
Articles | Volume 7, issue 2
https://doi.org/10.5194/tc-7-599-2013
© Author(s) 2013. This work is distributed under
the Creative Commons Attribution 3.0 License.
the Creative Commons Attribution 3.0 License.
https://doi.org/10.5194/tc-7-599-2013
© Author(s) 2013. This work is distributed under
the Creative Commons Attribution 3.0 License.
the Creative Commons Attribution 3.0 License.
Research article
| 
03 Apr 2013
Research article |
| 03 Apr 2013
Surface mass balance model intercomparison for the Greenland ice sheet
C. L. Vernon
School of Geographical Sciences, University of Bristol, Bristol, UK
J. L. Bamber
School of Geographical Sciences, University of Bristol, Bristol, UK
J. E. Box
Ohio State University, Byrd Polar Research Center and Dept. of Geography, Columbus, Ohio, USA
M. R. van den Broeke
Institute for Marine and Atmospheric Research Utrecht, Utrecht University, Utrecht, the Netherlands
X. Fettweis
Department of Geography, University of Liege, Liege, Belgium
E. Hanna
Department of Geography, University of Sheffield, Sheffield, UK
P. Huybrechts
Earth System Sciences and Department of Geography, Vrije Universiteit, Brussels, Belgium
Related authors
No articles found.
Marte Gé Hofsteenge, Willem Jan van de Berg, Christiaan van Dalum, Kristiina Verro, Maurice van Tiggelen, and Michiel van den Broeke
The Cryosphere, 20, 4747–4766, https://doi.org/10.5194/tc-20-4747-2026, https://doi.org/10.5194/tc-20-4747-2026, 2026
Short summary
Short summary
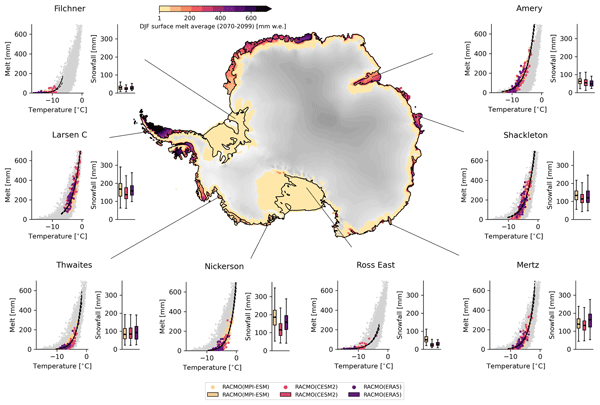
We use a regional climate model to study how surface melt on Antarctic ice shelves responds to air temperature. The relationship is strongly non-linear, mainly due to feedbacks in surface albedo, with other energy sources also contributing. Currently colder, drier, and more stable ice shelves will experience more melt at the same temperature than ice shelves in wetter climates, highlighting their vulnerability to fracturing, ice shelf instability, and contributions to global sea-level rise.
Alejandro Blazquez, Benoit Meyssignac, Robin Fraudeau, Michael Ablain, Jonathan Bamber, Antonio Bonaduce, Marie Bouih, Anny Cazenave, Thorben Döhne, Ines Dussaillant, Ramiro Ferrari, Martin Horwath, Nicolas Kolodziejczyk, Hugo Lecomte, Stephanie Leroux, William Llovel, Daniele Melini, Erwan Oulhen, Thierry Penduff, Roshin P. Raj, Giorgio Spada, Marius Schlaak, Papasarafianou Stamatia, Andrea Storto, Chunxue Yang, and Sarah Connors
Earth Syst. Sci. Data Discuss., https://doi.org/10.5194/essd-2026-627, https://doi.org/10.5194/essd-2026-627, 2026
Preprint under review for ESSD
Short summary
Short summary
Closing the sea‑level budget on annual and longer time scales is a cornerstone of physical oceanography because sea‑level rise is one of the best indicators of climate change, and a closed budget shows we have identified and quantified all major drivers. We examined it from 1993 to 2022, finding an accelerated rise that matched ice melt and warm water until 2015. Afterwards an unexplained gap appears. Better deep‑ocean observations and refined gravity processing are needed to close the budget.
Sanne B. M. Veldhuijsen, Peter Kuipers Munneke, Willem Jan van de Berg, Michiel R. van den Broeke, and Luke D. Trusel
EGUsphere, https://doi.org/10.5194/egusphere-2026-3453, https://doi.org/10.5194/egusphere-2026-3453, 2026
This preprint is open for discussion and under review for The Cryosphere (TC).
Short summary
Short summary
Antarctica has floating ice shelves around its perimeter that provide stability to the ice sheet. As temperature rises, snow on the ice shelves may melt away, and ponding of meltwater may cause the ice shelves to collapse. If that happens, Antarctica may start to lose ice faster than before, resulting in accelerated sea-level rise. The tool presented in this article will be used in simulations of future climate to determine when climate change leads to collapse of the ice shelves in Antarctica.
Christian Torres, Deniz Bozkurt, Vincent Favier, Victoire Buffet, Claudio Bravo, Xavier Fettweis, Thomas Dethinne, Antoine Rabatel, Maximiliano Viale, Sang-Jong Park, and Jorge Arigony-Neto
EGUsphere, https://doi.org/10.5194/egusphere-2026-3508, https://doi.org/10.5194/egusphere-2026-3508, 2026
This preprint is open for discussion and under review for The Cryosphere (TC).
Short summary
Short summary
We investigated periods when unusually warm conditions in Patagonia occurred at the same time as precipitation events on the Antarctic Peninsula. By combining observations and simulations, we identified 127 such events between 1980 and 2022. These events increased ice melt in Patagonia while enhancing accumulation on the Antarctic Peninsula, highlighting how large-scale weather patterns can simultaneously affect ice-covered regions in different ways.
Marco Tedesco, Racheet Matai, and Xavier Fettweis
The Cryosphere, 20, 4235–4253, https://doi.org/10.5194/tc-20-4235-2026, https://doi.org/10.5194/tc-20-4235-2026, 2026
Short summary
Short summary
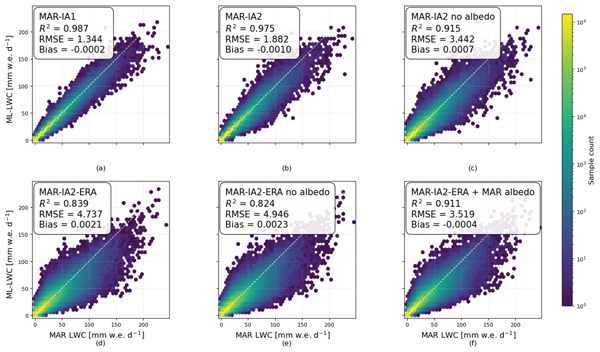
We developed a machine learning emulator of a climate model simulating melting over Greenland that performs as well as the original model but it is much faster. We show that this emulator can be used as powerful tools to complement regional climate models by enabling computationally efficient ensemble simulations and physically interpretable attribution of past and future Greenland surface melt. Development of regional climate models should go hand in hand with ML-based tools.
Xiaojun Ma, Matt King, Jonathan Bamber, Bin Liu, Wenke Sun, and Qiuyu Wang
EGUsphere, https://doi.org/10.5194/egusphere-2026-3461, https://doi.org/10.5194/egusphere-2026-3461, 2026
This preprint is open for discussion and under review for The Cryosphere (TC).
Short summary
Short summary
Satellite records of glacier change are only about two decades long, so short-term climate swings can strongly affect estimated trends. Using satellite gravity data, we show that the largest year-to-year changes in global glacier mass come from the Arctic and are linked to the North Atlantic Oscillation and Pacific Decadal Oscillation. Accounting for these effects makes Alaska’s estimated ice loss about one-third larger, improving interpretation of glacier change and future sea-level rise.
Guillaume Timmermans, Brice Noël, Christoph Kittel, Thomas Dethinne, Nicolas Ghilain, and Xavier Fettweis
EGUsphere, https://doi.org/10.5194/egusphere-2026-2341, https://doi.org/10.5194/egusphere-2026-2341, 2026
Short summary
Short summary
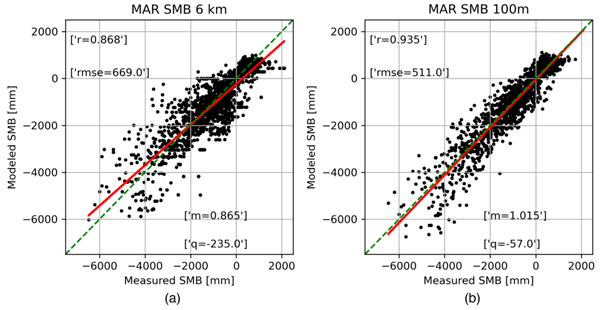
We assess how well a regional climate model reproduces changes in the mass of the Greenland Ice Sheet due to surface processes, an important driver of sea level rise. By comparing model results with observations, we show that high-resolution simulations closely match reality. Coarser simulations are less detailed near the edges but remain reliable overall. A resolution of 10 kilometers provides a good balance between accuracy and computing cost for long-term projections.
Leyue Tang, Jonathan L. Bamber, Tian Li, and Gang Qiao
Earth Syst. Sci. Data Discuss., https://doi.org/10.5194/essd-2026-414, https://doi.org/10.5194/essd-2026-414, 2026
Preprint under review for ESSD
Short summary
Short summary
Many Antarctic ice shelves are thinning and retreating, threatening future sea-level rise. Surface damage indicates structural weakening, but long-term records are scarce. We created a multi-decadal surface damage record for nine representative Antarctic ice shelves using satellite imagery and deep learning. The dataset shows that Pine Island, Thwaites and Larsen B have experienced the most significant damage changes since 1999, providing valuable insights into ice shelf stability.
Ian Simpson, Edward Hanna, Ryan S. Williams, Linh Luu, Andrew Orr, Julie Jones, Xavier Fettweis, Jose Abraham Torres Alavez, Ole Bøssing Christensen, Ella Gilbert, Sid Gumber, Christoph Kittel, Sihan Li, Damien Maure, Ruth Mottram, Tony Phillips, Willem Jan van de Berg, and Kristiina Verro
EGUsphere, https://doi.org/10.5194/egusphere-2026-2270, https://doi.org/10.5194/egusphere-2026-2270, 2026
Short summary
Short summary
The warming trend in global temperatures has potential to result in accelerated break up of the Antarctic ice shelves, which would contribute to rising sea levels. Here we present a novel database of Antarctic extreme weather events over a selection of the Antarctic ice shelves. We examine air temperature, precipitation, wind and surface pressure. In addition, we examine trends in the frequency of extreme events and the links with weather patterns around Antarctica.
Raf Antwerpen, Marco Tedesco, Pierre Gentine, Willem Jan van de Berg, and Xavier Fettweis
The Cryosphere, 20, 3131–3149, https://doi.org/10.5194/tc-20-3131-2026, https://doi.org/10.5194/tc-20-3131-2026, 2026
Short summary
Short summary
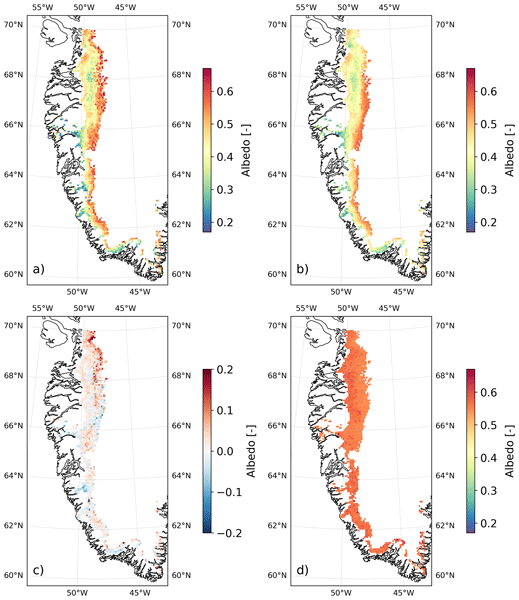
We study why Greenland ice melts faster by improving how ice brightness is represented. This is important because it controls how much sunlight is absorbed by the ice. Using satellite data and a new transparent machine learning method trained with climate model information, we capture how the shape of the ice sheet, temperature, and meltwater change ice brightness. Our approach outperforms existing climate models and can reduce uncertainty in future sea level rise projections.
Jonathon R. Preece, Patrick Alexander, Thomas L. Mote, Gabriel J. Kooperman, Xavier Fettweis, and Marco Tedesco
The Cryosphere, 20, 2871–2894, https://doi.org/10.5194/tc-20-2871-2026, https://doi.org/10.5194/tc-20-2871-2026, 2026
Short summary
Short summary
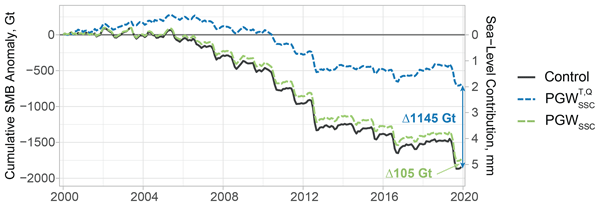
Surface melt of the Greenland Ice Sheet has increased dramatically since the turn of the century, aided by an increase in persistent atmospheric circulation patterns that promote anomalously warm conditions. Through modeling experiments, this study shows that surface mass loss would have been reduced by 62% relative to historical conditions if this shift in atmospheric circulation would have occurred under the lower average temperatures of a preindustrial climate.
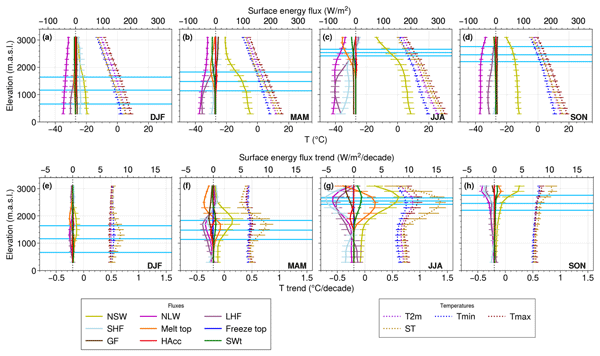
Ian Castellanos, Martin Ménégoz, Juliette Blanchet, Julien Beaumet, Hubert Gallée, Eduardo Moreno-Chamarro, Chantal Staquet, and Xavier Fettweis
Earth Syst. Dynam., 17, 581–605, https://doi.org/10.5194/esd-17-581-2026, https://doi.org/10.5194/esd-17-581-2026, 2026
Short summary
Short summary
The Alps host glaciers, distinct ecosystems, socio-economic interests and water resources that are being impacted by climate change. In this study, we aim at understanding how warming occurs in the Alps in projected scenarios and what physical processes drive it. We find under these scenarios that elevations around the snowline will warm faster than elsewhere, because snow retreats to higher elevations. Indeed, snow slows down warming due to its high albedo and the energy consumed to melt it.
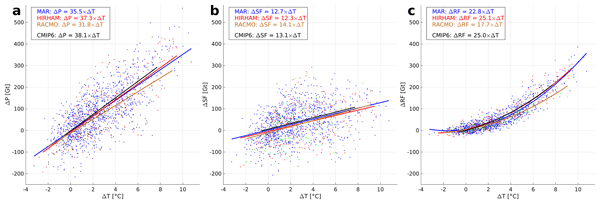
Fredrik Boberg, Xavier Fettweis, Nicolaj Hansen, Ruth Mottram, and Michiel R. van den Broeke
The Cryosphere, 20, 2947–2960, https://doi.org/10.5194/tc-20-2947-2026, https://doi.org/10.5194/tc-20-2947-2026, 2026
Short summary
Short summary
An ensemble of regional climate model simulations is used to estimate the 21st century change in precipitation on the Greenland ice sheet. For the end of the century, the change is in the range 40 to 170 Gt per year, depending on the emission scenario. Using annual values of 2 m air temperature and precipitation, we estimate an increase in precipitation of 35 Gt per year for every degree of warming.
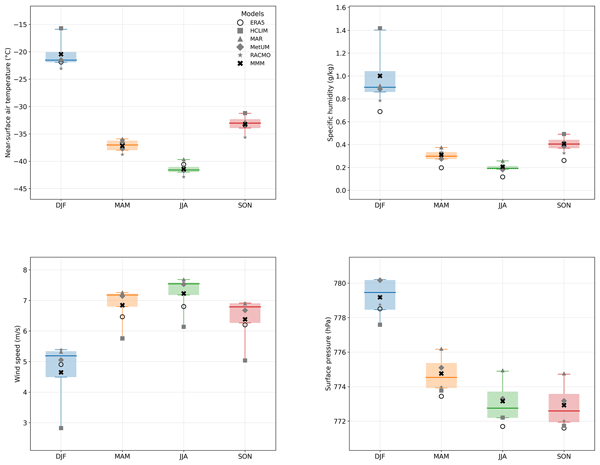
Ella Gilbert, José Abraham Torres-Alavez, Marte G. Hofsteenge, Willem Jan van de Berg, Fredrik Boberg, Ole Bøssing Christensen, Christiaan Timo van Dalum, Xavier Fettweis, Siddharth Gumber, Nicolaj Hansen, Christoph Kittel, Clara Lambin, Damien Maure, Ruth Mottram, Martin Olesen, Andrew Orr, Tony Phillips, Maurice van Tiggelen, Kristiina Verro, and Priscilla A. Mooney
The Cryosphere, 20, 2629–2658, https://doi.org/10.5194/tc-20-2629-2026, https://doi.org/10.5194/tc-20-2629-2026, 2026
Short summary
Short summary
Here we present a new dataset – the PolarRES ensemble – of four state-of-the-art regional climate models, which capture the full complexity of Antarctica's climate. The ensemble out-performs other available tools, advancing our ability to explore Antarctic climate. While it still has limitations, the PolarRES ensemble offers a novel and exciting way of evaluating climate processes and features, and we encourage researchers to use the data, which are freely available.
Samuel M. Tax, Maurice van Tiggelen, Thirza N. Feenstra, Paul C. J. P. Smeets, Srinidhi N. Gadde, Christiaan T. van Dalum, Willem Jan van de Berg, and Michiel R. van den Broeke
EGUsphere, https://doi.org/10.5194/egusphere-2026-1926, https://doi.org/10.5194/egusphere-2026-1926, 2026
Short summary
Short summary
Strong winds can lift snow into the air, which influences the energy exchange between the surface and the atmosphere. We studied this phenomenon over the Greenland Ice Sheet using observations and a climate model. We found that blowing snow traps heat near the surface like a blanket and reflects incoming sunlight like a mirror. Simulating these processes increases the net energy at the surface and improves model accuracy. Therefore, we recommend including these effects in climate models.
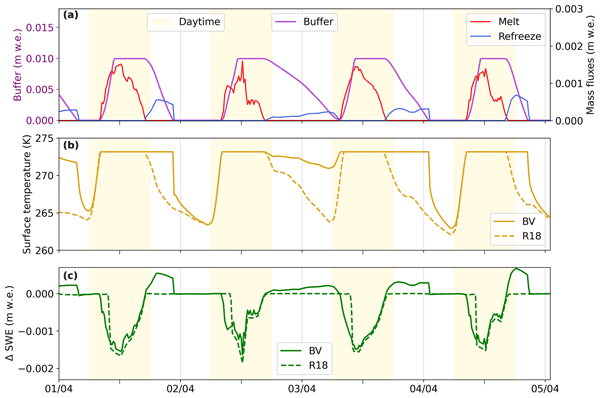
Audrey Goutard, Marion Réveillet, Fanny Brun, Delphine Six, Kevin Fourteau, Charles Amory, Xavier Fettweis, Mathieu Fructus, Arbindra Khadka, and Matthieu Lafaysse
The Cryosphere, 20, 2393–2416, https://doi.org/10.5194/tc-20-2393-2026, https://doi.org/10.5194/tc-20-2393-2026, 2026
Short summary
Short summary
A new scheme has been developed in a snowpack model (SURFEX/ISBA-Crocus), to consider the impact of liquid water dynamics on bare ice, including albedo feedback and refreezing. When applied to the Mera Glacier in Nepal, the model reveals strong seasonal effects on the energy and mass balance, with increased melting in dry seasons and significant refreezing during the monsoon. This development improves mass balance modeling under increasing rainfall and bare ice exposure due to climate warming.
Nils Lehmann, Cesar Aybar, Ando Shah, Marcello Passaro, Jonathan L. Bamber, and Xiao Xiang Zhu
Earth Syst. Sci. Data Discuss., https://doi.org/10.5194/essd-2026-232, https://doi.org/10.5194/essd-2026-232, 2026
Revised manuscript accepted for ESSD
Short summary
Short summary
We created a global ocean dataset that brings together satellite measurements, model outputs, and observations into one consistent system. We did this to reduce the time and effort needed to combine different data sources, to improve reproducibility, and enable new analyses. The result makes it easier to study ocean changes, compare methods, and support better understanding of climate processes and extreme events.
Benjamin Heurgue, Charles Amory, Christoph Kittel, Fredrik Boberg, Gaël Durand, Vincent Favier, Xavier Fettweis, Quentin Glaude, Heiko Goelzer, Nicolaj Hansen, Nicolas C. Jourdain, Ruth Mottram, Martin Olesen, Willem Jan Van de Berg, Michiel R. Van den Broeke, and René R. Wijngaard
EGUsphere, https://doi.org/10.5194/egusphere-2026-624, https://doi.org/10.5194/egusphere-2026-624, 2026
Short summary
Short summary
We studied how the Antarctic ice sheet surface mass balance may change by 2100 using three high-resolution climate models forced by the same future climate scenario. While the models agree for present-day conditions, they project very different futures, especially over floating ice shelves. These differences mainly come from how melting, refreezing, and temperature are represented. Our results show that future sea level projections strongly depend on how well models simulate today’s climate.
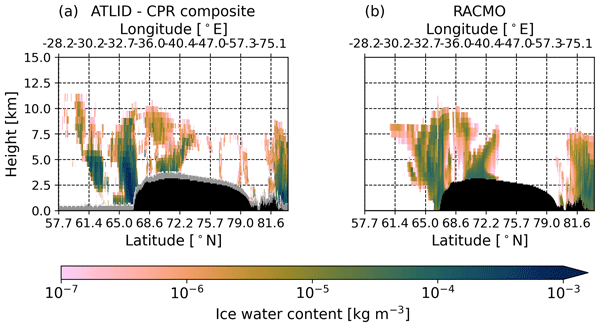
Thirza N. Feenstra, Willem Jan van de Berg, Gerd-Jan van Zadelhoff, David P. Donovan, Christiaan T. van Dalum, and Michiel R. van den Broeke
Atmos. Meas. Tech., 19, 1323–1344, https://doi.org/10.5194/amt-19-1323-2026, https://doi.org/10.5194/amt-19-1323-2026, 2026
Short summary
Short summary
Cloud representation brings large uncertainties in polar climate modeling. We show the first evaluation of Greenland clouds in the Regional Atmospheric Climate Model (RACMO2.4) with new EarthCARE satellite data. Comparing lidar and radar observations and retrieved cloud profiles with co-located RACMO output, we find RACMO captures low ice clouds but underestimates high clouds, mid-altitude liquid clouds, and snowfall. These results highlight EarthCARE's potential to improve polar climate models.
Tesse E. A. van den Aker, Peter Kuipers Munneke, Willem Jan van de Berg, Walter W. Immerzeel, and Michiel R. van den Broeke
EGUsphere, https://doi.org/10.5194/egusphere-2026-462, https://doi.org/10.5194/egusphere-2026-462, 2026
Short summary
Short summary
The firn layer, i.e. permanent snow, regulates how an ice sheet responds to climate change. Firn models are forced with with climate data at time steps from sub-daily to annual in literature, however, implications are barely evaluated. We test the impact of different climate forcing time steps on the modeled firn layer. We conclude that the climate forcing time step (1) affects firn model output, (2) can lead to non-physical behaviour, and (3) that resolving at least a diurnal cycle is required.
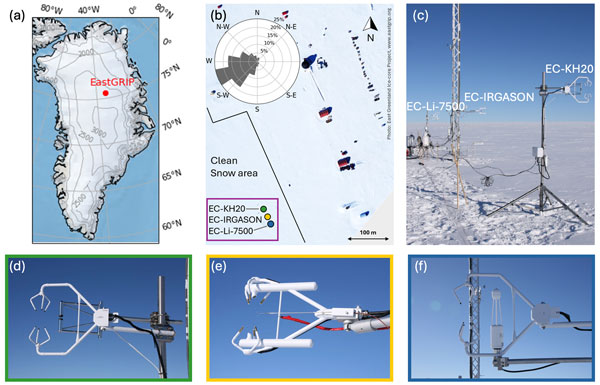
Ida Haven, Hans Christian Steen-Larsen, Laura J. Dietrich, Sonja Wahl, Jason E. Box, Michiel R. van den Broeke, Alun Hubbard, Stephan T. Kral, Joachim Reuder, and Maurice van Tiggelen
The Cryosphere, 20, 573–593, https://doi.org/10.5194/tc-20-573-2026, https://doi.org/10.5194/tc-20-573-2026, 2026
Short summary
Short summary
Three independent Eddy-Covariance measurement systems deployed on top of the Greenland Ice Sheet are compared. Using this dataset, we evaluate the reproducibility and quantify the differences between the systems. The fidelity of two regional climate models in capturing the seasonal variability in the latent and sensible heat flux between the snow surface and the atmosphere is assessed. We identify differences between observations and model simulations, especially during the winter period.

Horst Machguth, Andrew Tedstone, Peter Kuipers Munneke, Max Brils, Brice Noël, Nicole Clerx, Nicolas Jullien, Xavier Fettweis, and Michiel van den Broeke
The Cryosphere, 20, 427–452, https://doi.org/10.5194/tc-20-427-2026, https://doi.org/10.5194/tc-20-427-2026, 2026
Short summary
Short summary
Due to increasing air temperatures, surface melt expands to higher elevations on the Greenland ice sheet. This is visible on satellite imagery in the form of rivers of meltwater running across the surface of the ice sheet. We compare model results of meltwater at high elevations on the ice sheet to satellite observations. We find that each of the models shows strengths and weaknesses. A detailed look into the model results reveals potential reasons for the differences between models.
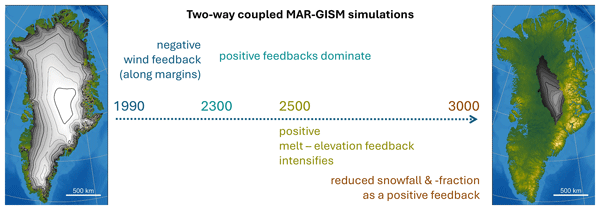
Chloë Marie Paice, Xavier Fettweis, and Philippe Huybrechts
The Cryosphere, 20, 309–332, https://doi.org/10.5194/tc-20-309-2026, https://doi.org/10.5194/tc-20-309-2026, 2026
Short summary
Short summary
To study Greenland ice sheet–atmosphere interactions, we coupled an ice sheet model to a regional climate model and performed simulations of differing coupling complexity over 1000 years under a high-warming climate scenario. They reveal that at first melt at the ice sheet margin is reduced by changing wind patterns. But over time, as the ice sheet melts and its surface lowers, precipitation patterns and cloudiness also change and amplify ice mass loss over the entire ice sheet.
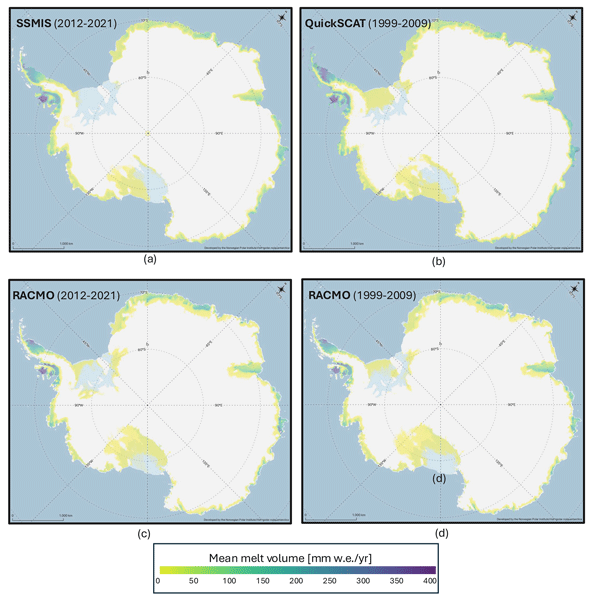
Valeria Di Biase, Peter Kuipers Munneke, Bert Wouters, Michiel R. van den Broeke, and Maurice van Tiggelen
The Cryosphere, 20, 87–96, https://doi.org/10.5194/tc-20-87-2026, https://doi.org/10.5194/tc-20-87-2026, 2026
Short summary
Short summary
We produce annual maps of Antarctic surface melt volumes from 2012 to 2021 using satellite microwave data. We detect melting days from thresholds on the satellite signal and then use actual melt measurements from weather stations to convert those signals into water‑equivalent volumes. Our maps capture known melt hotspots and show slightly lower totals than climate models. This dataset supports climate and ice‑shelf studies.

Heiko Goelzer, Constantijn J. Berends, Fredrik Boberg, Gael Durand, Tamsin L. Edwards, Xavier Fettweis, Fabien Gillet-Chaulet, Quentin Glaude, Philippe Huybrechts, Sébastien Le clec'h, Ruth Mottram, Brice Noël, Martin Olesen, Charlotte Rahlves, Jeremy Rohmer, Michiel van den Broeke, and Roderik S. W. van de Wal
The Cryosphere, 19, 6887–6906, https://doi.org/10.5194/tc-19-6887-2025, https://doi.org/10.5194/tc-19-6887-2025, 2025
Short summary
Short summary
We present an ensemble of ice sheet model projections for the Greenland ice sheet. The focus is on providing projections that improve our understanding of the range future sea-level rise and the inherent uncertainties over the next 100 to 300 years. Compared to earlier work we more fully account for some of the uncertainties in sea-level projections. We include a wider range of climate model output, more climate change scenarios and we extend projections schematically up to year 2300.
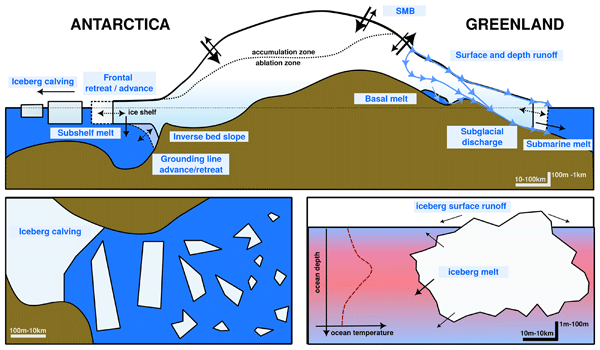
Gavin A. Schmidt, Kenneth D. Mankoff, Jonathan L. Bamber, Clara Burgard, Dustin Carroll, David M. Chandler, Violaine Coulon, Benjamin J. Davison, Matthew H. England, Paul R. Holland, Nicolas C. Jourdain, Qian Li, Juliana M. Marson, Pierre Mathiot, Clive R. McMahon, Twila A. Moon, Ruth Mottram, Sophie Nowicki, Anna Olivé Abelló, Andrew G. Pauling, Thomas Rackow, and Damien Ringeisen
Geosci. Model Dev., 18, 8333–8361, https://doi.org/10.5194/gmd-18-8333-2025, https://doi.org/10.5194/gmd-18-8333-2025, 2025
Short summary
Short summary
The impact of increasing mass loss from the Greenland and Antarctic ice sheets has not so far been included in historical climate model simulations. This paper describes the protocols and data available for modeling groups to add this anomalous freshwater to their ocean modules to better represent the impacts of these fluxes on ocean circulation, sea ice, salinity and sea level.
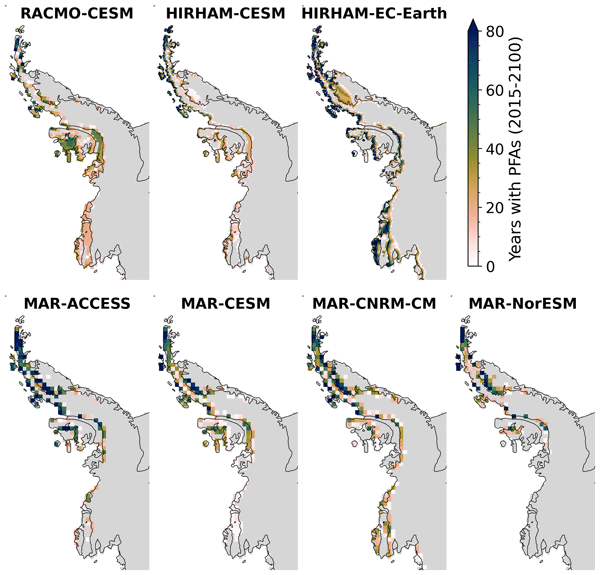
Sanne B. M. Veldhuijsen, Willem Jan van de Berg, Peter Kuipers Munneke, Nicolaj Hansen, Fredrik Boberg, Christoph Kittel, Charles Amory, and Michiel R. van den Broeke
The Cryosphere, 19, 5157–5173, https://doi.org/10.5194/tc-19-5157-2025, https://doi.org/10.5194/tc-19-5157-2025, 2025
Short summary
Short summary
Perennial firn aquifers (PFAs), year-round bodies of liquid water within firns, can potentially impact ice-shelf and ice-sheet stability. We developed a fast XGBoost firn emulator to predict the 21st-century distribution of PFAs in Antarctica for 12 climatic forcing datasets. Our findings suggest that, in low-emission scenarios, PFAs remain confined to the Antarctic Peninsula. However, in a high-emission scenario, PFAs are projected to expand to a region in West Antarctica and East Antarctica.
Thomas Dethinne, Nicolas Ghilain, Christoph Kittel, Benjamin Lecart, Xavier Fettweis, and François Jonard
EGUsphere, https://doi.org/10.5194/egusphere-2025-3907, https://doi.org/10.5194/egusphere-2025-3907, 2025
Short summary
Short summary
This study replace standard vegetation input of a regional climate model with a satellite-based vegetation dataset to assess how vegetation influences climate during extreme events and to test the sensitivity of the model. The results show a non-linear sensitivity to vegetation, and using an observation-based vegetation input allows for a better representation of the extreme events, highlight the need for an advanced representation of vegetation in climate model to improve climate predictions.
Johanna Beckmann, Ronja Reese, Felicity S. McCormack, Sue Cook, Lawrence Bird, Dawid Gwyther, Daniel Richards, Matthias Scheiter, Yu Wang, Hélène Seroussi, Ayako Abe‐Ouchi, Torsten Albrecht, Jorge Alvarez‐Solas, Xylar S. Asay‐Davis, Jean‐Baptiste Barre, Constantijn J. Berends, Jorge Bernales, Javier Blasco, Justine Caillet, David M. Chandler, Violaine Coulon, Richard Cullather, Christophe Dumas, Benjamin K. Galton‐Fenzi, Julius Garbe, Fabien Gillet‐Chaulet, Rupert Gladstone, Heiko Goelzer, Nicholas R. Golledge, Ralf Greve, G. Hilmar Gudmundsson, Holly Kyeore Han, Trevor R. Hillebrand, Matthew J. Hoffman, Philippe Huybrechts, Nicolas C. Jourdain, Ann Kristin Klose, Petra M. Langebroek, Gunter R. Leguy, William H. Lipscomb, Daniel P. Lowry, Pierre Mathiot, Marisa Montoya, Mathieu Morlighem, Sophie Nowicki, Frank Pattyn, Antony J. Payne, Tyler Pelle, Aurélien Quiquet, Alexander Robinson, Leopekka Saraste, Erika G. Simon, Sainan Sun, Jake P. Twarog, Luke D. Trusel, Benoit Urruty, Jonas Van Breedam, Roderik S. W. van de Wal, Chen Zhao, and Thomas Zwinger
EGUsphere, https://doi.org/10.5194/egusphere-2025-4069, https://doi.org/10.5194/egusphere-2025-4069, 2025
Short summary
Short summary
Antarctica holds enough ice to raise sea levels by many meters, but its future is uncertain. Warm ocean water melts ice shelves from below, letting inland ice flow faster into the sea. By 2300, Antarctica could add 0.6–4.4 m to sea levels. Our study identifies two key factors—how strongly shelves melt and how the ice responds. These explain much of the range, and refining them in models may improve future predictions.
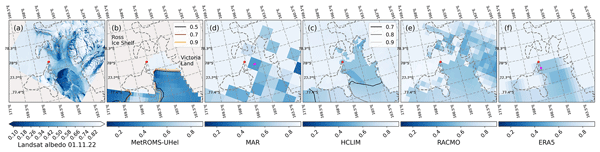
Kristiina Verro, Cecilia Äijälä, Roberta Pirazzini, Ruzica Dadic, Damien Maure, Willem Jan van de Berg, Giacomo Traversa, Christiaan T. van Dalum, Petteri Uotila, Xavier Fettweis, Biagio Di Mauro, and Milla Johansson
The Cryosphere, 19, 4409–4436, https://doi.org/10.5194/tc-19-4409-2025, https://doi.org/10.5194/tc-19-4409-2025, 2025
Short summary
Short summary
Accurately representing Antarctic sea ice is essential for reliable climate and ocean model predictions. We evaluated how different models simulate the sea ice's sunlight reflectivity (called albedo) using field and satellite data. Models with simple albedo schemes performed well in limited cases but missed key processes. The advanced scheme in the MetROMS-UHel ocean model provided the most accurate results, including observed day–night albedo changes observed during a field campaign.
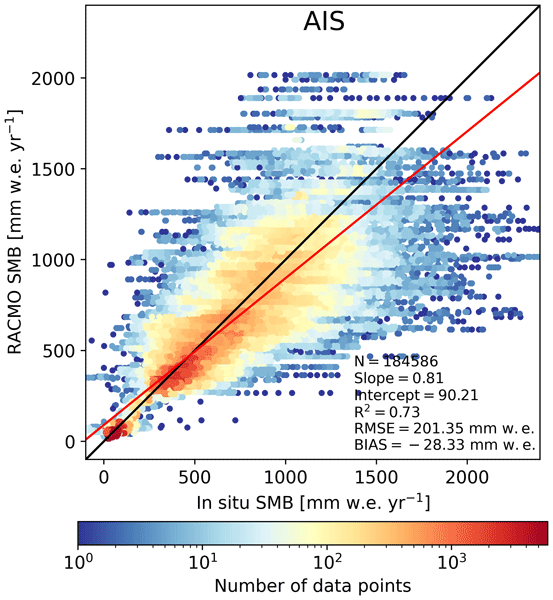
Christiaan T. van Dalum, Willem Jan van de Berg, Michiel R. van den Broeke, and Maurice van Tiggelen
The Cryosphere, 19, 4061–4090, https://doi.org/10.5194/tc-19-4061-2025, https://doi.org/10.5194/tc-19-4061-2025, 2025
Short summary
Short summary
In this study, we present a new surface mass balance (SMB) and near-surface climate product for Antarctica with the regional climate model RACMO2.4p1. We assess the impact of major model updates on the climate of Antarctica. Locally, the SMB has changed substantially but also agrees well with observations. In addition, we show that the SMB components, surface energy budget, albedo, pressure, temperature, and wind speed compare well with in situ and remote sensing observations.
Maurice van Tiggelen, Paul C. J. P. Smeets, Carleen H. Reijmer, Peter Kuipers Munneke, and Michiel R. van den Broeke
Earth Syst. Sci. Data, 17, 4933–4955, https://doi.org/10.5194/essd-17-4933-2025, https://doi.org/10.5194/essd-17-4933-2025, 2025
Short summary
Short summary
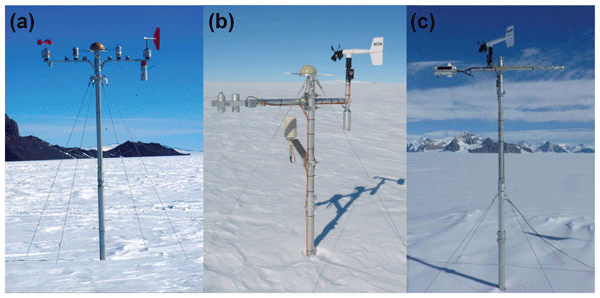
This paper describes the measurements from the 19 IMAU (Institute for Marine and Atmospheric research Utrecht) automatic weather stations that operated on the Antarctic ice sheet from 1995 through 2022. These stations also measured the net surface radiation and surface height change, allowing for the quantification of the surface energy and mass balance at hourly resolution. These data are invaluable for the evaluation of atmospheric models and for the detection of climatological changes.
Anneke L. Vries, Willem Jan van de Berg, Brice Noël, Lorenz Meire, and Michiel R. van den Broeke
The Cryosphere, 19, 3897–3914, https://doi.org/10.5194/tc-19-3897-2025, https://doi.org/10.5194/tc-19-3897-2025, 2025
Short summary
Short summary
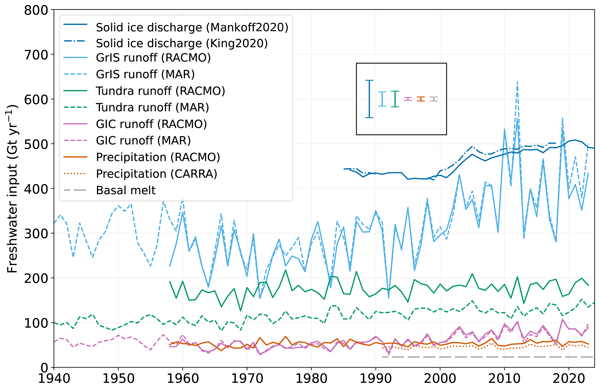
Freshwater flows into Greenland's fjords from various sources. Solid ice discharge (e.g. calving icebergs) dominates freshwater input in the southeast and northwest. In contrast, in the southwest, runoff from the ice sheet and tundra are the most significant. Seasonal data revealed that fjord precipitation and tundra runoff contribute up to 11 % and 35 % of the monthly freshwater input, respectively. Our results provide valuable input for ocean models and for researchers studying fjord ecosystems.
Zhengwen Yan, Jiangjun Ran, Pavel Ditmar, C. K. Shum, Roland Klees, Patrick Smith, and Xavier Fettweis
Earth Syst. Sci. Data, 17, 4253–4275, https://doi.org/10.5194/essd-17-4253-2025, https://doi.org/10.5194/essd-17-4253-2025, 2025
Short summary
Short summary
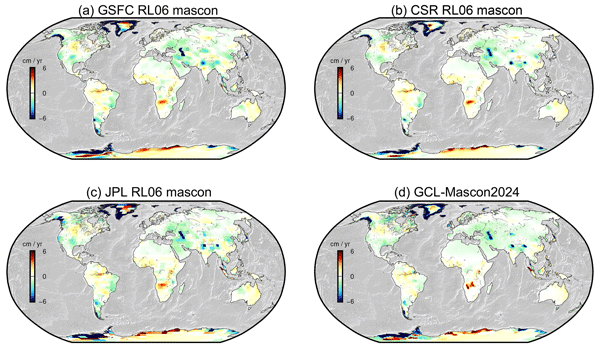
The Gravity Recovery And Climate Experiment (GRACE) mission has greatly improved our understanding of changes in Earth's gravity field over time. A novel mass concentration (mascon) dataset, GCL-Mascon2024, was determined by leveraging the short-arc approach, advanced spatial constraints, a frequency-dependent noise processing strategy, and parameterization-integrating natural boundaries, aiming to enhance accuracy for monitoring mass transportation on Earth.
Weiran Li, Stef Lhermitte, Bert Wouters, Cornelis Slobbe, Max Brils, and Xavier Fettweis
The Cryosphere, 19, 3419–3442, https://doi.org/10.5194/tc-19-3419-2025, https://doi.org/10.5194/tc-19-3419-2025, 2025
Short summary
Short summary
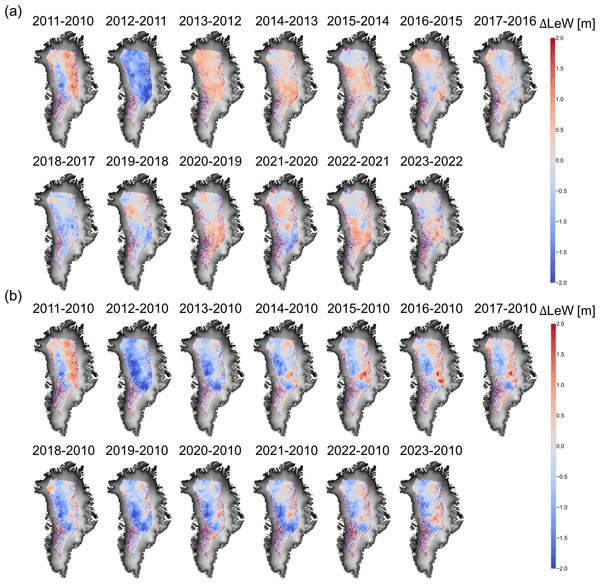
Due to recurrent melt and refreezing events in recent decades, the snow conditions over Greenland have changed. To observe this, we use a parameter (leading edge width; LeW) derived from satellite altimetry and analyse its spatial and temporal variations. By comparing the LeW variations with modelled firn parameters, we concluded that the 2012 melt event and the recent and increasingly frequent melt events have a long-lasting impact on the volume scattering of Greenland firn.
Adam Igneczi and Jonathan Louis Bamber
Earth Syst. Sci. Data, 17, 3203–3218, https://doi.org/10.5194/essd-17-3203-2025, https://doi.org/10.5194/essd-17-3203-2025, 2025
Short summary
Short summary
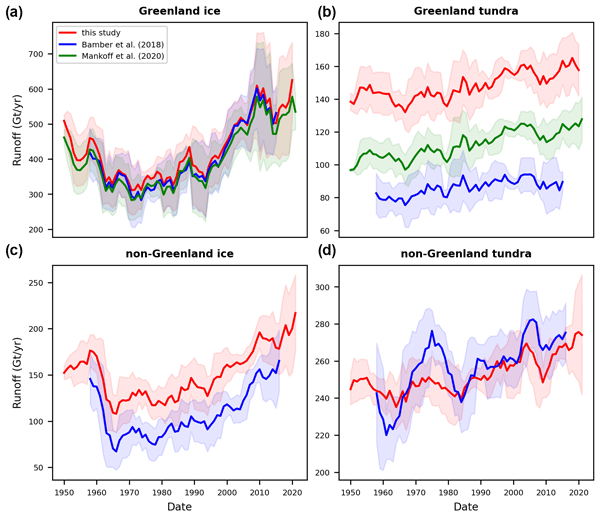
Freshwater from Arctic land ice loss strongly affects the Arctic and North Atlantic oceans. Datasets describing this freshwater discharge have low resolution and do not cover the entire Arctic. We statistically enhanced coarse-resolution climate model data – from approximately 6 km to 250 m – and routed meltwater towards the coastlines to provide high-resolution data covering all Arctic regions. This approach has far fewer computational requirements than running climate models at high resolution.
Shfaqat A. Khan, Helene Seroussi, Mathieu Morlighem, William Colgan, Veit Helm, Gong Cheng, Danjal Berg, Valentina R. Barletta, Nicolaj K. Larsen, William Kochtitzky, Michiel van den Broeke, Kurt H. Kjær, Andy Aschwanden, Brice Noël, Jason E. Box, Joseph A. MacGregor, Robert S. Fausto, Kenneth D. Mankoff, Ian M. Howat, Kuba Oniszk, Dominik Fahrner, Anja Løkkegaard, Eigil Y. H. Lippert, Alicia Bråtner, and Javed Hassan
Earth Syst. Sci. Data, 17, 3047–3071, https://doi.org/10.5194/essd-17-3047-2025, https://doi.org/10.5194/essd-17-3047-2025, 2025
Short summary
Short summary
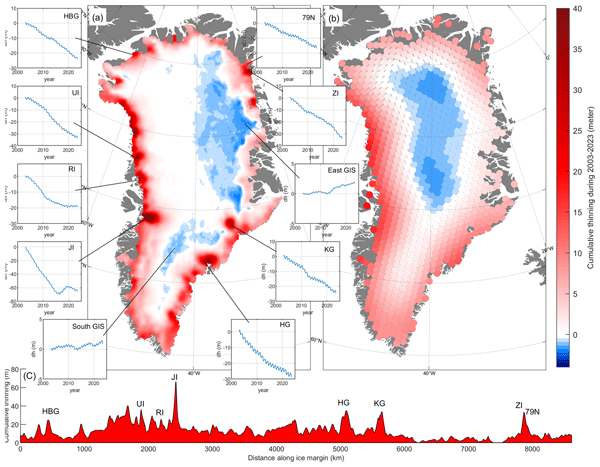
The surface elevation of the Greenland Ice Sheet is changing due to surface mass balance processes and ice dynamics, each exhibiting distinct spatiotemporal patterns. Here, we employ satellite and airborne altimetry data with fine spatial (1 km) and temporal (monthly) resolutions to document this spatiotemporal evolution from 2003 to 2023. This dataset of fine-resolution altimetry data in both space and time will support studies of ice mass loss and be useful for GIS ice sheet modeling.
Jean-François Grailet, Robin J. Hogan, Nicolas Ghilain, David Bolsée, Xavier Fettweis, and Marilaure Grégoire
Geosci. Model Dev., 18, 1965–1988, https://doi.org/10.5194/gmd-18-1965-2025, https://doi.org/10.5194/gmd-18-1965-2025, 2025
Short summary
Short summary
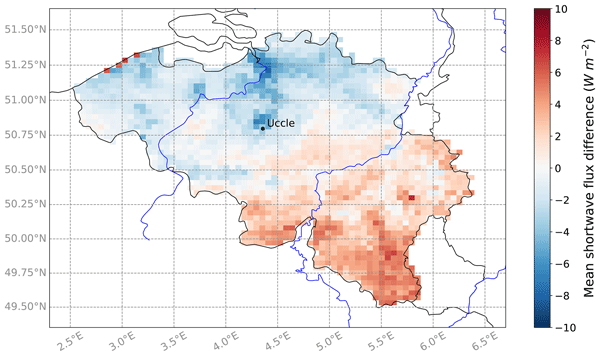
The MAR (Modèle Régional Atmosphérique) is a regional climate model used for weather forecasting and studying the climate over various regions. This paper presents an update of MAR thanks to which it can precisely decompose solar radiation, in particular in the UV (ultraviolet) and photosynthesis ranges, both being critical to human health and ecosystems. As a first application of this new capability, this paper presents a method for predicting UV indices with MAR.
Ny Riana Randresihaja, Olivier Gourgue, Lauranne Alaerts, Xavier Fettweis, Jonathan Lambrechts, Miguel De Le Court, Marilaure Grégoire, and Emmanuel Hanert
EGUsphere, https://doi.org/10.5194/egusphere-2025-634, https://doi.org/10.5194/egusphere-2025-634, 2025
Preprint archived
Short summary
Short summary
Coastal areas face rising flood threats as storms intensifies with climate change. With an advanced model of the Scheldt Estuary-North Sea, we studied how detailed atmospheric data must be to predict storm surge peaks in estuaries. We found that high-resolution atmospheric data gives the best results, and coarser data with same resolution as current global climate models give poorer results. We show that investing in localized, high-resolution atmospheric data can significantly improve results.
Viola Steidl, Jonathan Louis Bamber, and Xiao Xiang Zhu
The Cryosphere, 19, 645–661, https://doi.org/10.5194/tc-19-645-2025, https://doi.org/10.5194/tc-19-645-2025, 2025
Short summary
Short summary
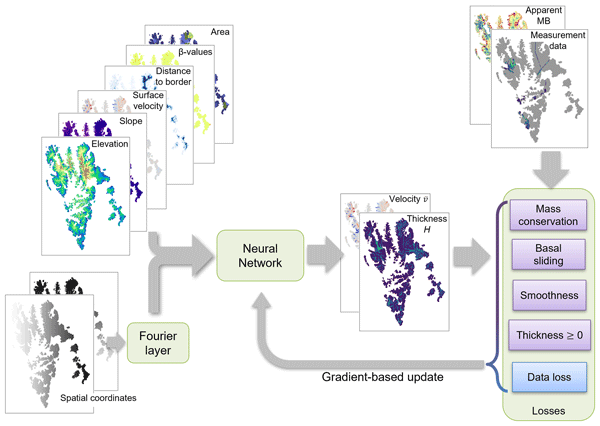
Glacier ice thickness is difficult to measure directly but is essential for glacier evolution modelling. In this work, we employ a novel approach combining physical knowledge and data-driven machine learning to estimate the ice thickness of multiple glaciers in Spitsbergen, Barentsøya, and Edgeøya in Svalbard. We identify challenges for the physics-aware machine learning model and opportunities for improving the accuracy and physical consistency that would also apply to other geophysical tasks.
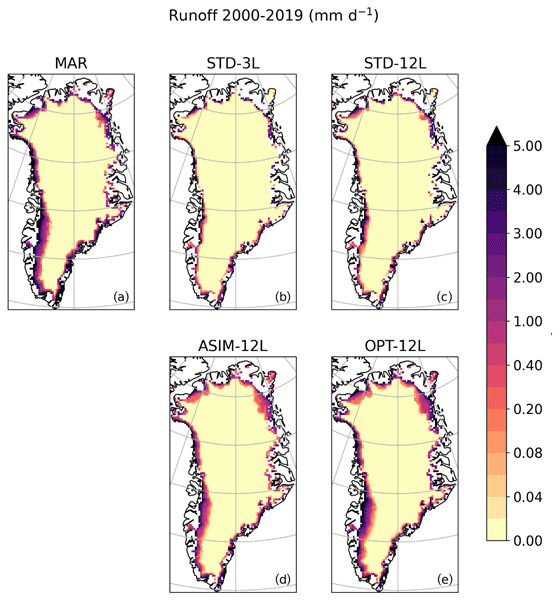
Sylvie Charbit, Christophe Dumas, Fabienne Maignan, Catherine Ottlé, Nina Raoult, Xavier Fettweis, and Philippe Conesa
The Cryosphere, 18, 5067–5099, https://doi.org/10.5194/tc-18-5067-2024, https://doi.org/10.5194/tc-18-5067-2024, 2024
Short summary
Short summary
The evolution of the Greenland ice sheet is highly dependent on surface melting and therefore on the processes operating at the snow–atmosphere interface and within the snow cover. Here we present new developments to apply a snow model to the Greenland ice sheet. The performance of this model is analysed in terms of its ability to simulate ablation processes. Our analysis shows that the model performs well when compared with the MAR regional polar atmospheric model.
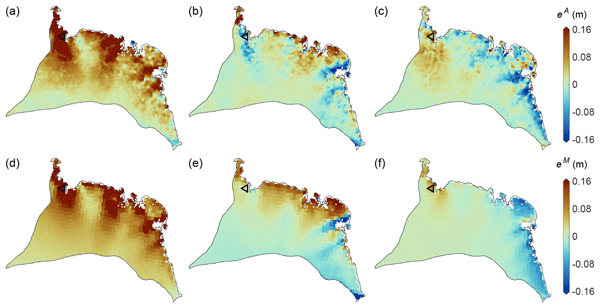
Maria T. Kappelsberger, Martin Horwath, Eric Buchta, Matthias O. Willen, Ludwig Schröder, Sanne B. M. Veldhuijsen, Peter Kuipers Munneke, and Michiel R. van den Broeke
The Cryosphere, 18, 4355–4378, https://doi.org/10.5194/tc-18-4355-2024, https://doi.org/10.5194/tc-18-4355-2024, 2024
Short summary
Short summary
The interannual variations in the height of the Antarctic Ice Sheet (AIS) are mainly due to natural variations in snowfall. Precise knowledge of these variations is important for the detection of any long-term climatic trends in AIS surface elevation. We present a new product that spatially resolves these height variations over the period 1992–2017. The product combines the strengths of atmospheric modeling results and satellite altimetry measurements.
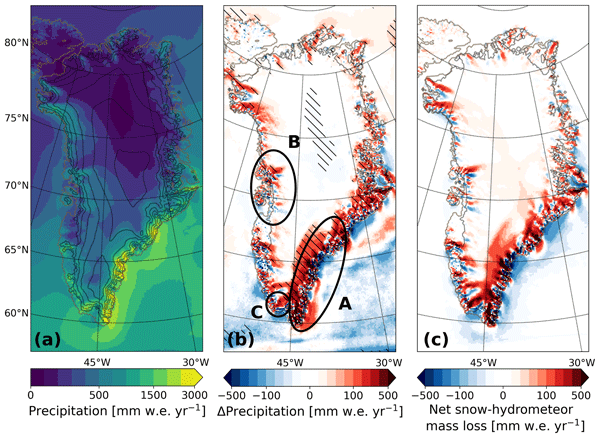
Christiaan T. van Dalum, Willem Jan van de Berg, Srinidhi N. Gadde, Maurice van Tiggelen, Tijmen van der Drift, Erik van Meijgaard, Lambertus H. van Ulft, and Michiel R. van den Broeke
The Cryosphere, 18, 4065–4088, https://doi.org/10.5194/tc-18-4065-2024, https://doi.org/10.5194/tc-18-4065-2024, 2024
Short summary
Short summary
We present a new version of the polar Regional Atmospheric Climate Model (RACMO), version 2.4p1, and show first results for Greenland, Antarctica and the Arctic. We provide an overview of all changes and investigate the impact that they have on the climate of polar regions. By comparing the results with observations and the output from the previous model version, we show that the model performs well regarding the surface mass balance of the ice sheets and near-surface climate.
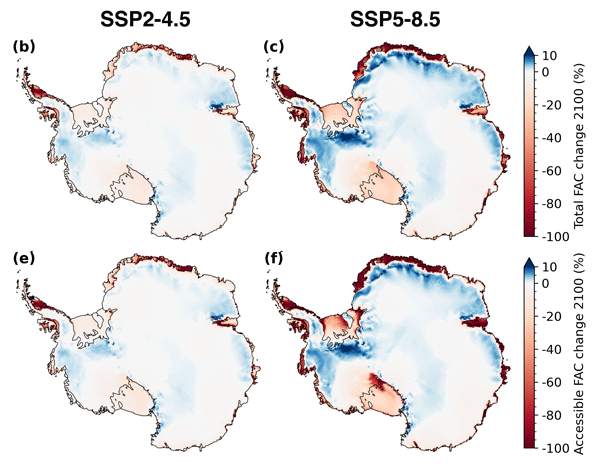
Sanne B. M. Veldhuijsen, Willem Jan van de Berg, Peter Kuipers Munneke, and Michiel R. van den Broeke
The Cryosphere, 18, 1983–1999, https://doi.org/10.5194/tc-18-1983-2024, https://doi.org/10.5194/tc-18-1983-2024, 2024
Short summary
Short summary
We use the IMAU firn densification model to simulate the 21st-century evolution of Antarctic firn air content. Ice shelves on the Antarctic Peninsula and the Roi Baudouin Ice Shelf in Dronning Maud Land are particularly vulnerable to total firn air content (FAC) depletion. Our results also underline the potentially large vulnerability of low-accumulation ice shelves to firn air depletion through ice slab formation.
Tian Li, Konrad Heidler, Lichao Mou, Ádám Ignéczi, Xiao Xiang Zhu, and Jonathan L. Bamber
Earth Syst. Sci. Data, 16, 919–939, https://doi.org/10.5194/essd-16-919-2024, https://doi.org/10.5194/essd-16-919-2024, 2024
Short summary
Short summary
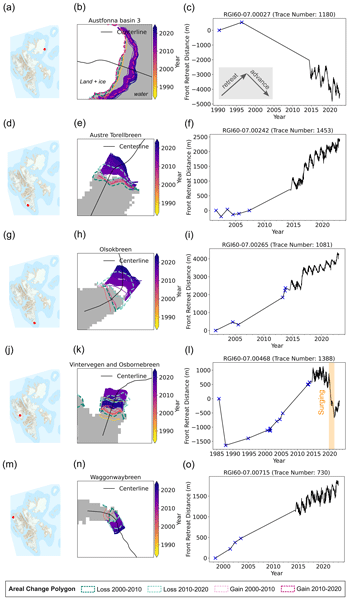
Our study uses deep learning to produce a new high-resolution calving front dataset for 149 marine-terminating glaciers in Svalbard from 1985 to 2023, containing 124 919 terminus traces. This dataset offers insights into understanding calving mechanisms and can help improve glacier frontal ablation estimates as a component of the integrated mass balance assessment.
Baptiste Vandecrux, Robert S. Fausto, Jason E. Box, Federico Covi, Regine Hock, Åsa K. Rennermalm, Achim Heilig, Jakob Abermann, Dirk van As, Elisa Bjerre, Xavier Fettweis, Paul C. J. P. Smeets, Peter Kuipers Munneke, Michiel R. van den Broeke, Max Brils, Peter L. Langen, Ruth Mottram, and Andreas P. Ahlstrøm
The Cryosphere, 18, 609–631, https://doi.org/10.5194/tc-18-609-2024, https://doi.org/10.5194/tc-18-609-2024, 2024
Short summary
Short summary
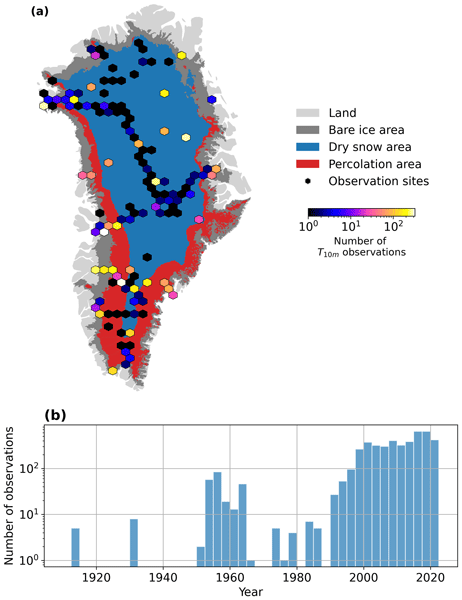
How fast is the Greenland ice sheet warming? In this study, we compiled 4500+ temperature measurements at 10 m below the ice sheet surface (T10m) from 1912 to 2022. We trained a machine learning model on these data and reconstructed T10m for the ice sheet during 1950–2022. After a slight cooling during 1950–1985, the ice sheet warmed at a rate of 0.7 °C per decade until 2022. Climate models showed mixed results compared to our observations and underestimated the warming in key regions.
Alison Delhasse, Johanna Beckmann, Christoph Kittel, and Xavier Fettweis
The Cryosphere, 18, 633–651, https://doi.org/10.5194/tc-18-633-2024, https://doi.org/10.5194/tc-18-633-2024, 2024
Short summary
Short summary
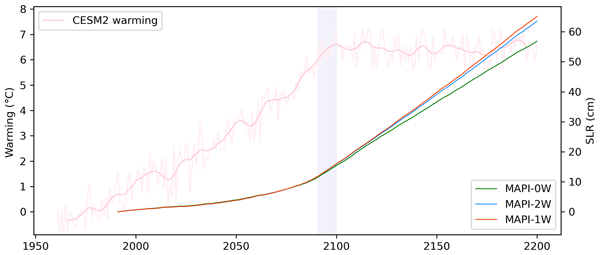
Aiming to study the long-term influence of an extremely warm climate in the Greenland Ice Sheet contribution to sea level rise, a new regional atmosphere–ice sheet model setup was established. The coupling, explicitly considering the melt–elevation feedback, is compared to an offline method to consider this feedback. We highlight mitigation of the feedback due to local changes in atmospheric circulation with changes in surface topography, making the offline correction invalid on the margins.
Idunn Aamnes Mostue, Stefan Hofer, Trude Storelvmo, and Xavier Fettweis
The Cryosphere, 18, 475–488, https://doi.org/10.5194/tc-18-475-2024, https://doi.org/10.5194/tc-18-475-2024, 2024
Short summary
Short summary
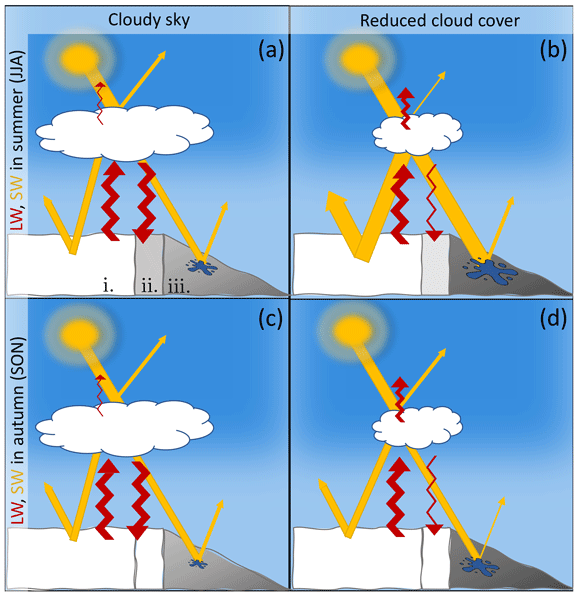
The latest generation of climate models (Coupled Model Intercomparison Project Phase 6 – CMIP6) warm more over Greenland and the Arctic and thus also project a larger mass loss from the Greenland Ice Sheet (GrIS) compared to the previous generation of climate models (CMIP5). Our work suggests for the first time that part of the greater mass loss in CMIP6 over the GrIS is driven by a difference in the surface mass balance sensitivity from a change in cloud representation in the CMIP6 models.
Laura J. Dietrich, Hans Christian Steen-Larsen, Sonja Wahl, Anne-Katrine Faber, and Xavier Fettweis
The Cryosphere, 18, 289–305, https://doi.org/10.5194/tc-18-289-2024, https://doi.org/10.5194/tc-18-289-2024, 2024
Short summary
Short summary
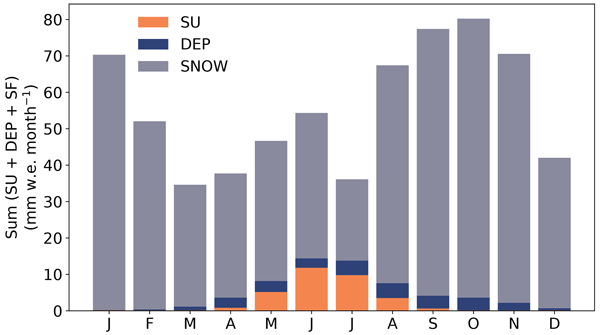
The contribution of the humidity flux to the surface mass balance in the accumulation zone of the Greenland Ice Sheet is uncertain. Here, we evaluate the regional climate model MAR using a multi-annual dataset of eddy covariance measurements and bulk estimates of the humidity flux. The humidity flux largely contributes to the summer surface mass balance (SMB) in the accumulation zone, indicating its potential importance for the annual SMB in a warming climate.
Jonas Van Breedam, Philippe Huybrechts, and Michel Crucifix
Clim. Past, 19, 2551–2568, https://doi.org/10.5194/cp-19-2551-2023, https://doi.org/10.5194/cp-19-2551-2023, 2023
Short summary
Short summary
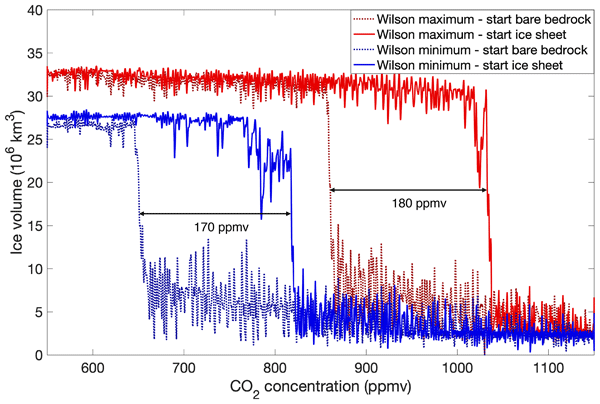
We investigated the different boundary conditions to allow ice sheet growth and ice sheet decline of the Antarctic ice sheet when it appeared ∼38–34 Myr ago. The thresholds for ice sheet growth and decline differ because of the different climatological conditions above an ice sheet (higher elevation and higher albedo) compared to a bare topography. We found that the ice–albedo feedback and the isostasy feedback respectively ease and delay the transition from a deglacial to glacial state.
Hélène Seroussi, Vincent Verjans, Sophie Nowicki, Antony J. Payne, Heiko Goelzer, William H. Lipscomb, Ayako Abe-Ouchi, Cécile Agosta, Torsten Albrecht, Xylar Asay-Davis, Alice Barthel, Reinhard Calov, Richard Cullather, Christophe Dumas, Benjamin K. Galton-Fenzi, Rupert Gladstone, Nicholas R. Golledge, Jonathan M. Gregory, Ralf Greve, Tore Hattermann, Matthew J. Hoffman, Angelika Humbert, Philippe Huybrechts, Nicolas C. Jourdain, Thomas Kleiner, Eric Larour, Gunter R. Leguy, Daniel P. Lowry, Chistopher M. Little, Mathieu Morlighem, Frank Pattyn, Tyler Pelle, Stephen F. Price, Aurélien Quiquet, Ronja Reese, Nicole-Jeanne Schlegel, Andrew Shepherd, Erika Simon, Robin S. Smith, Fiammetta Straneo, Sainan Sun, Luke D. Trusel, Jonas Van Breedam, Peter Van Katwyk, Roderik S. W. van de Wal, Ricarda Winkelmann, Chen Zhao, Tong Zhang, and Thomas Zwinger
The Cryosphere, 17, 5197–5217, https://doi.org/10.5194/tc-17-5197-2023, https://doi.org/10.5194/tc-17-5197-2023, 2023
Short summary
Short summary
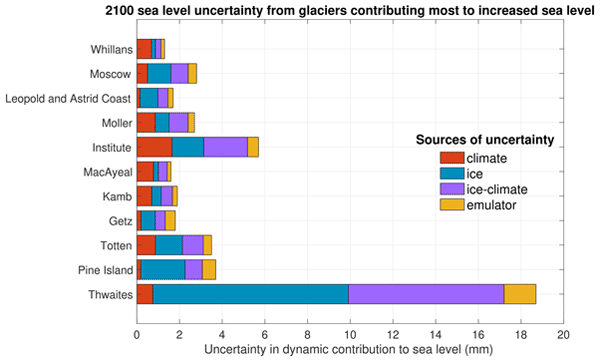
Mass loss from Antarctica is a key contributor to sea level rise over the 21st century, and the associated uncertainty dominates sea level projections. We highlight here the Antarctic glaciers showing the largest changes and quantify the main sources of uncertainty in their future evolution using an ensemble of ice flow models. We show that on top of Pine Island and Thwaites glaciers, Totten and Moscow University glaciers show rapid changes and a strong sensitivity to warmer ocean conditions.
Marco Tedesco, Paolo Colosio, Xavier Fettweis, and Guido Cervone
The Cryosphere, 17, 5061–5074, https://doi.org/10.5194/tc-17-5061-2023, https://doi.org/10.5194/tc-17-5061-2023, 2023
Short summary
Short summary
We developed a technique to improve the outputs of a model that calculates the gain and loss of Greenland and consequently its contribution to sea level rise. Our technique generates “sharper” images of the maps generated by the model to better understand and quantify where losses occur. This has implications for improving models, understanding what drives the contributions of Greenland to sea level rise, and more.
Damien Maure, Christoph Kittel, Clara Lambin, Alison Delhasse, and Xavier Fettweis
The Cryosphere, 17, 4645–4659, https://doi.org/10.5194/tc-17-4645-2023, https://doi.org/10.5194/tc-17-4645-2023, 2023
Short summary
Short summary
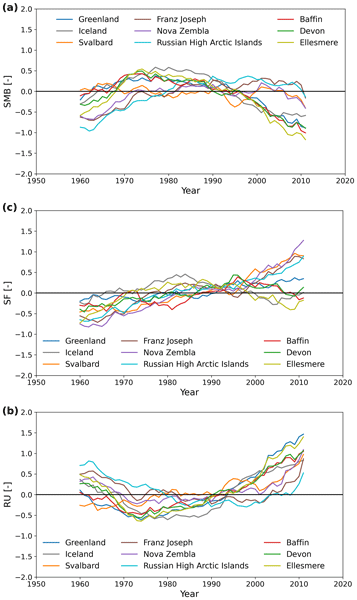
The Arctic is warming faster than the rest of the Earth. Studies have already shown that Greenland and the Canadian Arctic are experiencing a record increase in melting rates, while Svalbard has been relatively less impacted. Looking at those regions but also extending the study to Iceland and the Russian Arctic archipelagoes, we see a heterogeneity in the melting-rate response to the Arctic warming, with the Russian archipelagoes experiencing lower melting rates than other regions.
Lander Van Tricht and Philippe Huybrechts
The Cryosphere, 17, 4463–4485, https://doi.org/10.5194/tc-17-4463-2023, https://doi.org/10.5194/tc-17-4463-2023, 2023
Short summary
Short summary
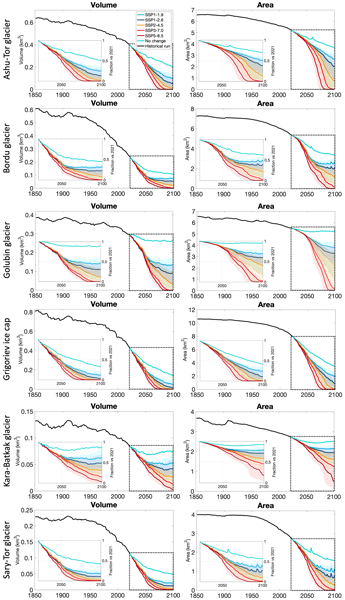
We modelled the historical and future evolution of six ice masses in the Tien Shan, Central Asia, with a 3D ice-flow model under the newest climate scenarios. We show that in all scenarios the ice masses retreat significantly but with large differences. It is highlighted that, because the main precipitation occurs in spring and summer, the ice masses respond to climate change with an accelerating retreat. In all scenarios, the total runoff peaks before 2050, with a (drastic) decrease afterwards.
Prateek Gantayat, Alison F. Banwell, Amber A. Leeson, James M. Lea, Dorthe Petersen, Noel Gourmelen, and Xavier Fettweis
Geosci. Model Dev., 16, 5803–5823, https://doi.org/10.5194/gmd-16-5803-2023, https://doi.org/10.5194/gmd-16-5803-2023, 2023
Short summary
Short summary
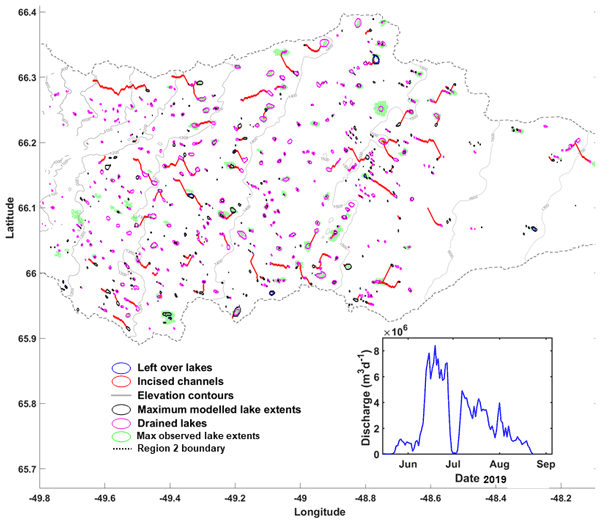
We developed a new supraglacial hydrology model for the Greenland Ice Sheet. This model simulates surface meltwater routing, meltwater drainage, supraglacial lake (SGL) overflow, and formation of lake ice. The model was able to reproduce 80 % of observed lake locations and provides a good match between the observed and modelled temporal evolution of SGLs.
Lander Van Tricht, Chloë Marie Paice, Oleg Rybak, and Philippe Huybrechts
The Cryosphere, 17, 4315–4323, https://doi.org/10.5194/tc-17-4315-2023, https://doi.org/10.5194/tc-17-4315-2023, 2023
Short summary
Short summary
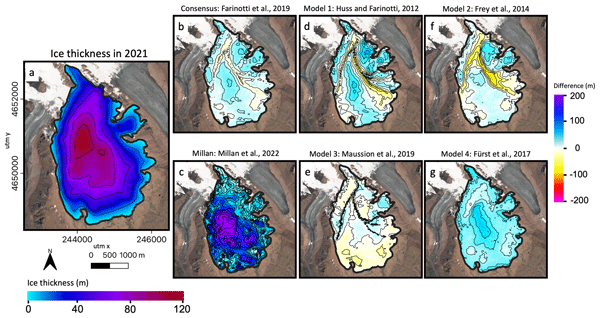
We performed a field campaign to measure the ice thickness of the Grigoriev ice cap (Central Asia). We interpolated the ice thickness data to obtain an ice thickness distribution representing the state of the ice cap in 2021, with a total volume of ca. 0.4 km3. We then compared our results with global ice thickness datasets composed without our local measurements. The main takeaway is that these datasets do not perform well enough yet for ice caps such as the Grigoriev ice cap.
Thomas Dethinne, Quentin Glaude, Ghislain Picard, Christoph Kittel, Patrick Alexander, Anne Orban, and Xavier Fettweis
The Cryosphere, 17, 4267–4288, https://doi.org/10.5194/tc-17-4267-2023, https://doi.org/10.5194/tc-17-4267-2023, 2023
Short summary
Short summary
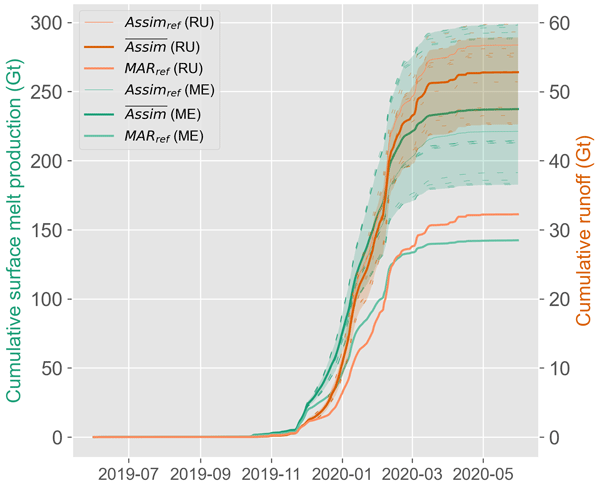
We investigate the sensitivity of the regional climate model
Modèle Atmosphérique Régional(MAR) to the assimilation of wet-snow occurrence estimated by remote sensing datasets. The assimilation is performed by nudging the MAR snowpack temperature. The data assimilation is performed over the Antarctic Peninsula for the 2019–2021 period. The results show an increase in the melt production (+66.7 %) and a decrease in surface mass balance (−4.5 %) of the model for the 2019–2020 melt season.
Lena G. Buth, Valeria Di Biase, Peter Kuipers Munneke, Stef Lhermitte, Sanne B. M. Veldhuijsen, Sophie de Roda Husman, Michiel R. van den Broeke, and Bert Wouters
EGUsphere, https://doi.org/10.5194/egusphere-2023-2000, https://doi.org/10.5194/egusphere-2023-2000, 2023
Preprint archived
Short summary
Short summary
Liquid meltwater which is stored in air bubbles in the compacted snow near the surface of Antarctica can affect ice shelf stability. In order to detect the presence of such firn aquifers over large scales, satellite remote sensing is needed. In this paper, we present our new detection method using radar satellite data as well as the results for the whole Antarctic Peninsula. Firn aquifers are found in the north and northwest of the peninsula, in agreement with locations predicted by models.
Benoit S. Lecavalier, Lev Tarasov, Greg Balco, Perry Spector, Claus-Dieter Hillenbrand, Christo Buizert, Catherine Ritz, Marion Leduc-Leballeur, Robert Mulvaney, Pippa L. Whitehouse, Michael J. Bentley, and Jonathan Bamber
Earth Syst. Sci. Data, 15, 3573–3596, https://doi.org/10.5194/essd-15-3573-2023, https://doi.org/10.5194/essd-15-3573-2023, 2023
Short summary
Short summary
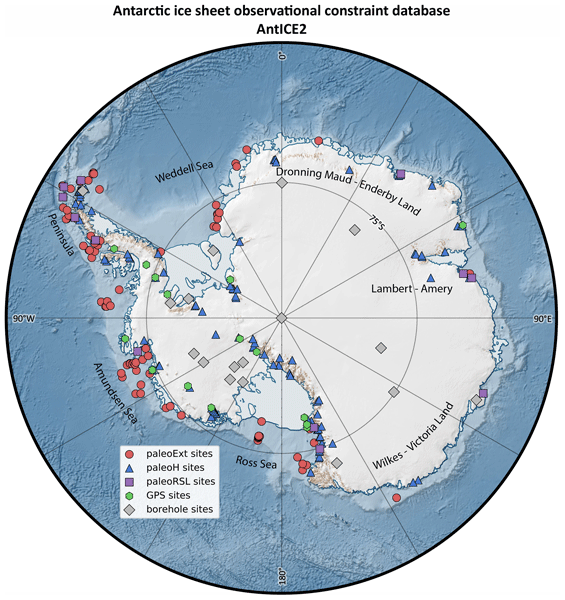
The Antarctic Ice Sheet Evolution constraint database version 2 (AntICE2) consists of a large variety of observations that constrain the evolution of the Antarctic Ice Sheet over the last glacial cycle. This includes observations of past ice sheet extent, past ice thickness, past relative sea level, borehole temperature profiles, and present-day bedrock displacement rates. The database is intended to improve our understanding of past Antarctic changes and for ice sheet model calibrations.
Lander Van Tricht, Harry Zekollari, Matthias Huss, Daniel Farinotti, and Philippe Huybrechts
The Cryosphere Discuss., https://doi.org/10.5194/tc-2023-87, https://doi.org/10.5194/tc-2023-87, 2023
Manuscript not accepted for further review
Short summary
Short summary
Detailed 3D models can be applied for well-studied glaciers, whereas simplified approaches are used for regional/global assessments. We conducted a comparison of six Tien Shan glaciers employing different models and investigated the impact of in-situ measurements. Our results reveal that the choice of mass balance and ice flow model as well as calibration have minimal impact on the projected volume. The initial ice thickness exerts the greatest influence on the future remaining ice volume.
Alice C. Frémand, Peter Fretwell, Julien A. Bodart, Hamish D. Pritchard, Alan Aitken, Jonathan L. Bamber, Robin Bell, Cesidio Bianchi, Robert G. Bingham, Donald D. Blankenship, Gino Casassa, Ginny Catania, Knut Christianson, Howard Conway, Hugh F. J. Corr, Xiangbin Cui, Detlef Damaske, Volkmar Damm, Reinhard Drews, Graeme Eagles, Olaf Eisen, Hannes Eisermann, Fausto Ferraccioli, Elena Field, René Forsberg, Steven Franke, Shuji Fujita, Yonggyu Gim, Vikram Goel, Siva Prasad Gogineni, Jamin Greenbaum, Benjamin Hills, Richard C. A. Hindmarsh, Andrew O. Hoffman, Per Holmlund, Nicholas Holschuh, John W. Holt, Annika N. Horlings, Angelika Humbert, Robert W. Jacobel, Daniela Jansen, Adrian Jenkins, Wilfried Jokat, Tom Jordan, Edward King, Jack Kohler, William Krabill, Mette Kusk Gillespie, Kirsty Langley, Joohan Lee, German Leitchenkov, Carlton Leuschen, Bruce Luyendyk, Joseph MacGregor, Emma MacKie, Kenichi Matsuoka, Mathieu Morlighem, Jérémie Mouginot, Frank O. Nitsche, Yoshifumi Nogi, Ole A. Nost, John Paden, Frank Pattyn, Sergey V. Popov, Eric Rignot, David M. Rippin, Andrés Rivera, Jason Roberts, Neil Ross, Anotonia Ruppel, Dustin M. Schroeder, Martin J. Siegert, Andrew M. Smith, Daniel Steinhage, Michael Studinger, Bo Sun, Ignazio Tabacco, Kirsty Tinto, Stefano Urbini, David Vaughan, Brian C. Welch, Douglas S. Wilson, Duncan A. Young, and Achille Zirizzotti
Earth Syst. Sci. Data, 15, 2695–2710, https://doi.org/10.5194/essd-15-2695-2023, https://doi.org/10.5194/essd-15-2695-2023, 2023
Short summary
Short summary
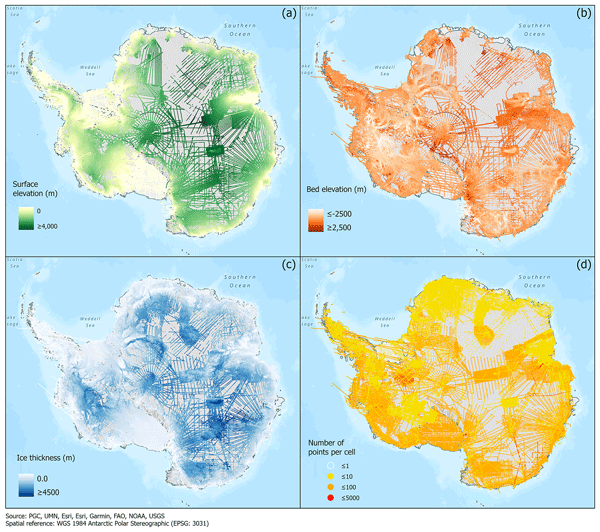
This paper presents the release of over 60 years of ice thickness, bed elevation, and surface elevation data acquired over Antarctica by the international community. These data are a crucial component of the Antarctic Bedmap initiative which aims to produce a new map and datasets of Antarctic ice thickness and bed topography for the international glaciology and geophysical community.
Inès N. Otosaka, Andrew Shepherd, Erik R. Ivins, Nicole-Jeanne Schlegel, Charles Amory, Michiel R. van den Broeke, Martin Horwath, Ian Joughin, Michalea D. King, Gerhard Krinner, Sophie Nowicki, Anthony J. Payne, Eric Rignot, Ted Scambos, Karen M. Simon, Benjamin E. Smith, Louise S. Sørensen, Isabella Velicogna, Pippa L. Whitehouse, Geruo A, Cécile Agosta, Andreas P. Ahlstrøm, Alejandro Blazquez, William Colgan, Marcus E. Engdahl, Xavier Fettweis, Rene Forsberg, Hubert Gallée, Alex Gardner, Lin Gilbert, Noel Gourmelen, Andreas Groh, Brian C. Gunter, Christopher Harig, Veit Helm, Shfaqat Abbas Khan, Christoph Kittel, Hannes Konrad, Peter L. Langen, Benoit S. Lecavalier, Chia-Chun Liang, Bryant D. Loomis, Malcolm McMillan, Daniele Melini, Sebastian H. Mernild, Ruth Mottram, Jeremie Mouginot, Johan Nilsson, Brice Noël, Mark E. Pattle, William R. Peltier, Nadege Pie, Mònica Roca, Ingo Sasgen, Himanshu V. Save, Ki-Weon Seo, Bernd Scheuchl, Ernst J. O. Schrama, Ludwig Schröder, Sebastian B. Simonsen, Thomas Slater, Giorgio Spada, Tyler C. Sutterley, Bramha Dutt Vishwakarma, Jan Melchior van Wessem, David Wiese, Wouter van der Wal, and Bert Wouters
Earth Syst. Sci. Data, 15, 1597–1616, https://doi.org/10.5194/essd-15-1597-2023, https://doi.org/10.5194/essd-15-1597-2023, 2023
Short summary
Short summary
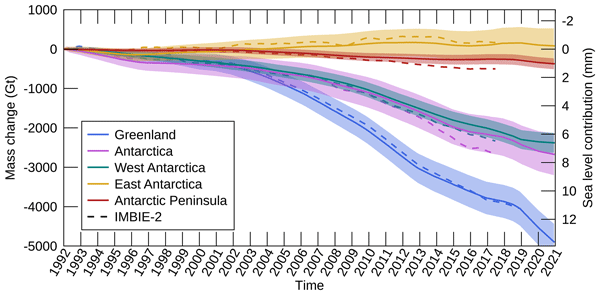
By measuring changes in the volume, gravitational attraction, and ice flow of Greenland and Antarctica from space, we can monitor their mass gain and loss over time. Here, we present a new record of the Earth’s polar ice sheet mass balance produced by aggregating 50 satellite-based estimates of ice sheet mass change. This new assessment shows that the ice sheets have lost (7.5 x 10¹²) t of ice between 1992 and 2020, contributing 21 mm to sea level rise.

Sanne B. M. Veldhuijsen, Willem Jan van de Berg, Max Brils, Peter Kuipers Munneke, and Michiel R. van den Broeke
The Cryosphere, 17, 1675–1696, https://doi.org/10.5194/tc-17-1675-2023, https://doi.org/10.5194/tc-17-1675-2023, 2023
Short summary
Short summary
Firn is the transition of snow to glacier ice and covers 99 % of the Antarctic ice sheet. Knowledge about the firn layer and its variability is important, as it impacts satellite-based estimates of ice sheet mass change. Also, firn contains pores in which nearly all of the surface melt is retained. Here, we improve a semi-empirical firn model and simulate the firn characteristics for the period 1979–2020. We evaluate the performance with field and satellite measures and test its sensitivity.
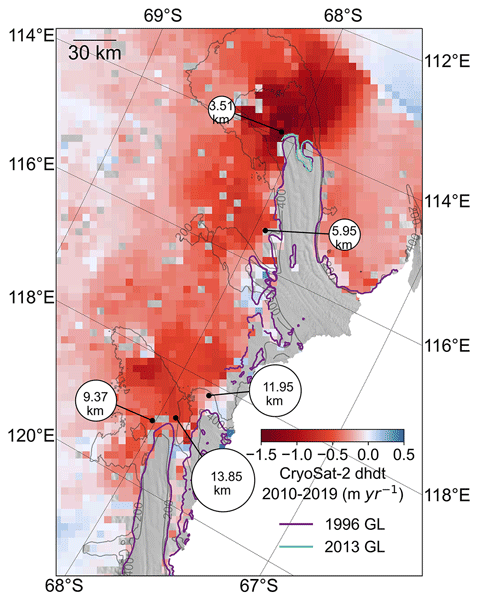
Tian Li, Geoffrey J. Dawson, Stephen J. Chuter, and Jonathan L. Bamber
The Cryosphere, 17, 1003–1022, https://doi.org/10.5194/tc-17-1003-2023, https://doi.org/10.5194/tc-17-1003-2023, 2023
Short summary
Short summary
The Totten and Moscow University glaciers in East Antarctica have the potential to make a significant contribution to future sea-level rise. We used a combination of different satellite measurements to show that the grounding lines have been retreating along the fast-flowing ice streams across these two glaciers. We also found two tide-modulated ocean channels that might open new pathways for the warm ocean water to enter the ice shelf cavity.

Benjamin E. Smith, Brooke Medley, Xavier Fettweis, Tyler Sutterley, Patrick Alexander, David Porter, and Marco Tedesco
The Cryosphere, 17, 789–808, https://doi.org/10.5194/tc-17-789-2023, https://doi.org/10.5194/tc-17-789-2023, 2023
Short summary
Short summary
We use repeated satellite measurements of the height of the Greenland ice sheet to learn about how three computational models of snowfall, melt, and snow compaction represent actual changes in the ice sheet. We find that the models do a good job of estimating how the parts of the ice sheet near the coast have changed but that two of the models have trouble representing surface melt for the highest part of the ice sheet. This work provides suggestions for how to better model snowmelt.
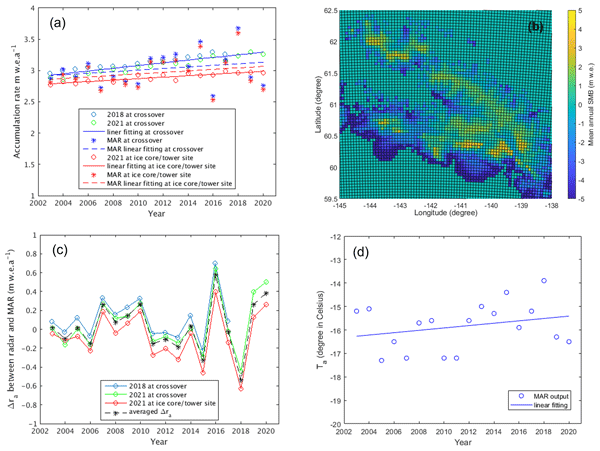
Jilu Li, Fernando Rodriguez-Morales, Xavier Fettweis, Oluwanisola Ibikunle, Carl Leuschen, John Paden, Daniel Gomez-Garcia, and Emily Arnold
The Cryosphere, 17, 175–193, https://doi.org/10.5194/tc-17-175-2023, https://doi.org/10.5194/tc-17-175-2023, 2023
Short summary
Short summary
Alaskan glaciers' loss of ice mass contributes significantly to ocean surface rise. It is important to know how deeply and how much snow accumulates on these glaciers to comprehend and analyze the glacial mass loss process. We reported the observed seasonal snow depth distribution from our radar data taken in Alaska in 2018 and 2021, developed a method to estimate the annual snow accumulation rate at Mt. Wrangell caldera, and identified transition zones from wet-snow zones to ablation zones.
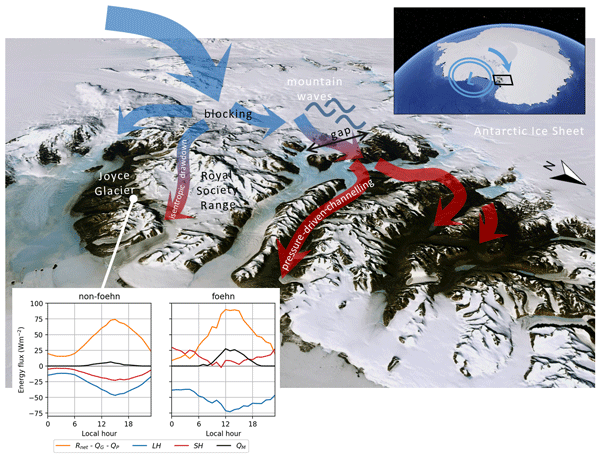
Marte G. Hofsteenge, Nicolas J. Cullen, Carleen H. Reijmer, Michiel van den Broeke, Marwan Katurji, and John F. Orwin
The Cryosphere, 16, 5041–5059, https://doi.org/10.5194/tc-16-5041-2022, https://doi.org/10.5194/tc-16-5041-2022, 2022
Short summary
Short summary
In the McMurdo Dry Valleys (MDV), foehn winds can impact glacial meltwater production and the fragile ecosystem that depends on it. We study these dry and warm winds at Joyce Glacier and show they are caused by a different mechanism than that found for nearby valleys, demonstrating the complex interaction of large-scale winds with the mountains in the MDV. We find that foehn winds increase sublimation of ice, increase heating from the atmosphere, and increase the occurrence and rates of melt.
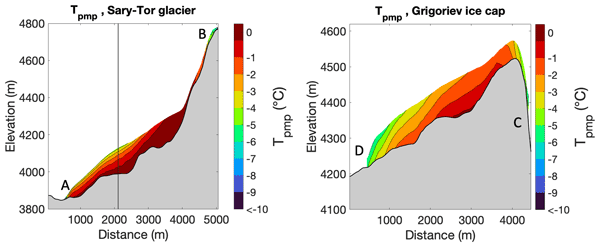
Lander Van Tricht and Philippe Huybrechts
The Cryosphere, 16, 4513–4535, https://doi.org/10.5194/tc-16-4513-2022, https://doi.org/10.5194/tc-16-4513-2022, 2022
Short summary
Short summary
We examine the thermal regime of the Grigoriev ice cap and the Sary-Tor glacier, both located in the inner Tien Shan in Kyrgyzstan. Our findings are important as the ice dynamics can only be understood and modelled precisely if ice temperature is considered correctly in ice flow models. The calibrated parameters of this study can be used in applications with ice flow models for individual ice masses as well as to optimise more general models for large-scale regional simulations.
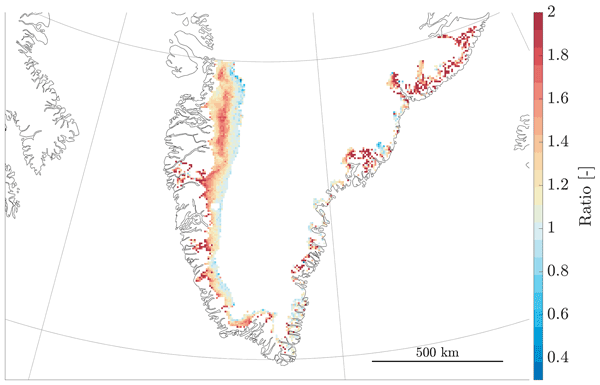
Raf M. Antwerpen, Marco Tedesco, Xavier Fettweis, Patrick Alexander, and Willem Jan van de Berg
The Cryosphere, 16, 4185–4199, https://doi.org/10.5194/tc-16-4185-2022, https://doi.org/10.5194/tc-16-4185-2022, 2022
Short summary
Short summary
The ice on Greenland has been melting more rapidly over the last few years. Most of this melt comes from the exposure of ice when the overlying snow melts. This ice is darker than snow and absorbs more sunlight, leading to more melt. It remains challenging to accurately simulate the brightness of the ice. We show that the color of ice simulated by Modèle Atmosphérique Régional (MAR) is too bright. We then show that this means that MAR may underestimate how fast the Greenland ice is melting.
Lena G. Buth, Bert Wouters, Sanne B. M. Veldhuijsen, Stef Lhermitte, Peter Kuipers Munneke, and Michiel R. van den Broeke
The Cryosphere Discuss., https://doi.org/10.5194/tc-2022-127, https://doi.org/10.5194/tc-2022-127, 2022
Manuscript not accepted for further review
Short summary
Short summary
Liquid meltwater which is stored in air bubbles in the compacted snow near the surface of Antarctica can affect ice shelf stability. In order to detect the presence of such firn aquifers over large scales, satellite remote sensing is needed. In this paper, we present our new detection method using radar satellite data as well as the results for the whole Antarctic Peninsula. Firn aquifers are found in the north and northwest of the peninsula, in agreement with locations predicted by models.
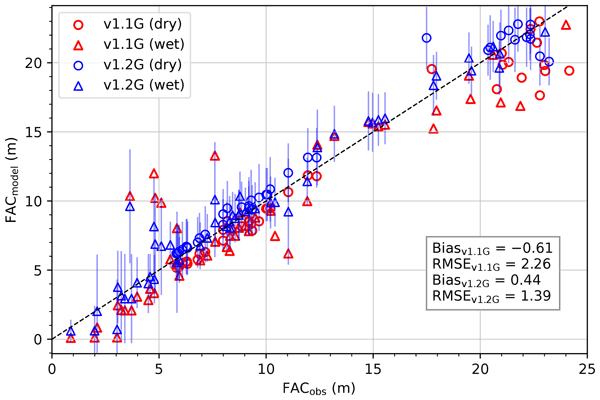
Max Brils, Peter Kuipers Munneke, Willem Jan van de Berg, and Michiel van den Broeke
Geosci. Model Dev., 15, 7121–7138, https://doi.org/10.5194/gmd-15-7121-2022, https://doi.org/10.5194/gmd-15-7121-2022, 2022
Short summary
Short summary
Firn covers the Greenland ice sheet (GrIS) and can temporarily prevent mass loss. Here, we present the latest version of our firn model, IMAU-FDM, with an application to the GrIS. We improved the density of fallen snow, the firn densification rate and the firn's thermal conductivity. This leads to a higher air content and 10 m temperatures. Furthermore we investigate three case studies and find that the updated model shows greater variability and an increased sensitivity in surface elevation.
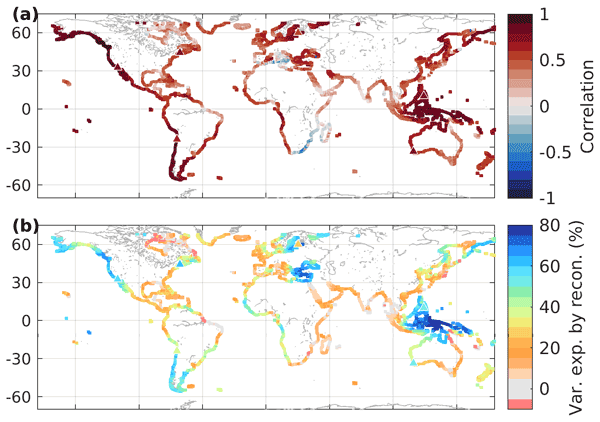
Sam Royston, Rory J. Bingham, and Jonathan L. Bamber
Ocean Sci., 18, 1093–1107, https://doi.org/10.5194/os-18-1093-2022, https://doi.org/10.5194/os-18-1093-2022, 2022
Short summary
Short summary
Decadal sea-level variability masks longer-term changes and increases uncertainty in observed trend and acceleration estimates. We use numerical ocean models to determine the magnitude of decadal variability we might expect in sea-level trends at coastal locations around the world, resulting from natural, internal variability. A proportion of that variability can be replicated from known climate modes, giving a range to add to short- to mid-term projections of regional sea-level trends.
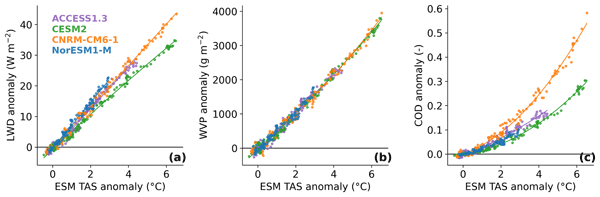
Christoph Kittel, Charles Amory, Stefan Hofer, Cécile Agosta, Nicolas C. Jourdain, Ella Gilbert, Louis Le Toumelin, Étienne Vignon, Hubert Gallée, and Xavier Fettweis
The Cryosphere, 16, 2655–2669, https://doi.org/10.5194/tc-16-2655-2022, https://doi.org/10.5194/tc-16-2655-2022, 2022
Short summary
Short summary
Model projections suggest large differences in future Antarctic surface melting even for similar greenhouse gas scenarios and warming rates. We show that clouds containing a larger amount of liquid water lead to stronger melt. As surface melt can trigger the collapse of the ice shelves (the safety band of the Antarctic Ice Sheet), clouds could be a major source of uncertainties in projections of sea level rise.
Sébastien Doutreloup, Xavier Fettweis, Ramin Rahif, Essam Elnagar, Mohsen S. Pourkiaei, Deepak Amaripadath, and Shady Attia
Earth Syst. Sci. Data, 14, 3039–3051, https://doi.org/10.5194/essd-14-3039-2022, https://doi.org/10.5194/essd-14-3039-2022, 2022
Short summary
Short summary
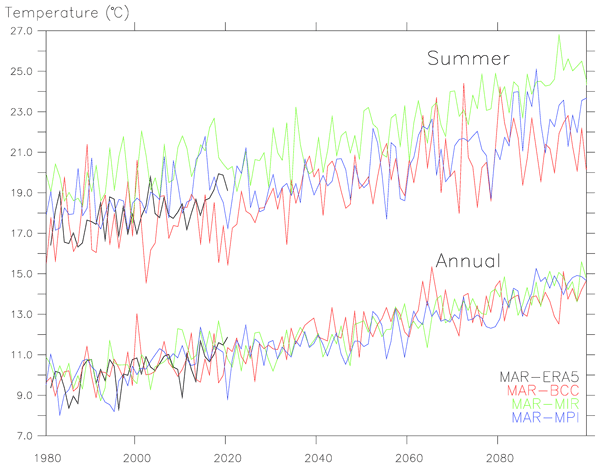
This data set provides historical (1980–2014) and future (2015–2100) weather data for 12 cities in Belgium. This data set is intended for architects or building or energy designers. In particular, it makes available to all users hourly open-access weather data according to certain standards to recreate a Typical and an Extreme Meteorological Year. In addition, it provides hourly data on heatwaves from 1980 to 2100. Weather data were produced from the outputs of the MAR model simulations.
Stephen J. Chuter, Andrew Zammit-Mangion, Jonathan Rougier, Geoffrey Dawson, and Jonathan L. Bamber
The Cryosphere, 16, 1349–1367, https://doi.org/10.5194/tc-16-1349-2022, https://doi.org/10.5194/tc-16-1349-2022, 2022
Short summary
Short summary
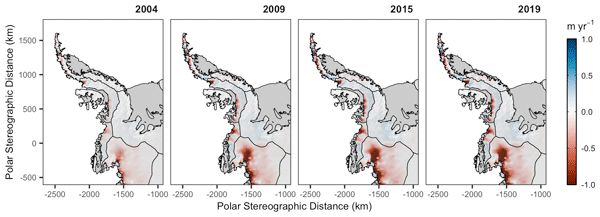
We find the Antarctic Peninsula to have a mean mass loss of 19 ± 1.1 Gt yr−1 over the 2003–2019 period, driven predominantly by changes in ice dynamic flow like due to changes in ocean forcing. This long-term record is crucial to ascertaining the region’s present-day contribution to sea level rise, with the understanding of driving processes enabling better future predictions. Our statistical approach enables us to estimate this previously poorly surveyed regions mass balance more accurately.
Christiaan T. van Dalum, Willem Jan van de Berg, and Michiel R. van den Broeke
The Cryosphere, 16, 1071–1089, https://doi.org/10.5194/tc-16-1071-2022, https://doi.org/10.5194/tc-16-1071-2022, 2022
Short summary
Short summary
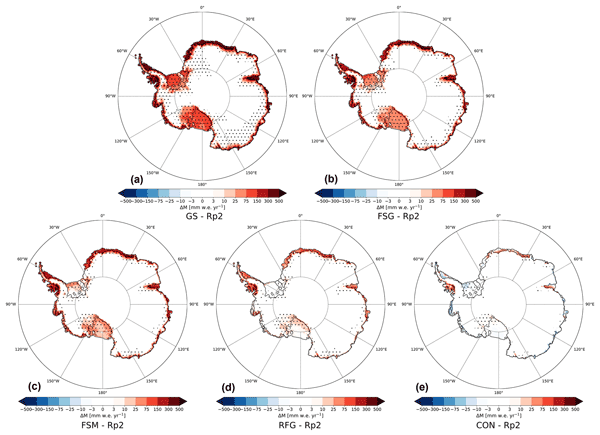
In this study, we improve the regional climate model RACMO2 and investigate the climate of Antarctica. We have implemented a new radiative transfer and snow albedo scheme and do several sensitivity experiments. When fully tuned, the results compare well with observations and snow temperature profiles improve. Moreover, small changes in the albedo and the investigated processes can lead to a strong overestimation of melt, locally leading to runoff and a reduced surface mass balance.
Tom Mitcham, G. Hilmar Gudmundsson, and Jonathan L. Bamber
The Cryosphere, 16, 883–901, https://doi.org/10.5194/tc-16-883-2022, https://doi.org/10.5194/tc-16-883-2022, 2022
Short summary
Short summary
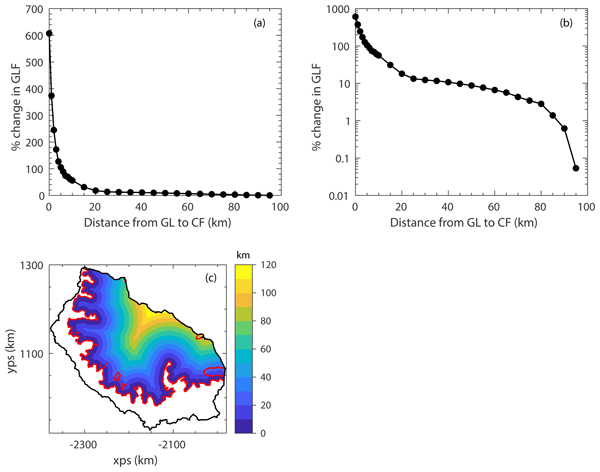
We modelled the response of the Larsen C Ice Shelf (LCIS) and its tributary glaciers to the calving of the A68 iceberg and validated our results with observations. We found that the impact was limited, confirming that mostly passive ice was calved. Through further calving experiments we quantified the total buttressing provided by the LCIS and found that over 80 % of the buttressing capacity is generated in the first 5 km of the ice shelf downstream of the grounding line.
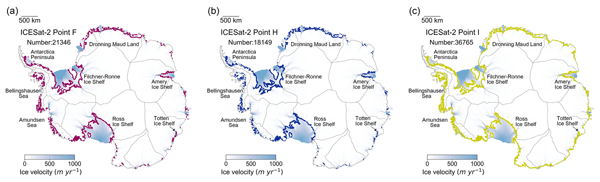
Tian Li, Geoffrey J. Dawson, Stephen J. Chuter, and Jonathan L. Bamber
Earth Syst. Sci. Data, 14, 535–557, https://doi.org/10.5194/essd-14-535-2022, https://doi.org/10.5194/essd-14-535-2022, 2022
Short summary
Short summary
Accurate knowledge of the Antarctic grounding zone is important for mass balance calculation, ice sheet stability assessment, and ice sheet model projections. Here we present the first ICESat-2-derived high-resolution grounding zone product of the Antarctic Ice Sheet, including three important boundaries. This new data product will provide more comprehensive insights into ice sheet instability, which is valuable for both the cryosphere and sea level science communities.
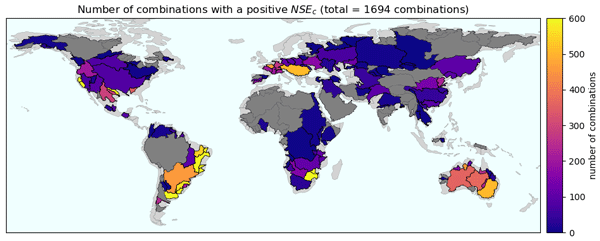
Fanny Lehmann, Bramha Dutt Vishwakarma, and Jonathan Bamber
Hydrol. Earth Syst. Sci., 26, 35–54, https://doi.org/10.5194/hess-26-35-2022, https://doi.org/10.5194/hess-26-35-2022, 2022
Short summary
Short summary
Many data sources are available to evaluate components of the water cycle (precipitation, evapotranspiration, runoff, and terrestrial water storage). Despite this variety, it remains unclear how different combinations of datasets satisfy the conservation of mass. We conducted the most comprehensive analysis of water budget closure on a global scale to date. Our results can serve as a basis to select appropriate datasets for regional hydrological studies.
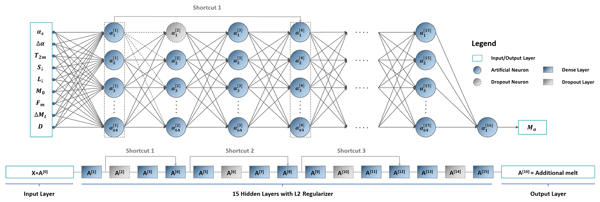
Zhongyang Hu, Peter Kuipers Munneke, Stef Lhermitte, Maaike Izeboud, and Michiel van den Broeke
The Cryosphere, 15, 5639–5658, https://doi.org/10.5194/tc-15-5639-2021, https://doi.org/10.5194/tc-15-5639-2021, 2021
Short summary
Short summary
Antarctica is shrinking, and part of the mass loss is caused by higher temperatures leading to more snowmelt. We use computer models to estimate the amount of melt, but this can be inaccurate – specifically in the areas with the most melt. This is because the model cannot account for small, darker areas like rocks or darker ice. Thus, we trained a computer using artificial intelligence and satellite images that showed these darker areas. The model computed an improved estimate of melt.
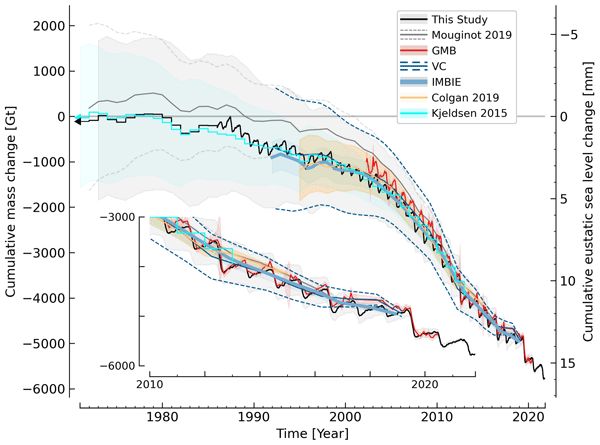
Kenneth D. Mankoff, Xavier Fettweis, Peter L. Langen, Martin Stendel, Kristian K. Kjeldsen, Nanna B. Karlsson, Brice Noël, Michiel R. van den Broeke, Anne Solgaard, William Colgan, Jason E. Box, Sebastian B. Simonsen, Michalea D. King, Andreas P. Ahlstrøm, Signe Bech Andersen, and Robert S. Fausto
Earth Syst. Sci. Data, 13, 5001–5025, https://doi.org/10.5194/essd-13-5001-2021, https://doi.org/10.5194/essd-13-5001-2021, 2021
Short summary
Short summary
We estimate the daily mass balance and its components (surface, marine, and basal mass balance) for the Greenland ice sheet. Our time series begins in 1840 and has annual resolution through 1985 and then daily from 1986 through next week. Results are operational (updated daily) and provided for the entire ice sheet or by commonly used regions or sectors. This is the first input–output mass balance estimate to include the basal mass balance.
Jonas Van Breedam, Philippe Huybrechts, and Michel Crucifix
Geosci. Model Dev., 14, 6373–6401, https://doi.org/10.5194/gmd-14-6373-2021, https://doi.org/10.5194/gmd-14-6373-2021, 2021
Short summary
Short summary
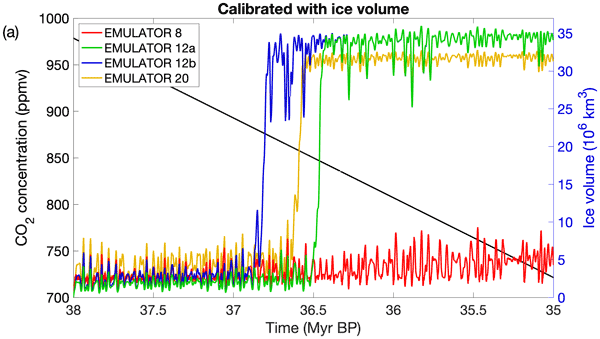
Ice sheets are an important component of the climate system and interact with the atmosphere through albedo variations and changes in the surface height. On very long timescales, it is impossible to directly couple ice sheet models with climate models and other techniques have to be used. Here we present a novel coupling method between ice sheets and the atmosphere by making use of an emulator to simulate ice sheet–climate interactions for several million years.
Lander Van Tricht, Philippe Huybrechts, Jonas Van Breedam, Alexander Vanhulle, Kristof Van Oost, and Harry Zekollari
The Cryosphere, 15, 4445–4464, https://doi.org/10.5194/tc-15-4445-2021, https://doi.org/10.5194/tc-15-4445-2021, 2021
Short summary
Short summary
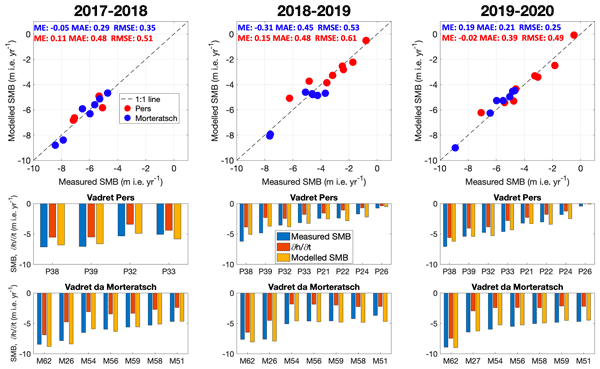
We conducted innovative research on the use of drones to determine the surface mass balance (SMB) of two glaciers. Considering appropriate spatial scales, we succeeded in determining the SMB in the ablation area with large accuracy. Consequently, we are convinced that our method and the use of drones to monitor the mass balance of a glacier’s ablation area can be an add-on to stake measurements in order to obtain a broader picture of the heterogeneity of the SMB of glaciers.
Cited articles
Alley, R. B., Andrews, J. T., Brigham-Grette, J., Clarke, G. K. C., Cuffey, K. M., Fitzpatrick, J. J., Funder, S., Marshall, S. J., Miller, G. H., Mitrovica, J. X., Muhs, D. R., Otto-Bliesner, B. L., Polyak, L., and White, J. W. C.: History of the Greenland Ice Sheet: paleoclimatic insights, Quaternary. Sci. Rev., 29, 1728–1756, https://doi.org/10.1016/j.quascirev.2010.02.007, 2010.
Bales, R. C., McConnell, J. R., Mosley-Thompson, E., and Csatho, B.: Accumulation over the Greenland ice sheet from historical and recent records, J. Geophys. Res.-Atmos., 106, 33813–33825, 2001.
Bales, R. C., Guo, Q. H., Shen, D. Y., McConnell, J. R., Du, G. M., Burkhart, J. F., Spikes, V. B., Hanna, E., and Cappelen, J.: Annual accumulation for Greenland updated using ice core data developed during 2000-2006 and analysis of daily coastal meteorological data, J. Geophys. Res.-Atmos., 114, D06116, https://doi.org/10.1029/2008jd011208, 2009.
Bougamont, M., Bamber, J. L., and Greuell, W.: A surface mass balance model for the Greenland ice sheet, J. Geophys. Res.-Earth, 110, F04018, https://doi.org/10.1029/2005JF000348, 2005.
Box, J. E., Bromwich, D. H., and Bai, L. S.: Greenland ice sheet surface mass balance 1991–2000: Application of Polar MM5 mesoscale model and in situ data, J. Geophys. Res.-Atmos., 109, D16105, https://doi.org/10.1029/2003jd004451, 2004.
Box, J. E., Bromwich, D. H., Veenhuis, B. A., Bai, L. S., Stroeve, J. C., Rogers, J. C., Steffen, K., Haran, T., and Wang, S. H.: Greenland ice sheet surface mass balance variability (1988–2004) from calibrated polar MM5 output, J. Climate, 19, 2783–2800, 2006.
Box, J. E., Yang, L., Bromwich, D. H., and Bai, L. S.: Greenland Ice Sheet Surface Air Temperature Variability: 1840–2007, J. Climate, 22, 4029–4049, 10.1175/2009jcli2816.1, 2009.
Box, J. E., Cappelen, J., Chen, C., Decker, D., Fettweis, X., Hall, D., Hanna, E., Jorgensen, B. V., Knudsen, N. T., Lipscomb, W. H., Mernild, S. H., Mote, T., Steiner, N., Tedesco , M., van de Wal, R. S. W., and Wahr, J.: Greenland Ice Sheet, Arctic Report Card: Update for 2011, available at: http://www.arctic.noaa.gov/reportcard/greenland_ice_sheet.html, 2011.
Box, J. E., Fettweis, X., Stroeve, J. C., Tedesco, M., Hall, D. K., and Steffen, K.: Greenland ice sheet albedo feedback: thermodynamics and atmospheric drivers, The Cryosphere, 6, 821–839, https://doi.org/10.5194/tc-6-821-2012, 2012.
Brun, E., David, P., Sudul, M., and Brunot, G.: A numerical model to simulate snow-cover stratigraphy for operational avalanche forecasting, J. Glaciol., 38, 13–22, 1992.
Cogley, J. G.: Greenland accumulation: An error model, J. Geophys. Res.-Atmos., 109, D18101, https://doi.org/10.1029/2003jd004449, 2004.
Dahl-Jensen, D., Bamber, J., Bøggild,C. E., Buch, E., Christensen, J. H., Dethloff, K., Fahnestock, M., Marshall, S., Rosing, M., Steffen, K., Thomas, R., Truffer, M., van den Broeke, M., and Veen, C. J. v. d.: The Greenland Ice Sheet in a Changing Climate: Snow, Water, Ice and Permafrost in the Arctic (SWIPA), Arctic Monitoring and Assessment Programme (AMAP), Oslo, 115 pp., 2009.
De Ridder, K. and Gallee, H.: Land surface-induced regional climate change in southern Israel, J. Appl. Meteorol., 37, 1470–1485, 1998.
Dee, D. P., Uppala, S. M., Simmons, A. J., Berrisford, P., Poli, P., Kobayashi, S., Andrae, U., Balmaseda, M. A., Balsamo, G., Bauer, P., Bechtold, P., Beljaars, A. C. M., van de Berg, L., Bidlot, J., Bormann, N., Delsol, C., Dragani, R., Fuentes, M., Geer, A. J., Haimberger, L., Healy, S. B., Hersbach, H., Hólm, E. V., Isaksen, L., Kållberg, P., Köhler, M., Matricardi, M., McNally, A. P., Monge-Sanz, B. M., Morcrette, J. J., Park, B. K., Peubey, C., de Rosnay, P., Tavolato, C., Thépaut, J. N., and Vitart, F.: The ERA-Interim reanalysis: configuration and performance of the data assimilation system, Q. J. Roy. Meteorol. Soc., 137, 553–597, https://doi.org/10.1002/qj.828, 2011.
Ettema, J., van den Broeke, M. R., van Meijgaard, E., van de Berg, W. J., Bamber, J. L., Box, J. E., and Bales, R. C.: Higher surface mass balance of the Greenland ice sheet revealed by high-resolution climate modeling, Geophys. Res. Lett., 36, L12501, https://doi.org/10.1029/2009gl038110, 2009.
Ettema, J., van den Broeke, M. R., van Meijgaard, E., and van de Berg, W. J.: Climate of the Greenland ice sheet using a high-resolution climate model – Part 2: Near-surface climate and energy balance, The Cryosphere, 4, 529–544, https://doi.org/10.5194/tc-4-529-2010, 2010a.
Ettema, J., van den Broeke, M. R., van Meijgaard, E., van de Berg, W. J., Box, J. E., and Steffen, K.: Climate of the Greenland ice sheet using a high-resolution climate model – Part 1: Evaluation, The Cryosphere, 4, 511–527, https://doi.org/10.5194/tc-4-511-2010, 2010b.
Fettweis, X.: Reconstruction of the 1979–2006 Greenland ice sheet surface mass balance using the regional climate model MAR, The Cryosphere, 1, 21–40, https://doi.org/10.5194/tc-1-21-2007, 2007.
Fettweis, X., Gallee, H., Lefebre, F., and van Ypersele, J. P.: Greenland surface mass balance simulated by a regional climate model and comparison with satellite-derived data in 1990–1991, Clim. Dynam., 24, 623–640, https://doi.org/10.1007/s00382-005-0010-y, 2005.
Fettweis, X., Hanna, E., Gallée, H., Huybrechts, P., and Erpicum, M.: Estimation of the Greenland ice sheet surface mass balance for the 20th and 21st centuries, The Cryosphere, 2, 117–129, https://doi.org/10.5194/tc-2-117-2008, 2008.
Fettweis, X., Tedesco, M., van den Broeke, M., and Ettema, J.: Melting trends over the Greenland ice sheet (1958–2009) from spaceborne microwave data and regional climate models, The Cryosphere, 5, 359–375, https://doi.org/10.5194/tc-5-359-2011, 2011.
Franco, B., Fettweis, X., Lang, C., and Erpicum, M.: Impact of spatial resolution on the modelling of the Greenland ice sheet surface mass balance between 1990–2010, using the regional climate model MAR, The Cryosphere, 6, 695–711, https://doi.org/10.5194/tc-6-695-2012, 2012.
Gallée, H. and Schayes, G.: Development of a Three-Dimensional Meso-γ Primitive Equation Model: Katabatic Winds Simulation in the Area of Terra Nova Bay, Antarctica, Mon. Weather Rev., 122, 671–685., 1994.
Gregory, J. M. and Huybrechts, P.: Ice-sheet contributions to future sea-level change, Philos. T. R. Soc. A, 364, 1709–1731, 2006.
Greuell, W. and Konzelmann, T.: Numerical Modeling of the Energy-Balance and the Englacial Temperature of the Greenland Ice-Sheet - Calculations for the Eth-Camp Location (West Greenland, 1155m Asl), Global Planet. Change, 9, 91–114, 1994.
Hall, D. K., Riggs, G. A., and Salomonson, V. V.: MODIS/Terra Snow Cover Daily L3 Global 500 m Grid V004, January to March 2003, Digital media, updated daily, National Snow and Ice Data Center, Boulder, CO, USA, 2011.
Hanna, E., Huybrechts, P., and Mote, T. L.: Surface mass balance of the Greenland ice sheet from climate-analysis data and accumulation/runoff models, Ann. Glaciol., 35, 35, 67–72, 2002.
Hanna, E., Huybrechts, P., Janssens, I., Cappelen, J., Steffen, K., and Stephens, A.: Runoff and mass balance of the Greenland ice sheet: 1958–2003, J. Geophys. Res.-Atmos., 110, D13108, https://doi.org/10.1029/2004JD005641, 2005.
Hanna, E., Huybrechts, P., Steffen, K., Cappelen, J., Huff, R., Shuman, C., Irvine-Fynn, T., Wise, S., and Griffiths, M.: Increased runoff from melt from the Greenland Ice Sheet: A response to global warming, J. Climate, 21, 331–341, https://doi.org/10.1175/2007jcli1964.1, 2008.
Hanna, E., Huybrechts, P., Cappelen, J., Steffen, K., Bales, R. C., Burgess, E., McConnell, J. R., Steffensen, J. P., Van den Broeke, M., Wake, L., Bigg, G., Griffiths, M., and Savas, D.: Greenland Ice Sheet surface mass balance 1870 to 2010 based on Twentieth Century Reanalysis, and links with global climate forcing, J. Geophys. Res.-Atmos., 116, D24121, https://doi.org/10.1029/2011jd016387, 2011.
Huybrechts, P., Gregory, J., Janssens, I., and Wild, M.: Modelling Antarctic and Greenland volume changes during the 20th and 21st centuries forced by GCM time slice integrations, Global Planet. Change, 42, 83–105, https://doi.org/10.1016/j.gloplacha.2003.11.011, 2004.
Huybrechts, P., Goelzer, H., Janssens, I., Driesschaert, E., Fichefet, T., Goosse, H., and Loutre, M. F.: Response of the Greenland and Antarctic Ice Sheets to Multi-Millennial Greenhouse Warming in the Earth System Model of Intermediate Complexity LOVECLIM, Surv. Geophys., 32, 397–416, https://doi.org/10.1007/s10712-011-9131-5, 2011.
Janssens, I. and Huybrechts, P.: The treatment of meltwater retention in mass-balance parameterizations of the Greenland ice sheet, in: Ann. Glaciol., 31, 2000, edited by: Steffen, K., Ann. Glaciol., Int Glaciological Soc, Cambridge, 133–140, 2000.
Kargel, J. S., Ahlstrøm, A. P., Alley, R. B., Bamber, J. L., Benham, T. J., Box, J. E., Chen, C., Christoffersen, P., Citterio, M., Cogley, J. G., Jiskoot, H., Leonard, G. J., Morin, P., Scambos, T., Sheldon, T., and Willis, I.: Brief communication Greenland's shrinking ice cover: "fast times" but not that fast, The Cryosphere, 6, 533–537, https://doi.org/10.5194/tc-6-533-2012, 2012.
Key, J., Fowler, C., Maslanik, J., Haran, T., Scambos, T., and Emery, W.: The Extended AVHRR Polar Pathfinder (APP-x) Product, v 1.0. Digital Media, Space Science and Engineering Center, University of Wisconsin, Madison, WI., 2006.
Lefebre, F., Gallee, H., van Ypersele, J. P., and Greuell, W.: Modeling of snow and ice melt at ETH Camp (West Greenland): A study of surface albedo, J. Geophys. Res.-Atmos., 108, 4231, https://doi.org/10.1029/2001jd001160, 2003.
Lucas-Picher, P., Wulff-Nielsen, M., Christensen, J. H., A{\dh}algeirsdóttir, G., Mottram, R., and Simonsen, S. B.: Very high resolution regional climate model simulations over Greenland: Identifying added value, J. Geophys. Res., 117, D02108, https://doi.org/10.1029/2011jd016267, 2012.
Mernild, S. H. and Liston, G. E.: Greenland freshwater runoff. Part II: Distribution and trends, 1960–2010, J. Climate, 6015–6035, https://doi.org/10.1175/jcli-d-11-00592.1, 2012.
Mote, T. L.: Greenland surface melt trends 1973–2007: Evidence of a large increase in 2007, Geophys. Res. Lett., 34, L22507, https://doi.org/10.1029/2007gl031976, 2007.
Overland, J. E., Wang, M. Y., Bond, N. A., Walsh, J. E., Kattsov, V. M., and Chapman, W. L.: Considerations in the Selection of Global Climate Models for Regional Climate Projections: The Arctic as a Case Study, J. Climate, 24, 1583–1597, https://doi.org/10.1175/2010jcli3462.1, 2011.
Pfeffer, W. T., Meier, M. F., and Illangasekare, T. H.: Retention of Greenland runoff by refreezing – implications for projected future sea-level change, J. Geophys. Res.-Oceans, 96, 22117–22124, https://doi.org/10.1029/91jc02502, 1991.
Rae, J. G. L., A{\dh}algeirsdóttir, G., Edwards, T. L., Fettweis, X., Gregory, J. M., Hewitt, H. T., Lowe, J. A., Lucas-Picher, P., Mottram, R. H., Payne, A. J., Ridley, J. K., Shannon, S. R., van de Berg, W. J., van de Wal, R. S. W., and van den Broeke, M. R.: Greenland ice sheet surface mass balance: evaluating simulations and making projections with regional climate models, The Cryosphere, 6, 1275–1294, https://doi.org/10.5194/tc-6-1275-2012, 2012.
Reijmer, C. H., van den Broeke, M. R., Fettweis, X., Ettema, J., and Stap, L. B.: Refreezing on the Greenland ice sheet: a comparison of parameterizations, The Cryosphere, 6, 743–762, https://doi.org/10.5194/tc-6-743-2012, 2012.
Rignot, E., Box, J. E., Burgess, E., and Hanna, E.: Mass balance of the Greenland ice sheet from 1958 to 2007, Geophys. Res. Lett., 35, L20502, https://doi.org/10.1029/2008gl035417, 2008.
Rignot, E., Velicogna, I., van den Broeke, M. R., Monaghan, A., and Lenaerts, J.: Acceleration of the contribution of the Greenland and Antarctic ice sheets to sea level rise, Geophys. Res. Lett., 38, L05503, https://doi.org/10.1029/2011gl046583, 2011.
Sasgen, I., van den Broeke, M., Bamber, J. L., Rignot, E., Sorensen, L. S., Wouters, B., Martinec, Z., Velicogna, I., and Simonsen, S. B.: Timing and origin of recent regional ice-mass loss in Greenland, Earth Planet. Sci. Lett., 333, 293–303, https://doi.org/10.1016/j.epsl.2012.03.033, 2012.
Steffen, K. and Box, J.: Surface climatology of the Greenland ice sheet: Greenland climate network 1995–1999, J. Geophys. Res.-Atmos., 106, 33951–33964, 2001.
Stephenson, D. B., Collins, M., Rougier, J. C., and Chandler, R. E.: Statistical problems in the probabilistic prediction of climate change, Environmetrics, 23, 364–372, https://doi.org/10.1002/env.2153, 2012.
Stroeve, J. C., Box, J. E., and Haran, T.: Evaluation of the MODIS (MOD10A1) daily snow albedo product over the Greenland ice sheet, Remote Sens. Environ., 105, 155–171, https://doi.org/10.1016/j.rse.2006.06.009, 2006.
Tedesco, M. and Fettweis, X.: 21st century projections of surface mass balance changes for major drainage systems of the Greenland ice sheet, Environ. Res. Lett., 7, 045405, https://doi.org/10.1088/1748-9326/7/4/045405, 2012.
Tedesco, M., Fettweis, X., van den Broeke, M. R., van de Wal, R. S. W., Smeets, C., van de Berg, W. J., Serreze, M. C., and Box, J. E.: The role of albedo and accumulation in the 2010 melting record in Greenland, Environ. Res. Lett., 6, 014005, https://doi.org/10.1088/1748-9326/6/1/014005, 2011.
Tedesco, M., Fettweis, X., Mote, T., Wahr, J., Alexander, P., Box, J., and Wouters, B.: Evidence and analysis of 2012 Greenland records from spaceborne observations, a regional climate model and reanalysis data, The Cryosphere Discuss., 6, 4939–4976, https://doi.org/10.5194/tcd-6-4939-2012, 2012.
Uppala, S. M., Kallberg, P. W., Simmons, A. J., Andrae, U., Bechtold, V. D., Fiorino, M., Gibson, J. K., Haseler, J., Hernandez, A., Kelly, G. A., Li, X., Onogi, K., Saarinen, S., Sokka, N., Allan, R. P., Andersson, E., Arpe, K., Balmaseda, M. A., Beljaars, A. C. M., Van De Berg, L., Bidlot, J., Bormann, N., Caires, S., Chevallier, F., Dethof, A., Dragosavac, M., Fisher, M., Fuentes, M., Hagemann, S., Holm, E., Hoskins, B. J., Isaksen, L., Janssen, P., Jenne, R., Mcnally, A. P., Mahfouf, J. F., Morcrette, J. J., Rayner, N. A., Saunders, R. W., Simon, P., Sterl, A., Trenberth, K. E., Untch, A., Vasiljevic, D., Viterbo, P., and Woollen, J.: The ERA-40 re-analysis. Q. J. Roy. Meteor. Soc., 131, 2961–3012, 2005.
van de Wal, R. S. W., Boot, W., Smeets, C. J. P. P., Snellen, H., van den Broeke, M. R., and Oerlemans, J.: Twenty-one years of mass balance observations along the K-transect, West Greenland, Earth Syst. Sci. Data, 4, 31–35, https://doi.org/10.5194/essd-4-31-2012, 2012.
van den Broeke, M., Bamber, J., Ettema, J., Rignot, E., Schrama, E., van de Berg, W. J., van Meijgaard, E., Velicogna, I., and Wouters, B.: Partitioning Recent Greenland Mass Loss, Science, 326, 984–986, https://doi.org/10.1126/science.1178176, 2009.
van Meijgarrd, E., van Ulft, L. H., Van De Berg, W. J., Bosveld, F. C., Van den Hurk, B. J. J. M., Lenderink, G., and Siebesma, A. P.: The KNMI regional atmospheric climate model RACMO version 2.1, KNNI, PO Box 201, 3730 AE De Bilt, Wilhelminalaan 10, De Bilt, the Netherlands, 2008.
Velicogna, I.: Increasing rates of ice mass loss from the Greenland and Antarctic ice sheets revealed by GRACE, Geophys. Res. Lett., 36, L19503, https://doi.org/10.1029/2009gl040222, 2009.


