the Creative Commons Attribution 4.0 License.
the Creative Commons Attribution 4.0 License.
 | 07 Apr 2022
Modelling the effect of submarine iceberg melting on glacier-adjacent water properties
Benjamin Joseph Davison
Tom Cowton
Andrew Sole
Finlo Cottier
Pete Nienow
The rate of ocean-driven retreat of Greenland's tidewater glaciers remains highly uncertain in predictions of future sea level rise, in part due to poorly constrained glacier-adjacent water properties. Icebergs and their meltwater contributions are likely important modifiers of fjord water properties, yet their effect is poorly understood. Here, we use a 3-D ocean circulation model, coupled to a submarine iceberg melt module, to investigate the effect of submarine iceberg melting on glacier-adjacent water properties in a range of idealised settings. Submarine iceberg melting can modify glacier-adjacent water properties in three principal ways: (1) substantial cooling and modest freshening in the upper ∼50 m of the water column; (2) warming of Polar Water at intermediate depths due to iceberg melt-induced upwelling of warm Atlantic Water and; (3) warming of the deeper Atlantic Water layer when vertical temperature gradients through this layer are steep (due to vertical mixing of warm water at depth) but cooling of the Atlantic Water layer when vertical temperature gradients are shallow. The overall effect of iceberg melt is to make glacier-adjacent water properties more uniform with depth. When icebergs extend to, or below, the depth of a sill at the fjord mouth, they can cause cooling throughout the entire water column. All of these effects are more pronounced in fjords with higher iceberg concentrations and deeper iceberg keel depths. These iceberg melt-induced changes to glacier-adjacent water properties will reduce rates of glacier submarine melting near the surface, increase them in the Polar Water layer, and cause typically modest impacts in the Atlantic Water layer. These results characterise the important role of submarine iceberg melting in modifying ice sheet-ocean interaction and highlight the need to improve representations of fjord processes in ice sheet scale models.
- Article
(3047 KB) - Full-text XML
- BibTeX
- EndNote


Predicting the rates of ocean-driven retreat of Greenland's tidewater glaciers remains one of the largest uncertainties in estimating future sea level rise (Edwards et al., 2021; Meredith et al., 2019). This uncertainty is partly due to limited constraints on the ocean-driven thermal forcing of tidewater glacier calving fronts, which reflects in part the difficulty in obtaining hydrographic observations in the proximity of tidewater glacier termini (Jackson et al., 2017, 2020; Sutherland et al., 2019). The few observations of water properties in the inner part of glacial fjords demonstrate that there are typically substantial differences between glacier-adjacent water properties and those near the fjord mouth (e.g. Inall et al., 2014; Jakobsson et al., 2020; Straneo et al., 2011), indicating that substantial modification of water temperature and salinity can occur within glacial fjords. Due to the relatively small number of observations and insufficient model constraints on glacier-adjacent water properties, ice sheet models used to simulate glacier retreat must be forced with far-field (i.e. acquired on and beyond the continental shelf) ocean boundary conditions that do not include fjord-scale influences (Goelzer et al., 2020; Slater et al., 2019), thereby introducing uncertainty into the resulting projections of ice sheet mass loss.
Glacier-adjacent water properties can differ from those near the fjord mouth for several reasons. Meltwater runoff enters the fjord at depth where tidewater glaciers meet the ocean (“subglacial discharge”). In Greenland's fjords, warm water of Atlantic origin (Atlantic Water, AW) is generally found at depth, whilst colder, fresher water of polar origin (Polar Water, PW) is found at intermediate depths (Straneo and Heimbach, 2013; Sutherland and Pickart, 2008). The cold, fresh subglacial discharge is buoyant when it enters the fjord and rises as a turbulent plume (Jenkins, 2011). As it rises it entrains fjord water, which mixes with the subglacial discharge as it ascends towards the fjord surface (e.g. Beaird et al., 2018). In this way, subglacial discharge-driven plumes act as mixing engines at the head of glacial fjords. Due to the temperature stratification in Greenland's fjords, plumes at deeply grounded glaciers (i.e. deeper than the PW-AW interface) often draw the relatively warm AW towards the fjord surface, thereby warming surface and near-surface waters (e.g. Carroll et al., 2016; Straneo et al., 2010, 2011). In contrast, plumes at shallowly grounded glaciers can cause cooling at and near the fjord surface as cold subglacial discharge and entrained PW is upwelled into surface layers that are seasonally warmed by solar radiation (Carroll et al., 2016). Models that include glacial plumes are able to reproduce these effects convincingly (Carroll et al., 2016; Cowton et al., 2015; Jackson et al., 2017). However, there remain substantial differences between modelled water properties and those that are observed adjacent to tidewater glaciers (Cowton et al., 2016; Davison et al., 2020; Fraser and Inall, 2018).
Several recent studies have identified icebergs as a substantial freshwater source in some of Greenland's fjords, with iceberg freshwater volumes comparable to or greater than ice sheet runoff (Enderlin et al., 2016, 2018; Jackson and Straneo, 2016; Moon et al., 2017; Moyer et al., 2019; Rezvanbehbahani et al., 2020). Furthermore, modelling of one of these fjords suggests that including the heat and salt fluxes associated with submarine iceberg melting greatly increases the model's ability to reproduce observed glacier-adjacent water properties (Davison et al., 2020). However, iceberg concentration, keel depth, and the size-frequency distribution likely vary hugely between fjords as well as over time, although observations of icebergs at the fjord scale are sparse (Enderlin et al., 2016; Moyer et al., 2019; Rezvanbehbahani et al., 2020; Sulak et al., 2017). As such, it is likely that the effect of icebergs on glacier-adjacent water properties will also vary both spatially (i.e. between fjords) and temporally. This variability likely results in different thermal forcing of tidewater glaciers for a given set of far-field ocean conditions. Constraining the effect of icebergs on glacier-adjacent water properties and thus glacier submarine melt rates, is therefore a necessary step in order to improve projections of ice sheet mass loss.
Here, we use an ocean circulation model in a series of idealised fjord-scale simulations to examine how icebergs affect glacier-adjacent water properties across a range of Greenland-relevant scenarios. We first consider how iceberg concentration, keel depth and size-frequency distribution individually affect glacier-adjacent water properties. We then consider a range of representative iceberg and ocean scenarios, to examine how these parameters interact to determine water properties in the critical region adjacent to tidewater glacier termini. Greenland's fjords are complex and varied in their geometry, ranging from short, narrow inlets to those that are long and wide, each with varying sinuosity and bathymetry, and often with several tributaries and sills of varying depth along their length. It would be impractical to attempt to characterise all of these systems. Therefore, we focus here on two simple fjord geometries: one with no sills and another with a single entrance sill, which we expect to be of particular importance for iceberg-ocean interaction given the capacity of sills to concentrate fjord-shelf water exchange near the surface where icebergs are concentrated (Schaffer et al., 2020).
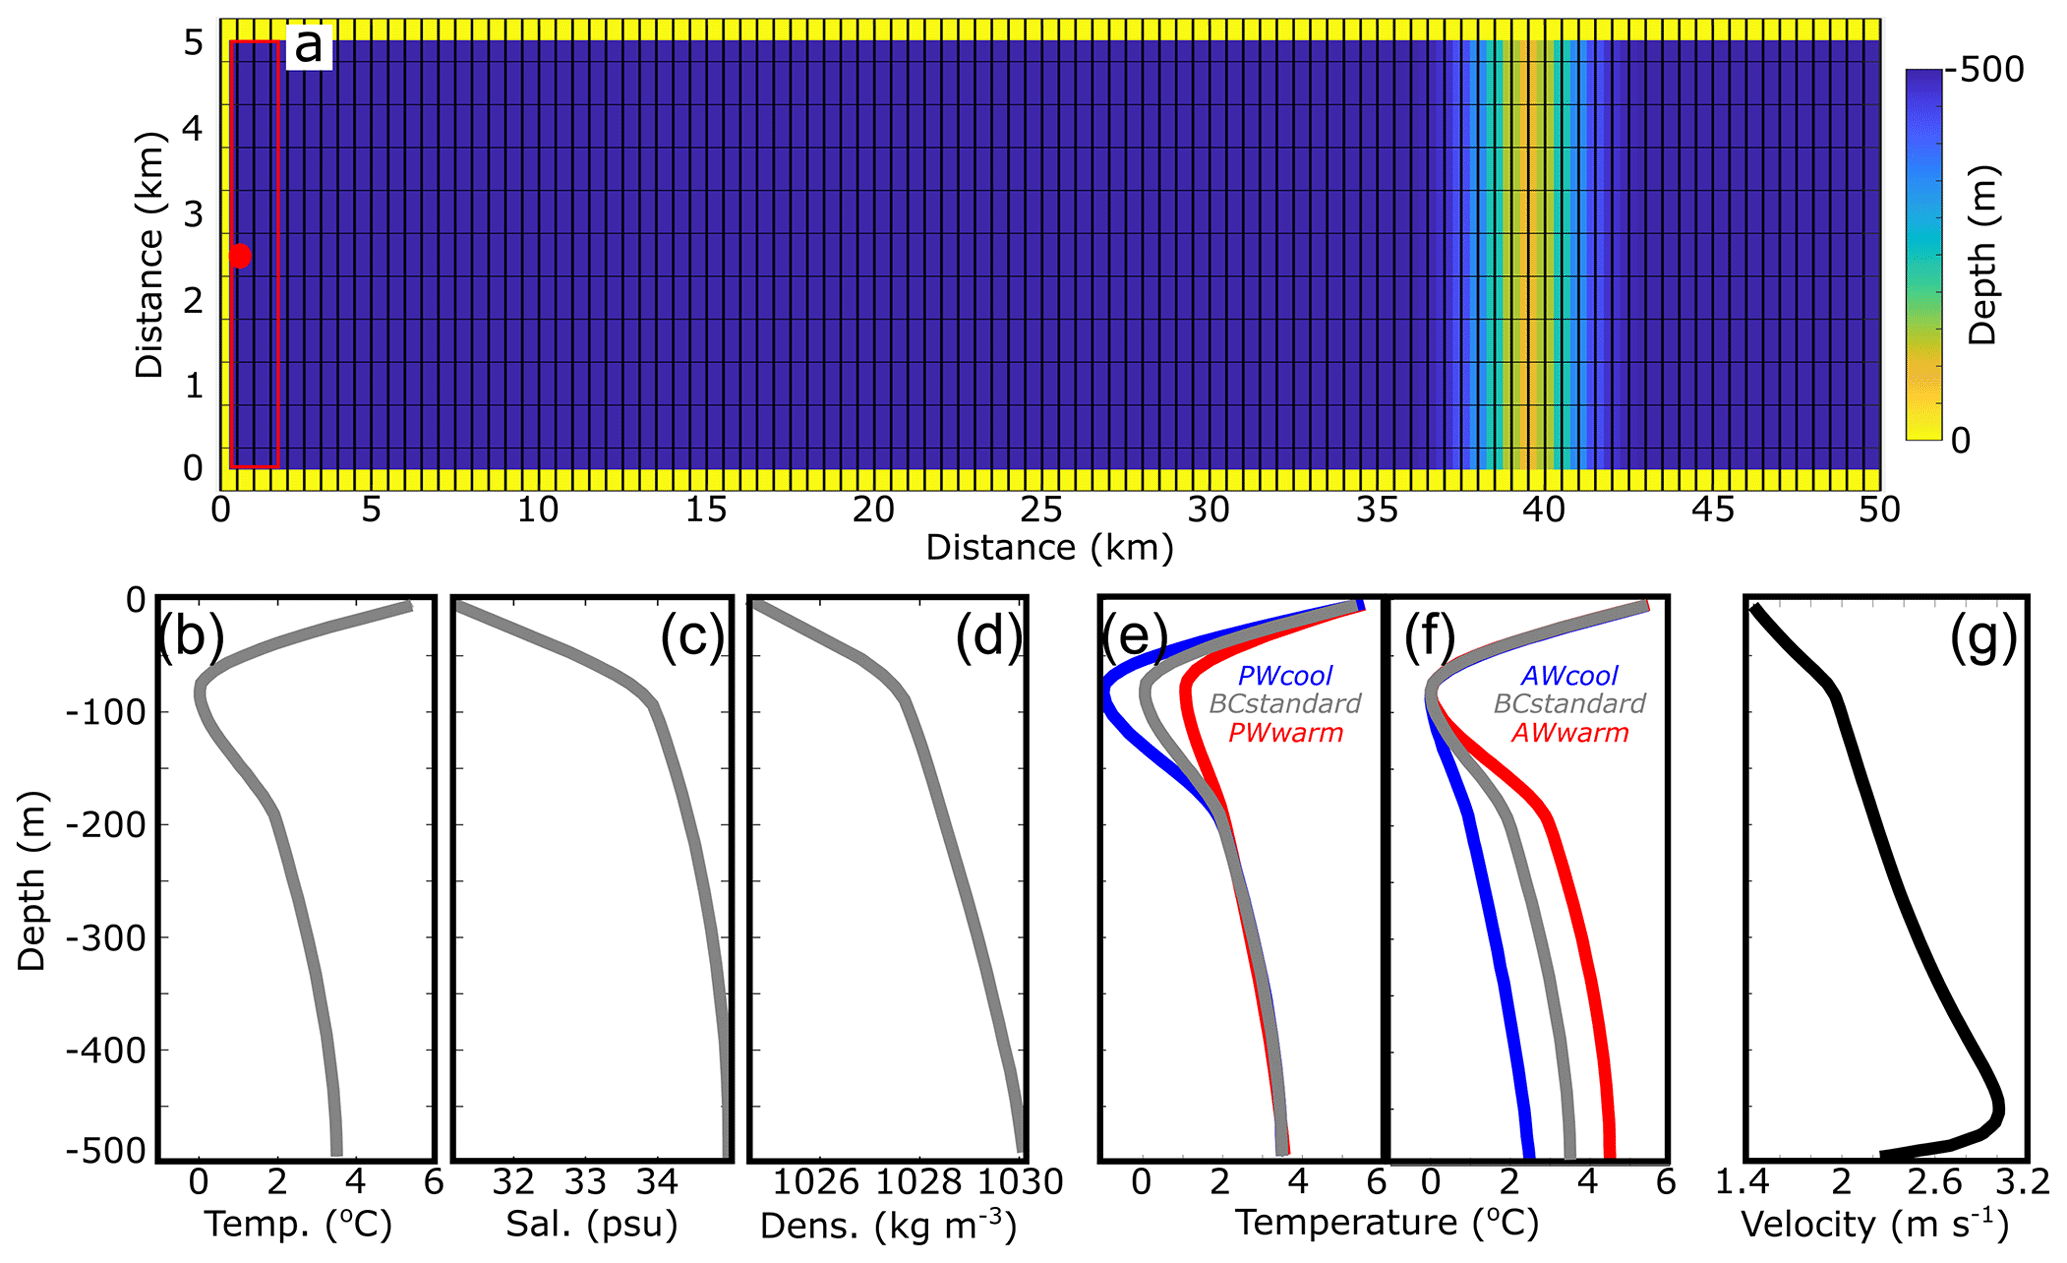
Figure 1Model domain and boundary conditions. (a) Plan view of model bathymetry with sill, with the ice wall at the left end of the domain (0 km) and the open boundary on the right. Hatching indicates model resolution (note that grid cells are 500 m×500 m in the horizontal). The red dot marks the location of subglacial discharge injection and the red box indicates the region from which steady-state glacier-adjacent water properties were extracted. In simulations without a sill, the domain is uniformly 500 m deep. Vertical profiles of (b) temperature, (c) salinity and (d) density with BCstandard. (e) Temperature profiles with varying PW temperature. (f) Temperature profiles with varying AW temperature. (g) Example of plume vertical velocity from the simulation with iceberg scenario 5, 500 m3 s−1 subglacial discharge and BCstandard boundary conditions.
2.1 Model domain
We used the Massachusetts Institute of Technology general circulation model (MITgcm) in its non-hydrostatic configuration (Marshall et al., 1997a, b) to model submarine ice melting and circulation in an idealised fjord 50 km in length and 5 km in width. In most simulations, the domain is uniformly 500 m deep. However, in some simulations, we include a sill which limits the overlying water depth to 100 m (uniform across the entire width of the fjord, and approximately 5 km wide in the along-fjord direction, with a Gaussian profile), centred 10 km from the open boundary (Fig. 1a). Model resolution is uniformly 500 m horizontally and 10 m vertically. The fjord sides are closed boundaries, while at the open ocean boundary we impose a 5 km sponge layer, in which conditions are relaxed towards those imposed at the boundary (e.g. Cowton et al., 2016; Sciascia et al., 2013; Slater et al., 2015).
The glacier-end of the domain is closed and consists of a virtual ice wall 5 km wide and 500 m high. In simulations incorporating subglacial discharge, this is input at a rate of 500 m3 s−1, a value typical of many of Greenland's tidewater glaciers (Mankoff et al., 2020a), at the centre of the base of the ice wall (Fig. 1a). The velocity of the subglacial discharge-driven plume (e.g. Fig. 1g) and the melting of the ice wall were calculated using the IcePlume package (Cowton et al., 2015). In common with several previous studies (Kimura et al., 2014; Slater et al., 2015; Xu et al., 2013), we implement a free slip condition on the fjord walls and ice front and do not simulate the effects of sea ice, atmospheric forcing or tides.
2.2 Initial and open boundary conditions
We use idealised representations of temperature and salinity profiles commonly observed at the mouth of Greenland's southeastern fjords during late summer as initial and open boundary conditions (Sutherland et al., 2014). In our standard set-up, this idealised profile is a cubic interpolation between 6 ∘C and 31 psu at the fjord surface, 0 ∘C and 34 psu at 100 m depth, 2 ∘C at 200 m and 3.5 ∘C at 500 m depth, where salinity is greatest at 35 psu (Fig. 1b–d). In this way, the upper several tens of metres represent waters that are seasonally warmed by solar insolation, whilst the relatively cold intermediate layer, centred 100 m below the fjord surface, represents the PW layer, which is underlain by warmer, more saline water representing the AW layer. Henceforth, we refer to this set of boundary conditions as BCstandard. In separate simulations, we use temperature minima at 100 m of −1 ∘C (PWcool) and 1 ∘C (PWwarm) and temperature maxima at 500 m of 2.5 ∘C (AWcool) and 4.5 ∘C (AWwarm) (Fig. 1e and f). Changing the temperature of the AW and PW layers causes corresponding changes in the vertical temperature gradient (Fig. 1e and f), the effects of which are discussed in Sect. 3.2. Initial and open boundary salinity are kept constant between simulations, but density changes between simulations are negligible. Boundary conditions were kept constant throughout each simulation. We focus on late-summer ocean conditions because of the greater availability of observations at that time to both force the model and with which to make comparisons.
2.3 Iceberg-ocean interaction
Submarine iceberg melting is simulated using the IceBerg package within MITgcm (Davison et al., 2020), with an ice temperature of −10 ∘C (Inall et al., 2014; Luthi et al., 2002; Sciascia et al., 2013; Sutherland and Straneo, 2012). This package uses the velocity-dependent 3-equation melt rate parameterisation (Hellmer and Olbers, 1989; Holland and Jenkins, 1999; Xu et al., 2012). We chose to use this melt rate parameterisation rather than existing iceberg melt parameterisations (e.g. Bigg et al., 1997), because it enables us to resolve the vertical pattern of submarine melting of individual icebergs. The temperature and salinity fluxes associated with melting of individual iceberg faces within a grid cell are calculated based on local temperature, salinity and face-normal velocity. Face-normal current speed is calculated assuming that icebergs drift with the average current velocity along their draught (although we note that the iceberg locations are kept constant through each simulation). Melt-driven plumes are not simulated directly; instead, their effect on melt rates is parameterised by applying a minimum face-normal current speed of 0.06 m s−1 to each iceberg face. This minimum current speed is based on line plume modelling (Davison et al., 2020). The package does not include the effect of waves or mechanical iceberg break-up; therefore, melt rates calculated here are conservative. We use standard parameter values (Cowton et al., 2015; Davison et al., 2020; Jackson et al., 2020) for the drag coefficient (0.0025), and thermal and salt turbulent transfer coefficients (0.022 and 0.00062, respectively). The icebergs are rectangular in plan-view and have flat, vertical sides. All icebergs have length (l) to width ratios of 1.62:1 (Dowdeswell et al., 1992), and iceberg keel depth (d) is related to iceberg length through d=2.91l071 (Barker et al., 2004).
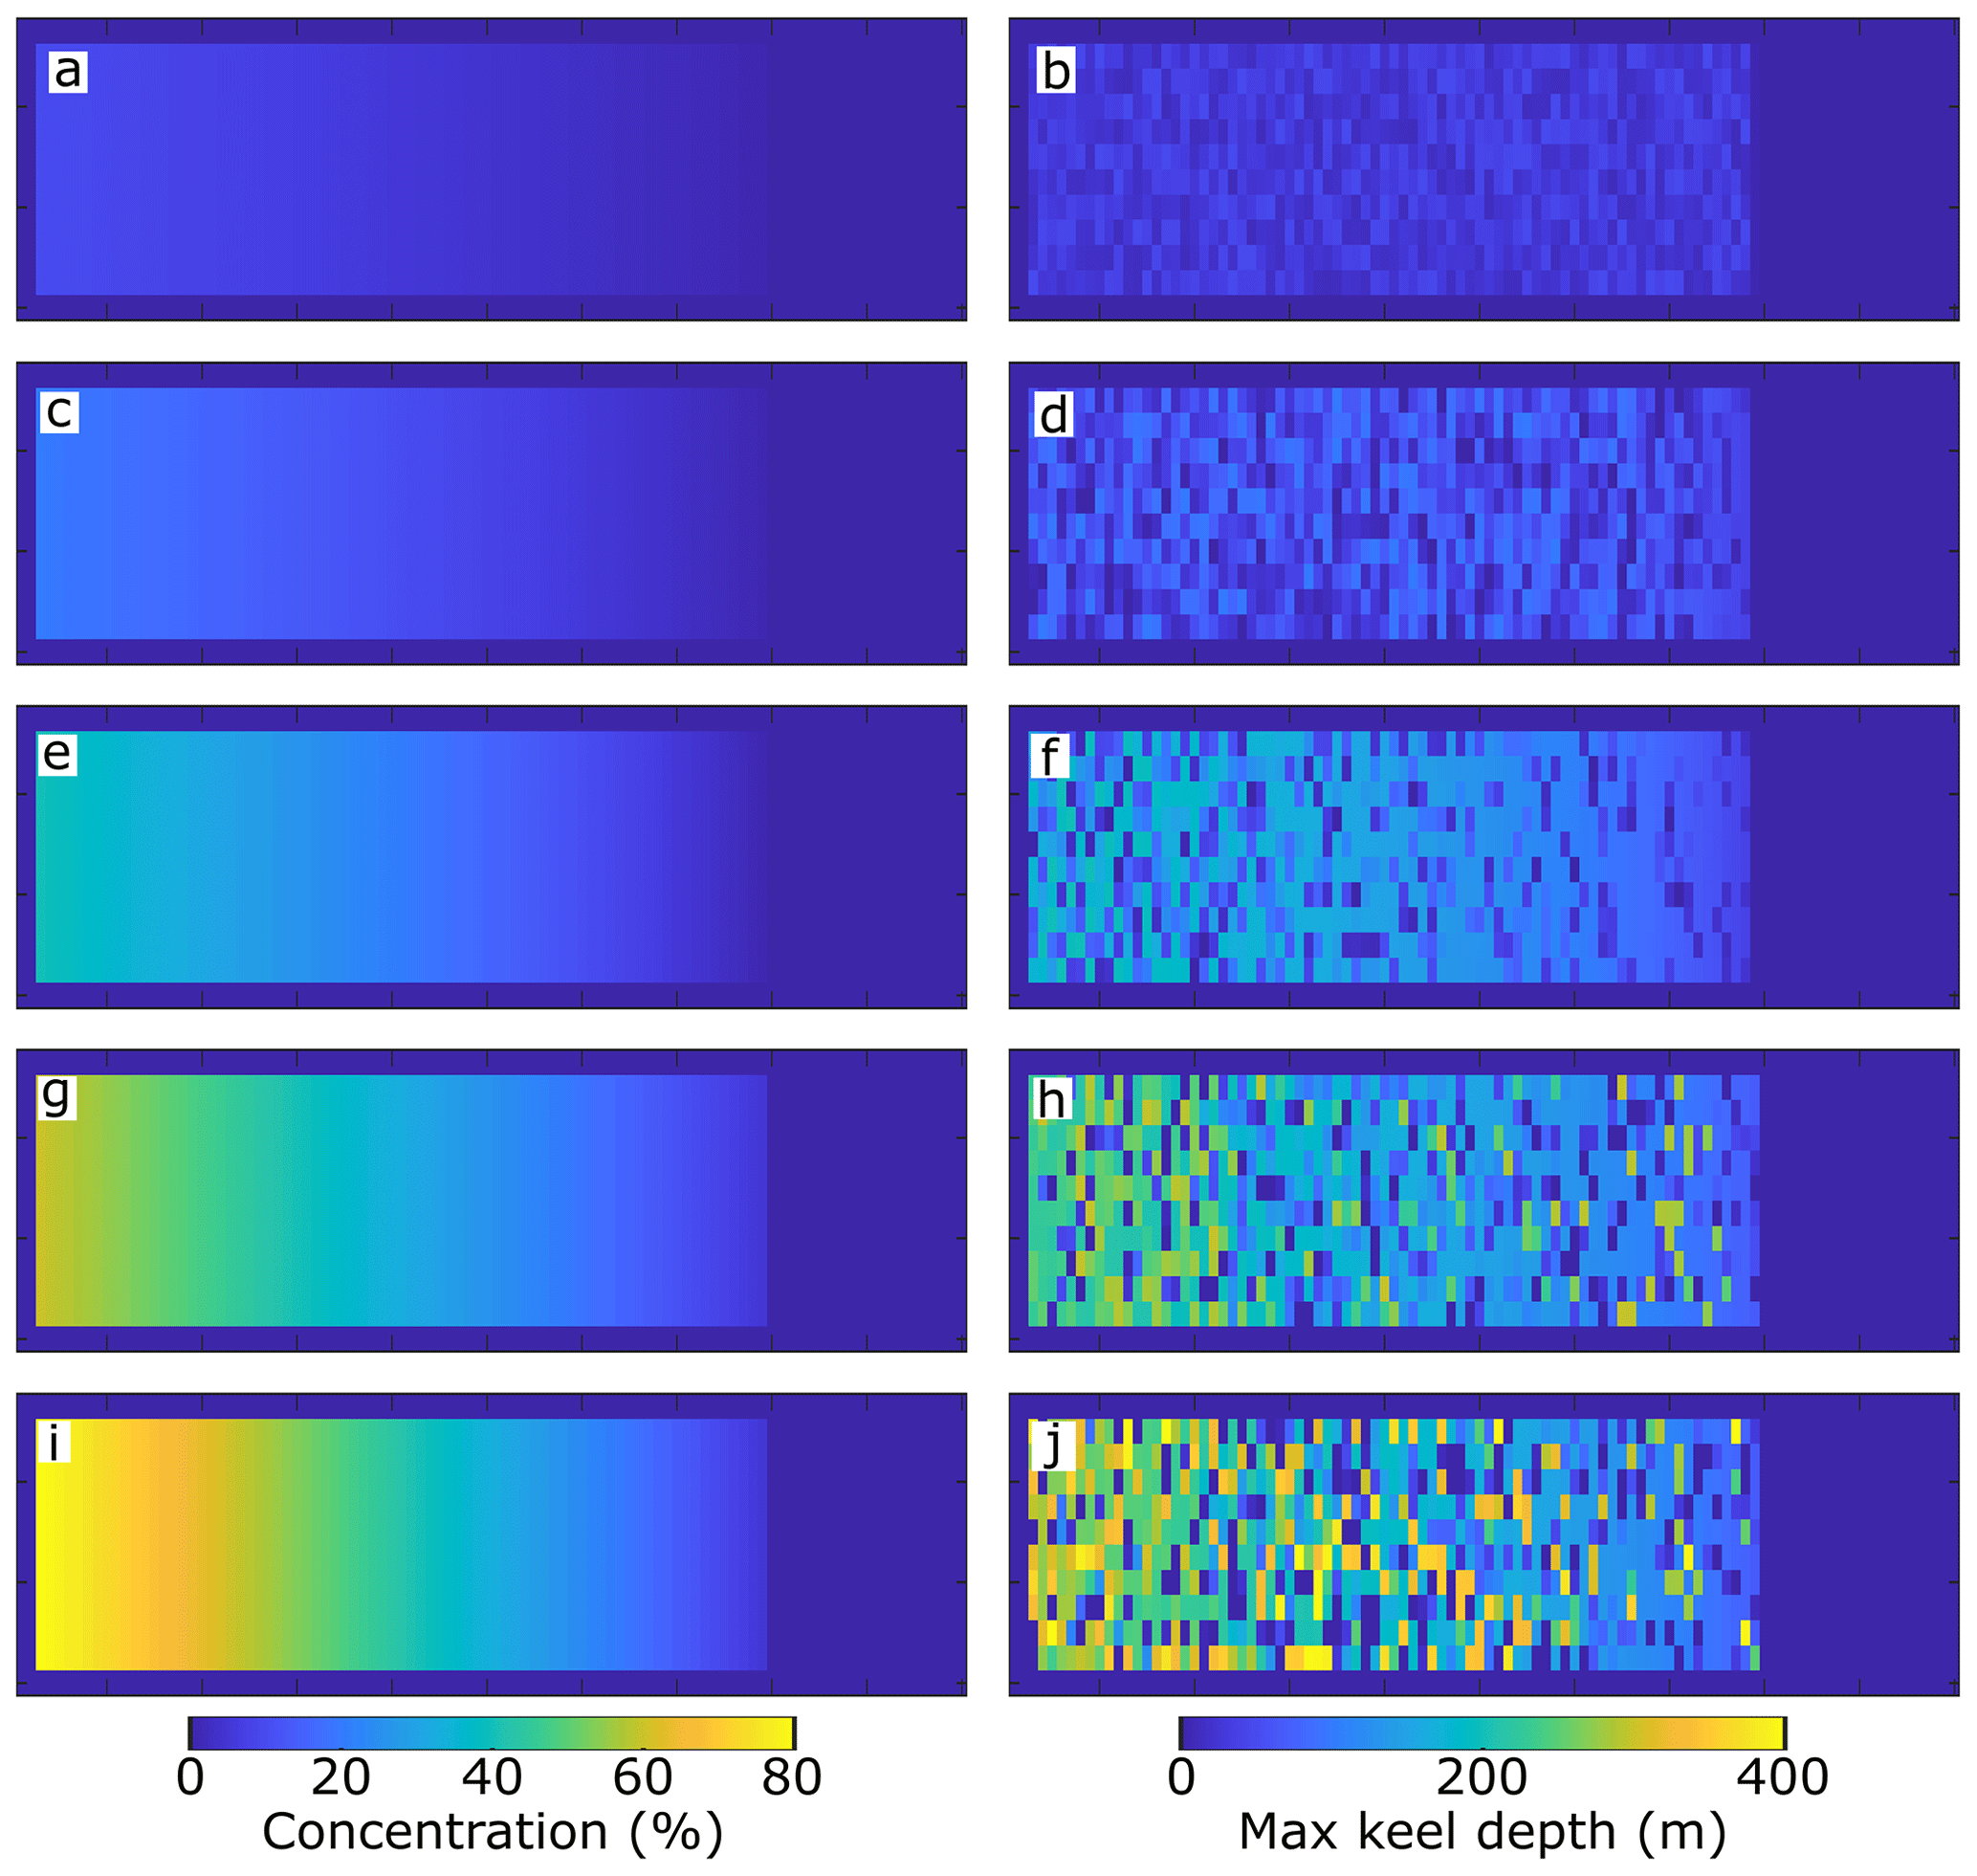
Figure 2Iceberg concentration (a, c, e, g, i) and maximum iceberg keel depth (b, d, f, h, j) for iceberg scenarios 1–5 (top to bottom). All panels show the domain in plan-view and are 50 km long and 5 km across.
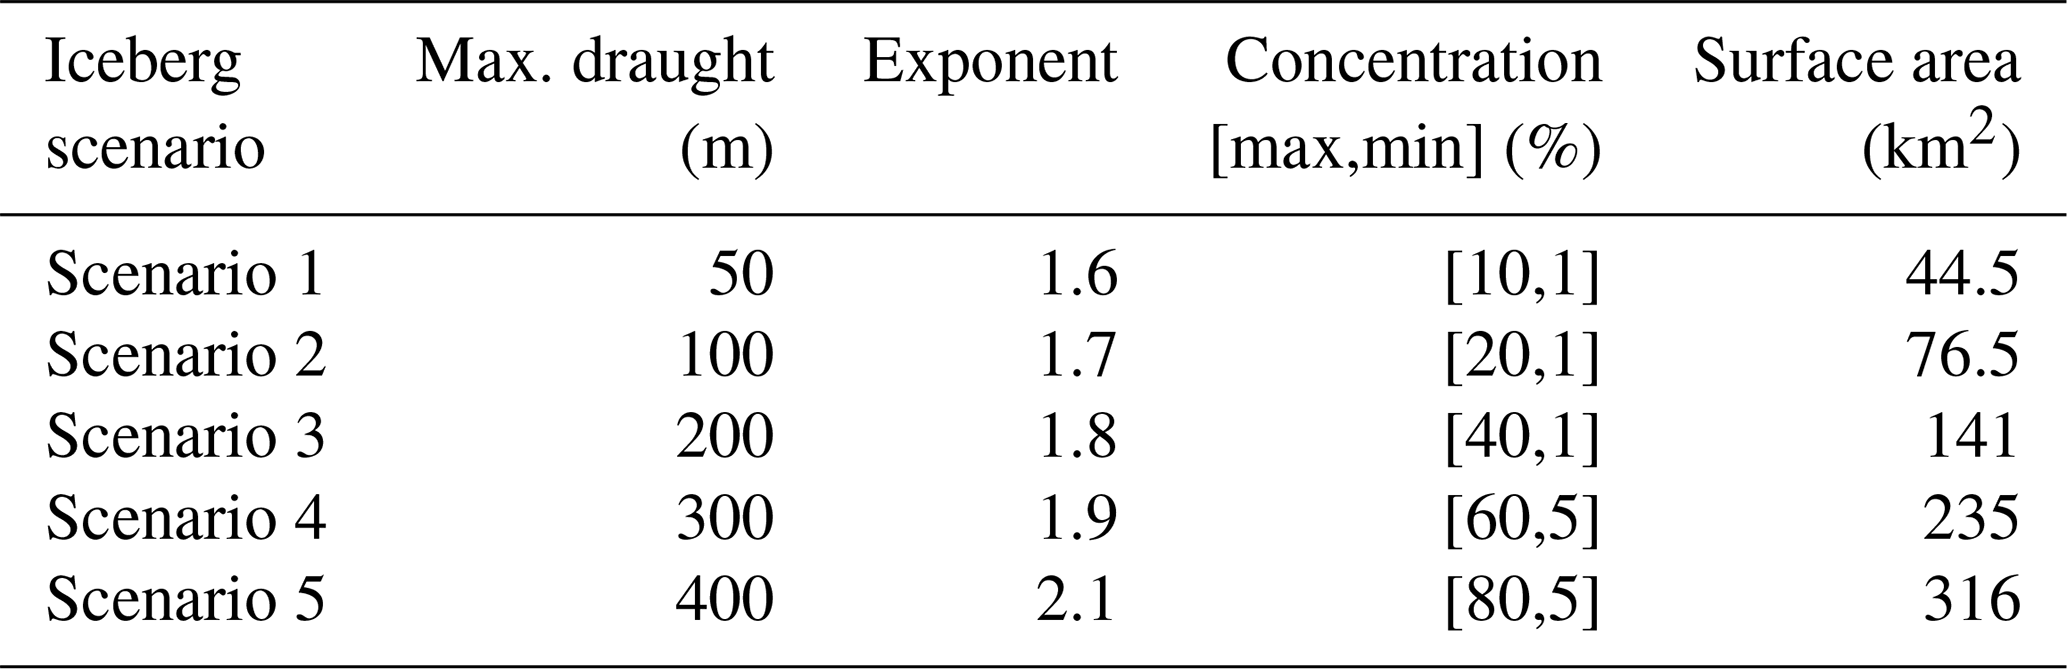
Table 1Details of each iceberg scenario. Concentration is the percentage of the fjord in plan-view occupied by icebergs. Iceberg concentration was linearly interpolated from the maximum value (adjacent to the glacier wall) to the minimum value 40 km down the fjord.
In Sect. 3.1, we consider a range of iceberg concentrations, maximum keel depths and size-frequency distributions, whilst using only the BCstandard boundary conditions. In all set-ups, iceberg concentration is uniform across the fjord and decreases linearly from a maximum adjacent to the virtual ice wall to a minimum 10 km from the open boundary. In Sect. 3.1, iceberg concentration (defined as the percentage of the fjord surface in plan-view occupied by icebergs), is 80 % adjacent to the ice wall and decreases to 5 % in our c1 experiment, and is reduced to 75 %, 50 % and 25 % of these values in our c0.75, c0.5, and c0.25 experiments, respectively. Regardless of concentration, we used a maximum iceberg keel depth of 300 m and the size-frequency distribution of the icebergs is described using a power law with an exponent of −2, which is similar to that observed in Sermilik Fjord (Sulak et al., 2017). In separate simulations, we assign maximum iceberg keel depths of 50, 150, 250, 350 and 450 m, whilst maintaining the c1 concentration and the −2 power law exponent. We then vary the size-frequency distribution power law exponent from −1.6 to −2.1 in increments of 0.1 (covering the range observed to date in Greenland's fjords (Rezvanbehbahani et al., 2020; Sulak et al., 2017)), whilst retaining the c1 concentration and the 300 m maximum keel depth. In Sect. 3.1 we show the results from simulations both with and without subglacial discharge, to demonstrate the effect of icebergs in isolation and in combination with subglacial discharge.
In Sect. 3.2 onwards we consider five realistic combinations of iceberg concentration, maximum iceberg keel depth and power law exponent, in order to approximate the range of iceberg geometries and distributions found in Greenland's fjords in summer (Fig. 2). In these set-ups, iceberg concentration decreases linearly in the along-fjord direction away from the glacier between specified maximum and minimum values (Table 1) and icebergs are distributed randomly in the across-fjord direction (Fig. 2). These iceberg set-ups range from those representing a fjord hosting few and small icebergs, such as Kangerlussuup Sermia Fjord (Sulak et al., 2017) (scenario 1), to those representing an iceberg-congested fjord, such as Sermilik Fjord (scenario 5) (Fig. 2; Table 1). In all simulations shown in this section (Sect. 3.2) 500 m3 s−1 subglacial discharge is injected into the fjord as described in Sect. 2.1.
3.1 The effect of iceberg concentration, keel depth and size-frequency distribution on glacier-adjacent water properties
The effect of iceberg melt on glacier-adjacent water properties depends on iceberg geometry, iceberg concentration and iceberg size-frequency distribution (Fig. 3) as well as on the presence or absence of subglacial discharge. In the absence of subglacial discharge, icebergs modify glacier-adjacent water properties (here defined as the average properties of the water within 2 km of the ice wall; Fig. 1a) in two main ways.
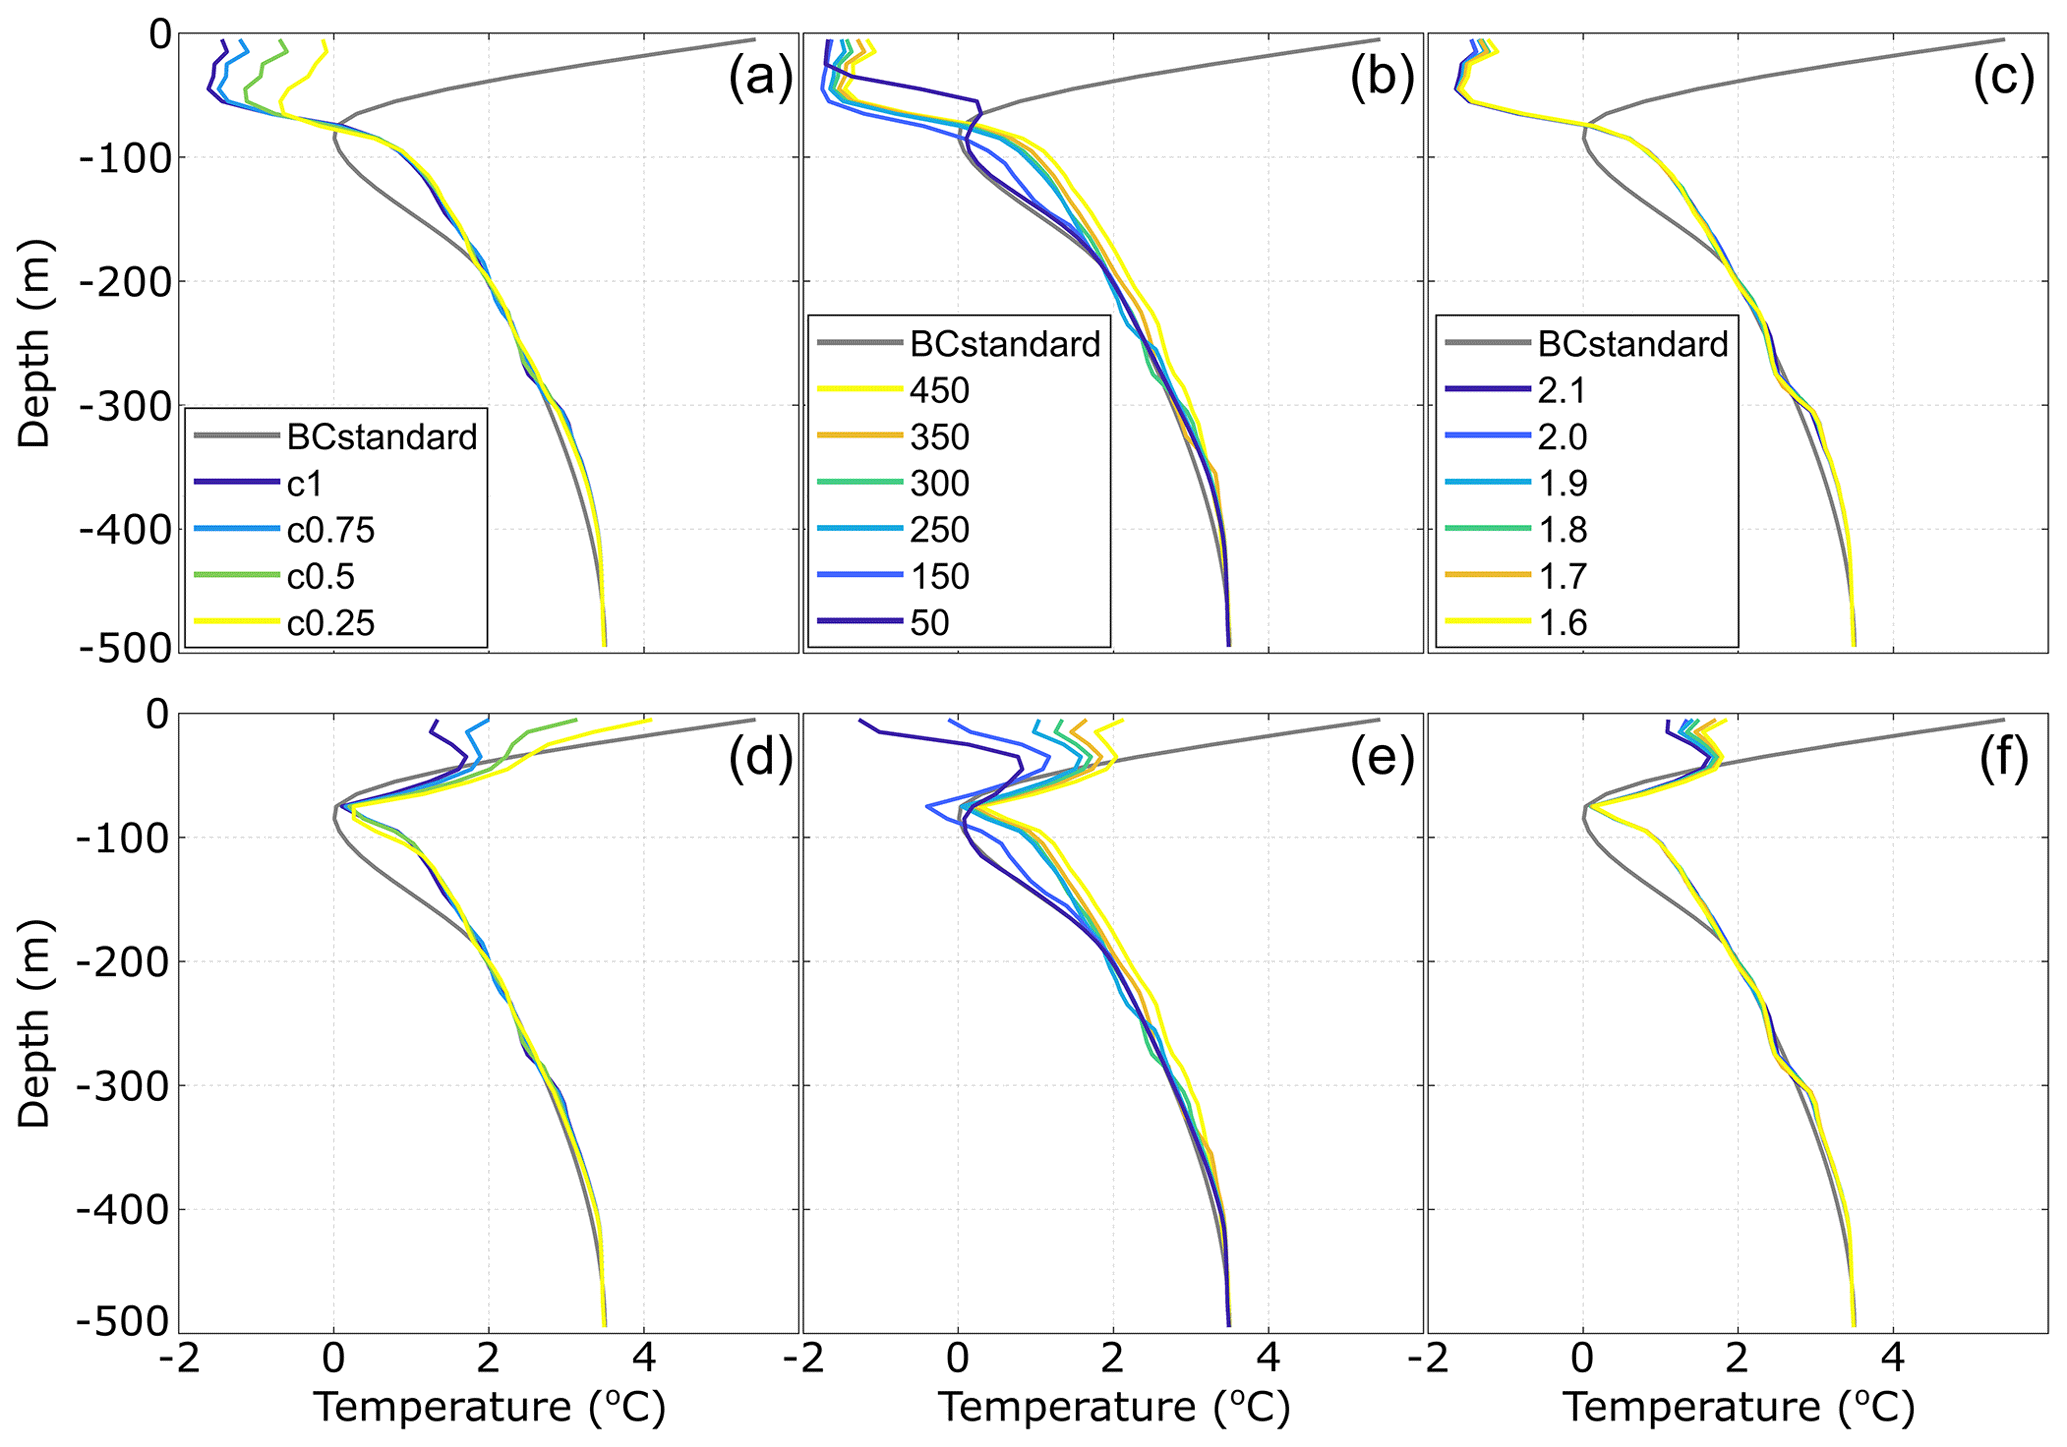
Figure 3Glacier-adjacent water temperature vs. iceberg geometry and distribution. Effect of iceberg concentration (a, d), maximum iceberg draught (b, e) and exponent describing the size-frequency distribution (c, f). Panels (a)–(c) are for simulations without subglacial discharge, whilst panels (d)–(f) are for simulations with 500 m3 s−1 subglacial discharge.
Firstly, they cause substantial (6–7.5 ∘C) cooling in the upper ∼60 m of the water column, relative to the initial conditions (Fig. 3a–c). The amount of cooling in this near-surface layer depends somewhat on iceberg concentration, with steady-state water temperature varying between and ∼0 ∘C over the range of iceberg concentrations considered but is otherwise relatively insensitive to changing iceberg geometry and distribution (Fig. 3a–c). Secondly, warming of up to ∼1 ∘C occurs below ∼80 m because iceberg melting causes localised freshening at depth. The resulting iceberg melt-modified water (i.e. the mixture of iceberg freshwater and ambient water at depth) is less dense than the surrounding water and rises buoyantly towards the fjord surface. The vertical extent and magnitude of the resulting warming generally increase with maximum iceberg keel depth (Fig. 3b), because icebergs with deeper keels cause upwelling of deeper AW (which in this case is also warmer (Fig. 1b)). This warming effect does not extend to the fjord surface, because the stronger stratification near the surface limits upwelling and because iceberg-ocean contact areas are much greater near the surface, so that cooling due to localised iceberg melting dominates. When subglacial discharge is included, the effect of iceberg melt on glacier-adjacent water properties at depth (below 60 m) is similar to that in simulations without subglacial discharge but glacier-adjacent water temperatures in the upper ∼60 m of the water column display a greater range and the cooling of the near-surface waters is considerably reduced (Fig. 3d–f). This is because the subglacial discharge causes strong upwelling of AW towards the fjord surface and increases rates of fjord-shelf exchange, which counters some of the iceberg-induced cooling of near-surface waters.
3.2 Combining iceberg scenarios and ocean conditions
In reality, changes in iceberg concentration, keel depth and size-frequency distribution do not occur in isolation and there are characteristic relationships between those iceberg descriptors (Sulak et al., 2017). Fjords hosting large glaciers, such as Sermilik Fjord and Helheim Glacier in east Greenland, tend to contain both high iceberg concentrations and large, deeply draughted icebergs, whilst those with lower iceberg concentrations, such as Kangerlussuup Sermia Fjord, also tend to contain smaller icebergs. To better represent the range of iceberg conditions found in Greenland's fjords, we consider five iceberg scenarios (Fig. 2; Table 1), ranging from a fjord with low iceberg concentration, shallow iceberg keels and fairly uniform iceberg sizes (iceberg scenario 1), to a fjord with high iceberg concentration, deep iceberg keels and a large range of iceberg sizes (iceberg scenario 5). For each of these scenarios, we examine steady-state glacier-adjacent water temperatures for a range of ocean boundary conditions, with and without a shallow (100 m) sill. We therefore consider three different PW and AW temperatures in turn (Fig. 1e and f), and examine the resulting glacier-adjacent water properties for each of the five iceberg scenarios. To isolate the effect of iceberg melting from other processes, we compare each of the above simulations to identical simulations without icebergs.
3.2.1 Changing Polar Water temperature
Figure 4 shows steady-state glacier-adjacent water properties for the range of iceberg scenarios and PW temperatures considered. In all iceberg scenarios, there is substantial (∼2 ∘C or more) cooling in the upper ∼60 m, with greater cooling in scenarios with higher iceberg concentrations. Other than this near-surface cooling, glacier-adjacent water properties are very similar to open ocean conditions in iceberg scenarios 1 and 2 (which have the lowest iceberg concentrations; Fig. 2; Table 1). However, in iceberg scenarios 3–5 the PW layer is increasingly modified (Fig. 4c–e). With PWcool, icebergs in these scenarios cause on average a net warming of 1.02 ∘C in the 80–200 m depth range, compared to simulations without icebergs. Conversely, with PWwarm, the icebergs cause a net cooling of 0.30 ∘C over the same depth range, such that the steady-state temperature profiles for both sets of initial conditions (PWcool and PWwarm) are similar.
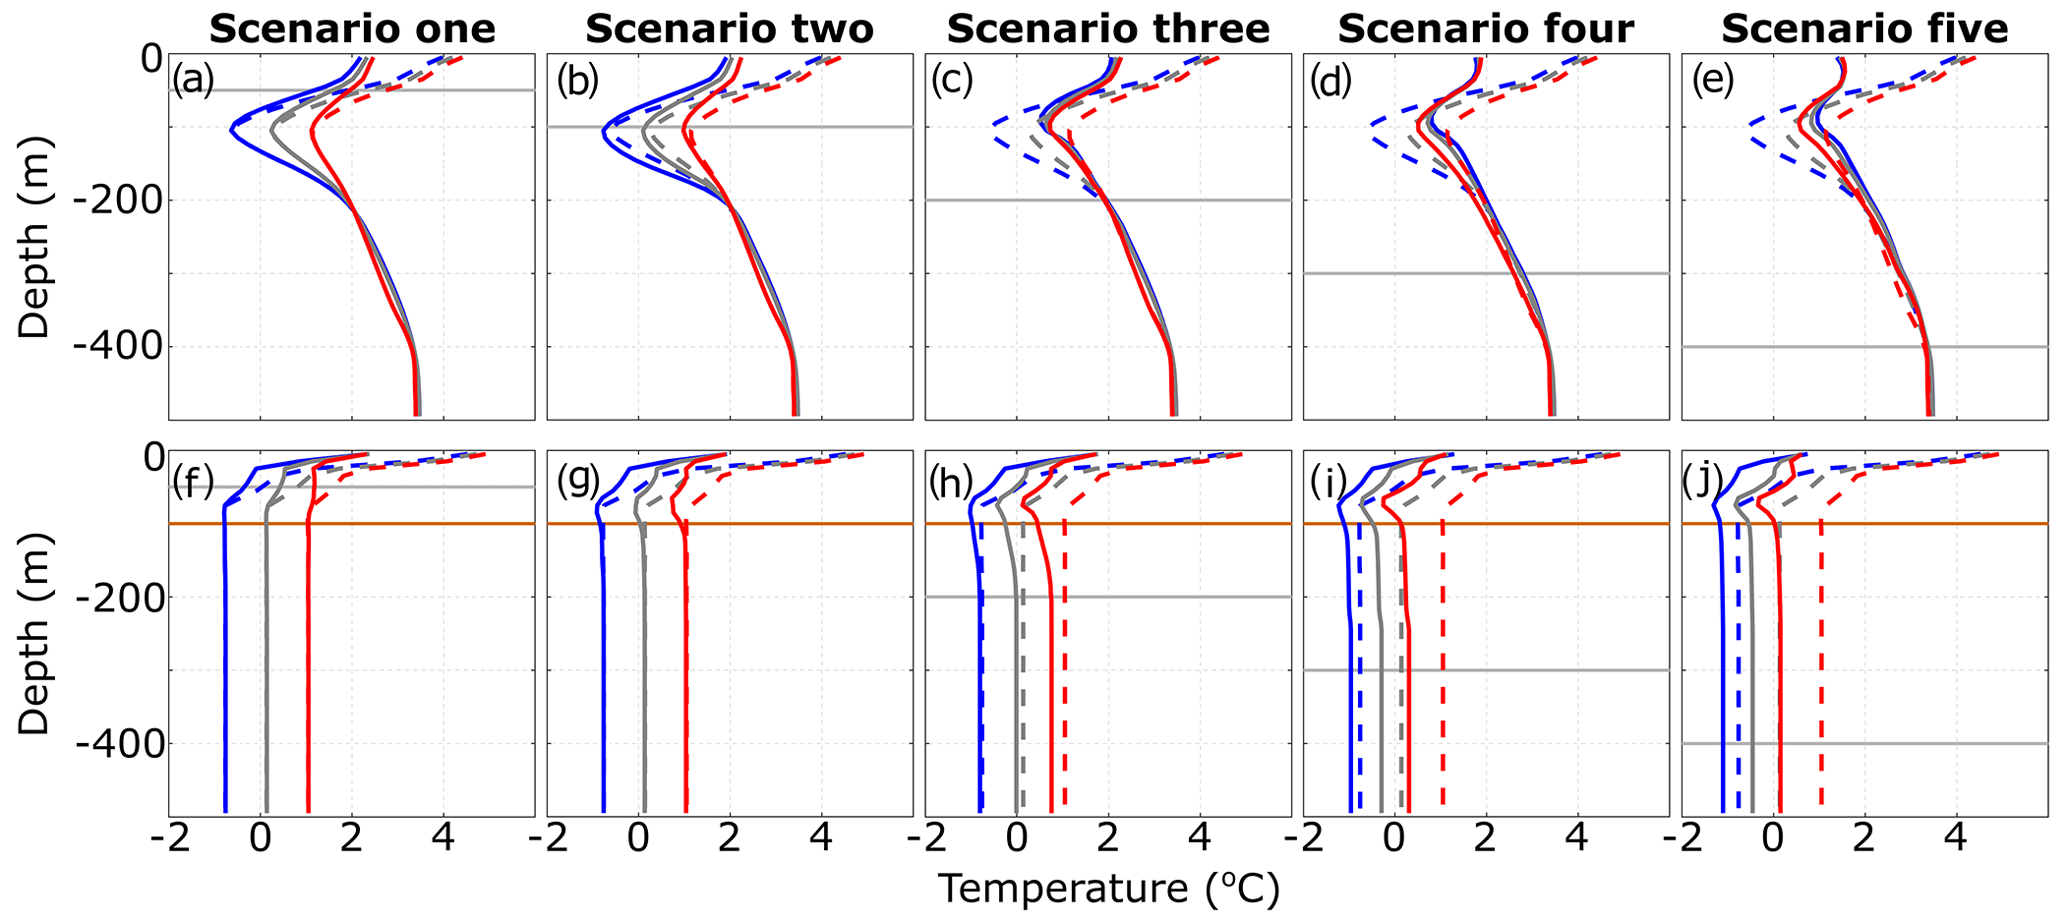
Figure 4Steady-state glacier-adjacent water temperature for a range of initial Polar Water conditions. In all plots, solid and dashed lines indicate simulations with and without icebergs, respectively. Panels (a)–(e) show configurations with a flat-bottomed domain, whilst (f)–(j) show those with a 100 m deep sill. Grey, blue and red lines show scenarios using the BCstandard, PWcool and PWwarm boundary conditions, respectively (shown in Fig. 1e). The horizontal grey lines indicate the maximum iceberg keel depth in each scenario, and the horizontal orange lines in panels (f)–(j) indicate the sill depth.
With BCstandard, the influence of icebergs on glacier-adjacent water properties falls between the two, with the net effect being a slight (0.43 ∘C) warming (Fig. 4c–e). These changes arise due to differing balances between cooling due to iceberg melting, and warming due to buoyancy-induced upwelling of relatively warm AW. With PWcool there is relatively little iceberg melting in the PW layer (because the PW is close to the in-situ freezing point), and so warming due to upwelling of AW dominates (driven by iceberg melting at greater depth in the warmer AW layer). In contrast, with PWwarm, iceberg melt rates in the PW layer are comparatively high, and the temperature difference between the PW and AW layers is reduced, so localised cooling offsets warming due to turbulent upwelling. In short, under the conditions represented by these simulations, submarine iceberg melting acts to make glacier-adjacent water temperature more uniform with depth (Fig. 4c–e).
The addition of a 100 m deep sill near the fjord mouth serves to amplify the cooling effect of icebergs (Fig. 4f–j). Sills typically block external shelf waters below the sill depth from entering the fjord (unless external forcing causes a shallowing of isopycnals seaward of the sill), causing the fjord basin bounded by the sill to be replenished by waters sourced only from above the sill depth (e.g. Jakobsson et al., 2020). When icebergs reach down to the sill depth, all water entering the fjord may thus be subject to melt-driven cooling. The result is that icebergs cause cooling throughout the water column, even below the deepest iceberg keels and below the sill depth (Fig. 4f–j). This cooling is increasingly pronounced as the PW temperature increases and with more concentrated and deeper icebergs (Fig. 4f–j). For example, over the 100–500 m depth range with PWcool, icebergs cause 0.21 ∘C cooling on average in iceberg scenarios 3–5 (0.06 ∘C in scenario 3 and 0.35 ∘C in scenario 5); whilst with PWwarm, icebergs cause 0.67 ∘C cooling on average (0.33 ∘C in scenario 3 and 0.91 ∘C in scenario 5).
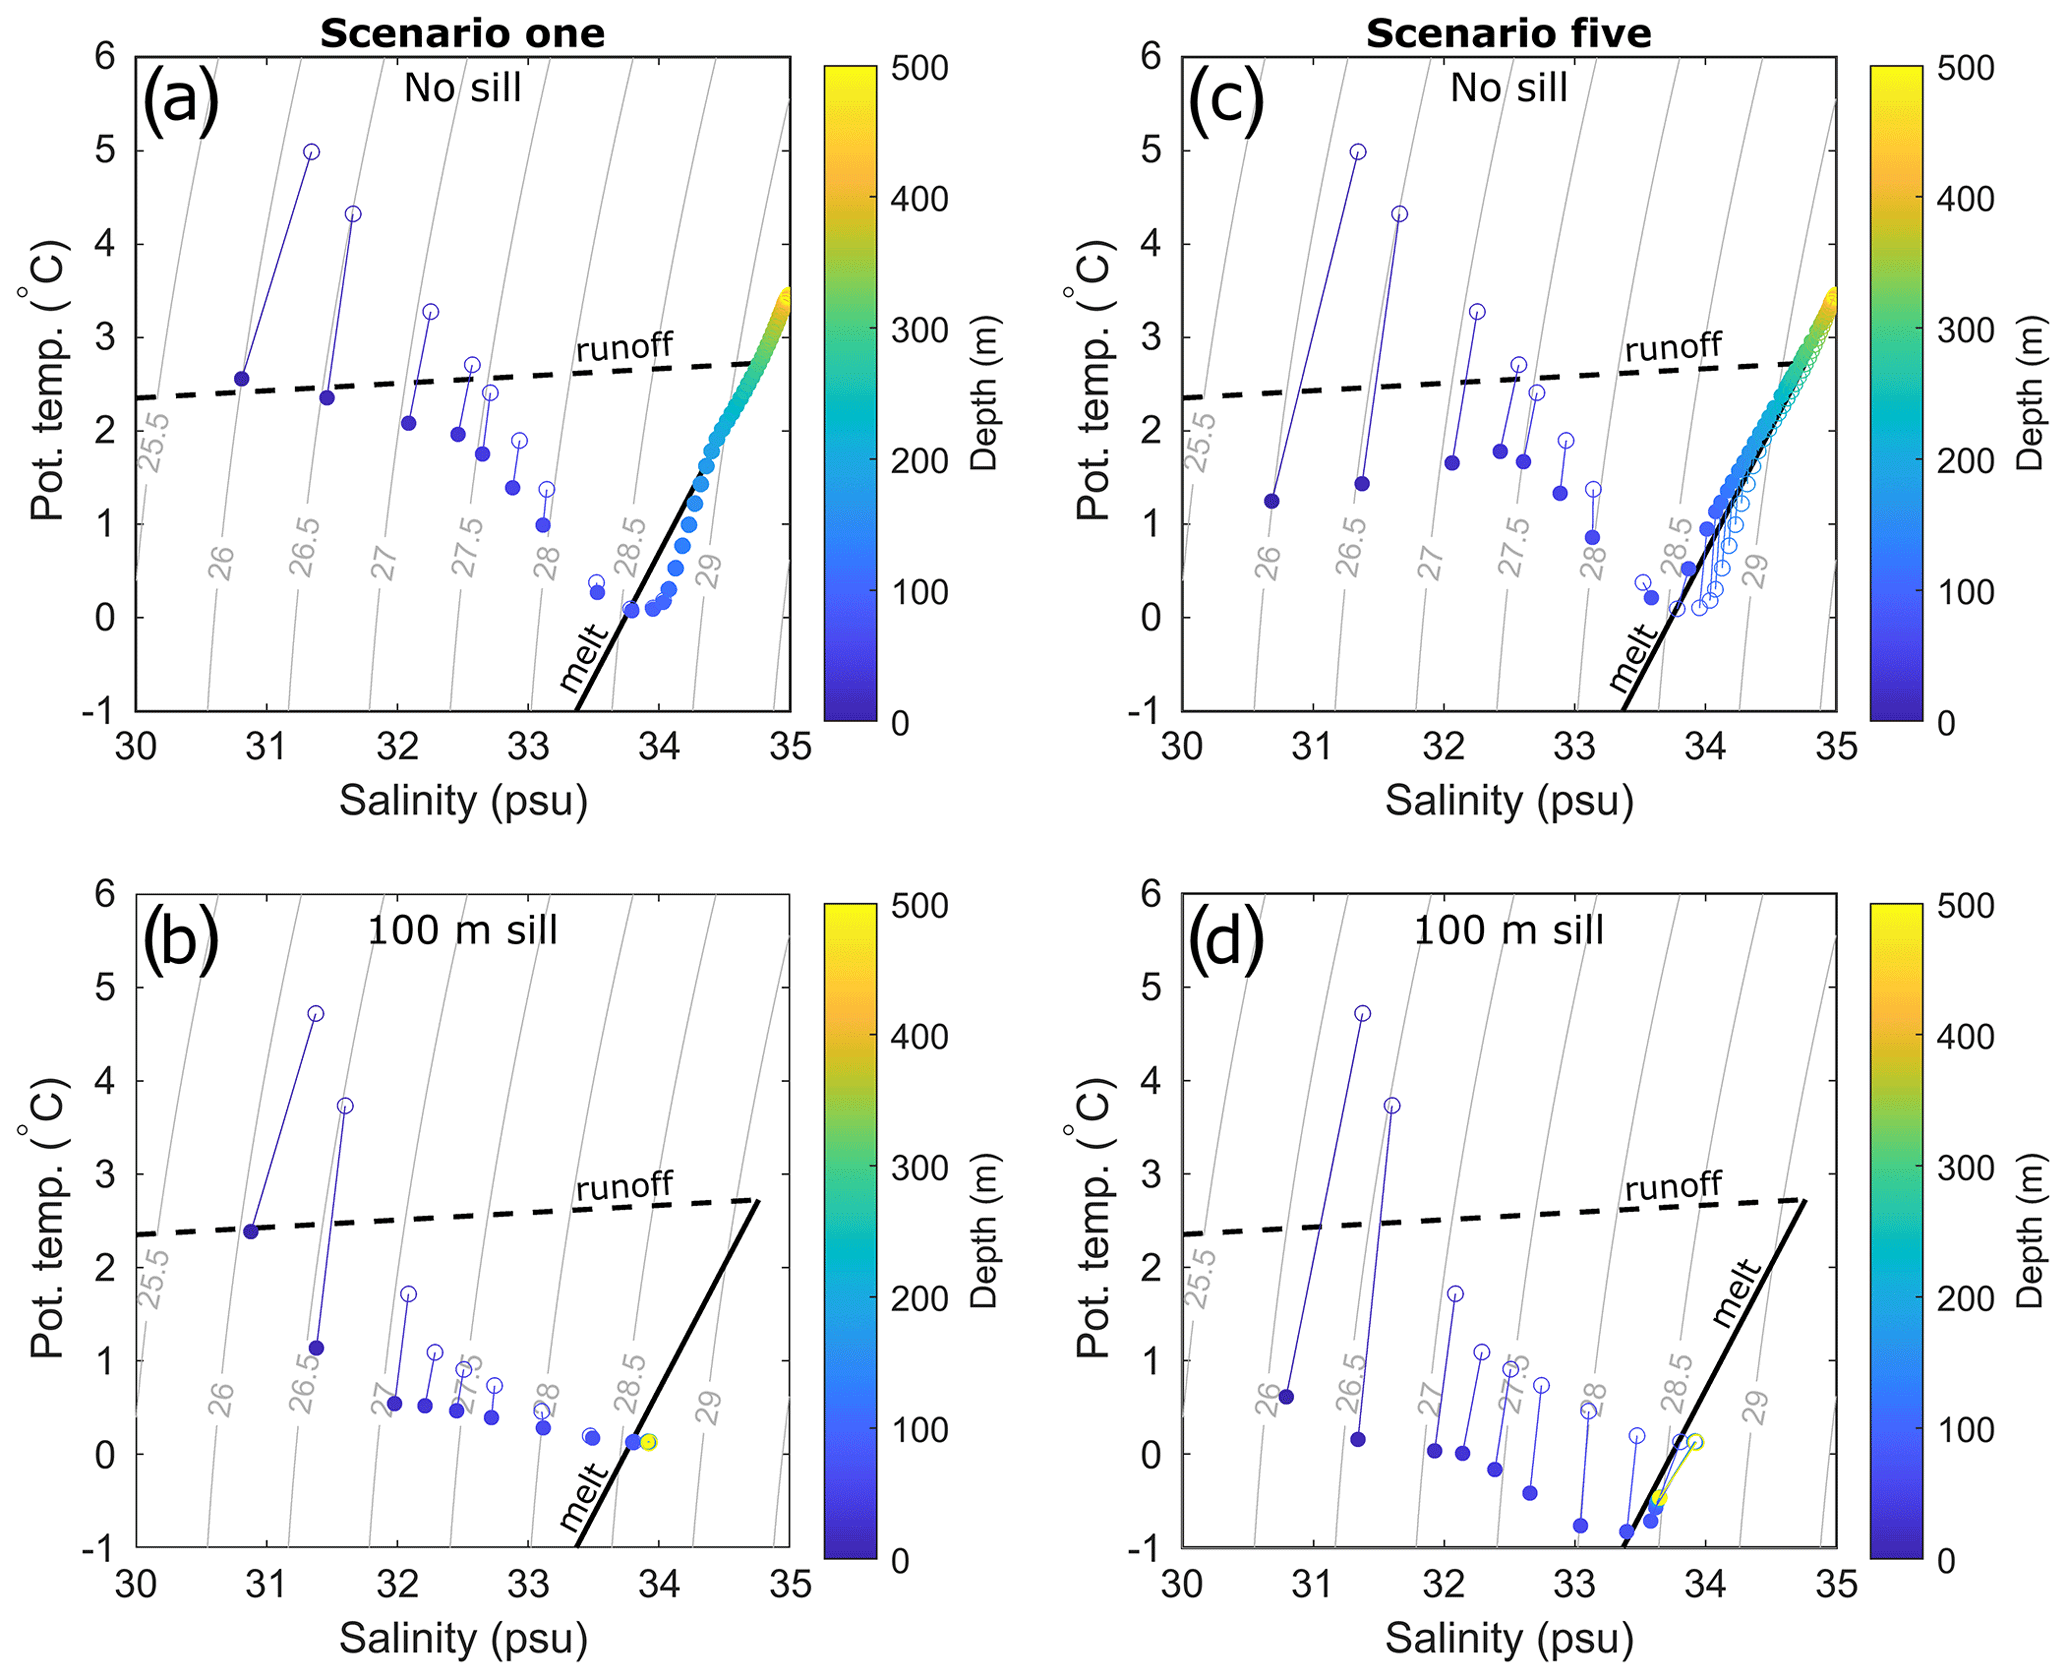
Figure 5Glacier-adjacent temperature and salinity with (solid circles) and without icebergs (open circles) for various iceberg and sill scenarios and with BCstandard boundary conditions. Panels (a) and (b) show iceberg scenario 1 without a 100 m sill (a) and with a sill (b). Panels (c) and (d) show iceberg scenario 5 without a sill (c) and with a 100 m sill (d). Solid lines joining open and closed circles indicate connected data points extracted from the same model depth.
The varied effects of icebergs on glacier-adjacent water properties are apparent in temperature-salinity space (Fig. 5). Initial glacier-adjacent water properties are inherited from those prescribed at the fjord mouth; however, icebergs modify fjord waters through ice melt and meltwater-driven vertical mixing. Comparing temperature-salinity profiles of simulations with and without icebergs illustrates these effects (Fig. 5). In the upper ∼60 m of all simulations with icebergs, iceberg melting causes substantial cooling and slight freshening (e.g. compare solid and open circles in Fig. 5 – solid circles are drawn down and slightly left in temperature-salinity space). Deeper in the water column (below 100 m), the influence of iceberg melting on water properties depends on the iceberg scenario and the presence or absence of a sill. In iceberg scenario 1 (Fig. 5a and b), iceberg melting causes very little modification of waters below 100 m, even in the presence of a sill (Fig. 5b). This is because the icebergs do not extend to the sill water depth and so there is some unmodified exchange between the fjord and the shelf. In iceberg scenario 5 icebergs cause on average 0.19 ∘C warming of waters below 100 m when there is no sill, and cooling of 0.61 ∘C below 100 m when there is a sill (Fig. 5b). This cooling below the maximum iceberg draught occurs in all iceberg scenarios in which icebergs extend to sill depth but is most apparent in the higher iceberg concentration scenarios (e.g. Fig. 5d). The simulated changes in water properties arise due the combined effects of local iceberg melting and fjord circulation. Submarine iceberg melting reduces the density of surrounding waters causing upwelling until those waters equilibrate at a new neutral buoyancy depth with respect to the fjord stratification. Within the temperature-salinity space of Greenland's fjords, density is predominantly controlled by salinity. Therefore, the salinity stratification is little changed by iceberg melting, whilst the temperature changes are much more pronounced. This means that the iceberg melt-induced migrations through temperature-salinity space that are often steeper than predicted by the submarine melt mixing line (Gade, 1979).
3.2.2 Changing Atlantic Water temperature
We also examine the interactions between iceberg scenarios and changes to AW temperature (Fig. 6). As in the PW scenarios, there is always marked cooling in the upper ∼60 m of the water column and water modification below this is minimal for iceberg scenarios 1 and 2. In iceberg scenarios 3–5, icebergs penetrate to a greater depth and thus into the AW layer, releasing freshwater which causes upwelling of AW. In these cases, the net effect of icebergs on water properties between ∼80 m and the maximum iceberg keel depth depends on the balance between cooling due to localised iceberg melting, and warming due to upwelling of AW. With AWwarm, there is a steep temperature gradient between the cold PW and warmer AW layers. Consequently, upwelling of AW causes notable warming in the PW layer that offsets localised iceberg-induced cooling. In the scenarios with greater iceberg concentration (e.g. iceberg scenario 5; Fig. 6e), the icebergs penetrate deeper into the AW layer and so can induce upwelling of the deeper, warmer water, resulting in more warming and over a greater depth range than in the lower iceberg concentration scenarios. However, with AWcool, the vertical temperature gradient is reduced, therefore cooling due to localised iceberg melting dominates the signal between the maximum iceberg draught and ∼80 m.
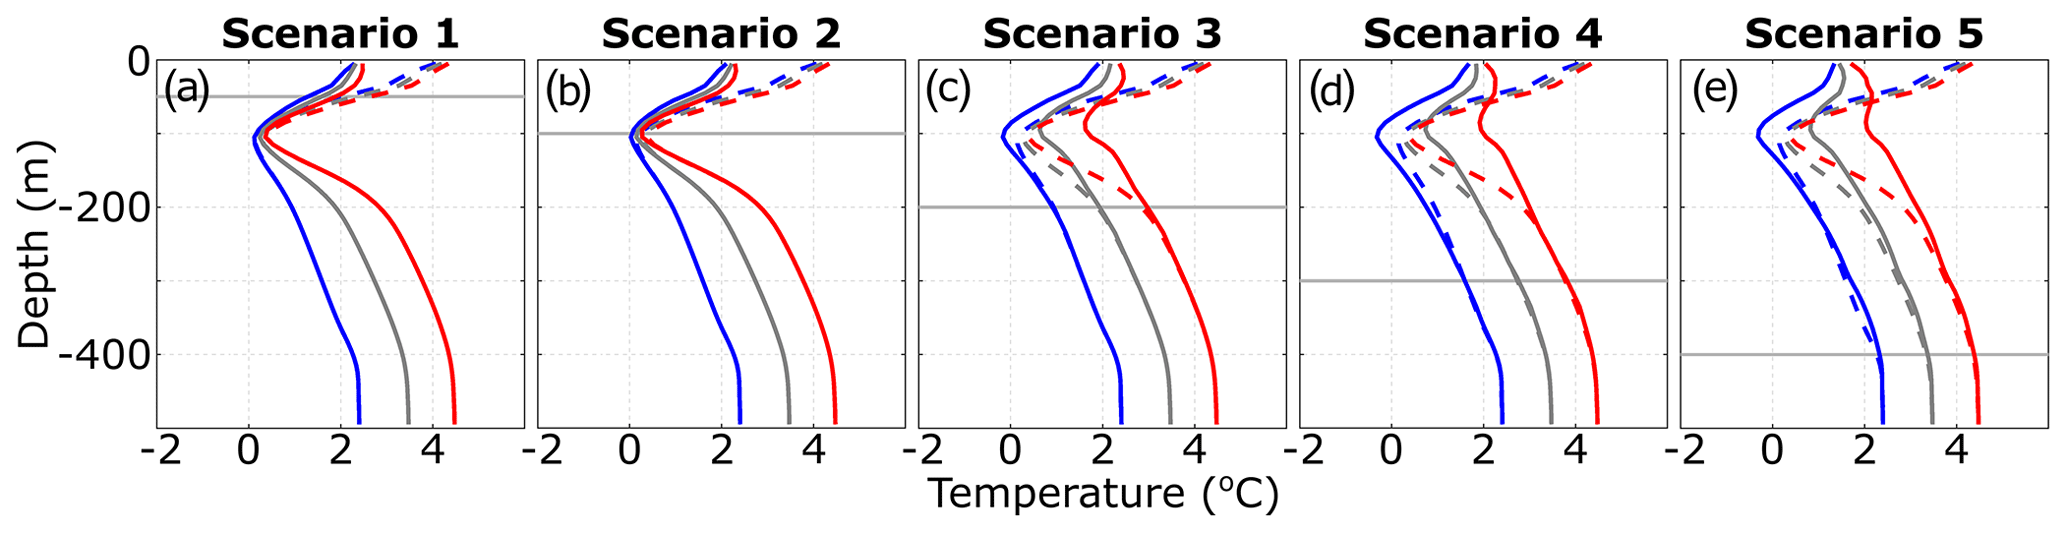
Figure 6Steady-state glacier-adjacent water temperature for a range of initial Atlantic Water conditions and with a flat-bottomed domain. In all plots, solid and dashed lines indicate simulations with and without icebergs, respectively. Grey, blue and red lines show scenarios using the BCstandard, AWcool and AWwarm boundary conditions, respectively (shown in Fig. 1f). The horizontal grey lines indicate the maximum iceberg keel depth in each scenario.
This dependence of iceberg modification of glacier-adjacent water properties on the temperature gradient through the AW layer is further illustrated by sensitivity tests in which the temperature of the AW layer was modified in two ways relative to BCstandard. First, to examine whether the absolute temperature of the water column affected the balance between upwelling and melting, the entire water column was uniformly warmed by 1 ∘C. With this uniform shift in temperature, the pattern of temperature with depth is similar to that of BCstandard (compare dashed grey and red lines in Fig. 7b), illustrating that the additional upwelling-driven warming with AWwarm is due to the steeper temperature gradient between the PW and AW layers, rather than the absolute temperature of the AW. Secondly, to illustrate the importance of the temperature gradient within the AW layer, we made the AW layer uniformly 3.5 ∘C. With this set of boundary conditions, upwelling-driven warming dominates in the PW layer, because of upwelling of warm AW, whilst melt-driven cooling dominates in the AW layer because upwelling-driven warming is muted (Fig. 7c). Thus, the average warming below ∼80 m that we simulate with AWwarm is strongly sensitive to the vertical temperature gradient and not only the average or maximum temperature of the AW.
With the addition of a 100 m sill, AW does not propagate into the fjord under the conditions simulated here. Thus in steady-state, glacier-adjacent water properties are unaffected by AW and adopt the properties of the PW layer (modified by iceberg melting and subglacial discharge). The resulting profiles therefore resemble the dashed pale blue lines in Fig. 4f–j and are not shown here.
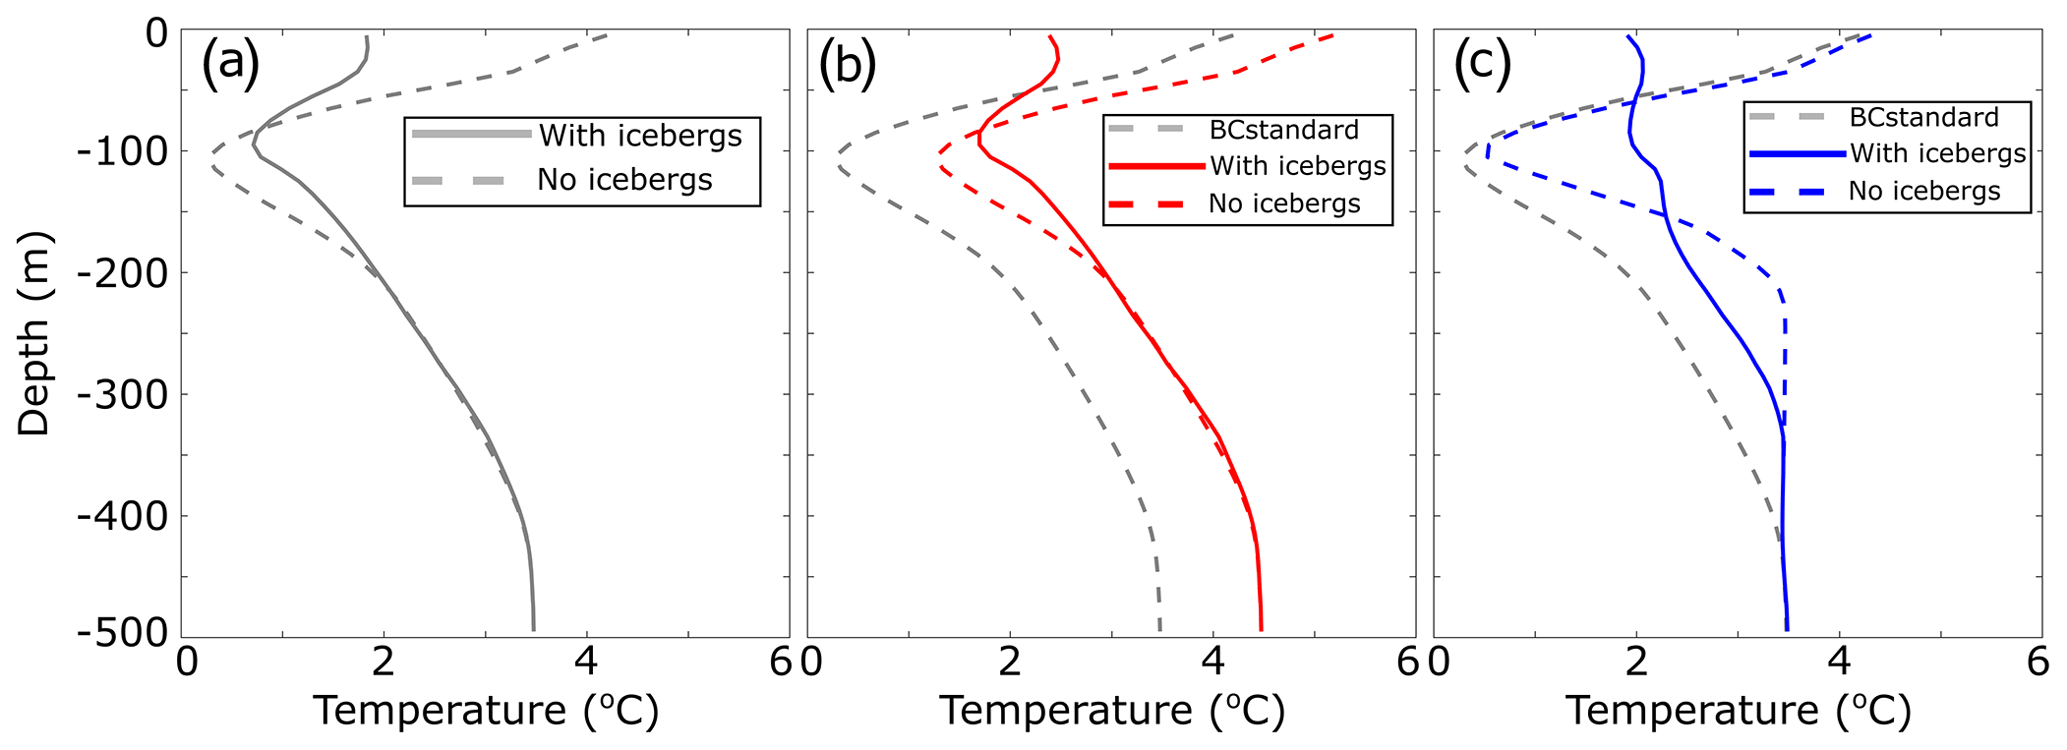
Figure 7AW temperature gradient sensitivity tests. Panels show simulations using (a) BCstandard, (b) temperature profile shifted by 1 ∘C throughout the water column, and (c) uniform initial AW temperature of 3.5 ∘C. Steady-state conditions without icebergs using BCstandard (grey line) are also shown in (b) and (c) for reference.
4.1 Comparison with observations and applicability to real fjords
Our simulations suggest that several changes to glacier-adjacent water properties can occur due to submarine iceberg melting. In almost all simulations, we simulate pronounced (>2 ∘C) cooling in the upper several tens of metres of the water column. Deeper in the water column (between ∼80 m and the maximum iceberg keel depth), both iceberg-induced cooling and warming can occur (e.g. Figs. 4 and 6), depending on the balance between cooling due local iceberg melting and warming due to melt-driven upwelling.
The balance between these processes depends on the iceberg contact area at depth available for local melting (and therefore cooling) and on the temperature of the upwelling water. When vertical temperature gradients are steep (e.g. with AWwarm; Fig. 6), icebergs can cause warming between their maximum keel depth and the surface layer. This is particularly apparent in the PW layer, where the temperature difference between an upwelled parcel of water and that at the parcel's new neutral buoyancy depth in the PW layer is greatest, and where iceberg melt rates (and therefore melt-driven cooling) are generally smaller because of the low water temperatures. In contrast, when vertical temperature gradients are shallower (e.g. with AWcool), cooling due to localised melting dominates (blue lines in Figs. 6d and e and 7c). These effects tend to reduce vertical temperature variations of glacier-adjacent waters compared both to simulations without icebergs and compared to conditions at the fjord mouth.
Detailed near-glacier hydrographic observations against which to make comparisons are sparse, but those that do exist provide some useful insight into the applicability of our model results to Greenland's fjords. The pronounced surface and near-surface cooling (relative to conditions at the mouth) that we simulate is a common feature in Greenland's fjords. For example, a transect of conductivity, temperature, depth (CTD) casts along Sermilik Fjord revealed cooling of approximately 4 ∘C in the upper ∼50 m (Straneo et al., 2011, 2012), which was also reproduced in a detailed modelling study of Sermilik Fjord that included icebergs (Davison et al., 2020). Similar along-fjord near-surface cooling has also been observed in other iceberg-congested fjords, such as Illulissat Isfjord (Beaird et al., 2017; Gladish et al., 2015) and Upernavik Isfjord (Fenty et al., 2016), both in West Greenland. In Illulissat Isfjord, the cold surface layer usually extends along-fjord to a shallow sill at the fjord mouth, where icebergs frequently become grounded (Gladish et al., 2015).
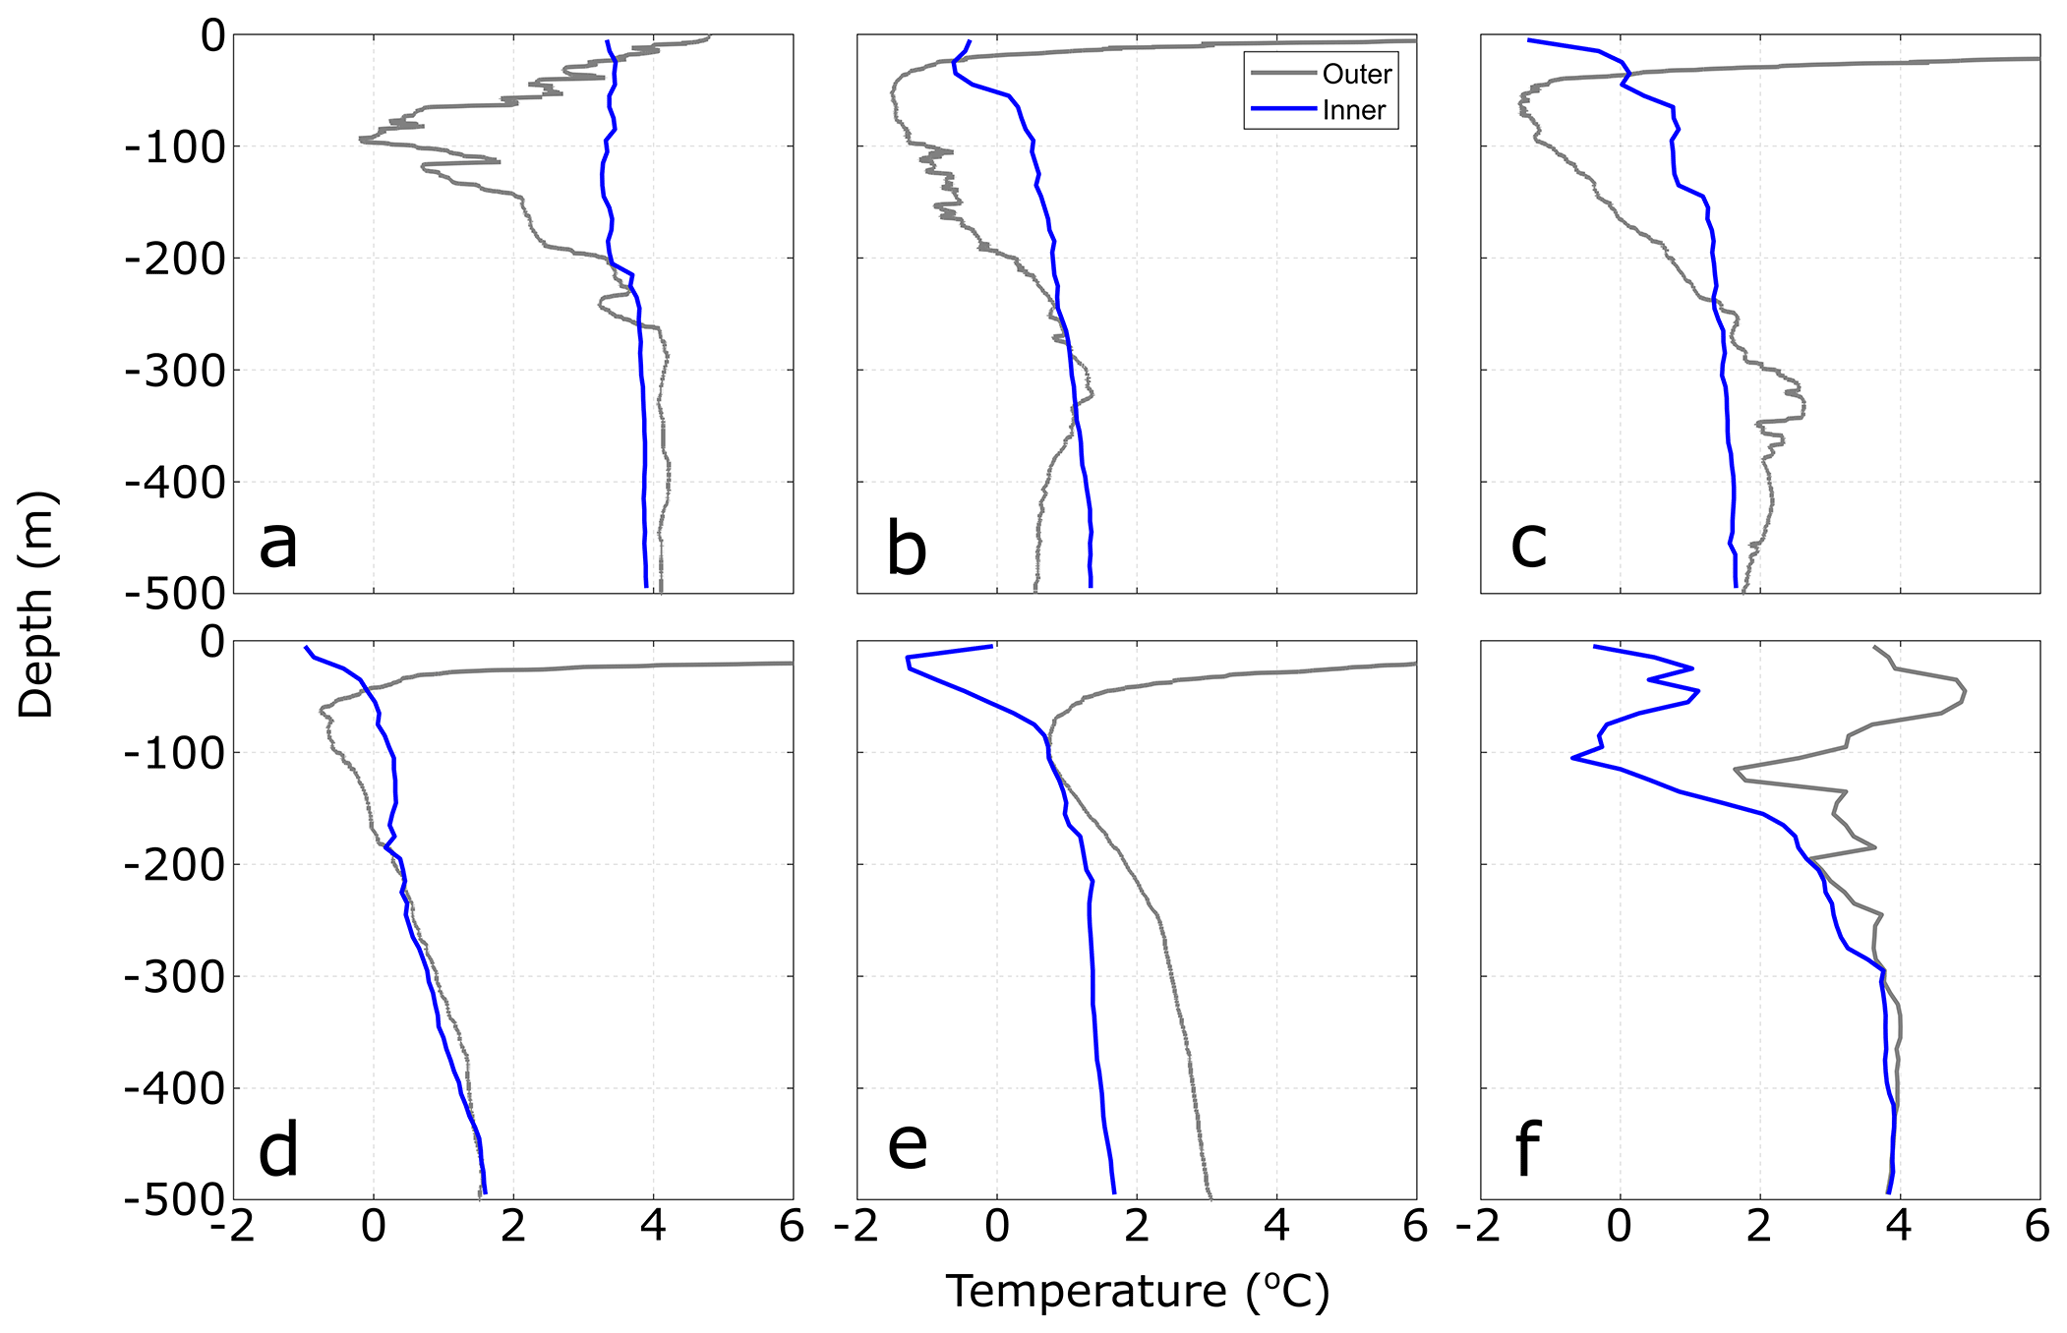
Figure 8Fjord temperature profiles from the Oceans Melting Greenland project (https://omg.jpl.nasa.gov/, last access: 14 April 2020). The blue lines are profiles acquired within the fjord, close to tidewater glacier termini, and the grey lines are acquired at or beyond the fjord mouth. Fjords (or nearest glacier) shown are (a) Sermilik Fjord, (b) Daugaard-Jensen, (c) Upernavik Isstrom, (d) Nunatakassaap Sermia Fjord, (e) Ilulissat Isfjord, and (f) Timmiarmiut Fjord. Data are available from: https://omg.jpl.nasa.gov/portal/data/OMGEV-AXCTD, last access: 14 April 2020).
Iceberg-induced changes to water properties below ∼ 80 m are harder to identify in hydrographic observations, most likely because they also contain the signature of glacial plumes resulting from subglacial discharge, or other external forcings. Our modelling suggests that if vertical temperature gradients are shallow, then icebergs can cause cooling over large depth ranges (e.g. Fig. 7c). As one example, hydrographic observations in Kangerdlugssuaq Fjord showed relatively uniform near-glacier temperatures with substantial cooling in both the upper 100 m and between depths of 300 and 400 m, relative to a transect acquired at the fjord mouth (Straneo et al., 2012), consistent with the modelling results presented here. Iceberg melt-induced warming of parts of the water column is even harder to identify in published hydrographic observations because of the difficulty in distinguishing it from relatively warm subglacial discharge-driven plume outflow.
To further compare our modelling results to observations, we examined CTD casts acquired as part of the Oceans Melting Greenland (OMG) project (https://omg.jpl.nasa.gov/, last access: 14 April 2020; data available at: https://omg.jpl.nasa.gov/portal/data/OMGEV-AXCTD, last access: 14 April 2020). In keeping with our simulation design, we selected pairs of CTD casts acquired less than a week apart, one near or outside the fjord mouth and the other as close as possible to the tidewater glacier at the head of the fjord. These profiles (Fig. 8) show many of the characteristics that we have simulated here. Specifically, the profiles show that near-surface water temperatures are substantially colder adjacent to tidewater glaciers compared to those observed outside each fjord, and the observed temperature differences between the mouth and near-glacier region are comparable to those simulated here. In all but two of the surveyed fjords (Illulissat Isfjord and Timmiarmiut Fjord, shown in Fig. 8e and f), the profiles also show warming at intermediate depths (∼50–200 m) relative to the waters outside the fjord, consistent with our simulations using icebergs scenarios 3–5, particularly using our AWwarm boundary conditions (Fig. 6c–e). These observations do not allow us to quantify the relative contributions to intermediate depth warming between plume outflow and iceberg melt-induced upwelling. However, we note that the vertical pattern and magnitudes of intermediate depth warming are similar to those simulated here. In addition, the intermediate depth warming occurs over a large depth range, which is not easily explained by plume outflow and is consistent with our simulations. Some of the profiles also show notable cooling at depth (e.g. Illulissat Isfjord, Fig. 8e), which we are only able to reproduce in simulations including a shallow sill (e.g. the red line in Fig. 4j). Our simulations may underestimate cooling at depth because power law size-frequency distributions underestimate the number of very large icebergs (Sulak et al., 2017) and because the parameter values used in our melt calculation may underestimate submarine melt rates (Jackson et al., 2020).
In our simulations, we have generally considered a glacier-fjord system in which the glacier face and subglacial discharge interact with the entire water column, and with icebergs affecting a range of depths between the surface and their keels, which is a coarse representation of many fjords in Greenland. In many other fjords in Greenland, glacier grounding lines are shallower, such that the calving front and subglacial discharge interact predominately with the surface and PW layers. Although our simulations do not encompass this geometry, they still provide some insights into the potential effect of icebergs on near-glacier conditions in these fjords. With this geometry, subglacial discharge is injected directly into the PW layer. Therefore, plume outflow is relatively cool and we would expect, based the simulations presented here, that iceberg-driven cooling of the surface layer to be significant (resembling Fig. 3a–c). In addition, icebergs calved from such shallow glaciers would not be able to cause upwelling of warm AW (as in our scenarios 1 and 2), and so we would not expect any iceberg melt-driven warming of the PW layer. Overall, based on the insights gained from our simulations we expect that the effect of iceberg melt on near-glacier water properties in shallow fjords therefore largely manifests as a cooling in the upper several tens of metres of the water column, thereby reducing vertical variations in water column temperature. Such patterns have been observed in fjords hosting glaciers with relatively shallow (∼250 m) grounding lines resting in the PW layer (e.g. Mortensen et al., 2020).
4.2 Implications for glacier-ocean interaction
If iceberg-induced changes to glacier-adjacent water properties significantly affect the magnitude and/or the vertical pattern of glacier submarine melting, then icebergs may play an important role in modifying glacier response to ocean forcing. To assess the effect of icebergs on glacier submarine melting, we first consider how iceberg melt impacts subglacial discharge-driven plume dynamics and then assess how the simulated temperature changes could affect melt rates across the parts of glacier fronts that are not directly affected by subglacial discharge-driven plumes.
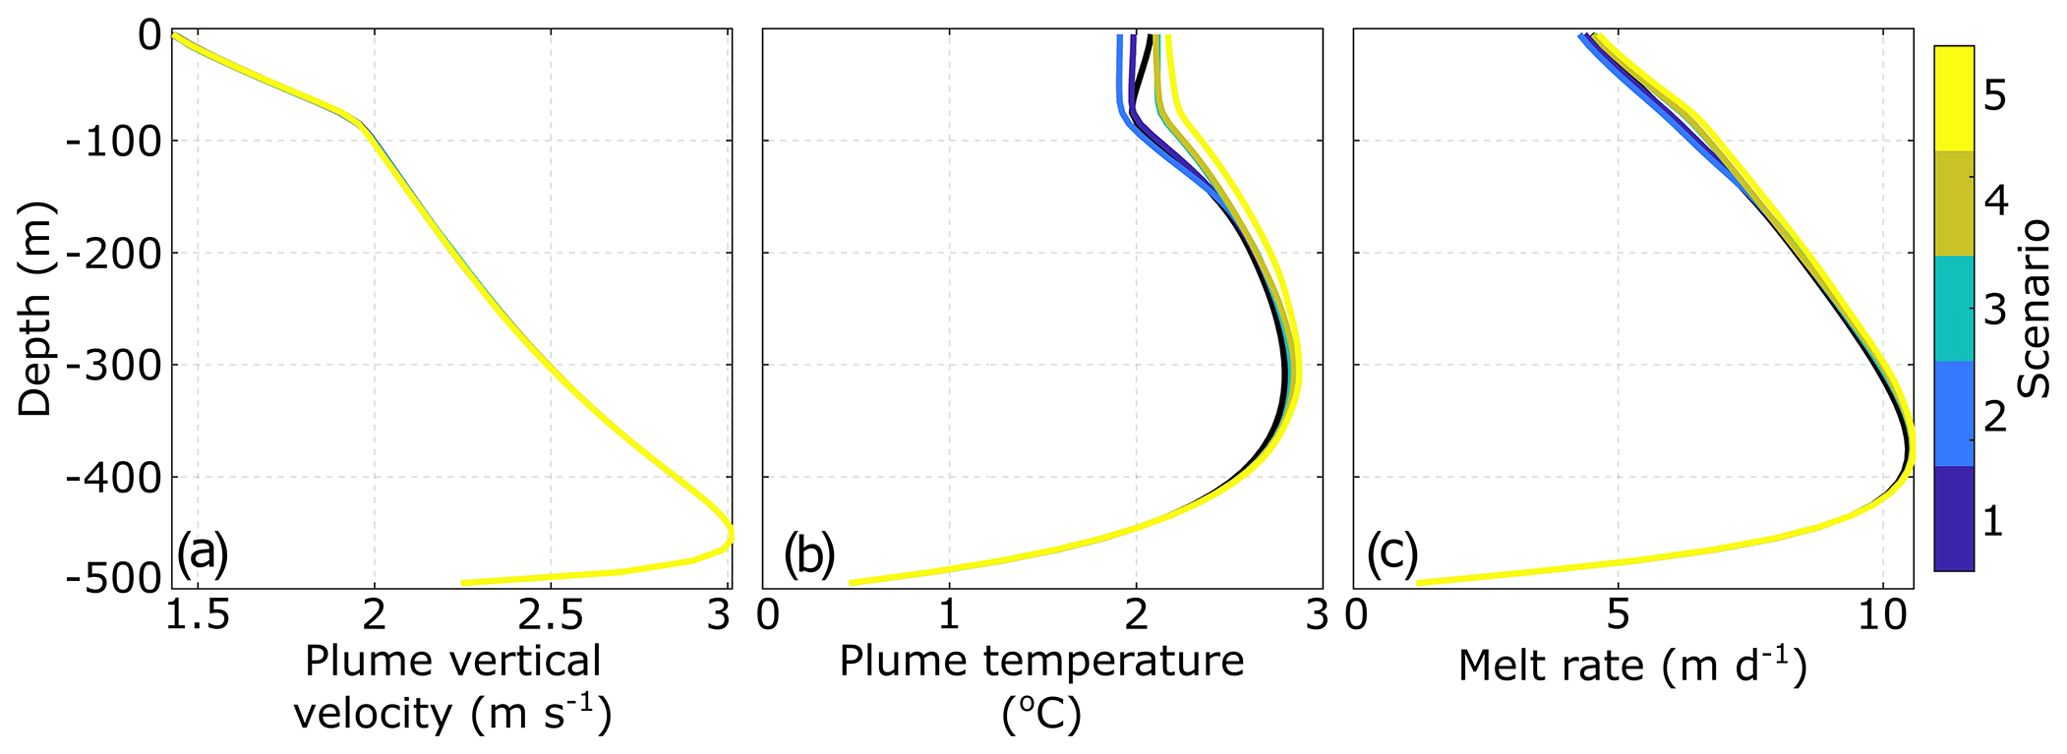
Figure 9Plume dynamics for iceberg scenarios 1–5. (a) Plume vertical velocity. (b) Plume temperature. (c) Glacier submarine melt rate in the plume. All simulations are based on BCstandard boundary conditions and 500 m s−1 subglacial discharge.
To examine the effect of icebergs on subglacial discharge plume-driven glacier submarine melting, we evaluated plume properties for a single set of ocean boundary conditions (BCstandard; Fig. 1b–d) using each of the five iceberg scenarios. We find that submarine iceberg melting has negligible influence on plume vertical velocity and only a modest influence on plume temperature, meaning that plume-induced glacier submarine melt rates appear relatively insensitive to the changes in temperature and salinity induced by changes in iceberg geometry, concentration and size-frequency distribution (Fig. 9).
Although subglacial discharge-driven plume dynamics appear to be relatively insensitive to iceberg-induced modification of glacier-adjacent water properties, submarine melting distal to glacial plumes (“background melting” (e.g. Slater et al., 2018)) may be more directly affected. Qualitatively, the iceberg melt-induced changes to glacier-adjacent water properties presented above suggest that iceberg melt will affect background glacier melt rates in three key ways: (1) at and near the fjord surface cooling will reduce background melt rates, (2) in the PW layer background melting will usually increase due to upwelling of warmer AW, and (3) in the AW layer iceberg melt-induced changes in background melt rates are expected to be modest with slight increases in fjords with steep vertical temperature gradients and slight decreases in other fjords (assuming icebergs penetrate into the AW layer). These effects will be more pronounced in fjords with higher concentrations of larger (and thus deeper keeled) icebergs. In fjords where icebergs cause cooling near the surface and warming at depth, we expect icebergs will increase glacier undercutting through impacting submarine melt rates, which may in turn influence the rate and mechanism of calving (Benn et al., 2017; James et al., 2014; O'Leary and Christoffersen, 2013).
To explore these effects quantitatively, we calculate the percentage change in background melt rate of the glacier terminus due to iceberg-induced modification of glacier-adjacent water temperature (relative to simulations without icebergs). Modelling studies indicate that background melt rates scale linearly with ocean temperature (Sciascia et al., 2013; Slater et al., 2016; Xu et al., 2013); thus, changes in temperature, T, should cause proportional changes in background melting (Jackson et al., 2014). We choose to focus on relative changes in melt rate rather than absolute changes, because of poor constraints on important melt rate parameter values (Jackson et al., 2020). We calculate the relative change in submarine melt rate, SMR, following Jackson et al. (2014), as
where the subscripts “ib” and “nib” indicate simulations with “icebergs” and “no icebergs”, respectively, and Tf is the in-situ freezing point, given by
where λ1−3 are constants representing the freezing point slope (−0.0573 ∘C psu−1), offset (0.0832 ∘C) and depth (0.000761 ∘C m−1), respectively (Cowton et al., 2015). S is the local salinity (horizontally averaged within 2 km of the terminus) and z is depth in the water column. It is worth noting that changes in melt rate calculated using this method assume that all changes in heat supply are accommodated by changes in submarine melt rates, and so this method provides an indication of the maximum relative changes in submarine melt rates expected due to changes in ambient ocean temperature.
Using this approach, we find that the impact on water properties resulting from iceberg melt substantially modifies background glacier submarine melt rates. Firstly, in the upper 50 m and using BCstandard, iceberg melt causes a 34.9 % reduction in melt rate on average. Even in iceberg scenario 1, iceberg melt causes a 29.5 % reduction in melt rate over this depth range. Secondly, between 100 and 200 m depth, iceberg melt causes a 13.5 % increase in melt rate on average when using BCstandard, but this increases to 59.2 % when using PWcool (for which warming of the PW layer due to upwelling is most pronounced). Changes in iceberg melt rates in the AW layer are minimal, with the most pronounced effect being a 5.4 % increase in the 200–400 m depth range using iceberg scenario 5 and PWwarm. When averaged through the entire water column, these effects largely compensate for each other, resulting in a net 3.1 % decrease in melt rates with BCstandard. Overall therefore, this analysis suggests that iceberg melt can influence the vertical pattern of glacier terminus background melting by decreasing melt rates at the surface and increasing them in the PW layer, with minimal changes in the AW layer.
As well as affecting glacier-adjacent water temperatures, iceberg melt likely affects submarine melt rates in other ways not examined here. For example, the cooling and freshening of the surface and near-surface layers induced by iceberg melting may prevent or hinder plume surfacing (De Andrés et al., 2020), and may expedite sea ice formation after the melt season, promoting the development of an ice mélange. In addition, mechanical iceberg break-up, iceberg calving and iceberg rotation can cause vigorous mixing of fjord waters, which can temporarily increase glacier and iceberg submarine melt rates (Enderlin et al., 2018), and increase the iceberg-ocean contact area available for melting. Iceberg melt-induced invigoration of fjord circulation can increase oceanic heat flux towards tidewater glaciers (Davison et al., 2020), likely resulting in faster terminus submarine melting. Icebergs likely also exert a mechanical influence on the circulation and plume dynamics at the ice-ocean interface (Amundson et al., 2020) and may prevent plume surfacing (Xie et al., 2019).
4.3 Implications for oceanic forcing of ice sheet scale models
Current state of the art projections of dynamic mass loss from the Greenland Ice Sheet (Goelzer et al., 2020) are forced by far-field ocean temperature profiles, provided by ocean modelling output that does not include fjord-scale processes (except for the obstruction of shelf-water intrusion by shallow sills) (Slater et al., 2019, 2020). The results presented here suggest that such an approach is broadly appropriate for fjords with maximum iceberg keel depths of less than 200 m and iceberg concentrations less than ∼20 % on average, where iceberg modification of glacier-adjacent water properties appears to be limited other than in the upper several tens of metres (Figs. 4 and 6). The majority of Greenland's fjords likely fall into this category (Mankoff et al., 2020b; Sulak et al., 2017). Even in such fjords, however, this approach would not capture the surface and near-surface cooling caused by iceberg melting. In order to capture this near surface cooling, one relatively simple modification to such an approach could be to reduce surface water temperature to close to the in-situ melting point during winter periods, and proportionally to the iceberg surface area at the fjord surface during summer periods.
In fjords hosting icebergs with keel depth greater than or equal to 200 m and with average concentrations of more than ∼20 % (i.e. our iceberg scenario 3 or higher), iceberg modification of glacier-adjacent water properties becomes increasingly more important. In such fjords that also exhibit relatively shallow sills, icebergs act to cool glacier-adjacent water throughout the water column, with the amount of cooling proportional to the draught and concentration of the icebergs, as well as to the temperature of the ambient water at the fjord mouth (Fig. 4). In such fjords that do not have shallow sills, the effect is more complicated with both iceberg melt-induced warming and cooling, depending on the vertical temperature gradient of the water column and iceberg concentration at depth. Overall, these changes to the water column temperature can cause non-negligible (up to several tens of percent) changes in terminus submarine melt rates across the large areas of the calving front that are not directly affected by plume-inducing subglacial discharge. The vertical pattern of changes to terminus submarine melt rates (reduced near the surface and increased at intermediate depths) induced by iceberg melting is expected to exacerbate undercutting of glacier termini, with potentially important impacts on calving rates (Benn et al., 2017; Ma and Bassis, 2019; O'Leary and Christoffersen, 2013; Todd and Christoffersen, 2014). Although fjords hosting icebergs this large and numerous are relatively few in number, it is these fjords (and the glaciers hosted by them) that contribute the most to dynamic mass loss from the Greenland Ice Sheet (Enderlin et al., 2014; Khan et al., 2020).
4.4 Transience vs. steady state
All of the results presented here were extracted from the final 10 d of simulations that were run to a quasi-steady state (i.e. the variable of interest had stabilised). In our domains without sills, steady state of temperature and salinity was generally reached after just 10–30 d. However, our simulations with sills could take as many as 1000 d to reach such a steady state because fjord-shelf exchange is reduced. For an equivalent steady state to be reached in reality, open ocean conditions, subglacial discharge and iceberg size and distribution would also have to remain quasi-stable for an equivalent time period. In reality, this is unlikely to occur (particularly in fjords with shallow sills) because subglacial discharge and coastal and open ocean conditions change on subseasonal to seasonal time scales (Moon et al., 2017; Mortensen et al., 2014; Noël et al., 2016; Sutherland et al., 2014; Sutherland and Pickart, 2008). In reality therefore, glacier-adjacent water properties in fjords with shallow sills are likely a complex amalgamation of temporally evolving source waters, modified by processes operating within the fjord. In addition, some variations in coastal conditions can be transmitted towards glaciers very rapidly. During winter, strong wind events on the east coast of Greenland drive fast shelf-forced flows (or intermediary currents) in glacial fjords, delivering coastal waters to tidewater glaciers over just a period of a few days, and potentially reducing the magnitude of iceberg-driven modification (Jackson et al., 2014, 2018). Such currents are strongest in winter, when hydrographic observations are sparse, so this remains speculative.
We have used a general circulation model (MITgcm) to quantify the effect of submarine iceberg melting on glacier-adjacent water properties in an idealised fjord domain. A large range of iceberg concentrations, keel depths and size-frequency distributions were examined to represent the range of iceberg conditions found in Greenland's marine terminating glacier fjords. We focused primarily on iceberg melt-induced changes to glacier-adjacent water temperatures throughout the water column, because of their principal importance to glacier submarine melting.
Our results suggest that icebergs can substantially modify glacier-adjacent water properties and that the precise impact depends on iceberg size and on the temperature profile and stratification of water within and beyond the fjord. In particular, we find that (1) temperature in the upper ∼60 m of the water column is reduced by several degrees Celsius over a wide range of iceberg scenarios, (2) fjords with more and deeper icebergs are subject to greater iceberg melt-induced modification, which can result in either cooling or warming at different depths depending on the balance between melt-driven cooling and upwelling-driven warming, which in turn depends on fjord temperature stratification and (3) when icebergs extend to or below the fjord mouth sill depth, they can cause significant cooling throughout the water column. Particularly with respect to point (2), our results highlight that oceanic forcing of large fast-flowing glaciers, which contribute the most to ice sheet dynamic mass loss, in existing projections of tidewater glacier dynamics is strongly affected by ignoring the impact of icebergs on fjord water properties. The iceberg-induced changes to the vertical temperature profile of glacier-adjacent waters identified here are likely to reduce submarine melt rates at and near the fjord surface while increasing them in the PW layer, which may influence the rate and mechanism of calving by exacerbating glacier terminus undercutting. Our results therefore identify a critical need to develop simple parameterisations of iceberg-induced modification of fjord waters, and other fjord-scale processes, to better constrain oceanic forcing of tidewater glaciers.
MITgcm is freely available at https://github.com/MITgcm/MITgcm/archive/master.zip and https://doi.org/10.5281/zenodo.4968496 (Campin et al., 2021; Marshall et al., 1997a). The IcePlume module is available from Tom Cowton on request. The IceBerg module is available at https://doi.org/10.5281/zenodo.3979647 (Davison, 2020) or from Benjamin Davison on request.
The model domains, boundary conditions and output are available from the corresponding author on request.
BJD and TC conceived the study. BJD developed the model code with support from TC and AS. BJD designed and conducted the simulations and analysis, and led the manuscript write up. TC, FC, AS and PN supported the interpretation of the model results and contributed to the preparation of the manuscript.
The contact author has declared that neither they nor their co-authors have any competing interests.
Publisher's note: Copernicus Publications remains neutral with regard to jurisdictional claims in published maps and institutional affiliations.
The simulations were conducted on the Sheffield Advanced Research Computer (ShARC). The authors thank the editor, Nicolas Jourdain, for considering our paper for publication, and Thomas Rackow and one anonymous reviewer for providing thorough reviews of the paper.
This research has been supported by the Scottish Alliance for Geoscience, Environment and Society and the University of St Andrews (PhD studentship).
This paper was edited by Nicolas Jourdain and reviewed by Thomas Rackow and one anonymous referee.
Amundson, J. M., Kienholz, C., Hager, A. O., Jackson, R. H., Motyka, R. J., Nash, J. D., and Sutherland, D. A.: Formation, flow and break-up of ephemeral ice mélange at LeConte Glacier and Bay, Alaska, J. Glaciol., 66, 577–590, https://doi.org/10.1017/jog.2020.29, 2020.
Barker, A., Sayed, M., and Carrieres, T.: Determination of Iceberg Draft, Mass And Cross-Sectional Areas, paper presented at the The Fourteenth International Offshore and Polar Engineering Conference, Toulon, France, May 2004.
Beaird, N., Straneo, F., and Jenkins, W.: Characteristics of meltwater export from Jakobshavn Isbræ and Ilulissat Icefjord, Ann. Glaciol., 58, 107–117, https://doi.org/10.1017/aog.2017.19, 2017.
Beaird, N. L., Straneo, F., and Jenkins, W.: Export of Strongly Diluted Greenland Meltwater From a Major Glacial Fjord, Geophys. Res. Lett., 45, 4163–4170, https://doi.org/10.1029/2018GL077000, 2018.
Benn, D. I., Aström, J., Zwinger, T., Todd, J., Nick, F. M., Cook, S., Hulton, N. R. J., and Luckman, A.: Melt-under-cutting and buoyancy-driven calving from tidewater glaciers: New insights from discrete element and continuum model simulations, J. Glaciol., 63, 691–702, https://doi.org/10.1017/jog.2017.41, 2017.
Bigg, G. R., Wadley, M. R., Stevens, D. P., and Johnson, J. A.: Modelling the dynamics and thermodynamics of icebergs, Cold Reg. Sci. Technol., 26, 113–135, https://doi.org/10.1016/S0165-232X(97)00012-8, 1997.
Campin, J.-M., Heimbach, P., Losch, M., Forget, G., edhill3, Adcroft, A., amolod, Menemenlis, D., dfer22, Hill, C., Jahn, O., Scott, J., stephdut, Mazloff, M., Fox-Kemper, B., antnguyen13, Doddridge, E., Fenty, I., Bates, M., Eichmann, A., Smith, T., Martin, T., Lauderdale, J., Abernathey, R., samarkhatiwala, hongandyan, Deremble, B., dngoldberg, Bourgault, P.,Dussin, R.: MITgcm/MITgcm: checkpoint67z (Version checkpoint67z), Zenodo, https://doi.org/10.5281/zenodo.4968496, 2021.
Carroll, D., Sutherland, D. A., Hudson, B., Moon, T., Catania, G. A., Shroyer, E. L., Nash, J. D., Bartholomaus, T. C., Felikson, D., Stearns, L. A., Noël, Y., and Van Den Broeke, M. R.: The impact of glacier geometry on meltwater plume structure and submarine melt in Greenland fjords, Geophys. Res. Lett., 43, 9739–9748, https://doi.org/10.1002/2016GL070170, 2016.
Cowton, T., Slater, D., Sole, A., Goldberg, D., and Niewnow, P.: Modeling the impact of glacial runoff on fjord circulation and submarine melt rate using a new subgrid-scale parameterisization for glacial plumes, J. Geophys. Res.-Ocean., 120, 1–17, https://doi.org/10.1002/2014JC010324, 2015.
Cowton, T., Sole, A., Nienow, P., Slater, D., Wilton, D., and Hanna, E.: Controls on the transport of oceanic heat to Kangerdlugssuaq Glacier, East Greenland, J. Glaciol., 62, 1–14, https://doi.org/10.1017/jog.2016.117, 2016.
Davison, B.: Iceberg melting substantially modifies oceanic heat flux towards a major Greenlandic tidewater glacier – data and code, Zenodo [data set], https://doi.org/10.5281/zenodo.3979647, 2020.
Davison, B. J., Cowton, T. R., Cottier, F. R., and Sole, A. J.: Iceberg melting substantially modifies oceanic heat flux towards a major Greenlandic tidewater glacier, Nat. Commun., 11, 1–13, https://doi.org/10.1038/s41467-020-19805-7, 2020.
De Andrés, E., Slater, D. A., Straneo, F., Otero, J., Das, S., and Navarro, F.: Surface emergence of glacial plumes determined by fjord stratification, The Cryosphere, 14, 1951–1969, https://doi.org/10.5194/tc-14-1951-2020, 2020.
Dowdeswell, J. A., Whittington, R. J., and Hodgkins, R.: The sizes, frequencies, and freeboards of East Greenland icebergs observed using ship radar and sextant, J. Geophys. Res., 97, 3515, https://doi.org/10.1029/91JC02821, 1992.
Edwards, T. L., Nowicki, S., Marzeion, B., Hock, R., Goelzer, H., Seroussi, H., Jourdain, N. C., Slater, D. A., Turner, F. E., Smith, C. J., McKenna, C. M., Simon, E., Abe-Ouchi, A., Gregory, J. M., Larour, E., Lipscomb, W. H., Payne, A. J., Shepherd, A., Agosta, C., Alexander, P., Albrecht, T., Anderson, B., Asay-Davis, X., Aschwanden, A., Barthel, A., Bliss, A., Calov, R., Chambers, C., Champollion, N., Choi, Y., Cullather, R., Cuzzone, J., Dumas, C., Felikson, D., Fettweis, X., Fujita, K., Galton-Fenzi, B. K., Gladstone, R., Golledge, N. R., Greve, R., Hattermann, T., Hoffman, M. J., Humbert, A., Huss, M., Huybrechts, P., Immerzeel, W., Kleiner, T., Kraaijenbrink, P., Le clec'h, S., Lee, V., Leguy, G. R., Little, C. M., Lowry, D. P., Malles, J. H., Martin, D. F., Maussion, F., Morlighem, M., O'Neill, J. F., Nias, I., Pattyn, F., Pelle, T., Price, S. F., Quiquet, A., Radić, V., Reese, R., Rounce, D. R., Rückamp, M., Sakai, A., Shafer, C., Schlegel, N. J., Shannon, S., Smith, R. S., Straneo, F., Sun, S., Tarasov, L., Trusel, L. D., Van Breedam, J., van de Wal, R., van den Broeke, M., Winkelmann, R., Zekollari, H., Zhao, C., Zhang, T. and Zwinger, T.: Projected land ice contributions to twenty-first-century sea level rise, Nature, 593, 74–82, https://doi.org/10.1038/s41586-021-03302-y, 2021.
Enderlin, E. M., Howat, I. M., Jeong, S., Noh, M. J., van Angelen, J. H., and Van den Broeke, M. R.: An improved mass budget for the Greenland ice sheet, Geophys. Res. Lett., 41, 866–872, https://doi.org/10.1002/2013GL059010, 2014.
Enderlin, E. M., Hamilton, G. S., Straneo, F., and Sutherland, D. A.: Iceberg meltwater fluxes dominate the freshwater budget in Greenland's iceberg-congested glacial fjords, Geophys. Res. Lett., 43, 11287–11294, https://doi.org/10.1002/2016GL070718, 2016.
Enderlin, E. M., Carrigan, C. J., Kochtitzky, W. H., Cuadros, A., Moon, T., and Hamilton, G. S.: Greenland iceberg melt variability from high-resolution satellite observations, The Cryosphere, 12, 565–575, https://doi.org/10.5194/tc-12-565-2018, 2018.
Fenty, I., Willis, J., Khazendar, A., Dinardo, S., Forsberg, R., Fukumori, I., Holland, D., Jakobsson, M., Moller, D., Morison, J., Münchow, A., Rignot, E., Schodlok, M., Thompson, A., Tinto, K., Rutherford, M., and Trenholm, N.: Oceans Melting Greenland: Early Results from NASA's Ocean-Ice Mission in Greenland, Oceanography, 29, 72–83, https://doi.org/10.5670/oceanog.2016.100, 2016.
Fraser, N. J. and Inall, M. E.: Influence of Barrier Wind Forcing on Heat Delivery Toward the Greenland Ice Sheet, J. Geophys. Res.-Ocean., 123, 2513–2538, https://doi.org/10.1002/2017JC013464, 2018.
Gade, H. G.: Melting of ice in sea water: A primitive model with application to the Antarctic ice shelf and icebergs, J. Phys. Oceanogr., 9, 189–198, https://doi.org/10.1175/1520-0485(1979)009<0189:MOIISW>2.0.CO;2, 1979.
Gladish, C. V., Holland, D. M., Rosing-Asvid, A., Behrens, J. W., and Boje, J.: Oceanic Boundary Conditions for Jakobshavn Glacier: Part I. Variability and Renewal of Ilulissat Icefjord Waters, 2001–2014, J. Phys. Oceanogr., 45, 3–32, https://doi.org/10.1175/JPO-D-14-0044.1, 2015.
Goelzer, H., Nowicki, S., Payne, A., Larour, E., Seroussi, H., Lipscomb, W. H., Gregory, J., Abe-Ouchi, A., Shepherd, A., Simon, E., Agosta, C., Alexander, P., Aschwanden, A., Barthel, A., Calov, R., Chambers, C., Choi, Y., Cuzzone, J., Dumas, C., Edwards, T., Felikson, D., Fettweis, X., Golledge, N. R., Greve, R., Humbert, A., Huybrechts, P., Le clec'h, S., Lee, V., Leguy, G., Little, C., Lowry, D. P., Morlighem, M., Nias, I., Quiquet, A., Rückamp, M., Schlegel, N.-J., Slater, D. A., Smith, R. S., Straneo, F., Tarasov, L., van de Wal, R., and van den Broeke, M.: The future sea-level contribution of the Greenland ice sheet: a multi-model ensemble study of ISMIP6, The Cryosphere, 14, 3071–3096, https://doi.org/10.5194/tc-14-3071-2020, 2020.
Hellmer, H. and Olbers, D.: A two-dimensional model for the thermohalin circulation under an ice shelf, Antarct. Sci., 1, 325–336, https://doi.org/10.1017/S0954102089000490, 1989.
Holland, D. M. and Jenkins, A.: Modeling Thermodynamic Ice–Ocean Interactions at the Base of an Ice Shelf, J. Phys. Oceanogr., 29, 1787–1800, https://doi.org/10.1175/1520-0485(1999)029<1787:MTIOIA>2.0.CO;2, 1999.
Inall, M. E., Murray, T., Cottier, F. R., Scharrer, K., and Boyd, T. J.: Oceanic heat delivery via Kangerdlugssuaq Fjord to the south-east Greenland ice sheet, J. Geophys. Res.-Ocean., 119, 631–645, https://doi.org/10.1002/2013JC009295. 2014.
Jackson, R. H. and Straneo, F.: Heat, salt, and freshwater budgets for a glacial fjord in Greenland, J. Phys. Oceanogr., 0, 2735–2768, https://doi.org/10.1175/JPO-D-15-0134.1, 2016.
Jackson, R. H., Straneo, F., and Sutherland, D. A.: Externally forced fluctuations in ocean temperature at Greenland glaciers in non-summer months, Nat. Geosci., 7, 1–6, https://doi.org/10.1038/ngeo2186, 2014.
Jackson, R. H., Shroyer, E. L., Nash, J. D., Sutherland, D. A., Carroll, D., Fried, M. J., Catania, G. A., Bartholomaus, T. C., and Stearns, L. A.: Near-glacier surveying of a subglacial discharge plume: Implications for plume parameterizations, Geophys. Res. Lett., 44, 6886–6894, https://doi.org/10.1002/2017GL073602, 2017.
Jackson, R. H., Lentz, S. J., and Straneo, F.: The dynamics of shelf forcing in Greenlandic fjords, J. Phys. Oceanogr., 48, 2799–2827, https://doi.org/10.1175/JPO-D-18-0057.1, 2018.
Jackson, R. H., Nash, J. D., Kienholz, C., Sutherland, D. A., Amundson, J. M., Motyka, R. J., Winters, D., Skyllingstad, E., and Pettit, E. C.: Meltwater Intrusions Reveal Mechanisms for Rapid Submarine Melt at a Tidewater Glacier, Geophys. Res. Lett., 47, e2019GL085335, https://doi.org/10.1029/2019GL085335, 2020.
Jakobsson, M., Mayer, L. A., Nilsson, J., Stranne, C., Calder, B., O'Regan, M., Farrell, J. W., Cronin, T. M., Brüchert, V., Chawarski, J., Eriksson, B., Fredriksson, J., Gemery, L., Glueder, A., Holmes, F. A., Jerram, K., Kirchner, N., Mix, A., Muchowski, J., Prakash, A., Reilly, B., Thornton, B., Ulfsbo, A., Weidner, E., Åkesson, H., Handl, T., Ståhl, E., Boze, L.-G., Reed, S., West, G., and Padman, J.: Ryder Glacier in northwest Greenland is shielded from warm Atlantic water by a bathymetric sill, Commun. Earth Environ., 1, 1–10, https://doi.org/10.1038/s43247-020-00043-0, 2020.
James, T. D., Murray, T., Selmes, N., Scharrer, K., and O'Leary, M.: Buoyant flexure and basal crevassing in dynamic mass loss at Helheim Glacier, Nat. Geosci., 7, 593–596, https://doi.org/10.1038/ngeo2204, 2014.
Jenkins, A.: Convection-Driven Melting near the Grounding Lines of Ice Shelves and Tidewater Glaciers, J. Phys. Oceanogr., 41, 2279–2294, https://doi.org/10.1175/JPO-D-11-03.1, 2011.
Khan, S. A., Bjørk, A. A., Bamber, J. L., Morlighem, M., Bevis, M., Kjær, K. H., Mouginot, J., Løkkegaard, A., Holland, D. M., Aschwanden, A., Zhang, B., Helm, V., Korsgaard, N. J., Colgan, W., Larsen, N. K., Liu, L., Hansen, K., Barletta, V., Dahl-Jensen, T. S., Søndergaard, A. S., Csatho, B. M., Sasgen, I., Box, J., and Schenk, T.: Centennial response of Greenland's three largest outlet glaciers, Nat. Commun., 11, 1–9, https://doi.org/10.1038/s41467-020-19580-5, 2020.
Kimura, S., Holland, P. R., Jenkins, A., and Piggott, M.: The effect of meltwater plumes on the melting of a vertical glacier face, J. Phys. Oceanogr., 44, 3099–3117, https://doi.org/10.1175/JPO-D-13-0219.1, 2014.
Luthi, M., Funk, M., Iken, A., Gogineni, S., and Truffer, M.: Mechanisms of fast flow in Jakobshavns Isbræ, Greenland, Part III: measurements of ice deformation, temperature and cross-borehole conductivity in boreholes to the bedrock, J. Glaciol., 48, 369–385, https://doi.org/10.3189/172756502781831322, 2002.
Ma, Y. and Bassis, J. N.: The Effect of Submarine Melting on Calving From Marine Terminating Glaciers, J. Geophys. Res.-Earth Surf., 124, 334–346, https://doi.org/10.1029/2018JF004820, 2019.
Mankoff, K. D., Noël, B., Fettweis, X., Ahlstrøm, A. P., Colgan, W., Kondo, K., Langley, K., Sugiyama, S., van As, D., and Fausto, R. S.: Greenland liquid water discharge from 1958 through 2019, Earth Syst. Sci. Data, 12, 2811–2841, https://doi.org/10.5194/essd-12-2811-2020, 2020a.
Mankoff, K. D., Solgaard, A., Colgan, W., Ahlstrøm, A. P., Khan, S. A., and Fausto, R. S.: Greenland Ice Sheet solid ice discharge from 1986 through March 2020, Earth Syst. Sci. Data, 12, 1367–1383, https://doi.org/10.5194/essd-12-1367-2020, 2020b.
Marshall, J., Adcroft, A., Hill, C., Perelman, L., and Heisey, C.: A finite-volume, incompressible Navier Stokes model for studies of the ocean on parallel computers, J. Geophys. Res., 102, 5753, https://doi.org/10.1029/96JC02775, 1997a.
Marshall, J., Hill, C., Perelman, L., and Adcroft, A.: Hydrostatic, quasi-hydrostatic, and nonhydrostatic ocean modeling, J. Geophys. Res., 102, 5733, https://doi.org/10.1029/96JC02776, 1997b.
Meredith, M., Sommerkorn, M., Cassotta, S., Derksen, C., Ekaykin, A., Hollowed, A., Kofinas, G., Mackintosh, A., Melbourne-Thomas, J., Muelbert, M. M. C., Ottersen, G., Pritchard, H., and Schuur, E. A. G.: Polar Regions, in: IPCC Special Report on the Ocean and Cryosphere in a Changing Climate, edited by: Pörtner, H.-O., Roberts, D. C., Masson-Delmotte, V., Zhai, P., Tignor, M., Poloczanska, E., Mintenbeck, K., Alegría, A., Nicolai, M., Okem, A., Petzold, J., Rama, B., Weyer, N. M., https://www.ipcc.ch/srocc/ (last access: 6 April 2022), 2019.
Moon, T., Sutherland, D. A., Carroll, D., Felikson, D., Kehrl, L., and Straneo, F.: Subsurface iceberg melt key to Greenland fjord freshwater budget, Nat. Geosci., 11, 49–54, https://doi.org/10.1038/s41561-017-0018-z, 2017.
Mortensen, J., Bendtsen, J., Lennert, K., and Rysgaard, S.: Seasonal variability of the circulation system in a west Greenland tidewater outlet glacier fjord, Godthåbsfjord (64∘ N), J. Geophys. Res.-Earth Surf., 119, 2591–2603, https://doi.org/10.1002/2014JF003267, 2014.
Mortensen, J., Rysgaard, S., Bendtsen, J., Lennert, K., Kanzow, T., Lund, H., and Meire, L.: Subglacial discharge and its down-fjord transformation in West Greenland with an ice melange, J. Geophys. Res.-Oceans, 125, e2020JC016301, https://doi.org/10.1029/2020JC016301, 2020.
Moyer, A. N., Sutherland, D. A., Nienow, P. W., and Sole, A. J.: Seasonal Variations in Iceberg Freshwater Flux in Sermilik Fjord, Southeast Greenland From Sentinel-2 Imagery, Geophys. Res. Lett., 46, 8903–8912, https://doi.org/10.1029/2019GL082309, 2019.
Noël, B., van de Berg, W. J., Machguth, H., Lhermitte, S., Howat, I., Fettweis, X., and van den Broeke, M. R.: A daily, 1 km resolution data set of downscaled Greenland ice sheet surface mass balance (1958–2015), The Cryosphere, 10, 2361–2377, https://doi.org/10.5194/tc-10-2361-2016, 2016.
O'Leary, M. and Christoffersen, P.: Calving on tidewater glaciers amplified by submarine frontal melting, The Cryosphere, 7, 119–128, https://doi.org/10.5194/tc-7-119-2013, 2013.
Rezvanbehbahani, S., Stearns, L. A., Keramati, R., Shankar, S., and van der Veen, C. J.: Significant contribution of small icebergs to the freshwater budget in Greenland fjords, Commun. Earth Environ., 1, 1–7, https://doi.org/10.1038/s43247-020-00032-3, 2020.
Schaffer, J., Kanzow, T., von Appen, W.-J., von Albedyll, L., Arndt, J. E., and Roberts, D. H.: Bathymetry constrains ocean heat supply to Greenland's largest glacier tongue, Nat. Geosci., 13, 227–231, https://doi.org/10.1038/s41561-019-0529-x 2020.
Sciascia, R., Straneo, F., Cenedese, C., and Heimbach, P.: Seasonal variability of submarine melt rate and circulation in an East Greenland fjord, J. Geophys. Res.-Ocean., 118, 2492–2506, https://doi.org/10.1002/jgrc.20142, 2013.
Slater, D. A., Nienow, P. W., Cowton, T. R., Goldberg, D. N., and Sole, A. J.: Effect of near-terminus subglacial hydrology on tidewater glacier submarine melt rates, Geophys. Res. Lett., 42, 1–8, https://doi.org/10.1002/2014GL062494, 2015.
Slater, D. A., Goldberg, D. N., Nienow, P. W., and Cowton, T. R.: Scalings for Submarine Melting at Tidewater Glaciers from Buoyant Plume Theory, J. Phys. Oceanogr., 46, 1839–1855, https://doi.org/10.1175/JPO-D-15-0132.1, 2016.
Slater, D. A., Straneo, F., Das, S. B., Richards, C. G., Wagner, T. J. W., and Nienow, P. W.: Localized Plumes Drive Front-Wide Ocean Melting of A Greenlandic Tidewater Glacier, Geophys. Res. Lett., 45, 12350–12358, https://doi.org/10.1029/2018GL080763, 2018.
Slater, D. A., Straneo, F., Felikson, D., Little, C. M., Goelzer, H., Fettweis, X., and Holte, J.: Estimating Greenland tidewater glacier retreat driven by submarine melting, The Cryosphere, 13, 2489–2509, https://doi.org/10.5194/tc-13-2489-2019, 2019.
Slater, D. A., Felikson, D., Straneo, F., Goelzer, H., Little, C. M., Morlighem, M., Fettweis, X., and Nowicki, S.: Twenty-first century ocean forcing of the Greenland ice sheet for modelling of sea level contribution, The Cryosphere, 14, 985–1008, https://doi.org/10.5194/tc-14-985-2020, 2020.
Straneo, F. and Heimbach, P.: North Atlantic warming and the retreat of Greenland's outlet glaciers, Nature, 504, 36–43, https://doi.org/10.1038/nature12854, 2013.
Straneo, F., Hamilton, G. S., Sutherland, D. A., Stearns, L. A., Davidson, F., Hammill, M. O., Stenson, G. B., and Rosing-Asvid, A.: Rapid circulation of warm subtropical waters in a major glacial fjord in East Greenland, Nat. Geosci., 3, 182–186, https://doi.org/10.1038/ngeo764, 2010.
Straneo, F., Curry, R. G., Sutherland, D. A., Hamilton, G. S., Cenedese, C., Våge, K., and Stearns, L. A.: Impact of fjord dynamics and glacial runoff on the circulation near Helheim Glacier, Nat. Geosci., 4, 322–327, https://doi.org/10.1038/ngeo1109, 2011.
Straneo, F., Sutherland, D. A., Holland, D., Gladish, C., Hamilton, G. S., Johnson, H. L., Rignot, E., Xu, Y., and Koppes, M.: Characteristics of ocean waters reaching Greenland's glaciers, Ann. Glaciol., 53, 202–210, https://doi.org/10.3189/2012AoG60A059, 2012.
Sulak, D. J., Sutherland, D. A., Enderlin, E. M., Stearns, L. A., and Hamilton, G. S.: Iceberg properties and distributions in three Greenlandic fjords using satellite imagery, Ann. Glaciol., 58, 1–15, https://doi.org/10.1017/aog.2017.5, 2017.
Sutherland, D., Straneo, F., and Pickart, R. S.: Characteristics and dynamics of two major greenland glacial fjords, J. Geophys. Res.-Earth Surf., 119, 2121–2128, https://doi.org/10.1002/2013JC009786, 2014.
Sutherland, D. A. and Pickart, R. S.: The East Greenland Coastal Current: Structure, variability, and forcing, Prog. Oceanogr., 78, 58–77, https://doi.org/10.1016/j.pocean.2007.09.006, 2008.
Sutherland, D. A. and Straneo, F.: Estimating ocean heat transports and submarine melt rates in sermilik fjord, greenland, using lowered acoustic doppler current profiler (LADCP) velocity profiles, Ann. Glaciol., 53, 50–58, https://doi.org/10.3189/2012AoG60A050, 2012.
Sutherland, D. A., Jackson, R. H., Kienholz, C., Amundson, J. M., Dryer, W. P., Duncan, D., Eidam, E. F., Motyka, R. J., and Nash, J. D.: Direct observations of submarine melt and subsurface geometry at a tidewater glacier, Science, 365, 369–374, https://doi.org/10.1126/science.aax3528, 2019.
Todd, J. and Christoffersen, P.: Are seasonal calving dynamics forced by buttressing from ice mélange or undercutting by melting? Outcomes from full-Stokes simulations of Store Glacier, West Greenland, The Cryosphere, 8, 2353–2365, https://doi.org/10.5194/tc-8-2353-2014, 2014.
Xie, S., Dixon, T. H., Holland, D. M., Voytenko, D., and Vaňková, I.: Rapid iceberg calving following removal of tightly packed pro-glacial mélange, Nat. Commun., 10, 3250, https://doi.org/10.1038/s41467-019-10908-4, 2019.
Xu, Y., Rignot, E., Menemenlis, D., and Koppes, M.: Numerical experiments on subaqueous melting of Greenland tidewater glaciers in response to ocean warming and enhanced subglacial discharge, Ann. Glaciol., 53, 229–234, https://doi.org/10.3189/2012AoG60A139, 2012.
Xu, Y., Rignot, E., Fenty, I., Menemenlis, D., and Flexas, M. M.: Subaqueous melting of Store Glacier, west Greenland from three-dimensional, high-resolution numerical modeling and ocean observations, Geophys. Res. Lett., 40, 4648–4653, https://doi.org/10.1002/grl.50825, 2013.