the Creative Commons Attribution 4.0 License.
the Creative Commons Attribution 4.0 License.
 | 28 Mar 2024
Subglacial valleys preserved in the highlands of south and east Greenland record restricted ice extent during past warmer climates
Guy J. G. Paxman
Stewart S. R. Jamieson
Aisling M. Dolan
Michael J. Bentley
The Greenland Ice Sheet is a key contributor to contemporary global sea level rise, but its long-term history and response to episodes of warming in Earth's geological past remain uncertain. The terrain covered by the ice sheet comprises ∼ 79 % of Greenland and ∼ 1.1 % of the Earth's land surface and contains geomorphological records that may provide valuable insights into past ice-sheet behaviour. Here we use ice surface morphology and radio-echo sounding data to identify ice-covered valleys within the highlands of southern and eastern Greenland and use numerical ice-sheet modelling to constrain the climatological and glaciological conditions responsible for valley incision. Our mapping reveals intricate subglacial valley networks with morphologies that are indicative of substantial glacial modification of an inherited fluvial landscape, yet many of these valleys are presently situated beneath cold-based, slow-moving (i.e. non-erosive) ice. We use the morphology of the valleys and our simple ice-sheet model experiments to infer that incision likely occurred beneath erosive mountain valley glaciers during one or more phases of Greenland's glacial history when ice was restricted to the southern and eastern highlands and when Greenland's contribution to barystatic sea level was up to +7 m relative to today. We infer that this valley incision primarily occurred prior to the growth of a continental-scale ice sheet, most likely during the late Miocene (ca. 7–5 Ma) and/or late Pliocene (ca. 3.6–2.6 Ma). Our findings therefore provide new data-based constraints on early Greenland Ice Sheet extent and dynamics that can serve as valuable boundary conditions in models of regional and global palaeoclimate during past warm periods that are important analogues for climate change in the 21st century and beyond.
- Article
(14860 KB) - Full-text XML
-
Supplement
(1390 KB) - BibTeX
- EndNote


Loss of ice from the Greenland Ice Sheet (GrIS) is one of the largest contributors to contemporary sea level rise (WCRP Global Sea Level Budget Group, 2018). Between 2005 and 2018, the GrIS contributed an average of 0.76 mm yr−1 to global mean sea level rise (WCRP Global Sea Level Budget Group, 2018) due to mass loss driven by increased surface melting and enhanced discharge from outlet glaciers (The Imbie Team, 2020). Climate–ice-sheet model ensemble experiments indicate that rates of ice mass loss in Greenland are likely to accelerate over the course of the current century, with the GrIS contributing several centimetres of additional global mean sea level rise by 2100 (Aschwanden and Brinkerhoff, 2022; Edwards et al., 2021; Goelzer et al., 2020). However, predicting future GrIS behaviour remains challenging due to incomplete understanding of ice dynamics, including the complex interactions between the ice sheet and the atmosphere, solid Earth, and ocean (Alley et al., 2019; Goelzer et al., 2013; Straneo and Heimbach, 2013). A key means of improving our understanding of current and future GrIS behaviour is to examine records of past change. However, significant uncertainties persist regarding the long-term history of the GrIS, particularly its extent and behaviour during past warm periods of the Quaternary and Neogene (Fig. 1a).
Given that ice covers approximately 79 % of the land surface of Greenland (Fig. 1b), many of the records used to infer long-term past ice-sheet behaviour have been acquired via coring or seismic imaging of offshore sedimentary material. For example, the presence of ice-rafted debris in North Atlantic and Arctic shelf and deep ocean sediments suggests that near-coastal ice existed in eastern Greenland from the late Miocene (ca. 11–7 Ma) (Helland and Holmes, 1997; Larsen et al., 1994; St. John and Krissek, 2002) and potentially as early as the late Eocene (ca. 38 Ma) in ephemeral form (Eldrett et al., 2007; Tripati and Darby, 2018) (Fig. 1a).
Records of ice-rafted debris in the North Atlantic (Bailey et al., 2013; Blake-Mizen et al., 2019; Flesche Kleiven et al., 2002; Jansen et al., 2000) and global ice volume signals extracted from marine oxygen isotope records (Mudelsee and Raymo, 2005) have been used to infer that the gradual transition towards large-scale glaciation in Greenland – referred to as the “onset of Northern Hemisphere Glaciation” (McClymont et al., 2023) – occurred during the late Pliocene to earliest Pleistocene (ca. 3.6–2.4 Ma; Fig. 1a). Glaciation is thought to have been primarily controlled by a drop in atmospheric CO2 levels below a key threshold (DeConto et al., 2008; Lunt et al., 2008), although other global factors such as uplift of the Himalayas and Rocky Mountains (Ruddiman and Kutzbach, 1989), closure of the Panama seaway (Haug and Tiedemann, 1998), and/or shifts in atmosphere and ocean circulation (Wara et al., 2005) may have also been partially responsible (Lunt et al., 2008). The initial phase of ice growth was likely interrupted by the mid-Piacenzian warm period (mPWP; ca. 3.26–3.02 Ma) (Haywood et al., 2016a); the global sea level highstand of up to +25 m during this interval (Dumitru et al., 2019; Dutton et al., 2015; Grant et al., 2019) implies that the GrIS was likely significantly smaller than its present-day extent.
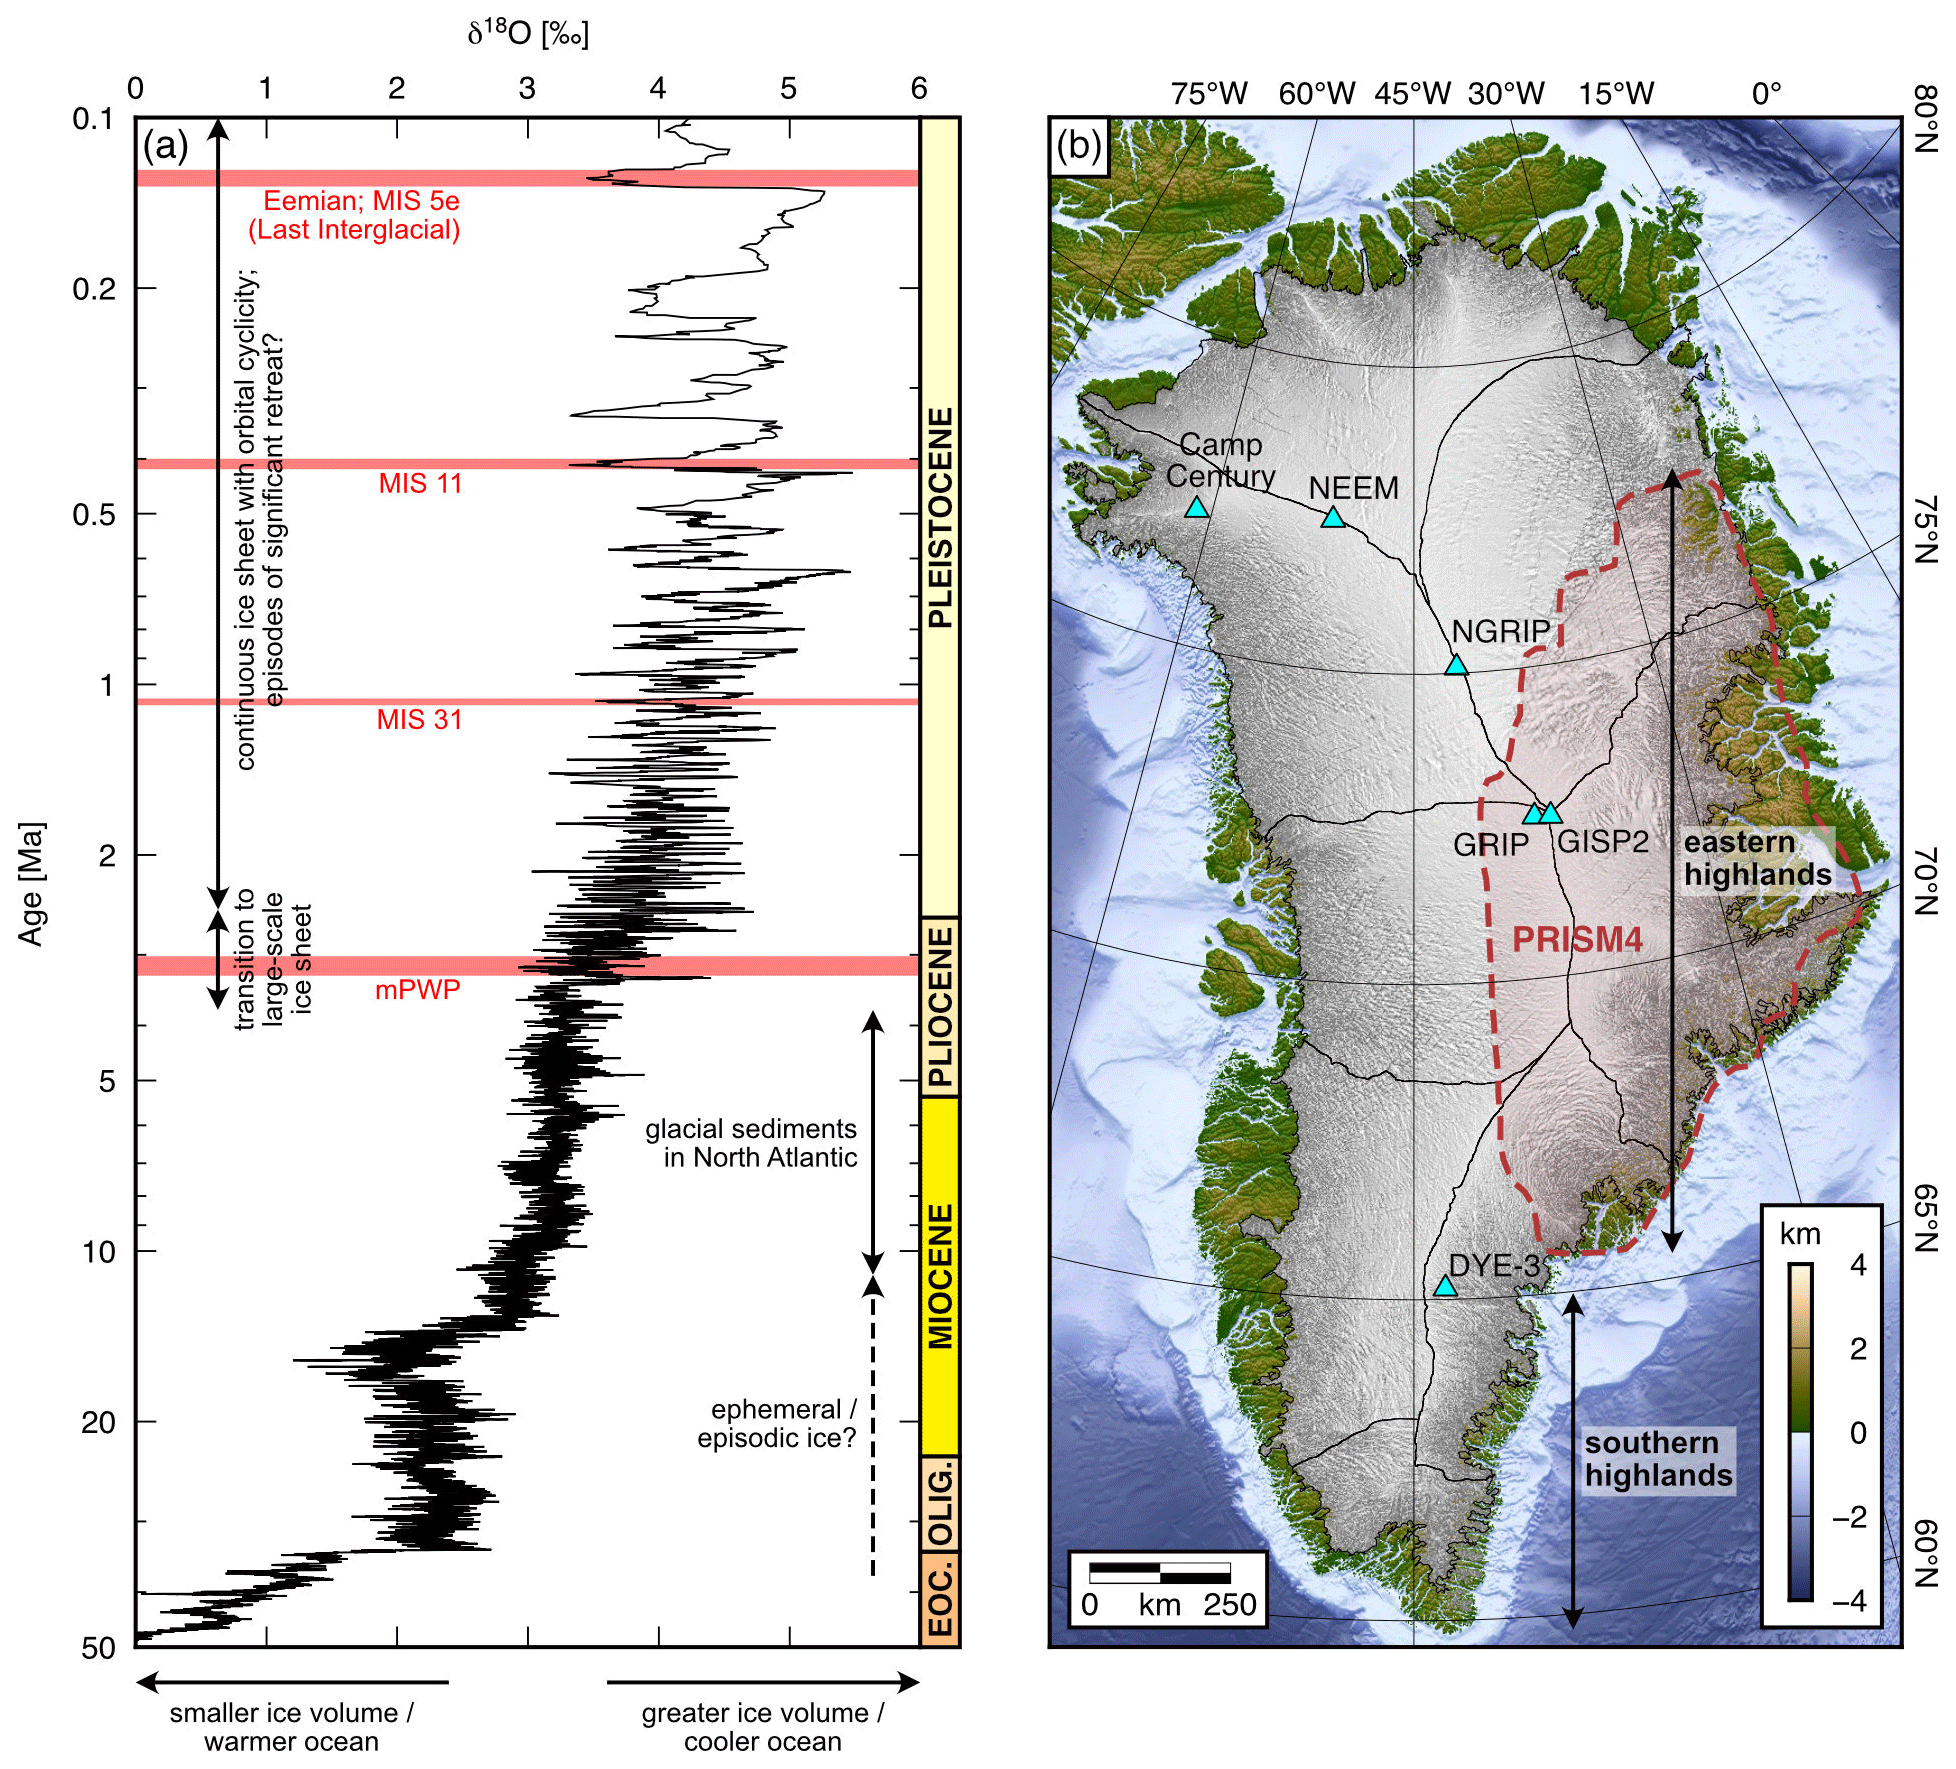
Figure 1Greenlandic glacial history. (a) Cenozoic global benthic oxygen isotope curve (five-point running mean) (Westerhold et al., 2020) (Eoc. is Eocene; Olig. is Oligocene). Note the logarithmic age scale. Red bars mark notable Plio-Pleistocene warm intervals (MIS is Marine Isotope Stage). (b) Present-day Greenland Ice Sheet. Hillshade image of the ice surface (Howat et al., 2014, 2022) is shaded in grey; land surface topography and seafloor bathymetry are displayed according to the colour scale (relative to mean sea level) (Morlighem et al., 2017). Black lines demarcate major ice-sheet drainage basins (Zwally et al., 2012); blue triangles mark deep ice core sites. The dashed red line marks the GrIS extent used as a PRISM4 (Pliocene Research Interpretation and Synoptic Mapping) palaeogeography boundary condition representing the mPWP interval in the Pliocene Model Intercomparison Project Phase 2 (Dowsett et al., 2016; Haywood et al., 2016b).
The intensification of large-scale glaciation on Greenland is believed to have commenced following the mPWP, culminating in a continental-scale ice sheet by the latest Pliocene/earliest Pleistocene (ca. 2.7–2.4 Ma) (Christ et al., 2020; Flesche Kleiven et al., 2002; Lisiecki and Raymo, 2005; McClymont et al., 2023). Interglacial marine sediments and terrestrial material exposed along the northern Greenland coast indicate that periods characterised by boreal forest–tundra conditions and less extensive ice cover persisted (at least intermittently) into the early Pleistocene (Bennike et al., 2010; Feyling-Hanssen et al., 1983; Funder et al., 2001). Dynamic behaviour of the GrIS in the early Pleistocene is also evidenced by offshore seismic reflection data, which reveal major cross-shelf glacial troughs and progradational trough-mouth fans and sedimentary wedges that are indicative of multiple phases of ice-sheet shelf-edge advance and retreat (Knutz et al., 2019; Nielsen and Kuijpers, 2013).
Cosmogenic radionuclide (e.g. 10Be and 26Al) concentrations in sediment and bedrock obtained via sub-ice drilling at GISP2 and Camp Century (Fig. 1b) indicate that these sites have not been continuously covered by ice for more than approx. 1.1 Myr, suggesting that at least one episode of major ice loss occurred in northwest and central Greenland at or since 1.1 Ma (Christ et al., 2021; Schaefer et al., 2016). However, cosmogenic radionuclides in North Atlantic sediments indicate that ice cover persisted at least in eastern Greenland throughout this time (Bierman et al., 2016). Candidate time intervals for partial late Pleistocene deglaciation include particularly warm or long-lasting interglacial periods, such as Marine Isotope Stage (MIS) 31 (ca. 1.09–1.06 Ma) (Melles et al., 2012) or 11 (ca. 430–400 ka) (Christ et al., 2023; Reyes et al., 2014; Robinson et al., 2017) (Fig. 1a). Most recently, the GrIS underwent a period of more muted retreat during the Last Interglacial (the Eemian; MIS 5e; ca. 125 ka) (Plach et al., 2018), before expanding onto the continental shelf at the Last Glacial Maximum (LGM; ca. 21 ka) (Lecavalier et al., 2014) and subsequently retreating to its modern configuration through the Holocene (Lesnek et al., 2020).
Building an improved understanding of GrIS behaviour during its early development and through subsequent warmer climate intervals will provide valuable analogues for predicting its response to current and projected future atmosphere and ocean warming. Model intercomparison projects such as PLISMIP (Pliocene Ice Sheet Model Intercomparison Project) demonstrate that there is significant model spread in the predicted GrIS configuration during past warm periods such as the mPWP, which largely relates to uncertainties in the climate forcing (Dolan et al., 2015; Koenig et al., 2015). This highlights the need for more data-based constraints of past ice extent and behaviour. Unfortunately, evidence for long-term GrIS behaviour is limited in quantity and irregularly distributed, reflecting the logistical challenges associated with acquiring geological data, the masking of 79 % of the land surface by the GrIS, and the fact that as the ice sheet waxes and wanes it erases the onshore debris that would otherwise provide a record of previous glacial cycles.
In areas elsewhere on Earth formerly covered by large ice sheets, investigations of large-scale glacial geomorphology have provided important insights into past ice-sheet extent and behaviour, given that the landscape typically records the long-term average glacial conditions to which it has been subjected (Porter, 1989). This paradigm has recently begun to be applied to the bed topography of Greenland and Antarctica, which has been measured/inferred using the large quantities of radio-echo sounding (RES) survey data and ice surface morphology imagery acquired in recent years (Haran et al., 2018; MacGregor et al., 2021). Previous studies have shown that the subglacial landscape records processes including glacial erosion, fluvial incision in the absence of ice, tectonic deformation, and isostatic adjustment (Cooper et al., 2016; Livingstone et al., 2017; Paxman et al., 2021; Pedersen et al., 2019). The topography of the 79 % of Greenland that is covered by the GrIS can therefore provide a valuable, and hitherto relatively little exploited, opportunity for understanding past ice-sheet behaviour, particularly during intervals associated with smaller-than-present ice configurations. Significantly, ice sheets can preserve large areas of topography beneath cold-based, non-erosive ice, meaning that geomorphological records pertaining to the early development of the ice sheet can survive for millions of years (Bierman et al., 2014; Rose et al., 2013).
The aim of this study is to use ice surface morphology and RES survey data to map and interpret the subglacial landscape of the highlands of south and east Greenland (Fig. 1b). We focus on this area because these highlands are believed to have been the site of initial GrIS inception (Solgaard et al., 2013) and to have retained ice during subsequent warm periods (Bierman et al., 2016; Schaefer et al., 2016) and are therefore the area most likely to contain geomorphological records of ice behaviour during intervals when the GrIS was significantly more restricted in extent. We combine our geomorphological mapping with numerical ice-sheet modelling to understand the processes responsible for the evolution of the subglacial landscape of these highlands and the implications for long-term ice behaviour.
2.1 Subglacial valley mapping
We used a combination of satellite imagery and airborne RES survey data to map subglacial valleys present in the eastern and southern highlands of Greenland (Fig. 1b). The distribution and morphology of valleys and their networks (i.e. how they are spatially organised and connected) are particularly useful in establishing the patterns and scales of past erosion and in turn the dynamics of past ice sheets (Livingstone et al., 2017; Rose et al., 2013).
2.1.1 Ice surface morphology
We followed the approach of previous studies (Jamieson et al., 2023; Lea et al., 2023; Ross et al., 2014) that have used ice surface morphology, as recorded by satellite imagery, to infer the locations of subglacial valleys and ridges. For this task, we used the 100 m resolution MODIS (Moderate Resolution Imaging Spectroradiometer) Mosaic of Greenland (MoG) surface morphology image map version 2 (Haran et al., 2018). MODIS is a passive sensor that records the intensity of (near-)visible solar radiation reflections; the MoG surface morphology map is derived by high-pass filtering of red-light MODIS images (Haran et al., 2018). MoG surface morphology imagery therefore provides a semi-quantitative approximation of the reflectivity of the ice surface, which depends on the slope/curvature. Depending on the local glaciological conditions, subtle changes in surface slope can be predictably correlated with undulations in bed topography (Le Brocq et al., 2008; Rémy and Minster, 1997); typically, subglacial valleys are positioned below darker areas (lower reflection intensity) and subglacial ridges below lighter areas (higher reflection intensity) in the MoG image (Fig. 2). Surface morphology mapping is often ineffective close to ice divides, where ice is thickest and horizontal velocities are near-zero, meaning surface expressions of basal features are heavily attenuated. Furthermore, isolating the signal from the basal topography is challenging in areas characterised by high basal sliding rates and active supra- and englacial dynamics (such as ice streams), which also influence ice surface morphology (Cooper et al., 2019). Surface imagery is therefore best suited to inferring qualitative variations in bed topography in areas of relatively slow (but non-zero) ice surface velocity, minimal basal sliding, high bed relief, and thin ice. The southern and eastern highlands of Greenland fulfil all of these criteria (Joughin et al., 2018; MacGregor et al., 2022; Morlighem et al., 2017) and are therefore an ideal target for this analysis.
2.1.2 Radio-echo sounding
The amplitude transfer of bed undulations to the ice surface is complex and dependent on basal sliding velocity, ice rheology, and ice thickness (Gudmundsson, 2003; Ng et al., 2018). Therefore, while useful for inferring the qualitative “form” of a subglacial landscape, ice surface morphology alone cannot be used to establish the absolute elevation of the bed. RES surveys directly measure the ice thickness (and thus bed elevation) along flight lines; these data can be used to ground-truth the locations of subglacial valleys and quantify their cross-profile morphology. For this task, we used a recently assembled database of the locations of subglacial valleys visible in Operation IceBridge RES data (MacGregor et al., 2021) (Fig. S1a in the Supplement) across the GrIS. This dataset (Paxman, 2023a) also contains quantitative metrics of valley cross-profile morphology, including depth, width, V-shapedness, and curvature, as well as classifications of valleys as either “glacial” or “fluvial” based on their morphological similarity to glacial or fluvial valleys observed elsewhere in the Northern Hemisphere. For the purposes of this study, we only examined the morphometrics of valley profiles whose classification is associated with high confidence (for more information the reader is referred to Paxman, 2023a).
MODIS ice surface imagery and RES bed elevation data are therefore complementary, providing (i) an indication of the morphology of valley cross-profiles where they are intersected by flight lines and (ii) a view of valley planform geometry (i.e. orientation and connectivity) between flight lines (Fig. 2). Using the MODIS MoG image and the RES-derived subglacial valley database (Paxman, 2023a), we digitised valley planform patterns within the highlands of southern and eastern Greenland visible in ice surface imagery, ground-truthed their locations using RES data, and extracted their cross-profile morphometrics.
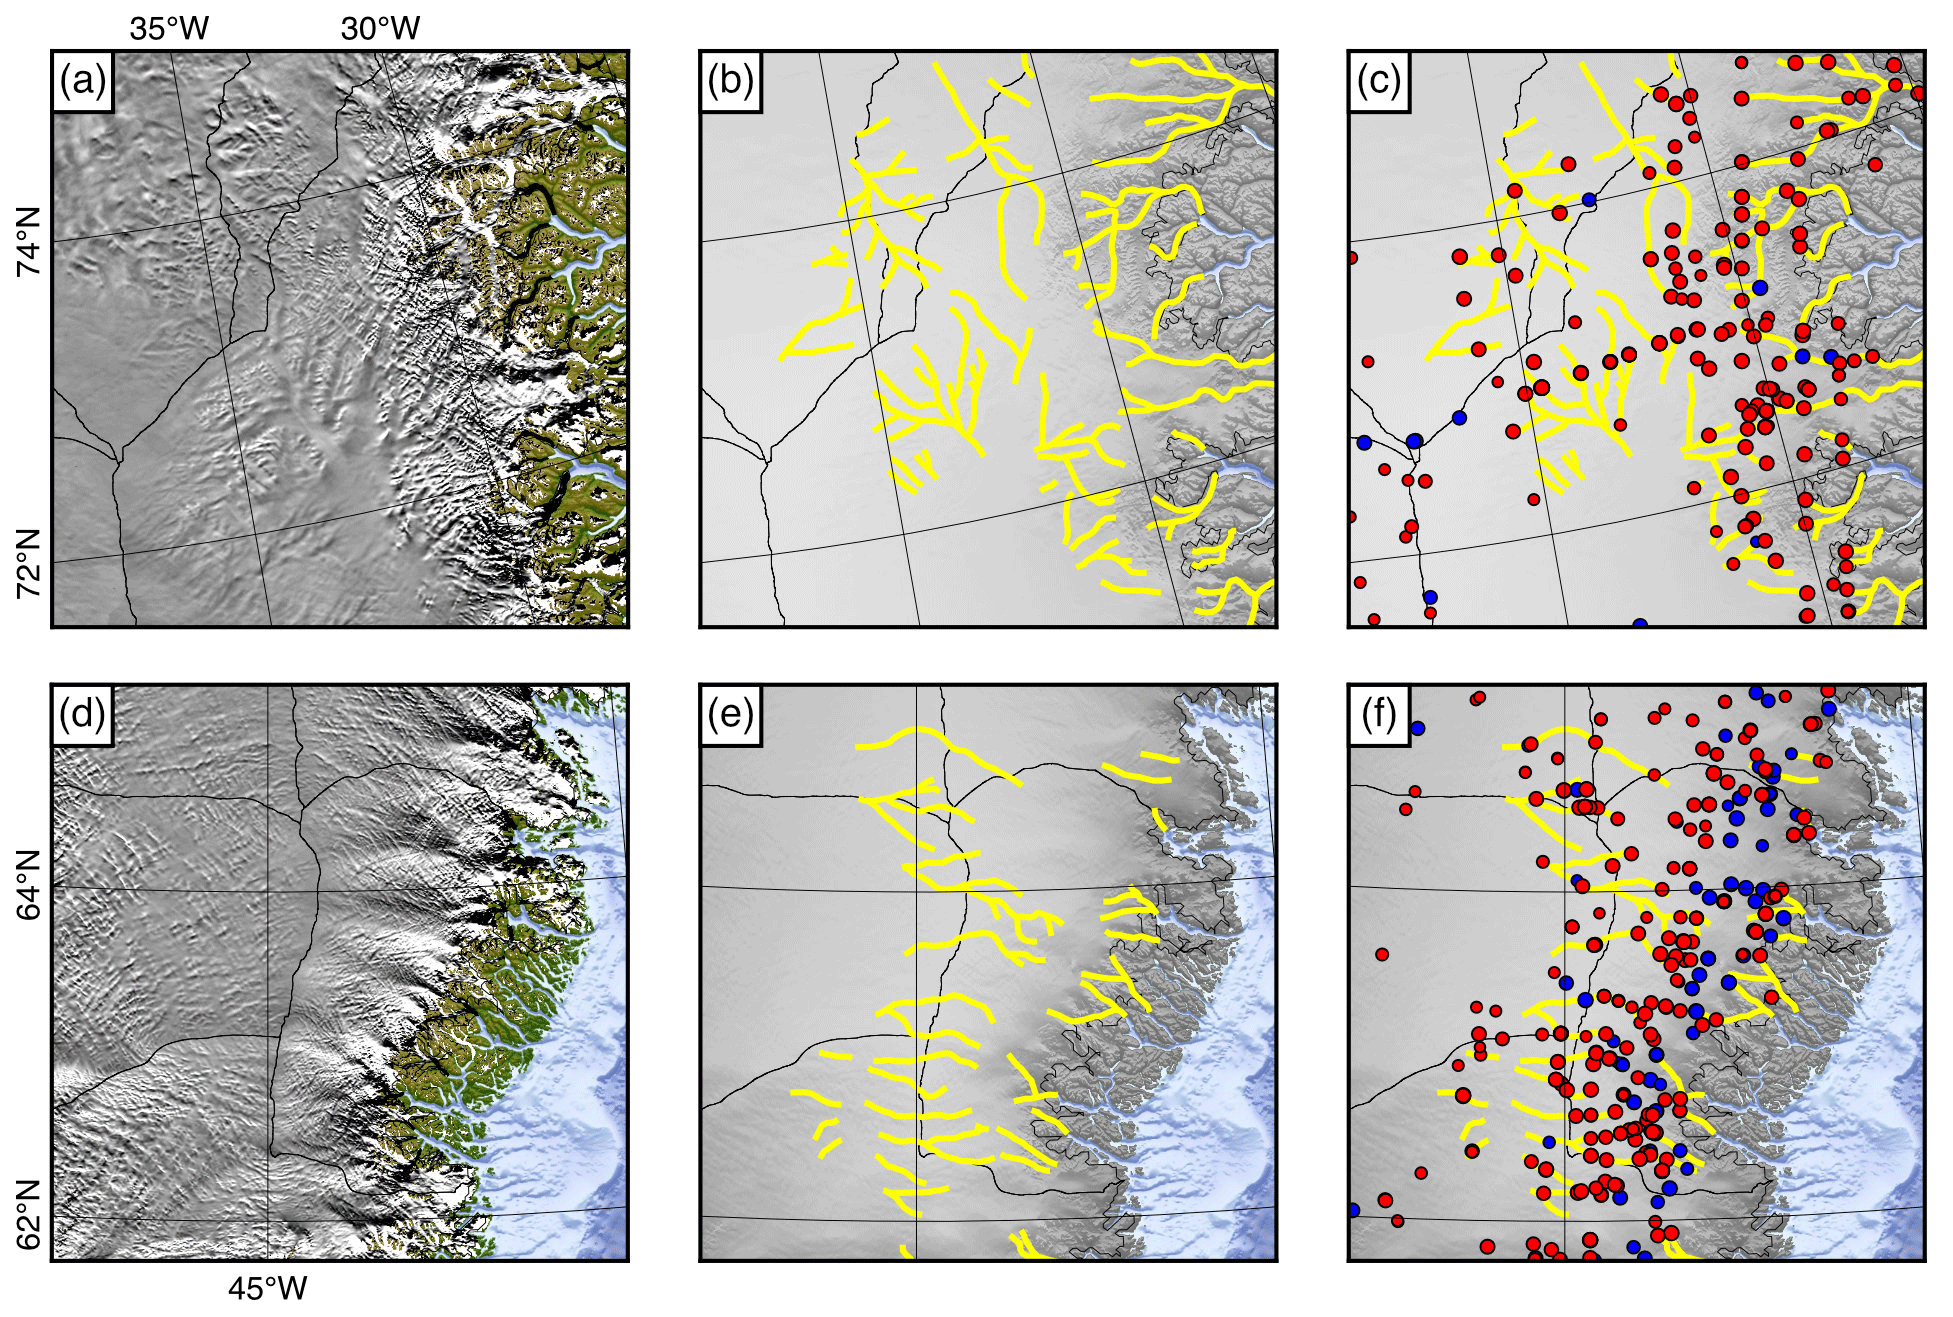
Figure 2Illustration of subglacial valley mapping from ice surface morphology imagery and RES survey data. (a, d) MODIS MoG ice surface morphology image (Haran et al., 2018). (b, e) Locations of interpreted subglacial valleys (yellow) overlain on shaded ice surface elevation (Howat et al., 2022) over the same areas as shown in the panels on the left. (c, f) Valleys identified in RES survey data (Paxman, 2023a) overlain on valley planforms mapped from MODIS MoG morphology imagery (yellow). Red circles are “glacial” classification; blue are “fluvial” classification. Panels (a)–(c) cover the area shown in Fig. 4c; panels (d)–(f) cover the area shown in Fig. 4e.
2.2 Ice-sheet modelling
The valleys in the southern and eastern highlands may have been formed, exploited, and/or modified during past mountain-scale glaciation in Greenland (Patton et al., 2016). They may therefore provide important constraints on the extent and behaviour of past ice sheets. We performed simple numerical ice-sheet modelling experiments to test whether it was possible to simulate ice masses with configurations consistent with the mapped valley extents and configurations, and if so to quantify the associated climatology. For this task we used the Parallel Ice Sheet Model (PISM), an open-source, finite-difference, shallow ice-sheet model (Winkelmann et al., 2011).
2.2.1 Model set-up
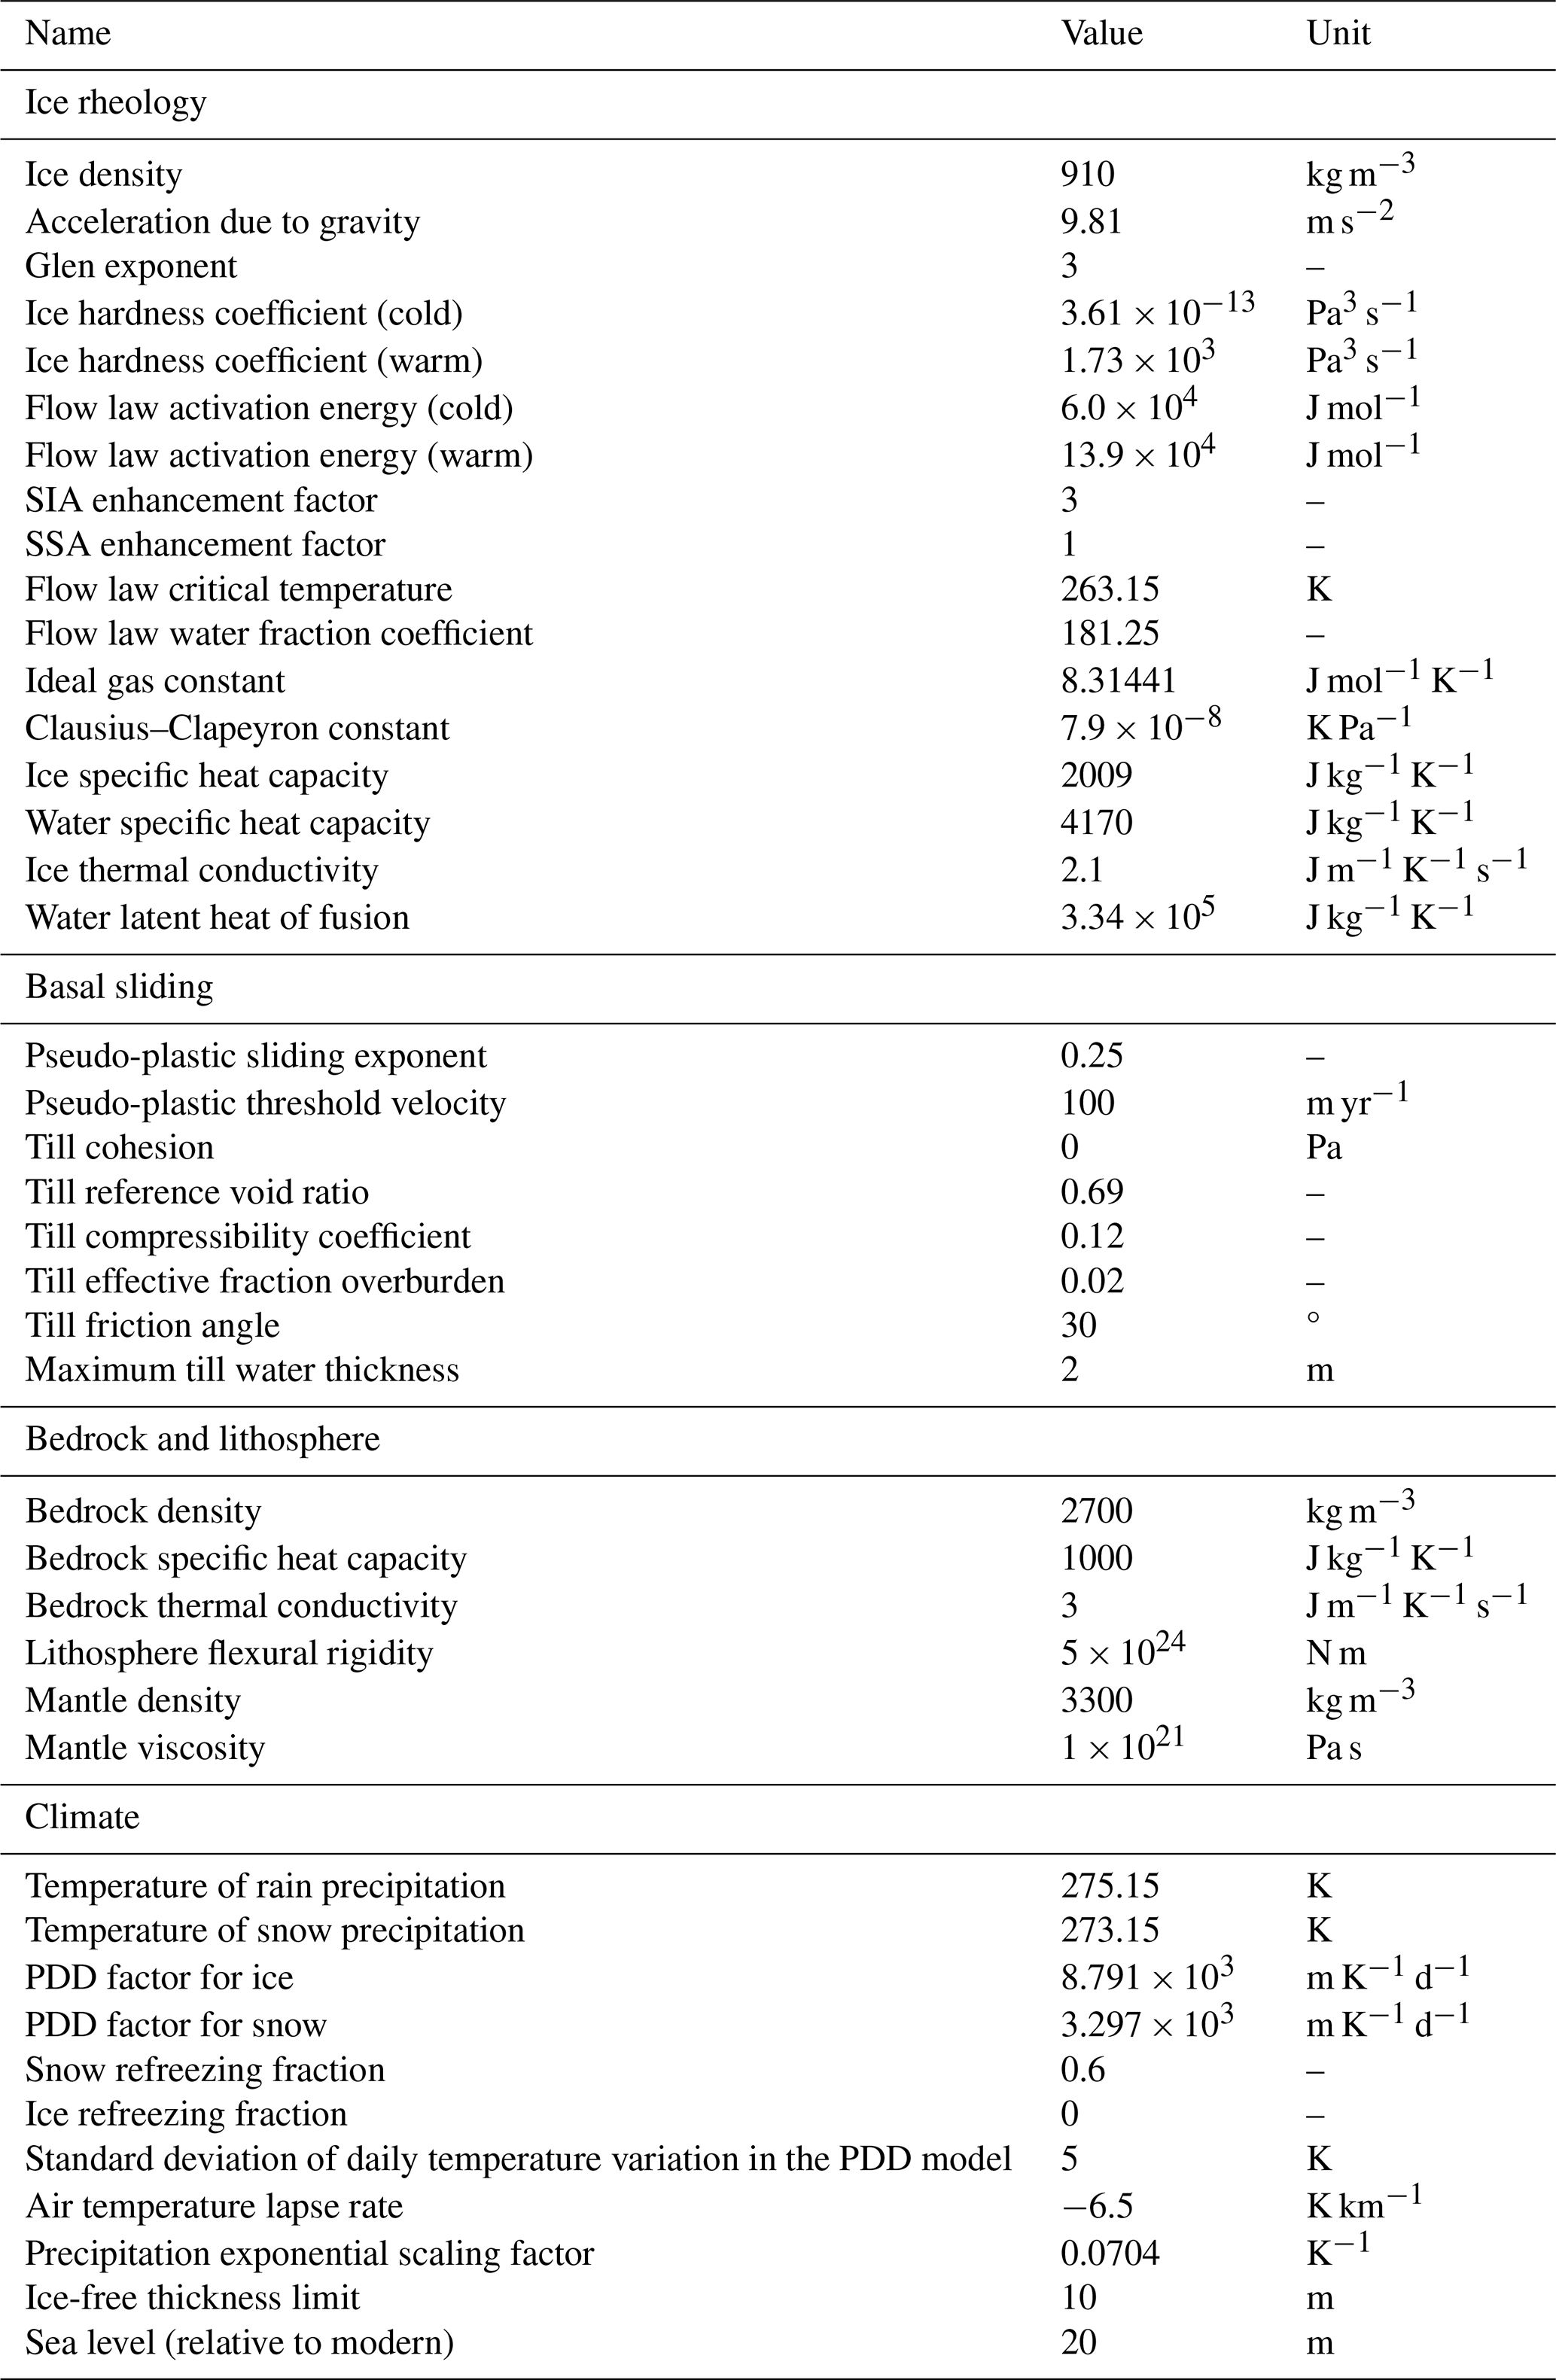
We used PISM in its “hybrid” mode, which simulates internal deformation and basal sliding by employing the shallow-ice and shallow-shelf approximations (SIA and SSA), respectively. Our model set-up included constitutive “laws” for temperature-dependent and water-content-dependent creep, which govern internal ice deformation (Aschwanden et al., 2012; Lliboutry and Duval, 1985; Paterson and Budd, 1982), and a pseudo-plastic sliding “law” that governs basal sliding (Bueler and Brown, 2009; Winkelmann et al., 2011); we used a constant till friction angle of 30° based on analogy with the European Alps (Seguinot et al., 2018). Unless otherwise stated, we used the PISM default values for the model parameters relating to ice rheology and basal sliding (a full list of the parameters used in our simulations is provided in Table 1).
Since the focus of our modelling was on upland ice growth as opposed to (e.g.) grounding line dynamics at marine-terminating glaciers, we assumed a simple calving model where ice is removed when it reaches the coastline; sea level was assumed to be 20 m higher than today (Dutton et al., 2015). The model domain includes the entirety of Greenland with a horizontal grid resolution of 10 km, which represents a compromise between computational efficiency and the ability to capture the larger valley networks present in the subglacial topography (see Paxman, 2023a). Selected experiments were also performed at a higher resolution of 5 km, which reflects the average valley width in the eastern and southern highlands (Paxman, 2023a), allowing us to examine the influence of valley topography on the simulated patterns of ice flow in greater detail. Each simulation started from an ice-free state, using the boundary conditions and climate forcing described below. In each case, the model was spun-up for 10 kyr, after which ice extent and volume reached quasi-equilibrium in all experiments. Through the model run, the bed topography was continually adjusted for isostatic deformation under the simulated ice load using an elastic lithosphere–relaxing asthenosphere model.
2.2.2 Boundary conditions
The main subglacial boundary conditions required by the ice-sheet model are the geothermal heat flux and bed topography. We used a present-day geothermal heat flux model derived from magnetic anomaly data (Martos et al., 2018) and, in the absence of a robust reconstruction of palaeo-geothermal heat flux, assumed that the heat flux has remained constant since early ice growth. For the bed topography, we adjusted the modern BedMachine v.5 digital elevation model (Morlighem et al., 2017) for the isostatic response to (a) the complete removal of the modern GrIS (Paxman et al., 2022a) and (b) erosional unloading driven by glacial valley and fjord incision (Medvedev et al., 2013; Pedersen et al., 2019).
For the erosional unloading correction, we followed the approach described by Medvedev et al. (2013) and Pedersen et al. (2019), whereby the thickness of glacially eroded material was estimated by subtracting the ice-free topography from an accordant surface interpolated between the plateaux and peaks that separate the fjords and valleys (Fig. S2a). Erosion of the glacial troughs on the adjacent continental shelf was also accounted for. We computed the isostatic response to this incision using an elastic plate model with a laterally variable effective elastic thickness (Paxman et al., 2021; Steffen et al., 2018) and subtracted this correction from the rebounded (ice-free) BedMachine v.5 digital elevation model. This means that the mountain peaks and plateaux (which are assumed to have not been eroded since widespread glaciation) were lowered to their estimated pre-glacial elevations, which was necessary for examining elevation–climate controls in our simulations of early mountain ice growth. The magnitude of the flexural response to fjord and valley incision is 200–400 m along the highlands (Fig. S2b) (Paxman et al., 2021). However, as soon as glaciation commences in our model experiments, it is necessary for the valleys themselves to be left open (i.e. instantaneously incised) in the digital elevation model, enabling us to simulate realistic spatial patterns of ice flow. Indeed, it is reasonable to assume that the modern-day valleys would have at least been partially incised by rivers prior to glaciation. While this means the bed topography boundary condition used in our models will not have existed at a single point in time, it acts as a representative state for the period of early mountain glaciation and allows a trade-off between ensuring that the elevation–climate controls on ice nucleation are correct while also allowing the influence of valleys on ice flow to be simulated.
Because there is uncertainty surrounding both the past geothermal heat flux and the bed topography (and given that we are not modelling a specific past time interval), we used sensitivity testing to examine the influence of these boundary conditions on the ice-sheet model results. To do so, we ran sensitivity experiments using the heat flux and topography described above and an alternative scenario for each boundary condition. The alternative heat flux map was derived by quantifying statistical relationships between global geological data and geothermal heat flux measurements to predict heat flux across Greenland from geophysical observations (Rezvanbehbahani et al., 2017). We are agnostic with regards to the relative merits of the two models, but importantly for our purposes they were determined using independent datasets and methodologies and contain contrasting estimates of heat flux for eastern and southern Greenland (30–50 mW m−2 in Rezvanbehbahani et al., 2017, vs. 60–70 mW m−2 in Martos et al., 2018), allowing us to fully assess the sensitivity of our results to this parameter. The alternative topography was generated using the same isostatic correction for modern ice-sheet unloading, but the flexural response to valley incision was reduced by a factor of 2 (i.e. equivalent to conservatively filling the fjords to only 50 % of their total relief). This allows for the likelihood that a certain (but unknown) fraction of the observed valley relief likely pre-dated (and was exploited by) glaciation. Aside from glacial fjord, trough, and valley incision and the associated isostatic response, the first-order topographic configuration of Greenland is unlikely to have been significantly altered since glacial inception (Alley et al., 2019). Although eastern Greenland may have experienced significant Neogene tectonic uplift (Japsen et al., 2013; Pedersen et al., 2012), any such uplift likely predated (and was potentially a key enabler of) ice-sheet nucleation (Japsen et al., 2014; Solgaard et al., 2013).
2.2.3 Climate forcing
Climatologically, ice-sheet extent and dynamics are highly sensitive to temperature and precipitation (e.g. Dolan et al., 2015; Golledge et al., 2008). Accurately reconstructing and modelling past temperature and precipitation patterns in Greenland is therefore a key community challenge (Haywood et al., 2016b). Given the high degree of uncertainty surrounding Greenland's palaeoclimate beyond the most recent glacial–interglacial cycles, we did not attempt a complex coupled general circulation atmosphere–ice-sheet model approach. Instead, we adopted a deliberately simplistic ice-sheet modelling strategy, whereby we performed experiments to identify broad-scale temperature and precipitation conditions that are (in-)capable of producing ice masses with extent and dynamics consistent with the mapped valley geomorphology along the southern and eastern highlands. We then assessed the implications of our findings for the chronology and timing of valley incision.
In our core experiments, we prescribed a range of simple temperature distributions defined by two parameters: the mean annual air temperature (MAAT) at sea level at 60° N (i.e. the southern tip of Greenland), and the latitudinal gradient (i.e. the rate at which temperature decreases moving northwards; Fig. 3a). For sea level MAAT at 60° N, we used 1 °C increments from 2 to 6 °C, representing a range of values higher than the modern-day average for this latitude (∼ −1 °C) (Noël et al., 2019). The modern latitudinal temperature gradient over Greenland is ∼ −0.8 °C ° N−1 (Noël et al., 2019); reduced polar amplification prior to the growth of a continental-scale ice sheet would most likely result in a weaker latitudinal gradient (Burls et al., 2021). We therefore used a range of gradients from −0.5 to −0.2 °C ° N−1 in 0.1 °C ° N−1 increments. We also assumed that temperature varies with altitude according to a constant moist atmospheric lapse rate of −6.5 °C km−1 (Kerr and Sugden, 1994) and tested the sensitivity of the model output to this choice using a stronger lapse rate of −8 °C km−1. The temperature field and surface mass balance were updated after every time step to account for changes in ice surface elevation (i.e. the ice–elevation feedback). On top of the MAAT values, we imposed a periodic annual cycle with an amplitude of ±10 °C, comparable to modern-day and inferred Pliocene annual variability (Ballantyne et al., 2010; Noël et al., 2019).
For precipitation, we used absolute values derived from the multi-model mean of the Pliocene Model Intercomparison Project Phase 2 (PlioMIP2) general circulation model output (Haywood et al., 2020). The multi-model mean precipitation is diminished over eastern Greenland due to the presence of a prescribed ice cap in the PRISM4 (Pliocene Research Interpretation and Synoptic Mapping) boundary conditions used in PlioMIP2 (Dowsett et al., 2016). To avoid circularity, this effect was removed by identifying the amplitude of the air temperature anomaly associated with the prescribed east Greenland ice cap and using a scaling of 5.5 % precipitation change per degree Celsius to adjust the multi-model mean precipitation (Nicola et al., 2023). The adjusted precipitation field is characterised by high rates in coastal areas of southeast Greenland (up to 2000 mm yr−1), decreasing to low rates (< 400 mm yr−1) in northern areas (Fig. 3b). For simplicity we assumed constant precipitation throughout the year. We did not use an ensemble of precipitation fields like for MAAT but instead tested the sensitivity of our results to precipitation by performing additional experiments with annual precipitation values 1 standard deviation below and above the multi-model mean (Haywood et al., 2020). Temperature and precipitation were used to calculate the surface mass balance (difference between accumulation and ablation). Accumulation is equal to precipitation when air temperatures are below 0 °C and decreases linearly to zero at temperatures above 2 °C. Ablation was computed using a positive degree-day (PDD) model, which integrates the time when temperatures are above 0 °C. We used the PISM default PDD factors, which are based on EISMINT-Greenland values (Winkelmann et al., 2011).
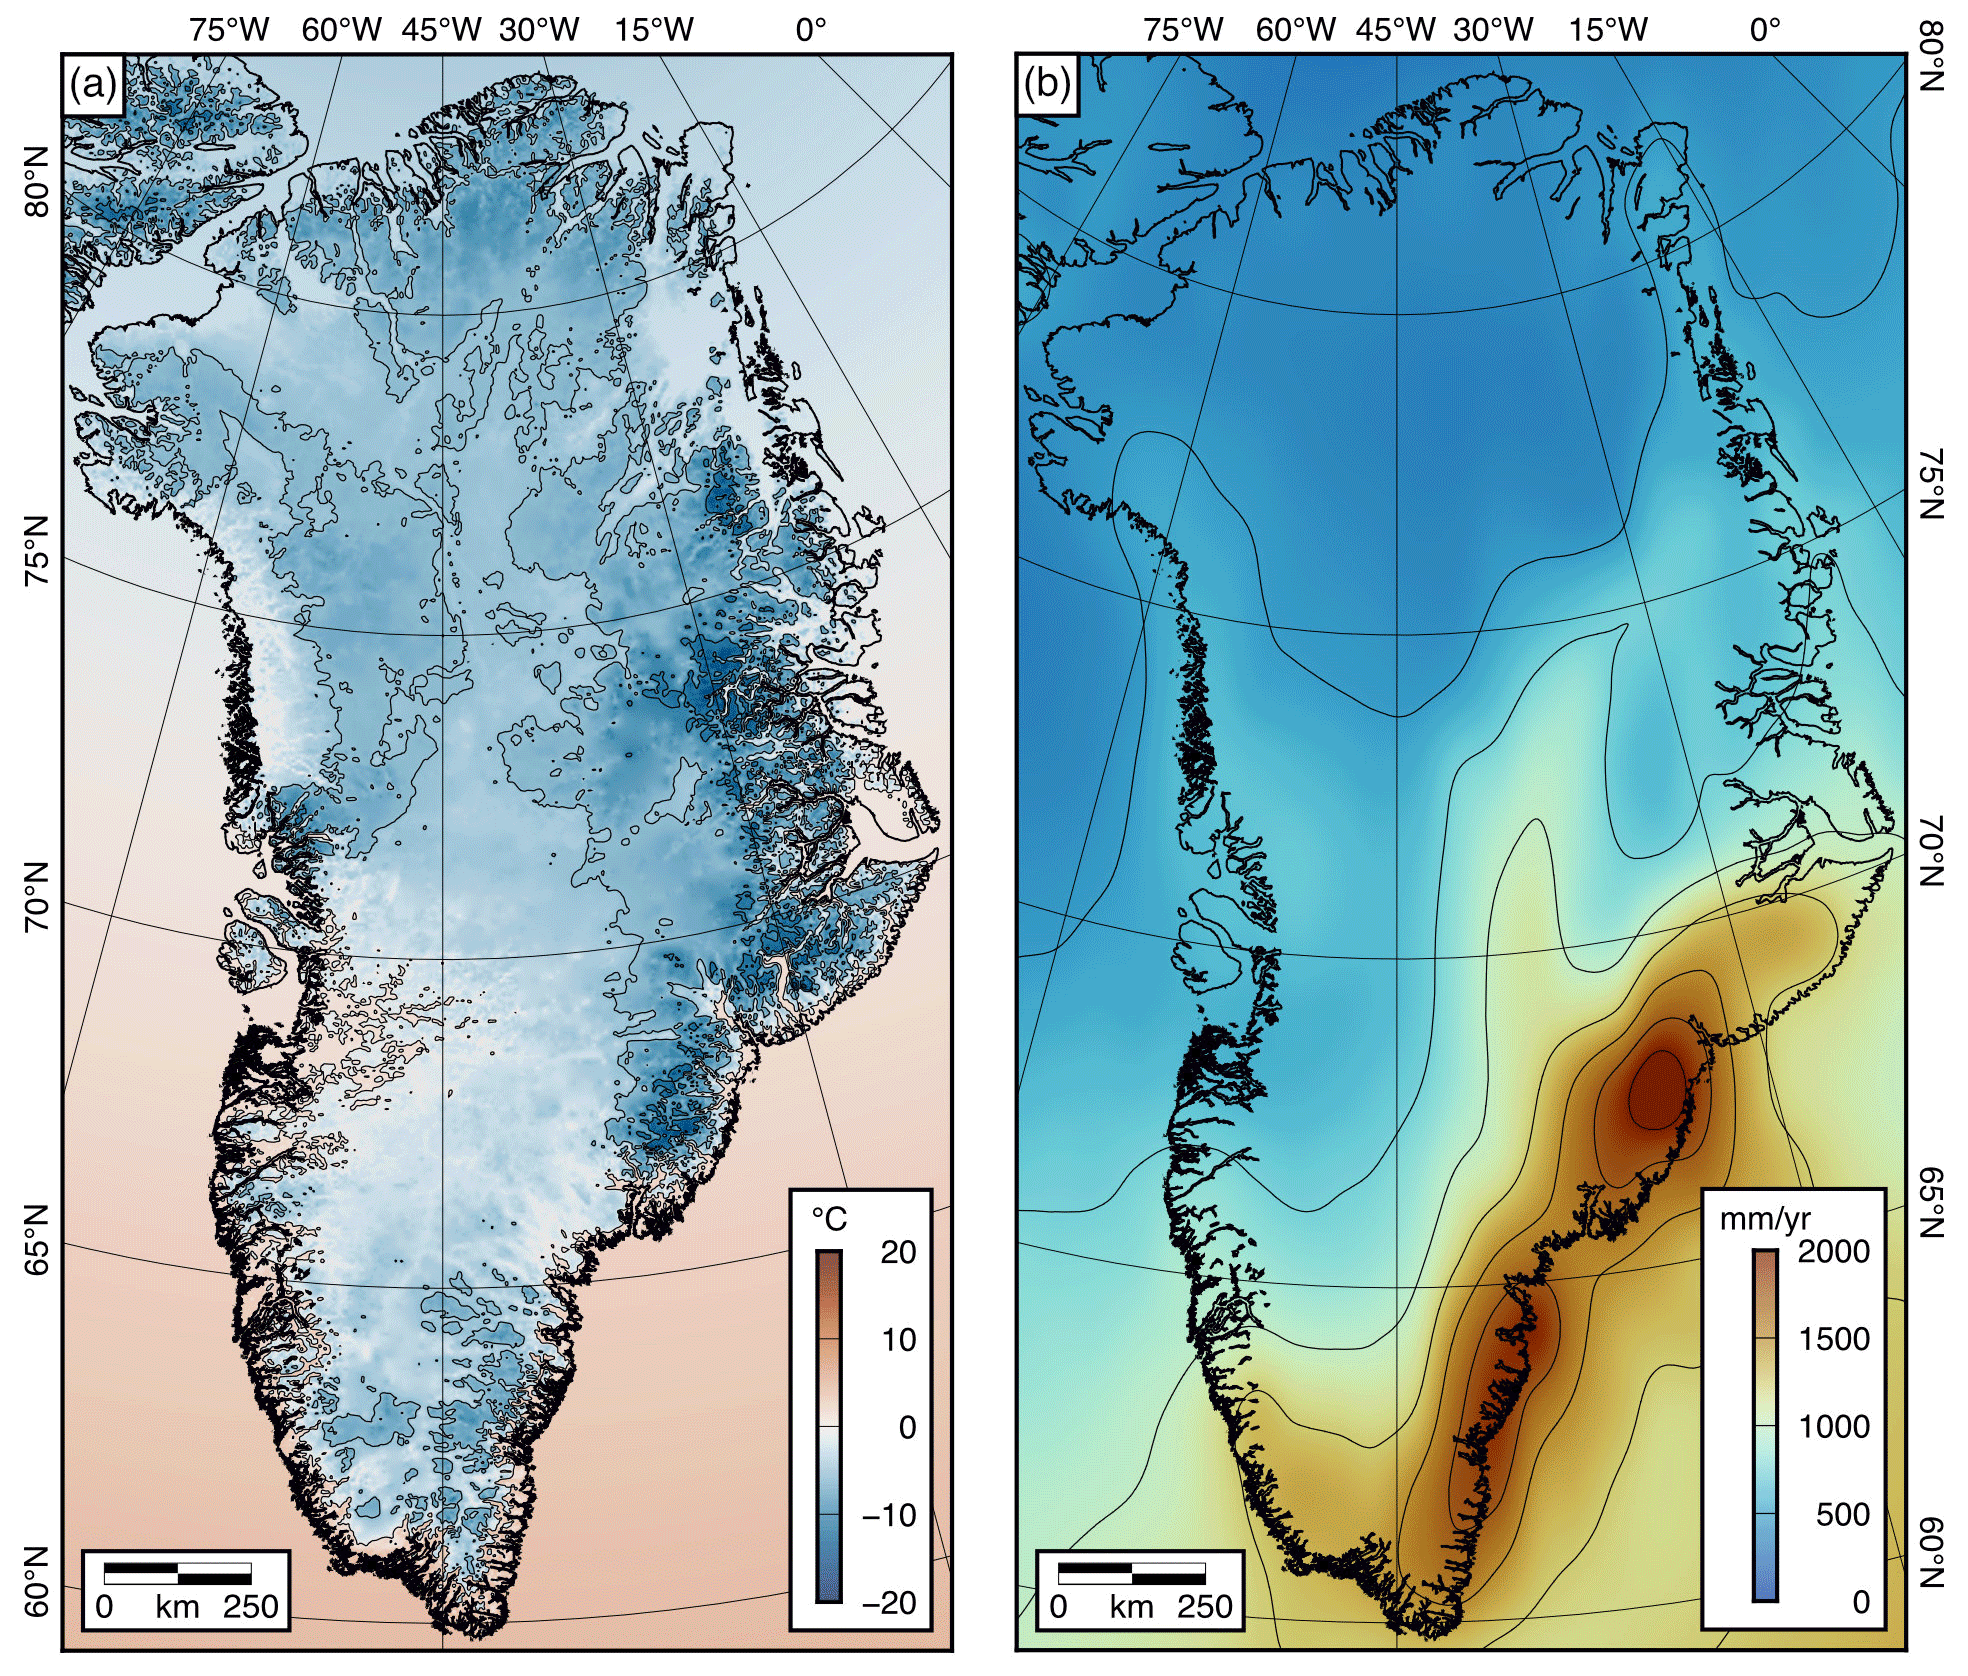
Figure 3Baseline temperature and precipitation for ice-sheet model experiments. (a) Example of a mean annual air temperature (MAAT) field. The MAAT field shown is one of an ensemble of 20 and was constructed assuming a MAAT of +4 °C at 60° N, a latitudinal gradient of −0.3 °C ° N−1, and a vertical lapse rate of −6.5 °C km−1. Contour interval is 5 °C. (b) Annual precipitation, derived from the PlioMIP2 multi-model mean and adjusted for the removal of the influence of ice on Greenland. Contour interval is 250 mm yr−1.
3.1 Subglacial valley networks
Using MODIS MoG imagery, we mapped over 300 subglacial valley segments along the length of the ice-covered highlands of southern Greenland (60–65° N) and eastern Greenland (66–78° N) (Fig. 4a). The valleys can be divided into two first-order categories: (i) those with a predominantly eastward orientation, which terminate at the modern-day ice margin or enter the fjord systems exposed along the North Atlantic coast, and (ii) those with a predominantly westward (inland-facing) orientation (Fig. 4). We traced a central divide separating these two groups of valleys that trends north–south along the spine of the highlands (Fig. 4).
MODIS MoG imagery also reveals that the valleys exhibit complex planform arrangements and often form interconnected networks with sinuous (Fig. 4b), branching/dendritic (Fig. 4c), and radial (Fig. 4d) structures. Some networks contain multiple distinct tributaries, whereas others exhibit a simpler structure with relatively few discernible tributaries (Fig. 4). We note that the ice surface morphology imagery will likely not capture basal topographic features on a scale smaller than the local ice thickness, so it is unlikely to resolve the narrower (sub-kilometre), lower-order tributaries within a valley network. In multiple locations, valleys are crosscut by present-day ice divides, and convergent tributaries join in a direction that is oblique to, or opposes, the modern ice flow direction (Fig. 4e).
The presence of these inferred subglacial valleys is confirmed by RES data (Fig. 4g), which show that the textural lineaments observed in the MODIS MoG imagery often correlate with subglacial valleys. A previous comparison of valley cross-profile morphology with glacial and fluvial valleys elsewhere in the Northern Hemisphere (Paxman, 2023a) indicates that 85 % of valleys within the highlands are classified as “glacial” in morphology (i.e. deep, wide, U-shaped, high curvature) and the remainder as “fluvial” (i.e. shallow, narrow, V-shaped, low curvature). Notably, however, the majority (∼ 72 %) of the “glacial” valleys are presently situated beneath ice that is either (a) likely frozen at the bed (i.e. cold-based) or (b) slow-flowing (< 50 m yr−1) with an uncertain basal thermal state (Figs. 4g, S2) (Joughin et al., 2018; MacGregor et al., 2022) and therefore likely non-erosive.
The orientations of the coast-facing valleys tend to be strongly aligned with the flow direction of the modern ice sheet (Fig. 5a) and the mean surface speed of the ice flowing through these valleys is 250 m yr−1 (Joughin et al., 2018) (Fig. 5b). By contrast, the inland-terminating valleys have a significantly lower mean ice surface flow speed of 20 m yr−1 (Joughin et al., 2018) (Figs. 4f, 5b) and are typically not aligned with contemporary ice flow; indeed there is a slight preferential misalignment of ∼ 180° (Fig. 5a), implying that ice commonly flows (slowly) up (rather than down) these valleys.
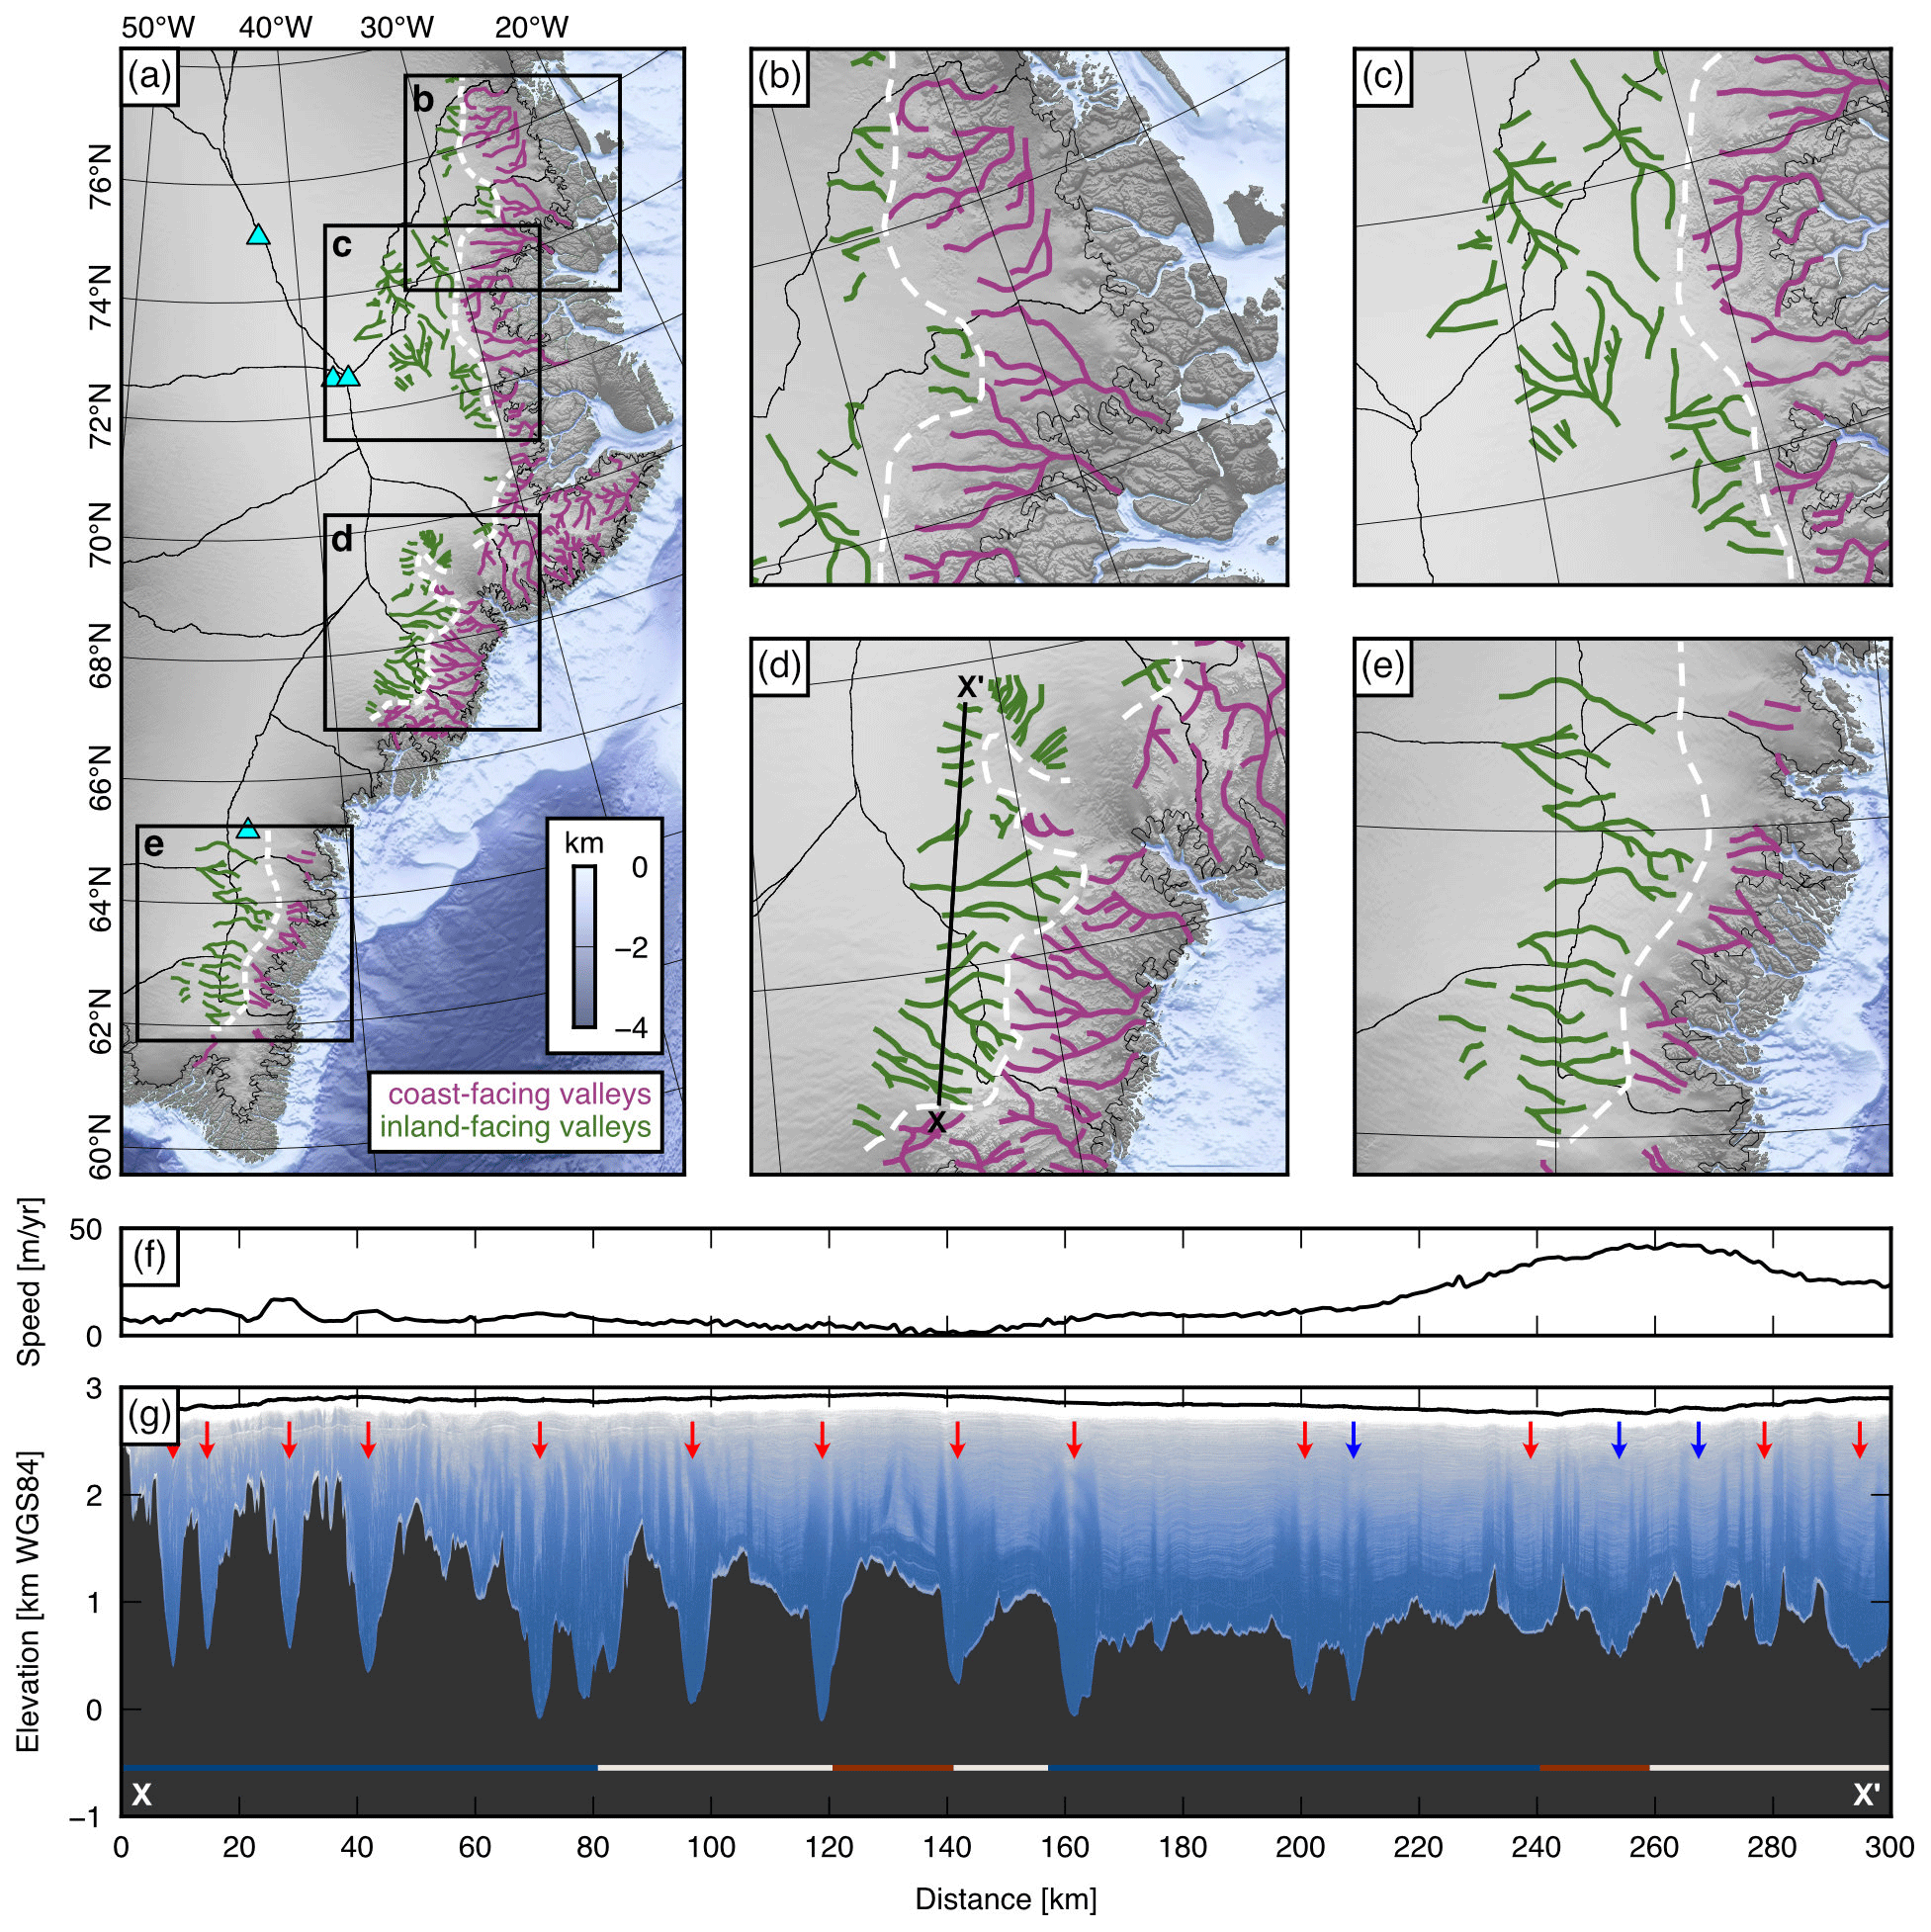
Figure 4Subglacial valleys in the eastern and southern highlands. (a) Valleys identified in MODIS MoG ice surface morphology imagery. Green lines denote inland-facing valleys; purple lines denote coast-facing valleys; dashed white lines delineate the divides between these valleys. Black lines show modern ice divides; blue triangles mark deep ice core sites. Greenland surface elevation is displayed in greyscale (Howat et al., 2022); offshore bathymetry according to the colour scale (Morlighem et al., 2017). (b–e) Valley networks within the four 400 km × 400 km areas indicated in panel (a). (f) Ice surface speed (Joughin et al., 2018) (sampled from Fig. S3a) along profile X–X′ over inland-facing valleys (location shown in panel d). (g) Ice-penetrating radargram along profile X–X′ (Operation IceBridge (OIB) flight segment 20170422_01). Arrows denote valleys identified in RES survey data (red is “glacial” classification; blue is “fluvial” classification) (Paxman, 2023a) that are correlated with lineations in MODIS MoG ice surface morphology imagery. Coloured bars denote the likely basal thermal state of the ice sheet (red is likely thawed; white is uncertain; blue is likely frozen) (MacGregor et al., 2022) (sampled from Fig. S3b).
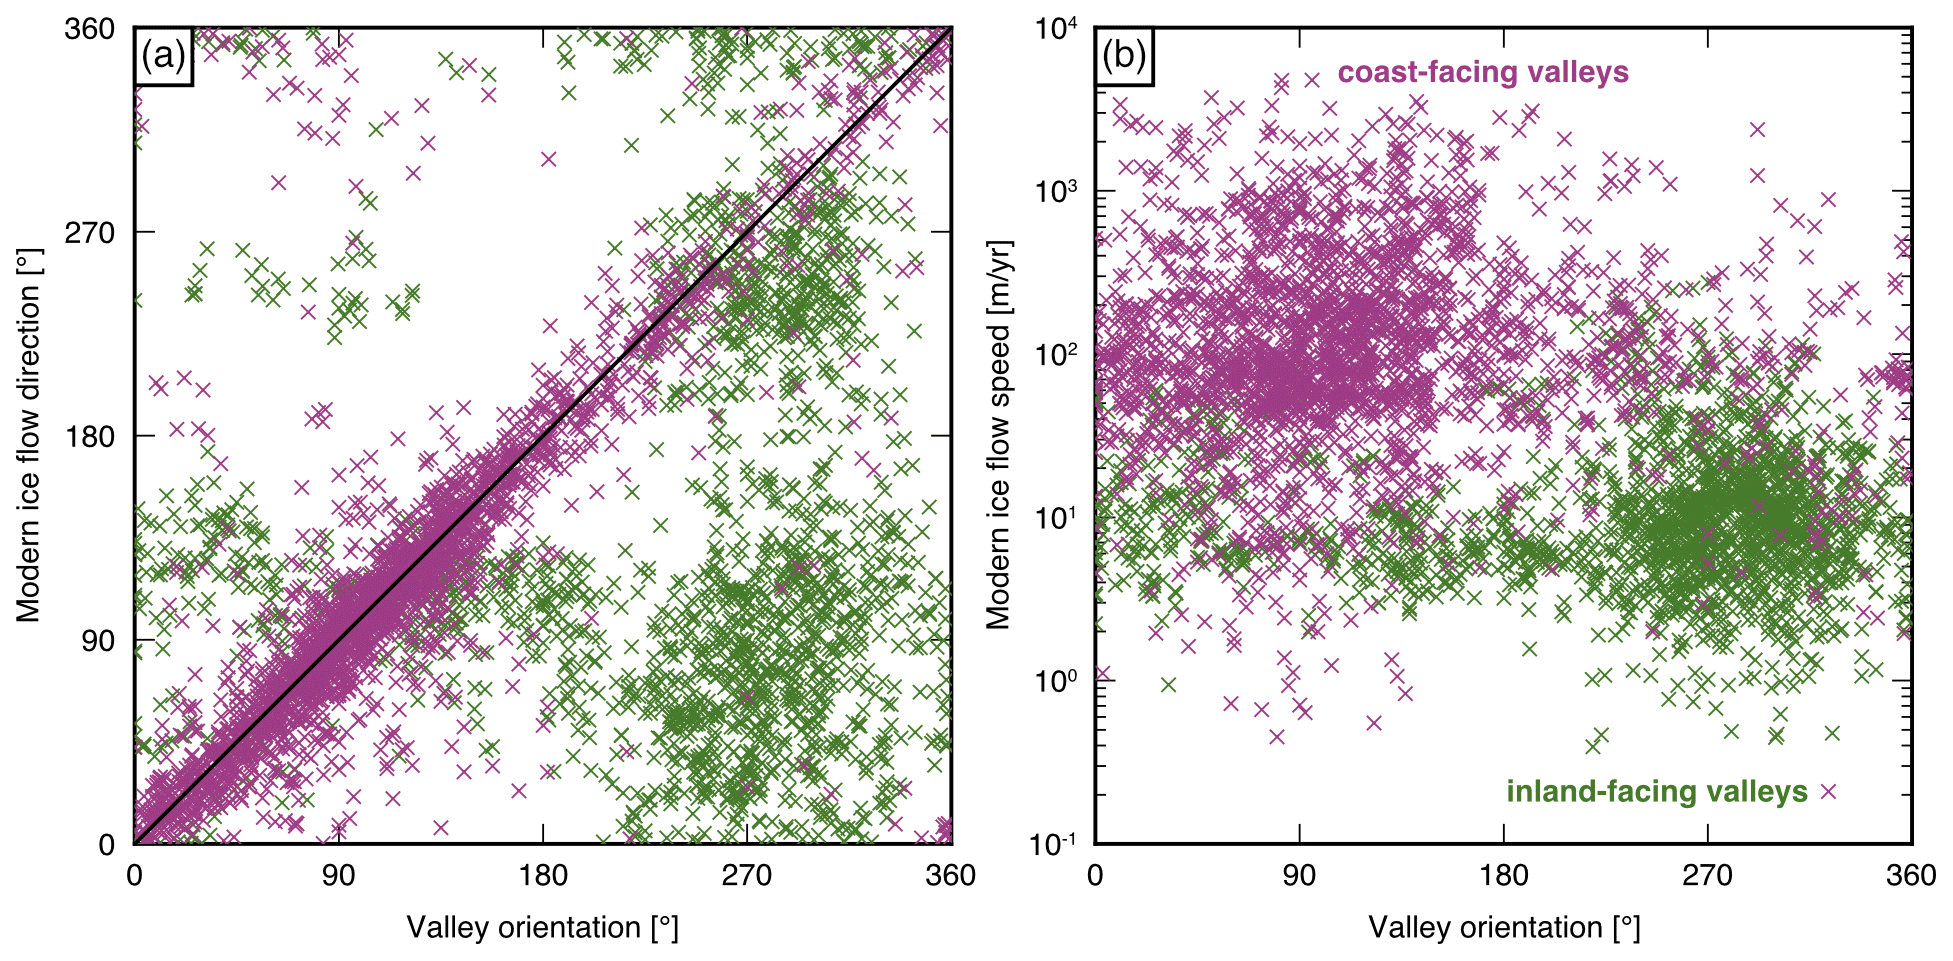
Figure 5Relationship between subglacial valleys and modern ice flow. (a) Valley orientation vs. modern ice surface flow direction (Joughin et al., 2018) for all inland-facing (green) and coast-facing (purple) valleys. Each symbol represents a point within the valley network; the horizontal spacing between adjacent points within all traced valleys is 2 km. Points where both orientations align will plot along the solid line. (b) Valley orientation vs. modern ice surface speed (Joughin et al., 2018).
RES data indicate that “glacial” valleys are densely clustered in the southern and eastern highlands, whereas “fluvial” valleys become more common further into the continental interior and in lower-lying gaps between the highlands (Fig. 6a). There is also a small, but non-negligible, fraction of “fluvial” valleys within the highlands, which varies between 20 % and 30 % in the southern highlands but is typically below 15 % in the eastern highlands (Fig. 6c). Another notable pattern in valley morphology is that the mean depth of “glacial” valleys in the southern highlands is ∼ 550 m compared to ∼ 980 m in the eastern highlands (Fig. 6b, d). This contrast is also apparent if only the ∼ 72 % of valleys that are not experiencing significant erosion beneath the modern GrIS are considered; the mean depths of this subset of valleys are ∼ 570 m in the southern highlands and ∼ 1040 m in the eastern highlands. Very few valleys in the southern highlands exceed 1 km depth, whereas many valleys in the eastern highlands exhibit depths of 1–2 km (Fig. 6b). A dichotomy is also observed between the depths of the “glacial” valleys on the inland and coastal sides of the highlands, with coast-facing valleys exhibiting a higher mean depth than inland-facing valleys (∼ 1070 m vs. 690 m), as well as a larger interquartile range (Fig. 6e).
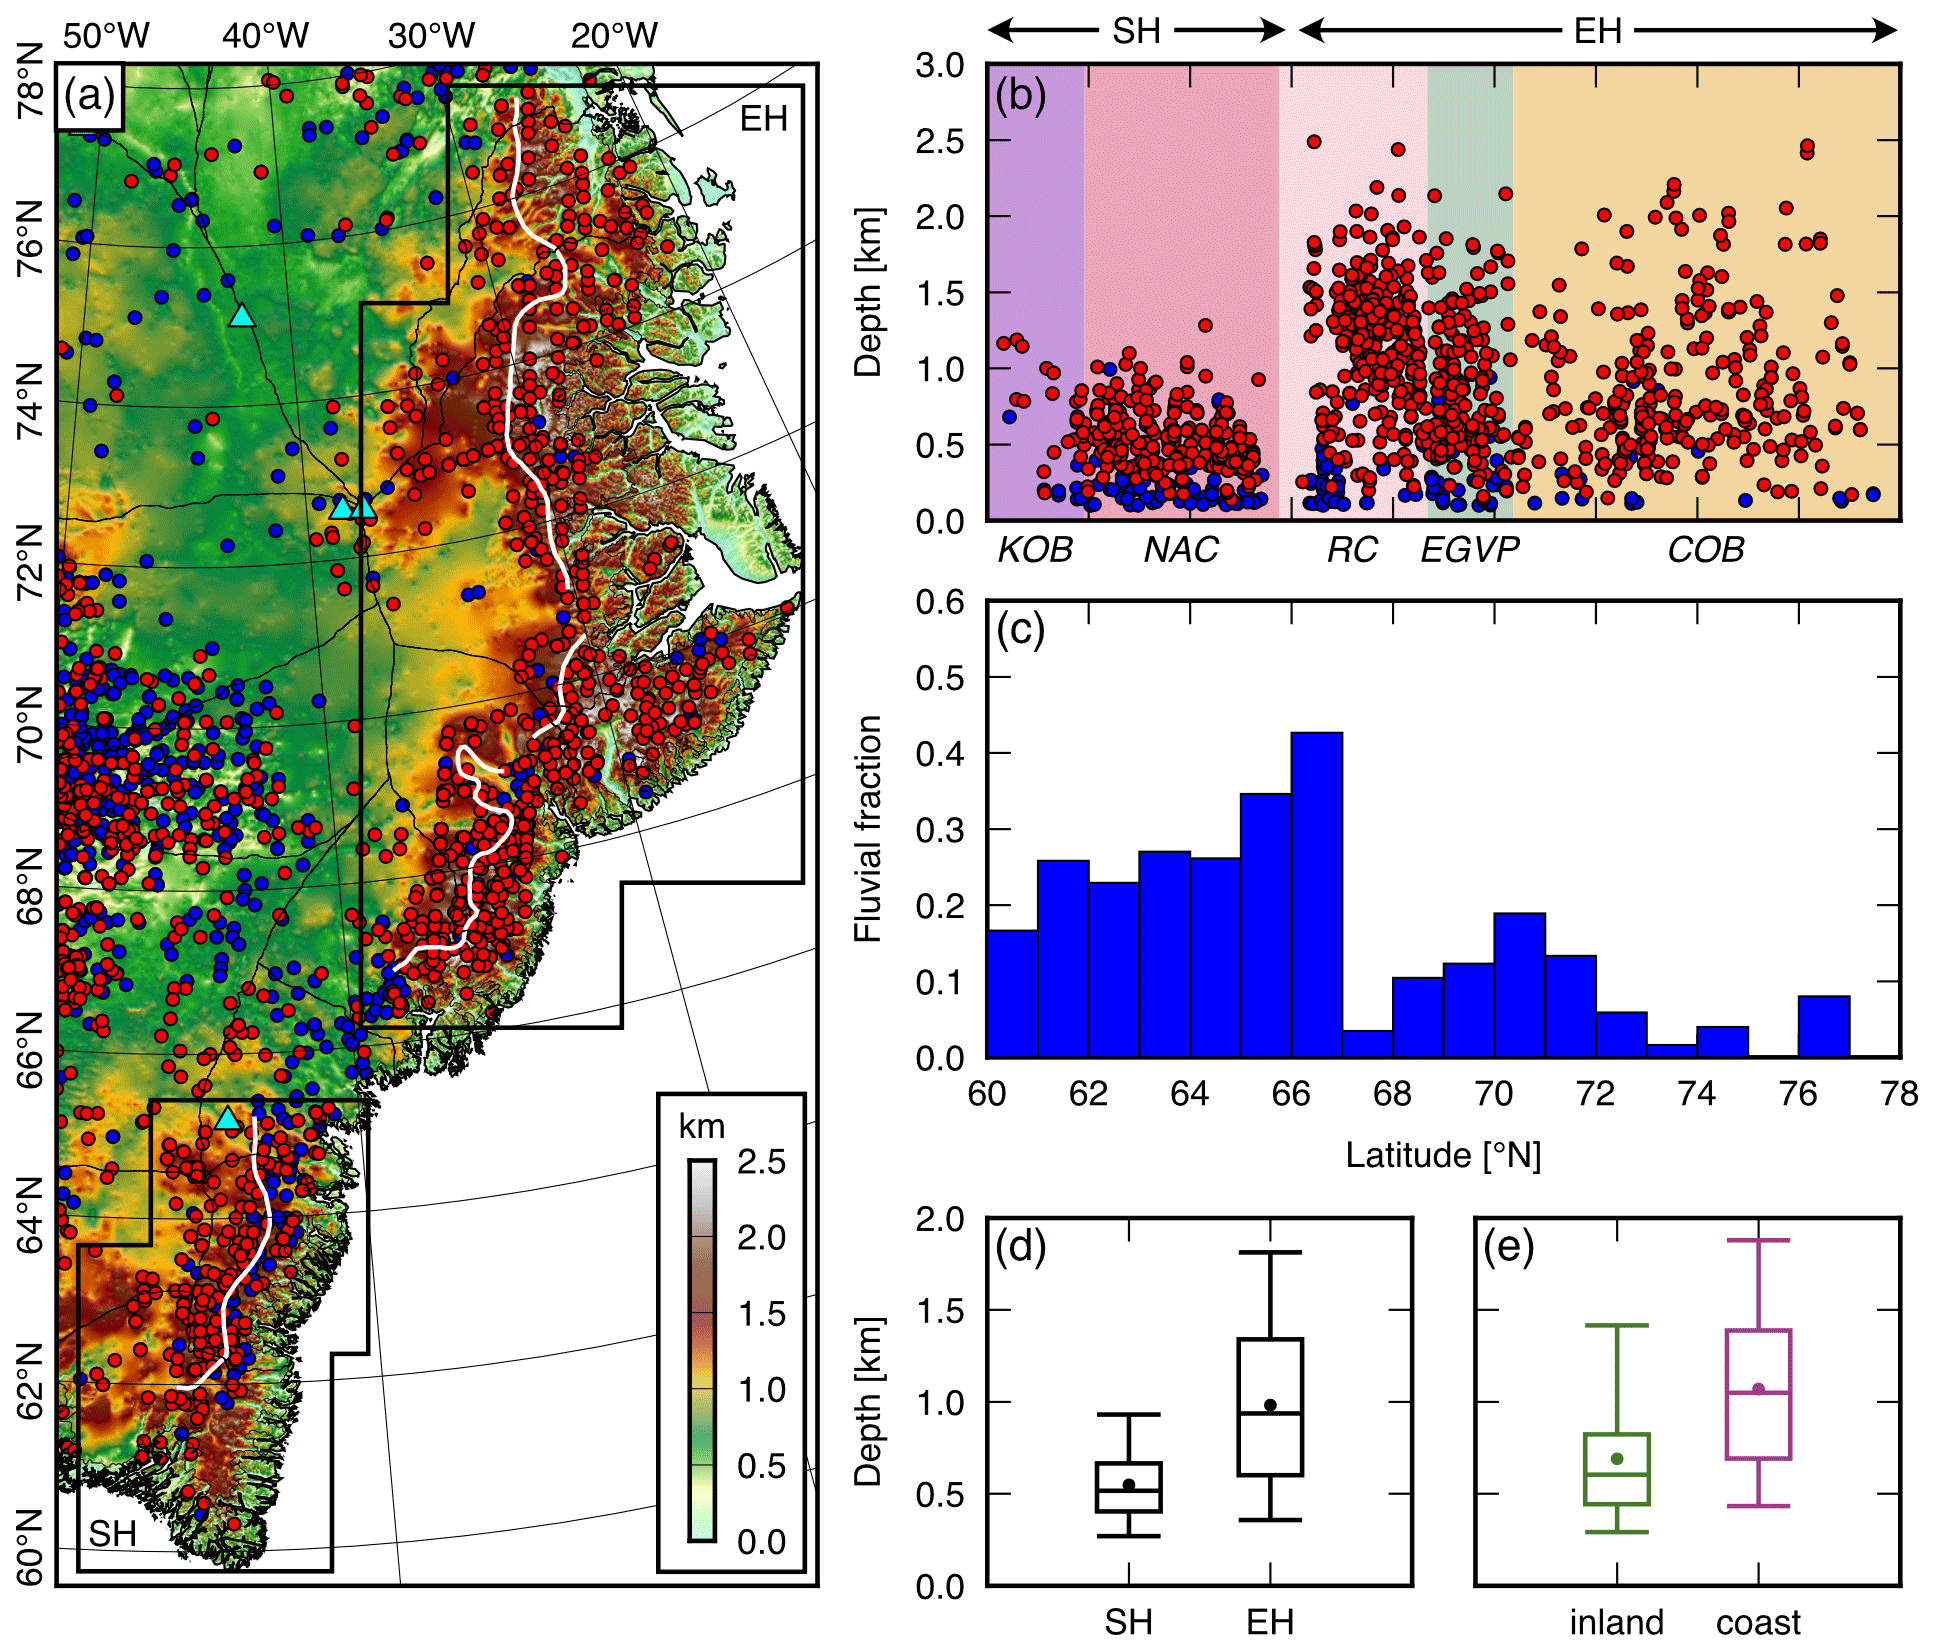
Figure 6Subglacial valley characteristics in the eastern and southern highlands. (a) Valleys identified from RES survey data (red is “glacial”; blue is “fluvial”). Valleys are overlain on the BedMachine v.5 onshore bed topography, which has been isostatically adjusted for the removal of the modern ice-sheet load (Morlighem et al., 2017; Paxman et al., 2022a). White lines are divides between coast- and inland-facing valleys; blue triangles mark deep ice core sites. (b) Variations in valley depth (i.e. ridge-to-floor relief) along the southern highlands (SH) and eastern highlands (EH). Geographic extents are shown by boxes in panel (a) and horizontal arrows in panel (b). Background colours denote first-order geological provinces, whose extents are shown in Fig. S1b; KOB is the Ketilidian Orogenic Belt; NAC is the North Atlantic Craton; RC is the Rae Craton; EGVP is the East Greenland Volcanic Province; COB is the Caledonian Orogenic Belt (Henriksen et al., 2009). (c) Fraction of valleys classified as “fluvial” within 1° latitudinal bins. (d) Boxplot of the depths of “glacial” valleys in the SH and EH. (e) Boxplot of the depths of inland- (green) and coast-facing (purple) “glacial” valleys within both the SH and EH.
The northern and southern limits of the valleys within the southern and eastern highlands are well-defined, with a distinct gap between 65 and 66° N. The western (inland) limit of the glacial valleys is also relatively well-defined in the MODIS MoG imagery, in which the inland-facing valleys often transition from clearly distinguishable to absent over a relatively short horizontal distance (Fig. 2). Surface features that are likely diagnostic of subglacial valleys are visible further inland, but these are more linear in planform and have previously been interpreted to reflect the upper reaches of palaeo-fluvial drainage pathways that extend from the inland foothills of the eastern highlands to the west coast (Cooper et al., 2016, 2019; Paxman et al., 2021). Similarly, RES data show a strong clustering of “glacial” valleys within the highlands, with a well-defined western margin, beyond which valleys are rarer and those that are observed are more commonly classified as “fluvial” (Paxman, 2023a) (Fig. 6). Good RES flight line coverage (Fig. S1a) and MODIS MoG imagery lacking in features in areas far from ice divides mean we are confident that the observed valley limit is not an artefact of data coverage. For the purposes of comparison with our ice-sheet model results, we constructed polygons demarcating the areas covered by the mapped mountain glacial valley networks, assuming that these valleys can be used to infer the approximate long-term average glacial limit at the time(s) of valley incision (Fig. 7). This exercise was most challenging along the eastern margin of the eastern highlands, where the limit of the mountain glacial valley networks is ambiguous due to the superimposition of the coastal fjord systems. For simplicity, we traced the eastern limit along the heads of the fjord systems, close to the modern ice margin (Fig. 7).
3.2 Simulations of mountain ice growth
Our ice-sheet modelling experiments show that the temperature field that yields an ice configuration that best matches the glacial valley limit in the eastern highlands is defined by a sea level MAAT of +4 °C at 60° N and a latitudinal MAAT gradient of −0.3 °C ° N−1 (Fig. 7m). These parameters yield a simulated ice sheet that covers a latitudinal range in strong agreement with the mapped valley limits and an inland margin positioned close to the inferred limit (Fig. 7m). The strength of the agreement was quantified by converting both the simulated ice extent and mapped glacial limit into binary fields (where 1 denotes the presence of ice and 0 the absence of ice). We computed the mean absolute deviation (MAD) between the two binary fields within a constant domain (Fig. 7e) as a measure of the spatial misfit (i.e. a lower MAD signifies a greater number of grid cells in which the model and geomorphological observations agree regarding whether ice is present or absent).
where Xi is 1 in grid cells where ice was present and 0 where ice was absent according to the mapped mountain glacial limit (Fig. 7), Yi is 1 in grid cells where ice is present and 0 where ice is absent in the given ice-sheet model experiment, and n is the number of grid cells in the domain.
The MAD confirms this combination of temperature parameters as producing the best-fitting modelled ice sheet in eastern Greenland (Fig. 7u) and also reveals that there is a trade-off between the sea level MAAT at 60° N and the latitudinal MAAT gradient, such that similarly good fits to the mapped glacial valley limit can be achieved via a combined increase in sea level MAAT at 60° N and a strengthening of the latitudinal MAAT gradient, or vice versa (Fig. 7u).
However, under the temperature scenario that yields the best match with the mapped glacial valley limit in the eastern highlands, the simulated ice extent in the southern highlands is more restricted than is implied by the valley limit (Fig. 7m). An ice mass that best matches the glacial valley limit in southern Greenland is obtained by decreasing the sea level MAAT at 60° N to +3 °C and steepening the latitudinal MAAT gradient to −0.4 °C ° N−1 (Fig. 7g). As for the eastern highlands, there is a trade-off between the two temperature parameters (Fig. 7v). Although high topography is also present in northern Greenland, ice here is absent or restricted to local-scale masses in most of our simulations owing to the low precipitation rates in this region (Figs. 3b, 7). Only under the lowest tested temperatures and steepest latitudinal gradients does the development of a large-scale ice sheet occur in northern Greenland (e.g. Fig. 7a).
Sensitivity testing indicates that increasing/decreasing the annual precipitation by 1 standard deviation from the multi-model mean increases/decreases the size of the modelled ice sheet by an amount approximately equivalent to that achieved by decreasing/increasing the MAAT by 1 °C (Fig. S4a–c). Increasing the atmospheric lapse rate to −8 °C km−1 predictably causes an increase in simulated ice extent, again by an amount comparable to that achieved by decreasing the MAAT by 1 °C (Fig. S4d). By contrast, bed topography and geothermal heat flux exert a relatively minor influence on the modelled ice-sheet geometry (Fig. S4e, f). The higher of the two bed topographies intuitively results in a slight increase in modelled ice volume due to the dependence of air temperature upon elevation (Fig. S4e). These sensitivity testing results, combined with the observed trade-off between sea level MAAT at 60° N and the latitudinal MAAT gradient (Fig. 7), suggest that reasonable uncertainty bounds are ±1 °C for the best-fitting sea level MAAT at 60° N and ±0.1 °C ° N−1 for the latitudinal MAAT gradient.
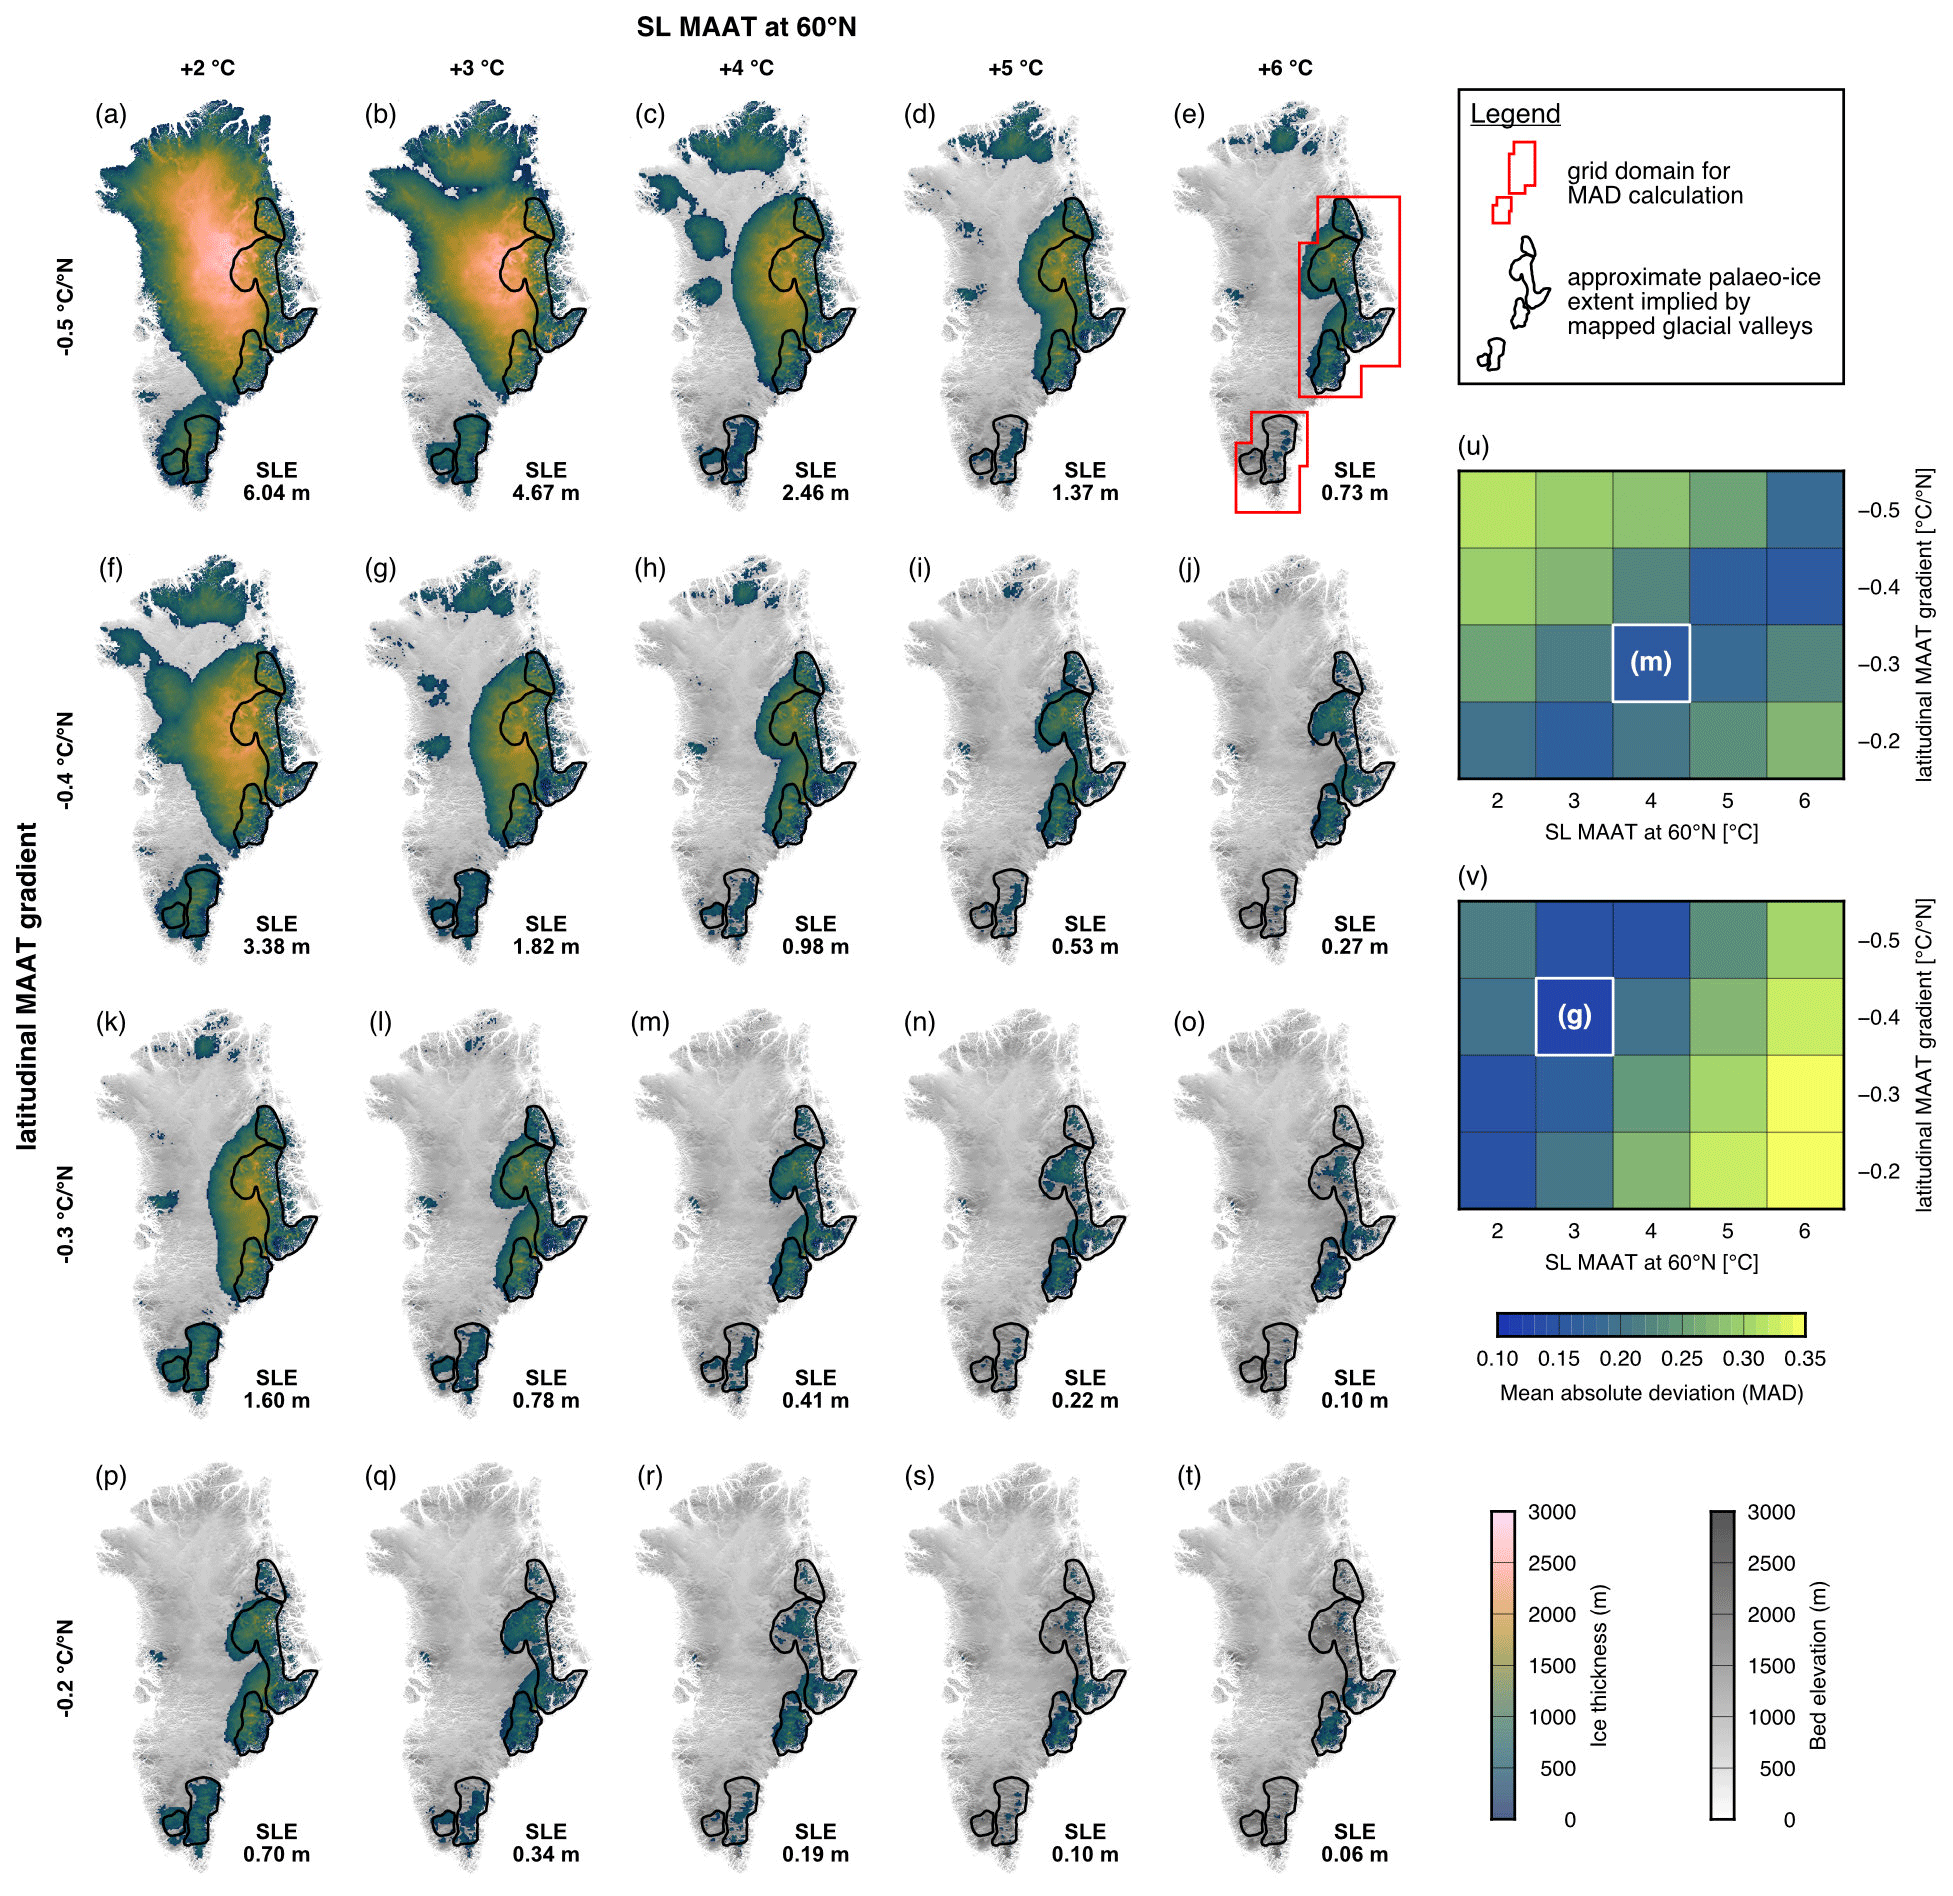
Figure 7Ice-sheet model ensemble results. Panels (a)–(t) show simulated steady-state ice thicknesses for a range of combinations of sea level MAAT at 60° N (columns) and the latitudinal MAAT gradient (rows). In each experiment, ice was grown from scratch on an ice-free palaeotopography (displayed in greyscale). Solid black outlines show the approximate palaeo-ice extent implied by the mapped valleys (Figs. 4, 6). The sea level equivalent (SLE) of each modelled ice sheet is labelled (modern GrIS SLE is 7.42 m). Panels (u) and (v) show the mean absolute deviation (MAD) between each simulated ice extent and the mapped mountain glacial valley limit for the eastern (u) and southern (v) highlands within the constant domains marked by the red boxes shown in panel (e). A lower MAD signifies greater domain-wide agreement between the model and geomorphological observations regarding whether ice is present or absent. The parameter combination that yields an ice configuration most consistent with the mapped glacial limit in the eastern highlands is a 60° N sea level MAAT of +4 °C and a latitudinal temperature gradient of −0.3 °C ° N−1 (m). For the southern highlands, a lower 60° N sea level MAAT of +3 °C and a steeper latitudinal gradient of −0.4 °C ° N−1 yield the smallest MAD (g).
Irrespective of the uncertainties associated with the assumed temperature and precipitation fields, our results demonstrate that ice masses with extents consistent with those implied by the mapped glacial valley networks can be simulated using a relatively simple numerical ice-sheet model set-up. A single latitudinal temperature gradient yields simulated ice masses that closely match the glacial valley limit along much of the eastern highlands, and a second, cooler temperature field yields a similarly good fit in the southern highlands. The ice masses that best fit the glacial valley limit in the eastern highlands contain a total volume of 1.7 × 10⁵ km3 and a sea level equivalent of 0.41 m (Fig. 7m), which is ∼ 6 % of that of the modern GrIS (7.42 m) (Morlighem et al., 2017). Given the trade-off between the two temperature parameters (Fig. 7u), a similarly good fit can be achieved for ice masses with sea level equivalents in the range 0.34 to 0.53 m (Fig. 7i, q). The modelled ice masses that yield the best fit in the southern highlands contain a larger volume of 7.3 × 10⁵ km3 and a sea level equivalent of 1.82 m, which is ∼ 25 % of that of the modern GrIS (with a range of 1.60–2.46 m; Fig. 7c, g, k, v). The implication is that at the time of valley incision in the eastern and southern highlands, barystatic sea level was significantly higher than today, with a Greenlandic contribution of between 5 and 7 m.
We stress that these values represent total Greenland ice volume under the best-fitting climate forcing scenarios. The scenario shown in Fig. 7g contains a greater ice volume than Fig. 7m not because the best-fitting southern highlands ice mass is larger than that of the eastern highlands, but because under the climate that best fits the glacial valley limit in the southern highlands, there is a substantial ice cap present in eastern Greenland and smaller bodies are also present in northern Greenland. Indeed, the sea level equivalent (SLE) of just the best-fitting ice mass in southern Greenland is 0.11 m. The combined SLE of the two best-fitting highland ice masses in isolation is therefore 0.52 m (∼ 7 % of that of the modern GrIS). We also note that because of the assumed palaeotopographic configuration, where we adjusted the topography for the flexural response to glacial valley and fjord incision but did not fill in the valleys themselves (Sect. 2.2.2), these modelled ice volumes are likely to be upper estimates, given that there is more accommodation space available within the valleys than may have been the case at the time of mountain ice growth. Conversely, given the limits in RES data coverage and model resolution, small-scale (< 10 km) basal roughness (which would increase the amount of accommodation space) will be poorly represented in our models.
For the best-fitting ice configurations (Fig. 7g, m), we performed additional high-resolution (5 km) simulations to examine the dynamics of the modelled ice masses in greater detail. These simulations produced ice masses of a similar configuration and thickness to (and with total volumes within ±5 % of) the lower-resolution (10 km) simulations (Fig. 8a, e), confirming that our first-order findings are not strongly dependent on model resolution. These high-resolution simulations show that ice flow is steered through the subglacial valleys, with flow directions consistent with the mapped valley networks and elevated ice surface velocities through many of the coast- and inland-facing valleys (Fig. 8b, f). Ice divides are established over subglacial ridges (Fig. 8b, f), with major drainage divides running north–south as is implied by the mapped valley network geometry (Fig. 4). Similarly, warm-based ice (which we defined as having a basal melt rate exceeding 10−4 m yr−1) is primarily located within valleys, whereas cold-based ice predominates within the interior of the ice masses that are situated over higher terrain (Fig. 8c, g).
Although a quantitative relationship between glacial dynamics and erosion rates remains difficult to establish, it is widely held that erosion predominantly occurs beneath warm-based ice and scales with the basal sliding velocity (Cook et al., 2020; Herman et al., 2015; Koppes et al., 2015). Thus, it is notable that basal sliding velocities are elevated within valleys but negligible over high terrain, indicating that erosion by these ice masses would have been strongly selective (Fig. 8d, h). These ice masses would therefore have been capable of preserving high topography (peaks and ridges) while contemporaneously incising the intervening valleys. We also note that modelled basal sliding velocity magnitudes are comparable in both the southern and eastern highlands, with the highest sliding velocities typically found on the coast-facing side of the highlands (Fig. 8d, h). The distributions of basal thermal state and sliding velocity are also more diffuse on the inland side of the highlands compared to the coastal side; this in part likely reflects the fact that many of the inland-facing valleys are not well resolved in the BedMachine digital elevation model due to poorer RES data coverage and the unsuitability of mass conservation techniques in (modern-day) slower-flowing areas, meaning simulated ice flow is not as strongly topographically focussed here as on the coastal side of the highlands.
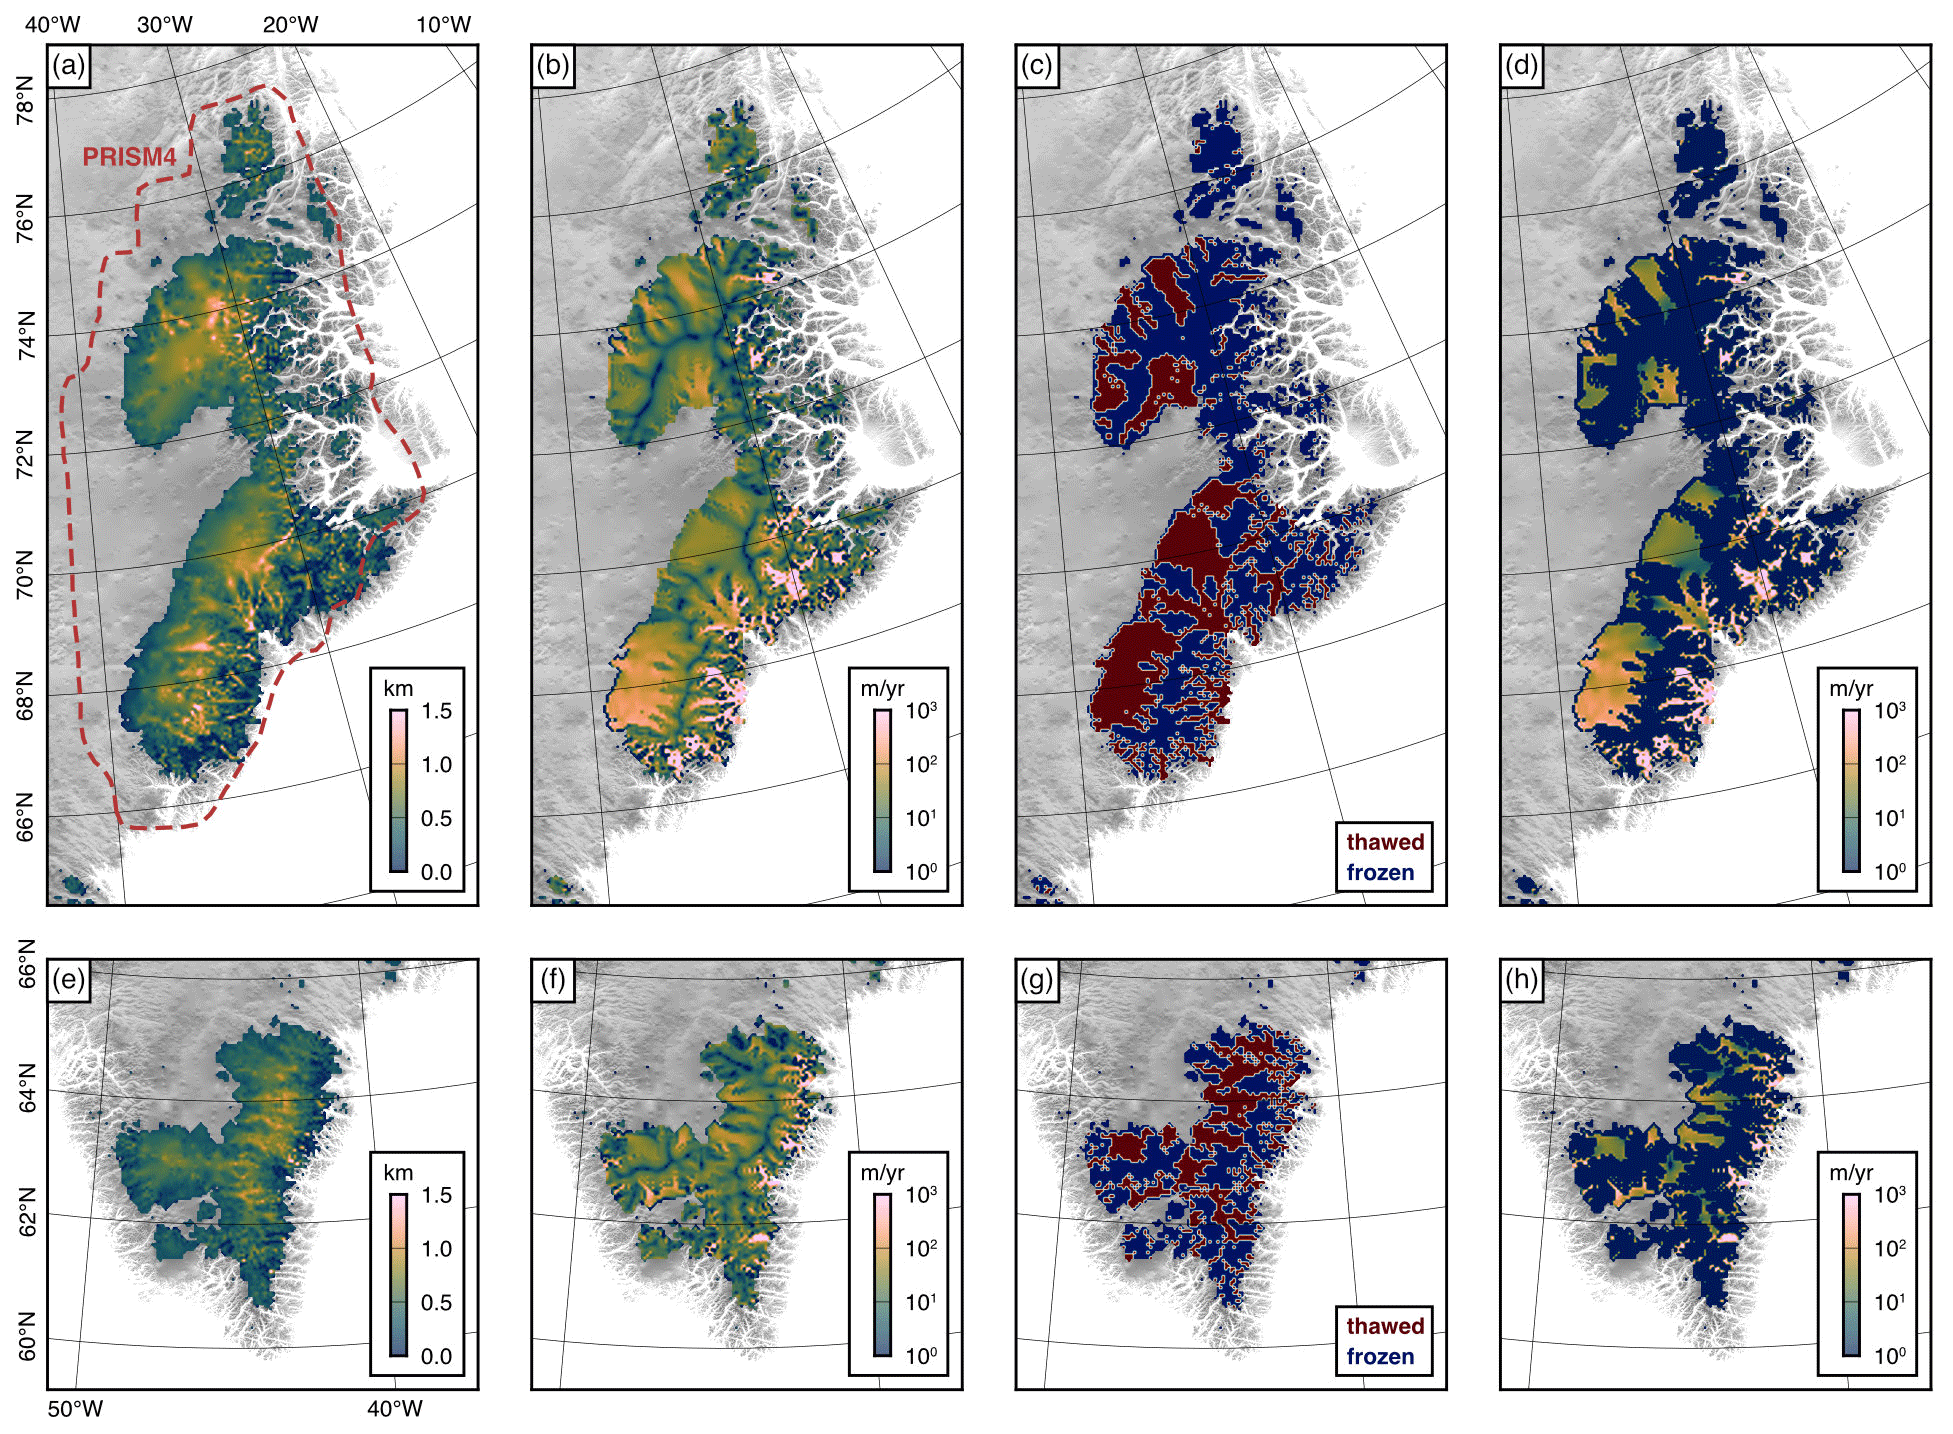
Figure 8Dynamics of the modelled ice masses in eastern and southern Greenland. The simulations shown were performed at 5 km resolution with an otherwise identical model set-up to the best-fitting ice configurations shown in Fig. 7m (eastern highlands; top row) and Fig. 7g (southern highlands; bottom row). (a, e) Ice thickness. (b, f) Ice surface velocity. (c, g) Basal thermal state (thawed is warm-based, frozen is cold-based). (d, h) Basal sliding velocity, which is a proxy for erosive potential. For comparison, the dashed red line in panel (a) marks the PRISM4 GrIS extent used in PlioMIP2 (note that PRISM4 assumed an absence of ice in the southern highlands) (Dowsett et al., 2016; Haywood et al., 2016b).
4.1 Origin and development of valley networks in the eastern and southern highlands
Despite predominantly resembling glacial valleys in their cross-profile morphology (Paxman, 2023a), the valley networks we have mapped in the highlands of eastern and southern Greenland show several characteristics that are inconsistent with formation beneath the modern continental-scale ice sheet. Many valleys are situated beneath modern slow-moving, cold-based ice, particularly the inland-facing valleys on the western side of the highlands (Figs. 4f, g, 5b). Additionally, valley planforms commonly exhibit intricate structures including sinuous, dendritic, and radial drainage patterns (Fig. 4) that are indicative of convergent/divergent flow through valleys with orientations that are often inconsistent with the modern ice surface velocity field (Fig. 5a), which overrides the landscape. The observation that numerous valleys are crosscut by modern ice divides (Fig. 4) also indicates that these valleys were not incised by the modern GrIS or by subglacial meltwater at its base. These valley patterns are more consistent with formation by fluvial and/or local-scale glacial erosion. The overall fraction of “fluvial” valleys within the highlands is 15 %, with higher fractions of 20 %–30 % in the southern highlands (Fig. 6c), indicating that elements of a fluvial landscape have been preserved since glacial inception, most likely facilitated by the long-term presence of cold-based, slow-flowing ice, as is present in the centre of our simulated ice masses (Fig. 8). We therefore surmise that the mapped valleys most likely represent inherited pre-glacial fluvial networks that were exploited and erosively modified by topographically steered valley glaciers, as part of a smaller ice field earlier in Greenland's glacial history. Modern-day analogues for the inferred palaeoenvironment include locations characterised by topographically steered valley glaciers emanating from central ice fields, such as south Patagonia and British Columbia, Yukon, and Alaska.
The mapped extent and geometry of the palaeo-glacial valleys may therefore reflect the approximate long-term average configuration and dynamics of the former ice mass(es) responsible for their incision (Porter, 1989). However, rather than reflecting a former limit of erosion, an alternative hypothesis is that the distribution of the palaeo-glacial valleys is governed by the modern distribution of non-erosive (i.e. cold-based) ice and instead reflects a limit of long-term preservation. The comparison of the observed valley network limits with the estimated likely basal thermal state of the modern GrIS (MacGregor et al., 2022) indicates that, other than at the northern end of the eastern highlands and in the gap between the eastern and southern highlands, the mapped valley limit does not coincide with an abrupt transition from cold- to warm-based ice (Fig. S3b), as would be expected if this limit reflected the extent of landscape preservation by current and former comparable continental-scale ice sheets. Indeed, cold-based, slow-flowing ice extends hundreds of kilometres inland of the limit of the palaeo-glacial network along much of the eastern highlands (MacGregor et al., 2022) (Fig. S3), suggesting it is unlikely that the observed valley network is the remainder of what was once a much wider signal that was partially removed by subsequent ice-sheet-scale erosion. This conclusion is also supported by the observation that the landscape further into the Greenlandic interior often appears to more closely resemble those of fluvial systems (Bamber et al., 2013; Cooper et al., 2016; Paxman et al., 2021; Paxman, 2023a), hinting at long-term landscape preservation.
A notable observation is that “glacial” valleys in the eastern highlands are on average almost twice as deeply incised as those in the southern highlands (Fig. 6b, d). This implies that southern Greenland has experienced a lesser amount of glacial incision integrated over its history than eastern Greenland. Two potential hypotheses to account for this observation are (i) a lithologically controlled difference in bedrock erodibility and (ii) a differing glacial history, for example a shorter overall duration of erosive mountain-scale glaciation or a lower average mass turnover (i.e. slower glacier velocities and lower incision rates) in southern Greenland than eastern Greenland.
Geologically, southern Greenland comprises (moving from south to north) the Ketilidian Orogenic Belt (Palaeoproterozoic metasediments and granitoid intrusions deformed during the Palaeoproterozoic Ketilidian Orogeny) and the North Atlantic Craton (Archaean granitic gneiss) (Fig. S1b) (Henriksen et al., 2009). The highlands of eastern Greenland span (from south to north) the Rae Craton (Palaeoproterozoic with reworked Archaean granitic gneiss), the East Greenland Volcanic Province (Palaeogene basalt and mafic intrusions), and the Caledonian Orogenic Belt (Mesoproterozoic metasediments deformed during the Silurian Caledonian Orogeny) (Fig. S1b) (Henriksen et al., 2009). Notably, the North Atlantic Craton (south Greenland) and Rae Craton (east Greenland) are geologically similar and would therefore be expected to be characterised by a similar hardness and erodibility (Campforts et al., 2020) but show a strong contrast in valley incision depth (Fig. 6b). Moreover, despite the significant geological variation along the eastern highlands, average and maximum valley depths remain comparable along the full length of the mountain chain and consistently deeper than those in the southern highlands (Fig. 6b). These observations indicate that lithology is not a significant control on the spatial variations in valley depth, which may instead be attributable to a contrasting glacial history between the southern and eastern highlands. We suggest that the apparent upper limit of ∼ 2 km on valley depths in the eastern highlands (Fig. 6b) may reflect negative feedbacks related to sediment evacuation that act to slow and stabilise the depth of glacial overdeepenings (Patton et al., 2016).
Our ice-sheet model ensemble results show that in all simulations which exhibit ice growth in the southern highlands there is always ice present in the eastern highlands, but the same is not true in reverse (Fig. 7). Glaciation of the southern highlands requires a cooler island-wide temperature field than the eastern highlands despite the higher modelled precipitation rates (Fig. 3b), owing to the higher temperatures at lower latitudes (Fig. 3a) and the lower maximum altitude of the southern highlands compared to the eastern highlands (Morlighem et al., 2017). Given that the southern highlands are less likely to be glaciated than the eastern highlands (Fig. 7), it follows that they have likely experienced a shorter duration of glacial incision integrated over Greenland's history, accounting for the lower average valley depths. This would also account for the greater incidence of preserved palaeo-fluvial valleys in the southern highlands (Fig. 6c).
An alternative scenario is that the eastern and southern highlands were occupied by erosive mountain ice for similar durations of time, but the ice in eastern Greenland was associated with higher rates of mass turnover (and therefore greater basal sliding velocities and erosion rates). However, this possibility can likely be discounted because the elevated palaeo-precipitation rates in southern Greenland that are consistently indicated by general circulation models (Fig. 3b) would likely result in higher rates of mass accumulation and turnover here than in eastern Greenland (all other things being equal). Moreover, our ice-sheet simulations do not show a clear difference in modelled ice surface or basal sliding velocities between the southern and eastern highlands (Fig. 8). Therefore, while ice growth and mountain glacial valley incision may have occurred nearly simultaneously along the full length of the eastern highlands (66–78° N) under a single latitudinal temperature gradient (Fig. 8a), we suggest that this pre-dated glaciation in southern Greenland and/or that mountain glaciation in southern Greenland was shorter lived or more intermittent due to a warmer climate and lower average topography.
The observation that coast-facing valleys are deeper on average than inland-facing valleys (Fig. 6e) is also indicative of a contrasting incision history between these two groups of valleys. Having discounted a major role for geological variability along the highlands, this second dichotomy may reflect (a) contrasting inherited (pre-glacial) valley depths and/or (b) a contrasting glacial incision history. Given the origin of the eastern and southern highlands via passive margin uplift following North Atlantic breakup (Japsen et al., 2014; Bonow et al., 2014), fluvial valleys on either side of the central drainage divide would have responded to continental separation and uplift by incising down to base level. Given their proximity to the coast, antecedent rivers on the east side of the highlands would be expected to have cut deep valleys through the uplifting margin to depths close to sea level, whereas antecedent rivers on the western side of the highlands would have been located several hundred kilometres up-catchment of their own base level (i.e. the west coast) and thus would not have been driven to incise such deep valleys (Beaumont et al., 2000; Cockburn et al., 2000). Although these valleys will have been subsequently excavated and overdeepened by valley glaciers, an inherited disparity in their depths either side of the drainage divide may have survived to the present day.
This scenario does not preclude the possibility that the coast-facing valleys have also experienced a greater amount of incision beneath fast-flowing, warm-based ice integrated over Greenland's glacial history. For example, both coast- and inland-facing valleys may have been incised during early mountain-scale glaciation, and subsequent continental-scale ice sheets may have contemporaneously preserved the inland-facing valleys beneath cold-based ice (Bierman et al., 2014; MacGregor et al., 2022) while continuing to incise and deepen the coast-facing valleys that were ideally oriented for exploitation by the warm-based, fast-flowing outlet glaciers that drain outwards from the modern ice-sheet interior (Figs. 5, S2a) (Joughin et al., 2018). A similar hypothesis has also been proposed to explain the asymmetric incision depths observed on the coast- and inland-facing sides of the conjugate Norwegian glaciated passive margin (Hall et al., 2013; Kleman et al., 2008). Faster basal sliding velocities on the coastal side of the highlands during mountain-scale glaciation (Fig. 8), which likely resulted from an increased maritime influence on the climate on the eastern side of the highlands (i.e. elevated precipitation and mass turnover rates; Fig. 3b), could have also contributed to a disparity in palaeo-incision rates (Cook et al., 2020; Seguinot and Delaney, 2021). A caveat attached to this explanation is that our models may underestimate the basal sliding velocities (and therefore erosion potential) of the inland-facing valleys because many of these features are not well resolved in BedMachine. Some or all of these mechanisms may have worked in concert to leave the coast-facing valleys deeper on average than those on the inland side of the highlands.
4.2 Timing of mountain glacial valley incision
While we have ascertained that the landscape of the eastern and southern highlands was significantly modified during one or more earlier phases of restricted, mountain-scale glaciation, the age of these event(s) cannot be easily determined from the onshore geomorphology alone. In this section, we explore whether our geomorphological mapping and ice-sheet modelling results can be combined with the findings of previous studies to constrain the timing and chronology of mountain valley glaciation in eastern and southern Greenland.
A challenge in addressing this question is that ice sheets and their underlying landscapes are continually evolving; subglacial topography does not reflect a single “definitive past configuration” of the ice sheet but is instead better thought of as a palimpsest produced during several glacial stages (Kleman, 1994). Such a landscape may therefore broadly relate to average glacial conditions over multiple glacial cycles (Porter, 1989), although this does not necessarily mean that the topography can be used to directly infer the historical mean or modal glacial conditions (Spagnolo et al., 2022). However, the presence of well-developed and morphologically consistent palaeo-glacial valley networks along the southern and eastern highlands of Greenland does suggest that ice likely occupied these regions in a configuration conducive to the incision of these valley networks for a protracted time span. This configuration may not have existed for a single continuous episode but instead during repeated intervals within a longer window of time, given the sensitivity of mountain glaciers to (e.g. orbital) climate variability. Here we focus on a series of time intervals pertinent to Greenland's glacial history and assess the relative likelihood of the valleys having experienced significant and repeated phases of incision during these times.
4.2.1 The Last Interglacial
The most recent time interval when the GrIS was potentially significantly diminished in extent relative to today is the Last Interglacial (Eemian; MIS 5e; ca. 125 ka), when global mean surface temperatures were 1.5–2 °C higher than during the current interglacial period (Clark and Huybers, 2009). Although ice loss at this time was likely non-negligible, numerical ice-sheet models consistently predict that the Eemian GrIS still covered much of central Greenland (Fig. 9a), and global sea level records do not require an extensive loss of ice from Greenland at this time (Dutton et al., 2015). The identification of Eemian ice in northern Greenland via glacial radiostratigraphy (MacGregor et al., 2015) and in the NEEM, GRIP/GISP2, and DYE-3 deep ice cores (Dahl-Jensen et al., 2013; Suwa et al., 2006; Yau et al., 2016) supports this view and argues in favour of the persistence of a significantly more extensive ice sheet at this time than the restricted ice masses that are likely to have incised the palaeo-glacial valleys in eastern and southern Greenland (Fig. 8).
4.2.2 Pleistocene “super-interglacials”
Cosmogenic nuclide analysis from sediment and bedrock obtained via sub-ice drilling at GISP2 and Camp Century (Fig. 1b) indicates that at least one episode of major ice loss occurred in Greenland at or since ca. 1.1 Ma (Christ et al., 2021; Schaefer et al., 2016), perhaps corresponding to one or more particularly warm and/or long-lasting interglacial periods such as MIS 11 (ca. 430–400 ka) or 31 (ca. 1.09–1.06 Ma). Ice retreat simulations indicate that deglaciation of the Camp Century site (northwest Greenland; Fig. 1b) during MIS 11 would require loss of at least ∼ 20 % of the GrIS (Christ et al., 2023), while an ice-free GISP2 site would necessitate reduction in the GrIS to < 10 % of its current volume, restricted to isolated ice caps in the eastern and/or southern highlands (Fyke et al., 2014; Schaefer et al., 2016). These ice core sites are both ice-free in our best-fitting ice-sheet simulations (Fig. 9). Although the exact chronology remains uncertain, it is therefore plausible that during the most prominent Pleistocene interglacials (e.g. MIS 11 and 31) the GrIS could have been restricted to a configuration capable of the incision of the mapped palaeo-glacial valley networks (Figs. 4, 8).
However, an important question is whether the ice sheet existed in this restricted state for a sufficiently long period(s) of time to account for observed valley depths of 1–2 km. Even allowing for an upper estimate for the combined duration of the MIS 11 and 31 interglacial peaks of ∼ 50 kyr (de Wet et al., 2016) and an assumption that half of the observed valley relief pre-dated glaciation, this would necessitate average erosion rates of ∼ 10–20 mm yr−1 to account for the incision of the valleys during these intervals alone. While estimating long-term glacial erosion rates from ice-sheet model output remains highly uncertain, using modelled basal sliding velocities of ∼ 100 m yr−1 (Fig. 8d, h) in a variety of empirical glacial erosion “laws” (Cook et al., 2020; Herman et al., 2015; Koppes et al., 2015) gives expected erosion rates on the order of ∼ 2 mm yr−1 within the valleys. The latter value is also more consistent with the typical range associated with alpine and polar glaciers (Koppes and Montgomery, 2009; Patton et al., 2022). Moreover, MIS 11 simulations suggest that while the GrIS was much diminished, basal ice remained below the pressure melting point across much of the remaining ice cap (Robinson et al., 2017), helping to preserve the landscape at GISP2 beneath cold-based, non-erosive ice (Bierman et al., 2014). The restricted ice caps present during Pleistocene “super-interglacials” may therefore have contributed to the incision of the valley networks in eastern and southern Greenland but were likely insufficiently long-lived or erosive to fully account for the observed relief of these features.
Moreover, isostatic calculations indicate that glacial valley and fjord incision in the near-coastal regions of eastern Greenland must have primarily occurred prior to ca. 2.5 Ma (Pedersen et al., 2019). This is because incision of these deep valley and fjord systems would be expected to have driven hundreds of metres of flexural uplift of the adjacent coastal areas via erosional unloading, but late Pliocene–early Pleistocene (ca. 2.5 Ma) shallow marine sediments are exposed along the shoreline and have not experienced significant uplift (Pedersen et al., 2019). This indicates that fjord incision and concomitant isostatic adjustment must have largely pre-dated the deposition of these sediments, pointing towards selective glacial valley and fjord incision having largely occurred prior to the Quaternary in eastern Greenland.
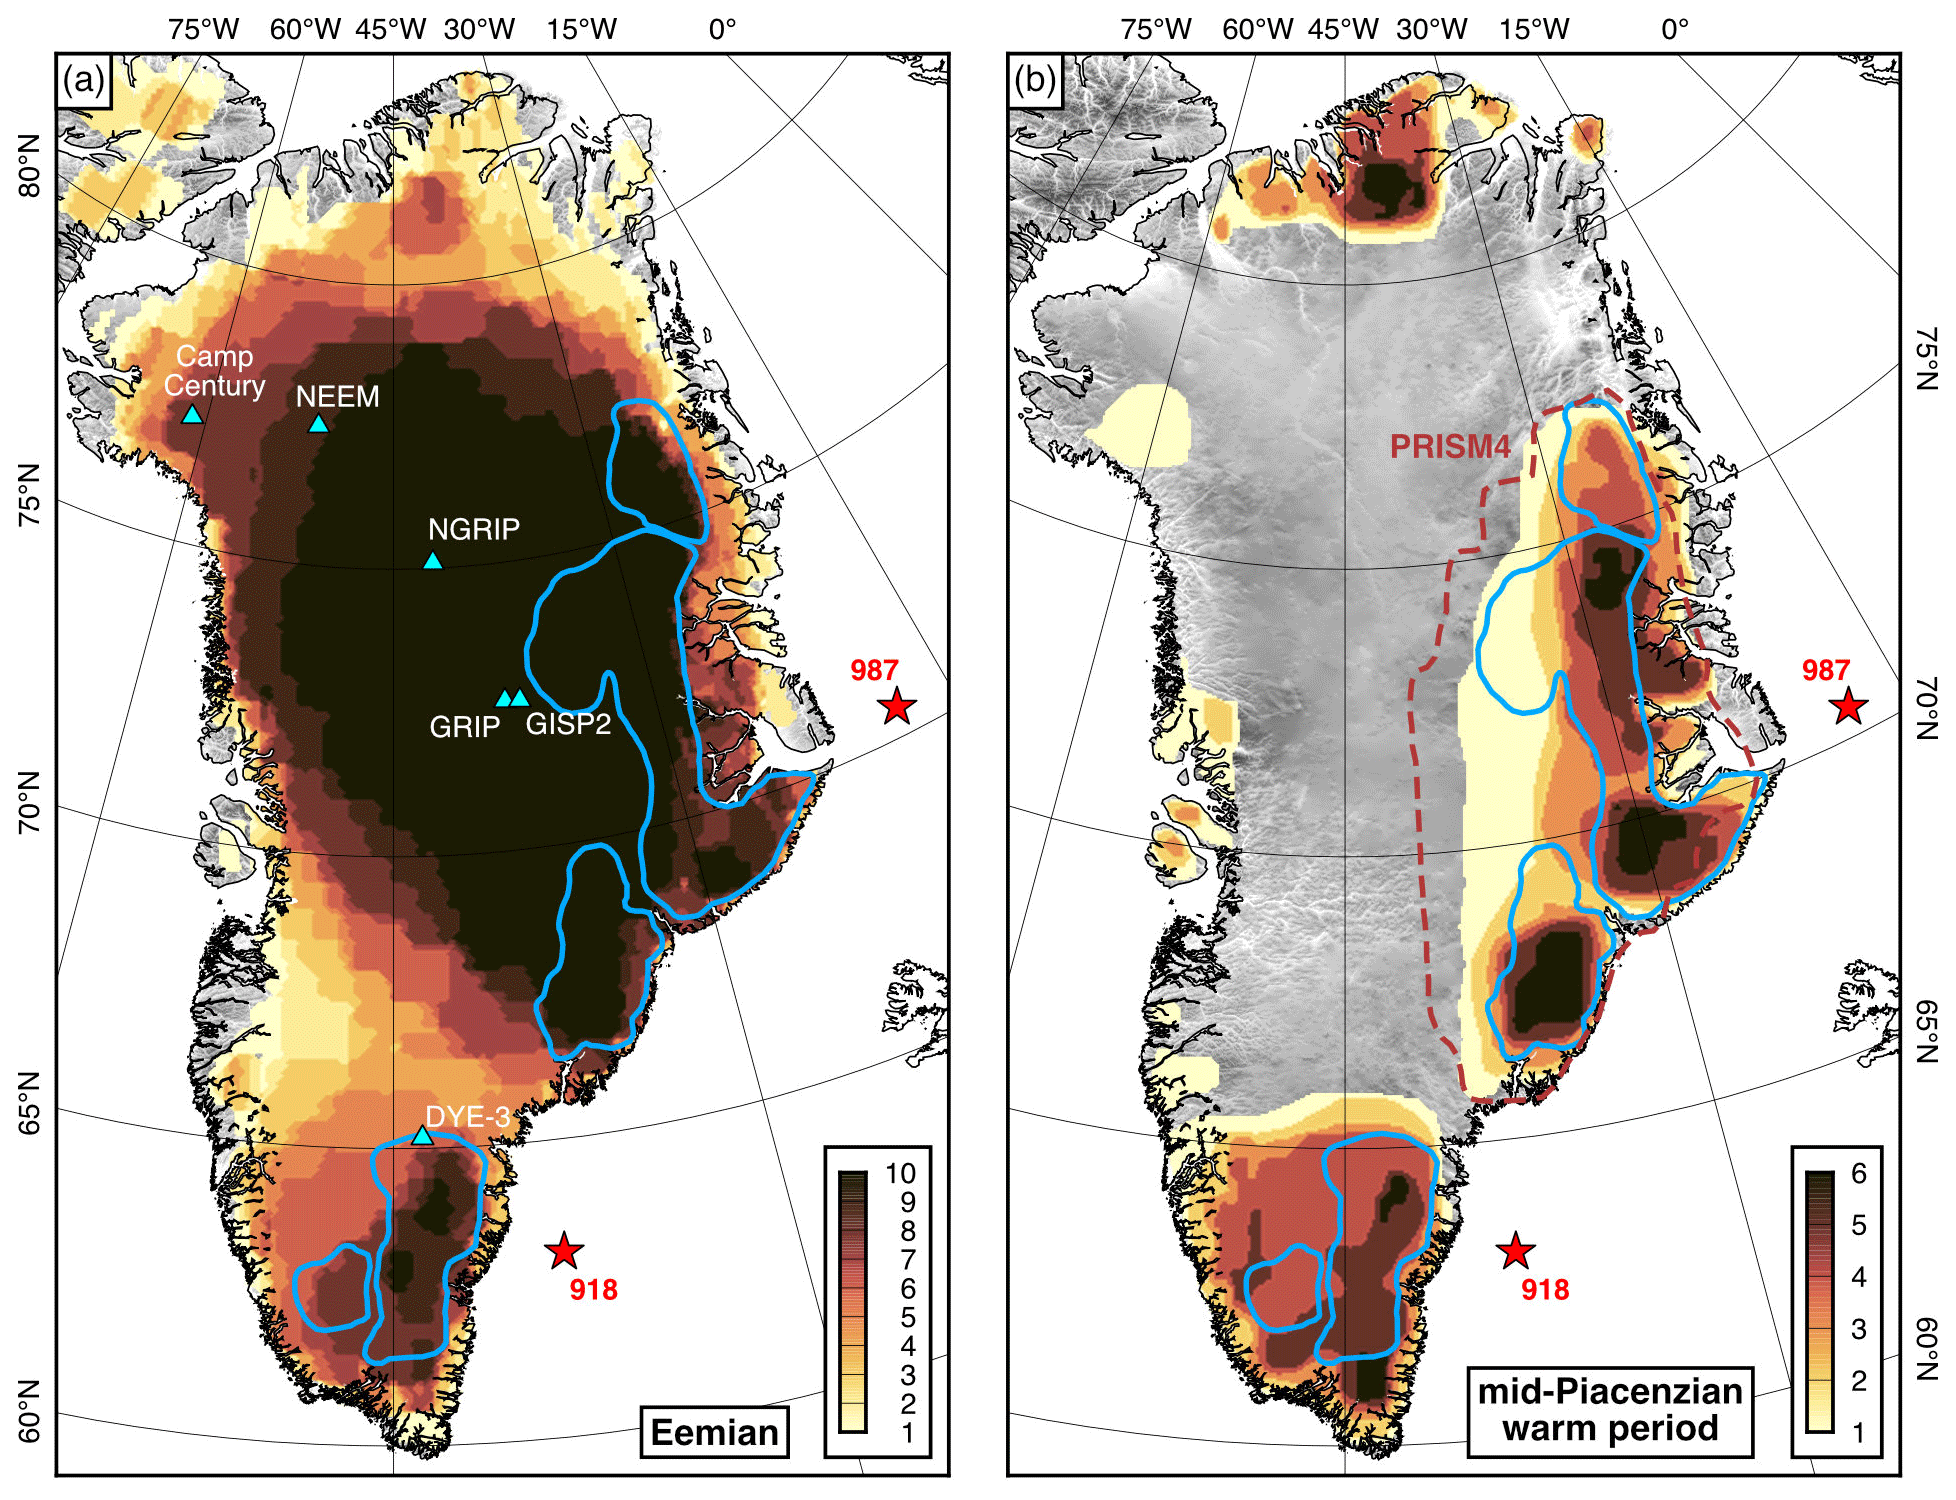
Figure 9Heat maps representing simulated GrIS extent during past warmer intervals. (a) Simulated GrIS minimum extent during the Last Interglacial (Eemian; ca. 125 ka), based on 10 previously published ice-sheet model outputs compiled in Fig. 2 of Plach et al. (2018). These simulations examine the retreat of the GrIS during the Last Interglacial. Colours indicate the number of model simulations that predict the presence of ice at a given location. Light blue triangles mark deep ice cores; red stars mark ODP core sites; blue polygons denote the highland palaeo-glacial valley limits mapped in this study. (b) Simulated GrIS extent during the mid-Piacenzian warm period (ca. 3.26–3.02 Ma), based on the results of six different ice-sheet models (Koenig et al., 2015). These simulations examine the growth of the GrIS on an ice-free Greenland using a late Pliocene climatology from the HadAM3 general circulation model. The dashed red line marks the PRISM4 GrIS extent used in PlioMIP2 (Dowsett et al., 2016; Haywood et al., 2016b).
4.2.3 Neogene ice growth
If mountain glacial valley incision did not primarily occur during Quaternary interglacial ice-sheet retreat episodes, the implication is that these valley networks primarily reflect early ice-sheet development during the Neogene. A number of modelling studies indicate that in the late Pliocene (ca. 3.6–2.6 Ma) the GrIS nucleated on, and expanded from, the mountains of eastern and southern Greenland (Berends et al., 2019; Contoux et al., 2015; Koenig et al., 2015; Lunt et al., 2009; Solgaard et al., 2011; Tan et al., 2018), although these results do not preclude the presence of upland ice masses prior to the late Pliocene (Bierman et al., 2016). Across multiple ice-sheet models that adopt a mPWP climate forcing from an atmospheric general circulation model in which no GrIS exists a priori, the simulated ice sheet is confined to the eastern and southern highlands (Koenig et al., 2015), with an extent that is broadly consistent with the mapped palaeo-glacial valley limit and our simple ice-sheet modelling results (Fig. 9b).
Data-based constraints for Greenland's climate during the late Pliocene are rare and derive from a small number of sites. On Ellesmere Island (78° N), multiproxy analysis including tree-ring width and oxygen isotopes, palaeo-vegetation composition, and tetraether lipids have been used to infer MAATs of −1 °C (±4 °C) during the late Pliocene (Ballantyne et al., 2010; Csank et al., 2011). Similarly, earlier analysis of floral and faunal fossil assemblages from the Kap København Formation in northern Greenland (82° N) provided an indicative estimate for local late Pliocene MAATs of −4 °C (Funder et al., 2001). In our ice-sheet modelling experiments, we obtained an ice sheet with a geometry in closest agreement with the observed glacial valley limit in eastern Greenland for a sea level MAAT of +4 °C at 60° N and a latitudinal gradient of −0.3 °C ° N−1 (Fig. 7). This implies a sea level MAAT of −2 °C at 80° N, which is broadly consistent with these data-based constraints for late Pliocene temperatures in northern Greenland. The best-fitting latitudinal gradient is also broadly consistent with estimated global palaeolatitudinal temperature gradients for the late Miocene and Pliocene, which, while highly uncertain, are typically less than half as steep between 60 and 90° N as in the present day (∼ −0.8 °C ° N−1) (Bradshaw et al., 2012; Burls et al., 2021; Zhang et al., 2019). The temperature conditions necessary to develop mountain ice masses capable of incising the mapped palaeo-glacial valleys therefore appear to be broadly consistent with those that characterised the late Miocene and/or Pliocene epochs. The inferred global sea level highstand of up to +25 m above modern global mean sea level during the mPWP (Dumitru et al., 2019; Grant et al., 2019) is also consistent with a significantly diminished GrIS at this time (Dutton et al., 2015). The ice masses that best match the extent of the palaeo-glacial valleys contain ∼ 0.4 m SLE in the eastern highlands and ∼ 0.1 m SLE in the southern highlands (Fig. 7), implying that at the time these valleys were incised, the GrIS contribution to barystatic sea level was as much as ∼ 7 m.
Offshore records of early Greenlandic glacial development prior to continental-scale ice-sheet formation indicate that glacial material began to appear in North Atlantic sediments during the late Miocene. At Ocean Drilling Program (ODP) Site 918 (southeast Greenland; Fig. 9), episodes of coarse sand, till, diamicton, and periodic ice-rafted debris (IRD) deposition commenced at ca. 7 Ma (Larsen et al., 1994; St. John and Krissek, 2002). Despite the southerly location of Site 918, sediments here were likely advected southwards by the East Greenland Current, which has been circulating anti-clockwise along the continental shelf since the late Miocene, and were likely sourced from rocks in the highlands of eastern Greenland rather than southern Greenland (Blake-Mizen et al., 2019). Similarly, at ODP Site 987 (east Greenland; Fig. 9), dropstones suggest that ice rafting commenced at ca. 7.5 Ma (Butt et al., 2001). Offshore seismic stratigraphy close to Site 987 also reveals that pre-late Miocene Atlantic sediments lack evidence of progradation or coarse-grained material, implying an absence of ice at the coast (Pérez et al., 2018). The first progradational glacial unit, indicative of outlet glaciers reaching the coast, is dated at ca. 7 Ma, followed by a broader major glacial advance in the early Pliocene (ca. 5 Ma) (Nielsen and Kuijpers, 2013; Pérez et al., 2018). Glaciers then appear to have retreated during the mPWP, followed by a second major advance at the Pliocene–Pleistocene transition (Pérez et al., 2018).
In our best-fitting ice-sheet model scenario for the eastern highlands (Fig. 7m), the ice sheet reaches the east coast in places along the southern half of the eastern highlands (Fig. 8a). The extent of the marine-terminating margins of the modelled ice sheets with extents more restricted than the best-fitting scenario appears to be reduced, although this is difficult to assess robustly given the uncertainties in the palaeotopography. This suggests that, while relatively restricted compared to the modern GrIS, these simulated ice masses were likely sufficiently extensive to reach the coast, at least in certain areas, and could have been responsible for the delivery of glaciogenic sedimentary material and IRD to the continental shelf during the late Miocene and Pliocene via tidewater glaciers. We note however that mountain glacial valley incision will have commenced prior to the establishment of a marine-terminating margin (Bierman et al., 2016). Thermochronological data from eastern Greenland suggest that kilometre-scale uplift of the highlands commenced at ca. 10 Ma (Japsen et al., 2014), and geomorphological evidence suggests that incision into peneplanation surfaces uplifted at this time was initially driven by rivers (Japsen et al., 2024). If rivers dominated this landscape at ca. 10 Ma and the uplift was necessary to trigger mountain glaciation (Solgaard et al., 2013), the mapped palaeo-glacial valley network is unlikely to have developed until after ca. 10 Ma.
Geological records therefore indicate that two plausible intervals for mountain glacial valley incision are (i) the late Miocene (after ca. 10 Ma) prior to the large-scale early Pliocene (ca. 5 Ma) margin advance and/or (ii) subsequent warm periods of the late Pliocene (e.g. the mPWP). It is difficult to determine from the evidence presented here whether glacial incision primarily occurred during both or only one of these two possible windows. The simplest scenario is that the mapped palaeo-glacial landscape primarily reflects the presence of restricted mountain-scale ice masses during the late Pliocene immediately prior to the onset of continental-scale glaciation (Funder et al., 2001) and consequent establishment of widespread cold-based, non-erosive ice. However, if a marine-terminating ice margin existed (at least intermittently) during the late Miocene/early Pliocene, mountain glacial valley incision likely commenced prior to the late Pliocene. Therefore, on the available evidence, we simply suggest that glacial valley incision in the eastern and southern highlands primarily occurred early in Greenland's glacial history, most likely in the late Miocene and/or subsequent warm intervals of the late Pliocene. To further resolve which of these two candidate intervals was characterised by the most incision, we recommend future analysis of offshore seismic data and/or acquisition of sediment cores on the east Greenland continental shelf to compare the provenance of Miocene and Pliocene sediments and the timing of pulses of erosion from the eastern and southern highlands.
Following the development of the alpine-style glacial landscape in southern and eastern Greenland over an extended interval (on the order of hundreds of thousands to a few million years), we suggest that the GrIS likely expanded to continental scale comparatively quickly. This inference is made on the basis of (i) ice-sheet modelling that suggests rapid GrIS expansion could have occurred via a surface elevation–mass balance feedback once a key temperature threshold was reached (DeConto et al., 2008), which is also borne out by our own ice-sheet model results (Fig. 7 shows that for every 1 °C of cooling, the modelled ice volume approximately doubles), and (ii) the subglacial geomorphology, which suggests that large parts of the interior landscape have not been strongly modified by glacial erosion (Bamber et al., 2013; Bierman et al., 2014; Cooper et al., 2016), implying that the ice margin (which would be expected to generally be characterised by the fastest ice flow and thus the highest erosion rates) was not situated in these locations (see Fig. 7c and k) for an extended period of time. Much of the landscape in the Greenlandic interior, including the inland-facing valleys in the eastern and southern highlands, would thus have been preserved beneath a cold-based core of the expanded continental-scale ice sheet. We therefore suggest that the inland-facing side of the eastern highlands in particular may be a promising region in which to find ancient ice in Greenland, on the basis that (a) the topography is generally high, with deep valleys last incised during early mountain glaciation; (b) the ice is cold-based and slow-moving (Joughin et al., 2018; MacGregor et al., 2022); and (c) ice has likely been persistent for millions of years (Bierman et al., 2016), with potentially the longest continual glacial history in Greenland.
Although the absolute timing remains to be fully resolved, the combined results of our geomorphological mapping and ice-sheet modelling provide an important constraint on the geometry of the GrIS (Fig. 8) during warm intervals of the late Miocene and/or late Pliocene, as well as possibly during the strongest Pleistocene interglacial periods. We suggest that these constraints could be retro-actively applied to existing climate/ice-sheet modelling studies to rule in/out certain simulated past ice-sheet scenarios. They can also act as an improved, data-constrained boundary condition for subsequent iterations of global palaeogeography boundary conditions such as PRISM (Dowsett et al., 2016) and palaeoclimate model intercomparison projects such as PlioMIP (Haywood et al., 2016b); we highlight that the best-fitting ice configuration in the eastern highlands is significantly less extensive than the ice cap assumed in PRISM4 (Fig. 8a). We also highlight the need for a better understanding of the chronology of landscape development. This could be facilitated by improved mapping and quantification of offshore sediment volumes and chronologies (e.g. Pedersen et al., 2018), as well as geochemical analysis of the provenance of eroded material entering the North Atlantic (e.g. Blake-Mizen et al., 2019; Cook et al., 2013), which would help better quantify the times at which the ice margin reached the coast or retreated inland along the eastern margin of Greenland.
In this study we have used a combination of geomorphological mapping and ice-sheet modelling to constrain the behaviour of the Greenland Ice Sheet during past warmer climates. We draw the following conclusions:
-
The highlands of eastern and southern Greenland are incised by a complex network of subglacial valleys that retain signatures of pre-glacial fluvial incision in their observed planform geometry and cross-sectional profile morphology. The distribution of the subglacial valleys is inconsistent with incision beneath the modern continental-scale GrIS.
-
Instead, the inherited palaeo-fluvial valleys likely steered, and were modified by, the flow of (warm-based, erosive) mountain valley glaciers that drained central high-elevation (cold-based, non-erosive) ice fields during past warmer climates. Our ice-sheet modelling indicates that the mapped palaeo-glacial valley limit in the eastern highlands is consistent with a palaeoclimate characterised by simulated late Pliocene precipitation rates and a simple air temperature field (defined by a sea level MAAT at 60° N of +4 ± 1 °C, a latitudinal gradient of −0.3 ± 0.1 °C ° N−1, and a vertical lapse rate of −6.5 °C km−1) that is broadly consistent with terrestrial records for the late Pliocene.
-
A further cooling of 1 °C and steepening of the latitudinal gradient by −0.1 °C ° N−1 is required to match the mapped palaeo-glacial valley limit in the southern highlands. Geomorphological mapping also indicates that the landscape of the southern highlands has been less extensively modified by mountain-scale glaciation. We suggest that glaciation in the eastern highlands likely pre-dated the southern highlands, reflecting the higher latitudes and higher elevations of this region. The SLE of the simulated ice masses that best match the mapped palaeo-glacial valley limit is ∼ 0.4 m in the eastern highlands and ∼ 0.1 m in the southern highlands, indicating that at the time of valley incision, the GrIS was significantly more restricted in extent than today, with a contribution to barystatic sea level of up to ∼ 7 m.
-
We suggest that the late Miocene (ca. 7–5 Ma) and late Pliocene (ca. 3.6–2.6 Ma) are the most likely time intervals for the incision of the mapped palaeo-glacial valley network, although we cannot exclude the possibility that the valleys were also incised during particularly warm and/or long-lived “super-interglacial” intervals of the Pleistocene. The mapped limit of the palaeo-glacial valley network and associated simulations of ice extent and flow can act as valuable constraints for the next generation of palaeoclimate model intercomparison projects focussed on these past warm periods, which provide analogues for projected future climate warming.
-
Subsequent transition(s) between a mountain- and continental-scale GrIS did not substantially erode the landscape of the Greenlandic interior, indicating that ice margin advance/retreat occurred relatively quickly and/or non-erosively. As a result, the inland-facing side of the eastern highlands may contain some of the oldest ice preserved in Greenland.
The BedMachine version 5 (https://doi.org/10.5067/GMEVBWFLWA7X, Morlighem et al., 2022) and MEaSUREs MODIS MoG version 2 (https://doi.org/10.5067/9ZO79PHOTYE5, Haran et al., 2018) datasets were accessed via the National Snow and Ice Data Center. The isostatic response to the unloading of the modern Greenland Ice Sheet (Paxman et al., 2022a) is available via the Arctic Data Center (https://doi.org/10.18739/A2WS8HN3C, Paxman et al., 2022b). The dataset of Greenland subglacial valleys (Paxman, 2023a) is available via https://doi.org/10.5281/zenodo.7794565 (Paxman, 2023b). Data produced in this study, including ESRI shapefiles of the mountain valley network and inferred palaeo-glacial limit and NetCDF files of selected ice-sheet model output, are available via https://doi.org/10.5281/zenodo.10013440 (Paxman et al., 2024).
The supplement related to this article is available online at: https://doi.org/10.5194/tc-18-1467-2024-supplement.
GJGP conceived the project, performed the analysis, constructed the figures, and drafted the manuscript. SSRJ and MJB provided input on the study scope, methods, and interpretation. AMD provided general circulation model output for the ice-sheet modelling and input on the interpretation of the model results. All authors contributed comments and revisions to the final manuscript.
The contact author has declared that none of the authors has any competing interests.
Publisher's note: Copernicus Publications remains neutral with regard to jurisdictional claims made in the text, published maps, institutional affiliations, or any other geographical representation in this paper. While Copernicus Publications makes every effort to include appropriate place names, the final responsibility lies with the authors.
This article is part of the special issue “Icy landscapes of the past”. It is not associated with a conference.
Guy J. G. Paxman was funded by a Leverhulme Trust Early Career Fellowship, award number ECF-2021-549. Michael J. Bentley was supported by funding received from the European Research Council (ERC) under the European Union's Horizon 2020 research and innovation programme, grant agreement 885205. The authors would like to thank Lauren Burton, Tamara Fletcher, Alan Haywood, Daniel Hill, Erin McClymont, and Julia Tindall for helpful discussions on late Pliocene Greenland, along with the broader PlioMIP climate modelling community for their ongoing efforts. We also extend thanks to Andreas Plach and Andreas Born for providing the modelled MIS 5e Greenland Ice Sheet extents used to construct the heat map in Fig. 9a. Guy J. G. Paxman would like to thank the attendees of the “Greenland Ice Sheet: lessons from the past” workshop in Bergen, Norway (April 2023), especially Jason Briner, Petra Langebroek, Vivi Pedersen, and Julien Seguinot, for fruitful discussions that helped shape the manuscript. We thank Henry Patton and a second, anonymous reviewer for their thoughtful and constructive comments, which greatly improved the final manuscript. Figures were prepared using the Generic Mapping Tools (GMT) version 6 software package (Wessel et al., 2019) and colour palettes from Scientific Colour Maps version 7 (Crameri et al., 2020).
This research has been supported by the Leverhulme Trust (grant no. ECF-2021-549) and the European Research Council, H2020 European Research Council (grant no. 885205).
This paper was edited by Neil Glasser and reviewed by Henry Patton and one anonymous referee.
Alley, R. B., Pollard, D., Parizek, B. R., Anandakrishnan, S., Pourpoint, M., Stevens, N. T., MacGregor, J. A., Christianson, K., Muto, A., and Holschuh, N.: Possible Role for Tectonics in the Evolving Stability of the Greenland Ice Sheet, J. Geophys. Res.-Earth, 124, 97–115, https://doi.org/10.1029/2018JF004714, 2019.
Aschwanden, A. and Brinkerhoff, D. J.: Calibrated mass loss projections from the Greenland Ice Sheet, Geophys. Res. Lett., 49, e2022GL099058, https://doi.org/10.1029/2022GL099058, 2022.
Aschwanden, A., Bueler, E., Khroulev, C., and Blatter, H.: An enthalpy formulation for glaciers and ice sheets, J. Glaciol., 58, 441–457, https://doi.org/10.3189/2012JoG11J088, 2012.
Bailey, I., Hole, G. M., Foster, G. L., Wilson, P. A., Storey, C. D., Trueman, C. N., and Raymo, M. E.: An alternative suggestion for the Pliocene onset of major northern hemisphere glaciation based on the geochemical provenance of North Atlantic Ocean ice-rafted debris, Quaternary Sci. Rev., 75, 181–194, https://doi.org/10.1016/j.quascirev.2013.06.004, 2013.
Ballantyne, A. P., Greenwood, D. R., Sinninghe Damsté, J. S., Csank, A. Z., Eberle, J. J., and Rybczynski, N.: Significantly warmer Arctic surface temperatures during the Pliocene indicated by multiple independent proxies, Geology, 38, 603–606, https://doi.org/10.1130/G30815.1, 2010.
Bamber, J. L., Siegert, M. J., Griggs, J. A., Marshall, S. J., and Spada, G.: Paleofluvial mega-canyon beneath the central Greenland ice sheet, Science, 341, 997–999, https://doi.org/10.1126/science.1239794, 2013.
Beaumont, C., Kooi, H., and Willett, S.: Coupled tectonic-surface process models with applications to rifted margins and collisional orogens, in: Geomorphology and Global Tectonics, edited by: Summerfield, M. A., Wiley, Chichester, 29–55, ISBN 978-0-471-97193-1, 2000.
Bennike, O., Knudsen, K. L., Abrahamsen, N., Böcher, J., Cremer, H., and Wagner, B.: Early Pleistocene sediments on Store Koldewey, northeast Greenland, Boreas, 39, 603–619, https://doi.org/10.1111/j.1502-3885.2010.00147.x, 2010.
Berends, C. J., de Boer, B., Dolan, A. M., Hill, D. J., and van de Wal, R. S. W.: Modelling ice sheet evolution and atmospheric CO2 during the Late Pliocene, Clim. Past, 15, 1603–1619, https://doi.org/10.5194/cp-15-1603-2019, 2019.
Bierman, P. R., Corbett, L. B., Graly, J. A., Neumann, T. A., Lini, A., Crosby, B. T., and Rood, D. H.: Preservation of a Preglacial Landscape Under the Center of the Greenland Ice Sheet, Science, 344, 402–405, https://doi.org/10.1126/science.1249047, 2014.
Bierman, P. R., Shakun, J. D., Corbett, L. B., Zimmerman, S. R., and Rood, D. H.: A persistent and dynamic East Greenland Ice Sheet over the past 7.5 million years, Nature, 540, 256–260, https://doi.org/10.1038/nature20147, 2016.
Blake-Mizen, K., Hatfield, R. G., Stoner, J. S., Carlson, A. E., Xuan, C., Walczak, M., Lawrence, K. T., Channell, J. E. T., and Bailey, I.: Southern Greenland glaciation and Western Boundary Undercurrent evolution recorded on Eirik Drift during the late Pliocene intensification of Northern Hemisphere glaciation, Quaternary Sci. Rev., 209, 40–51, https://doi.org/10.1016/j.quascirev.2019.01.015, 2019.
Bonow, J. M., Japsen, P., and Nielsen, T. F. D.: High-level landscapes along the margin of southern East Greenland-A record of tectonic uplift and incision after breakup in the NE Atlantic, Global Planet. Change, 116, 10–29, https://doi.org/10.1016/j.gloplacha.2014.01.010, 2014.
Bradshaw, C. D., Lunt, D. J., Flecker, R., Salzmann, U., Pound, M. J., Haywood, A. M., and Eronen, J. T.: The relative roles of CO2 and palaeogeography in determining late Miocene climate: results from a terrestrial model–data comparison, Clim. Past, 8, 1257–1285, https://doi.org/10.5194/cp-8-1257-2012, 2012.
Bueler, E. and Brown, J.: Shallow shelf approximation as a “sliding law” in a thermomechanically coupled ice sheet model, J. Geophys. Res.-Sol. Ea., 114, 1–21, https://doi.org/10.1029/2008JF001179, 2009.
Burls, N. J., Bradshaw, C. D., De Boer, A. M., Herold, N., Huber, M., Pound, M., Donnadieu, Y., Farnsworth, A., Frigola, A., Gasson, E., von der Heydt, A. S., Hutchinson, D. K., Knorr, G., Lawrence, K. T., Lear, C. H., Li, X., Lohmann, G., Lunt, D. J., Marzocchi, A., Prange, M., Riihimaki, C. A., Sarr, A. C., Siler, N., and Zhang, Z.: Simulating Miocene Warmth: Insights From an Opportunistic Multi-Model Ensemble (MioMIP1), Paleoceanogr. Paleoclim., 36, 1–40, https://doi.org/10.1029/2020PA004054, 2021.
Butt, F. A., Elverhøi, A., Forsberg, C. F., and Solheim, A.: Evolution of the Scoresby Sund Fan, central East Greenland – Evidence from ODP Site 987, Nor. Geol. Tidsskr., 81, 3–15, 2001.
Campforts, B., Vanacker, V., Herman, F., Vanmaercke, M., Schwanghart, W., Tenorio, G. E., Willems, P., and Govers, G.: Parameterization of river incision models requires accounting for environmental heterogeneity: insights from the tropical Andes, Earth Surf. Dynam., 8, 447–470, https://doi.org/10.5194/esurf-8-447-2020, 2020.
Christ, A. J., Bierman, P. R., Knutz, P. C., Corbett, L. B., Fosdick, J. C., Thomas, E. K., Cowling, O. C., Hidy, A. J., and Caffee, M. W.: The Northwestern Greenland Ice Sheet During The Early Pleistocene Was Similar To Today, Geophys. Res. Lett., 47, 1–9, https://doi.org/10.1029/2019GL085176, 2020.
Christ, A. J., Bierman, P. R., Schaefer, J. M., Dahl-Jensen, D., Steffensen, J. P., Corbett, L. B., Peteet, D. M., Thomas, E. K., Steig, E. J., Rittenour, T. M., Tison, J.-L., Blard, P.-H., Perdrial, N., Dethier, D. P., Lini, A., Hidy, A. J., Caffee, M. W., and Southon, J.: A multimillion-year-old record of Greenland vegetation and glacial history preserved in sediment beneath 1.4 km of ice at Camp Century, P. Natl. Acad. Sci. USA, 118, e2021442118, https://doi.org/10.1073/pnas.2021442118, 2021.
Christ, A. J., Rittenour, T. M., Bierman, P. R., Keisling, B. A., Knutz, P. C., Thomsen, T. B., Keulen, N., Fosdick, J. C., Hemming, S. R., Tison, J., Blard, P., Steffensen, J. P., Caffee, M. W., Corbett, L. B., Dahl-Jensen, D., Dethier, D. P., Hidy, A. J., Perdrial, N., Peteet, D. M., Steig, E. J., and Thomas, E. K.: Deglaciation of northwestern Greenland during Marine Isotope Stage 11, Science, 381, 330–335, https://doi.org/10.1126/science.ade4248, 2023.
Clark, P. U. and Huybers, P.: Interglacial and future sea level, Nature, 462, 856–857, https://doi.org/10.1038/462856a, 2009.
Cockburn, H. A. P., Brown, R. W., Summerfield, M. A., and Seidl, M. A.: Quantifying passive margin denudation and landscape development using a combined fission-track thermochronology and cosmogenic isotope analysis approach, Earth Planet. Sc. Lett., 179, 429–435, https://doi.org/10.1016/S0012-821X(00)00144-8, 2000.
Contoux, C., Dumas, C., Ramstein, G., Jost, A., and Dolan, A. M.: Modelling Greenland ice sheet inception and sustainability during the Late Pliocene, Earth Planet. Sc. Lett., 424, 295–305, https://doi.org/10.1016/j.epsl.2015.05.018, 2015.
Cook, C. P., Van De Flierdt, T., Williams, T., Hemming, S. R., Iwai, M., Kobayashi, M., Jimenez-Espejo, F. J., Escutia, C., González, J. J., Khim, B. K., McKay, R. M., Passchier, S., Bohaty, S. M., Riesselman, C. R., Tauxe, L., Sugisaki, S., Galindo, A. L., Patterson, M. O., Sangiorgi, F., Pierce, E. L., Brinkhuis, H., Klaus, A., Fehr, A., Bendle, J. A. P., Bijl, P. K., Carr, S. A., Dunbar, R. B., Flores, J. A., Hayden, T. G., Katsuki, K., Kong, G. S., Nakai, M., Olney, M. P., Pekar, S. F., Pross, J., Röhl, U., Sakai, T., Shrivastava, P. K., Stickley, C. E., Tuo, S., Welsh, K., and Yamane, M.: Dynamic behaviour of the East Antarctic ice sheet during Pliocene warmth, Nat. Geosci., 6, 765–769, https://doi.org/10.1038/ngeo1889, 2013.
Cook, S. J., Swift, D. A., Kirkbride, M. P., Knight, P. G., and Waller, R. I.: The empirical basis for modelling glacial erosion rates, Nat. Commun., 11, 759, https://doi.org/10.1038/s41467-020-14583-8, 2020.
Cooper, M. A., Michaelides, K., Siegert, M. J., and Bamber, J. L.: Paleofluvial landscape inheritance for Jakobshavn Isbræ catchment, Greenland, Geophys. Res. Lett., 43, 6350–6357, https://doi.org/10.1002/2016GL069458, 2016.
Cooper, M. A., Jordan, T. M., Siegert, M. J., and Bamber, J. L.: Surface Expression of Basal and Englacial Features, Properties, and Processes of the Greenland Ice Sheet, Geophys. Res. Lett., 46, 783–793, https://doi.org/10.1029/2018GL080620, 2019.
Crameri, F., Shephard, G. E., and Heron, P. J.: The misuse of colour in science communication, Nat. Commun., 11, 1–10, https://doi.org/10.1038/s41467-020-19160-7, 2020.
Csank, A. Z., Patterson, W. P., Eglington, B. M., Rybczynski, N., and Basinger, J. F.: Climate variability in the Early Pliocene Arctic: Annually resolved evidence from stable isotope values of sub-fossil wood, Ellesmere Island, Canada, Palaeogeogr. Palaeoclim., 308, 339–349, https://doi.org/10.1016/j.palaeo.2011.05.038, 2011.
Dahl-Jensen, D., Albert, M. R., Aldahan, A., Azuma, N., Balslev-Clausen, D., Baumgartner, M., Berggren, A. M., Bigler, M., Binder, T., Blunier, T., Bourgeois, J. C., Brook, E. J., Buchardt, S. L., Buizert, C., Capron, E., Chappellaz, J., Chung, J., Clausen, H. B., Cvijanovic, I., Davies, S. M., Ditlevsen, P., Eicher, O., Fischer, H., Fisher, D. A., Fleet, L. G., Gfeller, G., Gkinis, V., Gogineni, S., Goto-Azuma, K., Grinsted, A., Gudlaugsdottir, H., Guillevic, M., Hansen, S. B., Hansson, M., Hirabayashi, M., Hong, S., Hur, S. D., Huybrechts, P., Hvidberg, C. S., Iizuka, Y., Jenk, T., Johnsen, S. J., Jones, T. R., Jouzel, J., Karlsson, N. B., Kawamura, K., Keegan, K., Kettner, E., Kipfstuhl, S., Kjær, H. A., Koutnik, M., Kuramoto, T., Köhler, P., Laepple, T., Landais, A., Langen, P. L., Larsen, L. B., Leuenberger, D., Leuenberger, M., Leuschen, C., Li, J., Lipenkov, V., Martinerie, P., Maselli, O. J., Masson-Delmotte, V., McConnell, J. R., Miller, H., Mini, O., Miyamoto, A., Montagnat-Rentier, M., Mulvaney, R., Muscheler, R., Orsi, A. J., Paden, J., Panton, C., Pattyn, F., Petit, J. R., Pol, K., Popp, T., Possnert, G., Prié, F., Prokopiou, M., Quiquet, A., Rasmussen, S. O., Raynaud, D., Ren, J., Reutenauer, C., Ritz, C., Röckmann, T., Rosen, J. L., Rubino, M., Rybak, O., Samyn, D., Sapart, C. J., Schilt, A., Schmidt, A. M. Z., Schwander, J., Schüpbach, S., Seierstad, I., et al.: Eemian interglacial reconstructed from a Greenland folded ice core, Nature, 493, 489–494, https://doi.org/10.1038/nature11789, 2013.
DeConto, R. M., Pollard, D., Wilson, P. A., Pälike, H., Lear, C. H., and Pagani, M.: Thresholds for Cenozoic bipolar glaciation, Nature, 455, 652–656, https://doi.org/10.1038/nature07337, 2008.
de Wet, G. A., Castañeda, I. S., DeConto, R. M., and Brigham-Grette, J.: A high-resolution mid-Pleistocene temperature record from Arctic Lake El'gygytgyn: A 50 kyr super interglacial from MIS 33 to MIS 31?, Earth Planet. Sc. Lett., 436, 56–63, https://doi.org/10.1016/j.epsl.2015.12.021, 2016.
Dolan, A. M., Hunter, S. J., Hill, D. J., Haywood, A. M., Koenig, S. J., Otto-Bliesner, B. L., Abe-Ouchi, A., Bragg, F., Chan, W.-L., Chandler, M. A., Contoux, C., Jost, A., Kamae, Y., Lohmann, G., Lunt, D. J., Ramstein, G., Rosenbloom, N. A., Sohl, L., Stepanek, C., Ueda, H., Yan, Q., and Zhang, Z.: Using results from the PlioMIP ensemble to investigate the Greenland Ice Sheet during the mid-Pliocene Warm Period, Clim. Past, 11, 403–424, https://doi.org/10.5194/cp-11-403-2015, 2015.
Dowsett, H., Dolan, A., Rowley, D., Moucha, R., Forte, A. M., Mitrovica, J. X., Pound, M., Salzmann, U., Robinson, M., Chandler, M., Foley, K., and Haywood, A.: The PRISM4 (mid-Piacenzian) paleoenvironmental reconstruction, Clim. Past, 12, 1519–1538, https://doi.org/10.5194/cp-12-1519-2016, 2016.
Dumitru, O. A., Austermann, J., Polyak, V. J., Fornós, J. J., Asmerom, Y., Ginés, J., Ginés, A., and Onac, B. P.: Constraints on global mean sea level during Pliocene warmth, Nature, 574, 233–236, https://doi.org/10.1038/s41586-019-1543-2, 2019.
Dutton, A., Carlson, A. E., Long, A. J., Milne, G. A., Clark, P. U., DeConto, R., Horton, B. P., Rahmstorf, S., and Raymo, M. E.: Sea-level rise due to polar ice-sheet mass loss during past warm periods, Science, 349, aaa4019, https://doi.org/10.1126/science.aaa4019, 2015.
Edwards, T. L., Nowicki, S., Marzeion, B., Hock, R., Goelzer, H., Seroussi, H., Jourdain, N. C., Slater, D. A., Turner, F. E., Smith, C. J., McKenna, C. M., Simon, E., Abe-Ouchi, A., Gregory, J. M., Larour, E., Lipscomb, W. H., Payne, A. J., Shepherd, A., Agosta, C., Alexander, P., Albrecht, T., Anderson, B., Asay-Davis, X., Aschwanden, A., Barthel, A., Bliss, A., Calov, R., Chambers, C., Champollion, N., Choi, Y., Cullather, R., Cuzzone, J., Dumas, C., Felikson, D., Fettweis, X., Fujita, K., Galton-Fenzi, B. K., Gladstone, R., Golledge, N. R., Greve, R., Hattermann, T., Hoffman, M. J., Humbert, A., Huss, M., Huybrechts, P., Immerzeel, W., Kleiner, T., Kraaijenbrink, P., Le clec'h, S., Lee, V., Leguy, G. R., Little, C. M., Lowry, D. P., Malles, J.-H., Martin, D. F., Maussion, F., Morlighem, M., O'Neill, J. F., Nias, I., Pattyn, F., Pelle, T., Price, S. F., Quiquet, A., Radiæ, V., Reese, R., Rounce, D. R., Rückamp, M., Sakai, A., Shafer, C., Schlegel, N.-J., Shannon, S., Smith, R. S., Straneo, F., Sun, S., Tarasov, L., Trusel, L. D., Van Breedam, J., van de Wal, R., van den Broeke, M., Winkelmann, R., Zekollari, H., Zhao, C., Zhang, T., and Zwinger, T.: Projected land ice contributions to twenty-first-century sea level rise, Nature, 593, 74–82, https://doi.org/10.1038/s41586-021-03302-y, 2021.
Eldrett, J. S., Harding, I. C., Wilson, P. A., Butler, E., and Roberts, A. P.: Continental ice in Greenland during the Eocene and Oligocene, Nature, 446, 176–179, https://doi.org/10.1038/nature05591, 2007.
Feyling-Hanssen, R. W., Funder, S., and Petersen, K. S.: The Lodin Elv Formation; a Plio-Pleistocene occurrence in Greenland, Bull. Geol. Soc. Denmark, 31, 81–106, 1983.
Flesche Kleiven, H., Jansen, E., Fronval, T., and Smith, T. M.: Intensification of Northern Hemisphere glaciations in the circum Atlantic region (3.5–2.4 Ma) – Ice-rafted detritus evidence, Palaeogeogr. Palaeoclim., 184, 213–223, https://doi.org/10.1016/S0031-0182(01)00407-2, 2002.
Funder, S., Bennike, O., Böcher, J., Israelson, C., Petersen, K. S., and Símonason, L. A.: Late Pliocene Greenland – The Kap København Formation in North Greenland, Bull. Geol. Soc. Denmark, 48, 117–134, 2001.
Fyke, J., Eby, M., Mackintosh, A., and Weaver, A.: Impact of climate sensitivity and polar amplification on projections of Greenland Ice Sheet loss, Clim. Dynam., 43, 2249–2260, https://doi.org/10.1007/s00382-014-2050-7, 2014.
Goelzer, H., Huybrechts, P., Fürst, J. J., Nick, F. M., Andersen, M. L., Edwards, T. L., Fettweis, X., Payne, A. J., and Shannon, S.: Sensitivity of Greenland Ice Sheet projections to model formulations, J. Glaciol., 59, 733–749, https://doi.org/10.3189/2013JoG12J182, 2013.
Goelzer, H., Nowicki, S., Payne, A., Larour, E., Seroussi, H., Lipscomb, W. H., Gregory, J., Abe-Ouchi, A., Shepherd, A., Simon, E., Agosta, C., Alexander, P., Aschwanden, A., Barthel, A., Calov, R., Chambers, C., Choi, Y., Cuzzone, J., Dumas, C., Edwards, T., Felikson, D., Fettweis, X., Golledge, N. R., Greve, R., Humbert, A., Huybrechts, P., Le clec'h, S., Lee, V., Leguy, G., Little, C., Lowry, D. P., Morlighem, M., Nias, I., Quiquet, A., Rückamp, M., Schlegel, N.-J., Slater, D. A., Smith, R. S., Straneo, F., Tarasov, L., van de Wal, R., and van den Broeke, M.: The future sea-level contribution of the Greenland ice sheet: a multi-model ensemble study of ISMIP6, The Cryosphere, 14, 3071–3096, https://doi.org/10.5194/tc-14-3071-2020, 2020.
Golledge, N. R., Hubbard, A., and Sugden, D. E.: High-resolution numerical simulation of Younger Dryas glaciation in Scotland, Quaternary Sci. Rev., 27, 888–904, https://doi.org/10.1016/j.quascirev.2008.01.019, 2008.
Grant, G. R., Naish, T. R., Dunbar, G. B., Stocchi, P., Kominz, M. A., Kamp, P. J. J., Tapia, C. A., McKay, R. M., Levy, R. H., and Patterson, M. O.: The amplitude and origin of sea-level variability during the Pliocene epoch, Nature, 574, 237–241, https://doi.org/10.1038/s41586-019-1619-z, 2019.
Gudmundsson, G. H.: Transmission of basal variability to a glacier surface, J. Geophys. Res.-Sol. Ea., 108, 1–19, https://doi.org/10.1029/2002jb002107, 2003.
Hall, A. M., Ebert, K., Kleman, J., Nesje, A., and Ottesen, D.: Selective glacial erosion on the Norwegian passive margin, Geology, 41, 1203–1206, https://doi.org/10.1130/G34806.1, 2013.
Haran, T., Bohlander, J., Scambos, T., Painter, T., and Fahnestock, M.: MEaSUREs MODIS Mosaic of Greenland (MOG) 2005, 2010, and 2015 Image Maps, Version 2, Boulder, Colorado USA, NASA National Snow and Ice Data Center Distributed Active Archive Center [data set], https://doi.org/10.5067/9ZO79PHOTYE5, 2018.
Haug, G. H. and Tiedemann, R.: Effect of the formation of the Isthmus of Panama on Atlantic Ocean thermohaline circulation, Nature, 393, 673–676, https://doi.org/10.1038/31447, 1998.
Haywood, A. M., Dowsett, H. J., and Dolan, A. M.: Integrating geological archives and climate models for the mid-Pliocene warm period, Nat. Commun., 7, 10646, https://doi.org/10.1038/ncomms10646, 2016a.
Haywood, A. M., Dowsett, H. J., Dolan, A. M., Rowley, D., Abe-Ouchi, A., Otto-Bliesner, B., Chandler, M. A., Hunter, S. J., Lunt, D. J., Pound, M., and Salzmann, U.: The Pliocene Model Intercomparison Project (PlioMIP) Phase 2: scientific objectives and experimental design, Clim. Past, 12, 663–675, https://doi.org/10.5194/cp-12-663-2016, 2016b.
Haywood, A. M., Tindall, J. C., Dowsett, H. J., Dolan, A. M., Foley, K. M., Hunter, S. J., Hill, D. J., Chan, W.-L., Abe-Ouchi, A., Stepanek, C., Lohmann, G., Chandan, D., Peltier, W. R., Tan, N., Contoux, C., Ramstein, G., Li, X., Zhang, Z., Guo, C., Nisancioglu, K. H., Zhang, Q., Li, Q., Kamae, Y., Chandler, M. A., Sohl, L. E., Otto-Bliesner, B. L., Feng, R., Brady, E. C., von der Heydt, A. S., Baatsen, M. L. J., and Lunt, D. J.: The Pliocene Model Intercomparison Project Phase 2: large-scale climate features and climate sensitivity, Clim. Past, 16, 2095–2123, https://doi.org/10.5194/cp-16-2095-2020, 2020.
Helland, P. E. and Holmes, M. A.: Surface textural analysis of quartz sand grains from ODP site 918 off the southeast coast of Greenland suggests glaciation of southern Greenland at 11 Ma, Palaeogeogr. Palaeoclim., 135, 109–121, https://doi.org/10.1016/S0031-0182(97)00025-4, 1997.
Henriksen, N., Higgins, A. K., Kalsbeek, F., and Pulvertaft, T. C. R.: Greenland from Archaean to Quaternary: Descriptive text to the 1995 Geological map of Greenland, 1:2500000, 2nd Edn., Geol. Surv. Denmark Greenl. Bull., 18, 1–126, https://doi.org/10.34194/geusb.v18.4993, 2009.
Herman, F., Beyssac, O., Brughelli, M., Lane, S. N., Leprince, S., Adatte, T., Lin, J. Y. Y., Avouac, J. P., and Cox, S. C.: Erosion by an Alpine glacier, Science, 350, 193–195, https://doi.org/10.1126/science.aab2386, 2015.
Howat, I. M., Negrete, A., and Smith, B. E.: The Greenland Ice Mapping Project (GIMP) land classification and surface elevation data sets, The Cryosphere, 8, 1509–1518, https://doi.org/10.5194/tc-8-1509-2014, 2014.
Howat, I., Negrete, A., and Smith, B.: MEaSUREs Greenland Ice Mapping Project (GrIMP) Digital Elevation Model from GeoEye and WorldView Imagery, Version 2, Boulder, Colorado USA, NASA National Snow and Ice Data Center Distributed Active Archive Center [data set], https://doi.org/10.5067/BHS4S5GAMFVY, 2022.
Jamieson, S. S. R., Ross, N., Paxman, G. J. G., Clubb, F. J., Young, D. A., Yan, S., Greenbaum, J., Blankenship, D. D., and Siegert, M. J.: An ancient river landscape preserved beneath the East Antarctic Ice Sheet, Nat. Commun., 14, 6507, https://doi.org/10.1038/s41467-023-42152-2, 2023.
Jansen, E., Fronval, T., Rack, F., and Channell, J. E. T.: Pliocene-Pleistocene ice rafting history and cyclicity in the Nordic Seas during the last 3.5 Myr, Paleoceanography, 15, 709–721, https://doi.org/10.1029/1999PA000435, 2000.
Japsen, P., Green, P. F., and Chalmers, J. A.: The mountains of North-East Greenland are not remnants of the Caledonian topography. A comment on Pedersen et al. (2012): Tectonophysics vol. 530–531, 318–330, Tectonophysics, 589, 234–238, https://doi.org/10.1016/j.tecto.2012.07.026, 2013.
Japsen, P., Green, P. F., Bonow, J. M., Nielsen, T. F. D., and Chalmers, J. A.: From volcanic plains to glaciated peaks: Burial, uplift and exhumation history of southern East Greenland after opening of the NE Atlantic, Global Planet. Change, 116, 91–114, https://doi.org/10.1016/j.gloplacha.2014.01.012, 2014.
Japsen, P., Green, P. F., Chalmers, J. A., and Bonow, J. M.: Episodes of post-Caledonian burial and exhumation in Greenland and Fennoscandia, Earth-Sci. Rev., 248, 104626, https://doi.org/10.1016/j.earscirev.2023.104626, 2024.
Joughin, I., Smith, B. E., and Howat, I. M.: A complete map of Greenland ice velocity derived from satellite data collected over 20 years, J. Glaciol., 64, 1–11, https://doi.org/10.1017/jog.2017.73, 2018.
Kerr, A. and Sugden, D.: The sensitivity of the south chilean snowline to climatic change, Climatic Change, 28, 255–272, https://doi.org/10.1007/BF01104136, 1994.
Kleman, J.: Preservation of landforms under ice sheets and ice caps, Geomorphology, 9, 19–32, https://doi.org/10.1016/0169-555X(94)90028-0, 1994.
Kleman, J., Stroeven, A. P., and Lundqvist, J.: Patterns of Quaternary ice sheet erosion and deposition in Fennoscandia and a theoretical framework for explanation, Geomorphology, 97, 73–90, https://doi.org/10.1016/j.geomorph.2007.02.049, 2008.
Knutz, P. C., Newton, A. M. W., Hopper, J. R., Huuse, M., Gregersen, U., Sheldon, E., and Dybkjær, K.: Eleven phases of Greenland Ice Sheet shelf-edge advance over the past 2.7 million years, Nat. Geosci., 12, 361–368, https://doi.org/10.1038/s41561-019-0340-8, 2019.
Koenig, S. J., Dolan, A. M., de Boer, B., Stone, E. J., Hill, D. J., DeConto, R. M., Abe-Ouchi, A., Lunt, D. J., Pollard, D., Quiquet, A., Saito, F., Savage, J., and van de Wal, R.: Ice sheet model dependency of the simulated Greenland Ice Sheet in the mid-Pliocene, Clim. Past, 11, 369–381, https://doi.org/10.5194/cp-11-369-2015, 2015.
Koppes, M. N. and Montgomery, D. R.: The relative efficacy of fluvial and glacial erosion over modern to orogenic timescales, Nat. Geosci., 2, 644–647, https://doi.org/10.1038/ngeo616, 2009.
Koppes, M. N., Hallet, B., Rignot, E., Mouginot, J., Wellner, J. S., and Boldt, K.: Observed latitudinal variations in erosion as a function of glacier dynamics, Nature, 526, 100–103, https://doi.org/10.1038/nature15385, 2015.
Larsen, H. C., Saunders, A. D., Clift, P. D., Beget, J., Wei, W., and Spezzaferri, S.: Seven million years of glaciation in Greenland, Science, 264, 952–955, https://doi.org/10.1126/science.264.5161.952, 1994.
Lea, E. J., Jamieson, S. S. R., and Bentley, M. J.: Alpine topography of the Gamburtsev Subglacial Mountains, Antarctica, mapped from ice sheet surface morphology, The Cryosphere Discuss. [preprint], https://doi.org/10.5194/tc-2023-94, in review, 2023.
Le Brocq, A. M., Hubbard, A., Bentley, M. J., and Bamber, J. L.: Subglacial topography inferred from ice surface terrain analysis reveals a large un-surveyed basin below sea level in East Antarctica, Geophys. Res. Lett., 35, L16503, https://doi.org/10.1029/2008GL034728, 2008.
Lecavalier, B. S., Milne, G. A., Simpson, M. J. R., Wake, L., Huybrechts, P., Tarasov, L., Kjeldsen, K. K., Funder, S., Long, A. J., Woodroffe, S., Dyke, A. S., and Larsen, N. K.: A model of Greenland ice sheet deglaciation constrained by observations of relative sea level and ice extent, Quaternary Sci. Rev., 102, 54–84, https://doi.org/10.1016/j.quascirev.2014.07.018, 2014.
Lesnek, A. J., Briner, J. P., Young, N. E., and Cuzzone, J. K.: Maximum Southwest Greenland Ice Sheet Recession in the Early Holocene, Geophys. Res. Lett., 47, 1–11, https://doi.org/10.1029/2019GL083164, 2020.
Lisiecki, L. E. and Raymo, M. E.: A Pliocene-Pleistocene stack of 57 globally distributed benthic δ18O records, Paleoceanography, 20, 1–17, https://doi.org/10.1029/2004PA001071, 2005.
Livingstone, S. J., Chu, W., Ely, J. C., and Kingslake, J.: Paleofluvial and subglacial channel networks beneath Humboldt Glacier, Greenland, Geology, 45, 551–554, https://doi.org/10.1130/G38860.1, 2017.
Lliboutry, L. and Duval, P.: Various isotropic and anisotropic ices found in glaciers and polar ice caps and their corresponding rheologies, Int. J. Rock Mech. Min. Sci. Geomech. Abstr., 22, 198, https://doi.org/10.1016/0148-9062(85)90267-0, 1985.
Lunt, D. J., Foster, G. L., Haywood, A. M., and Stone, E. J.: Late Pliocene Greenland glaciation controlled by a decline in atmospheric CO2 levels, Nature, 454, 1102–1105, https://doi.org/10.1038/nature07223, 2008.
Lunt, D. J., Haywood, A. M., Foster, G. L., and Stone, E. J.: The Arctic cryosphere in the Mid-Pliocene and the future, Philos. T. R. Soc. A, 367, 49–67, https://doi.org/10.1098/rsta.2008.0218, 2009.
MacGregor, J. A., Fahnestock, M. A., Catania, G. A., Paden, J. D., Prasad Gogineni, S., Young, S. K., Rybarski, S. C., Mabrey, A. N., Wagman, B. M., and Morlighem, M.: Radiostratigraphy and age structure of the Greenland Ice Sheet, J. Geophys. Res.-Earth, 120, 212–241, https://doi.org/10.1002/2014JF003215, 2015.
MacGregor, J. A., Boisvert, L. N., Medley, B., Petty, A. A., Harbeck, J. P., Bell, R. E., Blair, J. B., Blanchard-Wrigglesworth, E., Buckley, E. M., Christoffersen, M. S., Cochran, J. R., Csathó, B. M., De Marco, E. L., Dominguez, R. T., Fahnestock, M. A., Farrell, S. L., Gogineni, S. P., Greenbaum, J. S., Hansen, C. M., Hofton, M. A., Holt, J. W., Jezek, K. C., Koenig, L. S., Kurtz, N. T., Kwok, R., Larsen, C. F., Leuschen, C. J., Locke, C. D., Manizade, S. S., Martin, S., Neumann, T. A., Nowicki, S. M. J., Paden, J. D., Richter-Menge, J. A., Rignot, E. J., Rodríguez-Morales, F., Siegfried, M. R., Smith, B. E., Sonntag, J. G., Studinger, M., Tinto, K. J., Truffer, M., Wagner, T. P., Woods, J. E., Young, D. A., and Yungel, J. K.: The Scientific Legacy of NASA's Operation IceBridge, Rev. Geophys., 59, 1–65, https://doi.org/10.1029/2020RG000712, 2021.
MacGregor, J. A., Chu, W., Colgan, W. T., Fahnestock, M. A., Felikson, D., Karlsson, N. B., Nowicki, S. M. J., and Studinger, M.: GBaTSv2: a revised synthesis of the likely basal thermal state of the Greenland Ice Sheet, The Cryosphere, 16, 3033–3049, https://doi.org/10.5194/tc-16-3033-2022, 2022.
Martos, Y. M., Jordan, T. A., Catalán, M., Jordan, T. M., Bamber, J. L., and Vaughan, D. G.: Geothermal Heat Flux Reveals the Iceland Hotspot Track Underneath Greenland, Geophys. Res. Lett., 8214–8222, https://doi.org/10.1029/2018GL078289, 2018.
McClymont, E. L., Ho, S. L., Ford, H. L., Bailey, I., Berke, M. A., Bolton, C. T., De Schepper, S., Grant, G. R., Groeneveld, J., Inglis, G. N., Karas, C., Patterson, M. O., Swann, G. E. A., Thirumalai, K., White, S. M., Alonso-Garcia, M., Anand, P., Hoogakker, B. A. A., Littler, K., Petrick, B. F., Risebrobakken, B., Abell, J. T., Crocker, A. J., de Graaf, F., Feakins, S. J., Hargreaves, J. C., Jones, C. L., Markowska, M., Ratnayake, A. S., Stepanek, C., and Tangunan, D.: Climate Evolution Through the Onset and Intensification of Northern Hemisphere Glaciation, Rev. Geophys., 61, e2022RG000793, https://doi.org/10.1029/2022RG000793, 2023.
Medvedev, S., Souche, A., and Hartz, E. H.: Influence of ice sheet and glacial erosion on passive margins of Greenland, Geomorphology, 193, 36–46, https://doi.org/10.1016/j.geomorph.2013.03.029, 2013.
Melles, M., Brigham-Grette, J., Minyuk, P. S., Nowaczyk, N. R., Wennrich, V., DeConto, R. M., Anderson, P. M., Andreev, A. A., Coletti, A., Cook, T. L., Haltia-Hovi, E., Kukkonen, M., Lozhkin, A. V., Rosen, P., Tarasov, P., Vogel, H., and Wagner, B.: 2.8 Million Years of Arctic Climate Change from Lake El'gygytgyn, NE Russia, Science, 337, 315–320, https://doi.org/10.1126/science.1222135, 2012.
Morlighem, M., Williams, C. N., Rignot, E., An, L., Arndt, J. E., Bamber, J. L., Catania, G., Chauché, N., Dowdeswell, J. A., Dorschel, B., Fenty, I., Hogan, K., Howat, I., Hubbard, A., Jakobsson, M., Jordan, T. M., Kjeldsen, K. K., Millan, R., Mayer, L., Mouginot, J., Noël, B. P. Y., O'Cofaigh, C., Palmer, S., Rysgaard, S., Seroussi, H., Siegert, M. J., Slabon, P., Straneo, F., van den Broeke, M. R., Weinrebe, W., Wood, M., and Zinglersen, K. B.: BedMachine v3: Complete Bed Topography and Ocean Bathymetry Mapping of Greenland From Multibeam Echo Sounding Combined With Mass Conservation, Geophys. Res. Lett., 44, 11051–11061, https://doi.org/10.1002/2017GL074954, 2017.
Morlighem, M., et al.: IceBridge BedMachine Greenland, Version 5. Distributed by NASA National Snow and Ice Data Center Distributed Active Archive Center [data set], https://doi.org/10.5067/GMEVBWFLWA7X, 2022.
Mudelsee, M. and Raymo, M. E.: Slow dynamics of the Northern Hemisphere glaciation, Paleoceanography, 20, PA4022, https://doi.org/10.1029/2005PA001153, 2005.
Ng, F. S. L., Ignéczi, Á., Sole, A. J., and Livingstone, S. J.: Response of Surface Topography to Basal Variability Along Glacial Flowlines, J. Geophys. Res.-Earth, 123, 2319–2340, https://doi.org/10.1029/2017JF004555, 2018.
Nicola, L., Notz, D., and Winkelmann, R.: Revisiting temperature sensitivity: how does Antarctic precipitation change with temperature?, The Cryosphere, 17, 2563–2583, https://doi.org/10.5194/tc-17-2563-2023, 2023.
Nielsen, T. and Kuijpers, A.: Only 5 southern Greenland shelf edge glaciations since the early Pliocene, Sci. Rep., 3, 1–5, https://doi.org/10.1038/srep01875, 2013.
Noël, B., van de Berg, W. J., Lhermitte, S., and van den Broeke, M. R.: Rapid ablation zone expansion amplifies north Greenland mass loss, Sci. Adv., 5, 2–11, https://doi.org/10.1126/sciadv.aaw0123, 2019.
Paterson, W. S. B. and Budd, W. F.: Flow parameters for ice sheet modeling, Cold Reg. Sci. Technol., 6, 175–177, https://doi.org/10.1016/0165-232X(82)90010-6, 1982.
Patton, H., Swift, D. A., Clark, C. D., Livingstone, S. J., and Cook, S. J.: Distribution and characteristics of overdeepenings beneath the Greenland and Antarctic ice sheets: Implications for overdeepening origin and evolution, Quaternary Sci. Rev., 148, 128–145, https://doi.org/10.1016/j.quascirev.2016.07.012, 2016.
Patton, H., Hubbard, A., Heyman, J., Alexandropoulou, N., Lasabuda, A. P. E., Stroeven, A. P., Hall, A. M., Winsborrow, M., Sugden, D. E., Kleman, J., and Andreassen, K.: The extreme yet transient nature of glacial erosion, Nat. Commun., 13, 7377, https://doi.org/10.1038/s41467-022-35072-0, 2022.
Paxman, G. J. G.: Patterns of valley incision beneath the Greenland Ice Sheet revealed using automated mapping and classification, Geomorphology, 436, 108778, https://doi.org/10.1016/j.geomorph.2023.108778, 2023a.
Paxman, G. J. G.: Automated mapping and classification of valleys beneath the Greenland Ice Sheet: Datasets (1.0), Zenodo [data set], https://doi.org/10.5281/zenodo.7794565, 2023b.
Paxman, G. J. G., Tinto, K. J., and Austermann, J.: Neogene–Quaternary uplift and landscape evolution in northern Greenland recorded by subglacial valley morphology, J. Geophys. Res.-Earth, 126, 1–24, https://doi.org/10.1029/2021JF006395, 2021.
Paxman, G. J. G., Austermann, J., and Hollyday, A.: Total isostatic response to the complete unloading of the Greenland and Antarctic Ice Sheets, Sci. Rep., 12, 11399, https://doi.org/10.1038/s41598-022-15440-y, 2022a.
Paxman, G. J. G., Austermann, J., and Hollyday, A.: Grid files of the total isostatic response to the complete unloading of the Greenland and Antarctic Ice Sheets (version 2), Arctic Data Center [data set], https://doi.org/10.18739/A2WS8HN3C, 2022b.
Paxman, G., Jamieson, S., Dolan, A., and Bentley, M.: Subglacial valleys preserved in the highlands of south and east Greenland record restricted ice extent during past warmer climates: Datasets (2.0), Zenodo [data set], https://doi.org/10.5281/zenodo.10649455, 2024.
Pedersen, V. K., Nielsen, S. B., and Gallagher, K.: The post-orogenic evolution of the Northeast Greenland Caledonides constrained from apatite fission track analysis and inverse geodynamic modelling, Tectonophysics, 530–531, 318–330, https://doi.org/10.1016/j.tecto.2012.01.018, 2012.
Pedersen, V. K., Braun, J., and Huismans, R. S.: Eocene to mid-Pliocene landscape evolution in Scandinavia inferred from offshore sediment volumes and pre-glacial topography using inverse modelling, Geomorphology, 303, 467–485, https://doi.org/10.1016/j.geomorph.2017.11.025, 2018.
Pedersen, V. K., Larsen, N. K., and Egholm, D. L.: The timing of fjord formation and early glaciations in North and Northeast Greenland, Geology, 47, 682–686, https://doi.org/10.1130/G46064.1, 2019.
Pérez, L. F., Nielsen, T., Knutz, P. C., Kuijpers, A., and Damm, V.: Large-scale evolution of the central-east Greenland margin: New insights to the North Atlantic glaciation history, Global Planet. Change, 163, 141–157, https://doi.org/10.1016/j.gloplacha.2017.12.010, 2018.
Plach, A., Nisancioglu, K. H., Le clec'h, S., Born, A., Langebroek, P. M., Guo, C., Imhof, M., and Stocker, T. F.: Eemian Greenland SMB strongly sensitive to model choice, Clim. Past, 14, 1463–1485, https://doi.org/10.5194/cp-14-1463-2018, 2018.
Porter, S. C.: Some geological implications of average Quaternary glacial conditions, Quaternary Res., 32, 245–261, https://doi.org/10.1016/0033-5894(89)90092-6, 1989.
Rémy, F. and Minster, J.-F.: Antarctica Ice Sheet Curvature and its relation with ice flow and boundary conditions, Geophys. Res. Lett., 24, 1039–1042, https://doi.org/10.1029/97GL00959, 1997.
Reyes, A. V., Carlson, A. E., Beard, B. L., Hatfield, R. G., Stoner, J. S., Winsor, K., Welke, B., and Ullman, D. J.: South Greenland ice-sheet collapse during Marine Isotope Stage 11, Nature, 510, 525–528, https://doi.org/10.1038/nature13456, 2014.
Rezvanbehbahani, S., Stearns, L. A., Kadivar, A., Walker, J. D., and van der Veen, C. J.: Predicting the Geothermal Heat Flux in Greenland: A Machine Learning Approach, Geophys. Res. Lett., 44, 12271–12279, https://doi.org/10.1002/2017GL075661, 2017.
Robinson, A., Alvarez-Solas, J., Calov, R., Ganopolski, A., and Montoya, M.: MIS-11 duration key to disappearance of the Greenland ice sheet, Nat. Commun., 8, 1–7, https://doi.org/10.1038/ncomms16008, 2017.
Rose, K. C., Ferraccioli, F., Jamieson, S. S. R., Bell, R. E., Corr, H., Creyts, T. T., Braaten, D., Jordan, T. A., Fretwell, P. T., and Damaske, D.: Early East Antarctic Ice Sheet growth recorded in the landscape of the Gamburtsev Subglacial Mountains, Earth Planet. Sc. Lett., 375, 1–12, https://doi.org/10.1016/j.epsl.2013.03.053, 2013.
Ross, N., Jordan, T. A., Bingham, R. G., Corr, H. F. J., Ferraccioli, F., Le Brocq, A. M., Rippin, D. M., Wright, A. P., and Siegert, M. J.: The Ellsworth Subglacial Highlands: Inception and retreat of the West Antarctic Ice Sheet, Geol. Soc. Am. Bull., 126, 3–15, https://doi.org/10.1130/B30794.1, 2014.
Ruddiman, W. F. and Kutzbach, J. E.: Forcing of late Cenozoic Northern Hemisphere climate by plateau uplift in southern Asia and the American west, J. Geophys. Res., 94, 18409–18427, https://doi.org/10.1029/jd094id15p18409, 1989.
Schaefer, J. M., Finkel, R. C., Balco, G., Alley, R. B., Caffee, M. W., Briner, J. P., Young, N. E., Gow, A. J., and Schwartz, R.: Greenland was nearly ice-free for extended periods during the Pleistocene, Nature, 540, 252–255, https://doi.org/10.1038/nature20146, 2016.
Seguinot, J. and Delaney, I.: Last-glacial-cycle glacier erosion potential in the Alps, Earth Surf. Dynam., 9, 923–935, https://doi.org/10.5194/esurf-9-923-2021, 2021.
Seguinot, J., Ivy-Ochs, S., Jouvet, G., Huss, M., Funk, M., and Preusser, F.: Modelling last glacial cycle ice dynamics in the Alps, The Cryosphere, 12, 3265–3285, https://doi.org/10.5194/tc-12-3265-2018, 2018.
Solgaard, A. M., Reeh, N., Japsen, P., and Nielsen, T.: Snapshots of the Greenland ice sheet configuration in the Pliocene to early Pleistocene, J. Glaciol., 57, 871–880, https://doi.org/10.3189/002214311798043816, 2011.
Solgaard, A. M., Bonow, J. M., Langen, P. L., Japsen, P., and Hvidberg, C. S.: Mountain building and the initiation of the Greenland Ice Sheet, Palaeogeogr. Palaeoclim., 392, 161–176, https://doi.org/10.1016/j.palaeo.2013.09.019, 2013.
Spagnolo, M., Rea, B. R., and Barr, I.: The (mis)conception of average Quaternary conditions, Quaternary Res., 105, 235–240, https://doi.org/10.1017/qua.2021.48, 2022.
Steffen, R., Audet, P., and Lund, B.: Weakened Lithosphere Beneath Greenland Inferred From Effective Elastic Thickness: A Hot Spot Effect?, Geophys. Res. Lett., 45, 4733–4742, https://doi.org/10.1029/2017GL076885, 2018.
St. John, K. E. K. and Krissek, L. A.: The late Miocene to Pleistocene ice-rafting history of Southeast Greenland, Boreas, 31, 28–35, https://doi.org/10.1111/j.1502-3885.2002.tb01053.x, 2002.
Straneo, F. and Heimbach, P.: North Atlantic warming and the retreat of Greenland's outlet glaciers, Nature, 504, 36–43, https://doi.org/10.1038/nature12854, 2013.
Suwa, M., von Fischer, J. C., Bender, M. L., Landais, A., and Brook, E. J.: Chronology reconstruction for the disturbed bottom section of the GISP2 and the GRIP ice cores: Implications for Termination II in Greenland, J. Geophys. Res.-Atmos., 111, 1–12, https://doi.org/10.1029/2005JD006032, 2006.
Tan, N., Ladant, J. B., Ramstein, G., Dumas, C., Bachem, P., and Jansen, E.: Dynamic Greenland ice sheet driven by pCO2 variations across the Pliocene Pleistocene transition, Nat. Commun., 9, 1–9, https://doi.org/10.1038/s41467-018-07206-w, 2018.
The Imbie Team: Mass balance of the Greenland Ice Sheet from 1992 to 2018, Nature, 579, 233–239, https://doi.org/10.1038/s41586-019-1855-2, 2020.
Tripati, A. and Darby, D.: Evidence for ephemeral middle Eocene to early Oligocene Greenland glacial ice and pan-Arctic sea ice, Nat. Commun., 9, 1–11, https://doi.org/10.1038/s41467-018-03180-5, 2018.
Wara, M. W., Ravelo, A. C., and Delaney, M. L.: Climate change: Permanent El Niño-like conditions during the Pliocene warm period, Science, 309, 758–761, https://doi.org/10.1126/science.1112596, 2005.
WCRP Global Sea Level Budget Group: Global sea-level budget 1993–present, Earth Syst. Sci. Data, 10, 1551–1590, https://doi.org/10.5194/essd-10-1551-2018, 2018.
Wessel, P., Luis, J. F., Uieda, L., Scharroo, R., Wobbe, F., Smith, W. H. F., and Tian, D.: The Generic Mapping Tools Version 6, Geochem. Geophys. Geosy., 20, 5556–5564, https://doi.org/10.1029/2019GC008515, 2019.
Westerhold, T., Marwan, N., Drury, A. J., Liebrand, D., Agnini, C., Anagnostou, E., Barnet, J. S. K., Bohaty, S. M., De Vleeschouwer, D., Florindo, F., Frederichs, T., Hodell, D. A., Holbourn, A. E., Kroon, D., Lauretano, V., Littler, K., Lourens, L. J., Lyle, M., Pälike, H., Röhl, U., Tian, J., Wilkens, R. H., Wilson, P. A., and Zachos, J. C.: An astronomically dated record of Earth's climate and its predictability over the last 66 million years, Science, 369, 1383–1388, https://doi.org/10.1126/SCIENCE.ABA6853, 2020.
Winkelmann, R., Martin, M. A., Haseloff, M., Albrecht, T., Bueler, E., Khroulev, C., and Levermann, A.: The Potsdam Parallel Ice Sheet Model (PISM-PIK) – Part 1: Model description, The Cryosphere, 5, 715–726, https://doi.org/10.5194/tc-5-715-2011, 2011.
Yau, A. M., Bender, M. L., Blunier, T., and Jouzel, J.: Setting a chronology for the basal ice at Dye-3 and GRIP: Implications for the long-term stability of the Greenland Ice Sheet, Earth Planet. Sc. Lett., 451, 1–9, https://doi.org/10.1016/j.epsl.2016.06.053, 2016.
Zhang, L., Hay, W. W., Wang, C., and Gu, X.: The evolution of latitudinal temperature gradients from the latest Cretaceous through the Present, Earth-Sci. Rev., 189, 147–158, https://doi.org/10.1016/j.earscirev.2019.01.025, 2019.
Zwally, H. J., Giovinetto, M. B., Beckley, M. A., and Saba, J. L.: Antarctic and Greenland Drainage Systems, GSFC Cryospheric Sciences Laboratory, http://icesat4.gsfc.nasa.gov/cryo_data/ant_grn_drainage_systems.php (last access: 12 June 2023), 2012.