the Creative Commons Attribution 4.0 License.
the Creative Commons Attribution 4.0 License.
 | 12 Mar 2020
Brief communication: Evaluation of the near-surface climate in ERA5 over the Greenland Ice Sheet
Alison Delhasse
Christoph Kittel
Charles Amory
Stefan Hofer
Dirk van As
Robert S. Fausto
Xavier Fettweis
The ERA5 reanalysis, recently made available by the European Centre for Medium-Range Weather Forecasts (ECMWF), is a new reanalysis product at a high resolution replacing ERA-Interim and is considered to provide the best climate reanalysis over Greenland to date. However, so far little is known about the performance of ERA5 over the Greenland Ice Sheet (GrIS). In this study, we compare the near-surface climate from the new ERA5 reanalysis to ERA-Interim, the Arctic System Reanalysis (ASR) as well as to a state-of-the-art polar regional climate model (MAR). The results show (1) that ERA5 does not outperform ERA-Interim significantly when compared with near-surface climate observations over GrIS, but ASR better models the near-surface temperature than both ERA reanalyses. (2) Polar regional climate models (e.g., MAR) are still a useful tool to downscale the GrIS climate compared to ERA5, as in particular the near-surface temperature in summer has a key role for representing snow and ice processes such as the surface melt. However, assimilating satellite data and using a more recent radiative scheme enable both ERA and ASR reanalyses to represent more satisfactorily than MAR the downward solar and infrared fluxes. (3) MAR near-surface climate is not affected when forced at its lateral boundaries by either ERA5 or ERA-Interim. Therefore, forcing polar regional climate models with ERA5 starting from 1950 will enable long and homogeneous surface mass balance reconstructions.
- Article
(1420 KB) - Full-text XML
-
Supplement
(228 KB) - BibTeX
- EndNote


Reanalyses are global datasets describing the recent history and current state of the atmosphere, land surface, and oceans. They merge sparse observations into a space- and time-continuous product over the whole Earth. These datasets, commonly used in geophysical sciences, enable for instance the evaluation of recent climate trends (e.g., Belleflamme et al., 2015; Hanna et al., 2018) and the constraint of numerical climate models at their boundaries (e.g., Stark et al., 2008; Fettweis et al., 2017; Noël et al., 2018).
The ERA5 reanalysis (Hersbach and Dick, 2016), recently made available by the European Centre for Medium-Range Weather Forecasts (ECMWF), is a new reanalysis product that has replaced ERA-Interim since 1 September 2019, considered until now the best reanalysis over Greenland (Chen et al., 2011; Jakobson et al., 2012; Lindsay et al., 2014; Fettweis et al., 2017). In addition to the model improvements listed in Hersbach and Dick (2016), ERA5 is available at higher vertical and spatial resolution (0.3∘) than ERA-Interim (0.75∘). This new generation of reanalysis products has been already evaluated over North America as forcing field for a land surface model (Albergel et al., 2018), over Europe (Urraca et al., 2018), and over the Arctic Ocean (Wang et al., 2019) but not yet over the Greenland Ice Sheet (GrIS).
Because of the finer resolution of ERA5 (∼31 km over the Equator and ∼15 km over Greenland), the question of the relevance of using regional reanalyses (e.g., Arctic System Reanalysis, ASR; Bromwich et al., 2016, 2018) or polar-oriented regional climate models (RCMs) (e.g., Fettweis et al., 2017; Noël et al., 2018) to study the near-surface climate of the GrIS can be raised. The spatial resolutions are now more similar, while the spatiotemporal evolution of snow pack properties, and the surface energy balance (Rae et al., 2012), remains poorly represented in global reanalyses (e.g., Bougamont et al., 2007; Reijmer et al., 2012; Goelzer et al., 2013; Vaughan et al., 2013; Vernon et al., 2013; van Kampenhout et al., 2019). Moreover, in the context of the substitution of the ERA-Interim reanalysis, it is relevant to assess the new product, ERA5, as a forcing dataset for (regional) climate models or positive degree day models simulating the surface mass balance (SMB), not yet represented in global reanalyses.
The main goals of this study are (1) to evaluate ERA5 against ERA-Interim and ASR reanalyses by comparison with a set of near-surface climate observations covering the GrIS not assimilated in the reanalyses (Ahlstrom et al., 2008), (2) to highlight the added value of using the state-of-the-art RCM MAR (Modèle Atmosphérique Régional, Fettweis et al., 2017) forced by both ERA-Interim and ERA5 to simulate the near-surface climate of the GrIS, and (3) to evaluate the sensitivity of MAR based near-surface climate to the forcing used (ERA-Interim and ERA5 reanalyses) at its lateral boundaries.
2.1 Reanalyses
2.1.1 The ERA-Interim reanalysis
The fourth-generation reanalysis from the ECMWF (ERA-Interim, Dee et al., 2011), available at a spatial resolution of ∼0.75∘ (about 41 km over Greenland) and a time resolution of 6-hourly for analysis fields, has been widely used over the Arctic (e.g., Kapsch et al., 2014; Simmons and Poli, 2015; Bieniek et al., 2016) and especially over Greenland (e.g., Lucas-Picher et al., 2012; Bennartz et al., 2013; Merz et al., 2013; Cox et al., 2014). The ERA-Interim reanalysis (EI hereafter) is considered the reference in this study.
2.1.2 The ERA5 reanalysis
The latest generation of ECMWF reanalyses, ERA5 (E5 hereafter; Hersbach and Dick, 2016), has a higher spatial resolution of ∼0.25∘ (about 15 km over Greenland) and higher temporal (hourly analysis fields and 3-hourly for the ensemble of data assimilation) output resolution than EI. E5 has replaced EI. E5 is now available from 1979 to near-real time, but it is planned to start in 1950. Besides the higher time and spatial resolution, the main improvements compared to EI consist in a higher number of vertical levels (137 versus 60 in EI), an improved 4D-Var assimilation system, more consistent sea surface condition input products, a globally better balance between precipitation and evaporation, and more (new) data assimilated (ECMWF, 2018).
2.1.3 The Arctic System Reanalysis
ASR is a regional reanalysis product for the Arctic region (Bromwich et al., 2016). ASR version 2 (called ASR hereafter; Bromwich et al., 2018) has a horizontal resolution (15 km) similar to E5 over Greenland and has 71 vertical levels. The outputs have a 3-hourly time resolution covering the 2000s (2010–2016) using version 3.6.0 of the Polar Weather Research Forecast model (Polar WRF, Skamarock et al., 2008) and the community WRF data assimilation system based on a 3D-Var technique. ASRv2 improves the comparison of near-surface climate variables with observations compared to ASRv1 and EI over the Arctic (Bromwich et al., 2018).
2.2 The model MAR
The model MAR is a RCM specifically designed for polar areas (Amory et al., 2015; Lang et al., 2015; Kittel et al., 2018; Agosta et al., 2019) and abundantly evaluated over Greenland (e.g., Fettweis et al., 2011, 2017). In this study, we use the last version of MAR (3.9.6). The main improvements compared to the previous MAR version used in Delhasse et al. (2018) are related to the computational efficiency of the model and its numerical stability. MAR is forced at its lateral boundaries (temperature, specific humidity, wind speed, pressure, sea surface temperature, and sea ice concentration) by EI and E5 reanalyses over Greenland at a spatial resolution of 15 km over 2010–2016. The MAR lateral boundaries are chosen to be far enough to enable the model to simulate its own climate in the atmospheric boundary layer over Greenland. These simulations are respectively called hereafter MAREI and MARE5.
2.3 Observations
2.3.1 PROMICE network
The PROMICE (Programme for Monitoring of the Greenland Ice Sheet) network (Ahlstrom et al., 2008) provides hourly measurements from automatic weather stations (AWSs) mainly in the ablation area of the GrIS since mid-2007. We use the PROMICE-generated daily-average values from 21 of the 25 AWSs available (see Sect. 2.3.2). PROMICE observations are assimilated neither in the reanalyses nor in MAR so that model output is truly independent of the observations.
2.3.2 Automatic weather stations
Among the time series from the 25 AWSs available in the PROMICE dataset, we dismissed the ones established after the end of our study period (2010–2016). The remaining 21 AWSs (Fig. 1) are mentioned in the Supplement (Table S1), also listing differences in elevation at the AWS sites between model and reality. For each of the model variables of interest (pressure, 2 m temperature, 10 m wind speed, shortwave and longwave downward radiative fluxes), we excluded the AWS (1) when there was too large of a difference in elevation between the station and the corresponding grid cells of all models ( m), and (2) data records clearly are subject to instrument malfunction. The AWSs are excluded and the reasons for their exclusion are listed in Table S2 of the Supplement. The robustness of the observed temperature time series has been improved with a selection criterion excluding measurements when the ventilation of the station is not active. An unventilated temperature can be significantly warm biased by solar radiation and thus cannot be considered reliable.
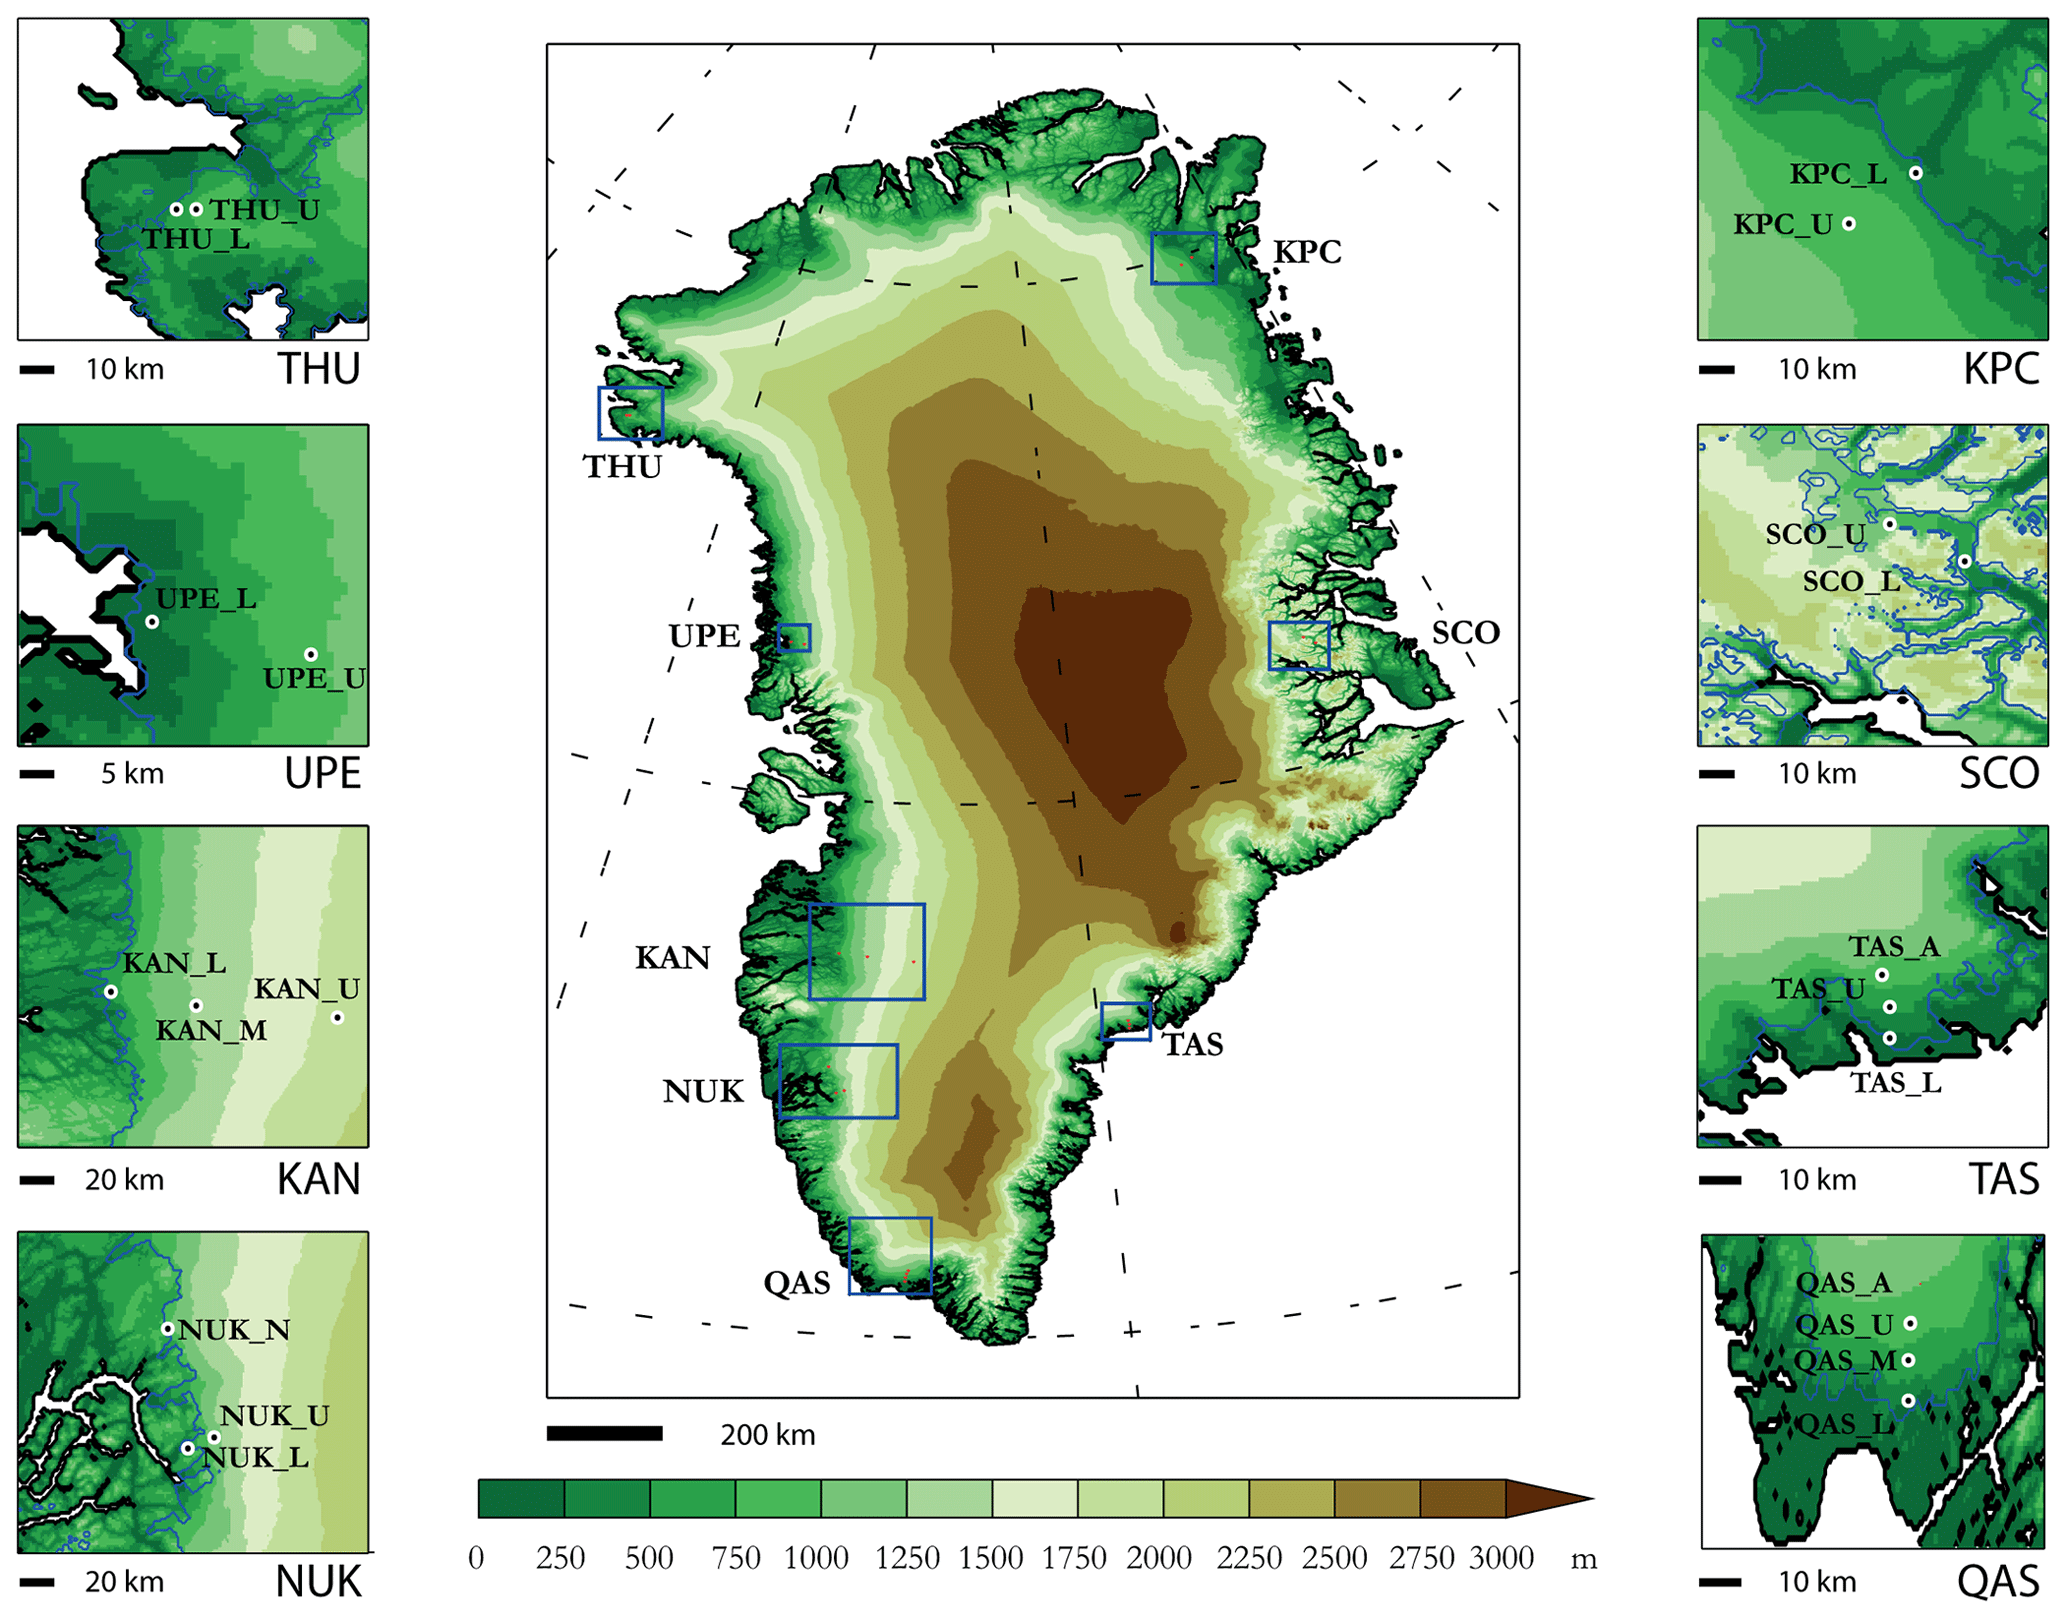
Figure 1Localization of the 21 AWSs from the PROMICE network used in the study. The blue lines in detailed maps represent the ice sheet margin.
2.3.3 Comparison method
When we stated our study, only the 2010–2017 period was available for E5, while ASRv2 is available until 2016. We have therefore limited the comparison to the time period spanning 2010–2016.
Here we assess the near-surface climate of the GrIS simulated by E5 against PROMICE observations at a daily timescale. We also compare it to the previous reanalysis generation, EI, the regional reanalysis ASR, and two MAR simulations. Four variables are evaluated here as proxy of the near-surface climate: 2 m temperature (T2 m), 10 m wind speed (W10 m), shortwave downward radiative flux (SWD), and longwave downward radiative flux (LWD).
Modeled values of these essential climate parameters are computed for each AWS location following an average-distance-weighted values of the four nearest grid points. To evaluate modeled values, we compare the correlation, the root-mean-square error (RMSE), the centered RMSE (RMSEc, Eq. S1 in the Supplement), and the mean bias (MB) between daily observations and each modeled dataset. These statistics are calculated for each day of AWS observations, averaged over 2010–2016 and for all AWSs, by applying a weighted average according to the number of available observations for each station.
For T2 m statistics, we initially tried to correct modeled temperature values from the altitude difference between the station and the model interpolated elevation with a time-variable vertical temperature gradient. As the comparisons did not improve, we concluded that applying such a correction would add more uncertainties than using the raw modeled fields without elevation correction.
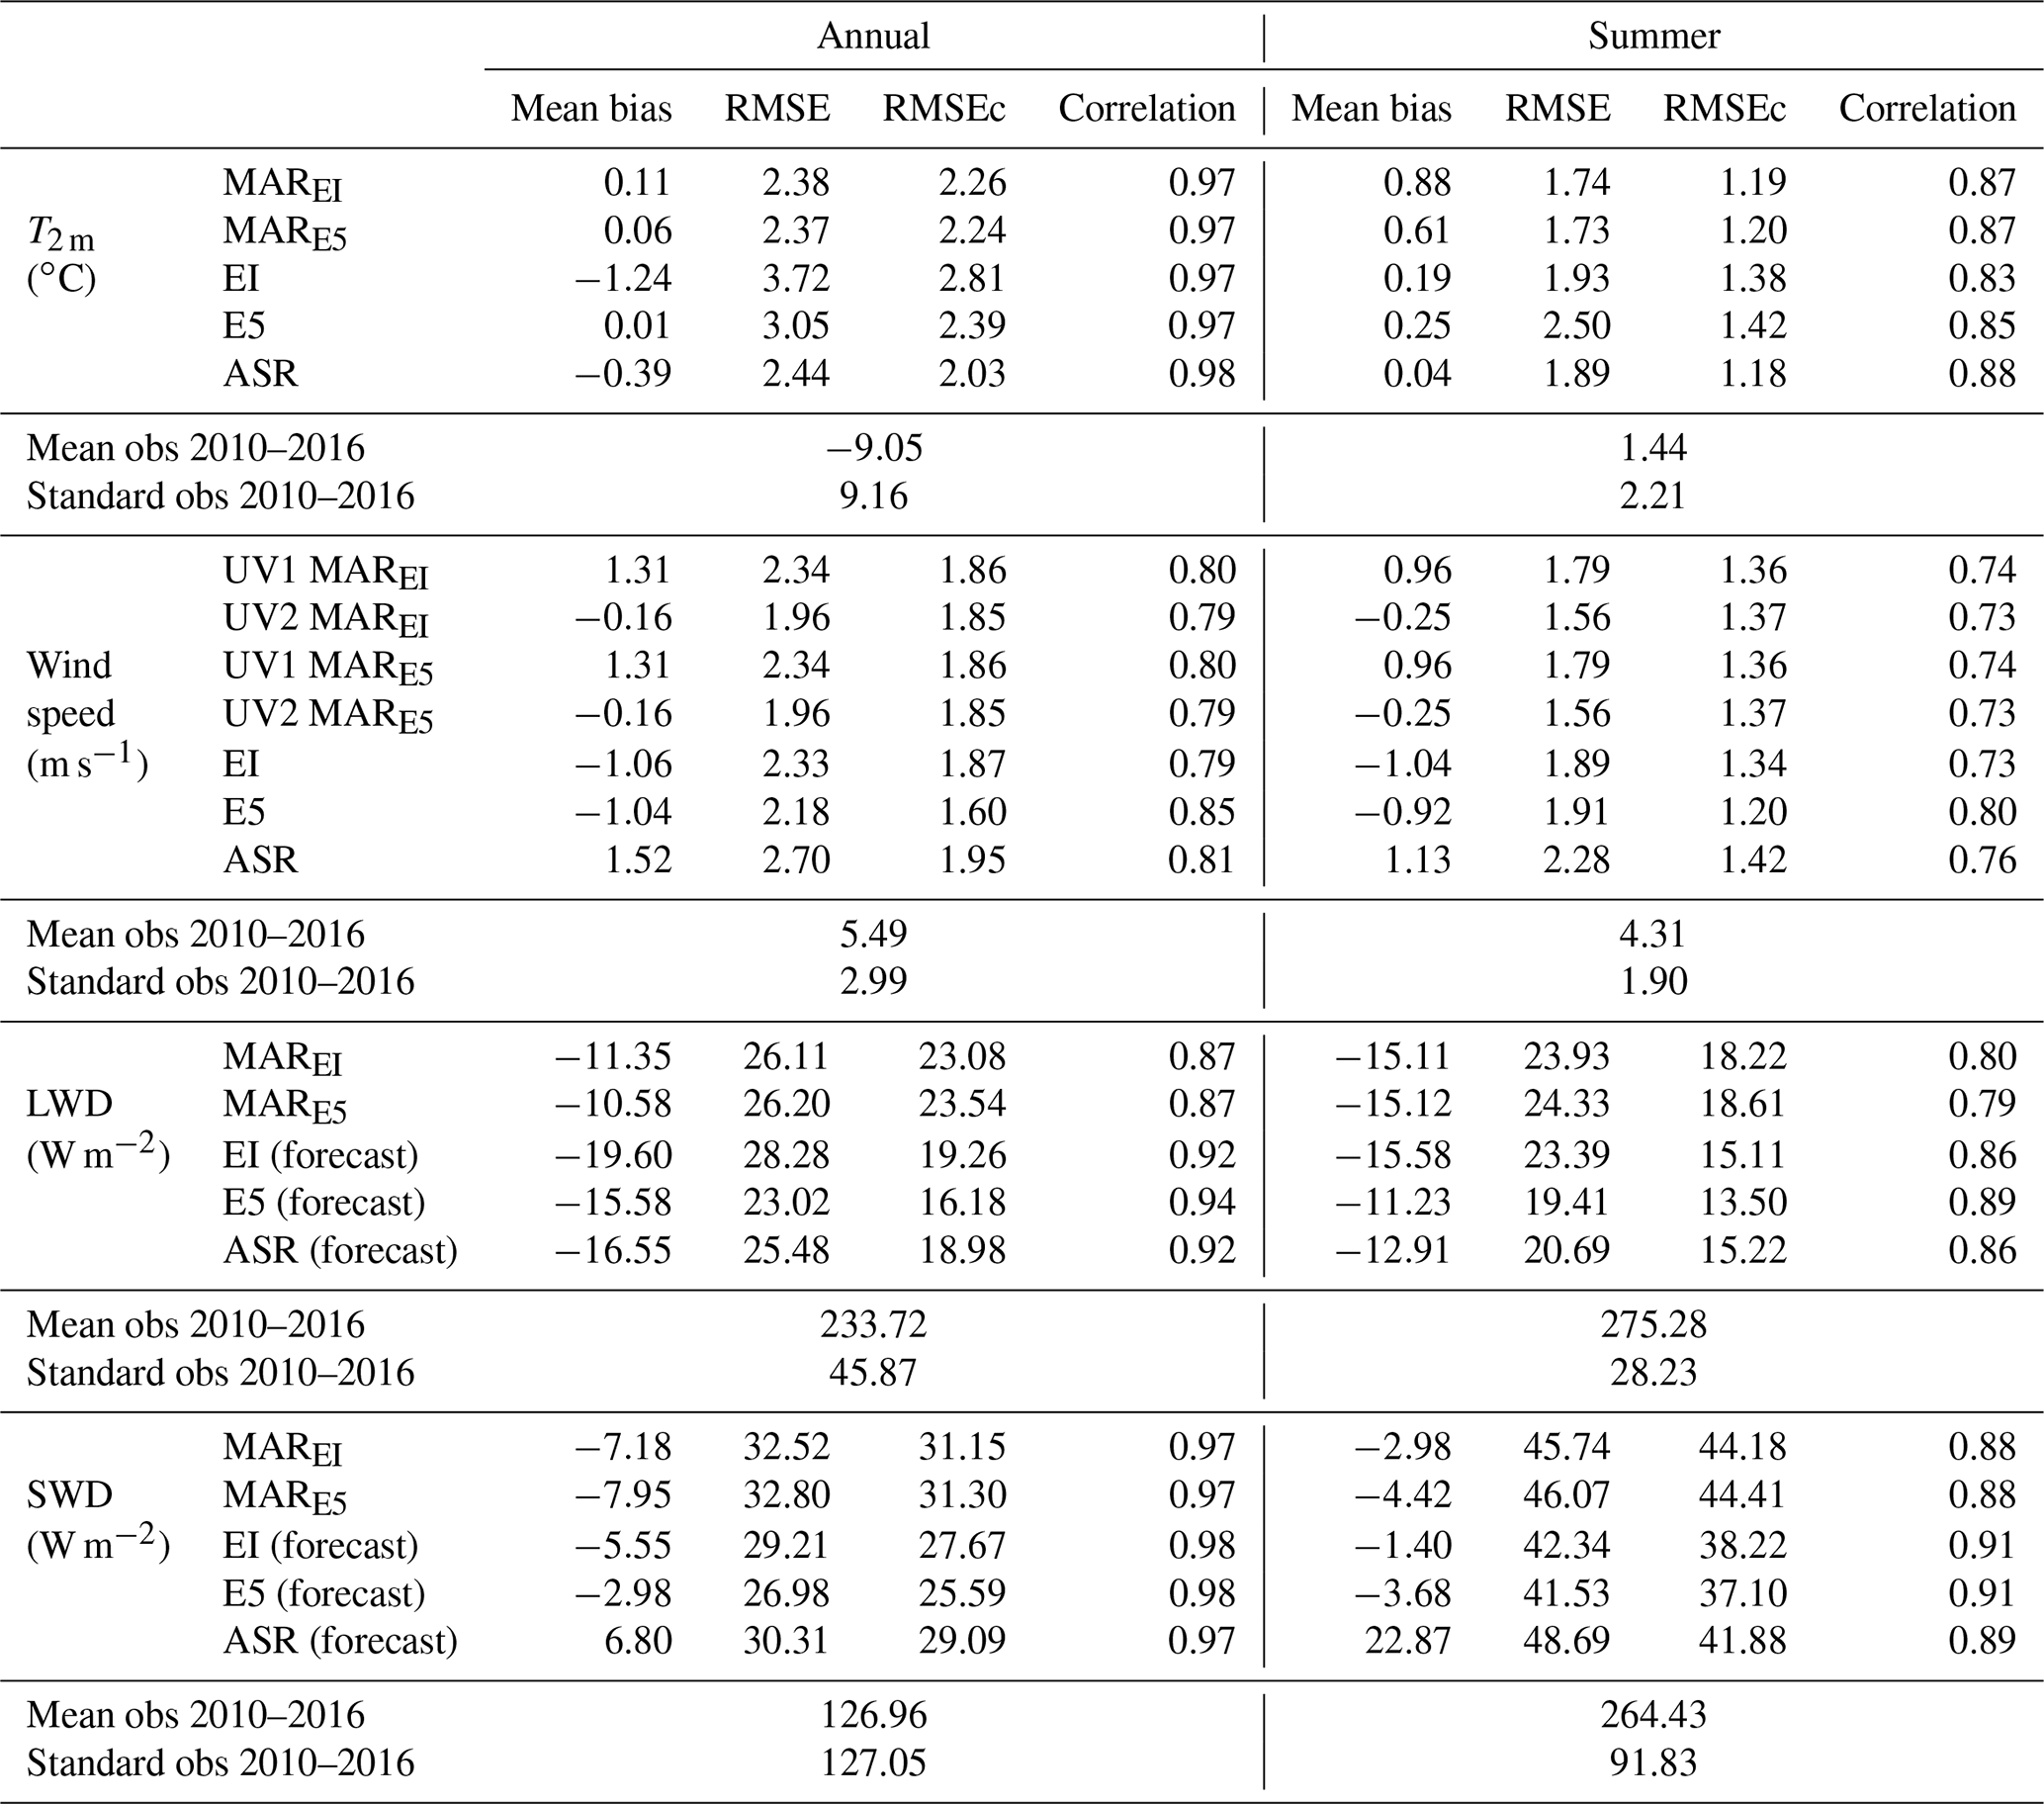
The comparison of daily observations and model values for the four main variables is summarized in Table 1. Before analyzing each variable in the next sections, it should be noted that all models succeed in representing the daily variability of surface pressure and then synoptic circulation with correlation values in the range 0.97–0.99 (listed in the Supplement, Tables S6–S10).
Table 1Mean bias, RMSE, centered RMSE (RMSEc), and correlation between daily observations from the PROMICE dataset and MAREI, MARE5, EI, E5, and ASR. Annual and summer statistics are given for the 2 m temperature (T2 m), the 10 m wind speed (W10 m), the longwave downward radiative flux (LWD), and the shortwave downward radiative flux (SWD) over 2010–2016. For the wind speed of both MAR simulation, statistics are given for 10E5 high (UV1) and 2E5 high (UV2).
3.1 Temperature
All model-generated temperatures correlate with PROMICE measurements with values exceeding 0.96 at the annual scale and higher than 0.82 in summer. With RMSE values representing about 30 % of the daily variability (taken as the standard deviation) the biases can be considered statistically insignificant (i.e., lower than the daily variability of the PROMICE observations).
ASR outperforms the ERA reanalyses, and E5 does not outperform EI: despite E5 correlating better in summer (0.85 vs. 0.83), EI has a smaller RMSE in summer than E5 (2.50 ∘C vs. 1.93 ∘C ).
The added value of MAR is recognizable in the yearly absolute values of MB that are smaller. In summer the temperature biases in both MAR simulations are the highest, but the same simulations show the lowest RMSE(c) and highest correlation with observations (0.87). Both ERA reanalyses perform worse than MAR, while ASR shows similar statistics as MAR.
MARE5 is colder in summer than MAREI, but the two simulations produce similar temporal variability.
Two explanations can be given for the statistical differences in T2 m between the models. First, a difference in altitude may exist between the AWS and the corresponding interpolated model elevation, which mainly influences the annual MB. For example, the interpolated elevation of the EI grid is 770 m higher at AWS QAS_L (see Table S1 in the Supplement), while the difference in altitude is lower for the other models (151 m for E5, 6 m for ASR and 119 m for MAR). This difference leads to a negative MB of EI (−4.89 ∘C; Table S15) and erroneously suggests that this model is colder at this location. The second difference in the modeling of T2 m is the better representation by the two regional models (MAR and ASR) of the physical processes at the surface of the GrIS. This consequently results in a better representation of surface–atmosphere interactions, which are influenced by the melt of the snow pack when the excess energy is used to melt snow or ice and not to warm the surrounding air, and by the density of the snow pack, which is better modeled in the polar RCMs. Resolving surface processes (i.e., melt–albedo feedback) that are driving the near-surface temperature and melt variability is particularly relevant in summer when the statistics of both ERA datasets are worse than those of RCMs.
The finer resolution of the RCMs and the inherently better representation of the topography could also play an important role in the better representation of climate variables. However, it appears to be irrelevant here, since the new reanalysis E5 has a resolution similar to MAR and ASR, and E5 does not outperform EI in terms of daily near-surface temperature. For example, AWSs where elevation differences are less than 100 m (NUK_U, KPC_U, KAN_U, UPE_U, TAS_A, NUK_N), T2 m from EI and E5 are better represented annually than in summer. By contrast, T2 m from both RCMs for the same AWS have significantly better statistics in summer than both ERA reanalyses.
Finally, annual T2 m simulation by ASR (correlation 0.98) is slightly better than for MAR (correlation 0.97), while the two MAR simulations have smaller RMSE values. The difference between ASR and MAR might be due to the assimilation of observations from DMI (Danish Meteorological Institute) weather stations along the Greenland coastline, which are generally close to the PROMICE AWSs located in the ablation area. Although DMI data are not assimilated in MAR, this last one provides the most accurate representation of T2 m over the GrIS in summer.
To conclude, MAR shows the best accuracy when modeling T2 m, which might also lead to a better representation of the surface energy balance and melt (not evaluated here).
3.2 Wind speed
W10 m in each model is well correlated with observations (Table 1, annually >0.79 and in summer >0.73) and has an insignificant RMSE representing 70 % of the daily variability (taken as the standard deviation), except for ASR in summer where the RMSE is higher than the standard deviation.
Wind speed depends not only on synoptic atmospheric features but also on interactions with the surface and local topographic conditions. These generate persistent and widespread katabatic winds, and winds being channeled through valley in mountainous coastal areas of Greenland. It is difficult for models to correctly represent the surface wind regime in mountainous areas due to their resolution exceeding the topographical length scales.
E5 correlates better with in situ observations than EI, MAR, and ASR at the annual and summer timescales, and it also has a smaller RMSE and RMSEc.
Despite the improved representation of W10m in E5, both EI and E5 underestimate W10 m (negative bias between −1.06 and −1.04 m s−1) as also shown by Moore et al. (2016) over Greenland and Jones et al. (2016) over Antarctica. Nevertheless not all PROMICE AWSs are located near the relatively steep ice sheet margin where mountains may or may not be present, disallowing the models to well capture the katabatic winds in the shallow atmospheric boundary layer. The models can also be unable to reproduce the near-surface temperature deficit, and/or they have too few levels near the ice sheet surface. It should be noted that the underestimation of wind speed would be even larger at the height (∼3 m) at which wind is measured by the PROMICE AWSs.
W10 m in ASR and in both MAR simulations (UV1 in Table 1) is overestimated with a positive bias higher than 1.3 m s−1. The biases are reduced for MAR wind speed at ∼2 m (UV2 in Table 1), which is more similar to the height of the AWS measurements. However, the correlation of the wind speed is sensitive neither to the vertical level used in MAR (2 m vs. 10 m) nor to EI versus E5 forcing.
3.3 Longwave downward radiative flux
Contrary to the near-surface wind speed and temperature observations that are usually assimilated in reanalyses, observed downward radiative fluxes are usually not. Forecasted radiative fluxes simulated by the three reanalysis models have been compared to in situ observation of radiative fluxes.
Table 1 shows that each model has a satisfactory representation of LWD. Differences with PROMICE observations are small, with all the models underestimating LWD by 10–16 W m−2.
E5 performs the best for LWD producing the highest correlation coefficients (0.94 annually, 0.89 in summer) and the smallest RMSE.
The two MAR simulations are similar, but the reanalyses show more favorable comparisons. The temporal variability of LWD is better represented by the reanalyses, yet the yearly MBs are smaller for MAREI (−11.35 W m−2) and MARE5 (−10.58 W m−2).
The better LWD statistics of the three reanalyses compared to MAREI and MARE5 are likely related to their assimilation of radiance from satellite data, as well as the assimilation of sparse coastal temperature and humidity profiles from radiosondes (Dee et al., 2011; Bromwich et al., 2016). This enables a better representation of incident radiative fluxes that depends on clouds and their microphysical characteristics, including the thickness, water phase, and temperature. MAR does not assimilate such observations, but it is only forced at its lateral boundaries every 6 h (specific humidity and temperature). Clouds in MAR are the outcome of the own climate and microphysics of the model.
3.4 Shortwave downward radiative flux
Table 1 shows that each model performs well at representing SWD (yearly correlation ≥0.97 and summer correlation ≥0.88), and differences with PROMICE observations are not significant.
Similar to the LWD statistics, the reanalyses represent SWD better than the RCMs, with E5 providing the best statistics.
The ASR reanalysis overestimates SWD (yearly MB =7 W m−2 and summer MB =23 W m−2), whereas other models underestimate SWD (MB W m−2 on average), as also highlighted by Bromwich et al. (2018). Large LWD and SWD biases in ASR indicate that additional model improvements in Polar WRF are necessary to better capture the radiative cloud effects despite improved model cloud physics between ASRv1 and ASRv2 (Bromwich et al., 2018).
The assessment of SWD as represented by both MAR experiments reveals no significant difference but a less accurate SWD temporal variability than in the ERA reanalyses.
In general, the accurate model representation of incident radiative fluxes (LWD and SWD) depends on radiative scheme of model. The scheme used by MAR is the one from ERA-40 (the previous ECMWF reanalysis before EI), which has been updated for the EI and E5 reanalyses. This, combined with the fact that the reanalyses assimilate observations within the RCM domains, enables them to simulate clouds better, explaining the higher accuracy of radiative fluxes simulated by the ERA reanalyses compared to MAR forced by these same reanalyses.
3.5 Additional analysis
The same statistical comparison with GC-Net (Steffen and Box, 2001) observations was performed to better cover the Greenland Ice Sheet, as GC-Net stations are mainly located in the accumulation area. However, it is important to note that GC-Net observations are assimilated into reanalyses (EI, E5, and ASR) but not into MAR. Therefore, the comparison of models with GC-Net observations was carried out separately from PROMICE observations in order to keep the independence of the PROMICE comparison with data assimilation. The conclusions of this comparison are identical to the results presented above, except that the assimilation of this dataset into reanalyses favors the reanalyses for the representation of T2 m with respect to MAR. A more detailed analysis of the results can be found in the Supplement (see Table S5).
We have evaluated essential near-surface climate variables (2 m temperature, 10 m wind speed and energy downward fluxes) simulated by the new ERA5 reanalysis against EI, ASR, and MAR forced by EI and by E5 for the period 2010–2016.
EI is usually used as a reference over Greenland while ASR is a regional reanalysis specifically developed for the Arctic region. E5 outperforms EI for most variables, but not significantly. ASR is able to model temperature more accurately than the other global reanalyses. Near-surface wind speed is underestimated by both ERA reanalyses.
MAR performs less satisfactorily than the reanalyses in terms of downward solar and infrared fluxes likely because of its older radiative scheme, and because it does not assimilate satellite data within its domain. Still, near-surface temperature, especially in summer, is calculated with more accuracy by MAR, suggesting that MAR does well in resolving processes in the shallow atmospheric boundary layer over the Greenland Ice Sheet. A good representation of T2 m is important because of its importance to snow and ice processes such as the surface melt. In order to better simulate SMB, there is still an interest of using polar RCMs like MAR, not constrained by observations, to represent the near-surface climate over Greenland in the ablation zone compared to E5.
We also evaluated the sensitivity of MAR to its lateral forcing, using both E5 and EI. For each analyzed variable, results from both MAR simulations are highly similar, except that MARE5 generates slightly lower near-surface temperatures than MAREI, illustrating the ability of regional climate models to simulate climate in detail when forced by reanalyses.
Since September 2019, E5 has replaced EI, and it covers a long and homogeneous period (planned from 1950 to present). This represents a significant advantage compared to the discontinuity between ERA-40 and ERA-Interim in 1979, which can be of consequence to SMB reconstructions (e.g., Fettweis et al., 2017). In this study we showed that E5 is superior in simulating the near-surface climate of the GrIS over EI, while the advantage is not large. However, when reconstructing SMB back in time to 1950, using E5 as forcing has clear advantages in terms of continuity.
All MARv3.9 outputs presented here are available at ftp://ftp.climato.be/fettweis/MARv3.9/ (last access: 10 March 2020). The ECMWF reanalyses (ERA5 and ERA-Interim) were downloaded from http://apps.ecmwf.int/datasets/ (last access: 10 March 2020).
The supplement related to this article is available online at: https://doi.org/10.5194/tc-14-957-2020-supplement.
AD and XF conceived the study. XF performed the simulations. AD led the writing of the manuscript. AD, XF, CK, CA, and SH discussed the results. DvA and RSF processed the AWS data and assisted with AWS data analysis. All co-authors revised and contributed to the editing of the manuscript.
The authors declare that they have no conflict of interest.
Data from the Programme for Monitoring of the Greenland Ice Sheet (PROMICE) and the Greenland Analogue Project (GAP) were provided by the Geological Survey of Denmark and Greenland (GEUS) at http://www.promice.dk (last access: 6 March 2020). Thanks are owed to the Greenland Climate Network (GC-Net) for providing meteorological station observations. The GC-Net has been supported by NASA's Cryospheric Program with additional logistic support by the US-NSF Office of Polar Program. Finally, we would like to thank the two anonymous reviewers and the editor (Ruth Mottram) for their constructive remarks that helped to improve the paper.
Computational resources have been provided by the Consortium des Équipements de Calcul Intensif (CÉCI), funded by the Fonds de la Recherche Scientifique de Belgique (F.R.S.FNRS) under grant no. 2.5020.11 and the Tier-1 supercomputer (Zenobe) of the Fédération Wallonie Bruxelles infrastructure funded by the Walloon Region under grant agreement no. 1117545. Alison Delhasse is a research fellow from the Fonds de la Recherche Scientifique de Belgique (F.R.S.-FNRS).
This paper was edited by Ruth Mottram and reviewed by two anonymous referees.
Agosta, C., Amory, C., Kittel, C., Orsi, A., Favier, V., Gallée, H., van den Broeke, M. R., Lenaerts, J. T. M., van Wessem, J. M., van de Berg, W. J., and Fettweis, X.: Estimation of the Antarctic surface mass balance using the regional climate model MAR (1979–2015) and identification of dominant processes, The Cryosphere, 13, 281–296, https://doi.org/10.5194/tc-13-281-2019, 2019. a
Ahlstrom, A. P., Gravesen, P., Andersen, S. B., van As, D., Citterio, M., Fausto, R. S., Nielsen, S., Jepsen, H. F., Kristensen, S. S., Christensen, E. L., Stenseng, L., Forsberg, R., Hanson, S., and Petersen, D.: A new programme for monitoring the mass loss of the Greenland ice sheet, Geol. Surv. Den. Greenl., 15, 61–64, 2008. a, b
Albergel, C., Dutra, E., Munier, S., Calvet, J.-C., Munoz-Sabater, J., de Rosnay, P., and Balsamo, G.: ERA-5 and ERA-Interim driven ISBA land surface model simulations: which one performs better?, Hydrol. Earth Syst. Sci., 22, 3515–3532, https://doi.org/10.5194/hess-22-3515-2018, 2018. a
Amory, C., Trouvilliez, A., Gallée, H., Favier, V., Naaim-Bouvet, F., Genthon, C., Agosta, C., Piard, L., and Bellot, H.: Comparison between observed and simulated aeolian snow mass fluxes in Adélie Land, East Antarctica, The Cryosphere, 9, 1373–1383, https://doi.org/10.5194/tc-9-1373-2015, 2015. a
Belleflamme, A., Fettweis, X., and Erpicum, M.: Recent summer Arctic atmospheric circulation anomalies in a historical perspective, The Cryosphere, 9, 53–64, https://doi.org/10.5194/tc-9-53-2015, 2015. a
Bennartz, R., Shupe, M. D., Turner, D. D., Walden, V. P., Steffen, K., Cox, C. J., Kulie, M. S., Miller, N. B., and Pettersen, C.: July 2012 Greenland melt extent enhanced by low-level liquid clouds, Nature, 496, 83–86, https://doi.org/10.1038/nature12002, 2013. a
Bieniek, P. A., Bhatt, U. S., Walsh, J. E., Rupp, T. S., Zhang, J., Krieger, J. R., and Lader, R.: Full access dynamical downscaling of ERA-interim temperature and precipitation for Alaska, J. Appl. Meteorol. Clim., 55, 635–654, https://doi.org/10.1175/JAMC-D-15-0153.1, 2016. a
Bougamont, M., Bamber, J. L., Ridley, J. K., Gladstone, R. M., Greuell, W., Hanna, E., Payne, A. J., and Rutt, I.: Impact of model physics on estimating the surface mass balance of the Greenland ice sheet, Geophys. Res. Lett., 34, 1–5, https://doi.org/10.1029/2007GL030700, 2007. a
Bromwich, D. H., Wilson, A. B., Bai, L. S., Moore, G. W., and Bauer, P.: A comparison of the regional Arctic System Reanalysis and the global ERA-Interim Reanalysis for the Arctic, Q. J. Roy. Meteor. Soc., 142, 644–658, https://doi.org/10.1002/qj.2527, 2016. a, b, c
Bromwich, D. H., Wilson, A. B., Bai, L., Liu, Z., Barlage, M., Shih, C. F., Maldonado, S., Hines, K. M., Wang, S. H., Woollen, J., Kuo, B., Lin, H. C., Wee, T. K., Serreze, M. C., and Walsh, J. E.: The arctic system reanalysis, version 2, B. Am. Meteorol. Soc., 99, 805–828, https://doi.org/10.1175/BAMS-D-16-0215.1, 2018. a, b, c, d, e
Chen, L., Johannessen, O., Wang, H., and Ohmura, A.: Accumulation over the Greenland Ice Sheet as Represented in Reanalysis Data, Adv. Atmos. Sci., 28, 1030–1038, https://doi.org/10.1007/s00376-010-0150-9, 2011. a
Cox, C. J., Walden, V. P., Compo, G. P., Rowe, P. M., Shupe, M. D., and Steffen, K.: Downwelling longwave flux over Summit, Greenland, 2010–2012: Analysis of surface-based observations and evaluation of ERA-Interim using wavelets, J. Geophys. Res.-Atmos., 119, 12317–12337, https://doi.org/10.1002/2014JD021975, 2014. a
Dee, D. P., Uppala, S. M., Simmons, A. J., Berrisford, P., Poli, P., Kobayashi, S., Andrae, U., Balmaseda, M. A., Balsamo, G., Bauer, P., Bechtold, P., Beljaars, A. C., van de Berg, L., Bidlot, J., Bormann, N., Delsol, C., Dragani, R., Fuentes, M., Geer, A. J., Haimberger, L., Healy, S. B., Hersbach, H., Hólm, E. V., Isaksen, L., Kållberg, P., Köhler, M., Matricardi, M., Mcnally, A. P., Monge-Sanz, B. M., Morcrette, J. J., Park, B. K., Peubey, C., de Rosnay, P., Tavolato, C., Thépaut, J. N., and Vitart, F.: The ERA-Interim reanalysis: Configuration and performance of the data assimilation system, Q. J. Roy. Meteor. Soc., 137, 553–597, https://doi.org/10.1002/qj.828, 2011. a, b
Delhasse, A., Fettweis, X., Kittel, C., Amory, C., and Agosta, C.: Brief communication: Impact of the recent atmospheric circulation change in summer on the future surface mass balance of the Greenland Ice Sheet, The Cryosphere, 12, 3409–3418, https://doi.org/10.5194/tc-12-3409-2018, 2018. a
ECMWF: What are the changes from ERA-Interim to ERA5?, available at: https://confluence.ecmwf.int//pages/viewpage.action?pageId=74764925 (last access: 6 March 2020), 2018. a
Fettweis, X., Tedesco, M., van den Broeke, M., and Ettema, J.: Melting trends over the Greenland ice sheet (1958–2009) from spaceborne microwave data and regional climate models, The Cryosphere, 5, 359–375, https://doi.org/10.5194/tc-5-359-2011, 2011. a
Fettweis, X., Box, J. E., Agosta, C., Amory, C., Kittel, C., Lang, C., van As, D., Machguth, H., and Gallée, H.: Reconstructions of the 1900–2015 Greenland ice sheet surface mass balance using the regional climate MAR model, The Cryosphere, 11, 1015–1033, https://doi.org/10.5194/tc-11-1015-2017, 2017. a, b, c, d, e, f
Goelzer, H., Huybrechts, P., Fürst, J. J., Nick, F. M., Andersen, M. L., Edwards, T. L., Fettweis, X., Payne, A. J., and Shannon, S.: Sensitivity of Greenland ice sheet projections to model formulations, J. Glaciol., 59, 733–749, https://doi.org/10.3189/2013JoG12J182, 2013. a
Hanna, E., Fettweis, X., and Hall, R. J.: Brief communication: Recent changes in summer Greenland blocking captured by none of the CMIP5 models, The Cryosphere, 12, 3287–3292, https://doi.org/10.5194/tc-12-3287-2018, 2018. a
Hersbach, H. and Dick, D.: ERA5 reanalysis is in production, ECMWF Newsletter, 147, p. 7, 2016. a, b, c
Jakobson, E., Vihma, T., Palo, T., Jakobson, L., Keernik, H., and Jaagus, J.: Validation of atmospheric reanalyses over the central Arctic Ocean, Geophys. Res. Lett., 39, 1–6, https://doi.org/10.1029/2012GL051591, 2012. a
Jones, R. W., Renfrew, I. A., Orr, A., Webber, B. G., Holland, D. M., and Lazzara, M. A.: Evaluation of four global reanalysis products using in situ observations in the amundsen sea embayment, antarctica, J. Geophys. Res., 121, 1–18, https://doi.org/10.1002/2015JD024680, 2016. a
Kapsch, M. L., Graversen, R. G., Economou, T., and Tjernström, M.: The importance of spring atmospheric conditions for predictions of the Arctic summer sea ice extent, Geophys. Res. Lett., 41, 5288–5296, https://doi.org/10.1002/2014GL060826, 2014. a
Kittel, C., Amory, C., Agosta, C., Delhasse, A., Doutreloup, S., Huot, P.-V., Wyard, C., Fichefet, T., and Fettweis, X.: Sensitivity of the current Antarctic surface mass balance to sea surface conditions using MAR, The Cryosphere, 12, 3827–3839, https://doi.org/10.5194/tc-12-3827-2018, 2018. a
Lang, C., Fettweis, X., and Erpicum, M.: Future climate and surface mass balance of Svalbard glaciers in an RCP8.5 climate scenario: a study with the regional climate model MAR forced by MIROC5, The Cryosphere, 9, 945–956, https://doi.org/10.5194/tc-9-945-2015, 2015. a
Lindsay, R., Wensnahan, M., Schweiger, A., and Zhang, J.: Evaluation of seven different atmospheric reanalysis products in the arctic, J. Climate, 27, 2588–2606, https://doi.org/10.1175/JCLI-D-13-00014.1, 2014. a
Lucas-Picher, P., Wulff-Nielsen, M., Christensen, J. H., Aoalgeirsdóttir, G., Mottram, R., and Simonsen, S. B.: Very high resolution regional climate model simulations over Greenland: Identifying added value, J. Geophys. Res.-Atmos., 117, 1–16, https://doi.org/10.1029/2011JD016267, 2012. a
Merz, N., Raible, C. C., Fischer, H., Varma, V., Prange, M., and Stocker, T. F.: Greenland accumulation and its connection to the large-scale atmospheric circulation in ERA-Interim and paleoclimate simulations, Clim. Past, 9, 2433–2450, https://doi.org/10.5194/cp-9-2433-2013, 2013. a
Moore, G. W., Bromwich, D. H., Wilson, A. B., Renfrew, I., and Bai, L.: Arctic System Reanalysis improvements in topographically forced winds near Greenland, Q. J. Roy. Meteor. Soci., 142, 2033–2045, https://doi.org/10.1002/qj.2798, 2016. a
Noël, B., van de Berg, W. J., van Wessem, J. M., van Meijgaard, E., van As, D., Lenaerts, J. T. M., Lhermitte, S., Kuipers Munneke, P., Smeets, C. J. P. P., van Ulft, L. H., van de Wal, R. S. W., and van den Broeke, M. R.: Modelling the climate and surface mass balance of polar ice sheets using RACMO2 – Part 1: Greenland (1958–2016), The Cryosphere, 12, 811–831, https://doi.org/10.5194/tc-12-811-2018, 2018. a, b
Rae, J. G. L., Aðalgeirsdóttir, G., Edwards, T. L., Fettweis, X., Gregory, J. M., Hewitt, H. T., Lowe, J. A., Lucas-Picher, P., Mottram, R. H., Payne, A. J., Ridley, J. K., Shannon, S. R., van de Berg, W. J., van de Wal, R. S. W., and van den Broeke, M. R.: Greenland ice sheet surface mass balance: evaluating simulations and making projections with regional climate models, The Cryosphere, 6, 1275–1294, https://doi.org/10.5194/tc-6-1275-2012, 2012. a
Reijmer, C. H., van den Broeke, M. R., Fettweis, X., Ettema, J., and Stap, L. B.: Refreezing on the Greenland ice sheet: a comparison of parameterizations, The Cryosphere, 6, 743–762, https://doi.org/10.5194/tc-6-743-2012, 2012. a
Simmons, A. J. and Poli, P.: Arctic warming in ERA-Interim and other analyses, Q. J. Roy. Meteor. Soc., 141, 1147–1162, https://doi.org/10.1002/qj.2422, 2015. a
Skamarock, W. C., Klemp, J. B., Dudhia, J., Gill, D. O., Barker, D. M., Duda, M. G., Huang, X.-Y., Wang, W., and Powers, J. G.: A Description of the Advanced Research WRF Version 3, NCAR Tech. Note NCAR/TN-475+STR, 113 pp., https://doi.org/10.5065/D68S4MVH, 2008. a
Stark, J. D., Donlon, C., O'Carroll, A., and Corlett, G.: Determination of AATSR biases using the OSTIA SST analysis system and a matchup database, J. Atmos. Ocean. Tech., 25, 1208–1217, https://doi.org/10.1175/2008JTECHO560.1, 2008. a
Steffen, K. and Box, J.: Surface climatology of the Greenland ice sheet: Greenland Climate Network 1995–1999, J. Geophys. Res., 106, 33951–33964, https://doi.org/10.1029/2001JD900161, 2001. a
Urraca, R., Huld, T., Gracia-Amillo, A., Martinez-de Pison, F. J., Kaspar, F., and Sanz-Garcia, A.: Evaluation of global horizontal irradiance estimates from ERA5 and COSMO-REA6 reanalyses using ground and satellite-based data, Sol. Energy, 164, 339–354, https://doi.org/10.1016/j.solener.2018.02.059, 2018. a
van Kampenhout, L., Rhoades, A. M., Herrington, A. R., Zarzycki, C. M., Lenaerts, J. T. M., Sacks, W. J., and van den Broeke, M. R.: Regional grid refinement in an Earth system model: impacts on the simulated Greenland surface mass balance, The Cryosphere, 13, 1547–1564, https://doi.org/10.5194/tc-13-1547-2019, 2019. a
Vaughan, D. G., Ian, A., Carrasco, J., Kaser, G., Kwok, R., Mote, P., Murray, T., Paul, F., Ren, J., Rignot, E., Solomina, O., Steffen, K., and Zhang, T.: Observations: Cryosphere, in: Climate Change 2013: The Physical Science Basis, Contribution of Working Group I to the Fifth Assessment Report of the Intergovernmental Panel on Climate Change, edited by: Stocker, T., Qin, D., Plattner, G.-K., Tignor, M., Allen, S., Boschung, J., Nauels, A., Xia, Y., Bex, V., and Midgley, P., chap. 4, Cambridge, United Kingdom and New York, NY, USA, Cambridge University Press, https://doi.org/10.1017/CBO9781107415324.012, 2013. a
Vernon, C. L., Bamber, J. L., Box, J. E., van den Broeke, M. R., Fettweis, X., Hanna, E., and Huybrechts, P.: Surface mass balance model intercomparison for the Greenland ice sheet, The Cryosphere, 7, 599–614, https://doi.org/10.5194/tc-7-599-2013, 2013. a
Wang, C., Graham, R. M., Wang, K., Gerland, S., and Granskog, M. A.: Comparison of ERA5 and ERA-Interim near-surface air temperature, snowfall and precipitation over Arctic sea ice: effects on sea ice thermodynamics and evolution, The Cryosphere, 13, 1661–1679, https://doi.org/10.5194/tc-13-1661-2019, 2019. a