the Creative Commons Attribution 4.0 License.
the Creative Commons Attribution 4.0 License.
 | 29 Apr 2024
Firn air content changes on Antarctic ice shelves under three future warming scenarios
Sanne B. M. Veldhuijsen
Willem Jan van de Berg
Peter Kuipers Munneke
Michiel R. van den Broeke
The Antarctic firn layer provides pore space in which an estimated 94 % to 96 % of the surface melt refreezes or is retained as liquid water. Future depletion of firn pore space by increased surface melt, densification and formation of low-permeability ice slabs can potentially lead to meltwater ponding, hydrofracturing and ice-shelf disintegration. Here, we investigate the 21st-century evolution of total firn air content (FAC) and accessible FAC (i.e. the pore space that meltwater can reach) across Antarctic ice shelves. We use the semi-empirical IMAU Firn Densification Model (IMAU-FDM) with an updated dynamical densification expression to cope with changing climate forcing. The firn model is forced by general circulation model output of the Community Earth System Model version 2 (CESM2) for three climate emission scenarios (SSP1-2.6, SSP2-4.5 and SSP5-8.5), dynamically downscaled to a 27 km horizontal resolution by the Regional Atmospheric Climate Model version 2.3p2 (RACMO2.3p2). To estimate accessible FAC, we prescribe a relationship between ice-slab thickness and permeability. In our simulations, ice shelves on the Antarctic Peninsula and the Roi Baudouin Ice Shelf in Dronning Maud Land are particularly vulnerable to total FAC depletion (> 50 % decrease by 2100), even for low-emission (SSP1-2.6) and intermediate-emission (SSP2-4.5) scenarios. In the high-emission (SSP5-8.5) scenario in particular, the formation of ice slabs further reduces accessible FAC on ice shelves with low accumulation rates (current rates of < 500 ), including many East Antarctic ice shelves and the Filchner–Ronne, Ross, Pine Island and Larsen C ice shelves. These results underline the potentially large vulnerability of low-accumulation ice shelves to firn air depletion through ice-slab formation.
- Article
(7458 KB) - Full-text XML
-
Supplement
(2922 KB) - BibTeX
- EndNote


The Antarctic Ice Sheet (AIS) has been losing mass since at least 2002 (The IMBIE team, 2018; Rignot et al., 2019), contributing ∼ 10 % to global average sea level rise since 1993 (Oppenheimer et al., 2019). This mass loss is mainly driven by enhanced iceberg calving and basal melting beneath ice shelves (Smith et al., 2020). Both reduce the buttressing effect of ice shelves, allowing tributary glaciers to accelerate and thereby increasing ice discharge into the ocean. On the Antarctic Peninsula, the warmest region of Antarctica, mass loss is also driven by surface melt. Here, extensive melt has led to meltwater ponding and subsequently to ice-shelf disintegration by hydrofracturing, after which mass loss from tributary glaciers has accelerated (Rignot et al., 2004; Banwell et al., 2013).
Not all ice shelves are susceptible to meltwater-induced hydrofracturing. Firstly, surface melt typically only leads to meltwater ponding when the firn layer lacks sufficient pore space for meltwater to percolate into and refreeze. Currently, an estimated 94 % to 96 % of the surface melt on the AIS is retained within the firn (Medley et al., 2022; Van Wessem et al., 2018). Secondly, meltwater-induced hydrofracturing also requires sufficient tensile stress. Hydrofracturing, in turn, only induces mass loss if the ice shelf provides substantial buttressing. Currently, 60 % of the ice shelves (by area) both buttress upstream ice and are vulnerable to hydrofracturing if inundated by meltwater (Lai et al., 2020). Hence, to assess the future stability of ice shelves and predict mass loss from the AIS, it is important to estimate the future evolution of its firn layer.
Under future warming, we anticipate more surface melt and rainfall, faster firn densification and increased formation of low-permeability ice slabs (i.e. ice layers > 1 m thick) (Ligtenberg et al., 2014; MacFerrin et al., 2019; Kittel et al., 2021; Vignon et al., 2021). These processes decrease the firn air content (FAC) and consequently enable firn saturation and ponding by meltwater. On the other hand, snowfall is projected to increase (Kittel et al., 2021), adding pore space to the firn. Climate models have recently been used to assess the impacts of future climatic changes on Antarctica's firn. Based on the exceedance of a melt-over-accumulation ratio (MOA) of 0.7, van Wessem et al. (2023) estimate future melt ponding on ice shelves. Gilbert and Kittel (2021) use runoff from climate models as an indicator for meltwater ponding.
Offline firn models forced by the output of regional climate models are useful tools to simulate the transient evolution of the firn layer and can therefore also be used to assess meltwater ponding onset. The main advantage of using a firn model instead of a climate model is the lower computational cost, which enables a higher vertical resolution, a proper initialisation of the firn layer and more extensive sensitivity tests. The disadvantage of using an offline firn model is that interaction with the atmosphere is not possible. In contrast to diagnostic studies that use MOA thresholds (e.g. van Wessem et al., 2023), firn models simulate transient changes in the firn layer, thereby accounting for the time it takes to adjust to new climatic conditions. Firn models have been used to simulate the current (1979–present) AIS firn layer (Gardner et al., 2023; Keenan et al., 2021; Medley et al., 2022; Veldhuijsen et al., 2023a) and its evolution in response to climate change (Ligtenberg et al., 2014; Kuipers Munneke et al., 2014a).
The densification equations used in semi-empirical firn models are often based on assumptions of constant accumulation and temperature (Arthern et al., 2010), but simulating future firn evolution requires densification expressions that allow for changing climatic conditions. Moreover, using only total FAC to assess the firn's meltwater buffering capacity overlooks the impact of near-surface ice slabs formed by meltwater refreezing. Ice slabs are common in Greenland (MacFerrin et al., 2019; Culberg et al., 2021) and have been locally observed in Antarctica on the Larsen C Ice Shelf (Hubbard et al., 2016). They impede vertical meltwater percolation into deeper firn, limiting the fraction of the FAC that is accessible to meltwater. To assess the meltwater buffering capacity of firn, it is therefore important to include the impact of ice slabs (henceforth the accessible FAC).
Here, we use the IMAU Firn Densification Model (IMAU-FDM) for Antarctica, which has previously been evaluated for the contemporary climate (1979–2020) (Veldhuijsen et al., 2023a). In this study, IMAU-FDM is driven by realisations of the Community Earth System Model version 2 (CESM2) of the scenarios SSP1-2.6, SSP2-4.5 and SSP5-8.5 for the period 1950–2100, dynamically downscaled to 27 km resolution with the Regional Atmospheric Climate Model version 2.3p2 (RACMO2.3p2). To allow for changing climatic conditions, we updated and evaluated the densification equation (Sect. 2). In Sect. 3, we parameterise the accessible FAC based on ice slabs and FAC. In Sects. 4 and 5, we present and discuss the response of the AIS firn layer to future warming scenarios in IMAU-FDM and specifically focus on the evolution of total FAC, accessible FAC and runoff. Finally, we present the conclusions in Sect. 6.
IMAU-FDM is a semi-empirical 1-dimensional firn densification model that simulates the evolution of firn depth, density, temperature and liquid water content. Firn compaction is calculated based on the semi-empirical dry-snow densification equations of Arthern et al. (2010). Meltwater percolation is simulated using the bucket method, whereby each firn layer has a maximum irreducible water content that decreases with increasing density (Coléou et al., 1999). The meltwater can percolate through all layers in a single time step and (partly) refreezes when it reaches a layer with a temperature below the freezing point. Once meltwater has saturated the lowermost firn layer beyond the maximum irreducible water content, we assume that it leaves the firn column as runoff instantaneously. Standing water and lateral runoff over ice layers are currently not considered. For further details on the model setup, we refer to Veldhuijsen et al. (2023a) and Brils et al. (2022). Version 1.2A of IMAU-FDM (referred to as FDM v1.2A) has been extensively evaluated over Antarctica against in situ observations of firn density and temperature and remote sensing altimetry measurements (Veldhuijsen et al., 2023a). In this study, we update the model to version IMAU-FDM v1.2AD (referred to as FDM v1.2AD) by implementing a densification expression that is suitable for transient climate change experiments, as is described in the next section.
2.1 Densification expression
The rate of the dry-firn densification () in IMAU-FDM v1.2A is calculated using the semi-empirical equation of Arthern et al. (2010) in combination with a calibration factor (MO∗):
in which D is a constant, is the long-term average accumulation rate (kg m2 yr−1), g is the gravitational acceleration, ρi is the density of bubble-free ice (917 kg m−3), ρ is the layer density (kg m−3), T is the instantaneous layer temperature (K), Tave is the long-term average surface temperature (K), R is the universal gas constant, and Ec and Eg are the activation energies for creep (60.0 kJ mol−1) and grain growth (42.4 kJ mol−1). The constant D has different values above (0.03) and below (0.07) the critical density level of ρ = 550 kg m−3 to represent two distinct densification mechanisms (Herron and Langway, 1980). The calibration factor, MO∗, depends on annual average accumulation and is defined separately for ρ < 550 kg m−3 (MO550) and for 550 < ρ < 830 kg m−3 (). These calibration factors are based on the ratio of modelled and observed values of depths of critical density levels ρ = 550 kg m−3 (z550) and ρ = 830 kg m−3 (z830), where = z830 − z550. MO550 and were chosen as logarithmic and power-law functions, respectively, of the long-term average accumulation rate:
in which α, β, δ, and ϵ and ϕ are fit coefficients. Equations (1) to (3) use the long-term annual average accumulation rate () as a proxy for overburden pressure, and Eq. (1) uses long-term annual average temperature (Tave) in the grain growth part of the exponential term. To include the effect of a changing climate on firn densification, previous studies with IMAU-FDM used running average accumulation and temperature over the 40 years preceding each time step (Ligtenberg et al., 2014; Kuipers Munneke et al., 2014a). Since there is a large spatial variation in firn age across the AIS (e.g. the firn age at the pore close-off depth ranges from 20 to ∼ 3200 years; Veldhuijsen et al., 2023a), the firn temperature and overburden pressure will change at different rates across the AIS in a warming future climate. In addition, the change in temperature and overburden pressure will also differ vertically within the firn column. Advection and conduction transport heat vertically; however, firn has a relatively low thermal conductivity (0.2 to 2 ; Calonne et al., 2019). For example, Muto et al. (2011) show that firn temperature throughout a firn column differs by about 1 K due to historical temperature trends in East Antarctica of 1 to 1.5 K over 50 years. So, using a running average of the accumulation and firn temperature is a crude approximation to capture the transient response of firn.
In this work, we aim to resolve this by replacing and Tave in the densification equations (Eqs. 1 to 3) while staying as close as possible to FDM v1.2A. To do so, we revert to the complete transient, dynamical model of Arthern et al. (2010) for the evolution of firn density. Equation (4) is derived from this equation using several simplifying assumptions, such as steady-state accumulation. The equation is based on evolving squared grain size (r2; mm2) and overburden pressure (σ; ) and includes the MO∗ term:
where kc is a constant. The evolution of r2 for one time step includes dry-snow metamorphism:
where kg is a constant. In the case of refreezing, r2 is calculated as the mass-weighted average of the solid firn grain size and refrozen liquid water grain size, under the condition that refreezing can only increase the grain size. The initial (0.03 mm) and refreezing (0.25 mm) grain sizes are taken from van Dalum et al. (2022). To determine MO∗ (Eqs. 2 and 3), we replace in those equations by the local (layer) long-term mean accumulation rate () defined as
wherein A is the firn age. For updates on the layer merging-and-splitting approach, we refer to Text S1 in the Supplement.
2.2 Atmospheric forcing
IMAU-FDM is forced at the upper boundary with 3-hourly values of snowfall, sublimation, snowdrift erosion, 10 m wind speed, surface temperature, snowmelt and rainfall from RACMO2.3p2. This regional climate model is used to dynamically downscale ERA5 reanalysis data (Hersbach et al., 2020) for the contemporary climate (RACMO2.3p2–ERA5) and Community Earth System Model version 2 model output (CESM2; Danabasoglu et al., 2020) for future projections (RACMO2p3–CESM2) to a 27 km resolution. RACMO2.3p2–ERA5 aims to provide an accurate description of past AIS weather (and climate) from 1979–present and has been thoroughly evaluated (van Wessem et al., 2023).
For future projections, van Wessem et al. (2023) used RACMO2.3p2 to dynamically downscale a historical CESM2 realisation (1950–2014) and one realisation of each of the low-, middle- and high-emission future (2015–2100) projection scenarios (SSP1-2.6, SSP2-4.5 and SSP5-8.5, respectively). CESM2 simulates the coupled interactions between the atmosphere–ocean–land components of the climate system on the global scale at a 1° horizontal resolution (Danabasoglu et al., 2020) and has been thoroughly evaluated over the AIS (Gorte et al., 2020; Dunmire et al., 2022). The model has a relatively detailed representation of polar processes and is among the best CMIP6 models in representing the present Antarctic surface mass balance (SMB; Gorte et al., 2020). The projected Antarctic warming in SSP5-8.5 (+7.7 °C) in CESM2 is stronger than the mean warming in CMIP6 models (+5 °C), which enables us to assess the AIS firn layer response to strong warming.
Arthern et al. (2010)Arthern et al. (2010)Table 1Abbreviations and characteristics of IMAU-FDM versions used in this study.
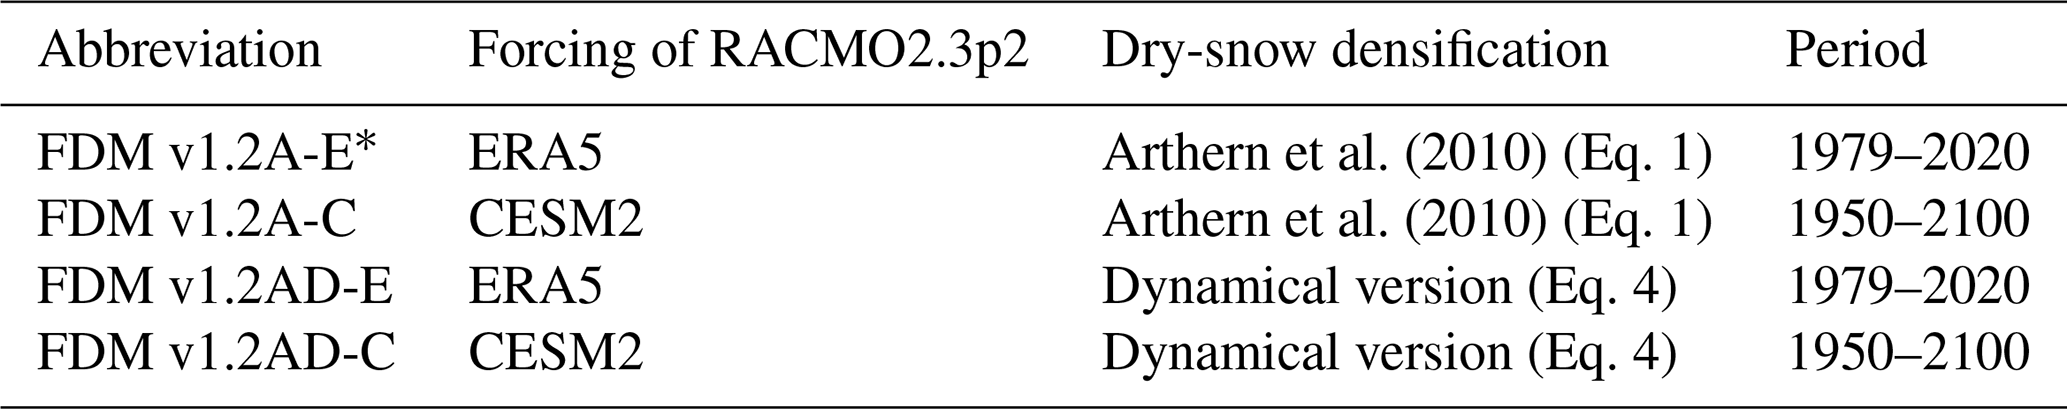
∗ Veldhuijsen et al. (2023a).
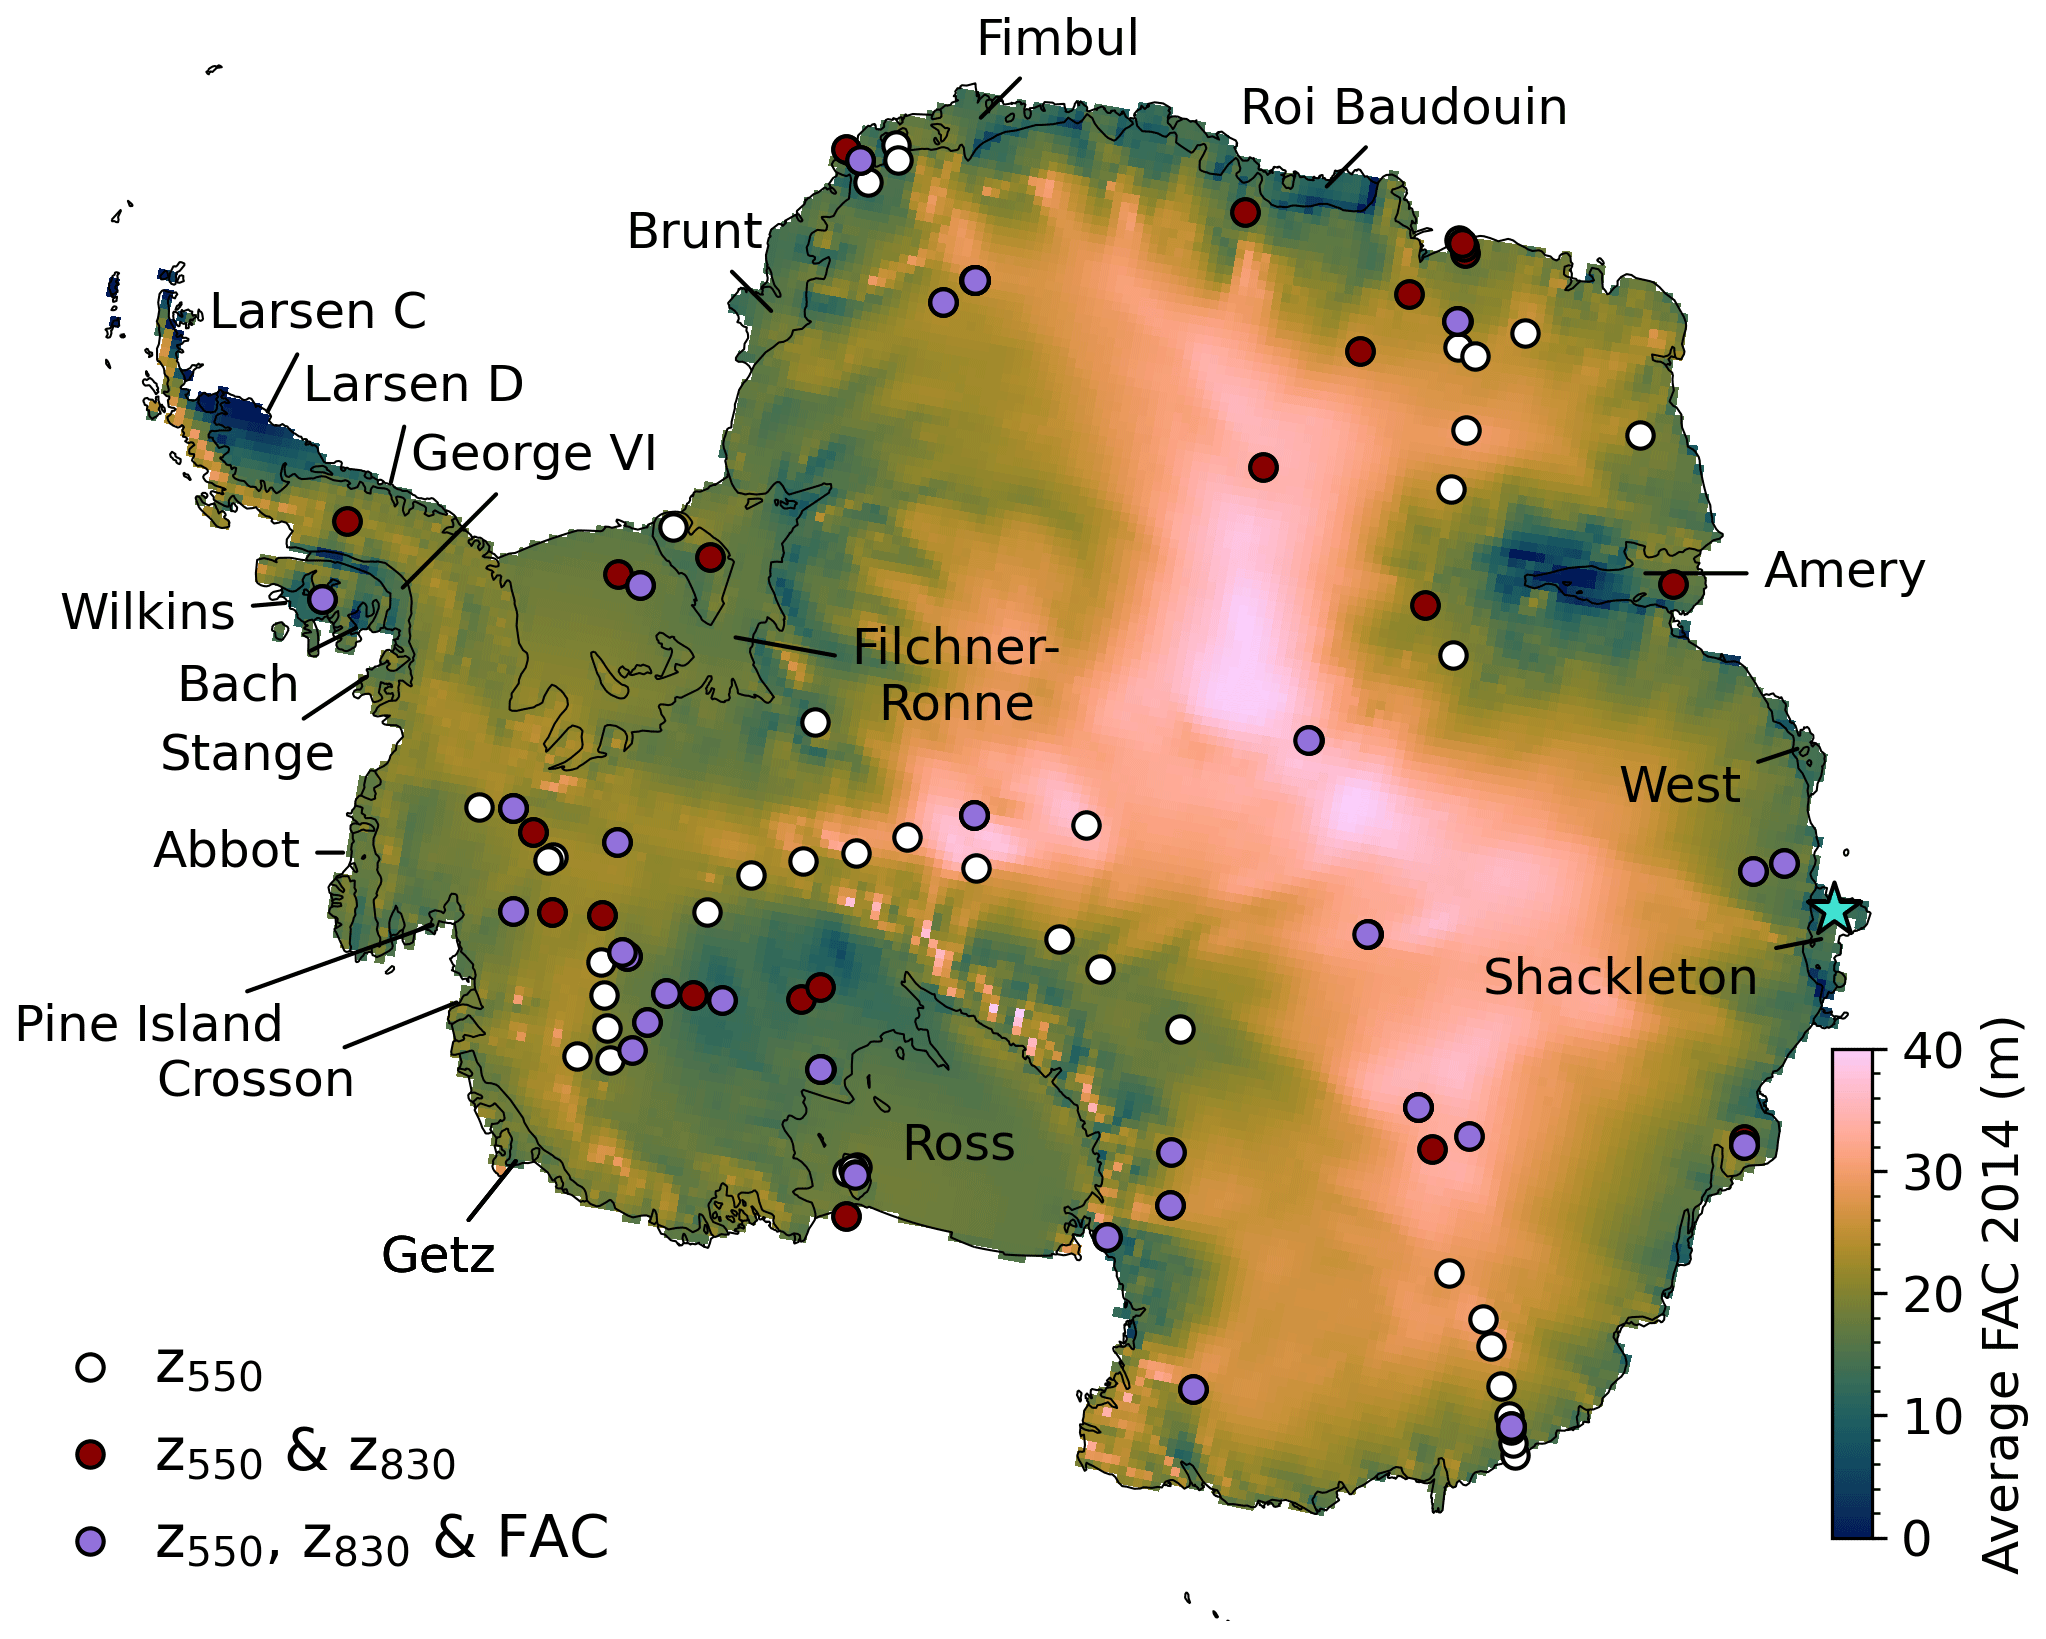
Figure 1Map of Antarctica showing average firn air content (FAC) for 2014 from FDM v1.2AD-C. The circles indicate locations of in situ observations of the depth of critical density level ρ = 550 kg m−3 (z550), the depth of critical density level ρ = 830 kg m−3 (z830) and firn air content (FAC). The blue star indicates the location of Fig. 3b. The names indicate the ice shelves referred to in the text.
RACMO2.3p2–CESM2 time series of mean annual surface temperature, accumulation and surface melt over the AIS are shown in Fig. S1 in the Supplement. Compared to RACMO2.3p2–ERA5 for the overlapping period (1979–2014), we find a temperature bias of −1.2 °C over the AIS, an accumulation bias of −7.6 (−4 %) and a snowmelt bias of −1.0 mm (−11 %). These biases can be explained by the cold bias in CESM2 (Dunmire et al., 2022). RACMO2.3p2–CESM2 has also been used by van Wessem et al. (2023) in their assessment of AIS meltwater ponding and compares well to meltwater lake volume observations of the Sentinel-2 satellite. Figure S2 in the Supplement shows the differences in mean annual surface temperature, accumulation and surface melt in the period 1979–2014 between RACMO2.3p2–CESM2 and RACMO2.3p2–ERA5. Accumulation and temperature in RACMO2.3p2–CESM2 are in general lower, except in Dronning Maud Land and Enderby Land. Temperatures are most notably lower on the Ross Ice Shelf and in West Antarctica. Surface melt is in general lower, except in Dronning Maud Land and on the Larsen C Ice Shelf.
2.3 Experimental setup
The four IMAU-FDM versions used in this study differ in the dry-snow densification expression (non-dynamical or dynamical; Sect. 2.1) and the indirect atmospheric forcing (ERA5 or CESM2; Sect. 2.2). Abbreviations and characteristics of the IMAU-FDM versions used are listed in Table 1. FDM v1.2AD-C, the dynamical model indirectly forced by CESM2, is used to simulate future firn evolution over the AIS. FDM v1.2A-E and FDM v1.2AD-E are used for the evaluation of the dynamical model over the current climate (Sect. 2.4), and FDM v1.2A-C is used to assess the impact of the dynamical model on future firn evolution (Sect. 4.5; tested for SSP5-8.5). FDM v1.2A-E provides firn characteristics over the AIS from 1979 to the present and has been extensively evaluated (Veldhuijsen et al., 2023a). Details about the model initialisation are given in Text S2 in the Supplement.

Figure 2Simulated against observed (a) z550, (b) and (c) firn air content (FAC) for FDM v1.2AD-E, FDM v1.2A-E and FDM v1.2AD-C.
2.4 In situ measurements
To calibrate and evaluate the firn model, we compare the overlapping historical part (1979–2014) of the FDM v1.2A-E, FDM v1.2AD-E and FDM v1.2A-C simulations to in situ firn core density measurements (Fig. 1). We used 112 density profiles across the AIS by combining multiple published datasets (van den Broeke, 2008; Schwanck et al., 2016; Bréant et al., 2017; Fernandoy et al., 2010; Montgomery et al., 2018; Fourteau et al., 2019; Olmi et al., 2021; Winstrup et al., 2019). Detailed information about the dataset is presented in Veldhuijsen et al. (2023a).
2.5 Calibration
The densification equation of the non-dynamical model indirectly forced by ERA5 (FDM v1.2A-E) has been calibrated in Veldhuijsen et al. (2023a). To calibrate the dry-snow densification rate of the dynamical model versions, we first performed simulations for locations with firn density observations (Fig. 1) without MO corrections – i.e. in which the MO values are equal to 1. The resulting MO fits and statistics are shown in Fig. S3 in the Supplement. All model versions yield similar R2 values. The MO550 fits of the dynamical versions are steeper and higher than FDM v1.2A-E due to a relatively low ratio of overburden pressure and grain size in the upper firn (above z550). In addition, the CESM2 forcing alters the MO550 and fits due to differences in modelled accumulation rates and surface temperature.
2.6 Performance of the dynamical densification model
We evaluate the performance of the dynamical model, FDM v1.2AD, by comparing it with FDM v1.2A and in situ observations. For the latter, we compare the simulated to the observed depths of the critical density levels ρ = 550 kg m−3 (z550) and ρ = 830 kg m−3 (z830) and FAC (Fig. 2a–c). Both versions indirectly forced by ERA5 yield a similar root mean square error (RMSE) and bias, which indicates a similar performance of the updated dynamical firn model for the same forcing. The CESM forced run with the dynamical model yields slightly higher RMSE, indicating that the CESM2 forcing, which is not constrained by observations like ERA5, results in a slightly poorer performance.
The average absolute difference in FAC over the AIS between FDM v1.2AD-C and FDM v1.2A-E for the period 1979–2014 (the overlapping historical period) is 5.2 % (Fig. S4b in the Supplement). This is caused by a combination of the updated dry-snow densification expression and different climatic forcing. Conversely, the absolute FAC difference over the period 1979–2020 between FDM v1.2AD-E and FDM v1.2A-E, caused solely by the updated dry-snow densification expression, averages only 1 % (Fig. S4a). Over the grounded ice, the differences are even smaller (0.6 %), while they are higher in regions with high MOA, such as on Wilkins and Larsen C ice shelves and around the grounding lines of, for example, the Roi Baudouin and Amery ice shelves. The reason is that densification is enhanced in regions with high MOA (Fig. S4c), which is consistent with theoretical considerations that a MOA > 0.7 initiates the depletion of pore space (Pfeffer et al., 1991; van Wessem et al., 2023). Overall, the results of the (non-)dynamical versions are similar over the historical period, which is as expected since there are no trends in accumulation and temperature, reducing the impact of the dynamical densification formulation. The difference in FAC evolution in response to future warming scenarios between the (non-)dynamical versions is discussed in Sect. 4.5.
The dynamical FDM version (FDM v1.2AD-C) is used to simulate the future FAC evolution to assess the vulnerability of ice shelves to meltwater ponding. However, meltwater refreezing can form ice slabs in firn, which can impede meltwater percolation into deeper layers, thereby reducing the firn's meltwater buffering capacity (Machguth et al., 2016; MacFerrin et al., 2019; Culberg et al., 2021). That is why, in addition to FAC (henceforth referred to as total FAC), we also calculate accessible FAC. To do so, we use ice layer thickness as a measure of their permeability. It is important to note that the calculation of accessible FAC is a post-processing step and that ice layers within the firn model itself are permeable for vertical liquid water movement.
Figure 3a shows relationships between ice layer thickness and permeability from several observational studies. A small-scale field experiment conducted in Greenland shows that ice layers of 0.12 m can still be completely permeable for liquid water (Samimi et al., 2020). On the other hand, in another small-scale field experiment in Greenland, ice lenses of only 0.03–0.05 m have also been found to be partly impermeable (Clerx et al., 2022). Samimi et al. (2021) assume that ice layers thicker than 0.5 m act as impermeable barriers and prescribe a non-linear decrease in permeability between 0.1 and 0.5 m. These results also show that processes of meltwater percolation and refreezing occur on a small scale. Firn is therefore spatially heterogeneous (e.g. Samimi et al., 2020; Vandecrux et al., 2019), and on a larger horizontal scale, such as that of a FDM grid cell (27 km), ice layers can be discontinuous, allowing meltwater to still percolate through. For ice layers to be impermeable on the model-resolved spatial scale, this requires at least a larger thickness than the ones found in the small-scale field experiments. Here, we also assume that lateral connectivity of ice layers increases with ice thickness.
Radar data and firn cores show that horizontally continuous > 1 m thick ice slabs typically develop on top of refrozen ice layers after extreme melt years. A radar study on Devon Ice Cap, Canada, revealed that an initially widespread ice layer that formed during an extreme melt year thickened by between 0.5 and 4.5 m over the subsequent 5 years (Gascon et al., 2013). Similarly, over time, thickening ice layers of 1–2 m formed in Greenland following an extreme melt year (Culberg et al., 2021). While these large-scale radar observations do not give an exact relation of thickness to permeability, they do give an indication that ice layers thicker than 0.5 m are at least partly impermeable on a larger scale. In addition, firn temperature measurements in Greenland show that no percolation occurred through a 5.5 m thick ice slab even during an extreme melt year (Charalampidis et al., 2016). Based on these observations, we propose a relationship between ice layer thickness (z) and permeability factor (Pf) (Fig. 3a) using a sigmoid function:
in which a and b are tuning coefficients for which we propose values of a = 1.130 and b = 3.245. We use a sigmoid function because it has a characteristic S-shaped curve, representing that on a large spatial scale, thin ice lenses are permeable, while even very thick ice layers only approach complete impermeability.
Since exact observations that evaluate the permeability as a function of ice layer thickness on the regional scale are lacking, the relationship in Eq. (7) must be regarded as a rough estimate. In addition, the locations of the observations have a larger surface slope (> 0.4°) (Yi et al., 2005) than most Antarctic ice shelves (< 0.15°) (Slater et al., 2018). The small surface slopes on ice shelves result in less lateral flow on top of refreezing layers, which may impact the permeability. Considering these uncertainties, we test the sensitivity of our results to adjusting the values of a (1.119 and 1.250) and b (13.490 and 0.0594), indicated by the envelope of the black-shaded surfaces in Fig. 3a. In addition, we also include the total FAC, which represents full permeability.
To calculate the accessible FAC of a layer, its FAC is multiplied with the permeability factors of all overlying ice layers. For example, if two distinct ice layers with a Pf of 0.5 are overlying a firn layer, the FAC of that layer is multiplied twice by 0.5 to yield its accessible FAC. The sum of accessible FAC of the individual layers equals the firn accessible FAC. An ice layer can range from a single to numerous model layers. Impermeable ice layers are usually defined as having a density of > 830 kg m−3 (the pore close-off density). Here, we use a threshold of > 900 kg m−3, which corresponds to the density of refreezing ice layers in the model. This choice limits the impact on the accessible FAC of changes in high-density non-refreezing layers in the deep firn. Figure 3b shows the impact of ice layer formation on accessible FAC for an example location in a high-emission scenario (SSP5-8.5). As can be seen, ice layer formation from 2060 onwards depletes the accessible FAC compared to the total FAC. Henceforth, we refer to (a set of) ice layers that have a substantial impact on the accessible FAC as ice slabs.
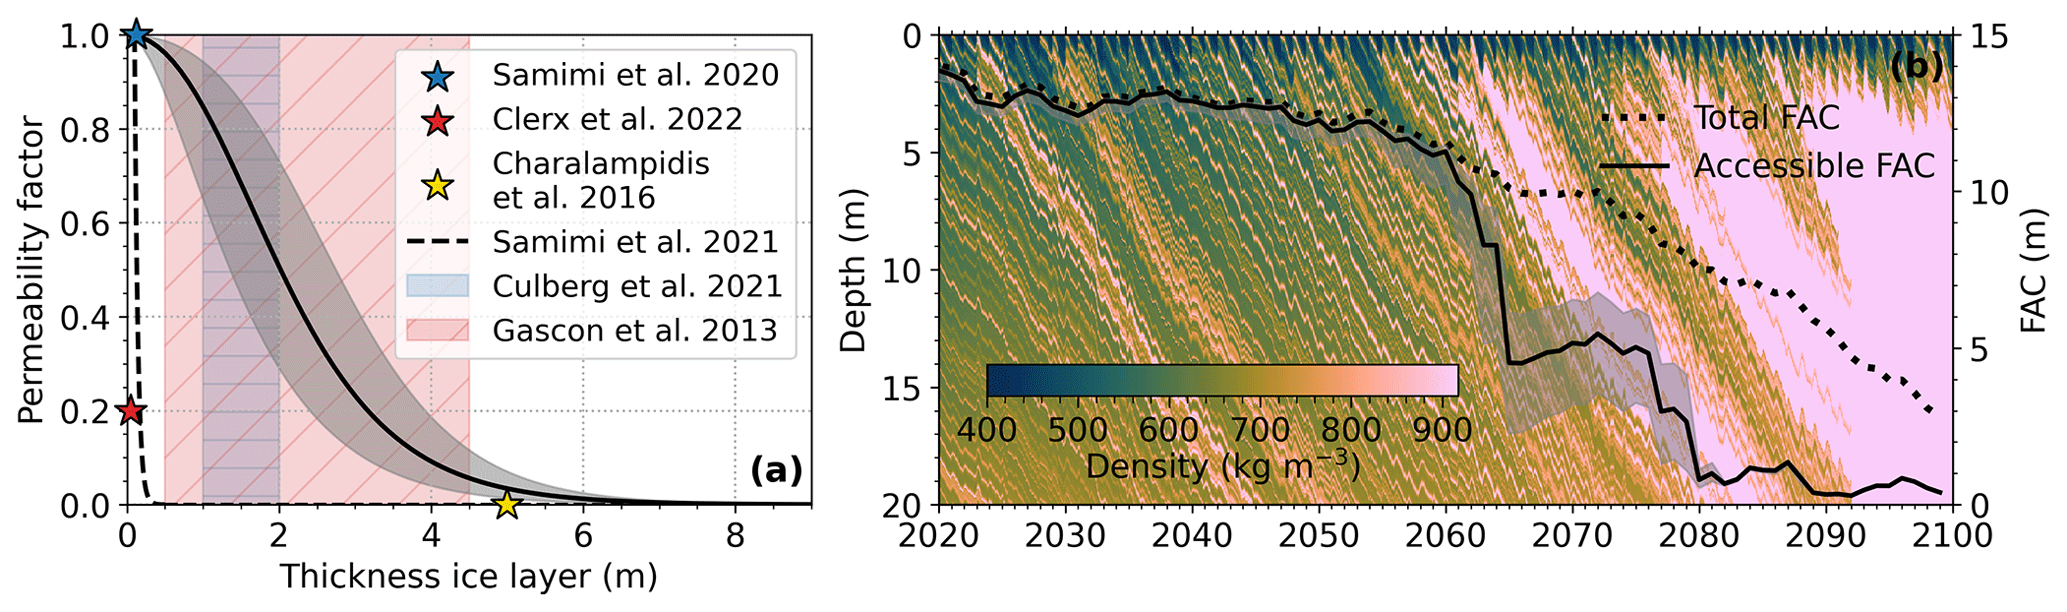
Figure 3(a) Relations between the ice layer thickness and permeability factor, including results from in situ observations (stars), a previous estimate (dotted line), observed ranges of reduced permeability from radar observations (coloured shaded surfaces) and a relationship proposed here (solid line), including tested sensitivity ranges (black-shaded surface). (b) Example plot of simulated density including total firn air content (FAC) and accessible FAC (calculated using the proposed relationship from panel a) simulated with FDM v1.2AD-C for SSP5-8.5. The location is on the Shackleton Ice Shelf and is indicated by the blue star in Fig. 1.
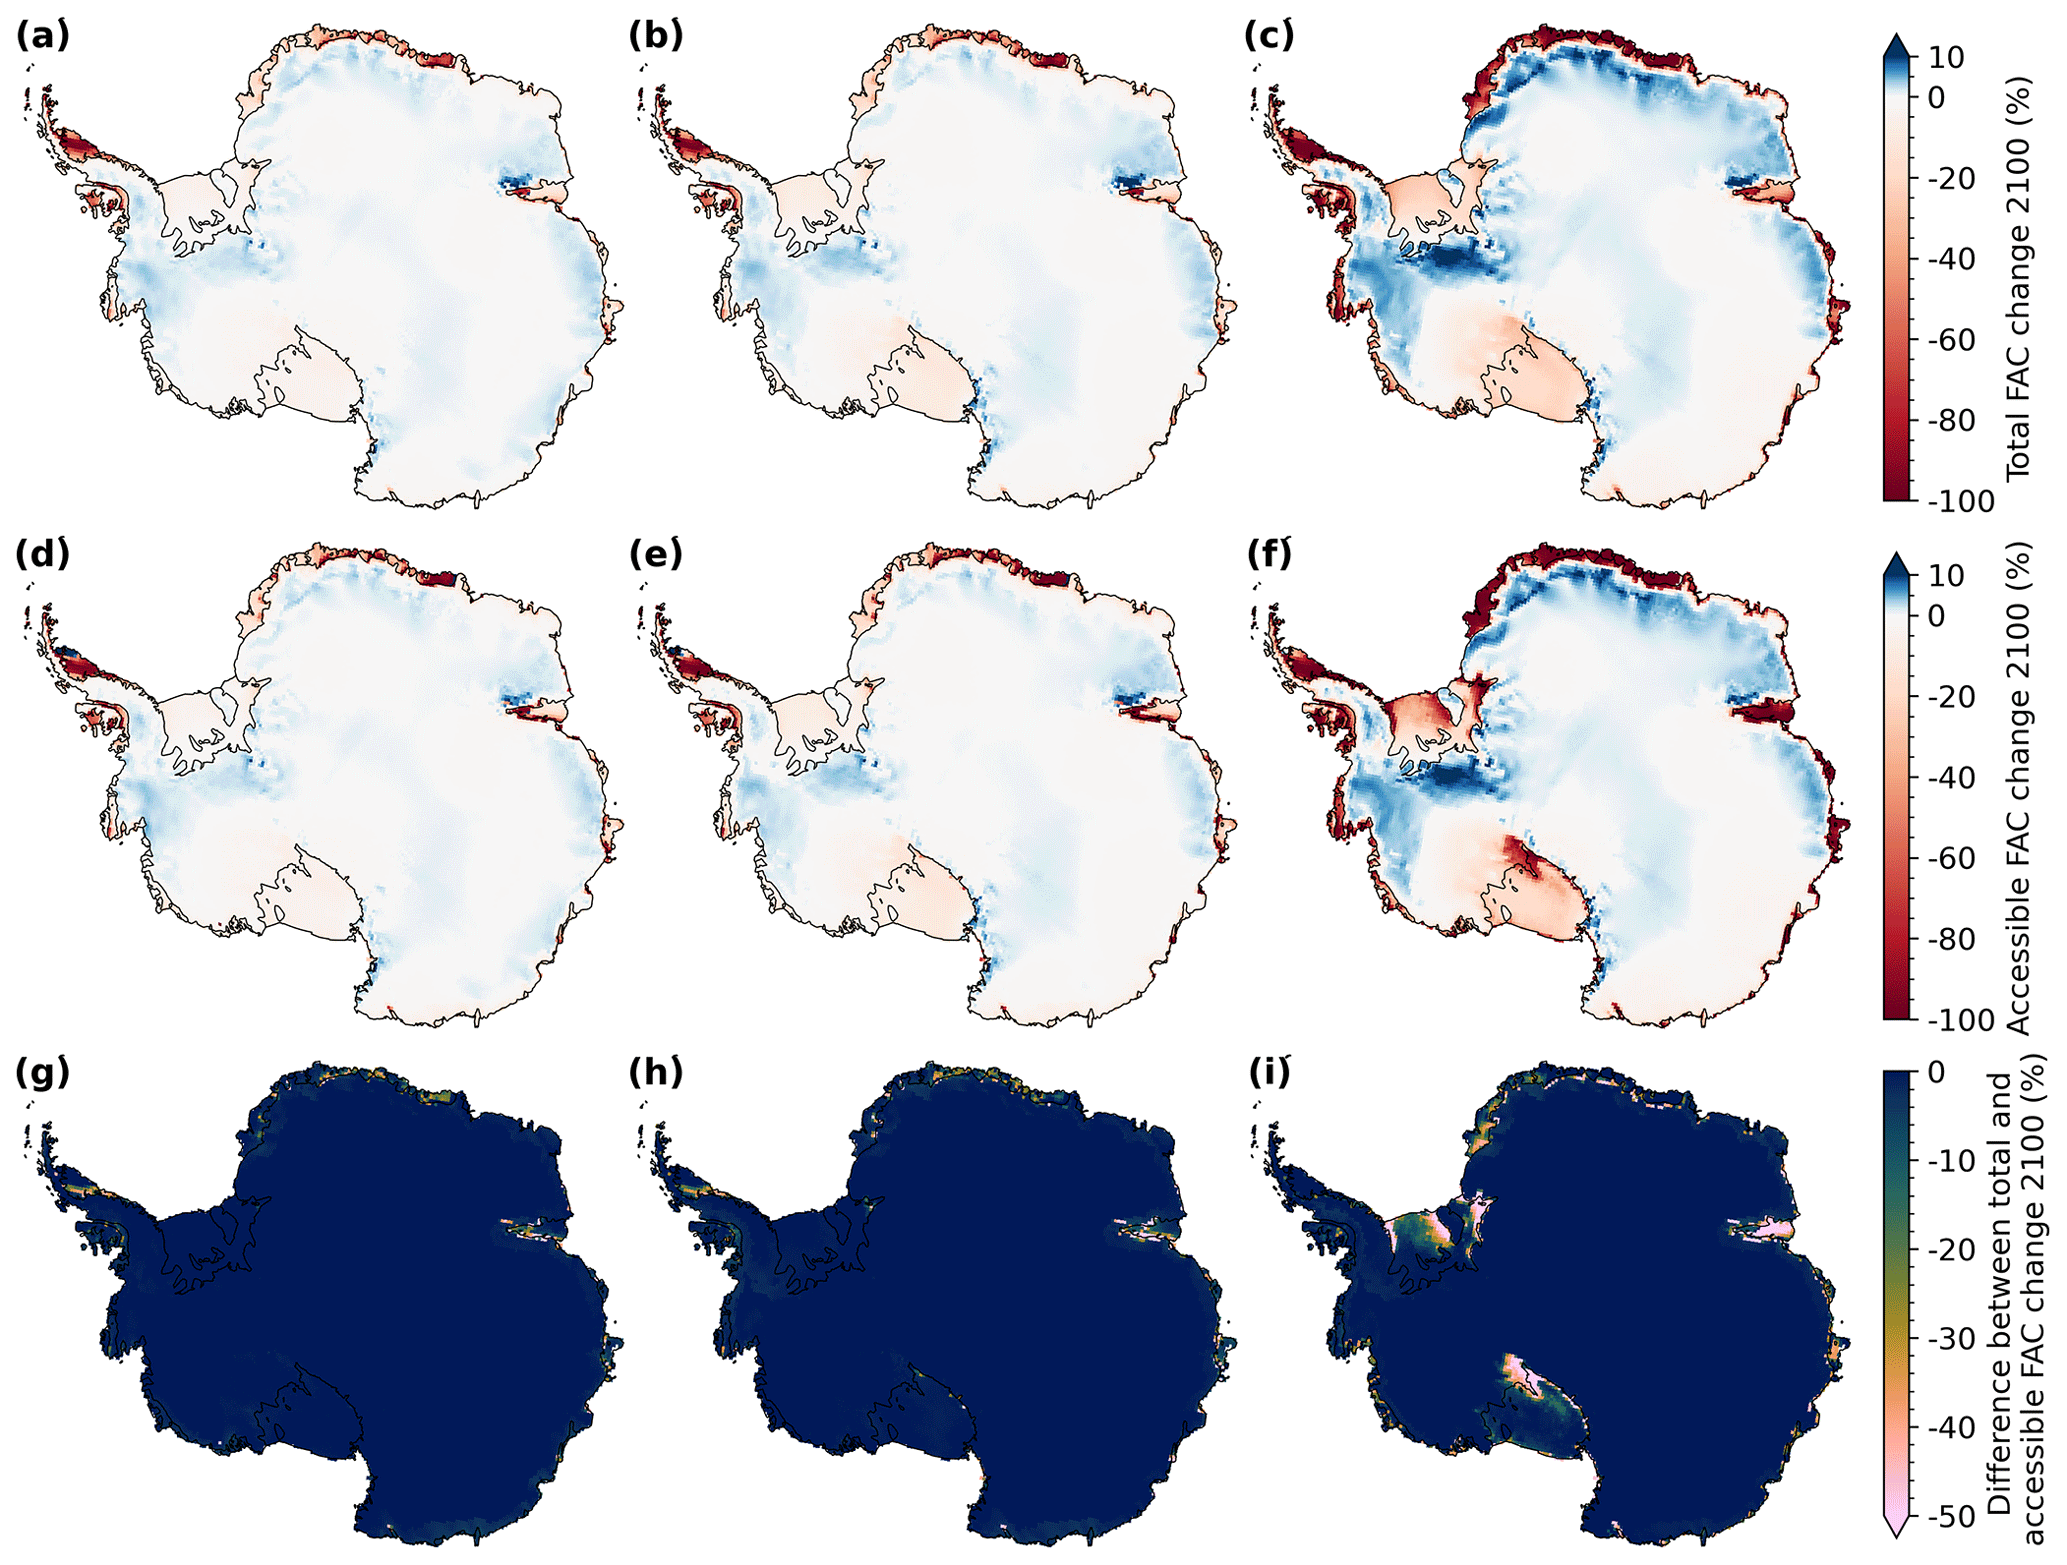
Figure 4Relative change in total firn air content (FAC) (a, b, c) and accessible FAC (d, e, f) by 2100 compared to 2014 for (a, d) SSP1-2.6, (b, e) SSP2-4.5 and (c, f) SSP5-8.5. Please note the different scales for decreasing (red) and increasing (blue) FAC. (g, h, i) Difference between the total FAC change by 2100 (a, b, c) and accessible FAC change by 2100 (d, e, f).
4.1 Total and accessible firn air content in 2100 CE
Using the updated firn model FDM v1.2AD, we project the firn evolution over the AIS for the period 1950–2100 driven by RACMO2.3p2–CESM2 for climate scenarios SSP1-2.6, SSP2-4.5 and SSP5-8.5. Figure 4a–c show the relative change in total FAC by 2100 compared to 2014. On average, FAC over the grounded ice shifts by −0.7 %, −1.1 % and −2.3 % for scenarios SSP1-2.6, SSP2-4.5 and SSP5-8.5, respectively. This implies that the effect of enhanced precipitation is weaker than the effect of firn warming. For ice shelves, FAC shifts by −16 %, −20 % and −42 % for scenarios SSP1-2.6, SSP2-4.5 and SSP5-8.5, respectively. For SSP1-2.6 and SSP2-4.5, we find a substantial FAC decrease on Larsen C (−70 % and −75 %), Wilkins (−59 % and −58 %), Roi Baudouin (−67 % and −81 %), George VI (−47 % and −56 %) and Bach (−59 % and −66 %) ice shelves. For SSP5-8.5, we additionally find a substantial FAC decrease for ice shelves in Dronning Maud Land, such as the Fimbul Ice Shelf (−91 %), and elsewhere for the Abbot (−76 %), Pine Island (−74 %), West (−83 %) and Shackleton (−76 %) ice shelves. FAC decrease on the Ross and Filchner–Ronne ice shelves is more modest (−21 % and −19 %).
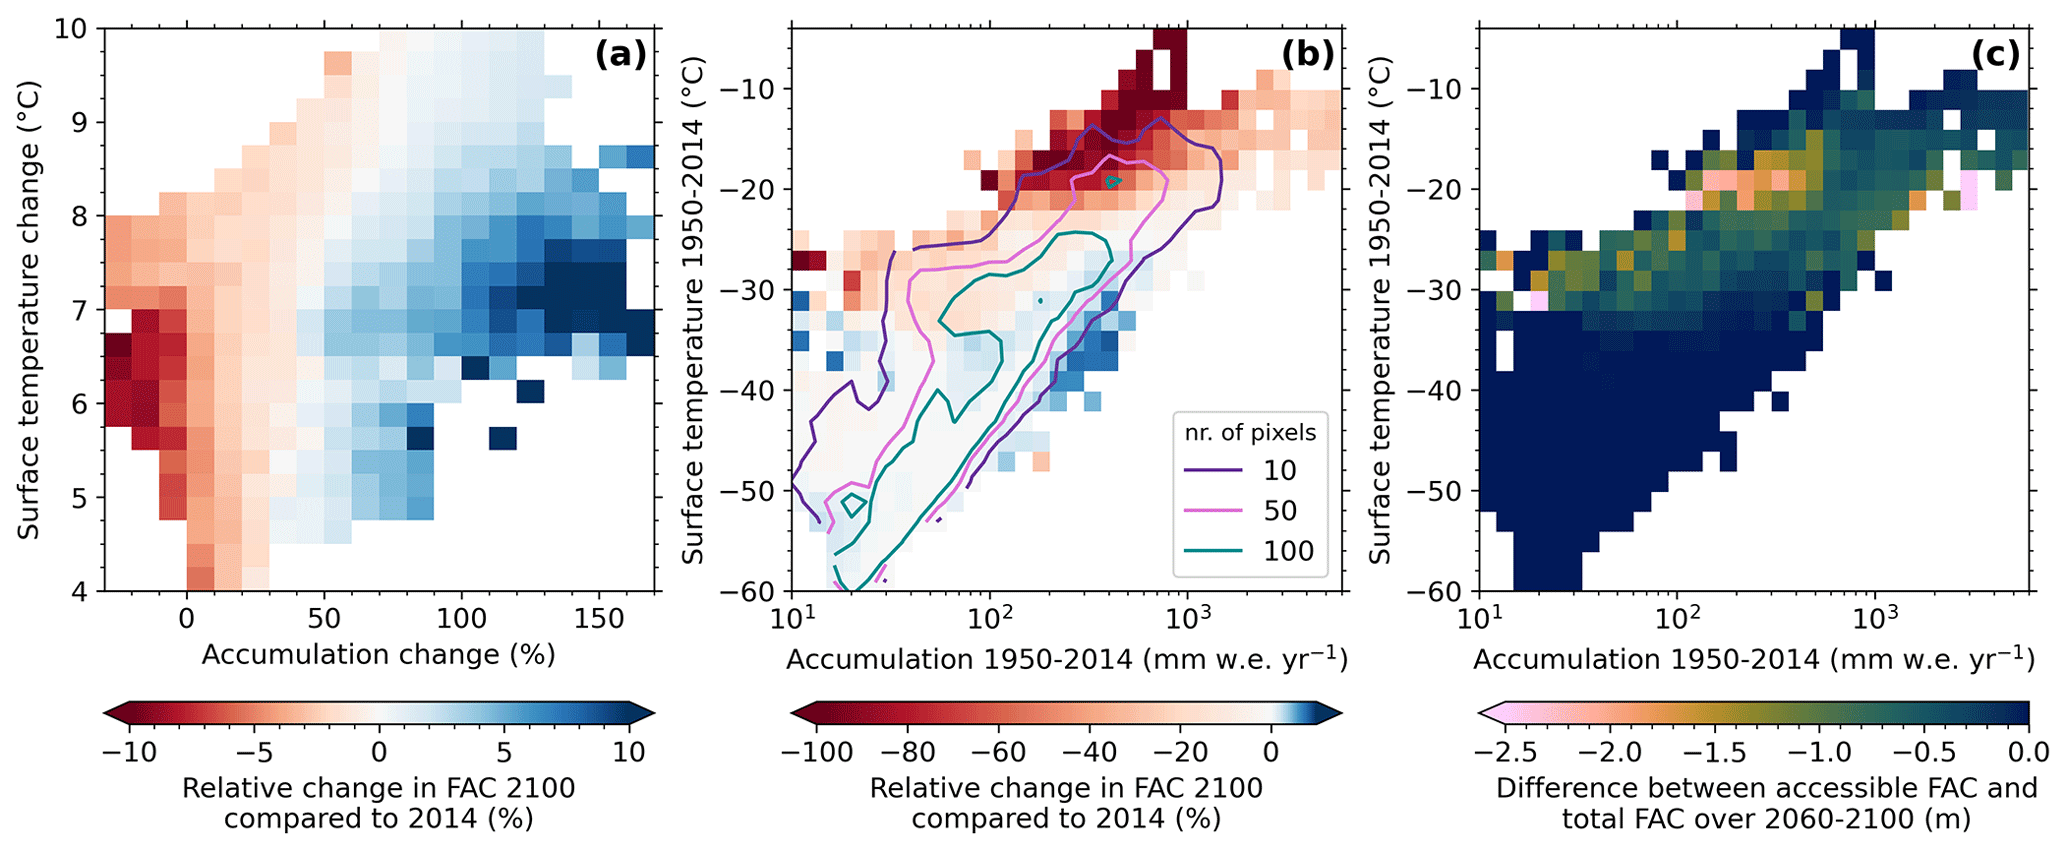
Figure 5Relative change in total firn air content (FAC) by 2100 for SSP5-8.5 compared to 2014 (a) as a function of temperature change and accumulation change by 2100 compared to 2014 for locations that do not experience melt by the end of the century in SSP5-8.5 and (b) as a function of annual average accumulation and temperature (1950–2014) for the entire AIS. (c) Average difference between accessible FAC and total FAC (accessible FAC minus total FAC) in 2060–2100 for SSP5-8.5 as a function of annual average accumulation and temperature (1950–2014) for the entire AIS. Contour lines in panel (b) indicate the number of pixels per bin. Please note the different scales for decreasing (red) and increasing (blue) FAC in panel (b).
Figure 4d–f show the relative change in accessible FAC by 2100 compared to 2014, and Fig. 4g–i show the difference between the total FAC change and accessible FAC change by 2100. The figures show that enhanced depletion of accessible FAC by ice layer formation mainly occurs over the ice shelves and is limited over the grounded ice sheet, except for the region east of the Ross Ice Shelf under SSP5-8.5. For SSP1-2.6, the decrease in accessible FAC is accelerated compared to the total FAC on Larsen D ice shelf (from −46 % to −65 %), but, on average, the difference over all ice shelves is limited (−16 % vs. −18 %), indicating limited ice layer formation. For SSP2-4.5, the depletion is accelerated on e.g. the Amery (from 30 % to −49 %), Larsen D (from −49 % to −68 %) and Fimbul (from −43 % to −55 %) ice shelves. The average difference over all ice shelves under this scenario is limited as well (−19 % vs. −23 %). In contrast, for SSP5-8.5, the accelerated accessible FAC depletion is substantial (on average, from −42 % to −53 %) and especially pronounced on e.g. Amery (from −54 % to −92 %), Shackleton (from −76 % to −94 %), Brunt (from −73 % to −93 %) and Filchner–Ronne (from −18 % to −33 %).
4.2 Climatic drivers of changes in firn air content
In this section, we link the changes in FAC under SSP5-8.5 to various climate variables. Due to low temperatures in the interior ice sheet, 76 % of the AIS does not experience melt by the end of the century even in this strong warming scenario. Here, changes in FAC are solely driven by increasing firn temperature and changing accumulation rates. In 42 % of melt-free locations, FAC decreases by 2100, while in the remaining 58 %, FAC increases. In Fig. 5a, we show the relative change in total FAC by 2100 compared to 2014 for non-melt locations as a function of temperature and accumulation change. For 4–6 °C warming, an increase of at least 30 % in accumulation is needed to compensate for the increased densification, whereas for > 8 °C warming, an increase of at least 70 % in accumulation is required. Because of these compensating mechanisms, for most of the AIS, the FAC remains relatively stable.
When we compare the change in FAC of the entire AIS to current climate conditions (1950–2014; Fig. 5b), we observe the largest relative decrease in FAC (−55 %) in currently warm regions (> −22 °C) receiving less than 1000 mm accumulation annually. For high-accumulation regions (> 1000 ), such as parts of the Getz Ice Shelf and the northwestern part of the Antarctic Peninsula, the decrease in FAC is notably smaller (−23 %). FAC also slightly decreases (−14 %) in colder regions (−34 and −24 °C) with low accumulation (< 100 ). Large differences over the period 2060–2100 between total FAC and accessible FAC mainly occur in current intermediate warm (−28 to −16 °C) and relatively dry (< 500 ) locations (−0.85 m) (Fig. 5c) and most prominently in regions with temperatures between −22 and −18 °C and accumulation rates between 100 and 400 (−1.6 m). We select this period as this is when total FAC and accessible FAC start to diverge. For colder initial conditions, the projected melt is too weak to allow for ice lens formation, while for warmer locations, the firn layer is projected to completely disappear in 2090–2100. In the wettest locations (> 600 ), the average difference is smaller (−0.59 m). The patterns in Fig. 5 are, in general, similar for SSP1-2.6 and SSP2-4.5, albeit with smaller magnitudes (Fig. S5 in the Supplement).
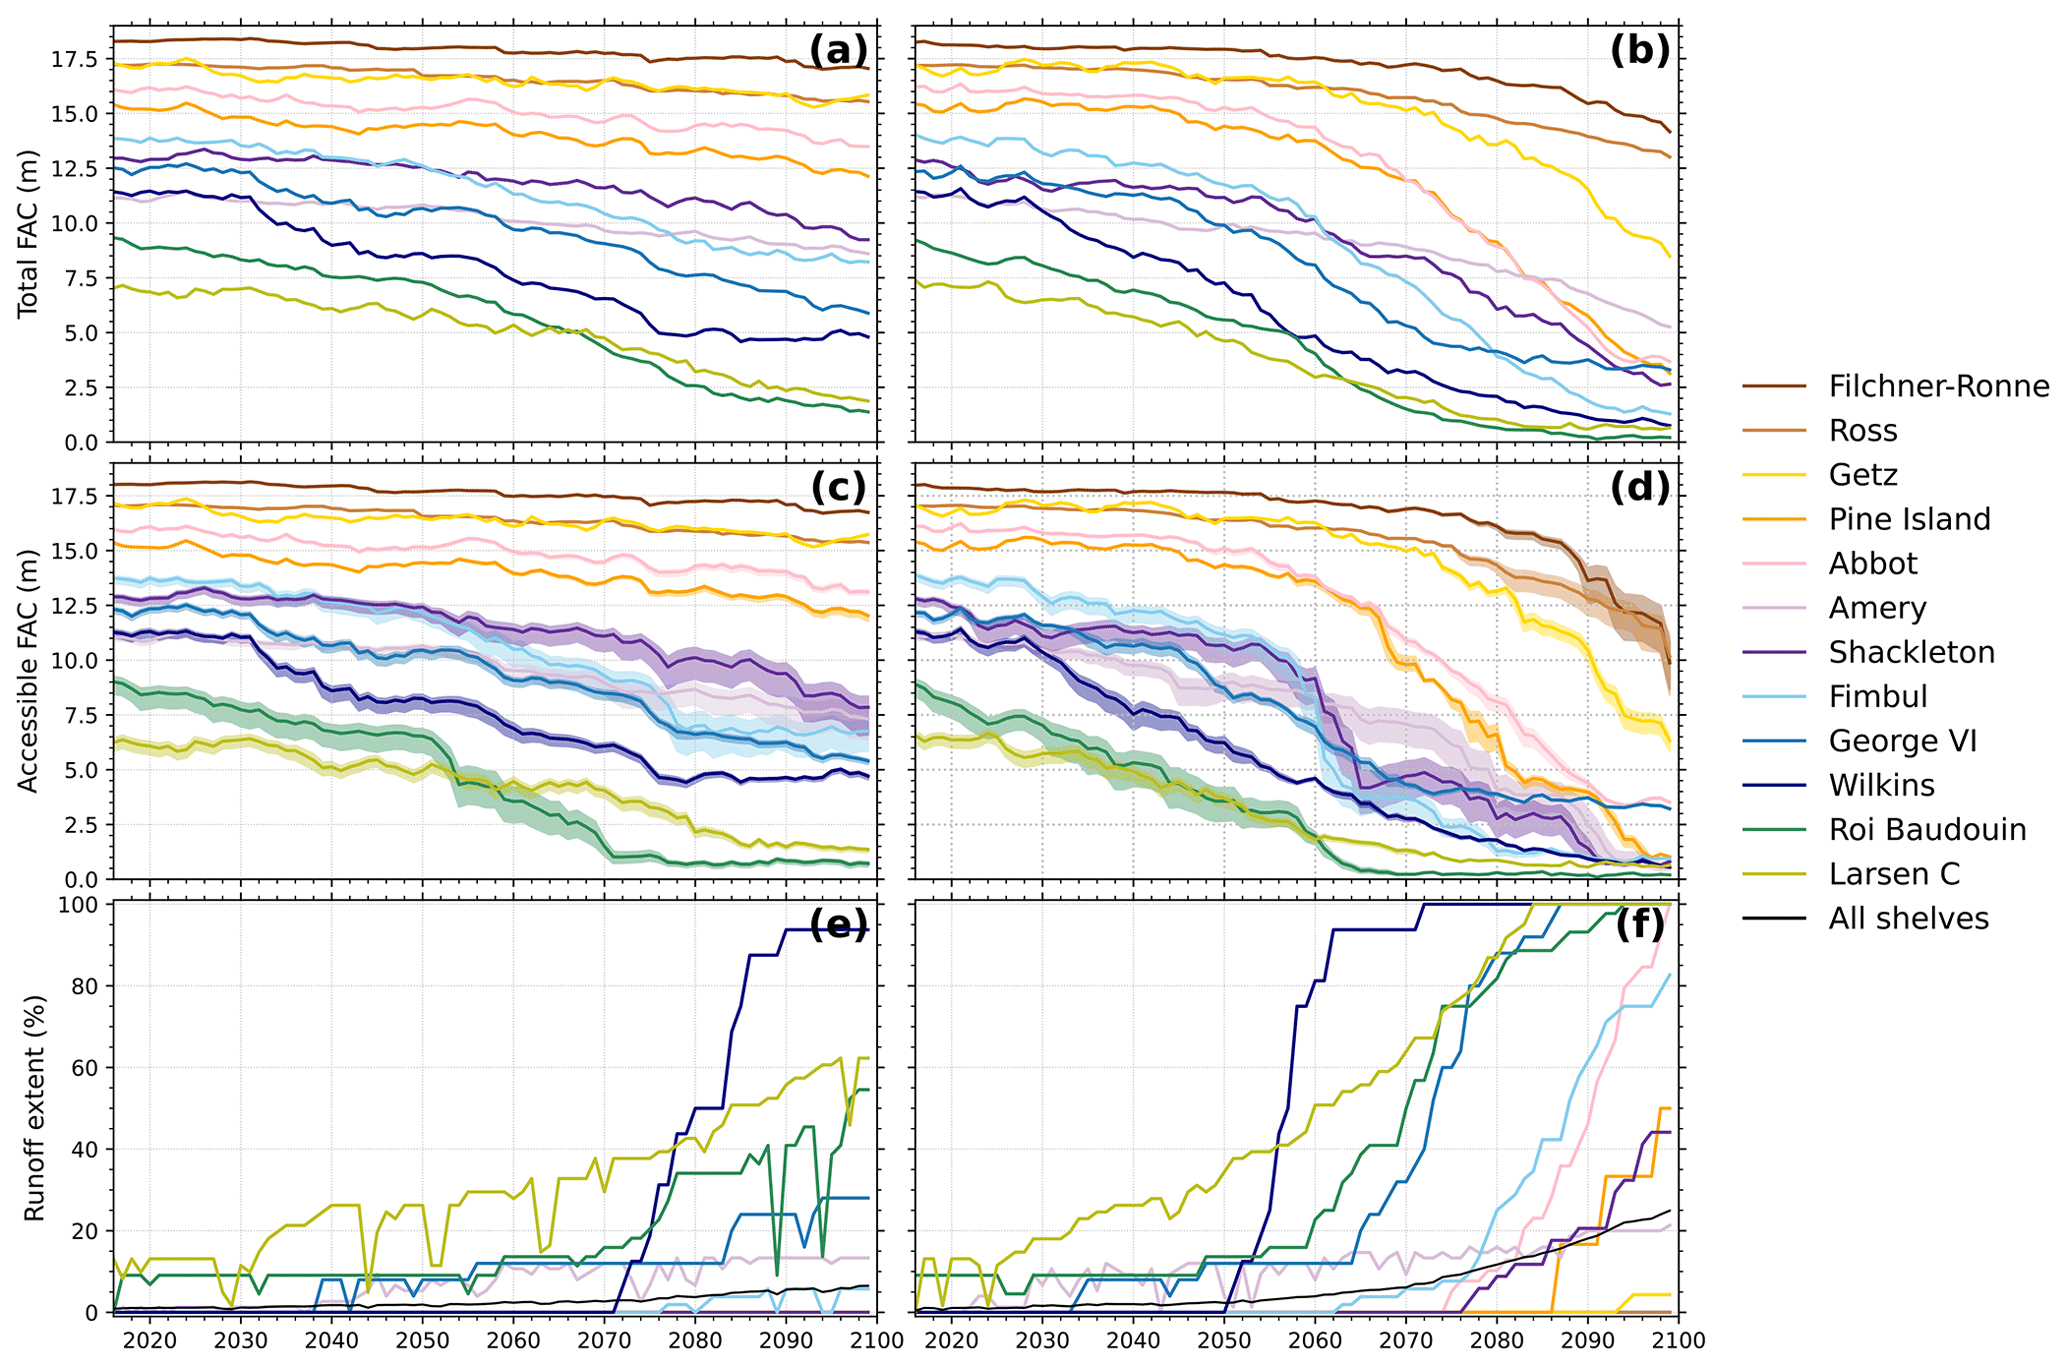
Figure 6Time series of (a, b) total firn air content (FAC), (c, d) accessible FAC and (e, f) runoff extent of 12 ice shelves for (a, c, e) SSP2-4.5 and (b, d, f) SSP5-8.5 for the period 2015–2100. The shaded areas indicate the sensitivity to the relationship between ice layer thickness and permeability factor shown in Fig. 3a.
4.3 Temporal evolution of total and accessible firn air content and runoff over ice shelves
Time series of total FAC, accessible FAC and runoff extent for 12 major ice shelves under SSP2-4.5 and SSP5-8.5 are shown in Fig. 6 (see Fig. S6 in the Supplement for SSP1-2.6). From 2020 onwards there is a gradual decrease in FAC on all ice shelves for all scenarios. An accelerated FAC depletion occurs around 2030 on the Antarctic Peninsula (Larsen C, Wilkins and George VI) ice shelves and Roi Baudouin ice shelf, irrespective of the scenario. Further ahead, for SSP5-8.5, enhanced FAC depletion on the Fimbul, Abbot, Pine Island and Shackleton ice shelves is projected around 2050–2060. Under SSP1-2.6 and SSP2-4.5 the Fimbul Ice Shelf also experiences enhanced FAC depletion around 2050–2060. By 2100, the Antarctic Peninsula ice shelves and the Roi Baudouin Ice Shelf are projected to retain less than 6 m FAC under SSP2-4.5. Under SSP5-8.5, FAC levels are anticipated to decrease by over 4 m across all ice shelves by 2100, resulting in less than 3 m of FAC remaining on the Roi Baudouin, Larsen C, Wilkins, Fimbul and Shackleton ice shelves.
Differences between the accessible and total FAC mainly occur under SSP5-8.5 and are most pronounced on Shackleton, Fimbul, Pine Island, Roi Baudouin, Amery and Filchner–Ronne ice shelves, where depletion is accelerated by up to 20 years and up to 5 m. What these ice shelves have in common is that they are currently relatively dry (< 500 ). On most ice shelves, the difference increases gradually. However, at the Fimbul and Shackleton ice shelves, ice layer formation around 2060 results in a rapid depletion of more than 5 m (> 50 %) of accessible FAC within 5 years. This coincides with an episode of high melt rates (25 % higher on Fimbul and 38 % higher on Shackleton compared to the previous and following 5 years). On the other hand, on the currently relatively warm (> −19 °C) and wet (> 600 ) Wilkins, Getz, Abbot and George VI ice shelves, there remains little difference between accessible and total FAC, which corresponds with Fig. 5c. For SSP2-4.5, there is generally little difference between total FAC and accessible FAC, except for Roi Baudouin, Fimbul and Amery ice shelves (>1 m reduction in accessible FAC compared to total FAC after 2070).
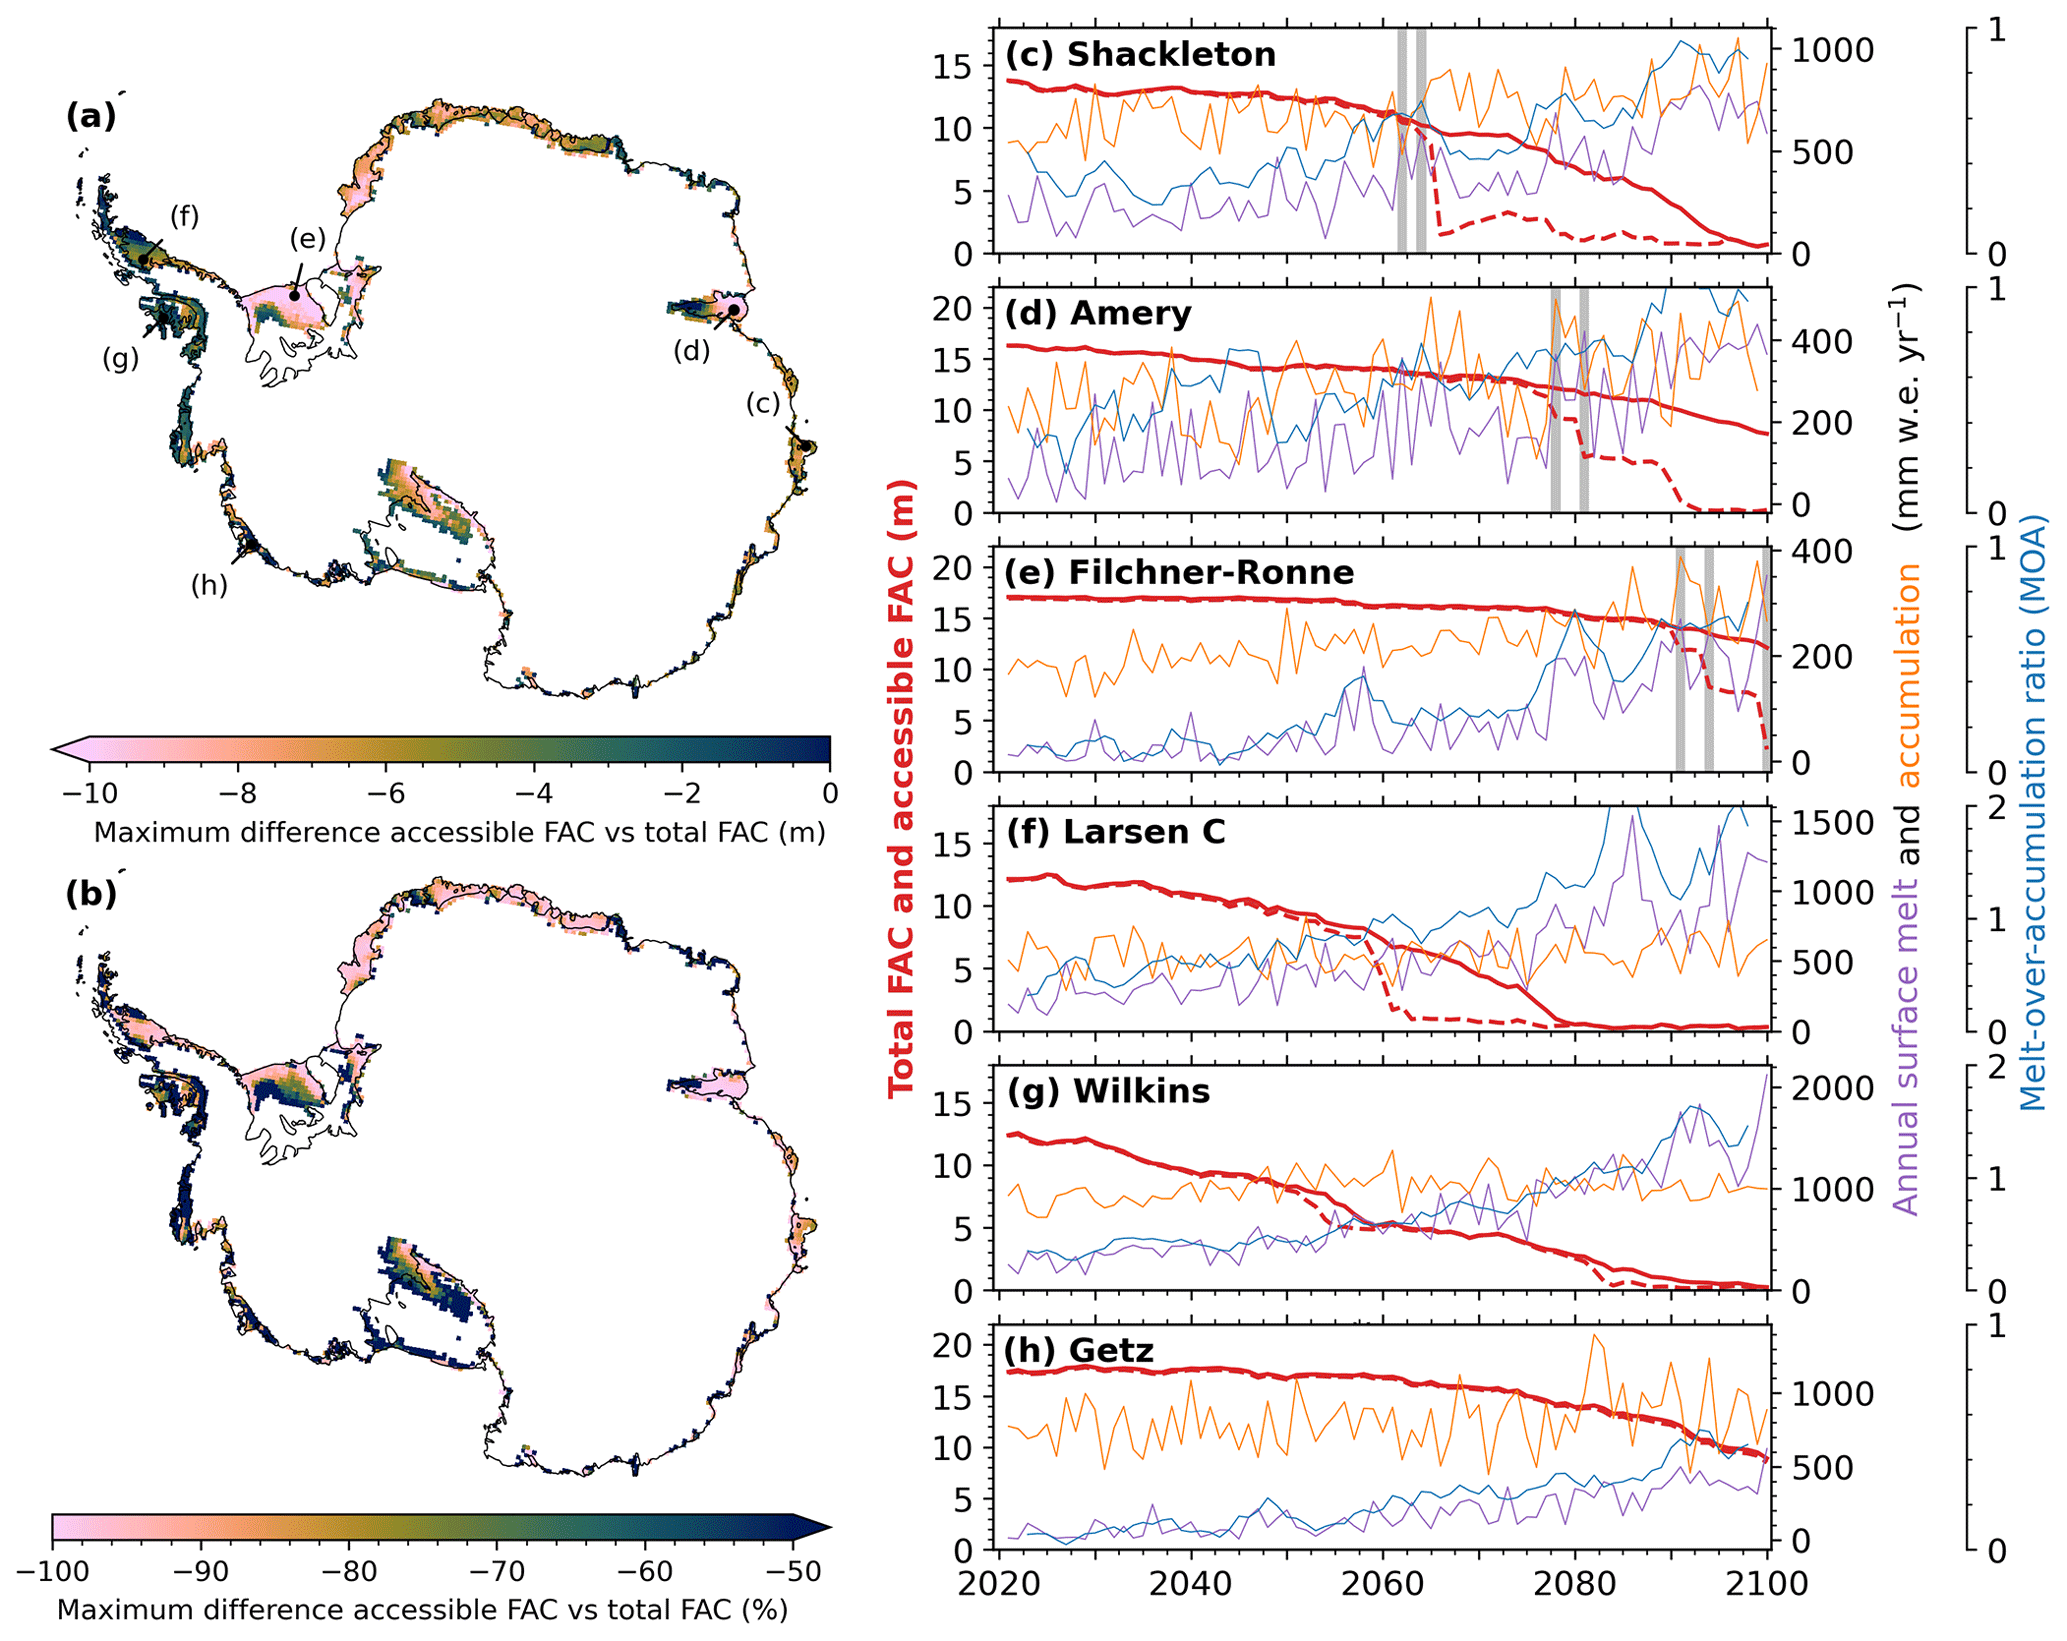
Figure 7(a, b) The maximum (a) absolute and (b) corresponding relative difference between total firn air content (FAC) and accessible FAC (total FAC minus accessible FAC) from 1950–2100 for SSP5-8.5, shown for locations with at least 25 % accessible FAC depletion in 2100 compared to 2014. (c–h) Time series of total FAC (solid red line), accessible FAC (dashed red line), annual surface melt, annual accumulation and 5-year running average melt-over-accumulation (MOA) ratio for individual grid points. The locations of the grid points are indicated in panel (a). The grey shaded areas indicate extreme melt seasons that cause persistent reduction in accessible FAC.
The runoff extent is the areal fraction of the ice shelf where runoff is generated in a given year. Since ice layers are fully permeable for meltwater percolation in IMAU-FDM, the runoff time series are closely related to the total FAC time series, with some differences (Fig. 6e and f). For the Wilkins, Abbot and George VI ice shelves, the runoff extent is large compared to the FAC depletion (>50 % runoff extent with 5 m FAC) in contrast to the Shackleton and Fimbul ice shelves, where the runoff extents are about 45 %, with 2.5 m of FAC. The reason for the high runoff extent on Wilkins, Abbot and George VI ice shelves is the combination of high accumulation and high melt rates. The high melt allows for saturation of a thick firn layer, which is maintained by high accumulation. In addition, runoff here also occurs year-round from firn aquifers, which are perennial subsurface bodies of liquid water that become more ubiquitous in a warmer Antarctica (Bell et al., 2018).
For the Wilkins Ice Shelf, we see a quick increase from 0 % to > 90 % runoff extent for both scenarios, which indicates limited spatial variation in the firn state across the ice shelf. On the other hand, Larsen C, a larger ice shelf with large latitudinal extent and climate gradients, shows a gradual southward migrating increase in runoff extent. On average, 6 % and 25 % of the entire Antarctic Ice Shelf area experience runoff in 2100 under SSP2-4.5 and SSP5-8.5, respectively, indicated by the black lines in Fig. 6e and f.
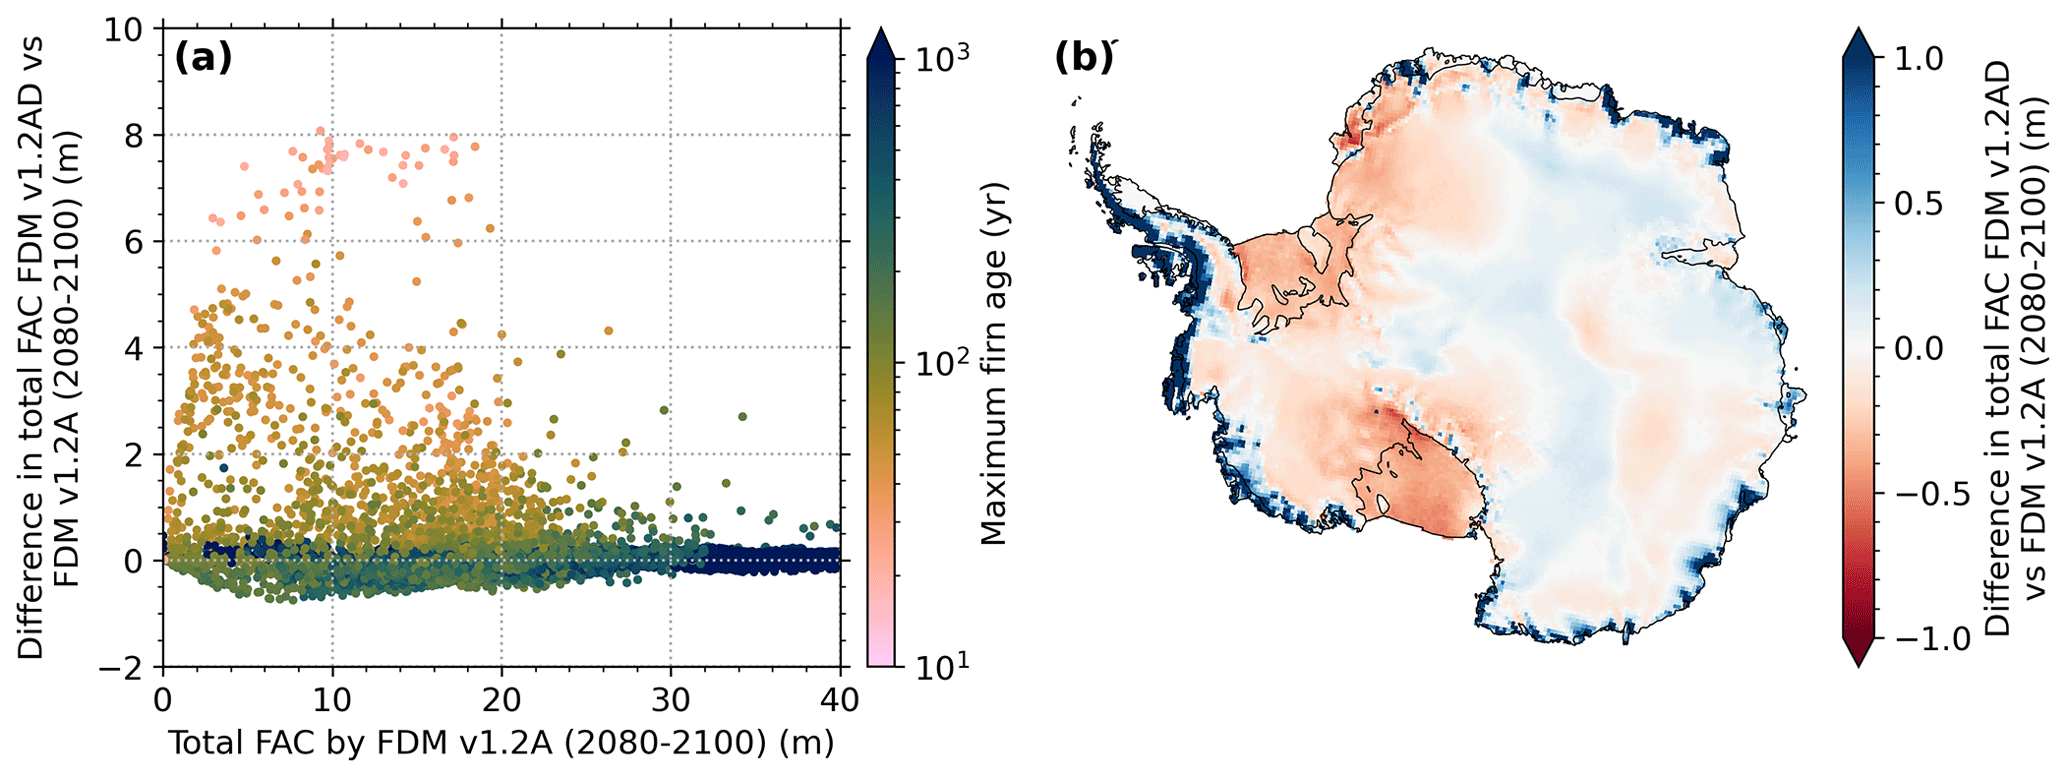
Figure 8(a) Average total firn air content (FAC) difference between FDM v1.2AD-C and FDM v1.2A-C (FDM v1.2AD-C subtracted from FDM v1.2A-C) against average FAC for FDM v1.2A-C for the period 2080–2100. The colour indicates the maximum firn age (taken as the age at the critical density level ρ = 830 kg m−3) from FDM v1.2A-C (averaged over 1950–2014). (b) Average FAC difference between FDM v1.2AD-C and FDM v1.2A-C for the period 2080–2100.
4.4 Ice layer formation and its climatic drivers
In the previous sections, we showed that ice layer formation on some ice shelves causes enhanced depletion of accessible FAC. Figure 7a and b, respectively, show the maximum absolute difference and the corresponding relative difference between total FAC and accessible FAC over the period 1950–2100 for SSP5-8.5. The differences are the highest on ice shelves in Dronning Maud Land and on the Amery, West, Shackleton, Ross and Filchner–Ronne ice shelves. In contrast, for the Ross Ice Shelf, the maximum difference is found near the grounding line and, for the Filchner–Ronne Ice Shelf, near the seaward edge. The differences are lowest in the Bellingshausen Sea region, on ice shelves such as Wilkins, George VI, Stange and Abbot and on the Getz and Crosson ice shelves (< −3.9 m and < −47 %), which are among the warmest and wettest ice shelves of the AIS (> −19 °C and > 600 ). The absence of ice slabs under these conditions is also depicted in Fig. 5c.
In Fig. 7c to h, we zoom in on FAC and accessible FAC time series for selected locations plotted together with accumulation, melt and associated MOA. At the Amery, Shackleton and Filchner–Ronne ice shelves, we see that extreme melt seasons can cause a persistent reduction in accessible FAC (indicated by the grey-shaded area). We define a melt season as extreme when the melt exceeds the 93rd quantile of the detrended time series. The 5-year running average MOA values for which this occurs on Amery, Shackleton and Filchner–Ronne are between 0.59 and 0.71. On Larsen C, where melt is more constant over the years, this occurs for a MOA of about 1.04. On the wetter Wilkins location, ice layer formation is limited, even though the firn layer becomes completely depleted and a MOA of 1 is exceeded. In addition, on the wetter Getz Ice Shelf location, ice layer formation is also limited as a MOA of 0.6 has not been reached, even though > 50 % of the FAC has depleted. The general pattern of these figures is that meltwater-blocking ice lenses are primarily formed in drier locations with considerable interannual variability in melt.
4.5 Impact of the dynamical densification model on future firn evolution
The change to a dynamical densification expression changes the temporal evolution of the firn. In this section and in Fig. 8, we quantify this effect by comparing the FAC by 2080–2100 under SSP5-8.5 simulated by FDM v1.2A and by the dynamical model (FDM v1.2AD). We select the period 2080–2100 as the firn layer disappears in 2090 on some ice shelves (Fig. 6b). As shown in Sect. 2.1, both models include the effect of warmer snow densifying faster. However, in FDM v1.2A, the compensating effects of enhanced grain growth, which makes snow stiffer, and enhanced accumulation, which increases the overburden pressure, are parameterised using 40-year running averages of temperature and accumulation.
High accumulation rates result in firn mostly younger than 40 to 100 years, and in such regions, FDM v1.2A provides lower 2080–2100 FAC estimates than the dynamical model. This indicates that the effect of grain size growth, which slows down densification, is underestimated in FDM v1.2A in a transient climate for these locations. Figure 8b shows that these young firn locations are mostly found along the coasts of the Antarctic Peninsula and West Antarctica, such as the Wilkins, Getz and George VI ice shelves. Average end-of-century (2080–2100) FAC estimates of the dynamical model are 3.8 and 1.1 m higher in regions with a maximum firn age lower than 40 and 100 years, respectively.
For locations with older firn (> 100 years), the differences are smaller. This does not prove that the parameterisations of transient behaviour are correct, but at least their errors largely balance out. Clear spatial patterns are visible in Fig. 8b. At the currently relatively dry Ross and Filchner–Ronne ice shelves (105 and 170 annual average accumulation, respectively), the dynamical model results in a quicker FAC depletion (−0.45 and −0.41 m, respectively) compared to FDM v1.2A due to a dominating effect of the increase in temperature (+8.1 and +8.4 °C, respectively) compared to accumulation (+10 % and +61 %, respectively) by 2080–2100 compared to 1950–2014.
5.1 Firn air depletion
We use a firn model with an updated dynamical densification expression to simulate FAC over the AIS under future warming scenarios. We also estimate the impact of ice slabs on the accessible FAC. For the contemporary climate, the performance of the updated model is comparable to the non-dynamical model (Fig. 2). In a warming transient climate (here tested for SSP5-8.5), the Ross and Ronne-Filcher ice shelves in the updated model are more vulnerable to firn air depletion. On the other hand, high-accumulation ice shelves, such as Getz, Wilkins and George VI, are less vulnerable (Fig. 8).
The high vulnerability of the Antarctic Peninsula ice shelves and the Roi Baudouin Ice Shelf to total FAC depletion (> 50 % decrease in FAC by 2100 for all scenarios) aligns with previous studies (Gilbert and Kittel, 2021; Kuipers Munneke et al., 2014a; van Wessem et al., 2023). According to our results, enhanced FAC depletion on these ice shelves is expected to start around 2030 for all scenarios (Figs. 6 and S6). For SSP5-8.5, we also find a substantial FAC depletion (> 74 % decrease) for ice shelves in Dronning Maud Land, such as Fimbul, and elsewhere for Abbot, Pine Island, West and Shackleton ice shelves. Enhanced FAC depletion on these ice shelves is expected to occur around 2050–2060 for SSP5-8.5.
By including the effect of reduced permeability of ice slabs, our results reveal enhanced accessible FAC depletion under SSP5-8.5 on ice shelves with current accumulation rates of < 500 , mean annual temperatures of < −16 °C and interannual variability in melt. Such ice shelves are mainly situated in East Antarctica but also include the Ross, Filchner–Ronne, Larsen C and Pine Island ice shelves. Enhanced depletion starts around 2060–2070 for Shackleton, Fimbul and Pine Island shelves (∼ 4 °C AIS-wide average warming) and around 2080 for the colder Ross and Filchner–Ronne ice shelves (∼ 6 °C AIS-wide average warming). For SSP1-2.6 and SSP2-4.5 the accelerated accessible FAC depletion is limited to Larsen D, Fimbul, Amery and Roi Baudouin ice shelves. The formation of ice slabs thus increases the divergence between firn air depletion for the high-emission scenario on the one hand and for low- and intermediate-emission scenarios on the other hand.
Our results suggest that extreme melt seasons can initiate ice-slab formation (Fig. 7), as observed in Greenland (Culberg et al., 2021). When ice layers that formed during an extreme melt season remain in contact with the surface hydrology, they concentrate new refreezing above their horizon, amplifying the contribution of even average subsequent melt seasons to ice-slab formation (Jullien et al., 2023). However, standing water on top of ice layers is not considered by IMAU-FDM, but an alternative positive feedback mechanism is captured: ice has a higher thermal conductivity, which contributes to more efficient conductive cooling and thereby promotes the growth of ice layers and slabs (Vandecrux et al., 2020). The future accessible FAC on these ice shelves will depend on the frequency of future extreme melt events, and the timing of depletion is therefore less certain compared to non-ice-slab regions, where the depletion is mainly forced by the mean climate state and therefore more gradual.
Ice shelves where ice-slab formation under SSP5-8.5 is prevented have current accumulation rates > 600 and mean annual temperatures > −19 °C and are mainly situated on the Antarctic Peninsula and West Antarctica, such as Wilkins, Stange, Abbot, Crosson and Getz ice shelves. High accumulation allows new pore space to regenerate FAC above the most recent refreezing layers. In addition, mild temperatures and more low-density fresh snow, both reducing the refreezing capacity per m3 of firn, prevent firn from reaching the ice density. The projected increasing snowfall in Antarctica is thus important not only to counteract ice sheet mass loss, but also to prevent ice-slab formation. This is in line with MacFerrin et al. (2019), who found that ice slabs appear to be absent in regions of high accumulation (> 572 ) on the Greenland Ice Sheet. In contrast, high accumulation (> 1000 ) and mild (> −19 °C) conditions may lead to the formation of aquifers (Kuipers Munneke et al., 2014b; van Wessem et al., 2021), which aligns with the absence of extensive refreezing. Although firn aquifers do not have a depleted (accessible) FAC, the runoff from aquifers has the potential to cause hydrofracturing. Therefore, we will explore the future expansion of AIS aquifers in a forthcoming study.
The AIS ice-shelf-wide runoff extent in Fig. 6, which is 25 % by 2100 for SSP5-8.5, is substantially lower than reported by Gilbert and Kittel (2021), who estimate a runoff extent of 98 % by 2100 using the regional climate model MAR forced by the same CESM2 realisation. In MAR, liquid water reaching a firn layer with a density of > 830 kg m−3 is converted to runoff, whereas in IMAU-FDM, ice layers are completely permeable for meltwater percolation. Both models thus represent extremes in permeability assumptions, which explains the large difference. This also underlines the potentially large impact of ice slabs when estimating the onset of meltwater ponding. Besides this, MAR also yields higher melt rates compared to RACMO2 for the same forcing (Carter et al., 2022), which is potentially caused by a more active snowmelt–albedo feedback. Differences in the initialisation of the firn layer could also contribute to the discrepancy.
Extensive meltwater ponding is expected when accessible FAC is strongly depleted. Figure 6 shows that runoff is enhanced when total FAC (averaged over the ice shelf) roughly approaches 2.5 m for low-accumulation ice shelves, such as the Roi Baudouin Ice Shelf, and 5 m for high-accumulation ice shelves, such as the Wilkins Ice Shelf. We expect that the accessible FAC thresholds for runoff generation are approximately similar. Based on these assumptions, Fig. 6 implies an extensive melt ponding onset around 2060 on the Roi Baudouin Ice Shelf for all scenarios. On Larsen C and Wilkins ice shelves, meltwater ponding is expected around 2060 for SSP5-8.5 and around 2080 for SSP1-2.6 and SSP2-4.5. For these three ice shelves, meltwater ponding is thus expected to occur in the 21st century irrespective of the emission scenario. For SSP5-8.5, extensive meltwater ponding is expected to occur on George VI around 2070; on Fimbul around 2075; and on the Shackleton, Amery and Pine Island ice shelves around 2090. However, extensive meltwater ponding has already been observed on the northern George VI Ice Shelf (van Wessem et al., 2023), which suggests that our initial FAC estimates (Fig. 1) may be overestimated. On the other hand, locally observed meltwater ponding along the grounding lines of Amery and Roi Baudouin ice shelves is in line with our low initial FAC estimates there.
5.2 Limitations
FDM v1.2AD uses the bucket scheme to simulate vertical meltwater movement, which does not allow for standing water over impermeable ice slabs, lateral meltwater movement or preferential flow. Neglecting these processes has impacts on densification and ice layer formation. Verjans et al. (2019) found that a firn model using the bucket scheme produces similar density results as the more physics-based Richards equation in a single domain for four locations on the Greenland ice sheet. Using the Richards equation in a dual domain, which accounts for partitioning between matrix and fast preferential flow, simulated more ice layers and underestimated the FAC to a greater extent but is better at reproducing density variability with depth. Using two firn models that use the bucket scheme, Thompson-Munson et al. (2023) simulated ice slabs in Greenland and found that most ice slabs detected by IceBridge accumulation radar data in 2014 (MacFerrin et al., 2019) overlap with simulated ice slabs and ablation zones. On average, the observed ice slabs are located at slightly higher altitudes than the modelled ones. However, the results are also strongly influenced by the densification equation and climatic forcing used (Verjans et al., 2019).
The densification scheme used in FDM v1.2AD (Eq. 4) is developed for dry-snow densification. The presence of liquid water may also impact the densification rate of firn; but, due to a lack of physical understanding and available measurements, this effect has not been included. In line with this, the in situ observations used for the calibration and evaluation of the model are mainly (90 %) situated in non-melt regions. Equation (4) depends on initial grain size (taken here as 0.03 mm), which is a poorly constrained parameter over the range of climates on ice sheets. Fortunately, the model grain size is not very sensitive to the initial value, since the growth rate is independent of the initial grain size, and the grain size quickly becomes magnitudes larger (e.g. a growth rate of 0.0056 mm d−1 for a firn layer of 250 K). Observed and modelled albedo evolution through melt–refreezing cycles shows that refreezing strongly increases the grain size (e.g. van Dalum et al., 2022). However, tests with a different refreezing grain size (e.g. 0.4 mm instead of 0.25 mm) did not lead to very different results (Fig. S7 in the Supplement). Again, this process is poorly constrained by direct observations, and hence the impact of refreezing on grain size and subsequently on firn compaction remains uncertain. Firn compaction by horizontal divergence and strain softening is not included in the model; therefore, densification in high-strain and horizontal stretching areas, such as Pine Island and Thwaites ice shelves, is likely underestimated (Horlings et al., 2021; Oraschewski and Grinsted, 2022).
Our outcomes of accessible FAC depend on ice-slab formation, which is a complex process to model. The current approach (as a diagnostic post-processing step rather than including it in the model) should be regarded as an exploratory study. We present these results together with the total FAC and test the sensitivity to several ice layer thickness–permeability relations. We found that the timing and magnitude of accessible FAC depletion averaged over ice shelves are not very sensitive (< 10 years and < 1 m) to the thickness–permeability relationships used (Figs. 3 and 6). Including the impermeability of ice layers interactively within IMAU-FDM will be tested in future work.
The current view is that meltwater ponding weakens ice shelves, potentially leading to ice-shelf disintegration by hydrofracturing (Banwell et al., 2013). However, Bell et al. (2017) found that when the ice surface slope is sufficiently steep, rivers can form that transport liquid water laterally to the ocean, thereby preventing its destructive effects on ice shelves. FDM does not include a liquid water routing scheme to transport water laterally by streams and rivers.
Our results are furthermore limited by only a single general circulation model (CESM2) and one model for dynamical downscaling (RACMO2). Future work should address this by an ensemble of Earth system models and other regional climate models such as MAR (Kittel et al., 2021) and MetUM (Orr et al., 2021), which have different outcomes for melt (Carter et al., 2022). The exact timing and amount of (accessible) FAC depletion will vary when using a different forcing dataset; however, the broad spatial variability among climatic regions and the dependency of ice layer formation on accumulation should not be fundamentally different.
In this study, we explored future (accessible) FAC evolution over the AIS under various emission scenarios. Our main tool is a firn model with an updated densification expression that allows for changing climatic conditions. Compared to the previous model version, the Ross and Filcher–Ronne ice shelves emerge as being more vulnerable to FAC depletion, while high-accumulation ice shelves, such as Getz, Wilkins and George VI, are less vulnerable. In our simulations, ice shelves on the Antarctic Peninsula and the Roi Baudouin Ice Shelf in Dronning Maud Land are particularly vulnerable to FAC depletion, also under low-emission (SSP1-2.6) and intermediate-emission (SSP2-4.5) scenarios (> 50 % decrease in FAC by 2100). In the high-emission (SSP5-8.5) scenario, all ice shelves experience considerable FAC depletion by 2100 (> 19 % decrease). The formation of ice slabs further reduces accessible FAC under SSP5-8.5, especially on low-accumulation ice shelves (current rates < 500 ) with a considerable interannual variability in surface melt. This includes many East Antarctic ice shelves and the Filchner–Ronne, Ross, Pine Island and Larsen C ice shelves. Under emission scenarios SSP1-2.6 and SSP2-4.5, ice-slab formation is limited to the Larsen D, Roi Baudouin, Fimbul and Amery ice shelves. High accumulation rates (currently > 600 ) on the Antarctic Peninsula and West Antarctic ice shelves, such as the Wilkins, George VI, Getz, Abbot, Stange and Crosson ice shelves, prevent the formation of ice slabs under all scenarios. These results highlight the potentially large vulnerability of low-accumulation ice shelves to firn air depletion through ice-slab formation.
The code of IMAU-FDM v1.2AD is available on Zenodo (https://doi.org/10.5281/zenodo.10723570; Veldhuijsen et al., 2023b).
The IMAU-FDM v1.2AD results (total firn air content and accessible firn air content) are available on Zenodo (https://doi.org/10.5281/zenodo.10726834; Veldhuijsen et al., 2023c).
The supplement related to this article is available online at: https://doi.org/10.5194/tc-18-1983-2024-supplement.
SBMV and WJvdB defined the research goals and designed the study. SBMV updated the model, performed the simulations and analysed the results. All authors contributed to discussions on the paper.
At least one of the (co-)authors is a member of the editorial board of The Cryosphere. The peer-review process was guided by an independent editor, and the authors also have no other competing interests to declare.
Publisher's note: Copernicus Publications remains neutral with regard to jurisdictional claims made in the text, published maps, institutional affiliations, or any other geographical representation in this paper. While Copernicus Publications makes every effort to include appropriate place names, the final responsibility lies with the authors.
We acknowledge the European Centre for Medium-Range Weather Forecasts (ECMWF) for computational time on their supercomputers.
This research has been supported by the Dutch Research Council (grant no. OCENW.GROOT.2019.091). Michiel R. van den Broeke was supported by the Netherlands Earth System Science Centre (NESSC).
This paper was edited by Masashi Niwano and reviewed by two anonymous referees.
Arthern, R. J., Vaughan, D. G., Rankin, A. M., Mulvaney, R., and Thomas, E. R.: In situ measurements of Antarctic snow compaction compared with predictions of models, J. Geophys. Res.-Earth, 115, F03011, https://doi.org/10.1029/2009JF001306, 2010. a, b, c, d, e, f
Banwell, A. F., MacAyeal, D. R., and Sergienko, O. V.: Breakup of the Larsen B Ice Shelf triggered by chain reaction drainage of supraglacial lakes, Geophys. Res. Lett., 40, 5872–5876, https://doi.org/10.1002/2013GL057694, 2013. a, b
Bell, R. E., Chu, W., Kingslake, J., Das, I., Tedesco, M., Tinto, K. J., Zappa, C. J., Frezzotti, M., Boghosian, A., and Lee, W. S.: Antarctic ice shelf potentially stabilized by export of meltwater in surface river, Nature, 544, 344–348, https://doi.org/10.1038/nature22048, 2017. a
Bell, R. E., Banwell, A. F., Trusel, L. D., and Kingslake, J.: Antarctic surface hydrology and impacts on ice-sheet mass balance, Nat. Clim. Change, 8, 1044–1052, https://doi.org/10.1038/s41558-018-0326-3, 2018. a
Bréant, C., Martinerie, P., Orsi, A., Arnaud, L., and Landais, A.: Modelling firn thickness evolution during the last deglaciation: constraints on sensitivity to temperature and impurities, Clim. Past, 13, 833–853, https://doi.org/10.5194/cp-13-833-2017, 2017. a
Brils, M., Kuipers Munneke, P., van de Berg, W. J., and van den Broeke, M.: Improved representation of the contemporary Greenland ice sheet firn layer by IMAU-FDM v1.2G, Geosci. Model Dev., 15, 7121–7138, https://doi.org/10.5194/gmd-15-7121-2022, 2022. a
Calonne, N., Milliancourt, L., Burr, A., Philip, A., Martin, C. L., Flin, F., and Geindreau, C.: Thermal Conductivity of Snow, Firn, and Porous Ice From 3-D Image-Based Computations, Geophys. Res. Lett., 46, 13079–13089, https://doi.org/10.1029/2019GL085228, 2019. a
Carter, J., Leeson, A., Orr, A., Kittel, C., and van Wessem, J. M.: Variability in Antarctic surface climatology across regional climate models and reanalysis datasets, The Cryosphere, 16, 3815–3841, https://doi.org/10.5194/tc-16-3815-2022, 2022. a, b
Charalampidis, C., Van As, D., Colgan, W. T., Fausto, R. S., Macferrin, M., and Machguth, H.: Thermal tracing of retained meltwater in the lower accumulation area of the Southwestern Greenland ice sheet, Ann. Glaciol., 57, 1–10, 2016. a
Clerx, N., Machguth, H., Tedstone, A., Jullien, N., Wever, N., Weingartner, R., and Roessler, O.: In situ measurements of meltwater flow through snow and firn in the accumulation zone of the SW Greenland Ice Sheet, The Cryosphere, 16, 4379–4401, https://doi.org/10.5194/tc-16-4379-2022, 2022. a
Coléou, C., Xu, K., Lesaffre, B., and Brzoska, J.-B.: Capillary rise in snow, Hydrol. Process., 13, 1721–1732, 1999. a
Culberg, R., Schroeder, D. M., and Chu, W.: Extreme melt season ice layers reduce firn permeability across Greenland, Nat. Commun., 12, 2336, https://doi.org/10.1038/s41467-021-22656-5, 2021. a, b, c, d
Danabasoglu, G., Lamarque, J.-F., Bacmeister, J., Bailey, D., DuVivier, A., Edwards, J., Emmons, L., Fasullo, J., Garcia, R., Gettelman, A., Hannay, C., Holland, M. M., and Large, W. G.: The community earth system model version 2 (CESM2), J. Adv. Model. Earth Sy., 12, e2019MS001916, https://doi.org/10.1029/2019MS001916, 2020. a, b
Datta, R. T., Herrington, A., Lenaerts, J. T. M., Schneider, D. P., Trusel, L., Yin, Z., and Dunmire, D.: Evaluating the impact of enhanced horizontal resolution over the Antarctic domain using a variable-resolution Earth system model, The Cryosphere, 17, 3847–3866, https://doi.org/10.5194/tc-17-3847-2023, 2023. a, b
Fernandoy, F., Meyer, H., Oerter, H., Wilhelms, F., Graf, W., and Schwander, J.: Temporal and spatial variation of stable-isotope ratios and accumulation rates in the hinterland of Neumayer station, East Antarctica, J. Glaciol., 56, 673–687, https://doi.org/10.3189/002214310793146296, 2010. a
Fourteau, K., Martinerie, P., Faïn, X., Schaller, C. F., Tuckwell, R. J., Löwe, H., Arnaud, L., Magand, O., Thomas, E. R., Freitag, J., Mulvaney, R., Schneebeli, M., and Lipenkov, V. Ya.: Multi-tracer study of gas trapping in an East Antarctic ice core, The Cryosphere, 13, 3383–3403, https://doi.org/10.5194/tc-13-3383-2019, 2019. a
Gardner, A. S., Schlegel, N.-J., and Larour, E.: Glacier Energy and Mass Balance (GEMB): a model of firn processes for cryosphere research, Geosci. Model Dev., 16, 2277–2302, https://doi.org/10.5194/gmd-16-2277-2023, 2023. a
Gascon, G., Sharp, M., Burgess, D., Bezeau, P., and Bush, A. B.: Changes in accumulation-area firn stratigraphy and meltwater flow during a period of climate warming: Devon Ice Cap, Nunavut, Canada, J. Geophys. Res.-Earth, 118, 2380–2391, https://doi.org/10.1002/2013JF002838, 2013. a
Gilbert, E. and Kittel, C.: Surface melt and runoff on Antarctic ice shelves at 1.5 °C, 2 °C, and 4 °C of future warming, Geophys. Res. Lett., 48, e2020GL091733, https://doi.org/10.1029/2020GL091733, 2021. a, b, c
Gorte, T., Lenaerts, J. T. M., and Medley, B.: Scoring Antarctic surface mass balance in climate models to refine future projections, The Cryosphere, 14, 4719–4733, https://doi.org/10.5194/tc-14-4719-2020, 2020. a, b
Herron, M. M. and Langway, C. C.: Firn densification: an empirical model, J. Glaciol., 25, 373–385, 1980. a
Hersbach, H., Bell, B., Berrisford, P., Hirahara, S., Horányi, A., Muñoz-Sabater, J., Nicolas, J., Peubey, C., Radu, R., Schepers, D., Simmons, A., Soci, C., Abdalla, S., Abellan, X., Balsamo, G., Bechtold, P., Biavati, G., Bidlot, J., Bonavita, M., De Chiara, G., Dahlgren, P., Dee, D., Diamantakis, M., Dragani, R., Flemming, J., Forbes, R., Fuentes, M., Geer, A., Haimberger, L., Healy, S., Hogan, R. J., Hólm, E., Janisková, M., Keeley, S., Laloyaux, P., Lopez, P., Lupu, C., Radnoti, G., de Rosnay, P., Rozum, I., Vamborg, F., Villaume, S., and Thépaut, J.-N.: The ERA5 global reanalysis, Q. J. Roy. Meteor. Soc., 146, 1999–2049, https://doi.org/10.1002/qj.3803, 2020. a
Horlings, A. N., Christianson, K., Holschuh, N., Stevens, C. M., and Waddington, E. D.: Effect of horizontal divergence on estimates of firn-air content, J. Glaciol., 67, 287–296, https://doi.org/10.1017/jog.2020.105, 2021. a
Hubbard, B., Luckman, A., Ashmore, D. W., Bevan, S., Kulessa, B., Kuipers Munneke, P., Philippe, M., Jansen, D., Booth, A., Sevestre, H., Tison, J.-L., O’Leary, M., and Rutt, I.: Massive subsurface ice formed by refreezing of ice-shelf melt ponds, Nat. Commun., 7, 11897, https://doi.org/10.1038/ncomms11897, 2016. a
Jullien, N., Tedstone, A. J., Machguth, H., Karlsson, N. B., and Helm, V.: Greenland ice sheet ice slab expansion and thickening, Geophys. Res. Lett., 50, e2022GL100911, doi10.1029/2022GL100911, 2023. a
Keenan, E., Wever, N., Dattler, M., Lenaerts, J. T. M., Medley, B., Kuipers Munneke, P., and Reijmer, C.: Physics-based SNOWPACK model improves representation of near-surface Antarctic snow and firn density, The Cryosphere, 15, 1065–1085, https://doi.org/10.5194/tc-15-1065-2021, 2021. a
Kittel, C., Amory, C., Agosta, C., Jourdain, N. C., Hofer, S., Delhasse, A., Doutreloup, S., Huot, P.-V., Lang, C., Fichefet, T., and Fettweis, X.: Diverging future surface mass balance between the Antarctic ice shelves and grounded ice sheet, The Cryosphere, 15, 1215–1236, https://doi.org/10.5194/tc-15-1215-2021, 2021. a, b, c
Kuipers Munneke, P., Ligtenberg, S. R., Van Den Broeke, M. R., and Vaughan, D. G.: Firn air depletion as a precursor of Antarctic ice-shelf collapse, J. Glaciol., 60, 205–214, https://doi.org/10.3189/2014JoG13J183, 2014a. a, b, c
Kuipers Munneke, P., M. Ligtenberg, S., Van Den Broeke, M., Van Angelen, J., and Forster, R.: Explaining the presence of perennial liquid water bodies in the firn of the Greenland Ice Sheet, Geophys. Res. Lett., 41, 476–483, 2014b. a
Lai, C.-Y., Kingslake, J., Wearing, M. G., Chen, P.-H. C., Gentine, P., Li, H., Spergel, J. J., and van Wessem, J. M.: Vulnerability of Antarctica's ice shelves to meltwater-driven fracture, Nature, 584, 574–578, https://doi.org/10.1038/s41586-020-2627-8, 2020. a
Ligtenberg, S. R. M., Kuipers Munneke, P., and van den Broeke, M. R.: Present and future variations in Antarctic firn air content, The Cryosphere, 8, 1711–1723, https://doi.org/10.5194/tc-8-1711-2014, 2014. a, b, c
MacFerrin, M., Machguth, H., As, D. v., Charalampidis, C., Stevens, C. M., Heilig, A., Vandecrux, B., Langen, P. L., Mottram, R., Fettweis, X., van den Broeke, M. R., Pfeffer, W. T., Moussavi, M. S., and Abdalati, W.: Rapid expansion of Greenland's low-permeability ice slabs, Nature, 573, 403–407, https://doi.org/10.1038/s41586-019-1550-3, 2019. a, b, c, d, e
Machguth, H., MacFerrin, M., van As, D., Box, J. E., Charalampidis, C., Colgan, W., Fausto, R. S., Meijer, H. A., Mosley-Thompson, E., and van de Wal, R. S.: Greenland meltwater storage in firn limited by near-surface ice formation, Nat. Clim. Change, 6, 390–393, 2016. a
Medley, B., Neumann, T. A., Zwally, H. J., Smith, B. E., and Stevens, C. M.: Simulations of firn processes over the Greenland and Antarctic ice sheets: 1980–2021, The Cryosphere, 16, 3971–4011, https://doi.org/10.5194/tc-16-3971-2022, 2022. a, b
Montgomery, L., Koenig, L., and Alexander, P.: The SUMup dataset: compiled measurements of surface mass balance components over ice sheets and sea ice with analysis over Greenland, Earth Syst. Sci. Data, 10, 1959–1985, https://doi.org/10.5194/essd-10-1959-2018, 2018. a
Muto, A., Scambos, T. A., Steffen, K., Slater, A. G., and Clow, G. D.: Recent surface temperature trends in the interior of East Antarctica from borehole firn temperature measurements and geophysical inverse methods, Geophys. Res. Lett., 38, L15502, https://doi.org/10.1029/2011GL048086, 2011. a
Olmi, R., Bittelli, M., Picard, G., Arnaud, L., Mialon, A., and Priori, S.: Investigating the influence of the grain size and distribution on the macroscopic dielectric properties of Antarctic firn, Cold Reg. Sci. Technol., 185, 103254, https://doi.org/10.1016/j.coldregions.2021.103254, 2021. a
Oppenheimer, M., Glavovic, B., Hinkel, J., van de Wal, R., Magnan, A. K., Abd-Elgawad, A., Cai, R., Cifuentes-Jara, M., Deconto, R. M., Ghosh, T., Hay, J., Isla, F., Marzeion, B., Meyssignac, B., and Sebesvari, Z.: Sea level rise and implications for low lying islands, coasts and communities, The Intergovernmental Panel on Climate Change, 2019. a
Oraschewski, F. M. and Grinsted, A.: Modeling enhanced firn densification due to strain softening, The Cryosphere, 16, 2683–2700, https://doi.org/10.5194/tc-16-2683-2022, 2022. a
Orr, A., Kirchgaessner, A., King, J., Phillips, T., Gilbert, E., Elvidge, A., Weeks, M., Gadian, A., Kuipers Munneke, P., van den Broeke, M., Webster, S., and McGrath, D.: Comparison of kilometre and sub-kilometre scale simulations of a foehn wind event over the Larsen C Ice Shelf, Antarctic Peninsula using the Met Office Unified Model (MetUM), Q. J. Roy. Meteor. Soc., 147, 3472–3492, https://doi.org/10.1002/qj.4138, 2021. a
Pfeffer, W. T., Meier, M. F., and Illangasekare, T. H.: Retention of Greenland runoff by refreezing: implications for projected future sea level change, J. Geophys. Res.-Oceans, 96, 22117–22124, https://doi.org/10.1002/qj.4138, 1991. a
Rignot, E., Casassa, G., Gogineni, P., Krabill, W., Rivera, A., and Thomas, R.: Accelerated ice discharge from the Antarctic Peninsula following the collapse of Larsen B ice shelf, Geophys. Res. Lett. 31, L18401, https://doi.org/10.1029/2004GL020697, 2004. a
Rignot, E., Mouginot, J., Scheuchl, B., Van Den Broeke, M., Van Wessem, M. J., and Morlighem, M.: Four decades of Antarctic Ice Sheet mass balance from 1979–2017, P. Natl. Acad. Sci. USA, 116, 1095–1103, https://doi.org/10.1073/pnas.1812883116, 2019. a
Samimi, S., Marshall, S. J., and MacFerrin, M.: Meltwater penetration through temperate ice layers in the percolation zone at DYE-2, Greenland Ice Sheet, Geophys. Res. Lett. 47, e2020GL089211, https://doi.org/10.1029/2020GL089211, 2020. a, b
Samimi, S., Marshall, S. J., Vandecrux, B., and MacFerrin, M.: Time-domain reflectometry measurements and modeling of firn meltwater infiltration at DYE-2, Greenland, J. Geophys. Res.-Earth, 126, e2021JF006295, https://doi.org/10.1029/2021JF006295, 2021. a
Schwanck, F., Simões, J. C., Handley, M., Mayewski, P. A., Bernardo, R. T., and Aquino, F. E.: Drilling, processing and first results for Mount Johns ice core in West Antarctica Ice Sheet, Braz. J. Geol., 46, 29–40, https://doi.org/10.1590/2317-4889201620150035, 2016. a
Slater, T., Shepherd, A., McMillan, M., Muir, A., Gilbert, L., Hogg, A. E., Konrad, H., and Parrinello, T.: A new digital elevation model of Antarctica derived from CryoSat-2 altimetry, The Cryosphere, 12, 1551–1562, https://doi.org/10.5194/tc-12-1551-2018, 2018. a
Smith, B., Fricker, H. A., Gardner, A. S., Medley, B., Nilsson, J., Paolo, F. S., Holschuh, N., Adusumilli, S., Brunt, K., Csatho, B., Harbeck, K., Markus, T., Neumann, T., Siegfried, M. R., and Zwally, H. J.: Pervasive ice sheet mass loss reflects competing ocean and atmosphere processes, Science, 368, 1239–1242, 2020. a
The IMBIE team: Mass balance of the Antarctic Ice Sheet from 1992 to 2017, Nature, 558, 219–222, https://doi.org/10.1038/s41586-018-0179-y, 2018. a
Thompson-Munson, M., Wever, N., Stevens, C. M., Lenaerts, J. T. M., and Medley, B.: An evaluation of a physics-based firn model and a semi-empirical firn model across the Greenland Ice Sheet (1980–2020), The Cryosphere, 17, 2185–2209, https://doi.org/10.5194/tc-17-2185-2023, 2023. a
van Dalum, C. T., van de Berg, W. J., and van den Broeke, M. R.: Sensitivity of Antarctic surface climate to a new spectral snow albedo and radiative transfer scheme in RACMO2.3p3, The Cryosphere, 16, 1071–1089, https://doi.org/10.5194/tc-16-1071-2022, 2022. a, b
van den Broeke, M.: Depth and density of the Antarctic firn layer, Arct. Antarct. Alp. Res., 40, 432–438, https://doi.org/10.1657/1523-0430(07-021)[BROEKE]2.0.CO;2, 2008. a
van Wessem, J. M., van de Berg, W. J., Noël, B. P. Y., van Meijgaard, E., Amory, C., Birnbaum, G., Jakobs, C. L., Krüger, K., Lenaerts, J. T. M., Lhermitte, S., Ligtenberg, S. R. M., Medley, B., Reijmer, C. H., van Tricht, K., Trusel, L. D., van Ulft, L. H., Wouters, B., Wuite, J., and van den Broeke, M. R.: Modelling the climate and surface mass balance of polar ice sheets using RACMO2 – Part 2: Antarctica (1979–2016), The Cryosphere, 12, 1479–1498, https://doi.org/10.5194/tc-12-1479-2018, 2018. a
van Wessem, J. M., Steger, C. R., Wever, N., and van den Broeke, M. R.: An exploratory modelling study of perennial firn aquifers in the Antarctic Peninsula for the period 1979–2016, The Cryosphere, 15, 695–714, https://doi.org/10.5194/tc-15-695-2021, 2021. a
van Wessem, J. M., van den Broeke, M. R., Wouters, B., and Lhermitte, S.: Variable temperature thresholds of melt pond formation on Antarctic ice shelves, Nat. Clim. Change, 13, 161–166, https://doi.org/10.1038/s41558-022-01577-1, 2023. a, b, c, d, e, f, g, h
Vandecrux, B., MacFerrin, M., Machguth, H., Colgan, W. T., van As, D., Heilig, A., Stevens, C. M., Charalampidis, C., Fausto, R. S., Morris, E. M., Mosley-Thompson, E., Koenig, L., Montgomery, L. N., Miège, C., Simonsen, S. B., Ingeman-Nielsen, T., and Box, J. E.: Firn data compilation reveals widespread decrease of firn air content in western Greenland, The Cryosphere, 13, 845–859, https://doi.org/10.5194/tc-13-845-2019, 2019. a
Vandecrux, B., Fausto, R., Van As, D., Colgan, W., Langen, P., Haubner, K., Ingeman-Nielsen, T., Heilig, A., Stevens, C., Macferrin, M., Niwano, M., Steffen, K., and Box, J. E.: Firn cold content evolution at nine sites on the Greenland ice sheet between 1998 and 2017, J. Glaciol., 66, 591–602, https://doi.org/10.1017/jog.2020.30, 2020. a
Veldhuijsen, S. B. M., van de Berg, W. J., Brils, M., Kuipers Munneke, P., and van den Broeke, M. R.: Characteristics of the 1979–2020 Antarctic firn layer simulated with IMAU-FDM v1.2A, The Cryosphere, 17, 1675–1696, https://doi.org/10.5194/tc-17-1675-2023, 2023a. a, b, c, d, e, f, g, h, i
Veldhuijsen, S., van de Berg, W. J., Kuipers Munneke, P., and van den Broeke, M. R.: IMAU-FDM v12AD TC release, Zenodo [code], https://doi.org/10.5281/zenodo.10723570, 2023b. a
Veldhuijsen, S., van de Berg, W. J., Kuipers Munneke, P., and van den Broeke, M. R.: IMAU-FDMv1.2AD total FAC and accessible FAC (1950–2100), Zenodo [data set], https://doi.org/10.5281/zenodo.8381267, 2023c. a
Verjans, V., Leeson, A. A., Stevens, C. M., MacFerrin, M., Noël, B., and van den Broeke, M. R.: Development of physically based liquid water schemes for Greenland firn-densification models, The Cryosphere, 13, 1819–1842, https://doi.org/10.5194/tc-13-1819-2019, 2019. a, b
Vignon, É., Roussel, M.-L., Gorodetskaya, I., Genthon, C., and Berne, A.: Present and future of rainfall in Antarctica, Geophys. Res. Lett., 48, e2020GL092281, https://doi.org/10.1029/2020GL092281, 2021. a
Winstrup, M., Vallelonga, P., Kjær, H. A., Fudge, T. J., Lee, J. E., Riis, M. H., Edwards, R., Bertler, N. A. N., Blunier, T., Brook, E. J., Buizert, C., Ciobanu, G., Conway, H., Dahl-Jensen, D., Ellis, A., Emanuelsson, B. D., Hindmarsh, R. C. A., Keller, E. D., Kurbatov, A. V., Mayewski, P. A., Neff, P. D., Pyne, R. L., Simonsen, M. F., Svensson, A., Tuohy, A., Waddington, E. D., and Wheatley, S.: A 2700-year annual timescale and accumulation history for an ice core from Roosevelt Island, West Antarctica, Clim. Past, 15, 751–779, https://doi.org/10.5194/cp-15-751-2019, 2019. a
Yi, D., Zwally, H. J., and Sun, X.: ICESat measurement of Greenland ice sheet surface slope and roughness, Ann. Glaciol., 42, 83–89, https://doi.org/10.3189/172756405781812691, 2005. a