the Creative Commons Attribution 4.0 License.
the Creative Commons Attribution 4.0 License.
 | 11 Oct 2022
Assessing bare-ice albedo simulated by MAR over the Greenland ice sheet (2000–2021) and implications for meltwater production estimates
Marco Tedesco
Xavier Fettweis
Patrick Alexander
Willem Jan van de Berg
Surface mass loss from the Greenland ice sheet (GrIS) has accelerated over the past decades, mainly due to enhanced surface melting and liquid water runoff in response to atmospheric warming. A large portion of runoff from the GrIS originates from exposure of the darker bare ice in the ablation zone when the overlying snow melts, where surface albedo plays a critical role in modulating the energy available for melting. In this regard, it is imperative to understand the processes governing albedo variability to accurately project future mass loss from the GrIS. Bare-ice albedo is spatially and temporally variable and contingent on non-linear feedbacks and the presence of light-absorbing constituents. An assessment of models aiming at simulating albedo variability and associated impacts on meltwater production is crucial for improving our understanding of the processes governing these feedbacks and, in turn, surface mass loss from Greenland. Here, we report the results of a comparison of the bare-ice extent and albedo simulated by the regional climate model Modèle Atmosphérique Régional (MAR) with satellite imagery from the Moderate Resolution Imaging Spectroradiometer (MODIS) for the GrIS below 70∘ N. Our findings suggest that MAR overestimates bare-ice albedo by 22.8 % on average in this area during the 2000–2021 period with respect to the estimates obtained from MODIS. Using an energy balance model to parameterize meltwater production, we find this bare-ice albedo bias can lead to an underestimation of total meltwater production from the bare-ice zone below 70∘ N of 42.8 % during the summers of 2000–2021.
- Article
(5745 KB) - Full-text XML
- BibTeX
- EndNote


Global mean sea level (GMSL) rise has significantly accelerated over the past decades (Chen et al., 2017), in part as a consequence of the acceleration in Greenland ice mass loss (Aschwanden et al., 2019). Ice mass loss from the Greenland ice sheet (GrIS) was one of the largest contributors to GMSL rise in the period 1901–2018 with 17 %–32 % and will likely remain so by the end of this century (Fox-Kemper et al., 2021). According to Fox-Kemper et al. (2021), the GrIS' contribution to GMSL will constitute ∼ 17 % by 2100 for the Shared Socioeconomic Pathway SSP5-8.5 (Riahi et al., 2017). From this point of view, it is imperative to improve model representation of physical processes responsible for ice mass loss to better constrain projections of the future contribution of the GrIS. In this regard, evaluation of climate model outputs vs. observational data can provide insight into the model's ability to represent the physical processes at play and can subsequently highlight regions for model improvement (van den Broeke et al., 2017).
The total mass loss from Greenland can be separated into surface losses (e.g., runoff) and frontal losses at the terminus of outlet glaciers (e.g., calving). For the 2000–2018 period, 55 % of Greenland's mass loss originated from surface mass balance (SMB; the balance between accumulation and ablation at the ice sheet surface), and 45 % was from ice discharge from outlet glaciers (Mouginot et al., 2019). The SMB losses from the GrIS have been increasing since the late 1990s, driven primarily by an increase in melt and subsequent liquid water runoff in response to recent atmospheric warming (van den Broeke et al., 2017). An increase in summer surface air temperatures of ∼ +2 ∘C has also been observed over Greenland since the early 1990s (Hanna et al., 2012; Box, 2013). This has increased runoff by 40 %, while the contribution of changes in precipitation, sublimation, and erosion since the early 1990s are not as substantial (van den Broeke et al., 2016, 2017). The recent increase in observed runoff has also been suggested to be linked to changes in atmospheric circulations around Greenland (Hanna et al., 2014; Tedesco and Fettweis, 2020). Hanna et al. (2018) and McLeod and Mote (2016) suggest that a significant increase in high summer pressure blocking over Greenland (Greenland Blocking Index) since the 1990s has been a major driver of the recent increase in surface melt over the GrIS (Fettweis et al., 2013; Tedesco et al., 2016a). Changes in atmospheric circulation promoting enhanced runoff have been characterized by increased shortwave incoming solar radiation (Tedesco and Fettweis, 2020). This, in turn, can increase the absorbed solar radiation, depending on surface albedo, which can be summarized as the ratio of the energy reflected off a unit area of material over the energy incident over that area.
Besides temperature, albedo also strongly controls surface melting and runoff over the GrIS. More specifically, broadband albedo refers to the wavelength-dependent albedo integrated over the full spectral range, weighted by the contribution of each wavelength. In the case of solar radiation, most of the contribution to broadband albedo comes from the visible wavelengths (300–700 nm), since most of the solar energy is concentrated within this band (Liang and Wang, 2020). Albedo is one of the key players in the energy balance for the bare ice of the GrIS, which is exposed when the overlying seasonal snow melts. Snow is characterized by a high albedo of ∼ 0.7–0.85 (Alexander et al., 2014), while bare ice is compacted, densified, and aged snow (Wiscombe and Warren, 1980) and is characterized by a low albedo of 0.31–0.57 (Wehrlé et al., 2021). Bare ice thus absorbs more solar radiation than snow, increasing the energy available for melting. Even though the bare-ice zone encompasses only a small fraction (12 ± 2 %) of the GrIS in summer along the margins of the ice sheet (Ryan et al., 2019), the bare-ice zone was responsible for 78 % of the runoff from the GrIS in the period 1960–2014 (Steger et al., 2017). Since bare-ice albedo strongly controls the amount of runoff from the bare-ice zone, it is of key importance in controlling GrIS-wide runoff (Tedesco et al., 2008; van Angelen et al., 2012; Alexander et al., 2019).
Bare-ice albedo is spatiotemporally variable at different scales in response to non-linear positive feedbacks between absorbed shortwave radiation and surface melt (Box et al., 2012; Ryan et al., 2019). Therefore, meltwater production depends not only on timing and persistence of bare-ice exposure but also on other modulating factors, such as snowfall, which can cover bare ice with a bright, highly reflective layer of fresh snow. The appearance of bare ice reduces the overall GrIS albedo, leading to more melting from the bare-ice zone as well as feeding a positive feedback mechanism which ultimately leads to an acceleration of surface melting (Tedesco et al., 2011).
Bare-ice exposure is often associated with the presence of light-absorbing constituents (LACs) on the ice, such as dust, black carbon, and organic material (Tedstone et al., 2017). These LACs can reduce surface albedo to as low as ∼ 0.1 (Wientjes et al., 2012; Tedstone et al., 2017, 2020) and can subsequently increase melting. Dark bands appear in the bare ice as a consequence of outcropping of ice layers mixed with dust that were deposited in the accumulation zone during the late Pleistocene and Holocene and, later, transported to the lower ablation zone through ice flow (MacGregor et al., 2020). Black carbon and cryoconite, small cylindrical holes (of a few centimeters to a few meters) in the ice surface containing impurities, have also been found to reduce the albedo of bare ice (Cook et al., 2016; Goelles and Bøggild, 2017). Wang et al. (2018) and Stibal et al. (2017) found an abundant presence of supraglacial ice algal blooms in the bare-ice zone in the southwestern GrIS, with a direct link between mineral phosphorus in the ice surface and glacier ice algae biomass (McCutcheon et al., 2021). These light-absorbing constituents reduce the bare-ice albedo, further enhancing meltwater production and runoff (Tedesco et al., 2016b; Williamson et al., 2018, 2020; Cook et al., 2020). The difficulty in representing bare-ice albedo in climate models partly originates from a lack of understanding of LACs and may result in a reduced accuracy of runoff projections (Alexander et al., 2014).
In this study, we evaluate the performance of the Modèle Atmosphérique Régional (MAR), a regional climate model especially developed for simulating polar climates (Fettweis et al., 2020), in simulating bare-ice extent, bare-ice albedo, and meltwater production by comparing MAR's model output with satellite imagery from the Moderate Resolution Imaging Spectroradiometer (MODIS). This study complements the study by Alexander et al. (2014), who focused on the GrIS-wide albedo. Here, we specifically focus on the bare-ice zone below 70∘ N, which is currently responsible for the majority of meltwater production from the GrIS (Steger et al., 2017). We evaluate MAR on a range of spatial resolutions during June, July, and August in 2000–2021. We use an energy balance model to parameterize the meltwater production and to analyze the effect of a bias in observed and modeled bare-ice albedo on estimates of meltwater production.
2.1 The MAR RCM
In this study, we use the Modèle Atmosphérique Régional (MAR) version 3.12 regional climate model (RCM), which simulates the coupled surface–atmosphere system over the Greenland region (Gallée, 1997; Ridder and Schayes, 1997; Lefebre, 2003; Fettweis et al., 2017) and is forced by reanalysis data or climate model output. Specifically, we force MAR at the lateral boundaries and ocean surface with 6-hourly reanalysis output from ERA5 (Hersbach et al., 2020), produced by the European Centre for Medium-Range Weather Forecasts (ECMWF). MARv3.5.2 is discussed and validated over the GrIS (Fettweis et al., 2017), with updates to MARv3.11 discussed in Fettweis et al. (2021). We point out that in the version we use in this study, the geographical projection has been changed to the standard polar-stereographic EPSG:3413 system from a previously used custom projection. An issue within the code impacting the snow temperature at the base of the snowpack has also been corrected in MARv3.12, and it now includes a continuous conversion from rainfall to snowfall from 0 to −2 ∘C as input for the snow model instead of a fixed value of −1 ∘C (Xavier Fettweis, personal communication, 2021). The atmospheric component of the model is described by Gallée and Schayes (1994), and the Soil Ice Snow Vegetation Atmosphere Transfer (SISVAT) scheme is used as the surface component of the model (Ridder and Schayes, 1997). The surface model incorporates the snow model Crocus (Brun et al., 1992), which simulates a set number of layers of snow, ice, or firn with variable thickness and transports energy and mass between each layer. The Crocus model also provides snow grain properties, which are used to simulate snow albedo. In this study, we run the MAR model over Greenland and produce daily output of variables pertaining to the atmosphere and ice sheet surface in this region at horizontal spatial resolutions of 6.5, 10, 15, and 20 km.
2.2 MODIS data
We obtained MOD09GA Version 6 (Vermote and Wolfe, 2015) surface reflectance images over the GrIS from the Moderate Resolution Imaging Spectroradiometer (MODIS) on board NASA's Terra satellite through Google Earth Engine (Gorelick et al., 2017). We use daily summer (June, July, and August; JJA) images over the period 2000–2021 with a horizontal spatial resolution of 500 m. Corrections have been applied to this product for atmospheric conditions such as aerosols, gases, and Rayleigh scattering (Vermote and Wolfe, 2015). We also collected daily snow cover images from MOD10A1 Version 6 from Google Earth Engine over the same period. This product includes a daily cloud mask which we use in this study to flag clouds in the MOD09GA images. The MOD10A1 product also contains daily broadband albedo values (Hall et al., 2016), though albedo values above a latitude of 70∘ N may be positively biased due to viewing geometry and large solar zenith angle (Alexander et al., 2014). Consequently, we omit MOD10A1 albedo data above 70∘ N from our albedo and meltwater production analysis. Note that we do include MOD09GA surface reflectance data above 70∘ N in our bare-ice extent analysis. We choose the summer 2000–2021 study period to accommodate the observation period of MODIS and to account for the seasonal variability of bare-ice exposure on the GrIS, when surface albedo has the largest impact on SMB (Alexander et al., 2014). To allow for a daily pixel-by-pixel comparison, we first use GDAL (Geospatial Data Abstraction Library; GDAL/OGR contributors, 2020) to reproject the daily MODIS data (MOD09GA and MOD10A1) to the MAR's native projection and simultaneously rescale it to the resolution of each of the MAR products.
2.3 Bare-ice extent
Bare ice is exposed when the snow blanketing it is removed through surface melting. Most of the areas where bare ice occurs are located in the ablation zone, where ablation is larger than accumulation and the SMB is negative. At the transition between the ablation and accumulation zones lies the equilibrium line altitude (ELA), denoting the elevation where ablation is equal to accumulation and the SMB is 0 (Noël et al., 2019). In order to study the behavior of bare-ice exposure, we determine a long-term average ELA from the daily MAR outputs of SMB over the GrIS. We estimate the average ELA at 1679 m a.s.l. for the period 2000–2021 over the entire ice sheet as the 95th percentile value of the elevation values in the ablation zone. Taking the 95th percentile of the long-term average values supports the omission of sporadically high ablation cell detections and provides a conservative estimate of the ELA. We note that this method may provide a conservative estimate of the bare-ice extent during warm, high-melt years, as the ELA in such years may lie at a higher elevation than the long-term average ELA. Then, we constrain bare ice as modeled by MAR to cells below the long-term average ELA. This is a first simplified estimate of the bare-ice extent, which is further refined by the following two conditions: (1) snow is absent (i.e., snow depth is 0 m), and (2) the average density in the top 1 m exceeds 907 kg m−3. A thin layer of fresh snow (300 kg m−3 in MAR) could cover the ice (920 kg m−3 in MAR) following a brief snowfall event. Solar radiation will not attenuate much in a thin layer of snow and will thus not significantly affect absorption into the underlying ice (Warren et al., 2006). A thin layer of fresh snow will lower the density of the top layer, however. Therefore, setting a lower limit of 907 kg m−3 for the average density of the top 1 m allows for 2 cm of fresh snow to cover the ice while also allowing for the cell to still be detected as bare ice and not as snow. Taking the average density also ensures that ice lenses are not detected as bare ice. We use the static ice mask and digital elevation model (DEM) of the GrIS as described by the Greenland Ice Mapping Project (GIMP) to select areas where the ice sheet is present (vs. where land is present) and to produce the satellite-derived extent and elevation of the GrIS (Howat et al., 2014).
We note that the static GIMP ice mask and DEM are constructed from Landsat 7 and RADARSAT-1 imagery acquired between 1999 and 2002, which only overlaps for 3 out of the 22 years of the study period in this study. However, the impact on the estimated bare-ice extent should be small given estimates for ice margin retreat rates and thinning rates (Helm et al., 2014; Lesnek et al., 2020; Young et al., 2021). We therefore believe that the static GIMP ice mask suffices for the purposes of this study.
We extract the satellite-derived bare-ice extent (BIE) on the GrIS by applying an upper threshold of 0.6 to band 2 (841–876 nm) in the MOD09GA product (Shimada et al., 2016). Following the same study, we define pixels with reflectance values above 0.6 in band 2 as snow. We define the annual maximum BIE as the area covered by those pixels that are detected as bare ice for a minimum of 10 % of the observed days in JJA in a single year. The aim of this is to provide a conservative estimate of bare-ice extent while ensuring omission of sporadic and erroneous bare-ice detections by MODIS, such as superimposed ice and meltwater lakes and streams. We define a lower estimate of the MODIS-derived annual maximum BIE as the area covered by the pixels below the long-term average ELA that are detected as bare ice for a minimum of 10 % of the observed days in JJA. We also define an upper estimate of the annual maximum BIE, which includes (1) the area found for the lower estimate and (2) the area covered by the pixels that are flagged as clouds in MOD10A1 for a minimum of 90 % of the observed days in JJA. For pixels that are covered by clouds for more than 90 % of the observed days in JJA, the view of the surface of the GrIS is obstructed to such an extended degree that bare ice cannot be detected for more than 10 % of the observed days in JJA. This automatically excludes them as a possible bare-ice pixel, leading to potentially missed bare-ice area.
We use forecast verification to quantify MAR's ability to simulate bare ice vs. snow. We assess MAR's forecast quality by examining the statistical characteristics of the dichotomous categorical forecasts of bare ice (true) vs. snow (false) as compared with observations from MODIS. The forecast and observation counts of both bare ice and of snow are listed in a contingency table. To assess MAR's performance in simulating bare ice, we use the frequency bias index. This statistic indicates a perfect forecaster with a score of 1, an underforecaster with a score lower than 1, and an overforecaster with a score higher than 1 (Wilks, 2011).
2.4 Bare-ice albedo
We evaluate the performance of MAR in simulating bare-ice albedo by comparing MAR's modeled albedo values with the albedo values observed by MODIS on the overlapping BIE. The output from MAR contains daily albedo values over the entire GrIS. The bare-ice albedo scheme in MARv2 originally consisted of simply assigning a fixed value of 0.55 to bare-ice albedo. Nevertheless, the improved MARv3 we use in this study simulates bare-ice albedo as a function of accumulated surface water height and slope of the ice sheet, following an exponential relation between pure bare-ice albedo and water albedo (Alexander et al., 2014). MAR includes lower and upper boundaries for the bare-ice albedo of 0.5 and 0.55. However, every year, large areas with albedo values lower than 0.5 are observed by MODIS and by some Programme for Monitoring of the Greenland Ice Sheet (PROMICE) automatic weather stations (AWSs; Tedesco et al., 2016b). An analysis by Wehrlé et al. (2021) shows that the average albedo from the 20 stations included in the study is lower than 0.5 for more than a month during the melt season. Therefore, values for the surface albedo below 0.5 can be considered a common event across the bare-ice zone. Such low albedo values in part result from the presence of LACs on the bare ice, which are not taken into consideration in the MARv3 bare-ice albedo scheme. Low albedo values can also arise from accumulated meltwater on the surface of the ice in the form of streams and lakes, but the relative effect of meltwater has been estimated to be smaller than that of impurities (Ryan et al., 2018).
2.5 Meltwater production
We use an energy balance model to parameterize the energy available for meltwater production over the bare-ice zone and to isolate the effect of albedo on meltwater production estimates from the bare-ice zone below 70∘ N. Following Pellicciotti et al. (2008), we parameterize the energy available for meltwater production as
with daily values for meltwater production (ME), albedo (α), downward shortwave radiation (SWdown), net longwave radiation (LWnet), and sensible and latent heat fluxes (SHF and LHF) simulated by MAR. The numerator on the right-hand side is equal to the energy available for melt. Dividing by density (ρw=1000 kg m−3) and the latent heat of fusion of water ( J kg−1) gives the potential meltwater production (mm w.e. d−1). For this purpose, we use the MAR outputs generated at a horizontal spatial resolution of 6.5 km. We determine the parameters a, b, c, and d by finding the minimum of this unconstrained multivariable function on a daily basis. Figure 1 shows the linear regression between the parameterized meltwater production and the meltwater production simulated by MAR, with an R2 of 0.92, mean bias of −0.728 mm w.e. d−1, and root mean square error of 3.97 mm w.e. d−1. As seen in Fig. 1 and from the negative mean bias, the parameterization tends to underestimate meltwater production slightly relative to the meltwater simulated by MAR. This could be due to the fact that MAR calculates meltwater production every minute and the parameterization calculates melt only once per day since it uses daily MAR output. Moreover, the feedbacks between air and surface processes are not captured in the parametrization scheme. Lastly, days with melt occurring only during a part of the day occur at the beginning and end of the melt season with the parameters (a, b, c, and d) not being able to fully account for this variation. The fractional contribution to meltwater production of each constituent in Eq. (1) is calculated by multiplying each parameter with the respective net energy flux and dividing by the total meltwater production on a daily basis.
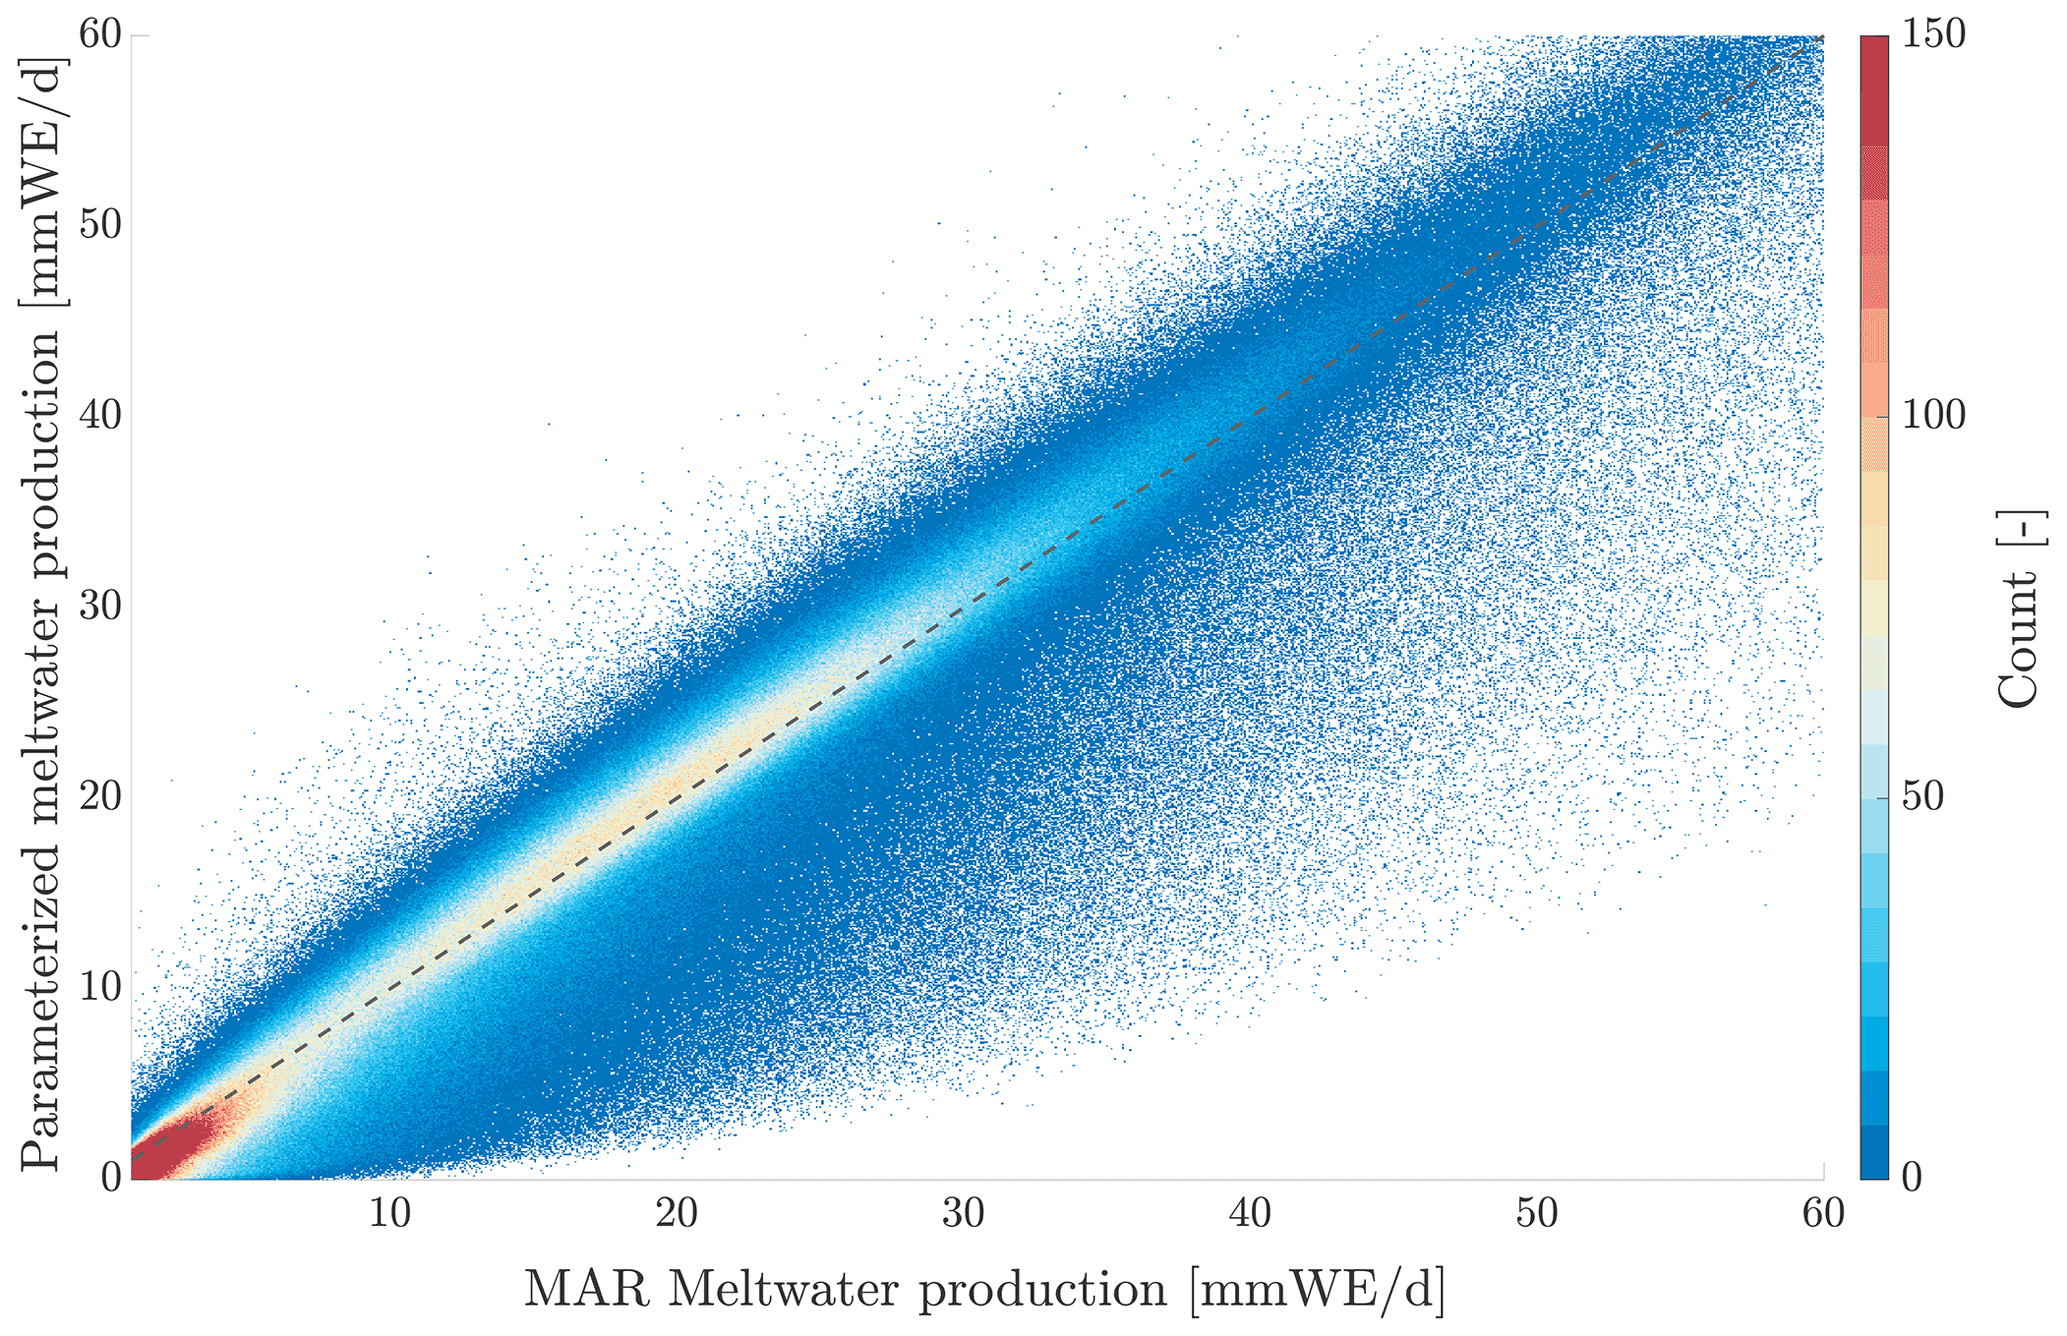
Figure 1Linear regression of daily meltwater production simulated by MAR and parameterized meltwater production using modeled albedo.
We calculate daily meltwater production estimates with the meltwater production parameterization twice, using the same values for the coefficients, once using the albedo modeled by MAR and once using the albedo observed by MODIS. The goal of this is to isolate the effect of bare-ice albedo on meltwater production. As a reminder, we exclude cells above a latitude of 70∘ N to account for the potentially reduced accuracy of albedo values in the MOD10A1 product in this region. In order to increase the fairness of the comparison we include only those areas and days where we simultaneously detect bare ice with both MAR and MODIS. Since we are interested in the effect of bare-ice albedo on meltwater production, we only include cells that are melting as prescribed by MAR (>1 mm w.e. d−1). This ensures that any absorbed energy fluxes predominantly go into the enthalpy of fusion of ice, i.e., leading to melt, and not into changing the temperature of the ice.
3.1 Bare-ice extent
The average number of days when bare ice is exposed during June, July, and August (JJA) for our study period (2000–2021) obtained from MODIS (Fig. 2a) and MAR (Fig. 2b) and their difference (Fig. 2c) are shown in Fig. 2. The number of bare-ice days observed by MODIS show slightly more inland variation, especially in the northern regions of the ice sheet. For instance, a large round feature in the northeast reveals that bare ice is exposed for up to 12 d on average during JJA. The geothermal heat flux map of Greenland created by Martos et al. (2018) shows a round feature of similar size in the same area with an enhanced heat flux. Increased heat flux from the bedrock to the ice sheet surface could lead to higher ice sheet surface temperatures, which enhances bare-ice exposure. This pattern is not captured by the MAR simulations.
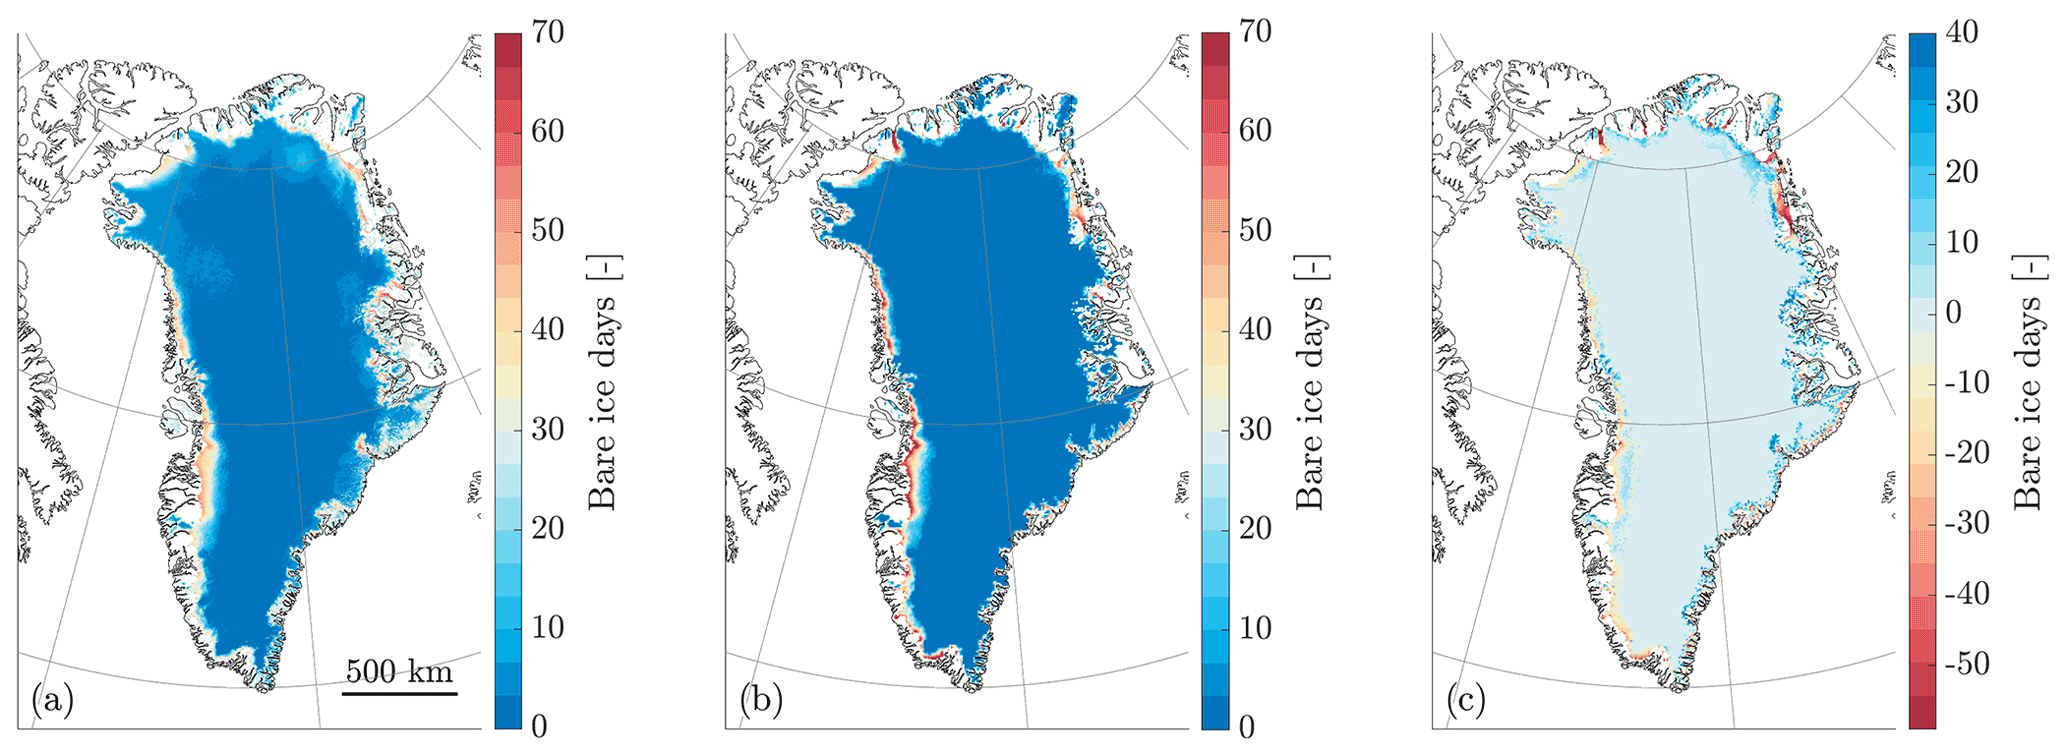
Figure 2Number of days bare ice is exposed in JJA, averaged over 2000–2021: (a) observed by MODIS at 500 m, (b) modeled by MAR at 6.5 km, and (c) their difference (MODIS minus MAR) at 6.5 km.
The inter-annual variability of the maximum extent of the bare-ice zone on the GrIS we obtained from the remote sensing and modeled data for the 2000–2021 study period is reported in Fig. 3a. The modeled results (lines of different shades of blue, depending on the horizontal spatial resolution) show that MAR agrees well with the general trend of the inter-annual variation in maximum bare-ice extent estimated by MODIS. We find R2 values of 0.72, 0.70, 0.65, and 0.65 between the lower MODIS estimate and MAR at 6.5, 10, 15, and 20 km, respectively. In this regard, the MAR output produced at the highest horizontal spatial resolutions (6.5 and 10 km) fit best with the observed inter-annual BIE.

Figure 3(a) Annual maximum bare-ice extent in 2000–2021, averaged over JJA, and (b) seasonal bare-ice extent in JJA, averaged over 2000–2021.
Years with a high maximum BIE, such as 2012 and 2019, correspond to known high-melt years (Tedesco and Fettweis, 2020). This is as expected since warmer temperatures or positive energy balance anomalies lead to more snowmelt, exposing the underlying bare ice. Additionally, exposed bare ice leads to increased absorption of solar radiation, generating higher melt rates (Ryan et al., 2019). In these high-BIE years MAR overestimates the BIE relative to the observations. This indicates that MAR potentially overestimates the amount of snow that is melted away in these years and exposes more bare ice than is actually the case. Some snowfall events may also have been missed by MAR, which would have otherwise reduced the BIE by temporarily covering the ice with a thin layer of fresh snow. Conversely, in years with a low maximum BIE, such as 2006 and 2018, MAR generally underestimates the BIE, suggesting that MAR underestimates the amount of snow that is melted away in these years. Because MAR under- and overestimates snowmelt in colder and warmer years, respectively, this suggests that MAR could be too sensitive to temperature. The BIE shows a positive trend during the study period for both MODIS (1486 km2 yr−1) and MAR (2303, 2082, 1951, and 2409 km2 yr−1 at 6.5, 10, 15, and 20 km, respectively). The significantly lower value for the average observed BIE stems from the inclusion of 2021 data, where estimates between observations and the model differ vastly. This difference is potentially caused in part by an anomalously high amount of clouds over the bare-ice zone in mid-August of 2021, obstructing view of potential BIE, which MAR models as bare ice. Excluding the 2021 MODIS data provides a trend of 2272 km2 yr−1, which is more similar to the trend simulated by MAR.
The observed and modeled seasonal BIE exhibit a peak from mid-July through mid-August (Fig. 3b). The resolutions we use in MAR have minimal effect on the timing and magnitude of the BIE. The initial modeled BIE is slightly lower than the observed BIE, indicating that the 0.6 threshold for band 2 in MOD09GA could be too high or that the onset of bare ice is delayed in MAR relative to the observed onset. The lower initial modeled BIE may also suggest that MAR misses uncovering of ice by snowdrift which would blow snow into crevasses and holes. In early July, the modeled BIE quickly surpasses the minimum observed estimate. The late-July dip in modeled BIE is in part due to snowfall events over the BIE as simulated by MAR.
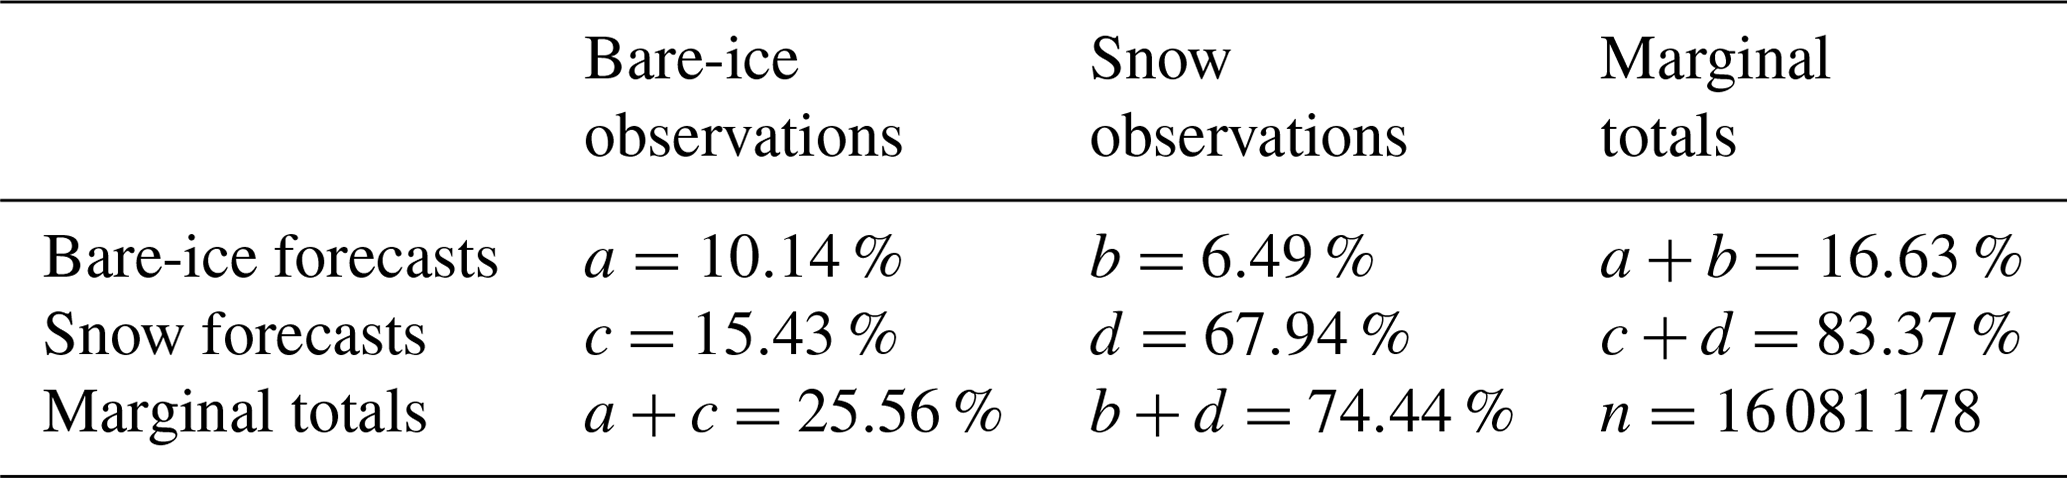
Table 1 shows the contingency table of the dichotomous categorical forecasts (MAR) and observations (MODIS) of bare ice vs. snow. MAR has a frequency bias index of 0.651, showing that, when bare ice is observed by MODIS, MAR simulates bare ice on the same pixel 65.1 % of the time. In other words, MAR underforecasts bare-ice exposure (Wilks, 2011).
Table 1Contingency table of forecasts (MAR) and observations (MODIS) in terms of determining either bare ice or snow. Bare ice both forecast and observed is a hit (a), bare ice forecast but snow observed is a false alarm (b), snow forecast but bare ice observed is a miss (c), and snow both forecast and observed is a correct rejection (d). Results are shown as a percentage of the total number of observations (n).
3.2 Bare-ice albedo
The average observed bare-ice albedo over 2000–2021 exhibits high spatial variability (Fig. 4a), with large sections of low albedo values (<0.4) in the southern region of the GrIS, especially over the dark-ice zone in the southwest. The low albedo values in the dark-ice zone suggest the presence of abundant LACs, such as black carbon, mineral dust, volcanic ash, cryoconite, and ice algal blooms (Tedstone et al., 2017). We observe little to no variability in average bare-ice albedo for MAR (Fig. 4b). This is expected from the bare-ice albedo scheme in MAR since it does not account for any form of LACs. Albedo values higher than expected for bare ice are detected by MODIS in the northern section of the ice sheet. This is an artifact of the positively biased MOD10A1 product above latitudes of 70∘ N (Alexander et al., 2014). The difference in bare-ice albedo values between MODIS and MAR (Fig. 4c) indicates that the dark-ice zone albedo is highly overestimated by MAR, as compared to MODIS.

Figure 4Maps of bare-ice albedo over maximum bare-ice extent averaged over JJA in 2000–2021 at 6.5 km: (a) observed by MODIS, (b) modeled by MAR, and (c) their difference (MODIS minus MAR). The dashed line denotes 70∘ N.
The annual average observed albedo over the overlapping bare-ice extent below 70∘ N shows significant variability throughout the study period for all resolutions, with little to no variability between MAR resolutions (Fig. 5a). The variability in annual average modeled bare-ice albedo is negligible and remains almost constant at around 0.55, on average 0.12 (or 27.5 %) higher than the average of 0.43 observed by MODIS. The observed bare-ice albedo shows an average trend of −0.015 ± 0.0025 per decade. We have given each resolution equal weight in the calculations of the means and trends.

Figure 5(a) Annual bare-ice albedo in 2000–2021, averaged over JJA, and (b) seasonal bare-ice albedo in JJA, averaged over 2000–2021.
The seasonal average observed bare-ice albedo below 70∘ N exhibits significant changes throughout the JJA season (Fig. 5b). The observed albedo (at 15 and 20 km resolution) in June shows high variability, which is a result of the minimal bare-ice extent on the GrIS in this period and the even smaller bare-ice extent overlapping between the model and observations. Hence, for the first ∼ 20 d of June only a small number of cells are available (less than 10 cells d−1) from which to determine the average bare-ice albedo, making anomalous values weigh more heavily in the average. The observed albedo declines rapidly in June and reaches a sustained minimum of ∼ 0.41 from early July until early August. Throughout the season, MAR overestimates bare-ice albedo relative to the observations fairly constantly at ∼ 0.55. The difference between observed and modeled albedo originates in part from the missing representation of LACs in the bare-ice albedo scheme in MAR (Fettweis et al., 2017). The dipping trend in observed albedo suggests an increase in spatial distribution or intensification of LAC concentrations. Algal blooms flourish and multiply (Wang et al., 2018, 2020). Holocene dust and black carbon are exposed through melting deeper and older ice layers. Holocene dust and black carbon are continuously being outcropped through melting of deeper and older ice layers and can accumulate on the surface of the ice (Doherty et al., 2013). Significant aeolian depositions of black carbon have also been observed (Goelles and Bøggild, 2017). Volcanic ash will play only a minor role in lowering the albedo, as it is distributed only in short time intervals during volcanic eruptions. Despite its dark surface, cryoconite has been shown to play a minor role in lowering albedo due to its sparse spatial distribution (Ryan et al., 2018). A part of the seasonal decrease in bare-ice albedo also arises from accumulated surface meltwater on the bare ice, which may be misrepresented in MAR.
3.3 Meltwater production
Figure 6a and b show annual and seasonal averages, respectively, of the fractional contributions of each of the constituents in the meltwater production parameterization, where we use albedo values from MODIS in the shortwave radiation term. The shortwave radiation term is consistently the largest term contributing to meltwater production owing to the low albedo of bare ice and the long days during boreal summer. Shortwave radiation contributes on average 5–5.5 times more to meltwater production than sensible heat flux, the second largest contributor. Longwave radiation contributes to a net loss of heat in general during the study period, releasing more energy from the surface of the ice than it absorbs. This leads to a net negative contribution to meltwater production. Sensible heat flux contributes a small but rather constant fraction to meltwater production. The contribution of latent heat flux to meltwater production is very small and often negative (−0.11–0.02), meaning that the latent heat flux on average results more in evaporation and sublimation than condensation and deposition.
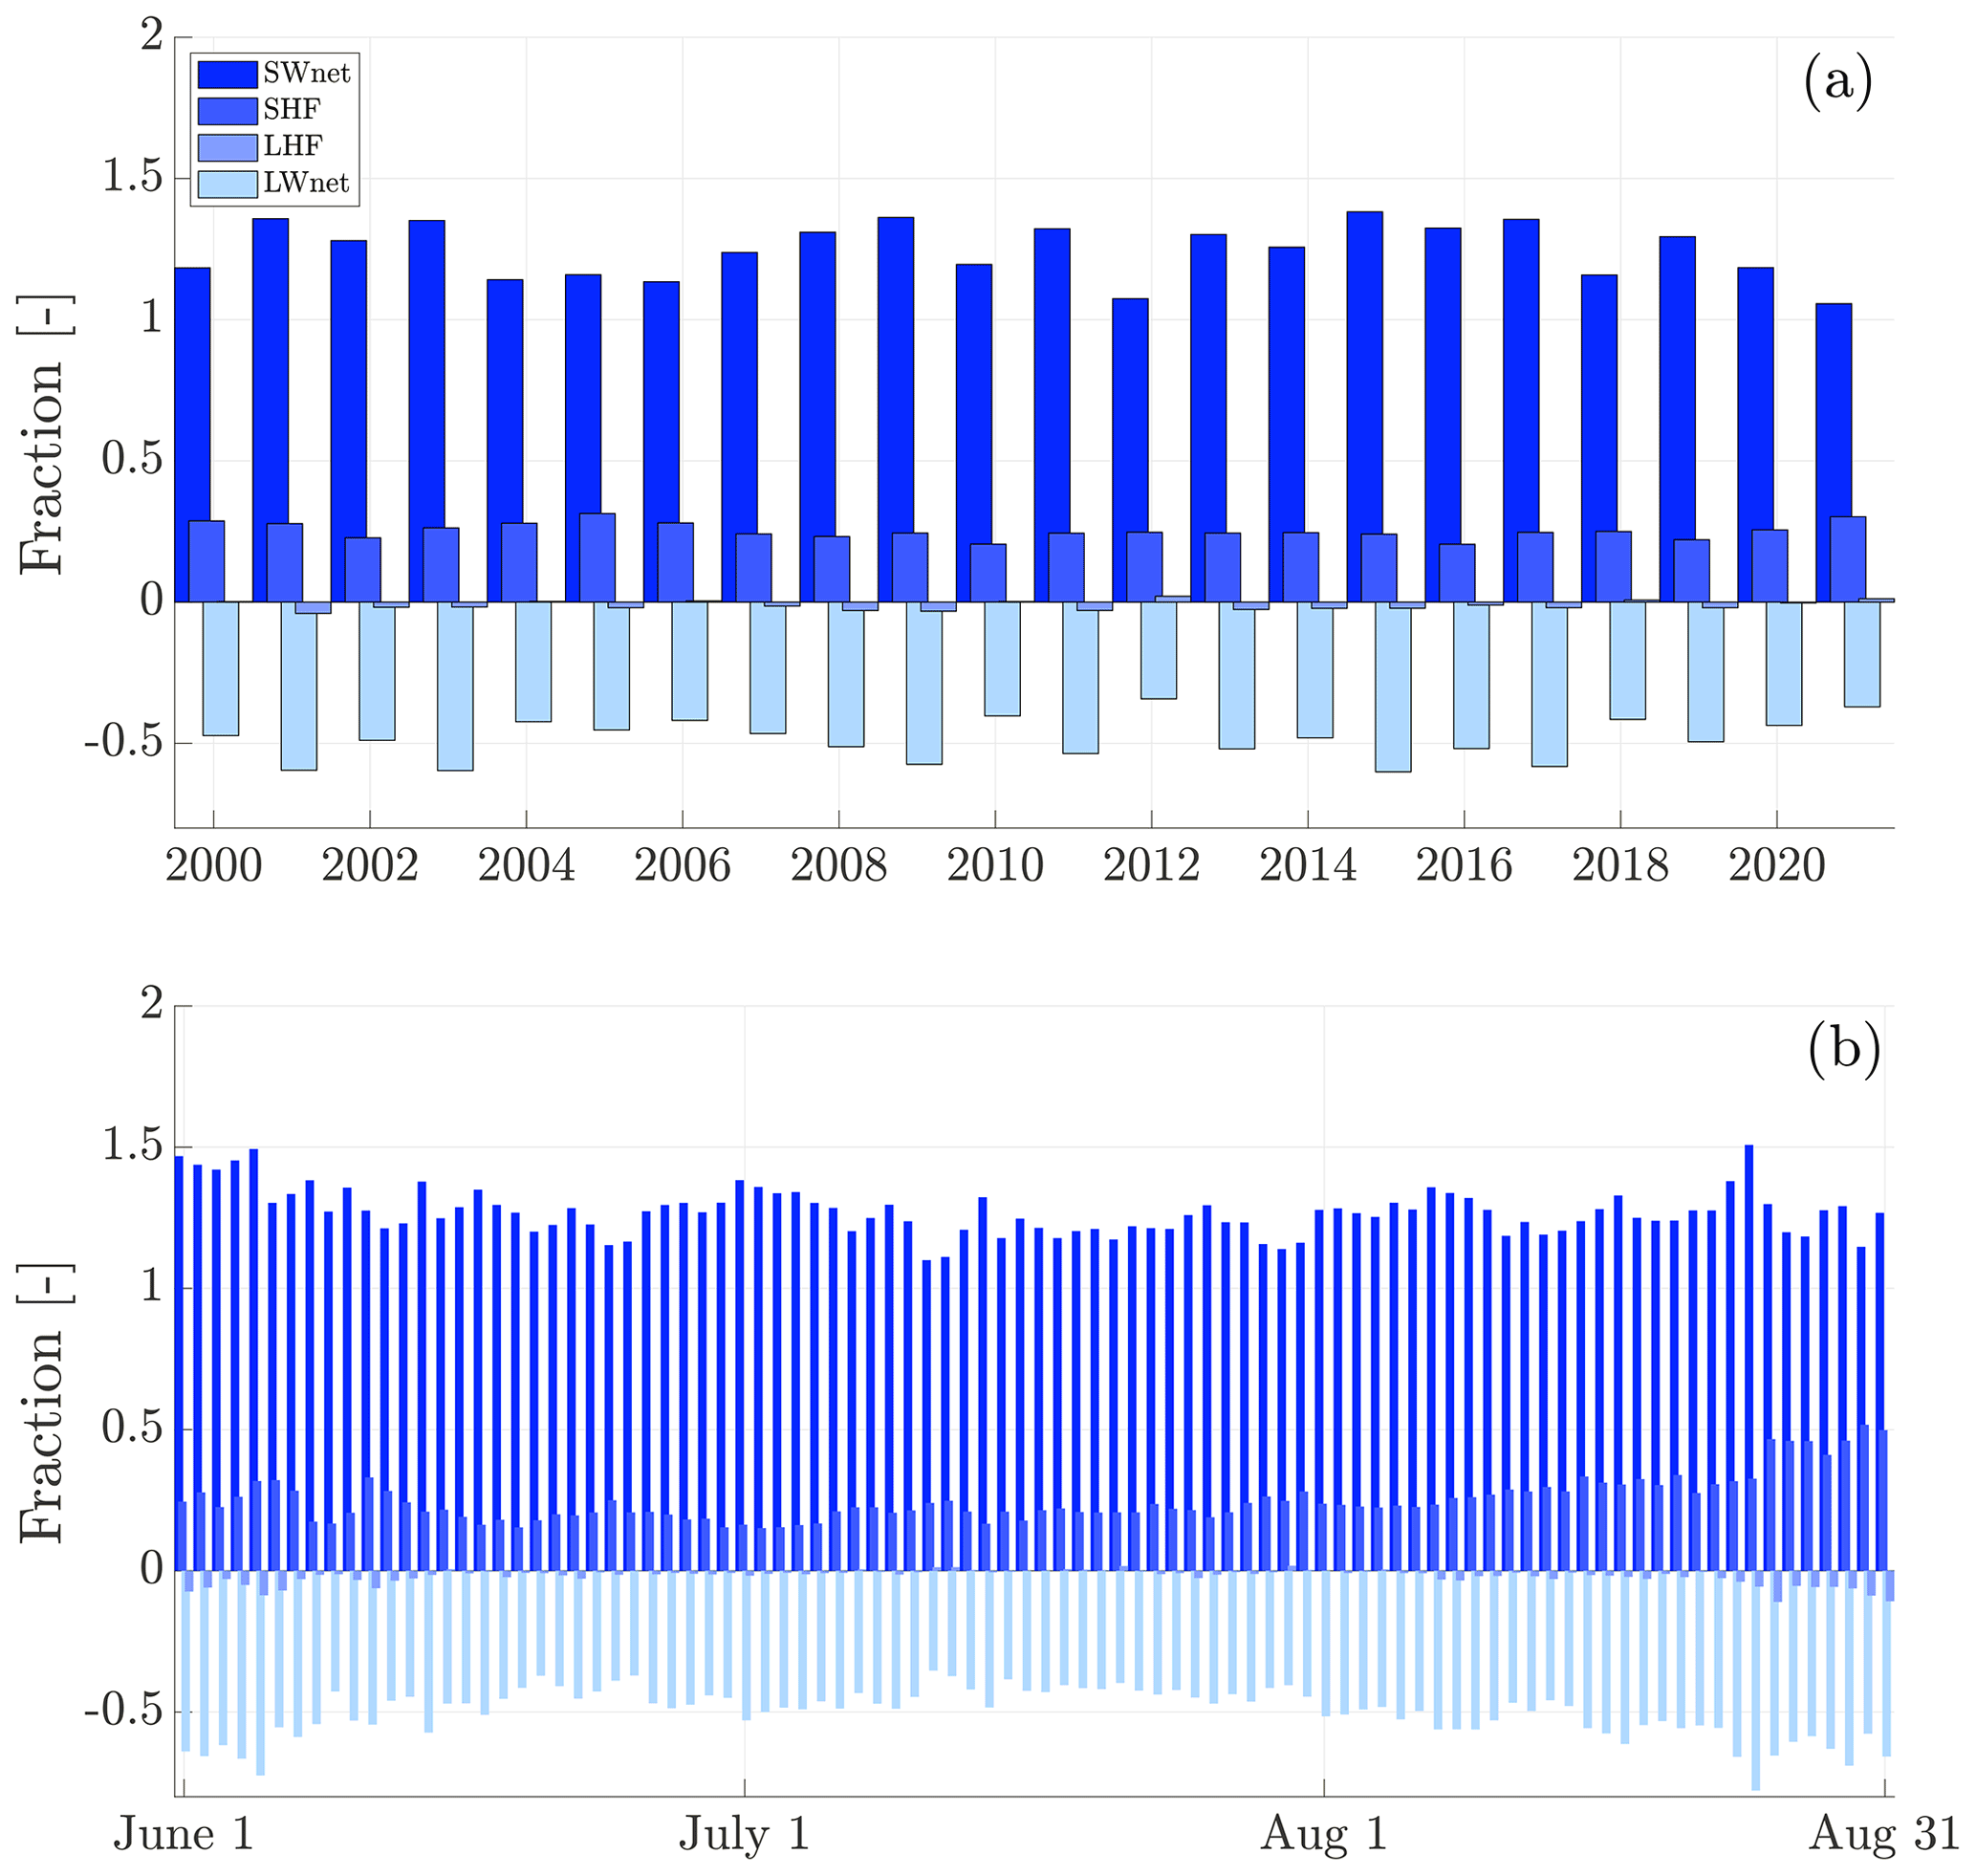
Figure 6Fractional contributions of energy fluxes to meltwater production over the bare-ice zone: (a) annual averages for 2000–2021 and (b) seasonal averages for JJA.
We quantify the effect of the bare-ice albedo bias by determining the meltwater production in two scenarios: once with the observed albedo and once with the modeled albedo as input to the meltwater production parameterization. We use the ratio of the daily averages of these two meltwater production estimates to isolate the effect of bare-ice albedo on meltwater production from the bare-ice zone below 70∘ N on a daily basis (Fig. 7). A positive ratio indicates that using the modeled albedo in the parameterization results in an underestimation of the average meltwater production on that day, compared to using the observed albedo.
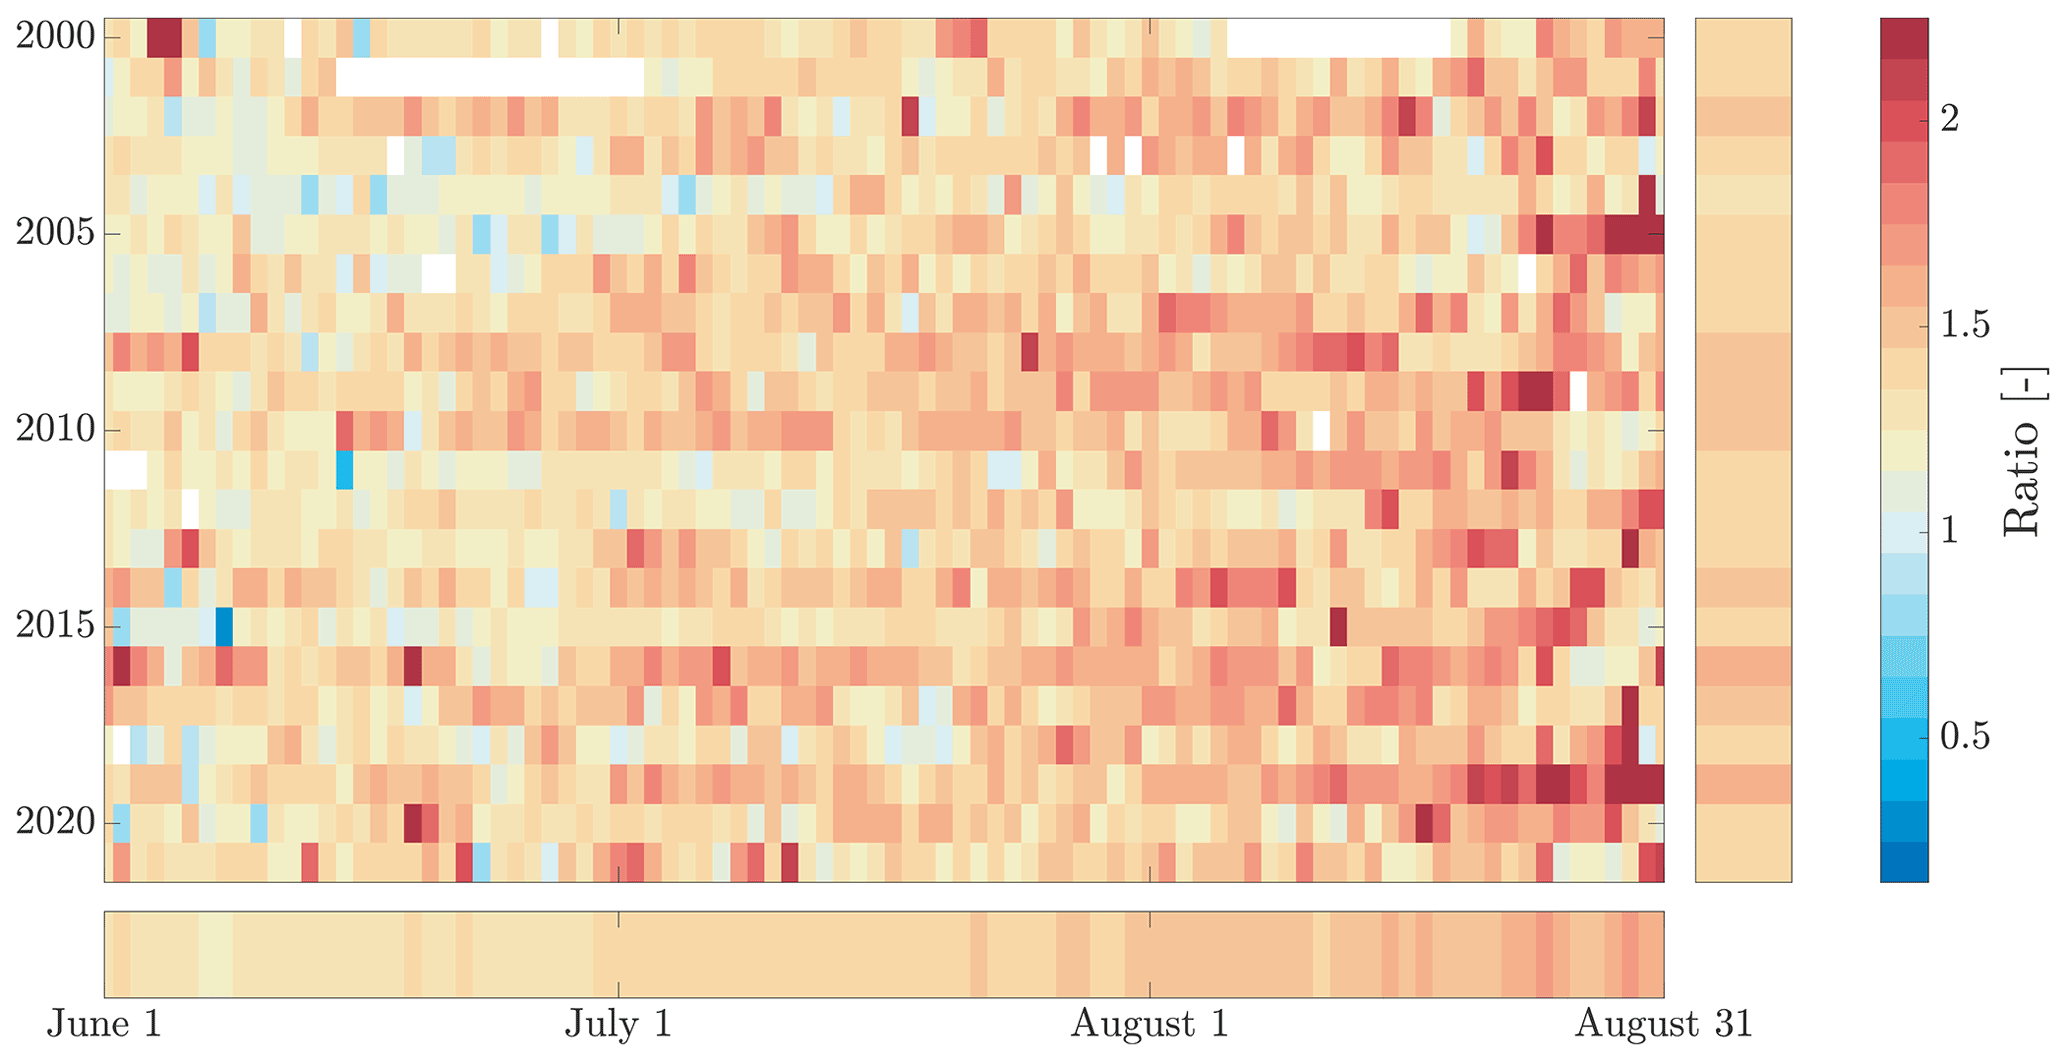
Figure 7Ratio of daily parameterized meltwater production with observed albedo to parameterized meltwater production with modeled albedo. The vertical and horizontal bars show annual and seasonal averages.
We observe a strong increasing seasonal trend in the average seasonal ratio of 0.0245 per week from June through August with seasonal average ratios for June, July, and August of 1.32, 1.42, and 1.54, respectively, indicating a seasonally increasing underestimation of parameterized meltwater production using the modeled albedo. The increase in the seasonal average ratio of meltwater production indicates that the spatial distribution and intensity of LAC concentrations on bare ice could be increasing during the season, reaching peak values in late August. Increasing amounts of accumulated surface meltwater could also be a cause of the increasing trend in the ratio. As shown earlier, the daily bare-ice extent significantly decreases after mid-August. This means there is a smaller area over which meltwater production is calculated, increasing its variability. The seasonal average reaches a low of 1.19 on 7 June and a peak of 1.75 on 24 August. The meltwater production ratio exhibits significant daily variability throughout the study period. Daily ratios in June vary from 0.34 to 3.04, though these extreme ratios are sporadic. Since the overlapping bare-ice extent between observations and the model is small in early June, this period shows extreme variability in observed bare-ice albedo and, thus, in meltwater production estimates. Hence, strong conclusions cannot be drawn for early June. The minimum and maximum daily ratios in July are 0.81 and 2.11, respectively. August exhibits numerous extremely high daily ratios, especially in late August, with minimum and maximum ratios of 0.98 and 3.09, respectively. The average annual ratio exhibits an increasing trend of 0.043 per decade from 2000 through 2021, indicating that parameterized meltwater production from the bare-ice zone below 70∘ N is being increasingly underestimated when using modeled albedo vs. observed albedo. One explanation for this could be an annually increasing number of LACs that are deposited onto and exposed in the bare-ice zone during the summer. Increasing temperatures and accumulated surface meltwater could also create more favorable conditions for algal bloom growth. The minimum and maximum annual average ratios are 1.26 and 1.58 for 2004 and 2019, respectively. Averaged over the bare-ice zone below 70∘ N and the entire study period, the MAR-derived meltwater production using the modeled albedo could be underestimated by 42.8 %, owing to an average overestimation of modeled bare-ice albedo of 22.8 %. The meltwater productions using observed and modeled albedo have a correlation coefficient of R2=0.60.
In addition to the examination of time series, we average the meltwater production ratios over the study period and map them onto the bare-ice extent (Fig. 8). We find high ratios over the dark-ice zone in southwestern Greenland, which is as expected from the high LAC concentrations in this area (Wang et al., 2020). Moreover, we find values between 0.4 and 1 higher up in the ablation zone in southwestern Greenland. In this region, meltwater production estimates are close to 0 using both observed and modeled albedo. Melting also occurs significantly less frequently with increasing elevation in this region. Hence, a small difference in albedo can result in a large percentage change of simulated meltwater production. We find extremely high ratios along the eastern margin where the observed albedo is significantly lower than the ∼ 0.55 simulated by MAR (Fig. 4). The large albedo differences and low number of melting days in this area make meltwater production estimates more variable.
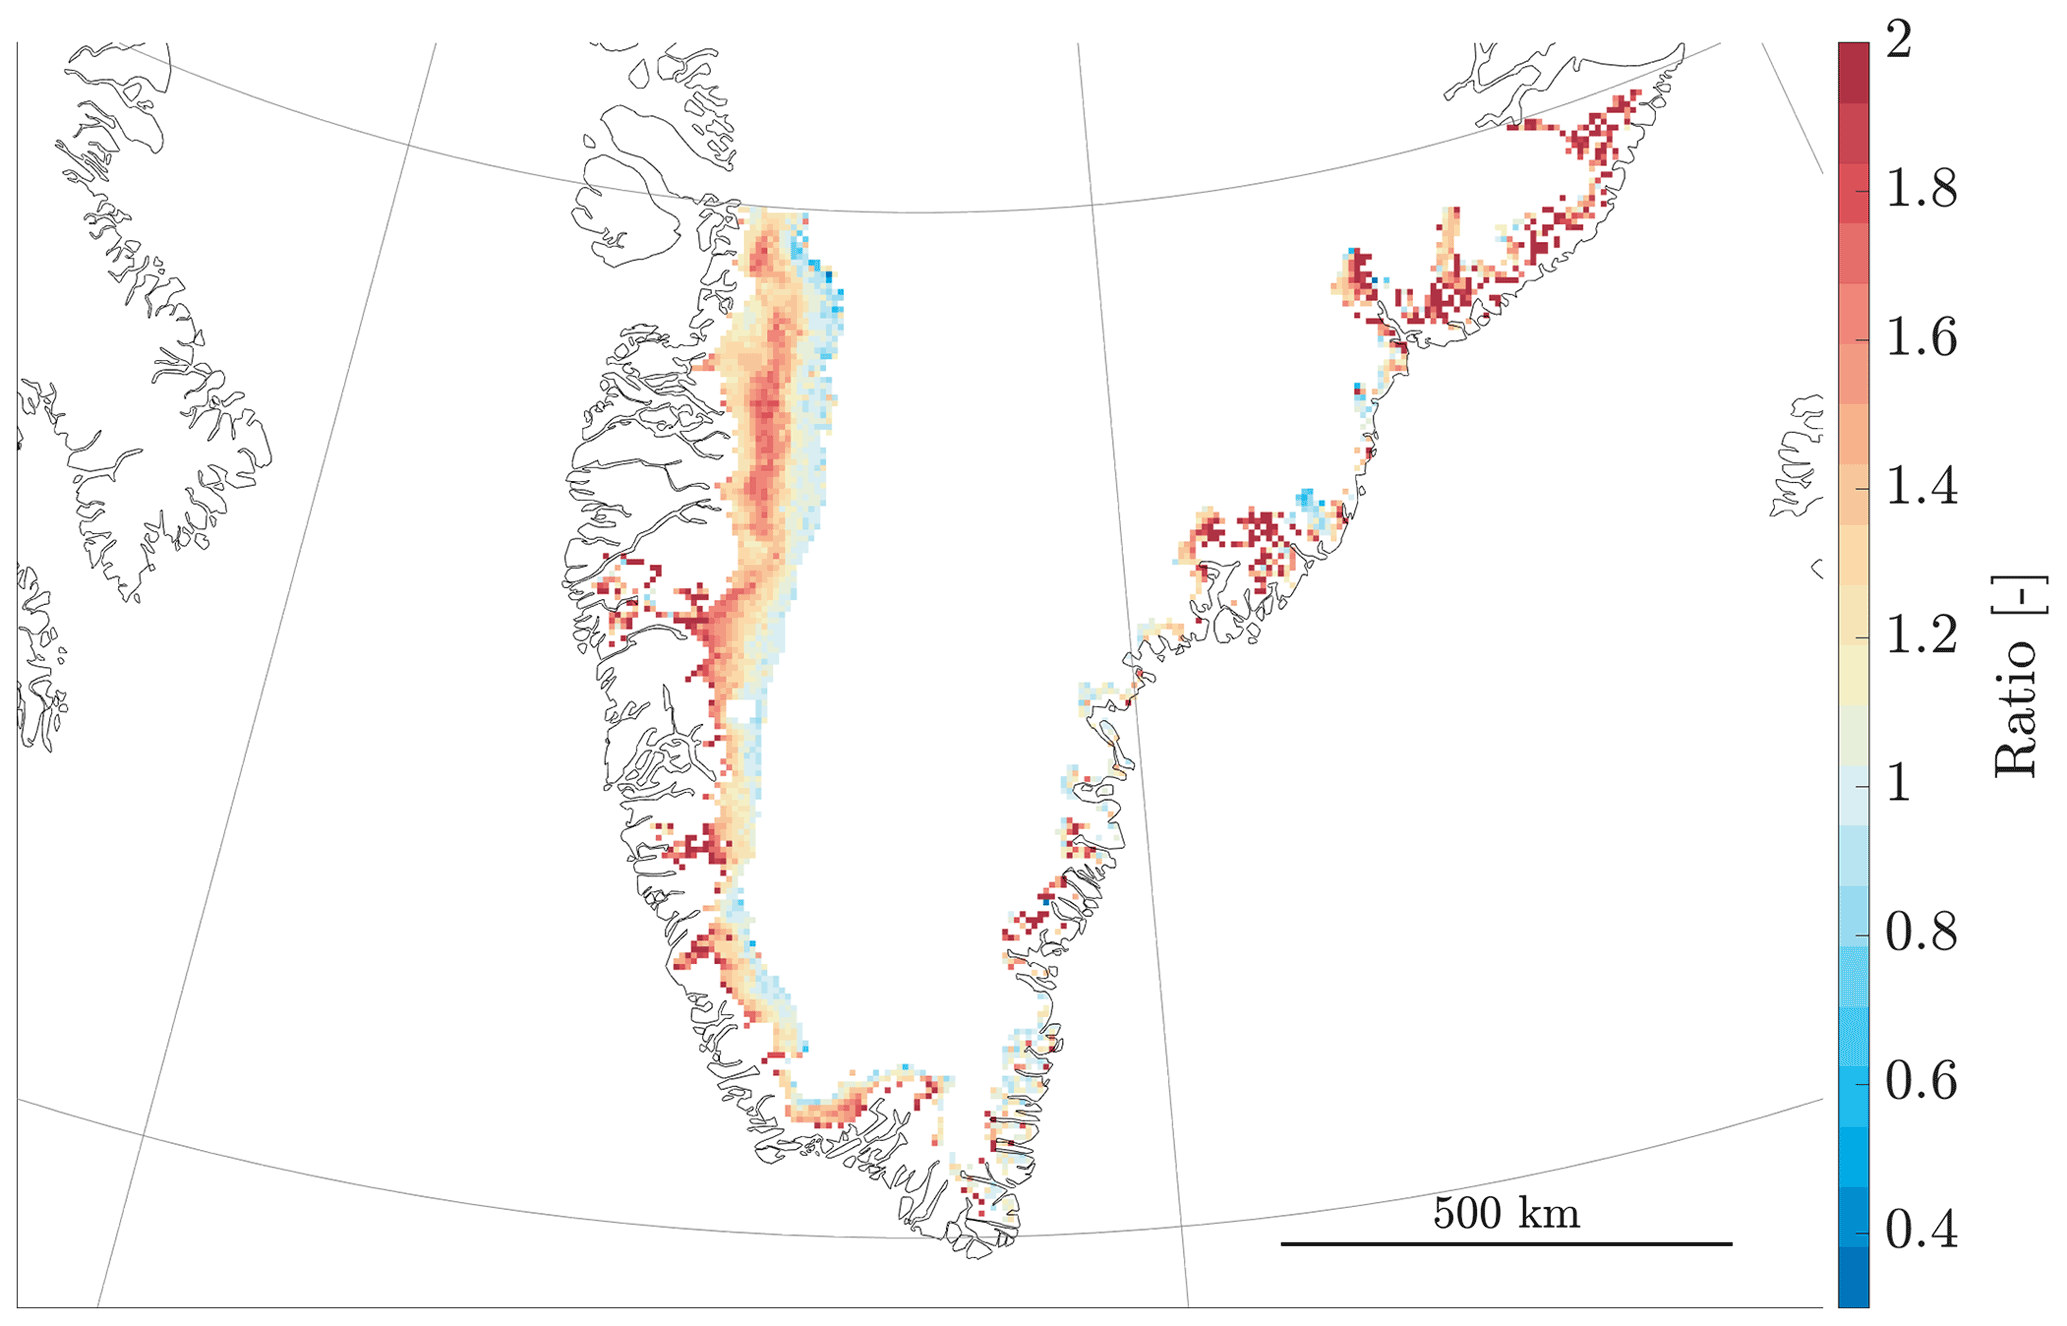
Figure 8Ratio of parameterized meltwater production with observed albedo to parameterized meltwater production with modeled albedo, averaged over the entire study period.
An analysis by Ryan et al. (2018) on sources of spatial albedo variability along a transect in the dark-ice zone, perpendicular to the ice margin, found that 73 % of spatial albedo variability can be attributed to LACs on the surface of bare ice, a mixture of algae, dust, and black carbon. Only 15 % of the spatial variability of albedo is explained by accumulated surface meltwater in rivers, streams, ponds, and lakes. Crevasses are responsible for 12 % of the observed albedo variability. Despite the very low albedo of cryoconite, due to its low abundance it accounts for only 0.6 % of the albedo variability. Moreover, accumulated surface meltwater may act as a distributor of LACs; a small change in accumulated surface meltwater may thus result in larger albedo changes than merely the added surface water. Granted, the analysis by Ryan et al. (2018) only holds for one transect covering 12.5 km2 on 6 August 2014 and may not necessarily be representative of the entire bare-ice area. A modeling study from Goelles and Bøggild (2017) suggests that meltout of englacial black carbon and dust are responsible for most of the LAC-driven meltwater production. Atmospheric deposition of black carbon and dust has a significantly lower effect on meltwater production in their study. These results hold for the location of a PROMICE AWS (KAN_M) at 1270 m a.s.l, in the dark-ice zone, for 2010–2015. It should be noted that biological activity is not included in their model, so they could be interpreting some albedo changes due to biological activity as effects from black carbon and dust. It thus remains unclear how the effect of algae relates to the effect of dust and black carbon on bare-ice albedo and meltwater production. Though, qualitatively, we assume the conclusions drawn by Goelles and Bøggild (2017) and Ryan et al. (2018) hold for the albedo differences between the model and observations we find in our analysis.
We recognize that the choice of the threshold in band 2 of MOD09GA to determine the bare-ice extent adds additional uncertainty to our results. Shimada et al. (2016) determined the 0.6 threshold from only one image of southwestern Greenland from MODIS' sub-sampled calibrated radiance product MOD02SSH from 12 July 2012 at 5 km spatial resolution. The authors picked this image because of the maximum variability in surface conditions within the image. The 0.6 threshold is simply defined as the mean of the spectral reflectance of snow and bare ice in band 2 (841–876 nm). Despite the small range of spatial and spectral data used in defining this threshold, a comparison with a coincident image from Landsat 8 OLI (Operational Land Imager) shows a good agreement in surface condition classification. A relative error in bare-ice classification of only 0.16 % leads us to believe that the threshold of 0.6 for bare-ice classification found by Shimada et al. (2016) is robust. As a sensitivity test, we reprocessed the MOD09GA data using a slightly lower threshold for bare-ice classification of 0.55 for the year 2009, whose bare-ice extent is representative as an average year in the period 2000–2021. We find that the maximum annual bare-ice extent is 17.22 % lower if we use a threshold of 0.55 as opposed to 0.6. On average, from 1 June through 31 August, the daily bare-ice extent is 23.73 % lower if we use a threshold of 0.55. This shows that the bare-ice extent is sensitive to the choice of the threshold in band 2 of MOD09GA. However, no other estimates for this threshold are available in the current literature. We therefore believe that the 0.6 threshold is currently the best estimate.
We want to emphasize that our results on albedo and meltwater production only hold for the bare-ice extent below 70∘ N that is simultaneously observed by MODIS and modeled by MAR. Since the MOD10A1 product may be less reliable above 70∘ N, we exclude this region from this part of our analysis. This means that the albedo and meltwater production results shown in this study cannot be extrapolated to the northern half of the GrIS, though we expect the physical processes to be fairly similar over the entire GrIS. An improved understanding of errors in satellite-derived albedo measurements, including additional high-quality in situ measurements, would be useful for properly analyzing the effects of albedo on meltwater production above 70∘ N.
The ratios we mention in Sect. 3.3 pertain to the parameterized meltwater production using observed albedo and modeled albedo. No direct conclusions can thus be drawn on the performance of MAR in simulating meltwater production over the bare-ice zone. However, in the “Data and methods” section we show that the parameterized meltwater production using the modeled albedo and the original meltwater production in MAR have a very high correlation (R2=0.92). We therefore believe that our conclusions are likely transferable and applicable to the performance of MAR in simulating meltwater production.
It is also important to note that the SMB simulated by MAR compares very well with SMB observations from the Programme for Monitoring of the Greenland Ice Sheet (PROMICE) on average over the entire GrIS (Fettweis et al., 2020). This suggests that the effects on meltwater production of a too high bare-ice albedo through absorption of shortwave radiation might be compensated by other energy fluxes (LWnet, SHF, LHF) in the energy balance equation of MAR over the bare-ice area. This is discussed in Fettweis et al. (2017), who highlighted an overestimation of albedo and downward shortwave radiation but an underestimation of downward longwave radiation. However, MAR underestimates melt at AWS locations in the ablation zone where melt is larger than 2 m w.e. yr−1 (Fettweis et al., 2020), suggesting that at these locations a lower bare-ice albedo would improve comparison of modeled SMB with observations from PROMICE. At these locations, the SMB modeled by the Regional Atmospheric Climate Model (RACMO2.3p2) compares better with PROMICE than the SMB from MAR does, most likely since RACMO integrates MODIS albedo into its model (Noël et al., 2019).
Using remote sensing observations and an energy balance model to parameterize meltwater production, we analyze the performance of the regional climate model MAR in simulating the spatiotemporal variability of the bare-ice extent and albedo as observed by MODIS. We have shown that MAR performs reasonably well in simulating the bare-ice extent on an annual basis. Despite the similarities in maximum annual bare-ice extent, MAR overestimates the daily bare-ice extent during the peak bare-ice season from mid-July through mid-August. We also conclude that MAR overestimates bare-ice albedo below 70∘ N on average by 22.8 % during the study period. This complements and builds further on a study by Alexander et al. (2014), who analyzed surface albedo over the entire GrIS. We advocate that this significant difference in bare-ice albedo arises in substantial part from the lack of LAC representation in MAR's bare-ice albedo scheme. A misrepresentation of accumulated surface meltwater on bare ice in MAR may also in part cause the difference between observed and modeled bare-ice albedo. Using the meltwater production parameterization, we isolate the effect of the bias in observed and modeled bare-ice albedo on the meltwater production from the bare-ice zone below 70∘ N. We find that, using the modeled albedo in the parameterization, meltwater production is underestimated on average by 42.8 % during the study period. The underestimation of meltwater production increases on average at 2.45 % per week from June through August and at 4.3 % per decade from 2000 through 2021. The largest discrepancies in meltwater production are located over the dark-ice zone, where the highest LAC concentrations are found, and along the eastern margins of the ice sheet, where simulating bare-ice extent is more difficult owing to the steep topography of the fjords and cliffs. Since meltwater production estimates from MAR and estimates from the parameterization with the modeled albedo are closely linked (R2=0.92), we believe that the results pertaining to meltwater production are likely transferable and applicable to MAR's performance in simulating meltwater production.
The results of this study show that research efforts should be directed towards uncovering the spatial and temporal variability of the distribution and trends of LAC concentrations on bare ice. Regional climate models, such as MAR, should work towards adopting a bare-ice albedo scheme that allows for inputting spatially and temporally variable LAC concentrations on bare ice. Radiative transfer models such as the Snow, Ice, and Aerosol Radiative (SNICAR) model are being improved to allow for inputting black carbon, brown carbon, dust, ash, and algae with a range of properties in a variable concentration (Whicker et al., 2022). However, neither a GrIS-wide nor a dark-ice-zone-wide quantification of distributions and trends is available yet. Hence, this aspect of LACs on bare ice still has to be parameterized.
As global, and more so Arctic, atmospheric temperature continues to rise, more bare ice will be exposed by melting the snow that usually blankets the bare ice, increasing meltwater production from the ablation zone of the GrIS. Correctly modeling and predicting bare-ice albedo, and in particular LAC concentrations on bare ice, are thus becoming increasingly imperative for proper projections of meltwater production from the GrIS by regional climate models and general circulation models.
The MAR code is available at https://www.mar.cnrs.fr (MAR model, 2021). The MAR output is available at ftp://ftp.climato.be/fettweis (last access: 28 October 2021). MODIS MOD09GA (https://doi.org/10.5067/MODIS/MOD09GA.006, Vermote and Wolfe, 2015) and MOD10A1 (https://doi.org/10.5067/MODIS/MOD10A1.006, Hall et al., 2016) data are available from Google Earth Engine (https://earthengine.google.com, Gorelick et al., 2017).
RMA, MT, PA, and WJvdB designed the study. XF ran MARv3.12 simulations and provided the outputs. RMA processed the data, performed the analysis, generated the figures, and wrote the manuscript. All authors discussed the results and contributed to the final manuscript.
At least one of the (co-)authors is a member of the editorial board of The Cryosphere. The peer-review process was guided by an independent editor, and the authors also have no other competing interests to declare.
Publisher’s note: Copernicus Publications remains neutral with regard to jurisdictional claims in published maps and institutional affiliations.
This research has been supported by the National Science Foundation (grant nos. ANS 1713072 and PLR-1603331), NASA (grant nos. MAP 80NSSC17K0351 and NNX17AH04G), and the Heising-Simons Foundation.
This paper was edited by Christian Haas and reviewed by Adrien Wehrlé and one anonymous referee.
Alexander, P. M., Tedesco, M., Fettweis, X., van de Wal, R. S. W., Smeets, C. J. P. P., and van den Broeke, M. R.: Assessing spatio-temporal variability and trends in modelled and measured Greenland Ice Sheet albedo (2000–2013), The Cryosphere, 8, 2293–2312, https://doi.org/10.5194/tc-8-2293-2014, 2014.
Alexander, P. M., Tedesco, M., Koenig, L., and Fettweis, X.: Evaluating a Regional Climate Model Simulation of Greenland Ice Sheet Snow and Firn Density for Improved Surface Mass Balance Estimates, Geophys. Res. Lett., 46, 12073–12082, https://doi.org/10.1029/2019GL084101, 2019.
Aschwanden, A., Fahnestock, M. A., Truffer, M., Brinkerhoff, D. J., Hock, R., Khroulev, C., Mottram, R., and Khan, S. A.: Contribution of the Greenland Ice Sheet to sea level over the next millennium, Sci. Adv., 5, eaav9396, https://doi.org/10.1126/sciadv.aav9396, 2019.
Box, J. E., Fettweis, X., Stroeve, J. C., Tedesco, M., Hall, D. K., and Steffen, K.: Greenland ice sheet albedo feedback: thermodynamics and atmospheric drivers, The Cryosphere, 6, 821–839, https://doi.org/10.5194/tc-6-821-2012, 2012.
Box, J. E.: Greenland Ice Sheet Mass Balance Reconstruction. Part II: Surface Mass Balance (1840–2010), J. Clim., 26, 6974–6989, https://doi.org/10.1175/JCLI-D-12-00518.1, 2013.
Brun, E., David, P., Sudul, M., and Brunot, G.: A numerical model to simulate snow-cover stratigraphy for operational avalanche forecasting, J. Glaciol., 38, 13–22, https://doi.org/10.3189/S0022143000009552, 1992.
Chen, X., Zhang, X., Church, J. A., Watson, C. S., King, M. A., Monselesan, D., Legresy, B., and Harig, C.: The increasing rate of global mean sea-level rise during 1993–2014, Nat. Clim. Change, 7, 492–495, https://doi.org/10.1038/nclimate3325, 2017.
Cook, J. M., Edwards, A., Bulling, M., Mur, L. A. J., Cook, S., Gokul, J. K., Cameron, K. A., Sweet, M., and Irvine-Fynn, T. D. L.: Metabolome-mediated biocryomorphic evolution promotes carbon fixation in Greenlandic cryoconite holes: Biocryomorphic evolution of cryoconite holes, Environ. Microbiol., 18, 4674–4686, https://doi.org/10.1111/1462-2920.13349, 2016.
Cook, J. M., Tedstone, A. J., Williamson, C., McCutcheon, J., Hodson, A. J., Dayal, A., Skiles, M., Hofer, S., Bryant, R., McAree, O., McGonigle, A., Ryan, J., Anesio, A. M., Irvine-Fynn, T. D. L., Hubbard, A., Hanna, E., Flanner, M., Mayanna, S., Benning, L. G., van As, D., Yallop, M., McQuaid, J. B., Gribbin, T., and Tranter, M.: Glacier algae accelerate melt rates on the south-western Greenland Ice Sheet, The Cryosphere, 14, 309–330, https://doi.org/10.5194/tc-14-309-2020, 2020.
Doherty, S. J., Grenfell, T. C., Forsström, S., Hegg, D. L., Brandt, R. E., and Warren, S. G.: Observed vertical redistribution of black carbon and other insoluble light-absorbing particles in melting snow: MELT REDISTRIBUTION OF BC IN SNOW, J. Geophys. Res.-Atmos., 118, 5553–5569, https://doi.org/10.1002/jgrd.50235, 2013.
Fettweis, X., Hanna, E., Lang, C., Belleflamme, A., Erpicum, M., and Gallée, H.: Brief communication “Important role of the mid-tropospheric atmospheric circulation in the recent surface melt increase over the Greenland ice sheet”, The Cryosphere, 7, 241–248, https://doi.org/10.5194/tc-7-241-2013, 2013.
Fettweis, X., Box, J. E., Agosta, C., Amory, C., Kittel, C., Lang, C., van As, D., Machguth, H., and Gallée, H.: Reconstructions of the 1900–2015 Greenland ice sheet surface mass balance using the regional climate MAR model, The Cryosphere, 11, 1015–1033, https://doi.org/10.5194/tc-11-1015-2017, 2017.
Fettweis, X., Hofer, S., Krebs-Kanzow, U., Amory, C., Aoki, T., Berends, C. J., Born, A., Box, J. E., Delhasse, A., Fujita, K., Gierz, P., Goelzer, H., Hanna, E., Hashimoto, A., Huybrechts, P., Kapsch, M.-L., King, M. D., Kittel, C., Lang, C., Langen, P. L., Lenaerts, J. T. M., Liston, G. E., Lohmann, G., Mernild, S. H., Mikolajewicz, U., Modali, K., Mottram, R. H., Niwano, M., Noël, B., Ryan, J. C., Smith, A., Streffing, J., Tedesco, M., van de Berg, W. J., van den Broeke, M., van de Wal, R. S. W., van Kampenhout, L., Wilton, D., Wouters, B., Ziemen, F., and Zolles, T.: GrSMBMIP: intercomparison of the modelled 1980–2012 surface mass balance over the Greenland Ice Sheet, The Cryosphere, 14, 3935–3958, https://doi.org/10.5194/tc-14-3935-2020, 2020.
Fettweis, X., Hofer, S., Séférian, R., Amory, C., Delhasse, A., Doutreloup, S., Kittel, C., Lang, C., Van Bever, J., Veillon, F., and Irvine, P.: Brief communication: Reduction in the future Greenland ice sheet surface melt with the help of solar geoengineering, The Cryosphere, 15, 3013–3019, https://doi.org/10.5194/tc-15-3013-2021, 2021.
Fox-Kemper, B., Hewitt, H. T., Xiao, C., Aðalgeirsdóttir, G., Drijfhout, S. S., Edwards, T. L., Golledge, N. R., Hemer, M., Kopp, R. E., Krinner, G., Mix, A., Notz, D., Nowicki, S., Nurhati, I. S., Ruiz, L., Sallée, J.-B., Slangen, A. B. A., and Yu, Y.: Ocean, Cryosphere and Sea Level Change, in: Climate Change 2021: The Physical Science Basis, Contribution of Working Group I to the Sixth Assessment Report of the Intergovernmental Panel on Climate Change, edited by: MassonDelmotte, V., Zhai, P., Pirani, A., Connors, S. L., Péan, C., Berger, S., Caud, N., Chen, Y., Goldfarb, L., Gomis, M. I., Huang, M., Leitzell, K., Lonnoy, E., Matthews, J. B. R., Maycock, T. K., Waterfield, T., Yelekçi, O., Yu, R., and Zhou, B., Cambridge University Press, Cambridge, United Kingdom and New York, NY, USA, pp. 1211–1362, 2021.
Gallée, H.: Air-sea interactions over Terra Nova Bay during winter: Simulation with a coupled atmosphere-polynya model, J. Geophys. Res.-Atmos., 102, 13835–13849, https://doi.org/10.1029/96JD03098, 1997.
Gallée, H. and Schayes, G.: Development of a Three-Dimensional Meso-γ Primitive Equation Model: Katabatic Winds Simulation in the Area of Terra Nova Bay, Antarctica, Mon. Weather Rev., 122, 671–685, https://doi.org/10.1175/1520-0493(1994)122<0671:DOATDM>2.0.CO;2, 1994.
GDAL/OGR contributors, GDAL/OGR Geospatial Data Abstraction software Library, https://gdal.org (last access: 28 October 2021), 2020.
Goelles, T. and Bøggild, C. E.: Albedo reduction of ice caused by dust and black carbon accumulation: a model applied to the K-transect, West Greenland, J. Glaciol., 63, 1063–1076, https://doi.org/10.1017/jog.2017.74, 2017.
Gorelick, N., Hancher, M., Dixon, M., Ilyushchenko, S., Thau, D., and Moore, R.: Google Earth Engine: Planetary-scale geospatial analysis for everyone, Remote Sensing of Environment, https://earthengine.google.com (last access: 28 October 2021), 2017.
Hall, D. K., Salomonson, V. V., and Riggs, G. A.: MODIS/Terra Snow Cover Daily L3 Global 500m Grid. Version 6, Boulder, Colorado USA: NASA National Snow and Ice Data Center Distributed Active Archive Center [data set], https://doi.org/10.5067/MODIS/MOD10A1.006, 2016.
Hanna, E., Mernild, S. H., Cappelen, J., and Steffen, K.: Recent warming in Greenland in a long-term instrumental (1881–2012) climatic context: I. Evaluation of surface air temperature records, Environ. Res. Lett., 7, 045404, https://doi.org/10.1088/1748-9326/7/4/045404, 2012.
Hanna, E., Fettweis, X., Mernild, S. H., Cappelen, J., Ribergaard, M. H., Shuman, C. A., Steffen, K., Wood, L., and Mote, T. L.: Atmospheric and oceanic climate forcing of the exceptional Greenland ice sheet surface melt in summer 2012: CLIMATE FORCING OF 2012 GREENLAND ICE MELT, Int. J. Climatol., 34, 1022–1037, https://doi.org/10.1002/joc.3743, 2014.
Hanna, E., Fettweis, X., and Hall, R. J.: Brief communication: Recent changes in summer Greenland blocking captured by none of the CMIP5 models, The Cryosphere, 12, 3287–3292, https://doi.org/10.5194/tc-12-3287-2018, 2018.
Helm, V., Humbert, A., and Miller, H.: Elevation and elevation change of Greenland and Antarctica derived from CryoSat-2, The Cryosphere, 8, 1539–1559, https://doi.org/10.5194/tc-8-1539-2014, 2014.
Hersbach, H., Bell, B., Berrisford, P., Hirahara, S., Horányi, A., Muñoz-Sabater, J., Nicolas, J., Peubey, C., Radu, R., Schepers, D., Simmons, A., Soci, C., Abdalla, S., Abellan, X., Balsamo, G., Bechtold, P., Biavati, G., Bidlot, J., Bonavita, M., De Chiara, G., Dahlgren, P., Dee, D., Diamantakis, M., Dragani, R., Flemming, J., Forbes, R., Fuentes, M., Geer, A., Haimberger, L., Healy, S., Hogan, R. J., Hólm, E., Janisková, M., Keeley, S., Laloyaux, P., Lopez, P., Lupu, C., Radnoti, G., de Rosnay, P., Rozum, I., Vamborg, F., Villaume, S., and Thépaut, J.-N.: The ERA5 global reanalysis, Q. J. Roy. Meteorol. Soc., 146, 1999–2049, https://doi.org/10.1002/qj.3803, 2020.
Howat, I. M., Negrete, A., and Smith, B. E.: The Greenland Ice Mapping Project (GIMP) land classification and surface elevation data sets, The Cryosphere, 8, 1509–1518, https://doi.org/10.5194/tc-8-1509-2014, 2014.
Lefebre, F.: Modeling of snow and ice melt at ETH Camp (West Greenland): A study of surface albedo, J. Geophys. Res., 108, 4231, https://doi.org/10.1029/2001JD001160, 2003.
Lesnek, A. J., Briner, J. P., Young, N. E., and Cuzzone, J. K.: Maximum Southwest Greenland Ice Sheet Recession in the Early Holocene, Geophys. Res. Lett., 47, 1–11, https://doi.org/10.1029/2019GL083164, 2020.
Liang, S. and Wang, J.: Broadband albedo, in: Advanced Remote Sensing, Elsevier, 193–250, https://doi.org/10.1016/B978-0-12-815826-5.00006-4, 2020.
MacGregor, J. A., Fahnestock, M. A., Colgan, W. T., Larsen, N. K., Kjeldsen, K. K., and Welker, J. M.: The age of surface-exposed ice along the northern margin of the Greenland Ice Sheet, J. Glaciol., 66, 667–684, https://doi.org/10.1017/jog.2020.62, 2020.
MAR model: MAR [code], https://www.mar.cnrs.fr, last access: 28 October 2021.
Martos, Y. M., Jordan, T. A., Catalán, M., Jordan, T. M., Bamber, J. L., and Vaughan, D. G.: Geothermal Heat Flux Reveals the Iceland Hotspot Track Underneath Greenland, Geophys. Res. Lett., 45, 8214–8222, https://doi.org/10.1029/2018GL078289, 2018.
McCutcheon, J., Lutz, S., Williamson, C., Cook, J. M., Tedstone, A. J., Vanderstraeten, A., Wilson, S. A., Stockdale, A., Bonneville, S., Anesio, A. M., Yallop, M. L., McQuaid, J. B., Tranter, M., and Benning, L. G.: Mineral phosphorus drives glacier algal blooms on the Greenland Ice Sheet, Nat. Commun., 12, 570, https://doi.org/10.1038/s41467-020-20627-w, 2021.
McLeod, J. T. and Mote, T. L.: Linking interannual variability in extreme Greenland blocking episodes to the recent increase in summer melting across the Greenland ice sheet: EXTREME GREENLAND BLOCKING AND SUMMER MELTING ACROSS THE GREENLAND ICE SHEET, Int. J. Climatol., 36, 1484–1499, https://doi.org/10.1002/joc.4440, 2016.
Mouginot, J., Rignot, E., Bjørk, A. A., van den Broeke, M., Millan, R., Morlighem, M., Noël, B., Scheuchl, B., and Wood, M.: Forty-six years of Greenland Ice Sheet mass balance from 1972 to 2018, P. Natl. Acad. Sci., 116, 9239–9244, https://doi.org/10.1073/pnas.1904242116, 2019.
Noël, B., van de Berg, W. J., Lhermitte, S., and van den Broeke, M. R.: Rapid ablation zone expansion amplifies north Greenland mass loss, Sci. Adv., 5, eaaw0123, https://doi.org/10.1126/sciadv.aaw0123, 2019.
Pellicciotti, F., Helbing, J., Rivera, A., Favier, V., Corripio, J., Araos, J., Sicart, J.-E., and Carenzo, M.: A study of the energy balance and melt regime on Juncal Norte Glacier, semi-arid Andes of central Chile, using melt models of different complexity, Hydrol. Process., 22, 3980–3997, https://doi.org/10.1002/hyp.7085, 2008.
Riahi, K., van Vuuren, D. P., Kriegler, E., Edmonds, J., O'Neill, B. C., Fujimori, S., Bauer, N., Calvin, K., Dellink, R., Fricko, O., Lutz, W., Popp, A., Cuaresma, J. C., Kc, S., Leimbach, M., Jiang, L., Kram, T., Rao, S., Emmerling, J., Ebi, K., Hasegawa, T., Havlik, P., Humpenöder, F., Da Silva, L. A., Smith, S., Stehfest, E., Bosetti, V., Eom, J., Gernaat, D., Masui, T., Rogelj, J., Strefler, J., Drouet, L., Krey, V., Luderer, G., Harmsen, M., Takahashi, K., Baumstark, L., Doelman, J. C., Kainuma, M., Klimont, Z., Marangoni, G., Lotze-Campen, H., Obersteiner, M., Tabeau, A., and Tavoni, M.: The Shared Socioeconomic Pathways and their energy, land use, and greenhouse gas emissions implications: An overview, Glob. Environ. Change, 42, 153–168, https://doi.org/10.1016/j.gloenvcha.2016.05.009, 2017.
Ridder, K. D. and Schayes, G.: The IAGL Land Surface Model, J. Appl. Meteorol. Climatol., 36, 167–182, https://doi.org/10.1175/1520-0450(1997)036<0167:TILSM>2.0.CO;2, 1997.
Ryan, J. C., Hubbard, A., Stibal, M., Irvine-Fynn, T. D., Cook, J., Smith, L. C., Cameron, K., and Box, J.: Dark zone of the Greenland Ice Sheet controlled by distributed biologically-active impurities, Nat. Commun., 9, 1065, https://doi.org/10.1038/s41467-018-03353-2, 2018.
Ryan, J. C., Smith, L. C., van As, D., Cooley, S. W., Cooper, M. G., Pitcher, L. H., and Hubbard, A.: Greenland Ice Sheet surface melt amplified by snowline migration and bare ice exposure, Sci. Adv., 5, eaav3738, https://doi.org/10.1126/sciadv.aav3738, 2019.
Shimada, R., Takeuchi, N., and Aoki, T.: Inter-Annual and Geographical Variations in the Extent of Bare Ice and Dark Ice on the Greenland Ice Sheet Derived from MODIS Satellite Images, Front. Earth Sci., 4, 1–10, https://doi.org/10.3389/feart.2016.00043, 2016.
Steger, C. R., Reijmer, C. H., and van den Broeke, M. R.: The modelled liquid water balance of the Greenland Ice Sheet, The Cryosphere, 11, 2507–2526, https://doi.org/10.5194/tc-11-2507-2017, 2017.
Stibal, M., Box, J. E., Cameron, K. A., Langen, P. L., Yallop, M. L., Mottram, R. H., Khan, A. L., Molotch, N. P., Chrismas, N. A. M., Calì Quaglia, F., Remias, D., Smeets, C. J. P. P., Broeke, M. R., Ryan, J. C., Hubbard, A., Tranter, M., As, D., and Ahlstrøm, A. P.: Algae Drive Enhanced Darkening of Bare Ice on the Greenland Ice Sheet, Geophys. Res. Lett., 44, 11463–11471, https://doi.org/10.1002/2017GL075958, 2017.
Tedesco, M. and Fettweis, X.: Unprecedented atmospheric conditions (1948–2019) drive the 2019 exceptional melting season over the Greenland ice sheet, The Cryosphere, 14, 1209–1223, https://doi.org/10.5194/tc-14-1209-2020, 2020.
Tedesco, M., Serreze, M., and Fettweis, X.: Diagnosing the extreme surface melt event over southwestern Greenland in 2007, The Cryosphere, 2, 159–166, https://doi.org/10.5194/tc-2-159-2008, 2008.
Tedesco, M., Fettweis, X., van den Broeke, M. R., van de Wal, R. S. W., Smeets, C. J. P. P., van de Berg, W. J., Serreze, M. C., and Box, J. E.: The role of albedo and accumulation in the 2010 melting record in Greenland, Environ. Res. Lett., 6, 014005, https://doi.org/10.1088/1748-9326/6/1/014005, 2011.
Tedesco, M., Mote, T., Fettweis, X., Hanna, E., Jeyaratnam, J., Booth, J. F., Datta, R., and Briggs, K.: Arctic cut-off high drives the poleward shift of a new Greenland melting record, Nat. Commun., 7, 11723, https://doi.org/10.1038/ncomms11723, 2016a.
Tedesco, M., Doherty, S., Fettweis, X., Alexander, P., Jeyaratnam, J., and Stroeve, J.: The darkening of the Greenland ice sheet: trends, drivers, and projections (1981–2100), The Cryosphere, 10, 477–496, https://doi.org/10.5194/tc-10-477-2016, 2016b.
Tedstone, A. J., Bamber, J. L., Cook, J. M., Williamson, C. J., Fettweis, X., Hodson, A. J., and Tranter, M.: Dark ice dynamics of the south-west Greenland Ice Sheet, The Cryosphere, 11, 2491–2506, https://doi.org/10.5194/tc-11-2491-2017, 2017.
Tedstone, A. J., Cook, J. M., Williamson, C. J., Hofer, S., McCutcheon, J., Irvine-Fynn, T., Gribbin, T., and Tranter, M.: Algal growth and weathering crust state drive variability in western Greenland Ice Sheet ice albedo, The Cryosphere, 14, 521–538, https://doi.org/10.5194/tc-14-521-2020, 2020.
van Angelen, J. H., Lenaerts, J. T. M., Lhermitte, S., Fettweis, X., Kuipers Munneke, P., van den Broeke, M. R., van Meijgaard, E., and Smeets, C. J. P. P.: Sensitivity of Greenland Ice Sheet surface mass balance to surface albedo parameterization: a study with a regional climate model, The Cryosphere, 6, 1175–1186, https://doi.org/10.5194/tc-6-1175-2012, 2012.
van den Broeke, M. R., Enderlin, E. M., Howat, I. M., Kuipers Munneke, P., Noël, B. P. Y., van de Berg, W. J., van Meijgaard, E., and Wouters, B.: On the recent contribution of the Greenland ice sheet to sea level change, The Cryosphere, 10, 1933–1946, https://doi.org/10.5194/tc-10-1933-2016, 2016.
van den Broeke, M., Box, J., Fettweis, X., Hanna, E., Noël, B., Tedesco, M., van As, D., van de Berg, W. J., and van Kampenhout, L.: Greenland Ice Sheet Surface Mass Loss: Recent Developments in Observation and Modeling, Curr. Clim. Change Rep., 3, 345–356, https://doi.org/10.1007/s40641-017-0084-8, 2017.
Vermote, E., and Wolfe, R.: MOD09GA MODIS/Terra Surface Reflectance Daily L2G Global 1km and 500m SIN Grid V006, NASA EOSDIS Land Processes DAAC [data set], https://doi.org/10.5067/MODIS/MOD09GA.006, 2015.
Wang, S., Tedesco, M., Xu, M., and Alexander, P. M.: Mapping Ice Algal Blooms in Southwest Greenland From Space, Geophys. Res. Lett., 45, 11779–11788, https://doi.org/10.1029/2018GL080455, 2018.
Wang, S., Tedesco, M., Alexander, P., Xu, M., and Fettweis, X.: Quantifying spatiotemporal variability of glacier algal blooms and the impact on surface albedo in southwestern Greenland, The Cryosphere, 14, 2687–2713, https://doi.org/10.5194/tc-14-2687-2020, 2020.
Warren, S. G., Brandt, R. E., and Grenfell, T. C.: Visible and near-ultraviolet absorption spectrum of ice from transmission of solar radiation into snow, Appl. Opt., 45, 5320, https://doi.org/10.1364/AO.45.005320, 2006.
Wehrlé, A., Box, J. E., Niwano, M., Anesio, A. M., and Fausto, R. S.: Greenland bare-ice albedo from PROMICE automatic weather station measurements and Sentinel-3 satellite observations, GEUS Bull., 47, 1–9, https://doi.org/10.34194/geusb.v47.5284, 2021.
Whicker, C. A., Flanner, M. G., Dang, C., Zender, C. S., Cook, J. M., and Gardner, A. S.: SNICAR-ADv4: a physically based radiative transfer model to represent the spectral albedo of glacier ice, The Cryosphere, 16, 1197–1220, https://doi.org/10.5194/tc-16-1197-2022, 2022.
Wientjes, I. G. M., Van De Wal, R. S. W., Schwikowski, M., Zapf, A., Fahrni, S., and Wacker, L.: Carbonaceous particles reveal that Late Holocene dust causes the dark region in the western ablation zone of the Greenland ice sheet, J. Glaciol., 58, 787–794, https://doi.org/10.3189/2012JoG11J165, 2012.
Wilks, D. S.: Forecast Verification, in: International Geophysics, vol. 100, Elsevier, 301–394, https://doi.org/10.1016/B978-0-12-385022-5.00008-7, 2011.
Williamson, C. J., Anesio, A. M., Cook, J., Tedstone, A., Poniecka, E., Holland, A., Fagan, D., Tranter, M., and Yallop, M. L.: Ice algal bloom development on the surface of the Greenland Ice Sheet, FEMS Microbiol. Ecol., 94, https://doi.org/10.1093/femsec/fiy025, 2018.
Williamson, C. J., Cook, J., Tedstone, A., Yallop, M., McCutcheon, J., Poniecka, E., Campbell, D., Irvine-Fynn, T., McQuaid, J., Tranter, M., Perkins, R., and Anesio, A.: Algal photophysiology drives darkening and melt of the Greenland Ice Sheet, P. Natl. Acad. Sci., 117, 5694–5705, https://doi.org/10.1073/pnas.1918412117, 2020.
Wiscombe, W. J. and Warren, S. G.: A model for the spectral albedo of snow. I: Pure Snow, J. Atmos. Sci., 37, 2712–2733, 1980.
Young, N. E., Lesnek, A. J., Cuzzone, J. K., Briner, J. P., Badgeley, J. A., Balter-Kennedy, A., Graham, B. L., Cluett, A., Lamp, J. L., Schwartz, R., Tuna, T., Bard, E., Caffee, M. W., Zimmerman, S. R. H., and Schaefer, J. M.: In situ cosmogenic 10Be–14C–26Al measurements from recently deglaciated bedrock as a new tool to decipher changes in Greenland Ice Sheet size, Clim. Past, 17, 419–450, https://doi.org/10.5194/cp-17-419-2021, 2021.