
Articles | Volume 14, issue 1
https://doi.org/10.5194/tc-14-93-2020
© Author(s) 2020. This work is distributed under
the Creative Commons Attribution 4.0 License.
the Creative Commons Attribution 4.0 License.
https://doi.org/10.5194/tc-14-93-2020
© Author(s) 2020. This work is distributed under
the Creative Commons Attribution 4.0 License.
the Creative Commons Attribution 4.0 License.
Research article
| 
16 Jan 2020
Research article |
| 16 Jan 2020
| 16 Jan 2020
Feature-based comparison of sea ice deformation in lead-permitting sea ice simulations
Alfred-Wegener-Institut Helmholtz-Zentrum für Polar- und Meeresforschung, Bremerhaven, Germany
Martin Losch
Alfred-Wegener-Institut Helmholtz-Zentrum für Polar- und Meeresforschung, Bremerhaven, Germany
Related authors
Nils Hutter and Cecilia M. Bitz
EGUsphere, https://doi.org/10.5194/egusphere-2026-461, https://doi.org/10.5194/egusphere-2026-461, 2026
Short summary
Short summary
Polar oceans are covered by many pieces of floating ice, called floes, that vary in size, shape and thickness. This study focuses on how fracturing caused by stresses from wind and ocean currents changes floe sizes. Using satellite images, we track ice motion and floe sizes, and study floe shapes and how deformation alters the distribution of floe sizes. We find that stronger deformation creates more small floes and present a formula to include this effect in sea-ice models.
Jean-François Lemieux, Mathieu Plante, Nils Hutter, Damien Ringeisen, Bruno Tremblay, François Roy, and Philippe Blain
The Cryosphere, 19, 5639–5654, https://doi.org/10.5194/tc-19-5639-2025, https://doi.org/10.5194/tc-19-5639-2025, 2025
Short summary
Short summary
In sea ice models, the flow rule determines how sea ice deforms (opening, closing and shearing) when critical stresses are reached. We implemented in CICE a novel approach to define the flow rule. This is a useful capability as it allows to independently optimize critical stresses and deformations. As opposed to the standard flow rule, the novel approach can lead to a thicker and more active sea ice cover with narrower deformations.
Evgenii Salganik, Odile Crabeck, Niels Fuchs, Nils Hutter, Philipp Anhaus, and Jack Christopher Landy
The Cryosphere, 19, 1259–1278, https://doi.org/10.5194/tc-19-1259-2025, https://doi.org/10.5194/tc-19-1259-2025, 2025
Short summary
Short summary
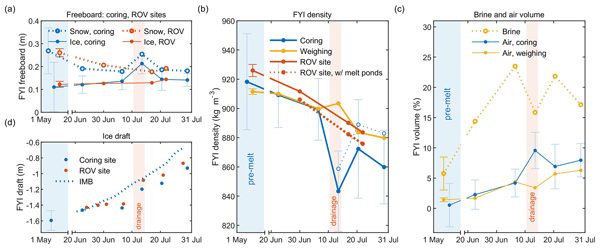
To measure Arctic ice thickness, we often check how much ice sticks out of the water. This method depends on knowing the ice's density, which drops significantly in summer. Our study, validated with sonar and laser data, shows that these seasonal changes in density can complicate melt measurements. We stress the importance of considering these density changes for more accurate ice thickness readings.

Karl Kortum, Suman Singha, Gunnar Spreen, Nils Hutter, Arttu Jutila, and Christian Haas
The Cryosphere, 18, 2207–2222, https://doi.org/10.5194/tc-18-2207-2024, https://doi.org/10.5194/tc-18-2207-2024, 2024
Short summary
Short summary
A dataset of 20 radar satellite acquisitions and near-simultaneous helicopter-based surveys of the ice topography during the MOSAiC expedition is constructed and used to train a variety of deep learning algorithms. The results give realistic insights into the accuracy of retrieval of measured ice classes using modern deep learning models. The models able to learn from the spatial distribution of the measured sea ice classes are shown to have a clear advantage over those that cannot.
Luisa von Albedyll, Stefan Hendricks, Nils Hutter, Dmitrii Murashkin, Lars Kaleschke, Sascha Willmes, Linda Thielke, Xiangshan Tian-Kunze, Gunnar Spreen, and Christian Haas
The Cryosphere, 18, 1259–1285, https://doi.org/10.5194/tc-18-1259-2024, https://doi.org/10.5194/tc-18-1259-2024, 2024
Short summary
Short summary
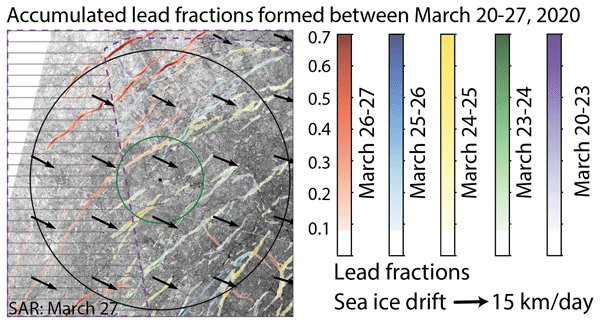
Leads (openings in sea ice cover) are created by sea ice dynamics. Because they are important for many processes in the Arctic winter climate, we aim to detect them with satellites. We present two new techniques to detect lead widths of a few hundred meters at high spatial resolution (700 m) and independent of clouds or sun illumination. We use the MOSAiC drift 2019–2020 in the Arctic for our case study and compare our new products to other existing lead products.
Robert Ricker, Steven Fons, Arttu Jutila, Nils Hutter, Kyle Duncan, Sinead L. Farrell, Nathan T. Kurtz, and Renée Mie Fredensborg Hansen
The Cryosphere, 17, 1411–1429, https://doi.org/10.5194/tc-17-1411-2023, https://doi.org/10.5194/tc-17-1411-2023, 2023
Short summary
Short summary
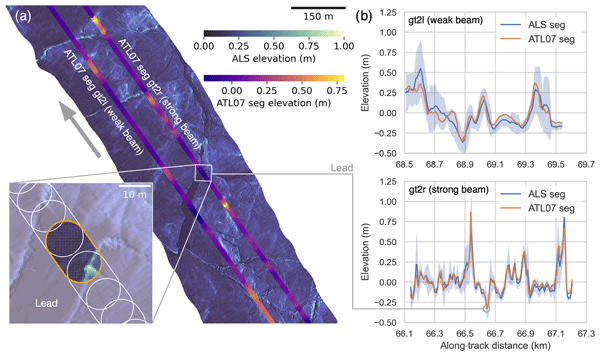
Information on sea ice surface topography is important for studies of sea ice as well as for ship navigation through ice. The ICESat-2 satellite senses the sea ice surface with six laser beams. To examine the accuracy of these measurements, we carried out a temporally coincident helicopter flight along the same ground track as the satellite and measured the sea ice surface topography with a laser scanner. This showed that ICESat-2 can see even bumps of only few meters in the sea ice cover.
Jan P. Gärtner, Martin Losch, Suvarchal K. Cheedela, Markus Jochum, and Roman Nuterman
Geosci. Model Dev., 19, 5225–5236, https://doi.org/10.5194/gmd-19-5225-2026, https://doi.org/10.5194/gmd-19-5225-2026, 2026
Short summary
Short summary
Climate simulations help us understand the Earth system and its evolution. The models used to perform these simulations are highly complex, require significant programming expertise to build and consume a lot of energy. A key component of climate models is their sea ice components. In this work, we present a sea ice model that offers an easier development process while maintaining strong performance. The model is able to run on a computer's graphics card, which greatly reduces its energy usage.
Jean-Francois Lemieux, Damien Ringeisen, Martin Losch, William Lipscomb, and Jinro Ukita
EGUsphere, https://doi.org/10.5194/egusphere-2026-1362, https://doi.org/10.5194/egusphere-2026-1362, 2026
This preprint is open for discussion and under review for The Cryosphere (TC).
Short summary
Short summary
The sea ice cover in the Arctic and in the Southern Ocean strongly varies spatially due to the formation of leads and pressure ridges. Leads and pressure ridges are formed when sea ice fails because forces inside the ice cover reach critical values. This work describes how the representation of leads and ridges in sea ice models should be modified when different critical forces are used.
Damien Ringeisen, Bruno Tremblay, Jean-Francois Lemieux, and Martin Losch
EGUsphere, https://doi.org/10.5194/egusphere-2026-1845, https://doi.org/10.5194/egusphere-2026-1845, 2026
Short summary
Short summary
Sea ice moves and deforms as wind and ocean currents push it around, creating narrow fracture lines on the surface. To accurately reproduce these fracture patterns in computer models used for climate predictions and navigation, we tested a mathematical approach to sea ice dynamics, common in other fields but rare in sea ice modeling, to see if it could better capture these patterns. Our results show this approach could improve fracture representation, though it requires more computing power.
Nils Hutter and Cecilia M. Bitz
EGUsphere, https://doi.org/10.5194/egusphere-2026-461, https://doi.org/10.5194/egusphere-2026-461, 2026
Short summary
Short summary
Polar oceans are covered by many pieces of floating ice, called floes, that vary in size, shape and thickness. This study focuses on how fracturing caused by stresses from wind and ocean currents changes floe sizes. Using satellite images, we track ice motion and floe sizes, and study floe shapes and how deformation alters the distribution of floe sizes. We find that stronger deformation creates more small floes and present a formula to include this effect in sea-ice models.
Jean-François Lemieux, Mathieu Plante, Nils Hutter, Damien Ringeisen, Bruno Tremblay, François Roy, and Philippe Blain
The Cryosphere, 19, 5639–5654, https://doi.org/10.5194/tc-19-5639-2025, https://doi.org/10.5194/tc-19-5639-2025, 2025
Short summary
Short summary
In sea ice models, the flow rule determines how sea ice deforms (opening, closing and shearing) when critical stresses are reached. We implemented in CICE a novel approach to define the flow rule. This is a useful capability as it allows to independently optimize critical stresses and deformations. As opposed to the standard flow rule, the novel approach can lead to a thicker and more active sea ice cover with narrower deformations.
Evgenii Salganik, Odile Crabeck, Niels Fuchs, Nils Hutter, Philipp Anhaus, and Jack Christopher Landy
The Cryosphere, 19, 1259–1278, https://doi.org/10.5194/tc-19-1259-2025, https://doi.org/10.5194/tc-19-1259-2025, 2025
Short summary
Short summary
To measure Arctic ice thickness, we often check how much ice sticks out of the water. This method depends on knowing the ice's density, which drops significantly in summer. Our study, validated with sonar and laser data, shows that these seasonal changes in density can complicate melt measurements. We stress the importance of considering these density changes for more accurate ice thickness readings.
Karl Kortum, Suman Singha, Gunnar Spreen, Nils Hutter, Arttu Jutila, and Christian Haas
The Cryosphere, 18, 2207–2222, https://doi.org/10.5194/tc-18-2207-2024, https://doi.org/10.5194/tc-18-2207-2024, 2024
Short summary
Short summary
A dataset of 20 radar satellite acquisitions and near-simultaneous helicopter-based surveys of the ice topography during the MOSAiC expedition is constructed and used to train a variety of deep learning algorithms. The results give realistic insights into the accuracy of retrieval of measured ice classes using modern deep learning models. The models able to learn from the spatial distribution of the measured sea ice classes are shown to have a clear advantage over those that cannot.
Luisa von Albedyll, Stefan Hendricks, Nils Hutter, Dmitrii Murashkin, Lars Kaleschke, Sascha Willmes, Linda Thielke, Xiangshan Tian-Kunze, Gunnar Spreen, and Christian Haas
The Cryosphere, 18, 1259–1285, https://doi.org/10.5194/tc-18-1259-2024, https://doi.org/10.5194/tc-18-1259-2024, 2024
Short summary
Short summary
Leads (openings in sea ice cover) are created by sea ice dynamics. Because they are important for many processes in the Arctic winter climate, we aim to detect them with satellites. We present two new techniques to detect lead widths of a few hundred meters at high spatial resolution (700 m) and independent of clouds or sun illumination. We use the MOSAiC drift 2019–2020 in the Arctic for our case study and compare our new products to other existing lead products.
Robert Ricker, Steven Fons, Arttu Jutila, Nils Hutter, Kyle Duncan, Sinead L. Farrell, Nathan T. Kurtz, and Renée Mie Fredensborg Hansen
The Cryosphere, 17, 1411–1429, https://doi.org/10.5194/tc-17-1411-2023, https://doi.org/10.5194/tc-17-1411-2023, 2023
Short summary
Short summary
Information on sea ice surface topography is important for studies of sea ice as well as for ship navigation through ice. The ICESat-2 satellite senses the sea ice surface with six laser beams. To examine the accuracy of these measurements, we carried out a temporally coincident helicopter flight along the same ground track as the satellite and measured the sea ice surface topography with a laser scanner. This showed that ICESat-2 can see even bumps of only few meters in the sea ice cover.
Cited articles
Antonov, J. I., Locarnini, R. A., Boyer, T. P., Mishonov, A. V., and Garcia,
H. E.: World Ocean Atlas 2005, Volume 2: Salinity, U.S. Government Printing Office, Washington, D.C., USA, 2006. a
Borradaile, G. J.: Statistics of Earth Science Data: Their Distribution in
Time, Space and Orientation, Springer-Verlag Berlin Heidelberg,
https://doi.org/10.1007/978-3-662-05223-5, 2003. a
Castellani, G., Losch, M., Ungermann, M., and Gerdes, R.: Sea-Ice Drag as
Function of Deformation and Ice Cover: Effects on Simulated Sea Ice and Ocean
Circulation in the Arctic., Ocean Model., 128, 48–66,
https://doi.org/10.1016/j.ocemod.2018.06.002, 2018. a, b
Clauset, A., Shalizi, C., and Newman, M.: Power-Law Distributions in Empirical
Data, SIAM Rev., 51, 661–703, https://doi.org/10.1137/070710111, 2009. a
Coon, M., Kwok, R., Levy, G., Pruis, M., Schreyer, H., and Sulsky, D.: Arctic
Ice Dynamics Joint Experiment (AIDJEX) assumptions revisited and found
inadequate, J. Geophys. Res.-Oceans, 112, C11S90,
https://doi.org/10.1029/2005JC003393,
2007. a
Cunningham, G. F., Kwok, R., and Banfield, J.: Ice lead orientation
characteristics in the winter Beaufort Sea, in: Proceedings of IGARSS '94 –
1994 IEEE International Geoscience and Remote Sensing Symposium, 8–12 August 1994, Pasadena, CA, USA, vol. 3, 1747–1749, https://doi.org/10.1109/IGARSS.1994.399553, 1994. a
Dansereau, V., Weiss, J., Saramito, P., and Lattes, P.: A Maxwell elasto-brittle rheology for sea ice modelling, The Cryosphere, 10, 1339–1359, https://doi.org/10.5194/tc-10-1339-2016, 2016. a, b, c
Dempsey, J., Xie, Y., Adamson, R., and Farmer, D.: Fracture of a ridged
multi-year Arctic sea ice floe, Cold Reg. Sci. Technol., 76–77,
63–68, https://doi.org/10.1016/j.coldregions.2011.09.012, 2012. a, b
Eguíluz, V. M., Fernández-Gracia, J., Irigoien, X., and Duarte, C. M.:
A quantitative assessment of Arctic shipping in 2010–2014, Sci.
Rep., 6, 30682, https://doi.org/10.1038/srep30682, 2016. a
Erlingsson, B.: Two-dimensional deformation patterns in sea ice, J.
Glaciol., 34, 301–308, 1988. a
Girard, L., Weiss, J., Molines, J. M., Barnier, B., and Bouillon, S.:
Evaluation of high-resolution sea ice models on the basis of statistical and
scaling properties of Arctic sea ice drift and deformation, J.
Geophys. Res.-Oceans, 114, 1–15, https://doi.org/10.1029/2008JC005182, 2009. a, b
Haas, C.: Dynamics Versus Thermodynamics: The Sea Ice Thickness Distribution,
chap. 4, John Wiley & Sons, Ltd, 113–151,
https://doi.org/10.1002/9781444317145.ch4,
2010. a
Heorton, H. D. B. S., Feltham, D. L., and Tsamados, M.: Stress and deformation
characteristics of sea ice in a high-resolution, anisotropic sea ice model,
Philos. T. Roy. Soc. A, 376, 20170349, https://doi.org/10.1098/rsta.2017.0349,
2018. a
Horvat, C., Tziperman, E., and Campin, J.-M.: Interaction of sea ice floe size, ocean eddies, and sea ice melting, Geophys. Res. Lett., 43,
8083–8090, https://doi.org/10.1002/2016GL069742,
2016. a, b, c
Hutchings, J. K., Heil, P., and Hibler, W. D.: Modeling Linear Kinematic
Features in Sea Ice, Mon. Weather Rev., 133, 3481–3497,
https://doi.org/10.1175/MWR3045.1,
2005. a, b
Hutter, N.: Viscous-plastic sea-ice models at very high resolution, Master's
thesis, University of Bremen, Alfred Wegener Institute, Helmholtz Centre for
Polar and Marine research, https://doi.org/10013/epic.46129, 2015. a, b
Hutter, N.: lkf_tools: a code to detect and track Linear Kinematic Features
(LKFs) in sea-ice deformation data (Version v1.0), Zenodo,
https://doi.org/10.5281/zenodo.2560078,
2019a. a
Hutter, N.: Linear Kinematic Features (leads & pressure ridges)
detected and tracked in sea-ice deformation simulated in an Arctic
configuration of MITgcm using a 2-km horizontal grid spacing from 1997 to
2008, PANGAEA, https://doi.org/10.1594/PANGAEA.909636, 2019b. a, b
Hutter, N.: Linear Kinematic Features (leads & pressure ridges)
detected and tracked in sea-ice deformation simulated in an Arctic
configuration of MITgcm using a 2-km horizontal grid with an active 5-class
ice thickness distribution spacing from 1997 to 2008, PANGAEA,
https://doi.org/10.1594/PANGAEA.909632, 2019c. a, b
Hutter, N., Zampieri, L., and Losch, M.: Linear Kinematic Features
(leads & pressure ridges) detected and tracked in RADARSAT Geophysical
Processor System (RGPS) sea-ice deformation data from 1997 to 2008, PANGAEA,
https://doi.org/10.1594/PANGAEA.898114, 2019b. a, b, c
Jung, T., Gordon, N. D., Bauer, P., Bromwich, D. H., Chevallier, M., Day,
J. J., Dawson, J., Doblas-Reyes, F., Fairall, C., Goessling, H. F., Holland,
M., Inoue, J., Iversen, T., Klebe, S., Lemke, P., Losch, M., Makshtas, A.,
Mills, B., Nurmi, P., Perovich, D., Reid, P., Renfrew, I. A., Smith, G.,
Svensson, G., Tolstykh, M., and Yang, Q.: Advancing Polar Prediction
Capabilities on Daily to Seasonal Time Scales, B. Am.
Meteorol. Soc., 97, 1631–1647, https://doi.org/10.1175/BAMS-D-14-00246.1,
2016. a
Kobayashi, S., Ota, Y., Harada, Y., Ebita, A., Moriya, M., Onoda, H., Onogi,
K., Kamahori, H., Kobayashi, C., Endo, H., Miyaoka, K., and Takahashi, K.:
The JRA-55 Reanalysis: General Specifications and Basic Characteristics,
J. Meteorol. Soc. Jpn. Ser. II, 93, 5–48,
https://doi.org/10.2151/jmsj.2015-001, 2015. a
Koldunov, N. V., Danilov, S., Sidorenko, D., Hutter, N., Losch, M., Goessling,
H., Rakowsky, N., Scholz, P., Sein, D., Wang, Q., and Jung, T.: Fast EVP
solutions in a high-resolution sea ice model, J. Adv. Model.
Earth Syst., 11, 1269–1284, https://doi.org/10.1029/2018MS001485,
2019. a, b, c
Kwok, R.: The RADARSAT Geophysical Processor System, in: Analysis of SAR Data
of the Polar Oceans, Springer Berlin Heidelberg, 235–257,
https://doi.org/10.1007/978-3-642-60282-5_11, 1998. a
Kwok, R.: Deformation of the Arctic Ocean Sea Ice Cover between November 1996
and April 1997: A Qualitative Survey, in: IUTAM Symposium on Scaling Laws in
Ice Mechanics and Ice Dynamics, edited by: Dempsey, J. and Shen, H., vol. 94
of Solid Mechanics and Its Applications, Springer
Netherlands, 315–322, https://doi.org/10.1007/978-94-015-9735-7_26, 2001. a, b, c
Kwok, R. and Cunningham, G. F.: Radarsat Geophysical Processor System: Data
User'S Handbook (Version 2.0), National Aeronautics and Space Administration, Pasadena, California, USA, 2014. a
Laherrère, J. and Sornette, D.: Stretched exponential distributions in
nature and economy: “fat tails” with characteristic scales, Eur.
Phys. J. B, 2, 525–539,
https://doi.org/10.1007/s100510050276, 1998. a
Lemieux, J.-F., Tremblay, L. B., Dupont, F., Plante, M., Smith, G. C., and
Dumont, D.: A basal stress parameterization for modeling landfast ice,
J. Geophys. Res.-Oceans, 120, 3157–3173,
https://doi.org/10.1002/2014JC010678,
2015. a, b
Levy, G., Coon, M., Nguyen, G., and Sulsky, D.: Metrics for evaluating linear
features, Geophys. Res. Lett., 35, L21705, https://doi.org/10.1029/2008GL035086,
2008. a
Lindsay, R. W. and Stern, H. L.: The RADARSAT geophysical processor system:
quality of sea ice trajectory and deformation estimates, J. Atmos. Ocean.
Tech., 20, 1333–1347,
https://doi.org/10.1175/1520-0426(2003)020<1333:TRGPSQ>2.0.CO;2,
2003. a, b
Linow, S. and Dierking, W.: Object-Based Detection of Linear Kinematic Features
in Sea Ice, Remote Sensing, 9, 493, https://doi.org/10.3390/rs9050493, 2017. a, b, c
Lipscomb, W. H., Hunke, E. C., Maslowski, W., and Jakacki, J.: Ridging,
strength, and stability in high-resolution sea ice models, J.
Geophys. Res.-Oceans, 112, C03S91, https://doi.org/10.1029/2005JC003355,
2007. a
Locarnini, R. A., Mishonov, A. V., Antonov, J. I., Boyer, T. P., and Garcia,
H. E.: World Ocean Atlas 2005, Volume 1: Temperature, U.S. Government Printing Office, Washington, D.C., USA, 2006. a
Losch, M., Menemenlis, D., Campin, J.-M., Heimbach, P., and Hill, C.: On the
formulation of sea-ice models. Part 1: Effects of different solver
implementations and parameterizations, Ocean Model., 33, 129–144,
https://doi.org/10.1016/j.ocemod.2009.12.008, 2010. a
Lüpkes, C. and Gryanik, V.: Parameterization of drag coefficients over
polar sea ice for climate models, Mercator Ocean Quarterly Newsletter –
Special Issue, 51, 29–34, 2015. a
Mahoney, A. R., Eicken, H., Shapiro, L. H., Heinrichs, T., Meyer, F. J., and
Gaylord, A. G.: Mapping and Characterization of Recurring Spring Leads and
Landfast Ice in the Beaufort and Chukchi Seas, final Report: OCS
Study BOEM 2012-067, available at:
https://www.boem.gov/sites/default/files/boem-newsroom/Library/Publications/2012/BOEM-2012-067.pdf (last access: 14 January 2020), 2012. a, b
Manucharyan, G. E. and Thompson, A. F.: Submesoscale Sea Ice-Ocean Interactions
in Marginal Ice Zones, J. Geophys. Res.-Oceans, 122,
9455–9475, https://doi.org/10.1002/2017JC012895,
2017. a
Marshall, J., Adcroft, A., Hill, C., Perelman, L., and Heisey, C.: A
Finite-Volume, Incompressible Navier Stokes Model for Studies of the
Ocean on Parallel Computers, J. Geophys. Res., 102, 5753–5766,
https://doi.org/10.1029/96JC02775, 1997. a
Massonnet, F., Goosse, H., Fichefet, T., and Counillon, F.: Calibration of sea
ice dynamic parameters in an ocean-sea ice model using an ensemble Kalman
filter, J. Geophys. Res.-Oceans, 119, 4168–4184,
https://doi.org/10.1002/2013JC009705,
2014. a
Menemenlis, D., Campin, J., Heimbach, P., Hill, C., Lee, T., Nguyen, A.,
Schodlok, M., and Zhang, H.: ECCO2: High Resolution Global Ocean and Sea
Ice Data Synthesis, Mercator Ocean Quaterly Newsletter, 31, 13–21, 2008. a
Miles, M. W. and Barry, R. G.: A 5-year satellite climatology of winter sea ice
leads in the western Arctic, J. Geophys. Res.-Oceans, 103,
21723–21734, https://doi.org/10.1029/98JC01997, 1998. a, b
MITgcm Group: MITgcm User Manual, Online documentation, MIT/EAPS,
Cambridge, MA 02139, USA, available at: http://mitgcm.org/public/docs.html (last access: 14 January 2020), 2017. a
Mohammadi-Aragh, M., Goessling, H. F., Losch, M., Hutter, N., and Jung, T.:
Predictability of Arctic sea ice on weather time scales, Sci.
Rep., 8, 6514, https://doi.org/10.1038/s41598-018-24660-0, 2018. a
Mourre, B., Aguiar, E., Juza, M., Hernandez-Lasheras, J., Reyes, E., Heslop,
E., Escudier, R., Cutolo, E., Ruiz, S., Mason, E., Pascual, A., and
Tintoré, J.: Assessment of High-Resolution Regional Ocean Prediction
Systems Using Multi-Platform Observations: Illustrations in the Western
Mediterranean Sea, in: New Frontiers in Operational Oceanography, edited by:
Chassignet, E., Pascual, A., Tintoré, J., and Verron, J.,
GODAE Ocean View, 663–694, https://doi.org/10.17125/gov2018.ch24, 2018. a
Nguyen, A. T., Menemenlis, D., and Kwok, R.: Arctic ice-ocean simulation with
optimized model parameters: approach and assessment, J. Geophys. Res., 116,
C04025, https://doi.org/10.1029/2010JC006573, 2011. a, b
Nguyen, A. T., Kwok, R., and Menemenlis, D.: Source and Pathway of the Western
Arctic Upper Halocline in a Data-Constrained Coupled Ocean and Sea Ice Model,
J. Phys. Oceanogr., 42, 802–823, https://doi.org/10.1175/JPO-D-11-040.1,
2012. a
Oikkonen, A., Haapala, J., Lensu, M., Karvonen, J., and Itkin, P.: Small-scale
sea ice deformation during N-ICE2015: From compact pack ice to marginal ice
zone, J. Geophys. Res.-Oceans, 122, 5105–5120,
https://doi.org/10.1002/2016JC012387, 2017. a
Pritchard, R. S.: Mathematical characteristics of sea ice dynamics models,
J. Geophys. Res.-Oceans, 93, 15609–15618,
https://doi.org/10.1029/JC093iC12p15609,
1988. a
Rampal, P., Weiss, J., Marsan, D., Lindsay, R., and Stern, H.: Scaling
properties of sea ice deformation from buoy dispersion analysis, J.
Geophys. Res.-Oceans, 113, 1–12, https://doi.org/10.1029/2007JC004143, 2008. a
Ringeisen, D., Losch, M., Tremblay, L. B., and Hutter, N.: Simulating intersection angles between conjugate faults in sea ice with different viscous–plastic rheologies, The Cryosphere, 13, 1167–1186, https://doi.org/10.5194/tc-13-1167-2019, 2019. a, b, c
Rothrock, D. A.: The energetics of the plastic deformation of pack ice by
ridging, J. Geophys. Res., 80, 4514–4519,
https://doi.org/10.1029/JC080i033p04514,
1975. a, b, c
Schaffer, J. and Timmermann, R.: Greenland and Antarctic ice sheet
topography, cavity geometry, and global bathymetry (RTopo-2), links to NetCDF
files, https://doi.org/10.1594/PANGAEA.856844, 2016. a
Schulson, E. M.: Compressive shear faults within arctic sea ice: Fracture on
scales large and small, J. Geophys. Res.-Oceans, 109, C07016,
https://doi.org/10.1029/2003JC002108, 2004. a
Schulson, E. M., Fortt, A., Iliescu, D., and Renshaw, C.: On the role of
frictional sliding in the compressive fracture of ice and granite: Terminal
vs. post-terminal failure, Acta Mater., 54, 3923–3932,
https://doi.org/10.1016/j.actamat.2006.04.024,
2006. a
Stamoulis, C. and Dyer, I.: Acoustically derived ice-fracture velocity in
central Arctic pack ice, J. Acoust. Soc. Am.,
108, 96–104, https://doi.org/10.1121/1.429448, 2000. a
Stern, H., Schweiger, A., Zhang, J., and Steele, M.: On reconciling disparate
studies of the sea-ice floe size distribution, Elementa Science of the
Anthropocene, 6, 1–16, https://doi.org/10.1525/elementa.304, 2018. a
Sumata, H., Kauker, F., Karcher, M., and Gerdes, R.: Simultaneous Parameter
Optimization of an Arctic Sea Ice–Ocean Model by a Genetic Algorithm,
Mon. Weather Rev., 147, 1899–1926, https://doi.org/10.1175/MWR-D-18-0360.1, 2019. a
Thorndike, A. S., Rothrock, D. A., Maykut, G. A., and Colony, R.: The thickness
distribution of sea ice, J. Geophys. Res., 80,
4501–4513, https://doi.org/10.1029/JC080i033p04501,
1975. a
Tsamados, M., Feltham, D. L., and Wilchinsky, A. V.: Impact of a new
anisotropic rheology on simulations of Arctic sea ice, J. Geophys.
Res.-Oceans, 118, 91–107, https://doi.org/10.1029/2012JC007990,
2013. a
Tsamados, M., Feltham, D. L., Schroeder, D., Flocco, D., Farrell, S. L., Kurtz,
N., Laxon, S. W., and Bacon, S.: Impact of Variable Atmospheric and Oceanic
Form Drag on Simulations of Arctic Sea Ice, J. Phys. Oceanogr.,
44, 1329–1353, https://doi.org/10.1175/JPO-D-13-0215.1, 2014. a, b
Ukita, J. and Moritz, R. E.: Yield curves and flow rules of pack ice, J. Geophys. Res.-Oceans, 100, 4545–4557, https://doi.org/10.1029/94JC02202,
1995. a
Ungermann, M. and Losch, M.: An Observationally Based Evaluation of Subgrid
Scale Ice Thickness Distributions Simulated in a Large-Scale Sea Ice-Ocean
Model of the Arctic Ocean, J. Geophys. Res.-Oceans, 123,
8052–8067, https://doi.org/10.1029/2018JC014022,
2018. a, b, c, d
Ungermann, M., Tremblay, L. B., Martin, T., and Losch, M.: Impact of the Ice
Strength Formulation on the Performance of a Sea Ice Thickness Distribution
Model in the Arctic, J. Geophys. Res., 122, 2090–2107,
https://doi.org/10.1002/2016JC012128, 2017. a
Van Dyne, M., Tsatsoulis, C., and Fetterer, F.: Analyzing lead information from
SAR images, IEEE T. Geosci. Remote, 36, 647–660,
https://doi.org/10.1109/36.662745, 1998. a
Wadhams, P.: Sea ice thickness distribution in the Greenland Sea and Eurasian
Basin, May 1987, J. Geophys. Res.-Oceans, 97, 5331–5348,
https://doi.org/10.1029/91JC03137,
1992. a
Walter, B. A. and Overland, J. E.: The response of lead patterns in the
Beaufort Sea to storm-scale wind forcing, Ann. Glaciol., 17,
219–226, https://doi.org/10.3189/S0260305500012878, 1993. a
Wang, K.: Observing the yield curve of compacted pack ice, J.
Geophys. Res.-Oceans, 112, C05015, https://doi.org/10.1029/2006JC003610, 2007. a, b, c
Wang, Q., Danilov, S., Jung, T., Kaleschke, L., and Wernecke, A.: Sea ice leads
in the Arctic Ocean: Model assessment, interannual variability and trends,
Geophys. Res. Lett., 43, 7019–7027, https://doi.org/10.1002/2016GL068696,
2016. a, b
Weiss, J.: Scaling of Fracture and Faulting of Ice on Earth, Surv.
Geophys., 24, 185–227, https://doi.org/10.1023/A:1023293117309, 2003. a
Weiss, J.: Sea Ice Deformation, in: Drift, Deformation, and Fracture of Sea
Ice, SpringerBriefs in Earth Sciences, Springer Netherlands, 31–51,
https://doi.org/10.1007/978-94-007-6202-2_3, 2013. a
Wernecke, A. and Kaleschke, L.: Lead detection in Arctic sea ice from CryoSat-2: quality assessment, lead area fraction and width distribution, The Cryosphere, 9, 1955–1968, https://doi.org/10.5194/tc-9-1955-2015, 2015.
a, b
Willmes, S. and Heinemann, G.: Sea-Ice Wintertime Lead Frequencies and Regional
Characteristics in the Arctic, 2003-2015, Remote Sensing, 8,
https://doi.org/10.3390/rs8010004,
2016. a, b, c
Zhang, J. and Hibler, W. D.: On an efficient numerical method for modeling sea ice dynamics, J. Geophys. Res.-Oceans, 102, 8691–8702,
https://doi.org/10.1029/96JC03744,
1997. a
Zhang, J., Thomas, D. R., Rothrock, D. A., Lindsay, R. W., Yu, Y., and Kwok,
R.: Assimilation of ice motion observations and comparisons with submarine
ice thickness data, J. Geophys. Res.-Oceans, 108, 3170,
https://doi.org/10.1029/2001JC001041, 2003. a
Zhao, M., Timmermans, M.-L., Cole, S., Krishfield, R., Proshutinsky, A., and
Toole, J.: Characterizing the eddy field in the Arctic Ocean halocline,
J. Geophys. Res.-Oceans, 119, 8800–8817,
https://doi.org/10.1002/2014JC010488,
2014. a
Short summary
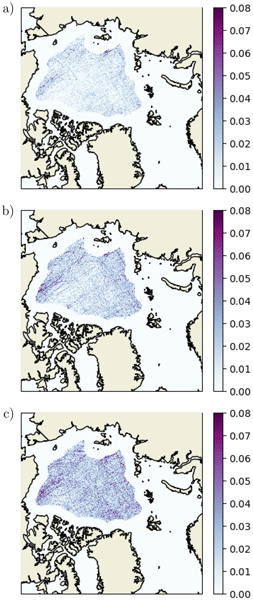
Sea ice is composed of a multitude of floes that constantly deform due to wind and ocean currents and thereby form leads and pressure ridges. These features are visible in the ice as stripes of open-ocean or high-piled ice. High-resolution sea ice models start to resolve these deformation features. In this paper we present two simulations that agree with satellite data according to a new evaluation metric that detects deformation features and compares their spatial and temporal characteristics.
Sea ice is composed of a multitude of floes that constantly deform due to wind and ocean...


