
the Creative Commons Attribution 4.0 License.
the Creative Commons Attribution 4.0 License.
 | 28 Jul 2026
Evaluation of representation of seasonally frozen ground characteristics in Land Surface Models: JSBACH and CLM
Mittal Parmar
Kristina Fröhlich
Antonella Sanna
Tobias Stacke
Marianna Benassi
Zhicheng Luo
Daniele Peano
Bodo Ahrens
Land surface models (LSMs) differ in simulating winter soil conditions due to complex freeze-thaw processes and snow-soil interactions, leading to uncertainties in spring and summer soil moisture and runoff. This study evaluates standalone simulations from two LSMs, JSBACH and CLM, driven by ERA5 data (1986–2022), compares them with ERA5-Land to study model differences across cold regions, and then examines all three models against the reference RIHMI-WDC observational dataset at 26 sites to better understand how seasonally frozen ground (SFG) characteristics (timing, duration, and freeze depth) are represented in these models. The research aims to identify biases in simulated SFG characteristics, investigate their causes, and assess how snow cover errors propagate into frozen ground biases using site-level evaluation over Russia. The importance of snow parameterization is highlighted in this study through an improvement to the snow density scheme in JSBACH, which reduced its cold bias in soil temperature by up to 10–20 °C, and this improved version was used for the comparative analysis. Among the models assessed in this study, JSBACH reproduces frozen ground extent most realistically, closely matching reference estimates of SFG and permafrost (PEFT) extent, but it simulates reduced snow depth (mean bias = −14.2 cm), leading to weaker insulation, enhanced soil cooling (mean bias = −3.7 °C), and deeper seasonal freezing, whereas CLM simulates soil temperatures comparatively close to observations (+0.1 °C) under colder air temperatures (−3.4 °C) and excessive snow (12.2 cm), indicating overestimated snow insulation. Site-level freeze-thaw evaluation reveals systematic biases across models, including premature autumn freezing and delayed spring thaw, leading to longer frozen ground duration (16 to 19 d) associated with contrasting snow insulation effects in CLM and JSBACH. Soil freezing in JSBACH responded too strongly to surface thermal forcing, whereas ERA5-Land and CLM showed an overestimated relationship between SFG and snow characteristics. This discrepancy indicates that LSMs differ in how control of soil freeze-thaw is partitioned between air temperature and snow processes. The study highlights that improving model performance requires better snow representation and a detailed assessment aimed at enhancing the parameterization of soil thermal and hydraulic properties.
- Article
(13395 KB) - Full-text XML
- BibTeX
- EndNote


Frozen ground is a significant component of the global cryosphere, which includes both seasonally frozen ground (SFG) and permafrost (PEFT) (Peng et al., 2020). SFG covers nearly fifty percent of the exposed land area in the Northern Hemisphere (including the active layer overlaying PEFT), where freeze-thaw processes significantly influence local and global climate, atmospheric circulation, hydrology, terrestrial ecosystems, and biogeochemistry (Boli et al., 2014; Luo et al., 2016; Schmidt et al., 2011; Li et al., 2002; Jin et al., 2009; Schuur et al., 2009). The coexistence of ice and liquid water in this area modifies the hydraulic and thermal properties of the soil, consequently affecting distribution of water and energy within the land surface system (Jan et al., 2022). Frozen soil can increase overland flow and flood risk due to reduced hydraulic conductivity, and earlier thawing of frozen ground can impact ecosystems by accelerating spring greening through reduced albedo and enhanced soil moisture infiltration (Stuurop et al., 2022; Hua et al., 2025). Previous studies have primarily looked at freeze-thaw processes in PEFT regions, with most research limited to local or regional case studies (Chang et al., 2018; Zhang et al., 1997; Peng et al., 2023). A limited number of studies have shown the dynamics and broader implications of freeze-thaw cycles in SFG on region scale (Luo et al., 2020; Zhao et al., 2022), with only a very few addressing the hemispheric scale (Chen et al., 2022), leaving significant gaps in our understanding of SFG’s large-scale behavior and environmental impacts. Land surface models (LSMs) are essential tool for exploring the physical mechanisms underlying the frozen soil processes. However, many studies have reported persistent challenges in accurately simulating soil temperature, snow cover, and freeze-thaw transitions under low-temperature conditions (Li et al., 2002; Zheng et al., 2017; Luo et al., 2020; Risto et al., 2022). Considerable discrepancies are often observed among different models even when they are driven by identical meteorological forcing, leading to substantial uncertainty in simulated surface water and energy budgets (Zheng et al., 2017; Slater et al., 2007). These inconsistencies mainly come from the highly nonlinear interactions between soil temperature, soil moisture, and ice content, as well as from differing model parameterizations of heat and mass transfer in frozen soils. A crucial prerequisite for evaluating how well models simulate freeze-thaw conditions is the assessment of the spatial distribution of frozen ground on large scales. However, despite its importance, available hemispheric-scale maps for the Northern Hemisphere are still limited. According to Zhang et al. (2000), SFG is estimated to cover approximately 48 million km2, whereas PEFT occupies about 12.21 to 16.98 million km2. More recent research, however, suggests that the extent of PEFT may range between 13.60 and 18.97 million km2 (Ran et al., 2022). Mapping and comparing these distributions across models is a preliminary yet crucial step in identifying and addressing the uncertainties related to the status of frozen ground. Apart from spatial distribution, a comprehensive understanding of SFG also requires investigating its key characteristics, such as the timing of freeze onset, thaw or end date, duration of the frozen period, and maximum freezing depth, along with their primary controlling factors (Chen et al., 2022; Li et al., 2021). Numerous studies have shown that air temperature and snow cover are the dominant factors modulating SFG characteristics, as they particularly influence the depth and duration of soil freezing (Wang and Chen, 2022; Zhang et al., 2021; Osokin et al., 2000; Zhang, 2005; Lawrence and Slater, 2010; Peng et al., 2016). Observational evidence consistently shows that rising air temperatures lead to delayed freezing, earlier thawing, a shorter frozen period, and shallower freezing depth (Li et al., 2021, 2012; Wang et al., 2015; Frauenfeld et al., 2011). Meanwhile, snow cover plays a dual and complex role through its insulating effect, it buffers the soil from air temperature fluctuations, and its influence depends strongly on snow characteristics such as timing, duration, thickness, density, and structure. In northern latitudes, shallow snow and shorter snow cover duration tend to enhance soil freezing by allowing greater heat loss from the ground to the atmosphere while under thick and persistent snowpacks, the insulating effect can dominate to such an extent that the influence of snow cover on soil freezing depth surpasses that of air temperature (Zhang, 2005; Lawrence and Slater, 2010). Given this complexity, LSMs must realistically capture the interactions between snow insulation, soil moisture, and energy exchange to simulate SFG behavior reliably. However, there is a notable lack of studies over Russia that systematically compare LSMs driven by the same forcing dataset to examine SFG characteristics. Offline or standalone model configurations provide a strategic framework for such analyses, as it allows for the detailed examination of soil freeze-thaw dynamics without atmospheric feedbacks (Matthes et al., 2025). This study investigates two LSMs: JSBACH and CLM, each utilizing different formulations for soil and snow processes, with both models driven by ERA5 reanalysis data (Hersbach et al., 2020). Additionally, the ERA5-Land offline model (ERA5L; Muñoz-Sabater et al., 2021), which is also driven by ERA5 data, is included to provide context for the range of uncertainties in offline simulations, rather than serving as a baseline. Model performance is evaluated using in situ observational data across Russia, focusing on how well frozen soil characteristics are represented. By examining the simulated winter soil and snow characteristics and their coupling relationships, the research seeks to identify the respective strengths and weaknesses of each model. Specifically, the paper aims to address the following questions:
-
How well do JSBACH and CLM simulate SFG characteristics compared to observations?
-
What factors lead to biases in the timing of SFG?
-
How do errors in simulated snow cover characteristics affect biases in SFG characteristics?
The paper is structured as follows: Sect. 2 discusses the data and methods, which include descriptions of LSMs, model setup, in situ observational data, definition of SFG and snow cover characteristics, and the evaluation metrics. In Sect. 3, results and discussion are presented, which examine model improvements, large-scale spatial performance, site-level validation, and the causes of SFG bias. Finally, Sect. 4 provides the conclusions of the study.
2.1 Land surface model description
2.1.1 JSBACH
The Jena Scheme for Biosphere-Atmosphere Coupling in Hamburg version 4 (JSBACHv4, Schneck et al., 2022), developed at the Max Planck Institute for Meteorology, is a part of ICON-Land, which is the land surface component of the ICOsahedral Nonhydrostatic (ICON) model (current ICON release 2025.04; https://gitlab.dkrz.de/icon/icon-model, last access: 16 June 2025). It is the successor of the earlier JSBACHv3 (Reick et al., 2021) and provides the lower boundary for the atmosphere in coupled simulations and can also be applied in standalone mode as a comprehensive terrestrial ecosystem model. In ICON-Land, JSBACHv4 processes are organized modularly, allowing clear separation and flexible coupling of individual components (Jungclaus et al., 2022). JSBACH simulates key processes of the land surface system including the surface energy and water balance, soil hydrology and thermodynamics, vegetation phenology, photosynthesis, and the coupling of carbon and nitrogen cycles (Ekici et al., 2014; Brovkin et al., 2009; Raddatz et al., 2007). To account for heterogeneity within grid cells, JSBACH uses a tiling approach in which different land-cover types are simulated separately and then aggregated to the grid scale (Reick et al., 2021). Additive quantities, such as flux densities (energy, water, and carbon) and albedo, are aggregated using area weighted averaging based on tile fractions. However, non-additive quantities, such as surface temperature and roughness, are treated separately, with surface temperature computed at the grid-box level and subsurface heat and moisture fluxes calculated at the tile level before averaging. Recent model versions feature an enhanced representation of soil thermal and hydrological processes. Soil thermal properties such as heat capacity and conductivity are calculated dynamically as a function of the relative amounts of liquid water, ice, and organic matter in each layer (Ekici et al., 2014; Schneck et al., 2022). The standard discretization resolves five soil layers (node depths: 0.065, 0.254, 0.913, 2.902, and 5.7 m), enabling a realistic simulation of the active layer and deeper subsurface thermal buffering. Moisture phase transitions, incorporating the concept of supercooled water, are represented explicitly, and the presence of soil ice reduces hydraulic conductivity, thereby limiting vertical water transport, restricting the effective rooting depth to the thawed active layer, and improving the realism of plant water stress responses in boreal and PEFT regions. The current ICON release (2025.04) also incorporates enhancements to the soil hydrology scheme, such as vertical variations in organic matter content, which directly affect hydraulic and thermal properties, refinements in percolation and drainage through the inclusion of soil ice impedance, and a simple wetland parameterization (De Vrese et al., 2023). A more detailed description of the model parameterizations can be found in Reick et al. (2021, 2013); De Vrese et al. (2023); Schneck et al. (2022). Snow is represented using a multilayer scheme with up to five layers, where the upper four layers are fixed at 5 cm and the bottom layer grows dynamically. The layers are hydrologically inactive, so meltwater transfer and refreezing within the snowpack are not simulated, and snowmelt infiltration into the soil is handled separately by the hydrology module (Ekici et al., 2014). Snow densification over time alters the thermal conductivity of the snowpack and its insulating effect on the underlying soil. Earlier formulations used a time-dependent approach with a constant decay factor, which often caused rapid densification and shallow snow depths. After updating the snow aging parameterization to depend on snow temperature (Heise et al., 2006), as described in Sect. 2.6, it has resulted in better representation of snow depth evolution and an improved simulation of the soil thermal regime beneath the snowpack. This update is now officially included in ICON-Land, and further details on the improvements are provided in Sect. 2.6.
2.1.2 CLM
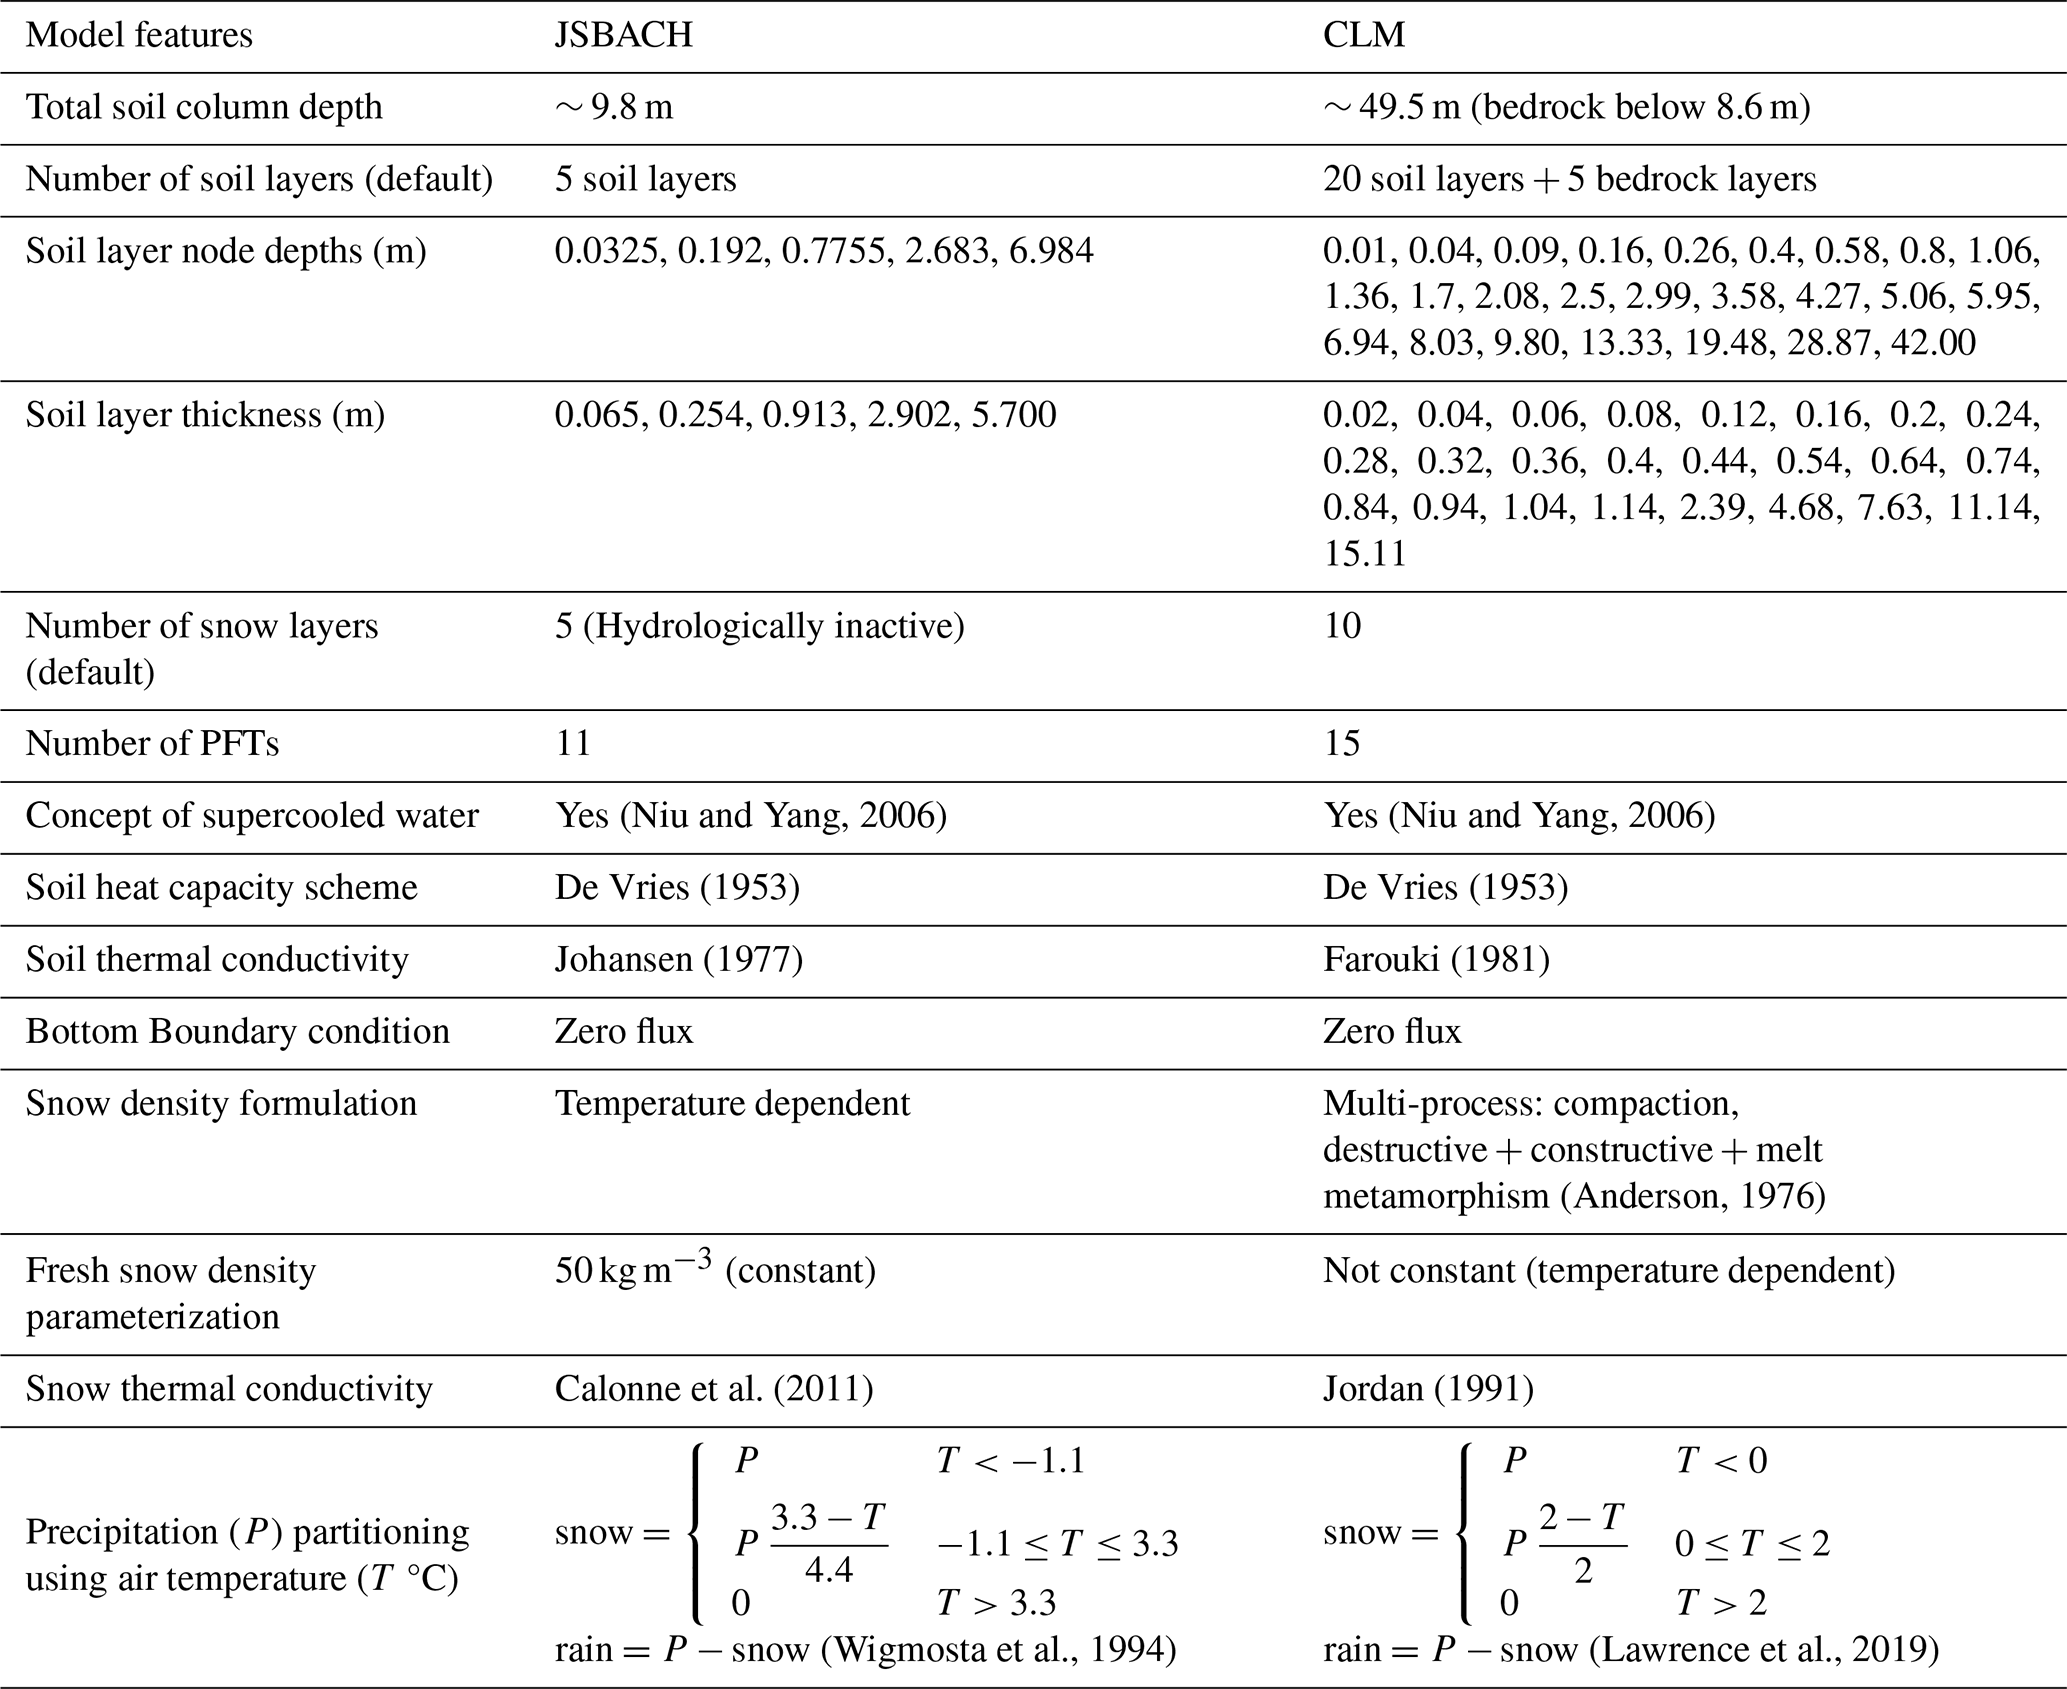
The Community Land Model (CLM) is an advanced land surface modeling system developed as the terrestrial component of the Community Earth System Model (CESM; http://www.cesm.ucar.edu/models/cesm2/, last access: 15 October 2025, Danabasoglu et al., 2020) within the Community Terrestrial Systems Model framework (CTSM; https://github.com/ESCOMP/CTSM, last access: 15 October 2025). Beyond CESM, CLM has also been integrated into other Earth System Modeling frameworks, including the Norwegian Earth System Model (NorESM), Euro-Mediterranean Center on Climate Change Earth System Model (CMCC-ESM2), etc. This study uses version CTSM5.1.dev128_cm3_v1 (https://github.com/CMCC-Foundation/CTSM, last access: 30 March 2024; hereafter referred to as CLM), which is designed to simulate complex land-atmosphere interactions and can be used in both regional and global modeling configurations, offering flexibility for diverse scientific applications. The soil thermal and hydrological schemes are tightly coupled, with phase change processes explicitly accounting for latent heat effects during freezing and thawing, and soil ice content dynamically affecting both thermal conductivity and hydraulic properties. This coupling is particularly important for simulating PEFT dynamics and seasonal freeze-thaw cycles in cold regions. The model uses a comprehensive representation of terrestrial hydrological processes spanning the full water cycle, from canopy interception through snowpack dynamics to deep groundwater interactions. A notable distinction of CLM compared to JSBACH is its explicit treatment of hydrologically active snow layers, allowing simulation of liquid water percolation, refreezing, and storage within the snowpack itself (Lawrence et al., 2019), processes that directly affect snow thermal properties and meltwater timing. The model uses a sophisticated subgrid hierarchy where each grid cell is divided into land units (vegetated, urban, glacier, lake), which are further subdivided into soil columns and plant functional types (PFTs). The default soil column configuration comprises 25 vertical layers, including 20 hydrologically and biogeochemically active soil layers overlying 5 bedrock layers, extending to a total depth of 49.5 m with bedrock starting below 8.6 m (Lawrence et al., 2008b), although this vertical discretization can be adjusted for specific applications. A detailed description of the CLM model physics and parameterizations is provided by Lawrence et al. (2019), with additional technical information available in the official model documentation (https://www.cesm.ucar.edu/models/clm/, last access: 15 October 2025). Table 1 shows a side-by-side comparison of the key structural and parametric formulations in JSBACH and CLM. Since both the models use different precipitation partitioning schemes (Table 1), small differences in simulated snow related variables are expected, particularly during transitional seasons when near-surface air temperatures fall within the model specific rain-snow threshold range.
(Niu and Yang, 2006)(Niu and Yang, 2006)De Vries (1953)De Vries (1953)Johansen (1977)Farouki (1981)(Anderson, 1976)Calonne et al. (2011)Jordan (1991)(Wigmosta et al., 1994)(Lawrence et al., 2019)Table 1Key structural and parametric differences in soil and snow process representations between JSBACH and CLM.
2.2 Standalone model setup
To study frozen soil processes, JSBACH and CLM were implemented in standalone mode to enable detailed evaluation of their frozen soil representations without feedbacks from coupled atmospheric dynamics. The models were forced with ERA5 reanalysis (Hersbach et al., 2020) data at a 3-hourly temporal resolution, providing globally consistent atmospheric forcing at a spatial resolution of 31 km, which ensures reliable surface meteorological conditions for multi-decadal simulations. For CLM, the BGC-CROP biogeochemistry crop model was activated (not used for JSBACH), and the model was initialized using a standard two-phase spin up procedure (Koven et al., 2013a; Lawrence et al., 2019). First, a preindustrial spin up was performed with 400 years of accelerated decomposition followed by 800 years in normal mode to equilibrate slow carbon and nitrogen pools. Equilibrium conditions for the year 1850 were obtained by integrating over a repeating 20-year cycle (1901–1920) of Global Soil Wetness Project (GSWP3) meteorological forcing under fixed preindustrial boundary conditions. From 1901 onwards, the model was forced with GSWP3 data until 1940, followed by 10 cyclical runs using climatological ERA5 forcing for 1941–1950 to ensure a smooth transition between forcing datasets, with the final spin up state serving as the initial condition for the transient simulation from 1941 to 2022 using 3-hourly ERA5 data. In contrast, JSBACH was run continuously from 1941 to 2022 without an equivalent two-phase spin up. The analysis for both models focused on 1986–2022 to match the availability of observational datasets. The models were run on their native grids using a 30 min time step, with JSBACH on the ICON R02B06 grid (40 km resolution) and CLM on an approximately 0.5° grid (0.47° × 0.63° latitude-longitude resolution), producing daily output for analysis. Appendix Figs. B1–B2 shows the selected study region and the temporal evolution of deep soil temperature, soil moisture, and snow depth, highlighting the model spin state prior to the analysis period.
2.3 In situ observations
To assess the performance of the models and to better understand the magnitude of differences between them, we first evaluated the simulated frozen soil characteristics over the entire mid- to high-latitude region and then conducted a detailed site-level analysis using 26 meteorological stations from the All-Russian Research Institute of Hydrometeorological Information-World Data Centre (RIHMI-WDC; http://meteo.ru/data/, last access: 15 June 2024), indicated by red dots in Fig. 1, as this dataset provides uniform soil temperature records at multiple depths along with other key variables required for this study. The stations are located in regions of Russia (mainly Siberia) that experience a complete annual freeze-thaw cycle and provide continuous records from 1986, with the time series carefully screened to avoid large data gaps. If a station remains frozen to the last layer depth throughout the entire observation period, it is classified as PEFT and excluded from the analysis. Stations with only shallow or short-duration freezing were excluded because this study focuses on areas where freezing extends below the top soil, strongly influencing seasonal soil thermal and hydrological regimes and allowing effective evaluation of the models' ability to represent freeze-thaw dynamics. This ensures that the selected sites are representative of zones where freeze-thaw dynamics are most pronounced and have significant implications for land-atmosphere interactions. The following variables were used for the site-level analysis: soil temperature at multiple depths (20, 40, 80, 120, 160, 240, and 320 cm), 2 m air temperature, and snow depth. To facilitate a direct model-to-observation comparison, the gridded model output was spatially interpolated to the geographic coordinates of each station. Details of the 26 selected stations, including their three letter codes, geographic coordinates, and elevations, are provided in Table A1, where the sites are arranged in increasing order of latitude.
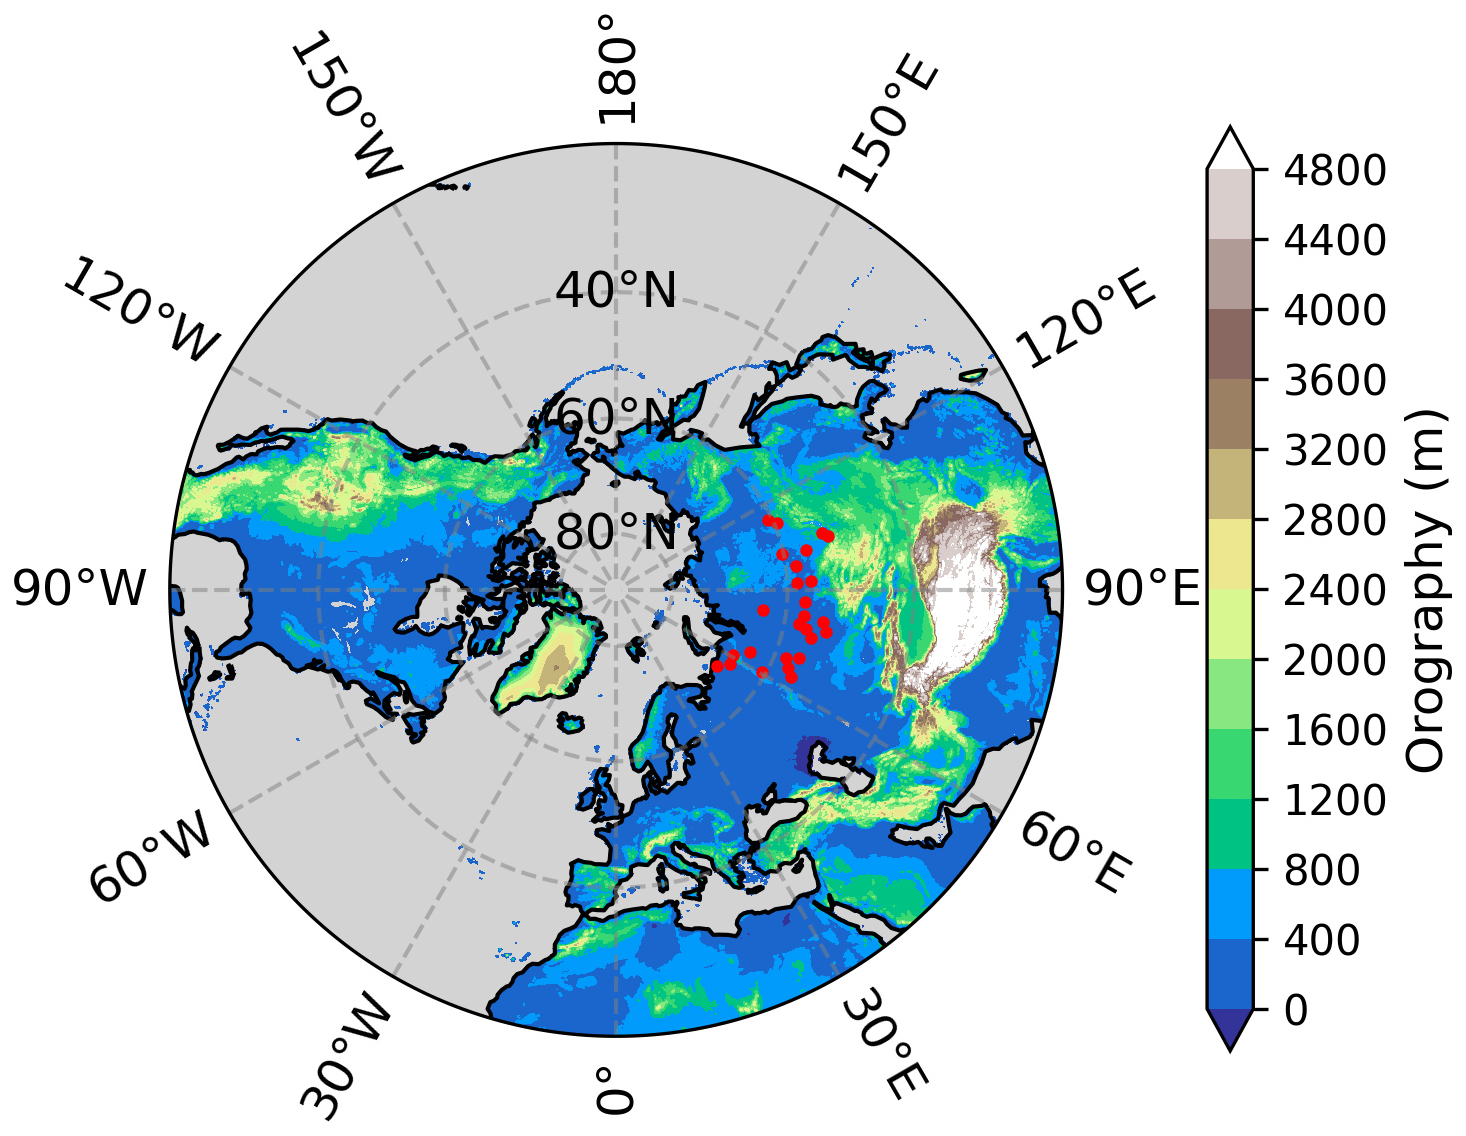
Figure 1Orography map with red dots showing 26 RIHMI-WDC observational sites used for site-level analysis.
2.4 Definition of SFG and snow cover characteristics
To quantitatively evaluate model performance in representing cold region processes during the annual freezing-thawing cycle (1 September of a given year to 31 August of the following year (Luo et al., 2020)), several parameters were determined using simulated and observed data. These are defined as follows:
-
SFG Onset and End date: Onset (freeze) occurs on the first day after 1 September when the daily mean soil temperature at 20 cm depth falls below 0 °C and remains below this threshold for at least 15 consecutive days. End (thaw) occurs when, following the onset, the daily mean soil temperature at 20 cm depth rises above 0 °C and remains above this threshold for at least 15 consecutive days.
-
SFG Duration (SFGD): The number of days between the SFG onset and end dates, representing the complete period during which the soil at the 20 cm depth remains frozen.
-
Snow cover Onset and End date: Onset (snow accumulation) occurs on the first day when snow depth exceeds 5 cm (Akyurek et al., 2023) and is maintained for at least the following 10 consecutive days (Bender et al., 2020). End (snow disappearance) occurs when, following the onset, snow depth falls below 5 cm and remains below this threshold for at least 10 consecutive days.
-
Snow Cover Duration (SCD): This is the total period of persistent snow cover, calculated as the number of days between the snow cover onset date and end date, when snow depth falls below the 5 cm threshold at the end of the season.
-
Maximum Freeze Depth (MFD): The MFD for each year is estimated using the approach of Frauenfeld et al. (2004), based on monthly soil temperature profiles. It is defined as the maximum depth of the 0 °C isotherm within the annual freeze-thaw period. This parameter provides an index of the intensity of seasonal freezing. It should be noted that MFD differs from active layer thickness (ALT) as MFD represents the maximum depth of soil freezing in SFG, while ALT refers to the annually thawed layer in PEFT regions. In addition to the MFD, the annual air freezing index (FI) and thawing index (TI) provide an indication of the intensity of the seasonal freeze-thaw cycle that governs SFG. FI is calculated as the cumulative sum of daily mean 2 m air temperatures below 0 °C during the freezing period, considered from 1 July of a given year to 30 June of the following year. TI is the cumulative sum of daily mean 2 m air temperatures above 0 °C during the thawing period, defined from 1 January to 31 December of the same year (Zhang et al., 2005; Steurer and Crandell, 1995).
2.5 Evaluation metrics
The evaluation of model performance against in situ observations was conducted using the following standard statistical metrics: the Root Mean Square Error (RMSE), Mean Bias Error (MBE), and Pearson Correlation Coefficient (R). The RMSE quantifies the average magnitude of the differences (errors) between simulated and observed values, the MBE indicates the systematic tendency of the model to over- or under-estimate observations, and R measures the strength and direction of the linear relationship between simulated and observed values. These metrics are defined as:
where Si and Oi denote the simulated and observed values at time step i, and are their respective means, and N is the total number of data points.
In addition to the above metrics, the timing and duration of SFG and snow cover characteristics were evaluated using the median bias and interquartile range (IQR), which describe the central tendency and spread of model deviations from observations. These metrics were selected because they are less sensitive to outliers and provide a more representative summary of model performance across stations and years with varying distributions. The difference between simulated and observed values was calculated for each station and year for each SFG characteristic as:
where denotes the stations and denotes the years. These differences were then pooled across all stations to form a single dataset of deviations. The overall median bias was computed as the median of all pooled differences:
and the IQR, representing the spread of model deviations, was defined as:
where Q75 and Q25 are the 75th and 25th percentiles of the pooled distribution, respectively. This approach provides an overall assessment of model performance across all stations and years, capturing both the systematic bias and the variability in simulating SFG characteristics.
2.6 JSBACH snow aging parameterization
JSBACH simulation output exhibited unrealistic cold soil temperatures relative to CLM and ERA5L over cold regions of the Northern Hemisphere, with the underlying cause of this bias and the corresponding solution documented in a dedicated technical report archived on Zenodo (see code availability). A detailed investigation revealed that one major cause of this cold bias was the old snow densification scheme (hereafter referred to as the old setup), which employed a constant decay factor (Verseghy, 1991). This formulation caused overly rapid snow densification and consequently shallower snowpacks. The reduced snow depth critically diminished the snowpack's insulating capacity, allowing the soil to be more strongly influenced by extreme cold air temperatures and leading to excessive soil cooling during winter. This systematic behavior pointed to a deficiency in the model's representation of snow processes. To address this issue, a revised snow aging formulation (hereafter referred to as the new setup) was implemented by introducing a temperature-dependent decay factor (Heise et al., 2006). This modification allows snow densification to vary dynamically with snow temperature, improving the representation of snow aging and the temporal evolution of snow density and thickness. Figure B3 illustrates the difference in the seasonal climatological mean (1986–2022) of snow depth and soil temperature at 20 cm depth between the new and old setups. The new parameterization increases snow depth by up to 15–20 cm in cold regions, thereby enhancing the simulated snow insulation effect resulting from increased snowpack and raising soil temperatures by approximately 10–20 °C. In contrast, some coastal regions exhibit a reduction in snow depth with almost no corresponding change in soil temperature, likely due to the strong dependence on snow temperature, which may lead to reduced snow accumulation under humid, cold coastal conditions. Overall, this change has improved JSBACH's performance by making its simulated snow and soil thermal states more similar to those of CLM and ERA5L. The updated snow parameterization has since been incorporated into the ICON model repository, and all subsequent analyses presented in this study are based on the new setup.
3.1 Model performances
3.1.1 Frozen ground distribution
Accurately simulating the spatial extent of frozen ground provides a fundamental test of a LSM's ability to represent the cold region soil thermal state. Figure 2 shows the simulated frozen ground distribution, classified into PEFT and SFG, by ERA5L, JSBACH, and CLM. Here, PEFT is defined as grid cells where at least one soil layer remains frozen year-round in >50 % of the 1986–2022 simulation years (i.e., ≥19 of 37 years), representing persistent frozen-ground conditions in a multi-decadal framework. Although the International Permafrost Association (IPA) conventionally defines PEFT as ground remaining below 0 °C for two or more consecutive years (Brown et al., 1997), alternative diagnostics are commonly used in gridded model assessments (Steinert et al., 2024; Langer et al., 2024; Gruber, 2012; Slater and Lawrence, 2013; Burke et al., 2020). SFG denotes areas experiencing seasonal freezing for at least 15 d yr−1. The resulting distributions were evaluated against reference values reported by Ran et al. (2022) for a PEFT extent of 13.60–18.97 × 10⁶ km2 and by Zhang (2003) for an SFG extent of 48.12×10⁶ km2. Comparison of simulated frozen ground extent reveals notable inter-model differences relative to the reference distribution. ERA5L simulates a PEFT area of 7.26×10⁶ km2, representing only 38-53 % of the reference range and indicating a substantial underestimation of year-round soil freezing conditions. In contrast, JSBACH simulates 13.76×10⁶ km2 of PEFT, which is close to the lower bound of the reference range, suggesting a more realistic representation of year-round freezing conditions, while CLM demonstrates intermediate performance, simulating 10.63×10⁶ km2 of PEFT, which is below the reference range. For SFG, both ERA5L (47.35×10⁶ km2) and JSBACH (49.76×10⁶ km2) produce estimates that are in close agreement with the reference value, with ERA5L underestimating and JSBACH overestimating the extent by about km2. CLM simulates an SFG extent of 49.4×10⁶ km2, which is similar to that simulated by JSBACH. Spatial analysis reveals that CLM tends to classify the Tibetan Plateau as SFG rather than PEFT, which is inconsistent with known high-altitude PEFT distributions in this region (Cao et al., 2023; Ran et al., 2021). This misclassification leads to reduced PEFT extent and improving the representation of PEFT processes over the Tibetan Plateau would likely bring CLM’s simulated extents closer to reference estimates while enhancing the reliability of its frozen ground simulation. Overall, among the three models, JSBACH provides the most realistic representation of frozen ground distribution, capturing both PEFT and SFG extents in closest agreement with Ran et al. (2022). While CLM shows potential, its performance is limited by the need for improved soil thermal parameterization, whereas ERA5L is mainly constrained by its shallow soil structure, restricting its capability to represent deep PEFT dynamics (Cao et al., 2020, 2022).
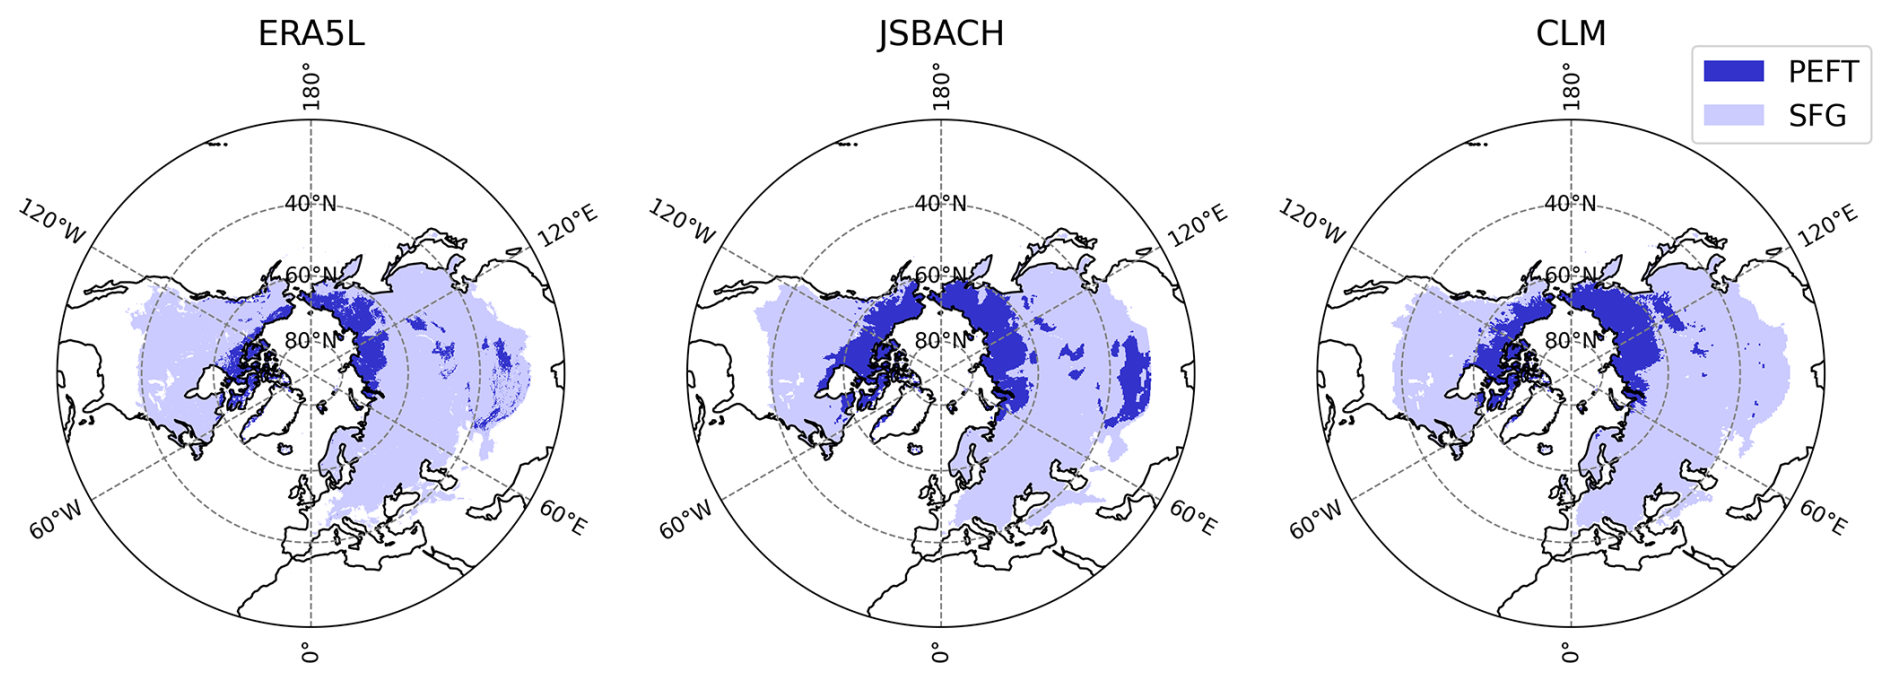
Figure 2Distribution of frozen ground classified into SFG and PEFT regions based on modeled soil temperatures from ERA5L, JSBACH, and CLM. Grid cells are classified as SFG when frozen for at least 15 d yr−1, and as PEFT when frozen year-round in any soil layer for more than 50 % of the years from 1986 to 2022.
3.1.2 Spatial patterns
This section examines spatial variations in simulated soil moisture (SM), soil temperature (ST), and snow depth (SD) to evaluate inter-model consistency and identify key differences in the representation of variables governing frozen ground dynamics. A comparative assessment of JSBACH and CLM, alongside ERA5L, provides a systematic evaluation of the relative performance of each model, highlighting their respective strengths, limitations, and sources of bias in simulating cold region soil and snow processes. Figures 3, 4, and 5 presents the spatial climatology (1986–2022) of SM, ST at 20 cm depth, and SD, respectively, averaged for the four seasons over mid- to high-latitude regions. Analysis of total SM, defined here as the combined liquid and ice content in the top 20 cm, reveals distinct hydrological behaviors among the models. ERA5L and JSBACH exhibit comparable magnitudes of total SM in the upper 20 cm and show minimal seasonal variability, whereas CLM simulate more pronounced seasonal cycles in total SM. JSBACH and CLM separately represent soil liquid and ice contents, which are not provided individually in ERA5L. In cold regions, CLM shows a larger fraction of total SM in the frozen phase compared to JSBACH (Fig. B4), indicating stronger near-surface soil freezing. Comparison of the top layer liquid SM with ESA-CCI satellite observations (Fig. B5) shows that CLM generally underestimates liquid SM across boreal and arctic regions. Although summer thaw increases liquid water content, autumn SM remains lower than observed, suggesting persistently drier near-surface conditions before freeze-up, which may further promote rapid freezing in autumn. The spatial patterns of ST at 20 cm depth further highlight model disparities. CLM exhibits relatively warm ST over the Tibetan Plateau, corresponding to its misclassification of PEFT as SFG in the same region, although its cold soil temperature extent in other regions during winter appears generally reasonable. These warmer conditions may be attributed to the soil thermal conductivity scheme in CLM, which has been reported to perform less effectively over soils containing broken pieces of stones and gravels, such as those prevalent on the Tibetan Plateau (Pan et al., 2024; Yang et al., 2021, 2022). JSBACH captures the overall extent of cold STs well, reproducing frozen conditions across high-latitude regions during winter and the subsequent thaw in spring and summer. However, without direct comparison with observations, it remains uncertain whether JSBACH systematically over- or under-estimates ST in specific regions. ERA5L simulates less cold ST than both JSBACH and CLM across high-latitude regions, particularly during winter and spring. The comparatively warmer soil conditions are consistent with its underestimation of PEFT extent and likely originates from its soil or snow parameterizations within the ERA5L framework. Previous studies have also reported similar limitations of ERA5L in representing near-surface thermal conditions during cold seasons (Cao et al., 2020, 2022). Figure 6 illustrates model performance in simulating SD across the mid- to high-latitude Northern Hemisphere. JSBACH simulates shallower snowpacks than the other two models across most regions, even after the improvements introduced in Sect. 2.6. The reduced SD likely strengthens soil-atmosphere coupling, allowing greater surface heat loss and contributing to colder STs, which can be confirmed through the site-level analysis (Sect. 3.2). In contrast, CLM produces SD patterns broadly similar to ERA5L, though with higher values in several regions, potentially enhancing insulation and reducing soil freezing intensity. For validation purposes, ERA5 provides more reliable SD estimates than ERA5L because it assimilates both ground-based and satellite snow observations (Cao et al., 2022; Kouki et al., 2023; Sarpong and Nazemi, 2025). A comparison between ERA5L and ERA5 (Fig. B6) further indicates that ERA5L tends to overestimate SD during winter and spring.
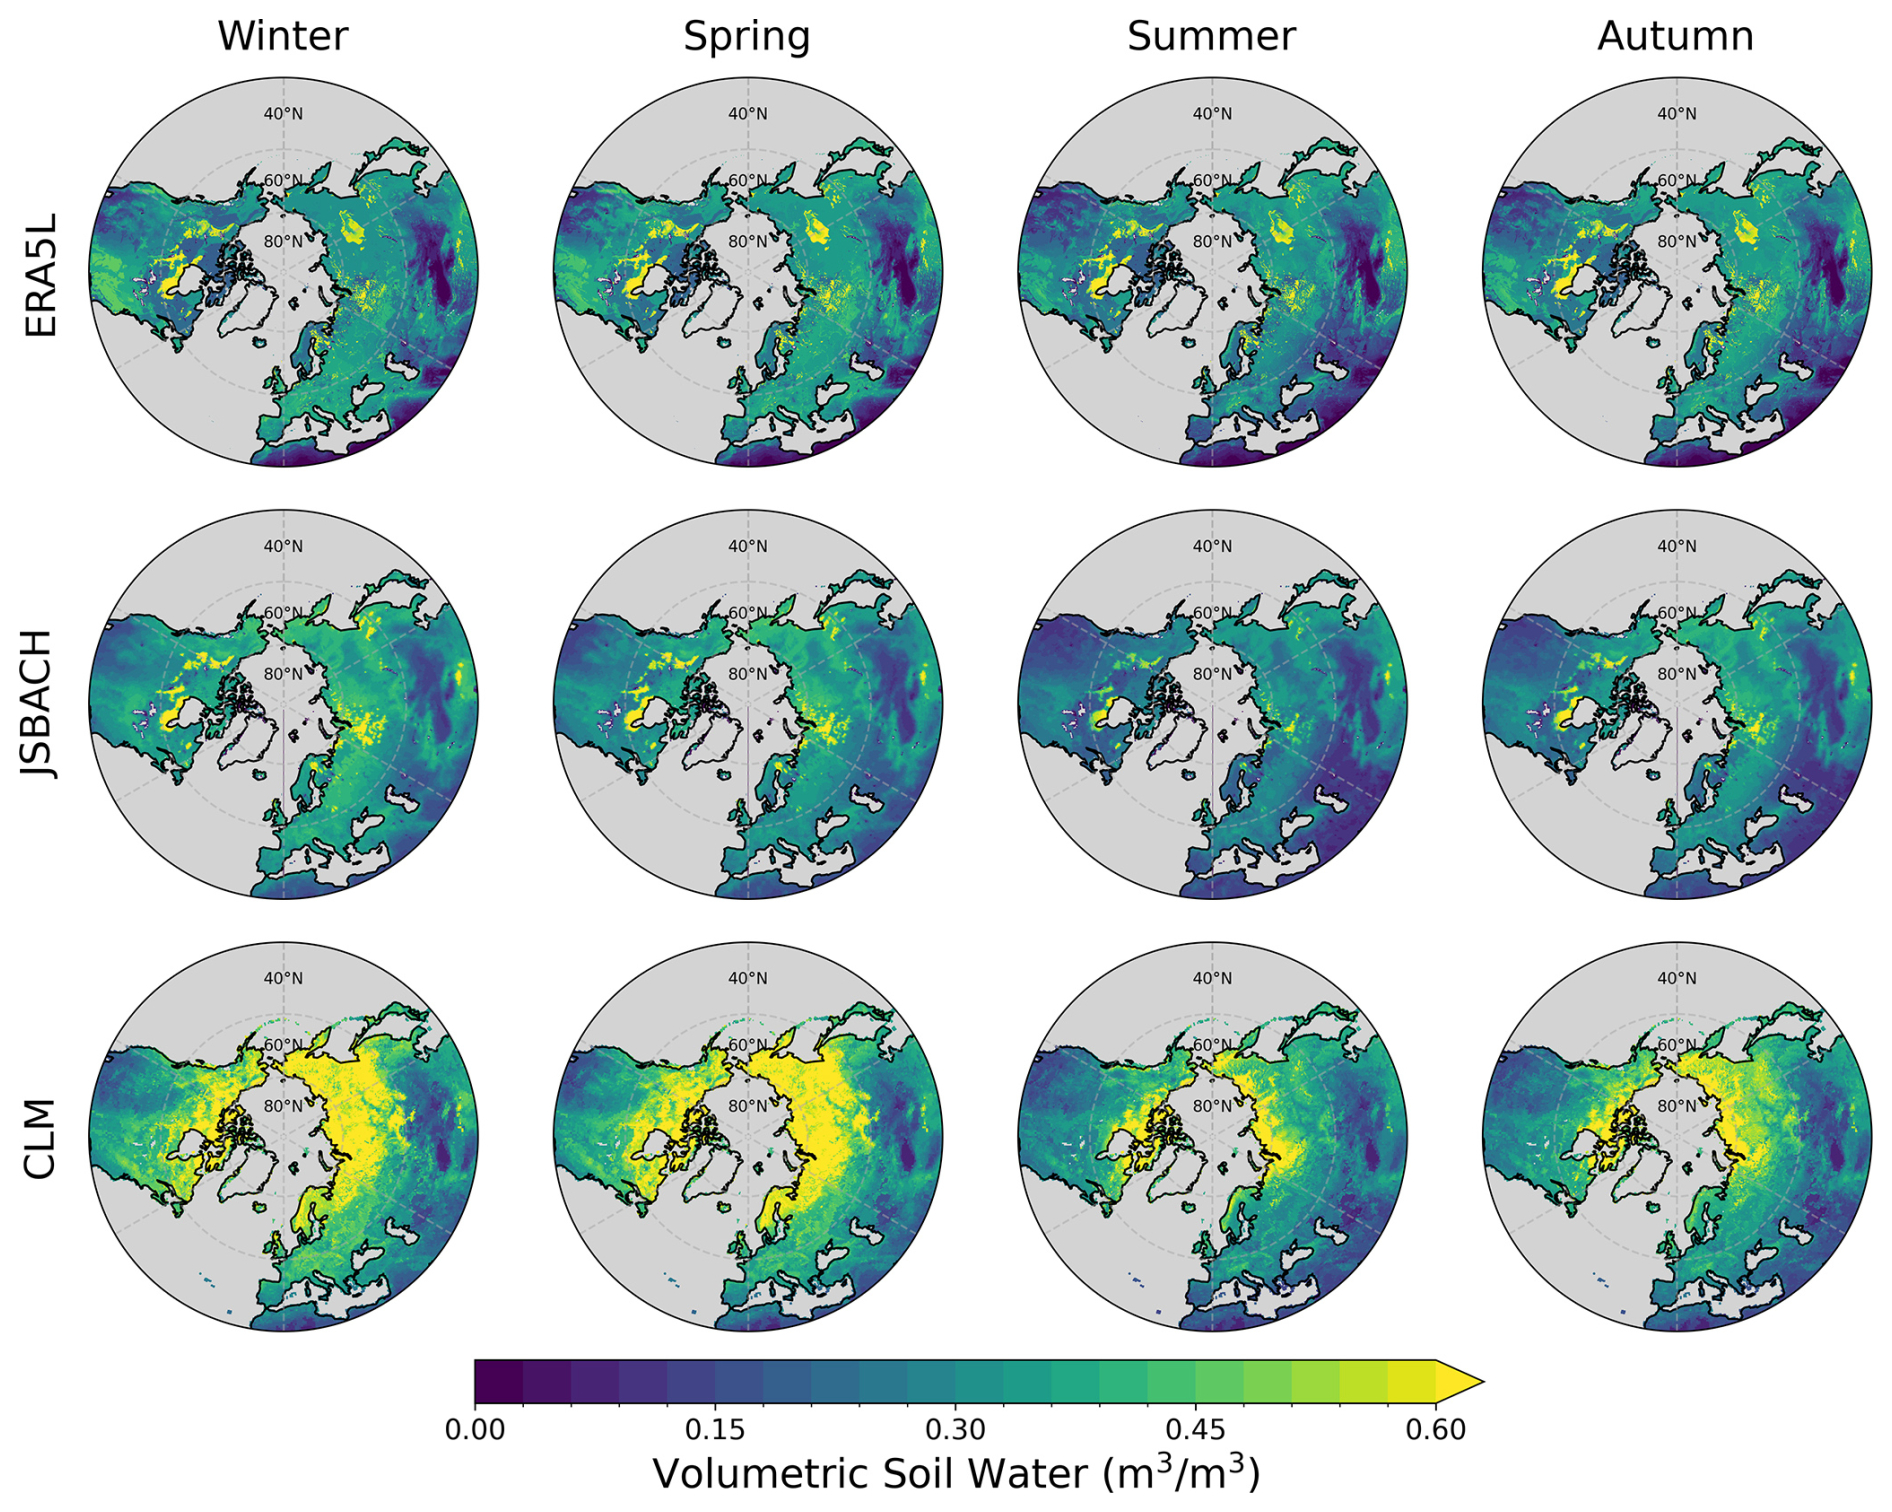
Figure 3Seasonal climatology (1986–2022) of total soil moisture (liquid + ice) at 20 cm depth across Northern Hemisphere mid- to high-latitude regions (30–90° N), as simulated by ERA5L (top row), JSBACH (middle row), and CLM (bottom row).
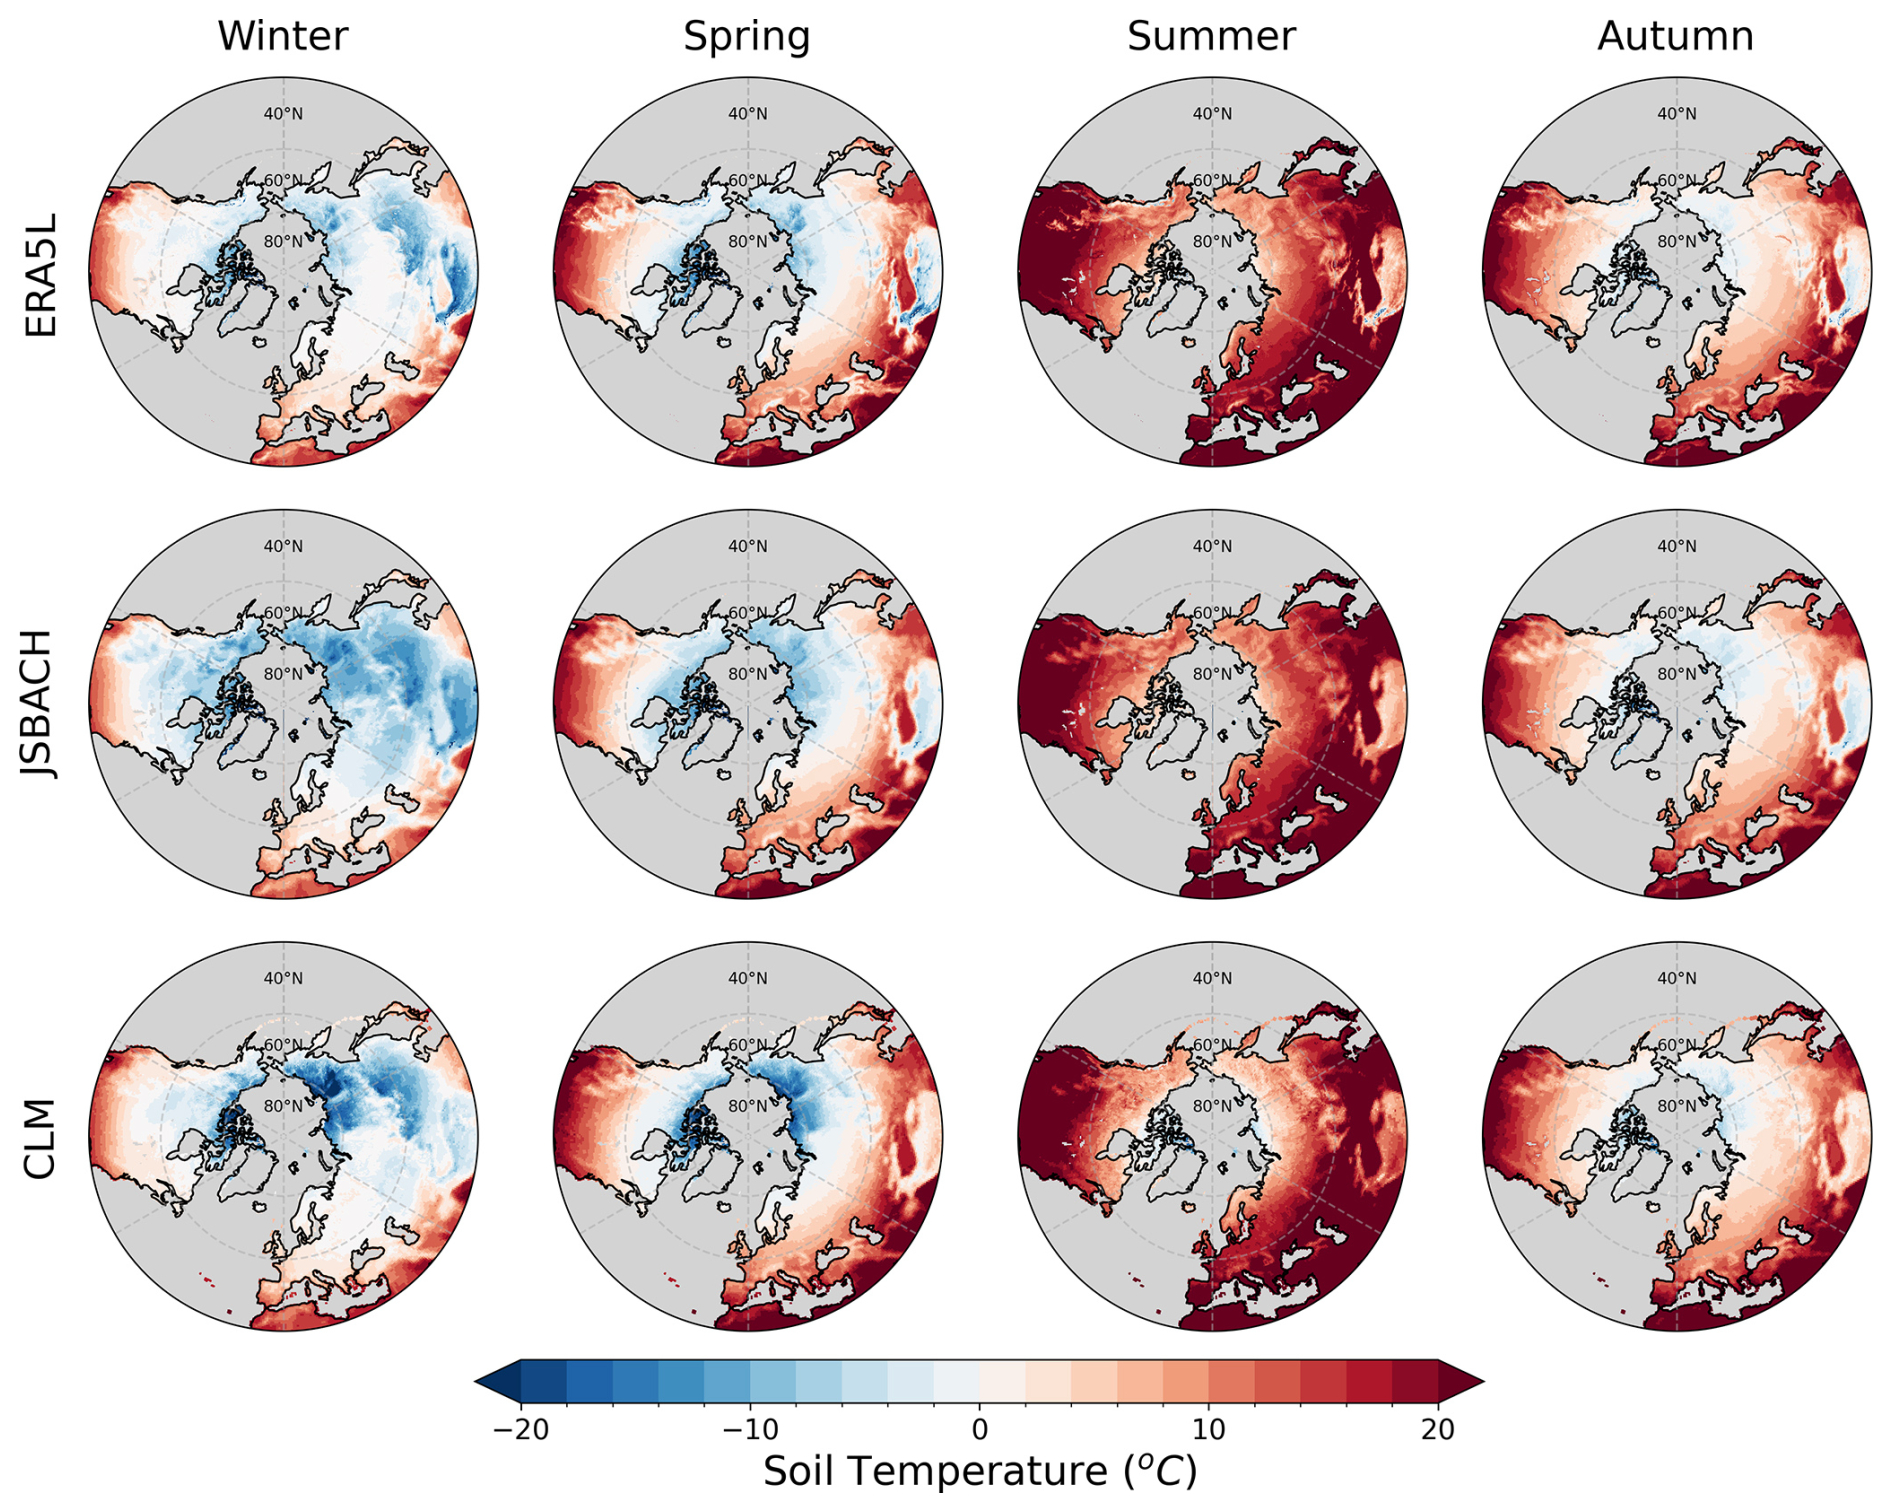
Figure 4Same as Fig. 3 but for soil temperature at 20 cm depth.
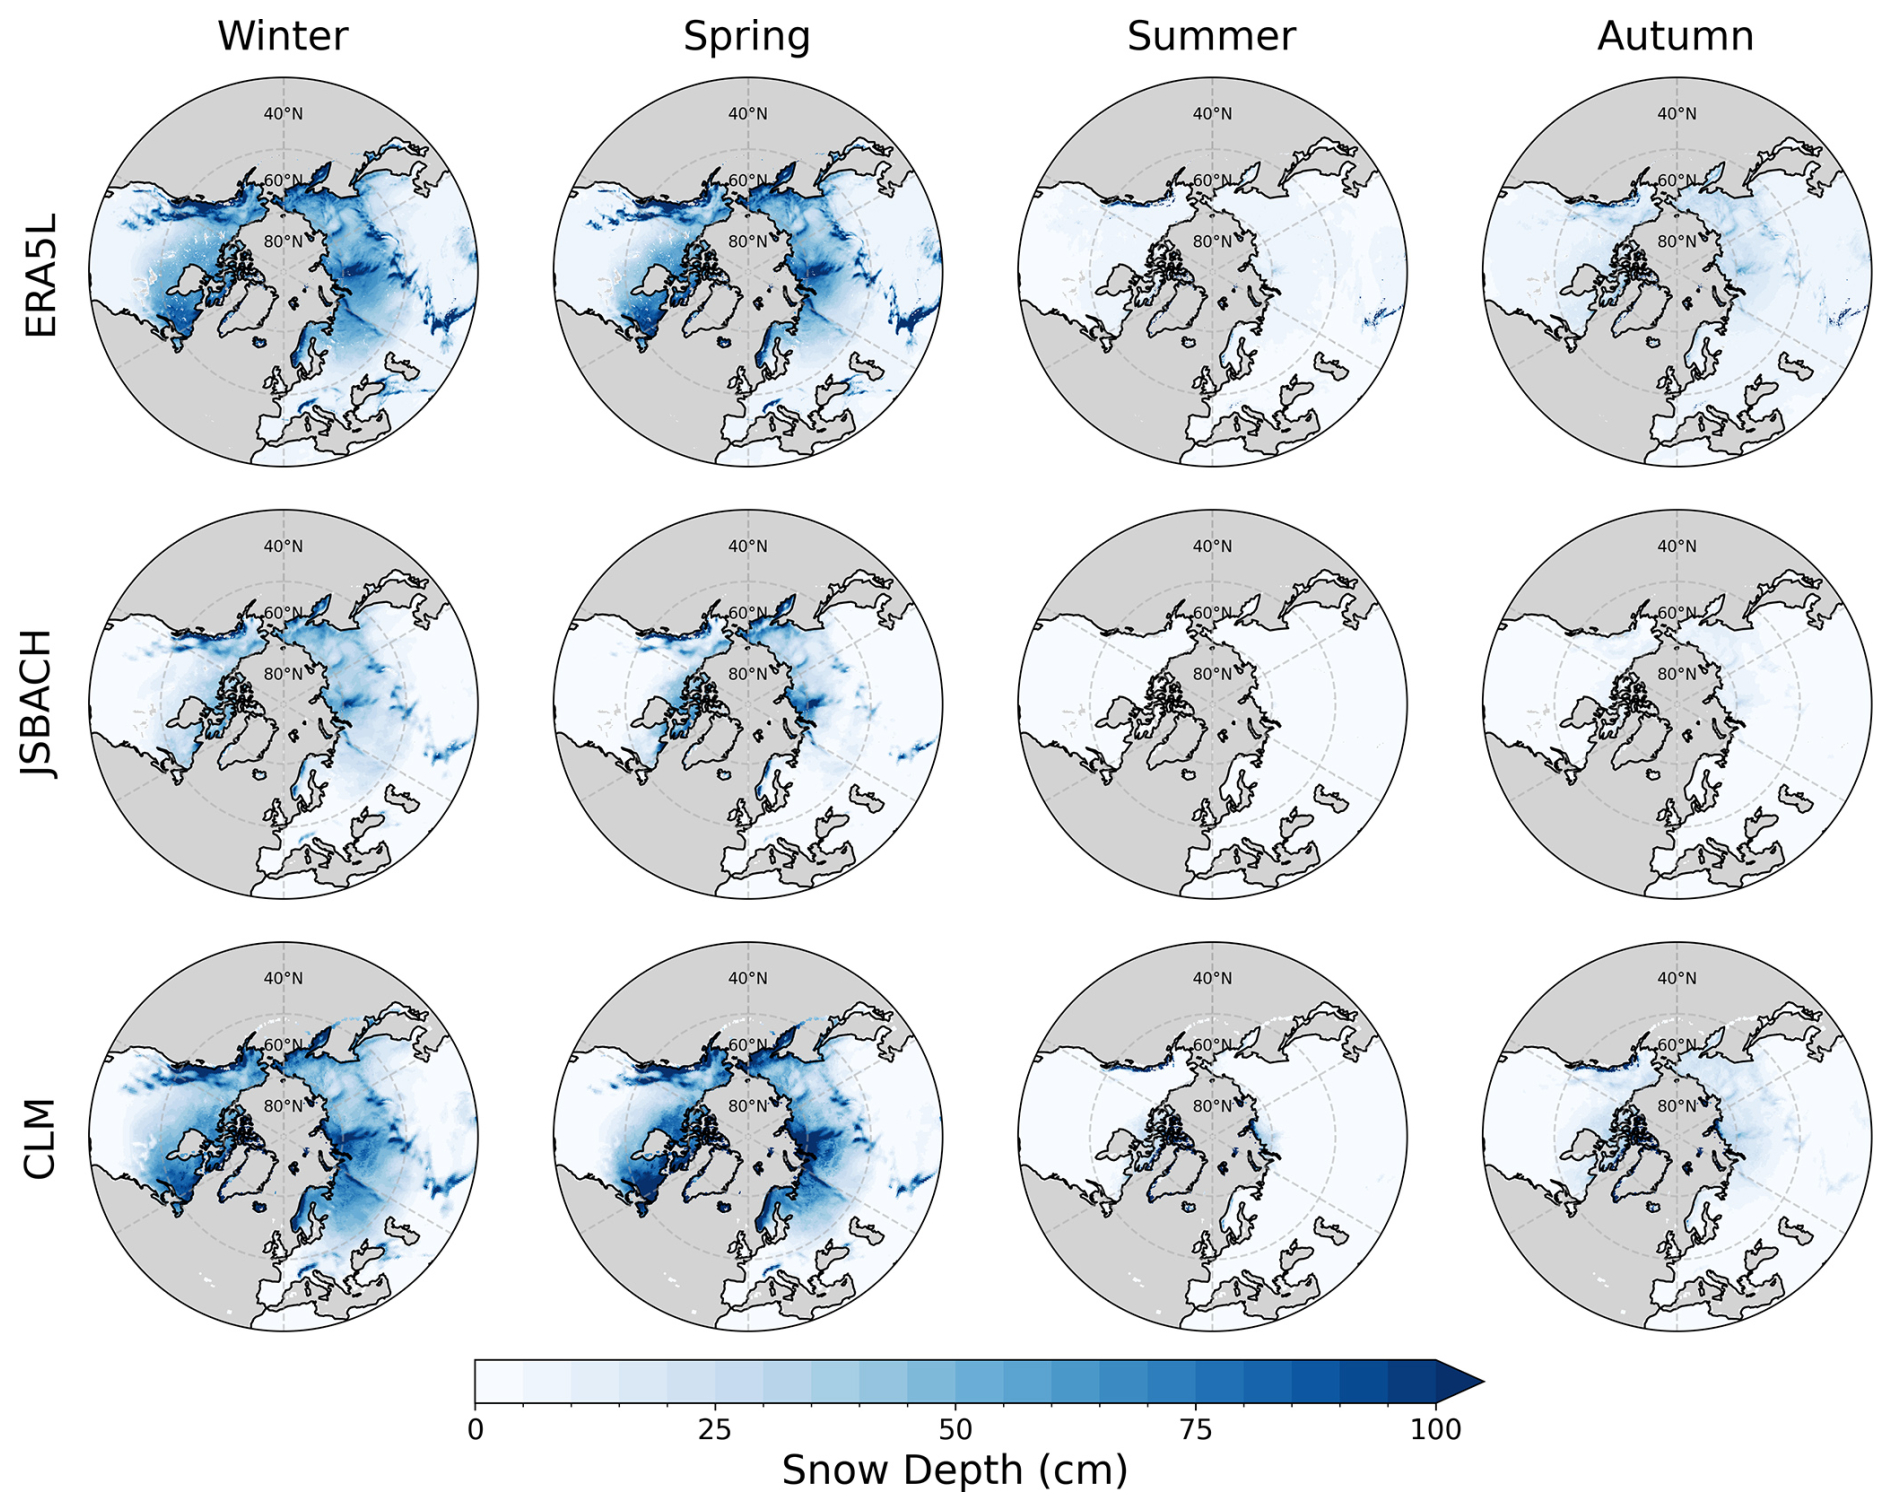
Figure 5Same as Fig. 3 but for snow depth.
3.2 Site-level Evaluation
3.2.1 Comparison of soil temperature, snow depth and air temperature
This section complements the spatial analysis by providing a direct observation-based evaluation of model performance through comparison with in situ data from 26 stations across Russia (shown in Fig. 1). Figure 6 shows box plots of the monthly means of 2 m air temperature (AT), SD, and ST at 20 cm depth during the winter season, along with the corresponding statistical metrics (RMSE, MBE, and R) computed across all stations. Such comparative analyses remain valuable for identifying consistent model deficiencies and systematic performance characteristics. The comparison of AT indicates that JSBACH demonstrates the lowest error metrics (RMSE = 1 °C), followed by ERA5L (RMSE = 1.3 °C) and CLM (RMSE = 3.6 °C). Although all models were forced with same atmospheric fields from ERA5, variations in AT arise due to model specific adjustments or corrections applied within their respective structures. Both ERA5L and CLM temperatures were adjusted using lapse rate correction, and in CLM the 2 m air temperature includes surface roughness length and displacement height. JSBACH exhibits low AT errors but shows a cold soil bias (MBE = −3.7 °C, RMSE = 4.9 °C), likely linked to insufficient snow cover (MBE = −14.2 cm, RMSE = 18.9 cm), that reduces snow insulation and increases heat loss from the soil. In contrast, CLM exhibits a cold air temperature bias (MBE = −3.4 °C) and excessive snow accumulation (MBE = +12.2 cm, RMSE = 18.5 cm), while showing a smaller soil temperature bias (MBE = +0.1 °C, RMSE = 2.9 °C) relative to the other two models. The large RMSE and MBE values associated with SD across all models highlight the persistent challenge of accurately representing snow accumulation and melt processes at the observation sites. These discrepancies in simulated snow cover directly influence the soil thermal regime through snow-soil thermal coupling, which is examined in the subsequent sections. The inter-model differences mainly arise from how each model represents key physical processes such as soil heat conduction, snow insulation, and surface energy exchange, rather than from differences in spatial resolution alone. This study recognizes the potential spatial representativeness issues that arise when comparing gridded model outputs with point based in situ observations. Differences in spatial resolution, grid-cell heterogeneity, initial state, and boundary condition datasets describing soil properties likely contribute to some of the simulated biases. In addition, differences in vertical soil discretization can affect heat and water transport in the soil column. Koven et al. (2013b) and Slater and Lawrence (2013) identified vertical resolution, together with snow insulation and land surface physics, as key sources of uncertainty in simulating cold-region soil thermal states, while González-Rouco et al. (2021) demonstrated that soil column depth alone can substantially influence long-term subsurface temperature dynamics. Therefore, the inter-model differences reported in this study should be interpreted as reflecting the combined influence of structural configuration and physical process representation, rather than being attributable to either factor in isolation. Furthermore, since all simulations are driven by the same ERA5 meteorological forcing and frozen soil dynamics in high latitude regions are known to be sensitive to forcing uncertainties (Guo et al., 2012; Lawrence et al., 2012), potential biases in ERA5, particularly related to snow in mid to high latitude regions (Kouki et al., 2023; Bian et al., 2019; Guo and Yang, 2022), may introduce a common baseline error. Although such scale mismatches and forcing uncertainties are unavoidable limitations in global model configurations, the consistent differences observed across sites still provide meaningful information about the systematic strengths and weaknesses of each model and reflect contrasts in the internal snow and soil process representations of the models.
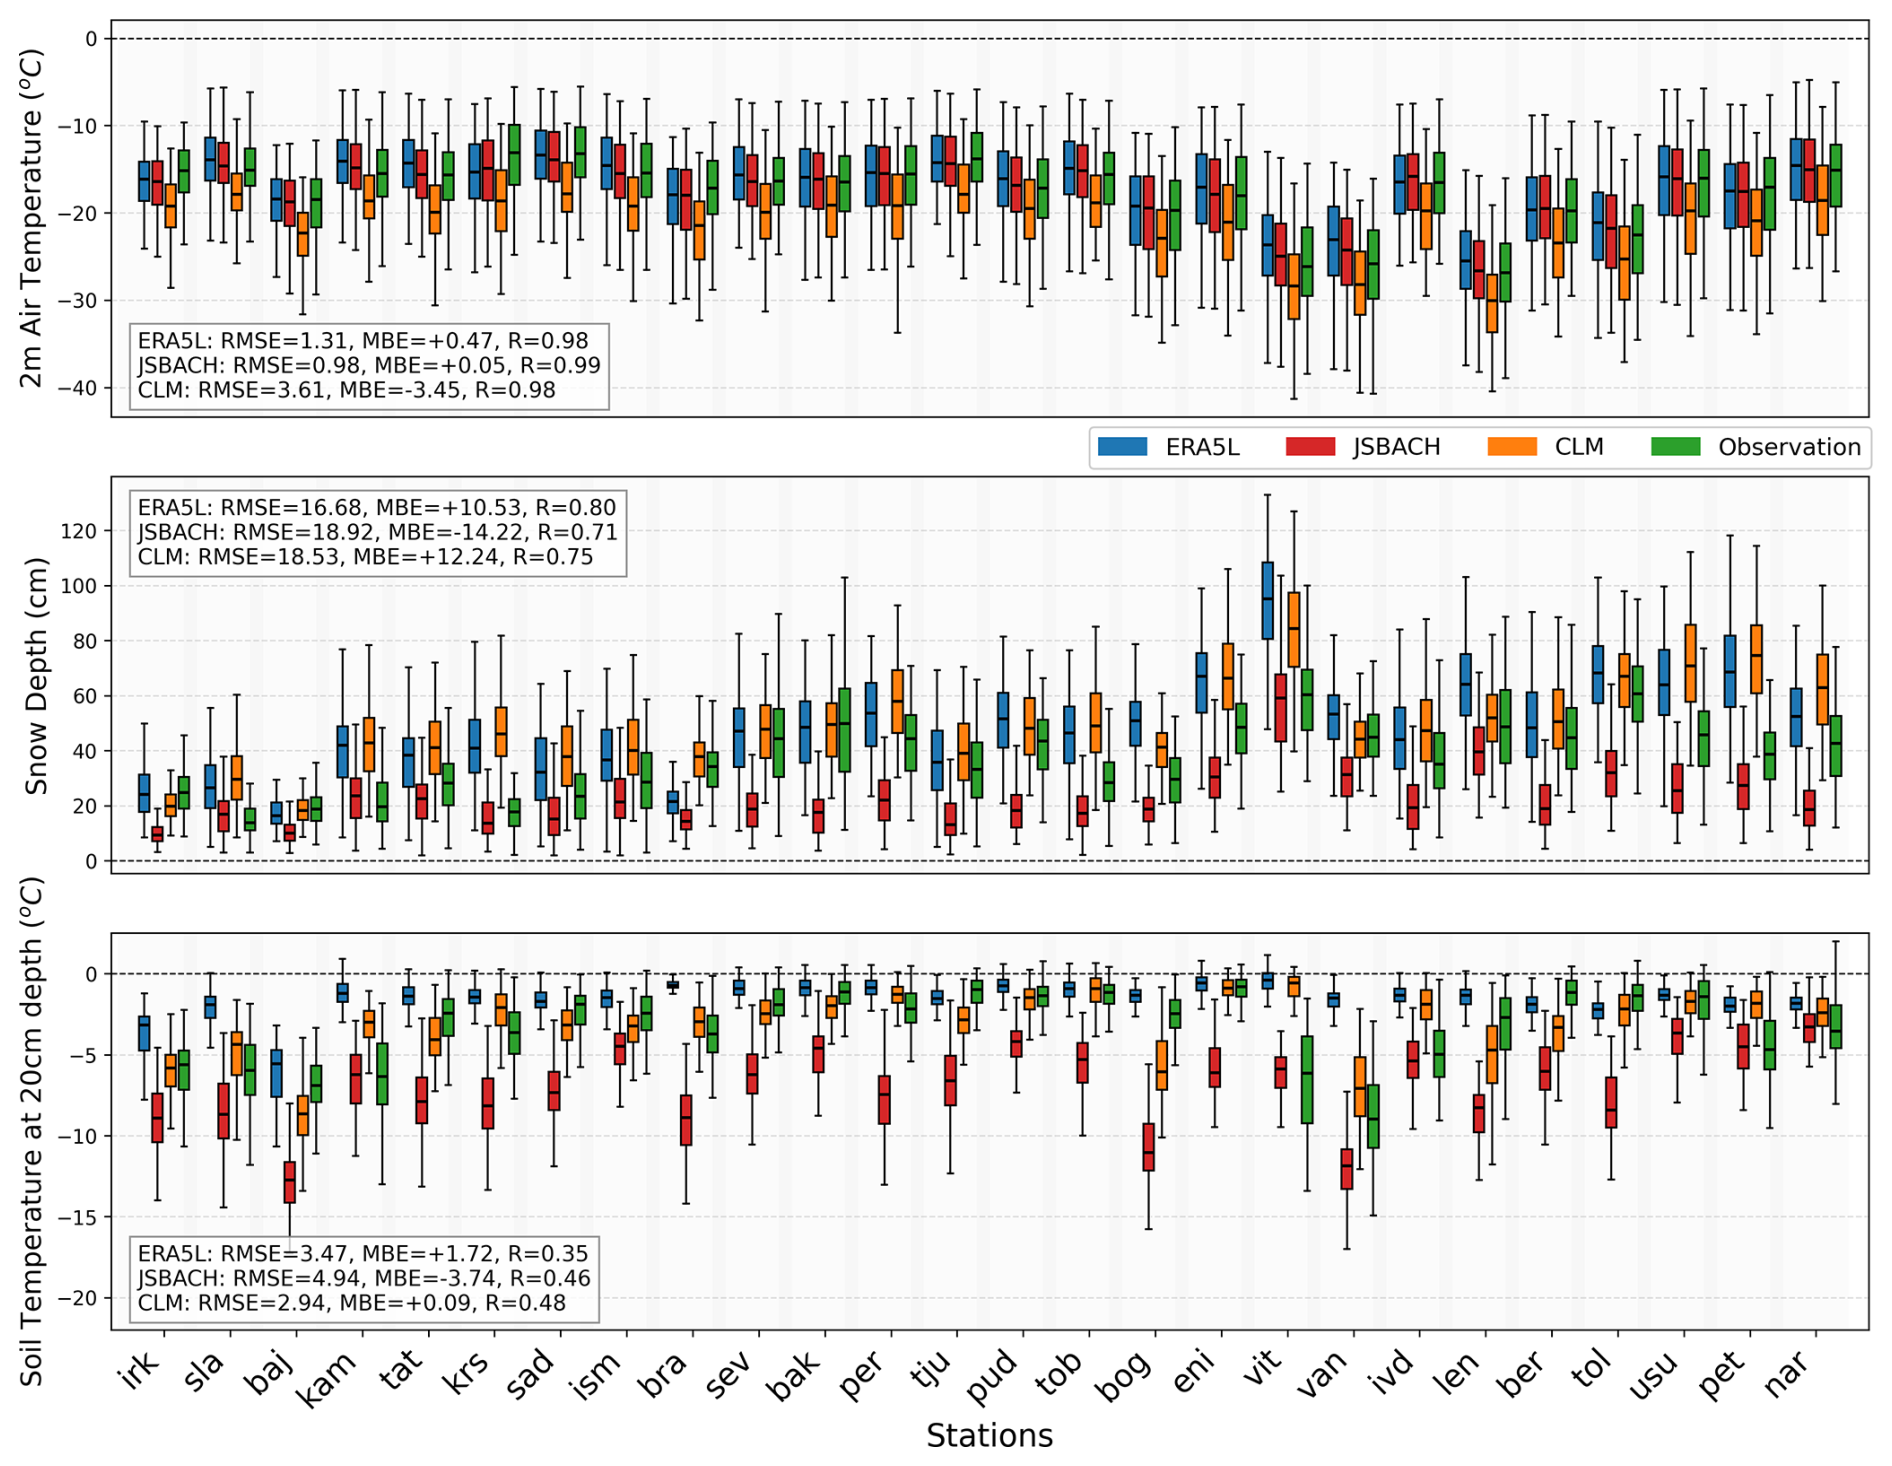
Figure 6Comparison of simulated and observed monthly mean AT, SD, and ST at 20 cm depth during the cold season (DJF) across 26 stations. Box plots show the distribution of monthly values, and the corresponding statistical metrics: RMSE, MBE, and R are presented for ERA5L (blue), JSBACH (red), and CLM (orange) relative to observations (green).
3.2.2 Snow insulation effect
The systematic bias in SD presented in previous section has important implications for surface energy exchange and soil thermal regulation, as the insulating capacity of the snowpack strongly influences winter STs (Sect. 2.6). JSBACH's underestimation of SD and the overestimation by CLM and ERA5L suggest that differences in simulated STs may arise not only from atmospheric forcing or soil parameterizations but also from variations in the snowpack's insulation capacity. This relationship was also evident in Sect. 2.6, where increasing SD produced notable changes in ST. To assess the snow insulation effect, we adopted the approach used in earlier model evaluations by Wang et al. (2016). Figure 7 (upper panel) shows the relationship between the temperature difference between soil and air (TDSA) and SD using monthly mean values during the cold season. Observations indicate that TDSA increases with snow accumulation and stabilizes around 35–45 cm, beyond which additional SD exerts little influence on the temperature offset. ERA5L reproduces the observed relationship between SD and thermal insulation, whereas CLM tends to overestimate the insulating effect. A lack of data under thin snow conditions (0–5 cm) is also evident in CLM, while JSBACH underestimates the insulation effect, exhibiting a weaker TDSA-SD relationship associated with its generally thinner snow cover.
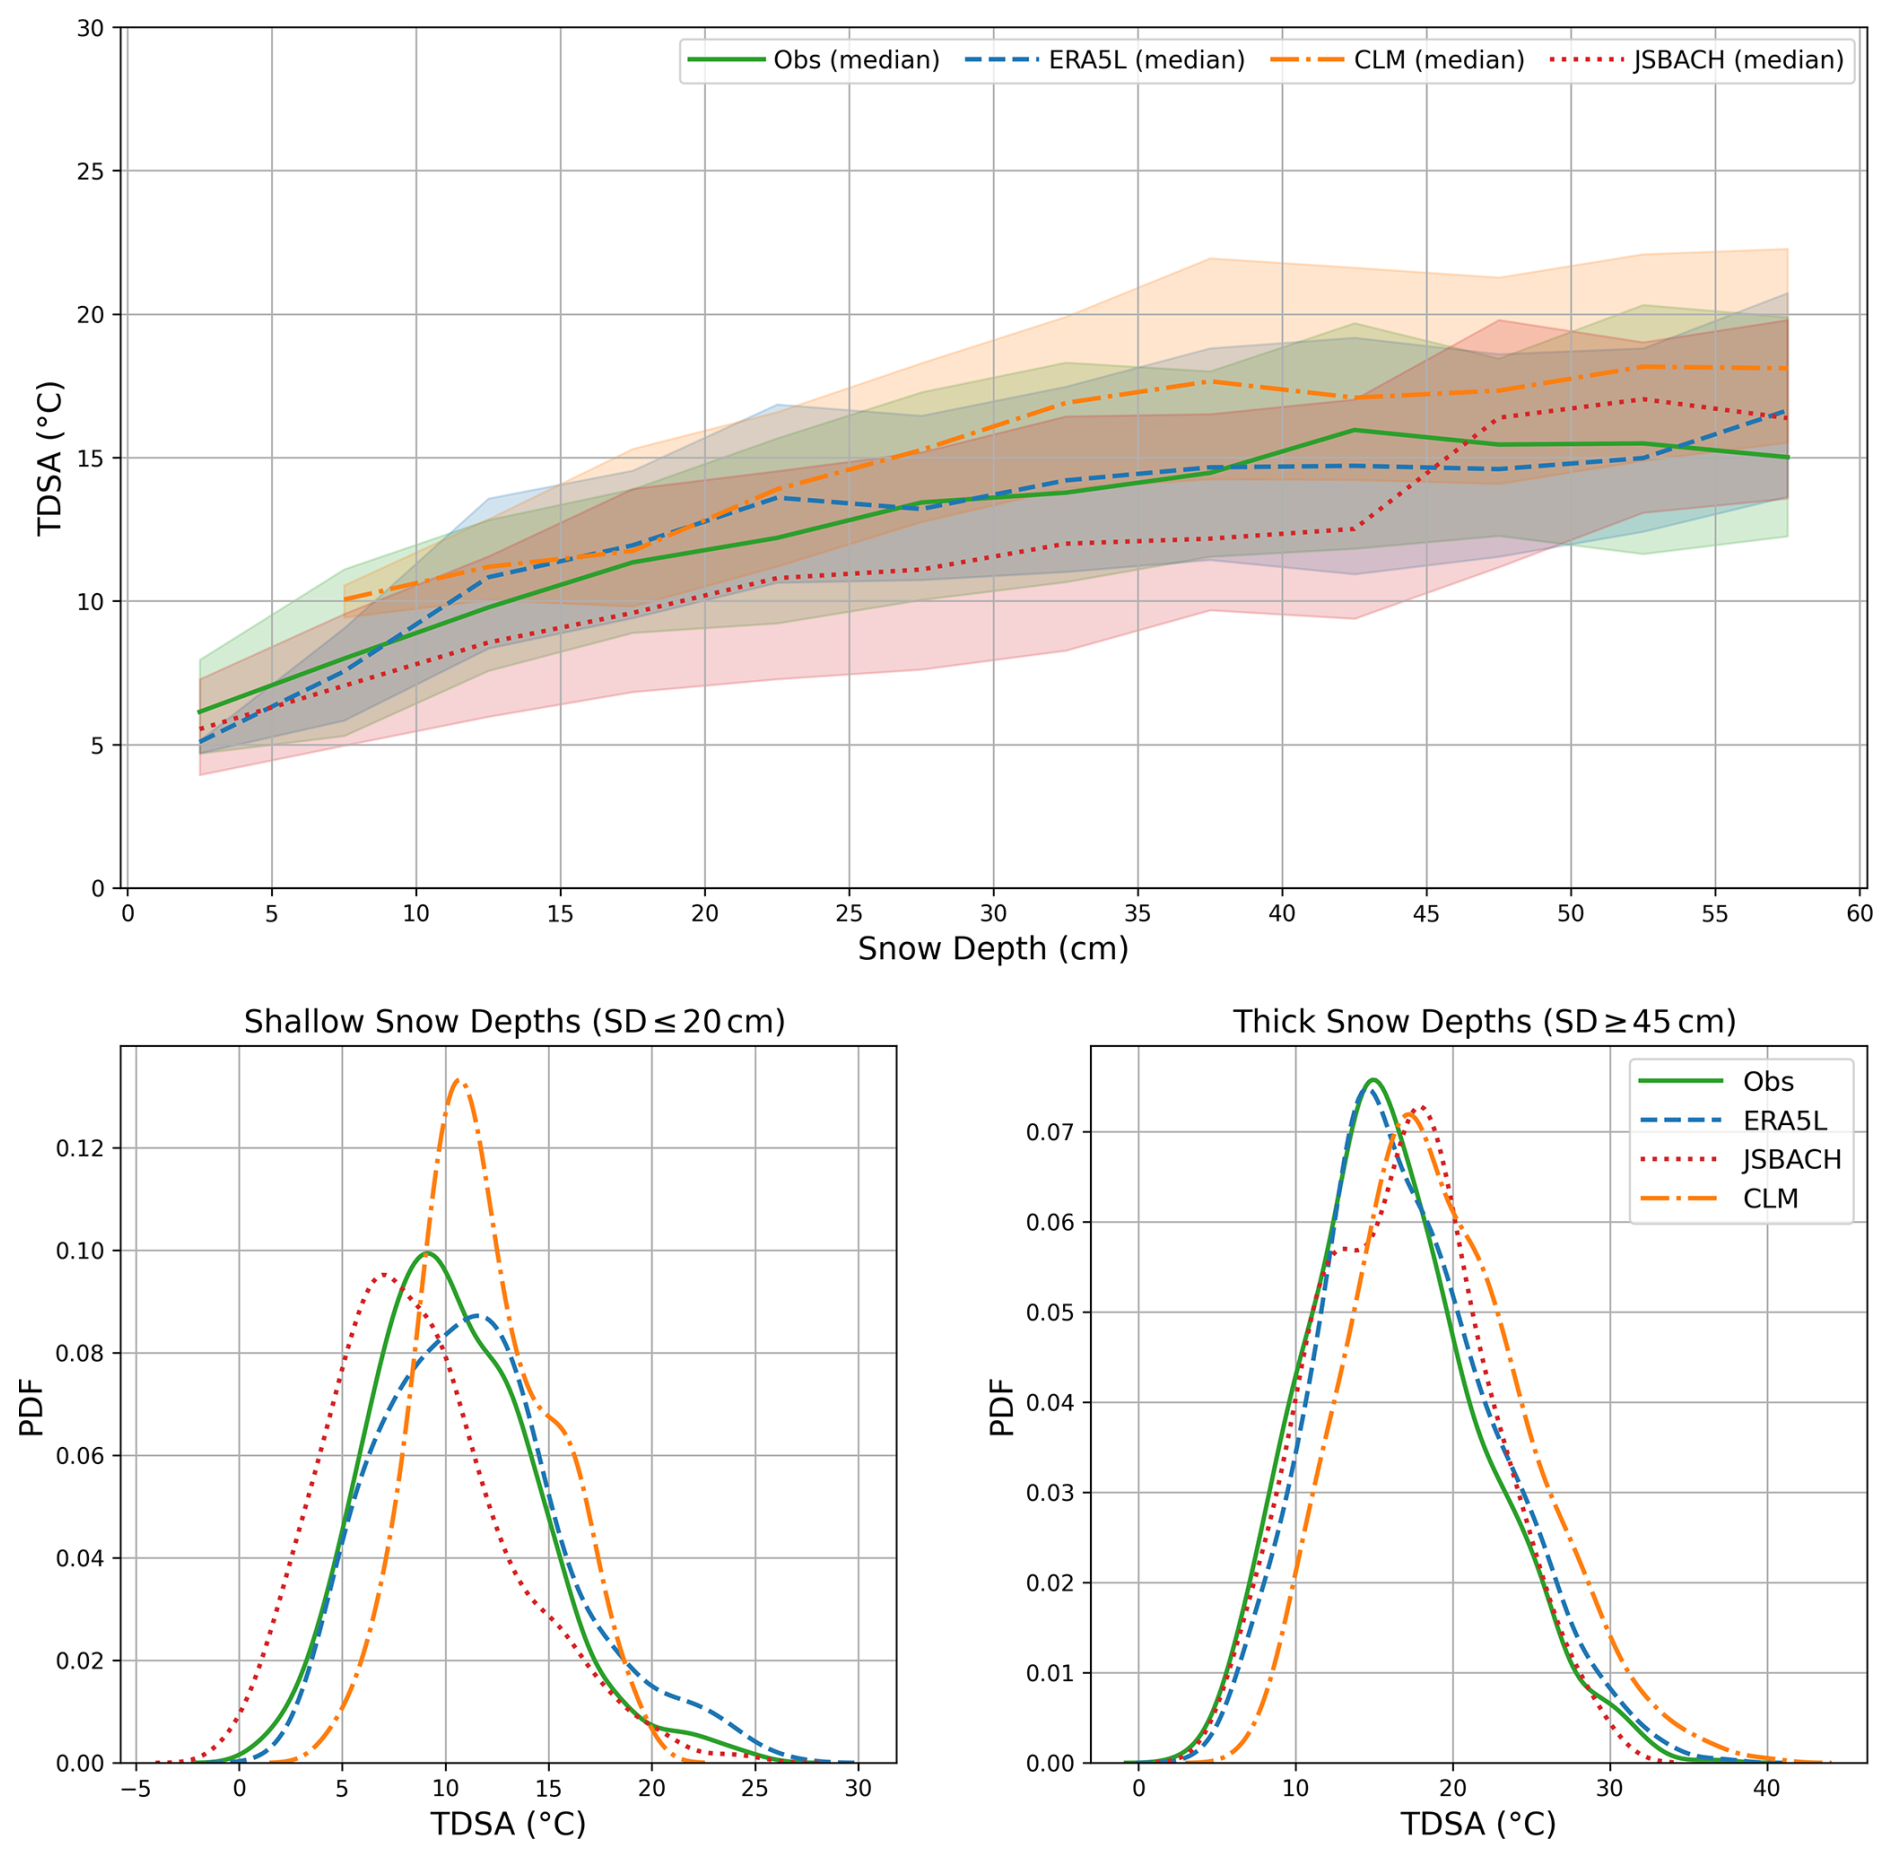
Figure 7Relationship between wintertime monthly mean SD and soil-air temperature difference (TDSA) across observational and model datasets, shown as median TDSA (dotted lines, 5 cm SD bins) and IQR (shaded) for observations (Obs; green), ERA5L (blue), JSBACH (red), and CLM (orange) in upper panel. Lower panel shows probability density functions (PDFs) of TDSA for shallow (SD ≤ 20 cm) and thick (SD ≥ 45 cm) snow conditions.
To complement the TDSA-SD analysis, the probability distribution functions (PDFs) of TDSA were examined under two snow regimes, enabling a more detailed evaluation of temperature difference associated with varying snow conditions (Fig. 7, lower panel). This approach allows comparison of the modal values and spread of the TDSA distributions, with the dataset divided into shallow (≤20 cm) and thick (≥45 cm) snow categories to assess how SD influences the insulating effect (Wang et al., 2016). The observed TDSA distributions show modal values of approximately 9 °C for shallow snow and 15 °C for thick snow, with the modal TDSA shifting by about 6 °C toward higher values under deeper snow, confirming the stronger insulating effect of thick snowpacks. ERA5L closely replicates the observed distributions for both regimes, showing a comparable spread and slightly different modal value for shallow snow depth. In contrast, CLM exhibits a narrow distribution that is sharply peaked at a higher TDSA of around 11 °C for shallow snow, exceeding the observed modal value, with a similar overestimation evident under deeper snow conditions. JSBACH, on the other hand, shows lower modal values (∼ 7 °C), consistent with its weaker insulation performance under thin snow cover and its limited ability to capture extreme events. The stepwise shift observed in JSBACH for thick snow likely results from the limited number of deep snow cases in the model.
3.2.3 SFG and snow cover characteristics
Following the assessment of snow insulation effects, it is important to evaluate how well the models reproduce the observed intensity of frozen ground conditions. Figure 8 compares the simulated and observed Maximum Freezing Depth (MFD) across all stations, illustrating the intensity of SFG for ERA5L, JSBACH, and CLM. ERA5L is structurally constrained by its shallow soil column (∼ 2 m), which limits its ability to capture the observed deep freezing (up to 3.2 m). In ERA5L, eight out of the 26 stations reached the model's maximum soil depth for several years, which are not shown in the figure. JSBACH generally overestimates MFD (MBE = 1.7 m, RMSE = 2.2 m), with a low correlation coefficient (R=0.36), suggesting that insufficient snow insulation allows deeper ground freezing. For four stations, freezing reached the maximum soil depth in some years. CLM performs comparatively better (MBE = 0.6 m, RMSE = 1.3 m, R=0.43), with most data points clustering near the 1:1 reference line and within the expected range, except at a few stations where freezing extended beyond 4 m.
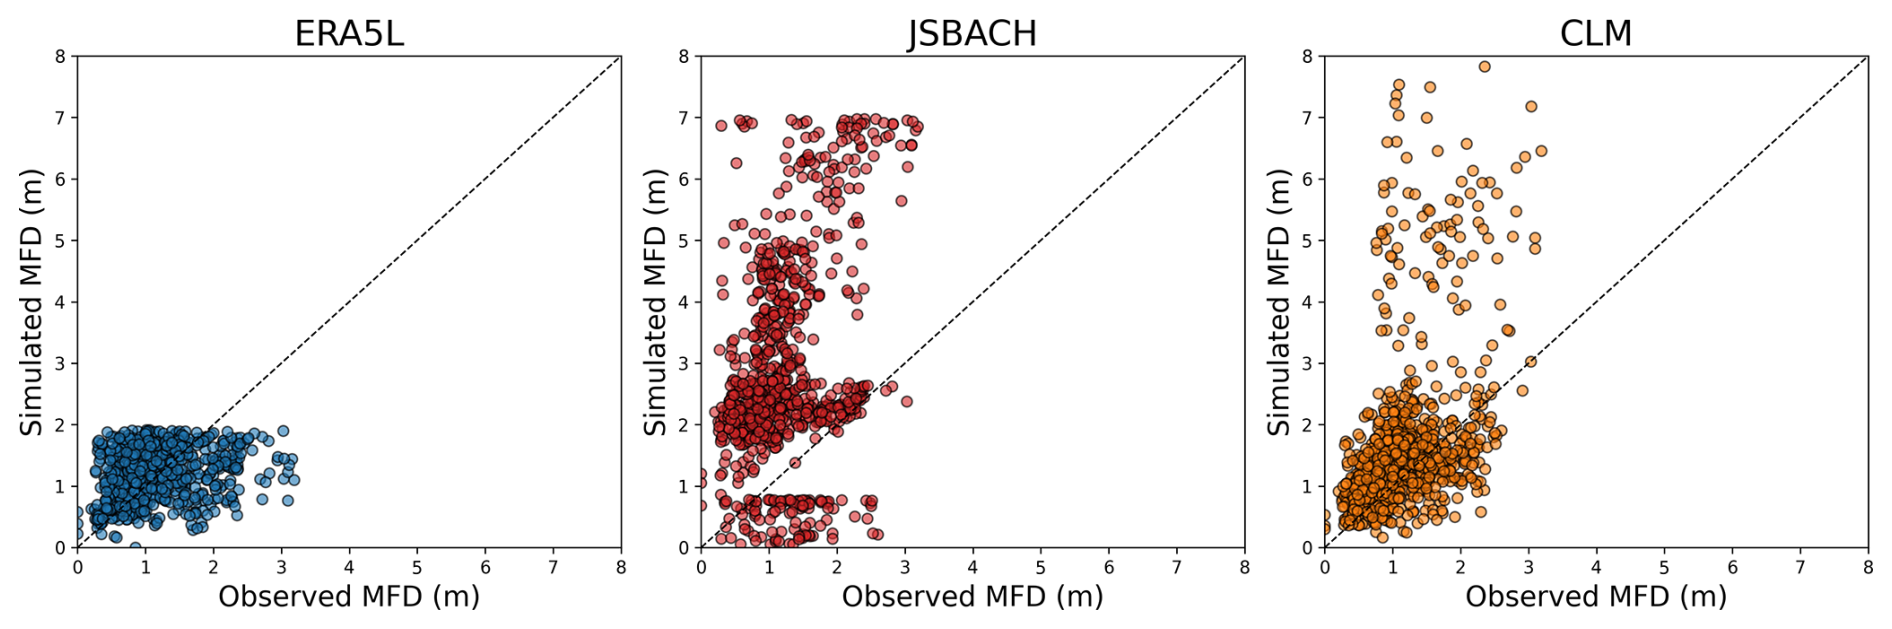
Figure 8Scatter plot of observed versus simulated Maximum Freezing Depth (MFD) across all stations, showing annual MFD values for ERA5L (blue), JSBACH (red), and CLM (orange). The 1:1 line indicates perfect agreement between simulations and observations.
To get a full picture of model behavior, it is also essential to examine the timing and duration of SFG and snow cover. Figure 9 compares the simulated and observed timing of seasonal transitions in frozen ground and snow cover by showing the biases in onset, end date, and duration across all stations, with panels (a–c) representing SFG characteristics and (d–f) representing snow cover characteristics. The SFG onset timing indicates that all models simulate an earlier freeze onset at 20 cm depth relative to observations across most stations, with median biases ranging from −5 to −11.5 d. ERA5L shows a bias of −5 d (IQR: −19 to +1 d), CLM −7 d (IQR: −19 to 0 d), and JSBACH −11.5 d (IQR: −24 to −4 d). This early freezing suggests that soil cooling begins prematurely, reflecting challenges in representing autumn land-atmosphere interactions related to soil thermal characteristics and snow evolution processes. Early freezing onset and delayed thaw together extend the frozen period in all models (median bias: 19 to 26 d) as shown in Fig. 9c. The SFG end date or thaw date (Fig. 9b) is delayed across all models, with median biases ranging from +9 to +16 d. JSBACH exhibits the smallest bias (+9 d), whereas CLM and ERA5L show larger positive biases (+12 to +16 d) and greater variability. The timing and duration of snow cover (Fig. 9d–f) further explain these SFG biases. JSBACH simulates delayed snow onset (median bias = +10 d) and earlier snow disappearance (median bias = −15 d), resulting in a shorter snow cover duration (median bias = −27 d). This outcome is consistent with its underestimated SD and weaker insulation, which enhance soil heat loss and allow for deeper soil freezing. We speculate that snow density still needs adjustment, as it strongly influences snow depth, consequently, snow insulation. Cold soil conditions and low snow accumulation are interlinked, with snowfall occurring but snow depth remaining low, which delays reaching the 5 cm threshold and reduces insulation, allowing the soil to stay cold, and further research is needed to identify all the contributing factors. In contrast, ERA5L and CLM simulate earlier snow onset (median bias = −3 to −7 d) and delayed melt (median bias: +9 to +15 d), resulting in an extended snow cover duration (+15.5 to +24 d). The prolonged frozen soil period in these models likely arises from excessive snow accumulation and insulation, which inhibit soil-atmosphere heat exchange and delay thaw, whereas JSBACH's weaker snow dependence and stronger AT control lead to smaller variability in thaw timing.
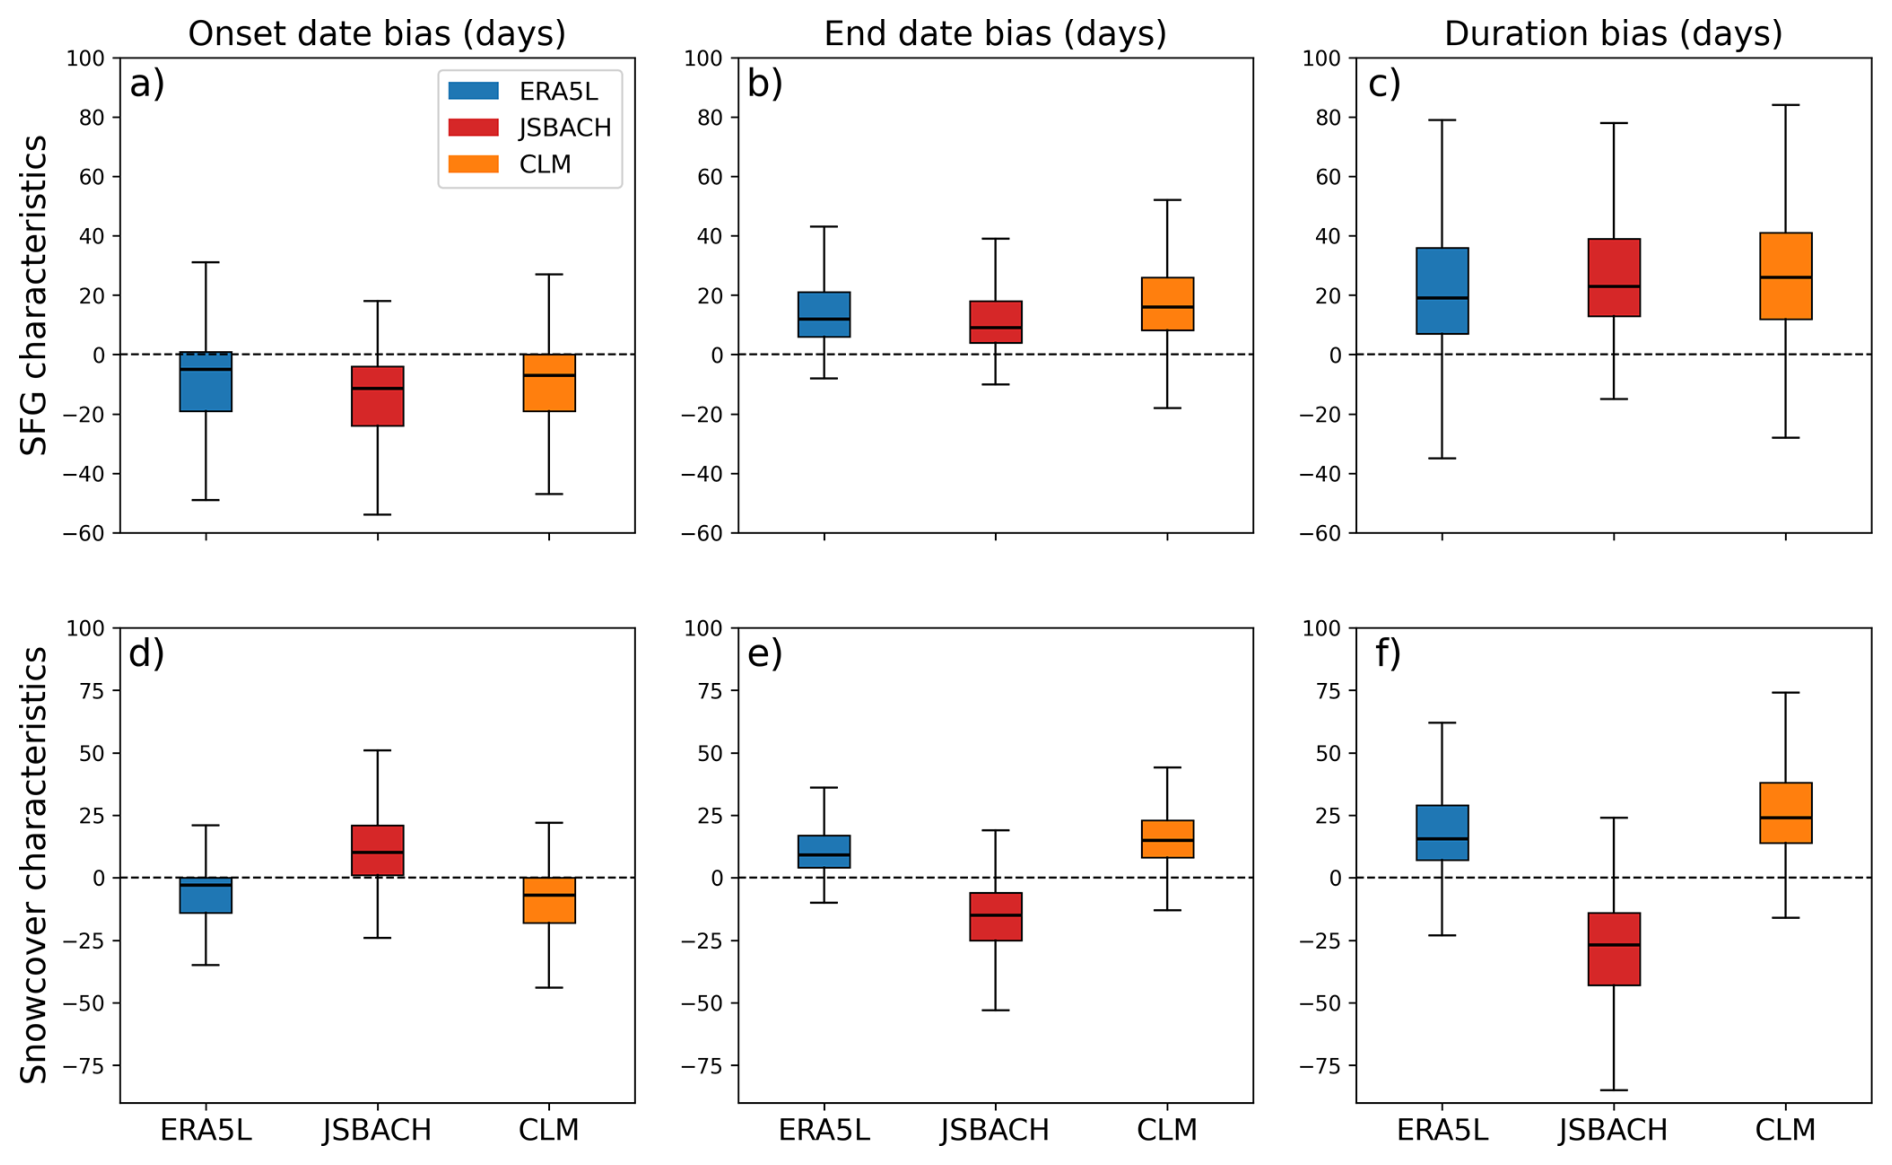
Figure 9Comparison of simulated and observed timing of SFG and snow cover characteristics. The figure shows biases in onset date (first column), end date (second column), and duration (third column) across all stations. Panels (a)–(c) represent biases in SFG characteristics, while panels (d)–(f) show biases in snow cover characteristics. Positive (negative) values indicate later (earlier) occurrence relative to observations.
3.2.4 Factors affecting seasonal freeze-thaw variability in cold region soils
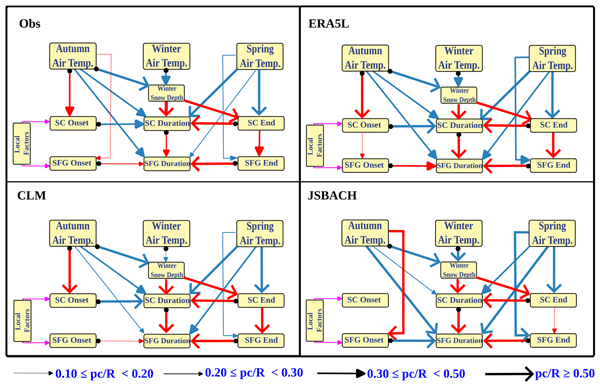
In the previous sections, model biases in the timing, duration, and intensity of SFG have been examined. To gain a comprehensive understanding of the underlying mechanisms, it is important to investigate how these SFG characteristics respond to environmental drivers. Previous research has predominantly focused on the direct effects of AT or SD on MFD (Peng et al., 2017; Frauenfeld et al., 2011; Wang and Chen, 2022) or SFG duration (Luo et al., 2020; Li et al., 2021), often neglecting the onset timings of freeze and thaw and their relationship with snow cover characteristics. While MFD reflects the cumulative effect of continuous soil freezing, the processes controlling its formation and disappearance remain insufficiently understood (Wang and Chen, 2024). This section analyzes the relationships between SFG characteristics and snow cover properties, including timing, duration, and depth, along with seasonal ATs and cumulative thermal indices, specifically annual freezing and thawing degree days, offering an integrated perspective on the factors influencing seasonal freeze-thaw variability. Figure 10 shows statistically significant correlation matrices between SFG and snow cover characteristics, seasonal ATs, winter SD, as well as thermal indices for observations and models. To further distinguish direct relationships from shared seasonal influences, partial correlation (pc) analysis was additionally calculated (using pingouin package; https://pingouin-stats.org/generated/pingouin.partial_corr.html, last access: 20 May 2026). The resulting partial correlation values are presented in Appendix Table A3, while the corresponding controlling factors used in each analysis are listed in Appendix Table A2. This approach removes the effect of co-varying seasonal controls (autumn AT, spring AT, winter AT and winter SD), allowing a clearer assessment of whether snow cover exerts an independent influence on soil freezing dynamics or whether observed linkages arise primarily through common atmospheric forcing. Figure 11 presents a schematic diagram based on Appendix Table A3, illustrating both pearson correlations (R) and partial correlations (pc) after accounting for shared drivers, thereby highlighting the relative strength and direction of the key interactions among variables. In observations, SFG onset is not directly controlled by large-scale seasonal conditions. SC onset and autumn AT show a direct moderate positive relationship (R=0.30), indicating that warmer autumn temperatures delay snow cover onset, consistent with a temperature-driven control, yet autumn AT exerts only limited direct influence on SFG onset (pc=0.14), and the mutual partial correlation between SC onset and SFG onset is negligible (pc=0.02 after controlling for autumn AT). SC duration is primarily controlled by winter SD (), spring AT (), and autumn AT (). SC end shows strong dependence on spring AT () and winter SD (), and a moderate relationship with SFG end after controlling for spring temperature (). In contrast, SFG end is correlated with the thawing index () but is only weakly directly influenced by spring AT once the effect of SC end is removed (), highlighting that soil thaw timing is largely mediated through snow cover dynamics rather than temperature alone. SFG duration shows the strongest association with autumn AT (; after controlling for SC duration and spring AT), with spring AT retaining a moderate independent effect on SFG duration after controlling for SC duration (). Altogether, the observations indicate that snow cover governs thaw timing and, together with the intensity of seasonal air temperature, determines the duration of seasonal ground freezing.
ERA5L and CLM broadly reproduce several of the observed dependencies but often amplify the strength of correlations, suggesting an excessive sensitivity of the simulated soil thermal regime to AT and snow controls. Moreover, both models do not account for the high heterogeneity in local conditions present at observation sites, as land surface properties are spatially smoothed, which likely contributes to the strong dependence of snow cover onset on seasonal variables, particularly autumn AT. In addition, precipitation phase partitioning in the models is governed by grid scale temperature thresholds, making the onset of snow accumulation primarily temperature driven. Consequently, local factors that modify the near-surface temperature regime, such as vegetation dynamics, soil thermal properties, microtopography, and surface energy exchanges, cannot be represented as specifically as in station observations. The SC_End-SFG_End coupling is particularly inflated (R>0.9; pc=0.85 in ERA5L and 0.84 in CLM after controlling for spring AT), far exceeding observations. In ERA5L, spring AT retains a stronger direct effect on SFG end than observed (), and the SFG duration-SC duration coupling is elevated (R=0.53 vs. 0.38 in observations), with comparable sensitivity of SFG duration to both autumn AT () and spring AT (). In CLM, SC onset is highly sensitive to autumn AT (R=0.73), and the dominant role of snow accumulation in regulating SC duration is reflected in strong partial correlations with winter SD () and spring AT (). CLM weakens the direct influence of autumn AT on soil freezing duration ( compared to −0.37 in observations), while slightly strengthening the independent role of spring AT ( compared to −0.21 in observations). Collectively, the amplified correlations indicate that excessive snow accumulation in ERA5L and CLM produces a tighter-than-observed coupling between snowpack evolution and subsurface freezing, thereby reducing the influence of other environmental controls on SFG variability.
JSBACH on the other hand, exhibits a distinctly different relationship structure, likely reflecting its substantial snow depth underestimation. SC onset shows no dependence on autumn AT (R=0.07), while SFG onset is strongly tied to autumn AT (pc=0.71) with no meaningful SC onset-SFG onset relationship (). At the thaw end, the SC end-SFG end partial correlation weakens (pc=0.18 vs. 0.37 in observations), while spring AT's direct effect on SFG end remains very strong (), indicating that spring warming forces soil thaw without mediation through snow cover. Consequently, both autumn AT () and spring AT () exert substantially stronger independent control on SFG duration than observed, bypassing the buffering role of snow insulation. A notable sign reversal in JSBACH where SFG onset shows a strong negative relationship with SFG duration (), alongside a strong positive SFG end-SFG duration relationship (), indicates that both earlier onset and delayed end contribute to longer frozen ground duration, whereas in observations and the other models, SFG duration is primarily controlled through the end date. The model's limited snow accumulation and relatively shallow snowpack fail to adequately decouple the soil from atmospheric temperature variations, resulting in a more direct soil thermal response to AT. Together, these results highlight that observed SFG characteristics arise from a balanced interaction between snow dynamics and seasonal thermal/freeze energy, whereas models diverge in how they distribute control between AT and snow insulation. ERA5L and CLM exaggerate the thermal decoupling effect of snow, while JSBACH underrepresents it, leading to contrasting biases in the simulated freeze-thaw behavior.
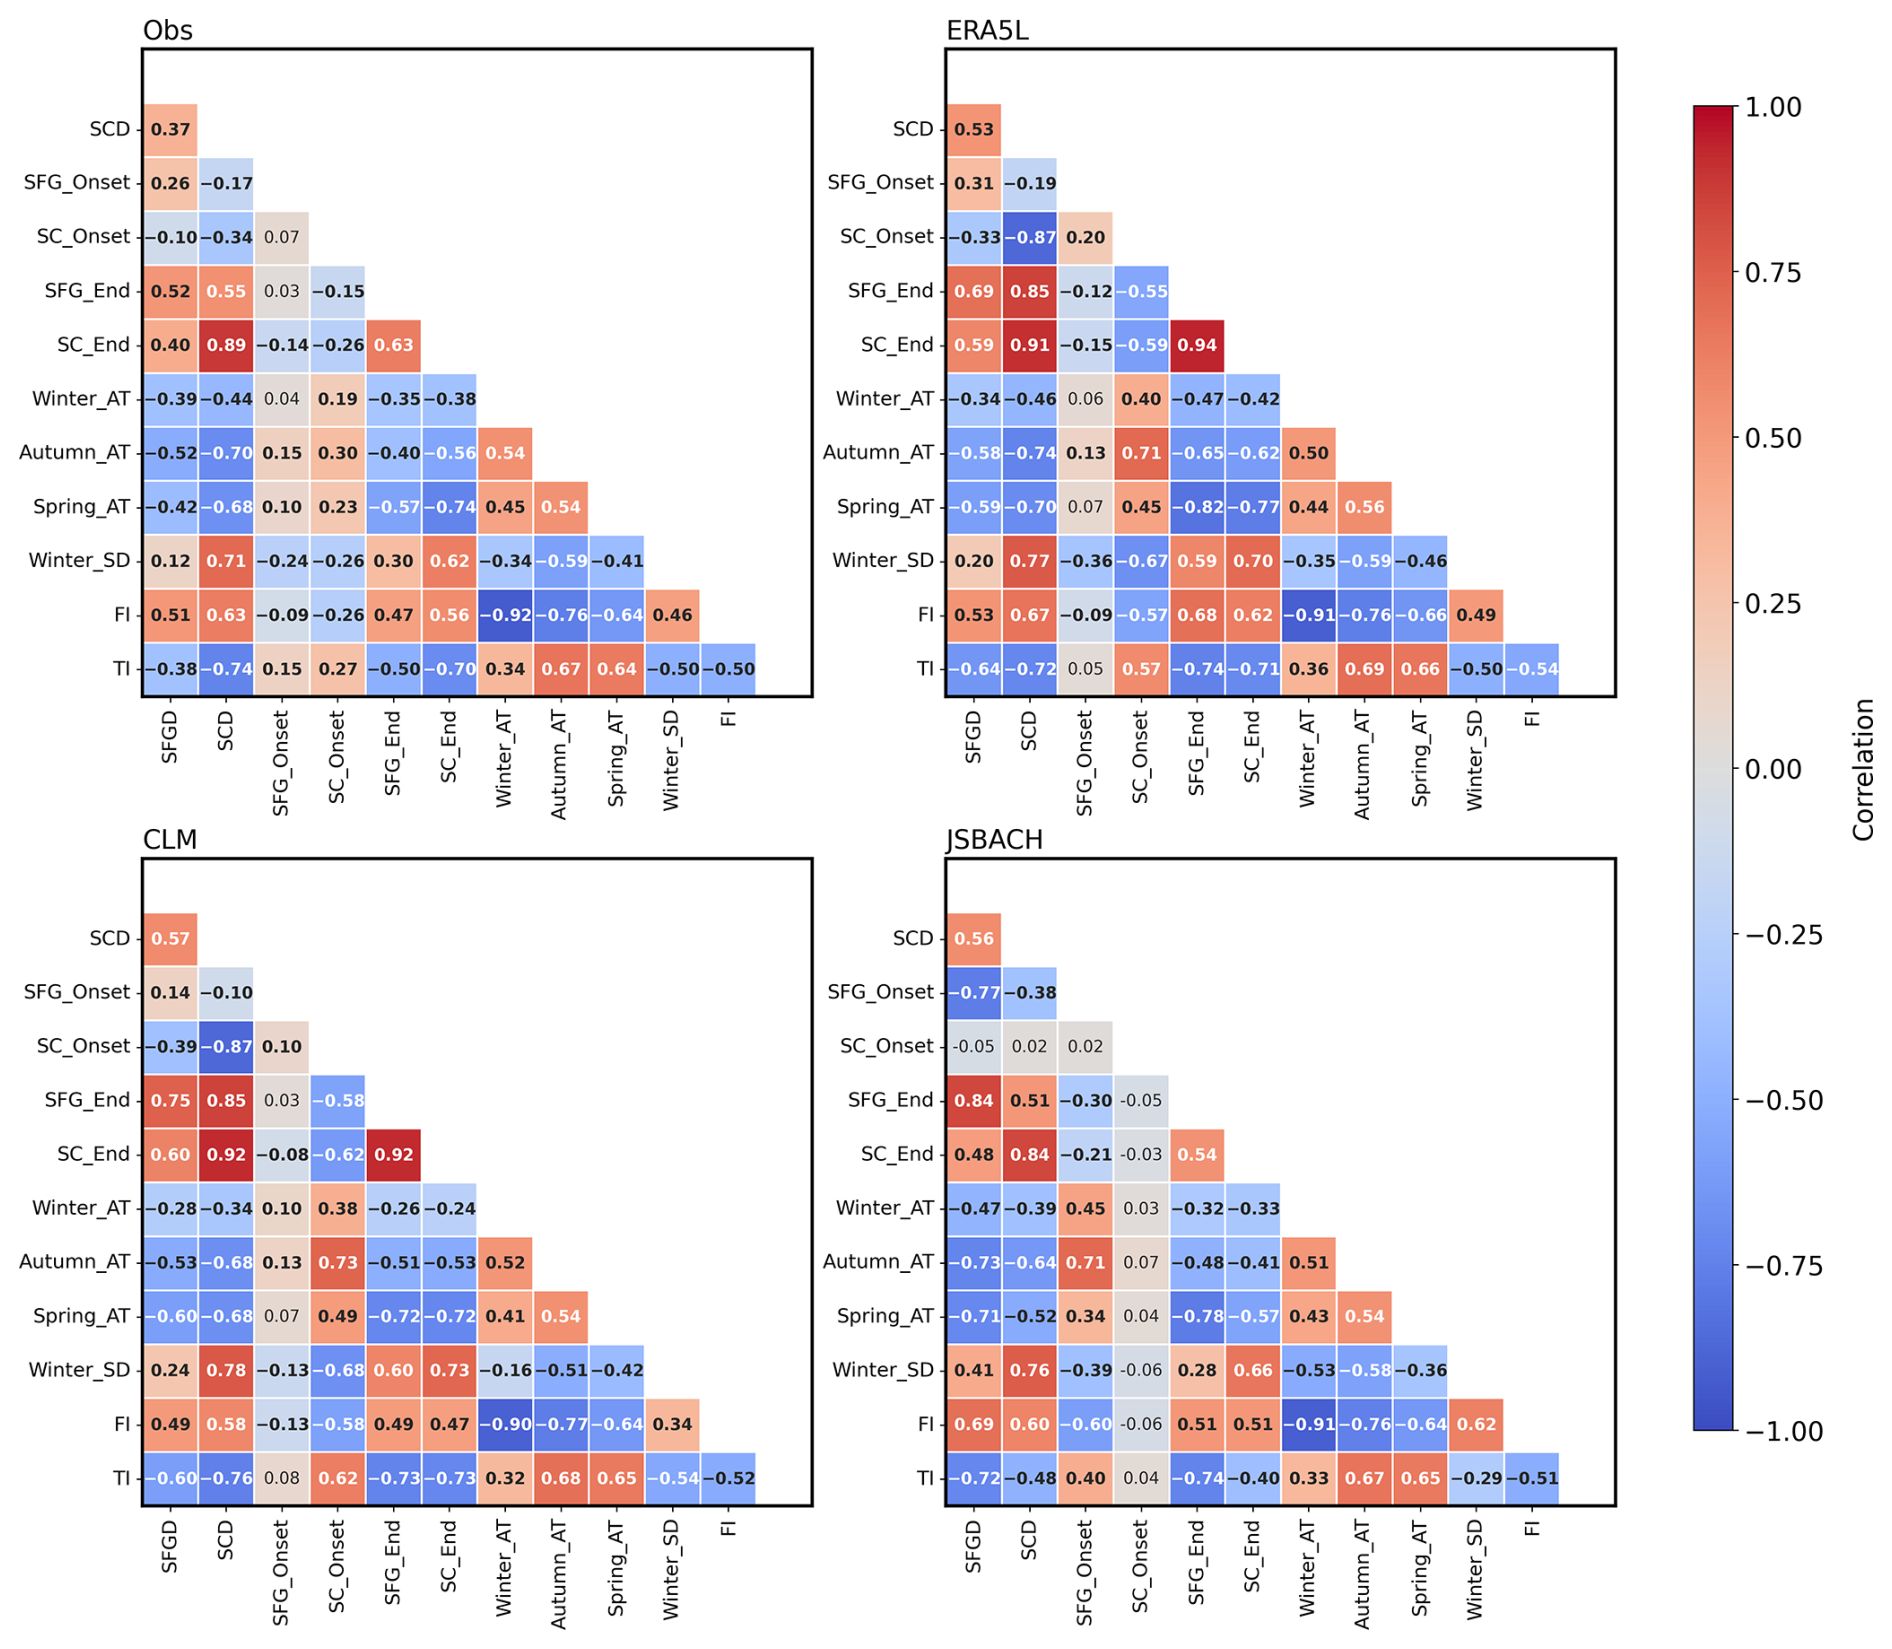
Figure 10Correlation heat maps showing relationships between SFG characteristics (SFG_Onset, SFG_End, SFGD), snow cover characteristics (SC_Onset, SC_End, SCD), and key environmental variables, including seasonal ATs (Winter_AT, Spring_AT, Autumn_AT), winter SD (Winter_SD), annual FI, and TI. Panels show observations (upper left), ERA5L (upper right), CLM (lower left), and JSBACH (lower right). Positive and negative correlations are shown in red and blue, respectively, with the color intensity indicating the correlation strength. Statistically significant values (p<0.01) are shown in bold.
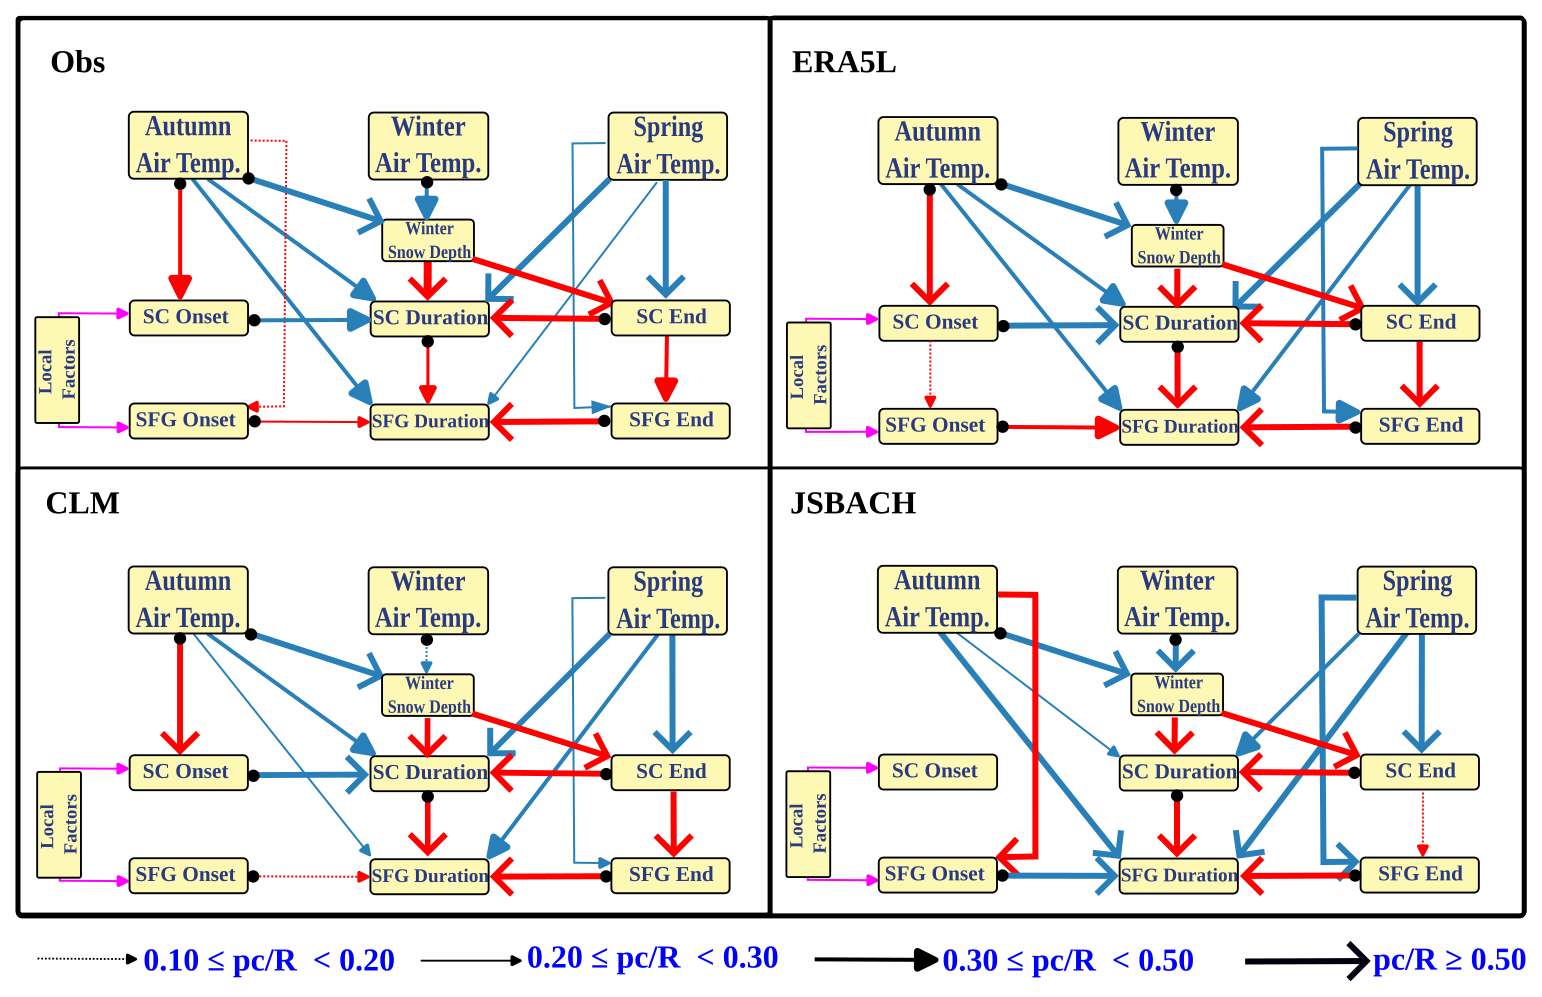
Figure 11Schematic representation of the statistically significant pearson and partial correlations derived from Appendix Table A3, illustrating the interactions among seasonal air temperature, snow cover, snow depth, and seasonally frozen ground characteristics for (a) OBS, (b) ERA5L, (c) CLM, and (d) JSBACH. Red and blue lines denote positive and negative correlations, respectively, while the magenta-coloured line indicates possible local influences affecting the variables. Filled circles at the arrow origin indicate pearson correlation coefficients; all other values represent partial correlations.
This study investigated frozen soil characteristics in JSBACH and CLM, two land surface models over mid-to high-latitude region, in standalone configurations driven by 3-hourly ERA5 data (1986–2022) with ERA5L included as an additional dataset for the comparison. JSBACH's baseline cold bias was notably reduced by using a temperature-dependent snow densification scheme, highlighting the importance of snow density parameterization in accurately modeling the soil thermal regime, and all results discussed here use the improved JSBACH version. The spatial analysis showed that, among the models considered in this study, JSBACH best captured the frozen ground extent, closely matching reference estimates for both SFG and PEFT, although its lower snow accumulation suggested weaker insulation and enhanced soil cooling. CLM showed intermediate skill between JSBACH and ERA5L, with a lack of PEFT over the Tibetan Plateau and excess snow and soil ice, while ERA5L indicated less cold high-latitude soils with excessive snow. These spatial patterns and model behaviors were further evaluated through site-level analysis using observations from 26 Russian SFG stations. At most stations, the models exhibited premature soil freezing and delayed spring thaw, reflecting persistent challenges in capturing autumn land-atmosphere interactions and snow evolution processes (including snowmelt dynamcis). JSBACH’s shorter, less effective snow cover and underestimation of SD led to weaker insulation and a stronger direct response of STs to AT. In contrast, ERA5L and CLM produced an extended snow cover period due to earlier snow onset and delayed melt, where excessive snow accumulation suppressed soil-atmosphere heat exchange and prolonged the frozen ground period. Errors in simulating snow timing, depth, and duration propagate into freeze-thaw biases by altering soil insulation and subsurface energy exchange, resulting in contrasting model biases. The results demonstrate that observed SFG characteristics over Siberia are governed by the interplay between snow dynamics and seasonal thermal energy, while the models diverge in how control is partitioned between AT and snow processes. Our findings indicate that both JSBACH and CLM would benefit from improved representation of snow properties, with CLM additionally requiring a better representation of the partitioning between liquid and ice fraction of soil water. Future studies should focus on site level performance to investigate the combined effects of snow accumulation and snowmelt processes, vegetation, soil properties, and soil moisture on soil freeze-thaw dynamics, in order to enhance land surface model performance.
Table A1Details of the selected meteorological stations with their geographic coordinates, elevation, and station codes, listed in order of increasing latitude.
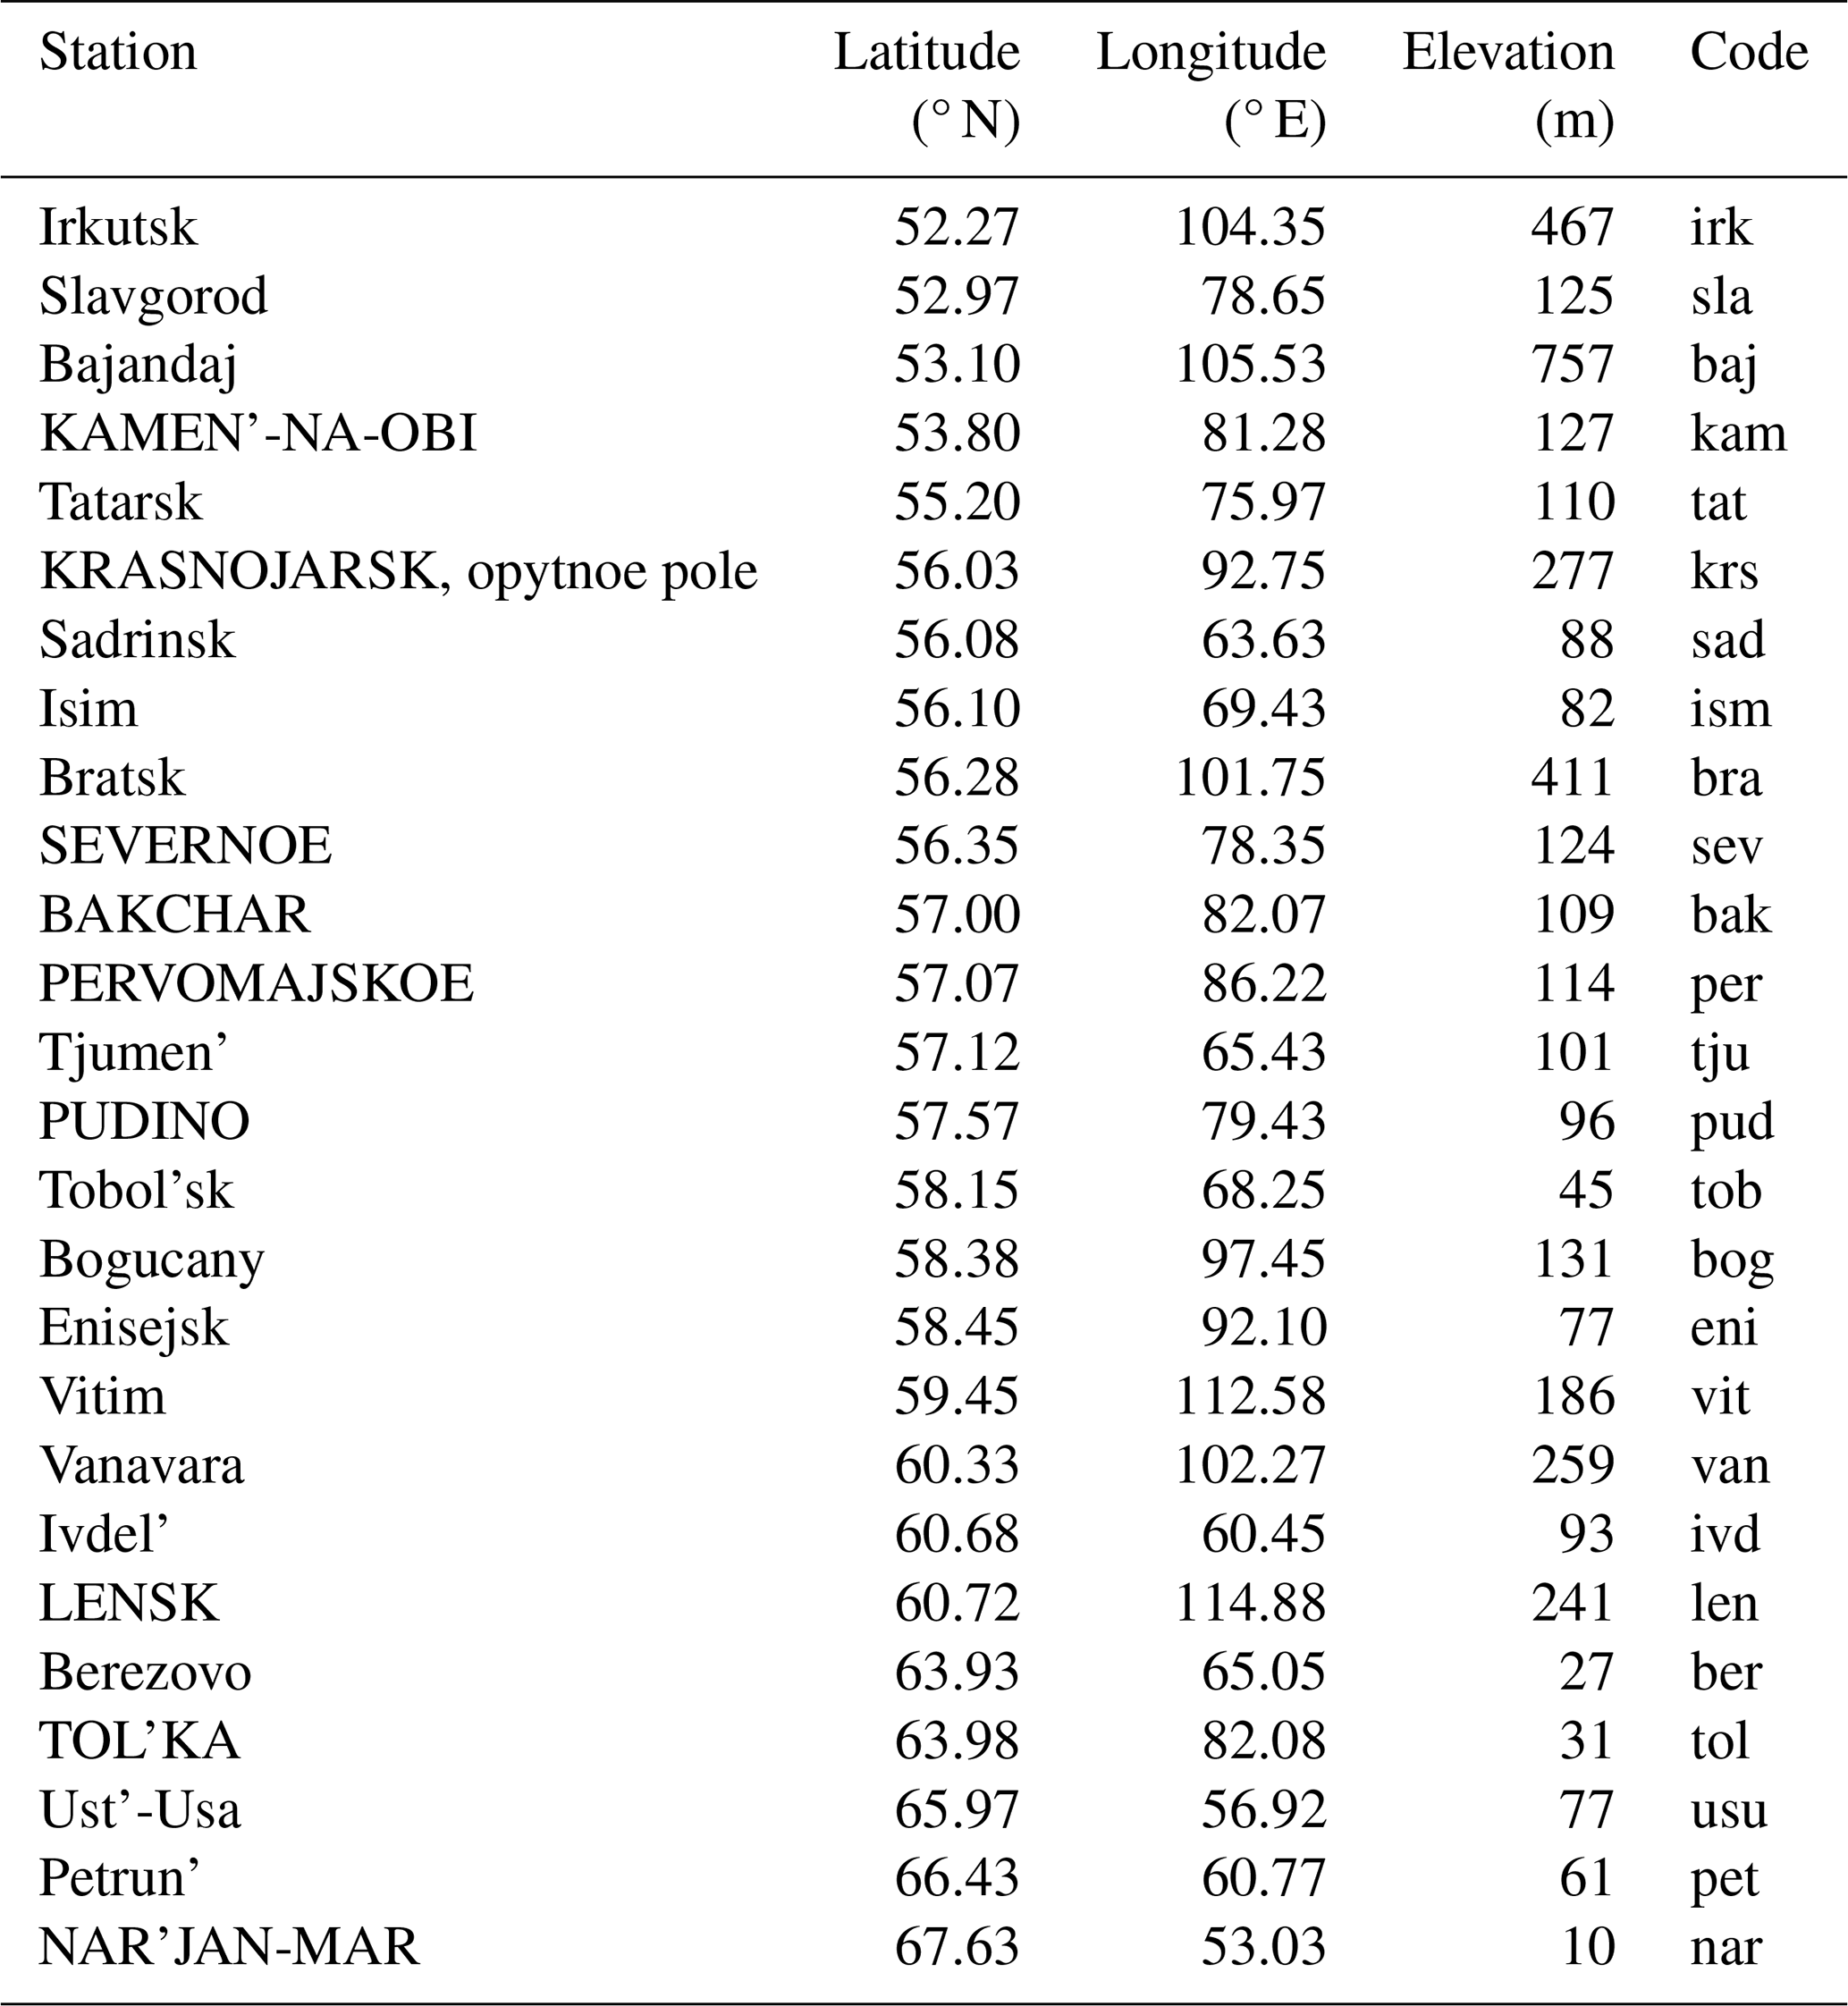
Table A2Relationships between seasonal air temperatures, snow depth, snow cover, and seasonally frozen ground characteristics with controlling factors and physical interpretation.
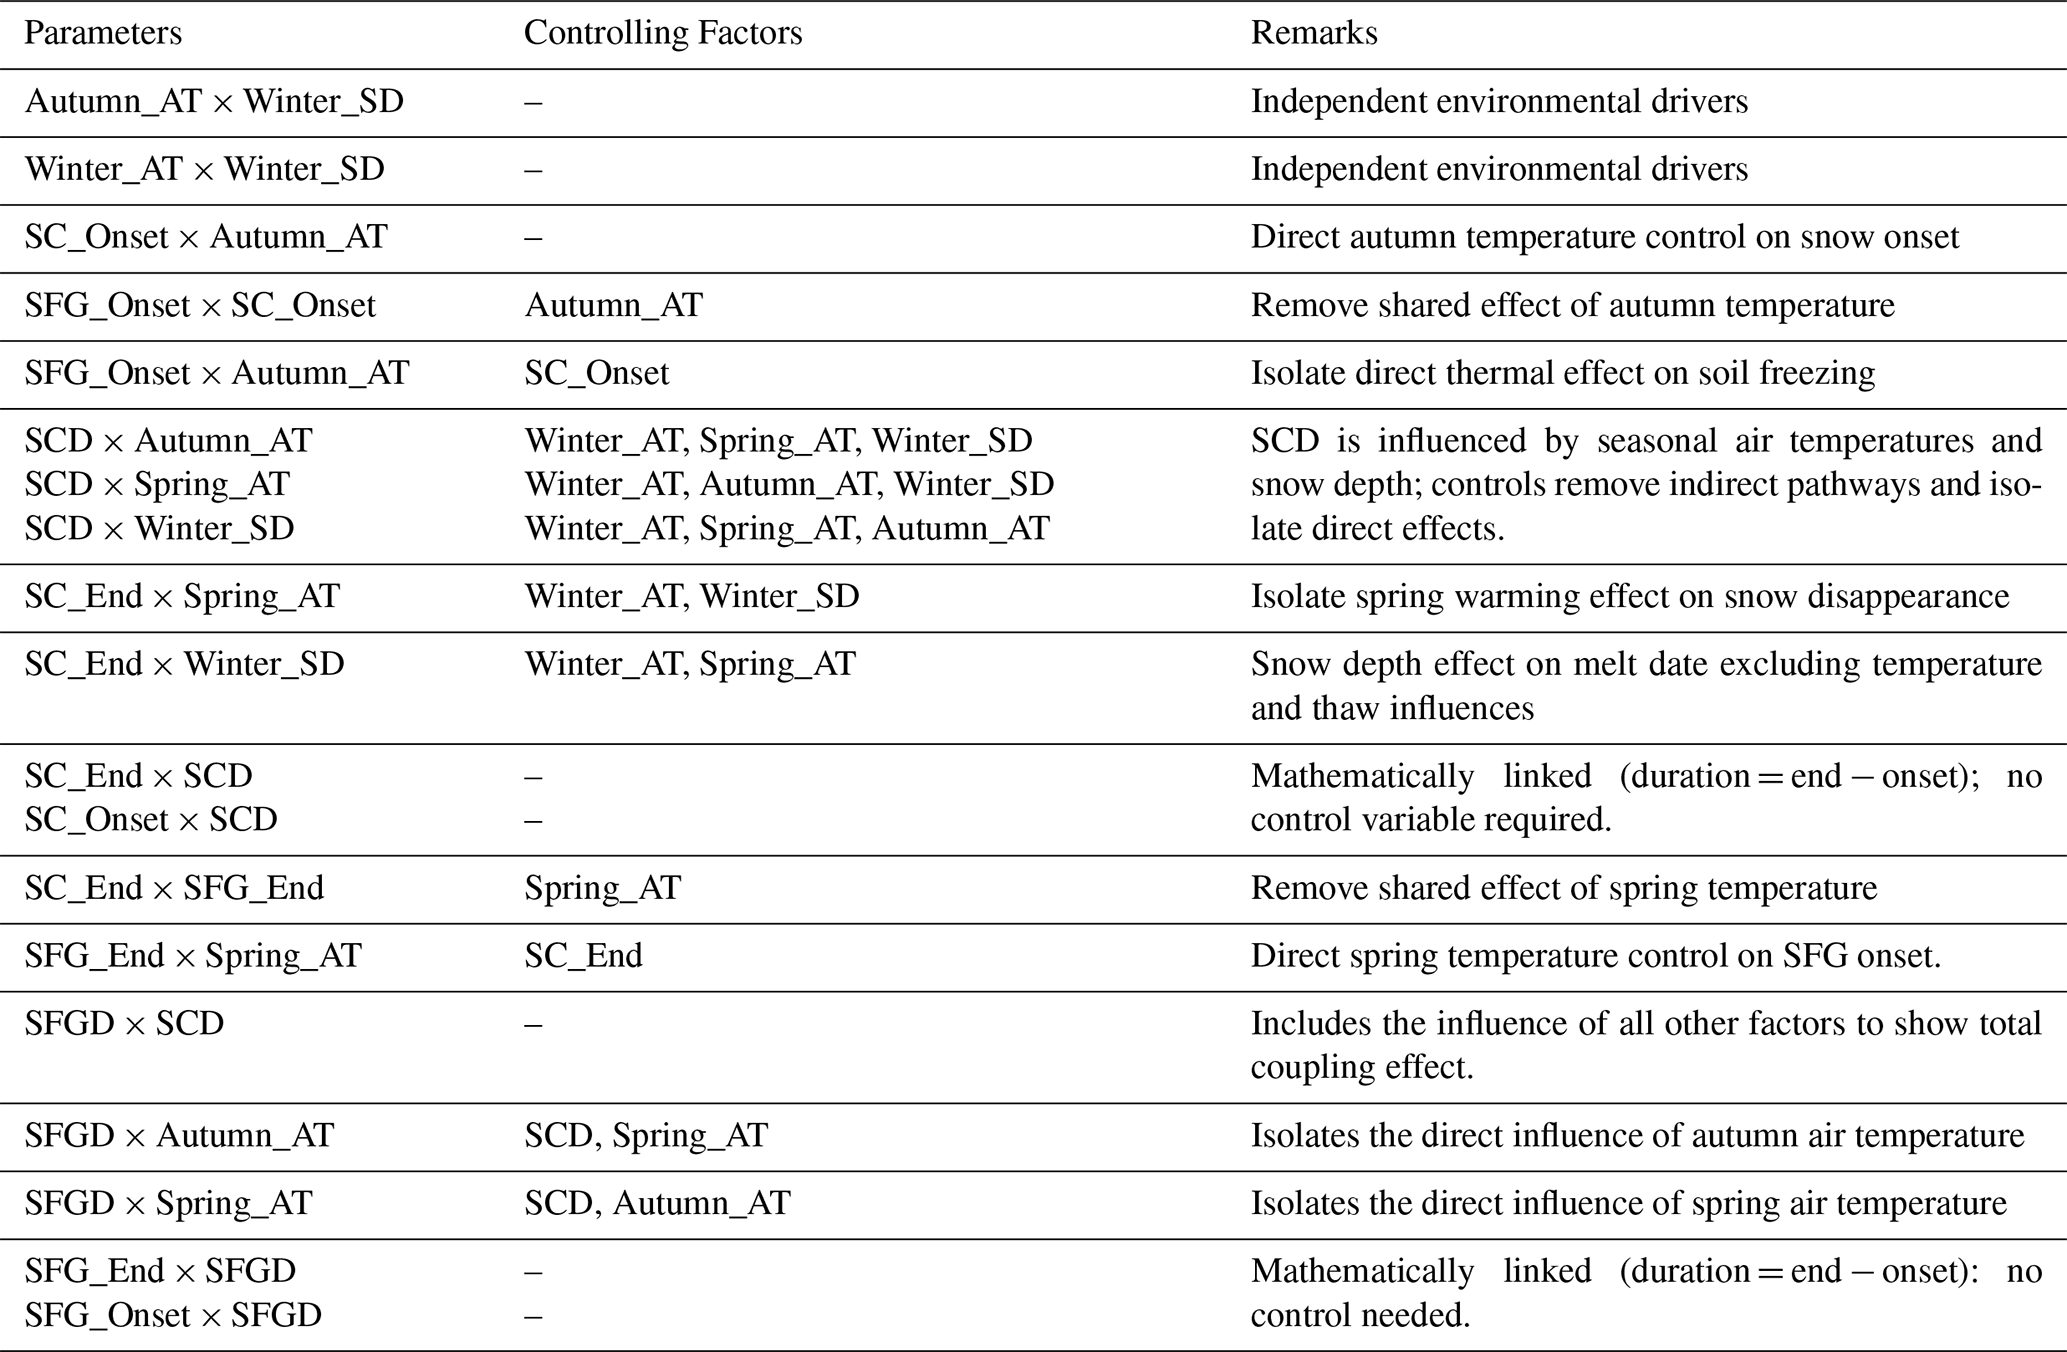
Table A3Statistically significant (p value < 0.01) pearson and partial correlations between seasonal air temperatures, winter snow depth, snow cover, and seasonally frozen ground characteristics.
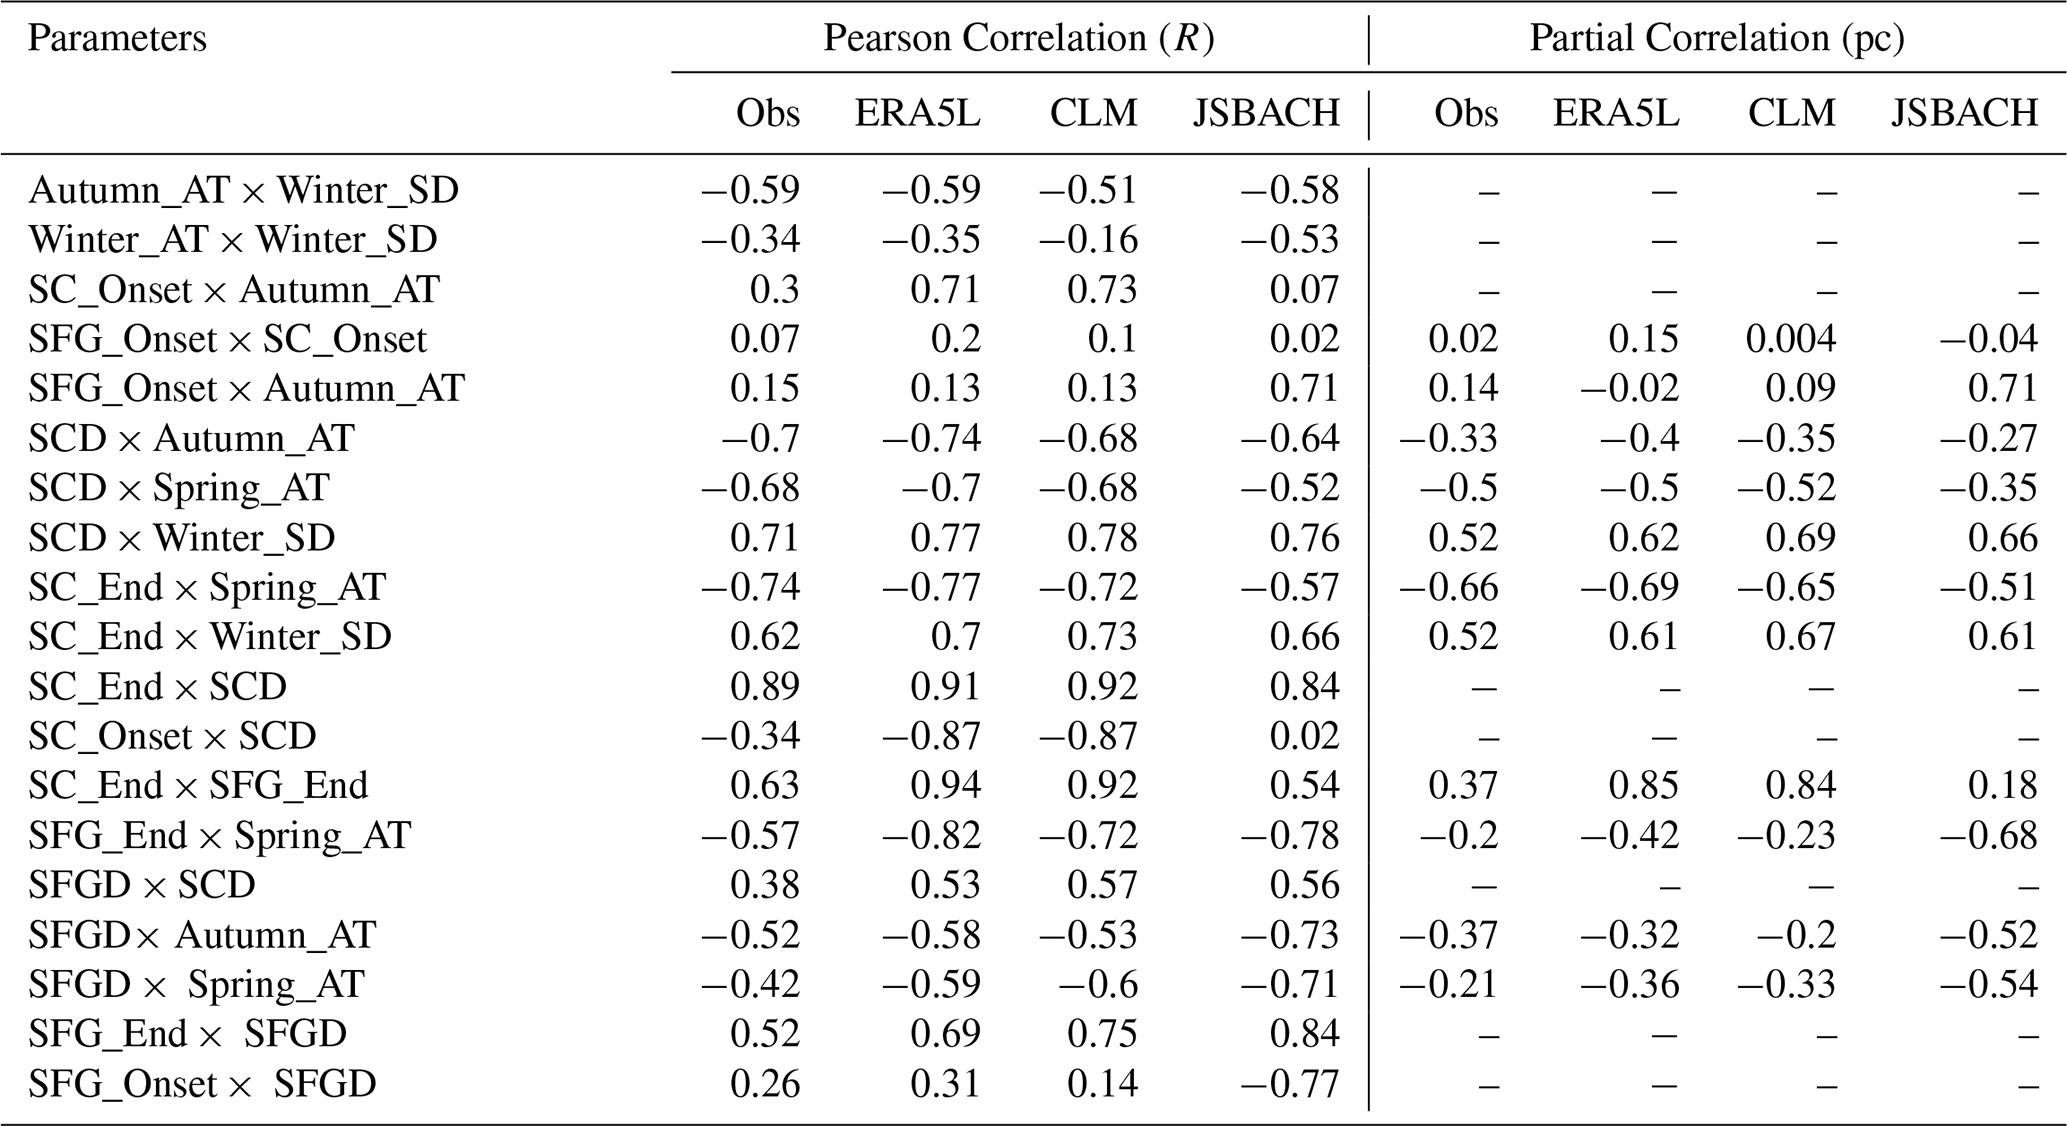
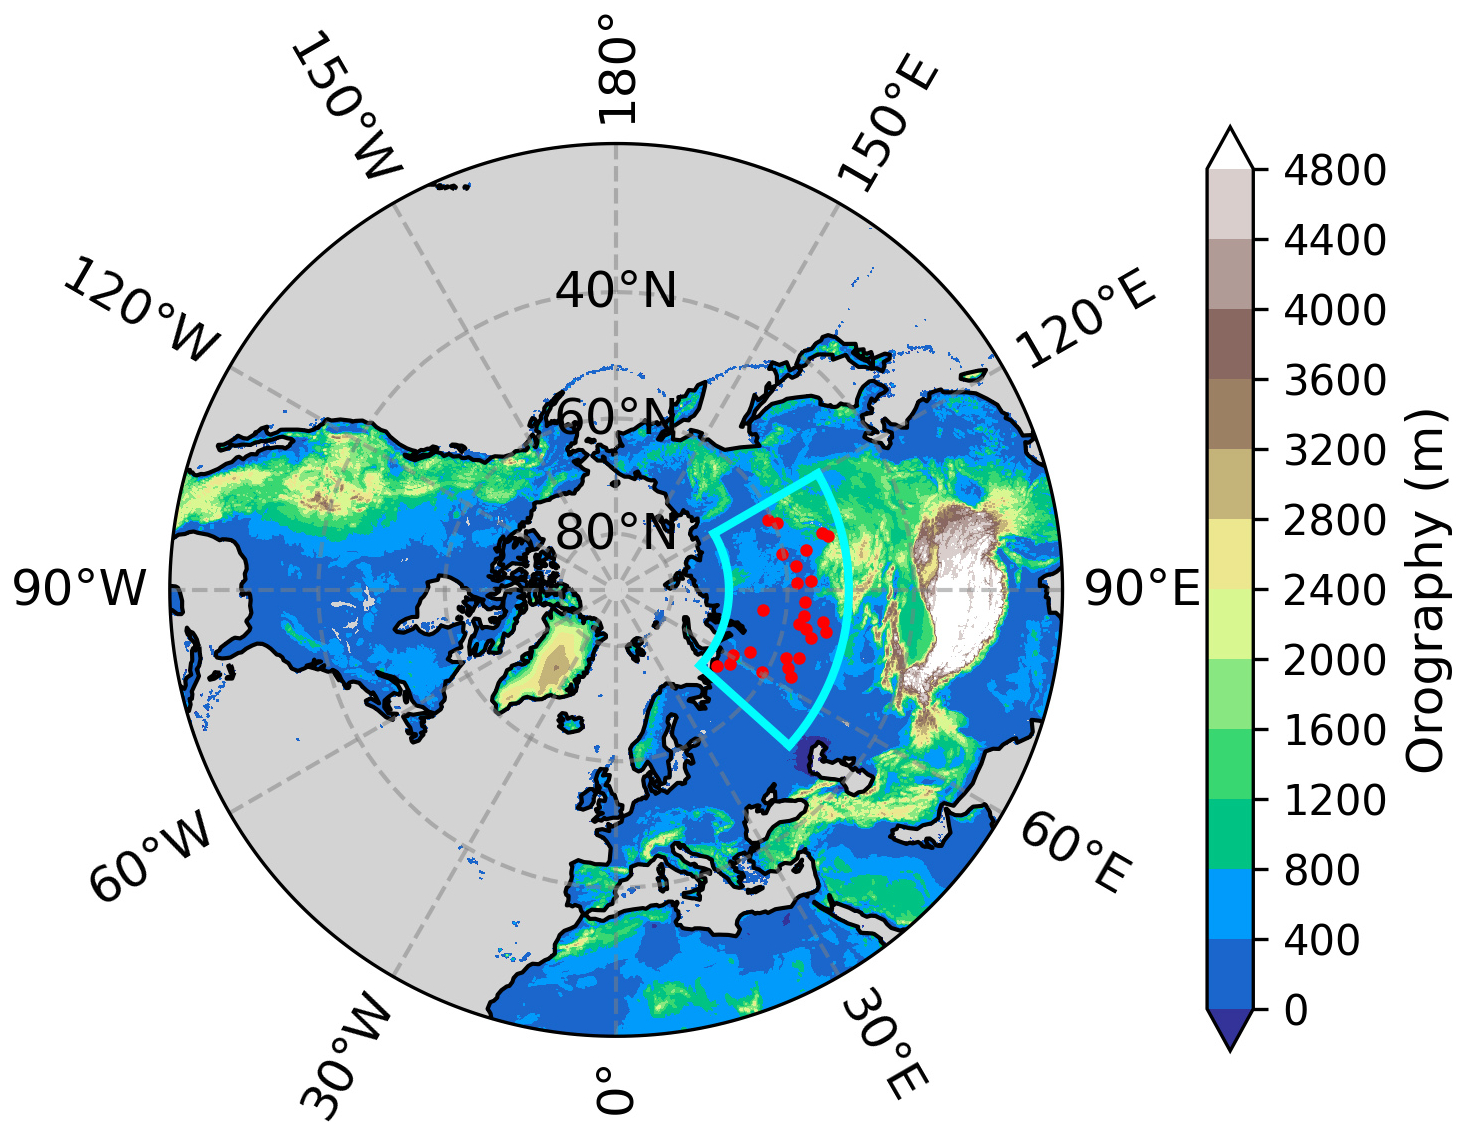
Figure B1Selected study region for the equilibrium analysis shown by the cyan color box on the orography map.
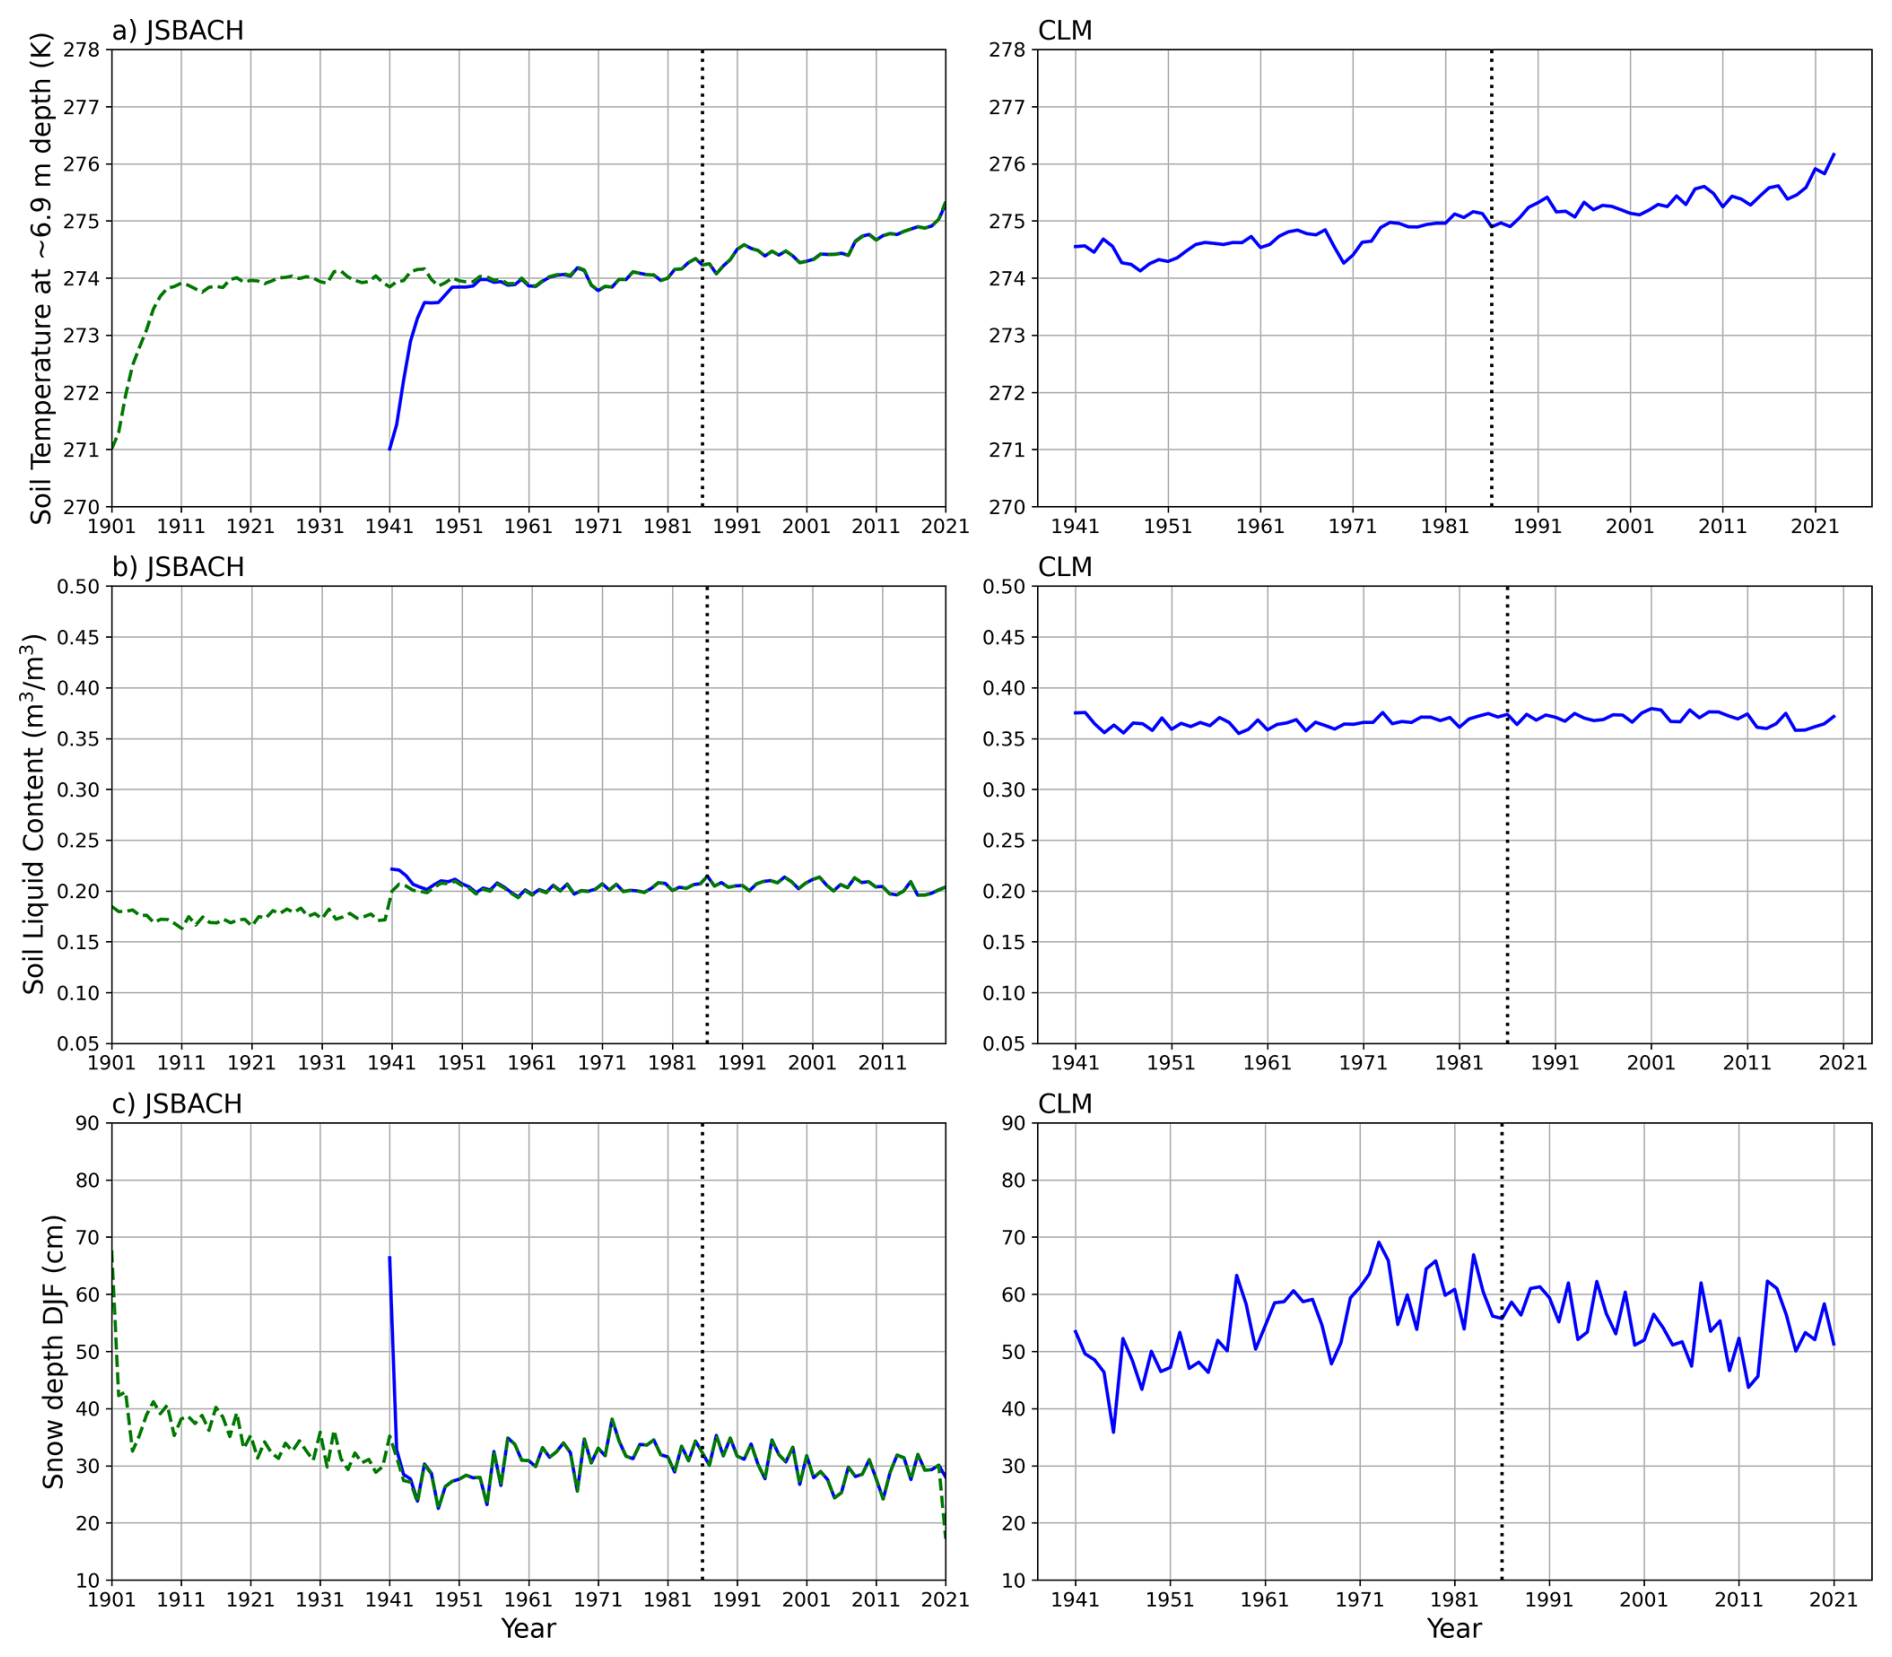
Figure B2Time series of (a) winter mean soil temperature at 6.9 m depth, (b) summer mean volumetric soil liquid water content (0–1 m) (m3 m−3), and (c) winter mean snow depth, averaged over the region shown in Fig. B1, simulated by JSBACH (first column) and CLM5 (second column) for the period 1941–2022 (blue solid lines). In addition, an extended JSBACH simulation forced with GSWP3 (1901–1940) and subsequently ERA5 (1941–2022) is shown (green dashed line), which converges to the same trajectory as the standard simulation well before the start of the analysis period, indicating that the soil thermal and hydrological states become effectively independent of the initial conditions before 1986.
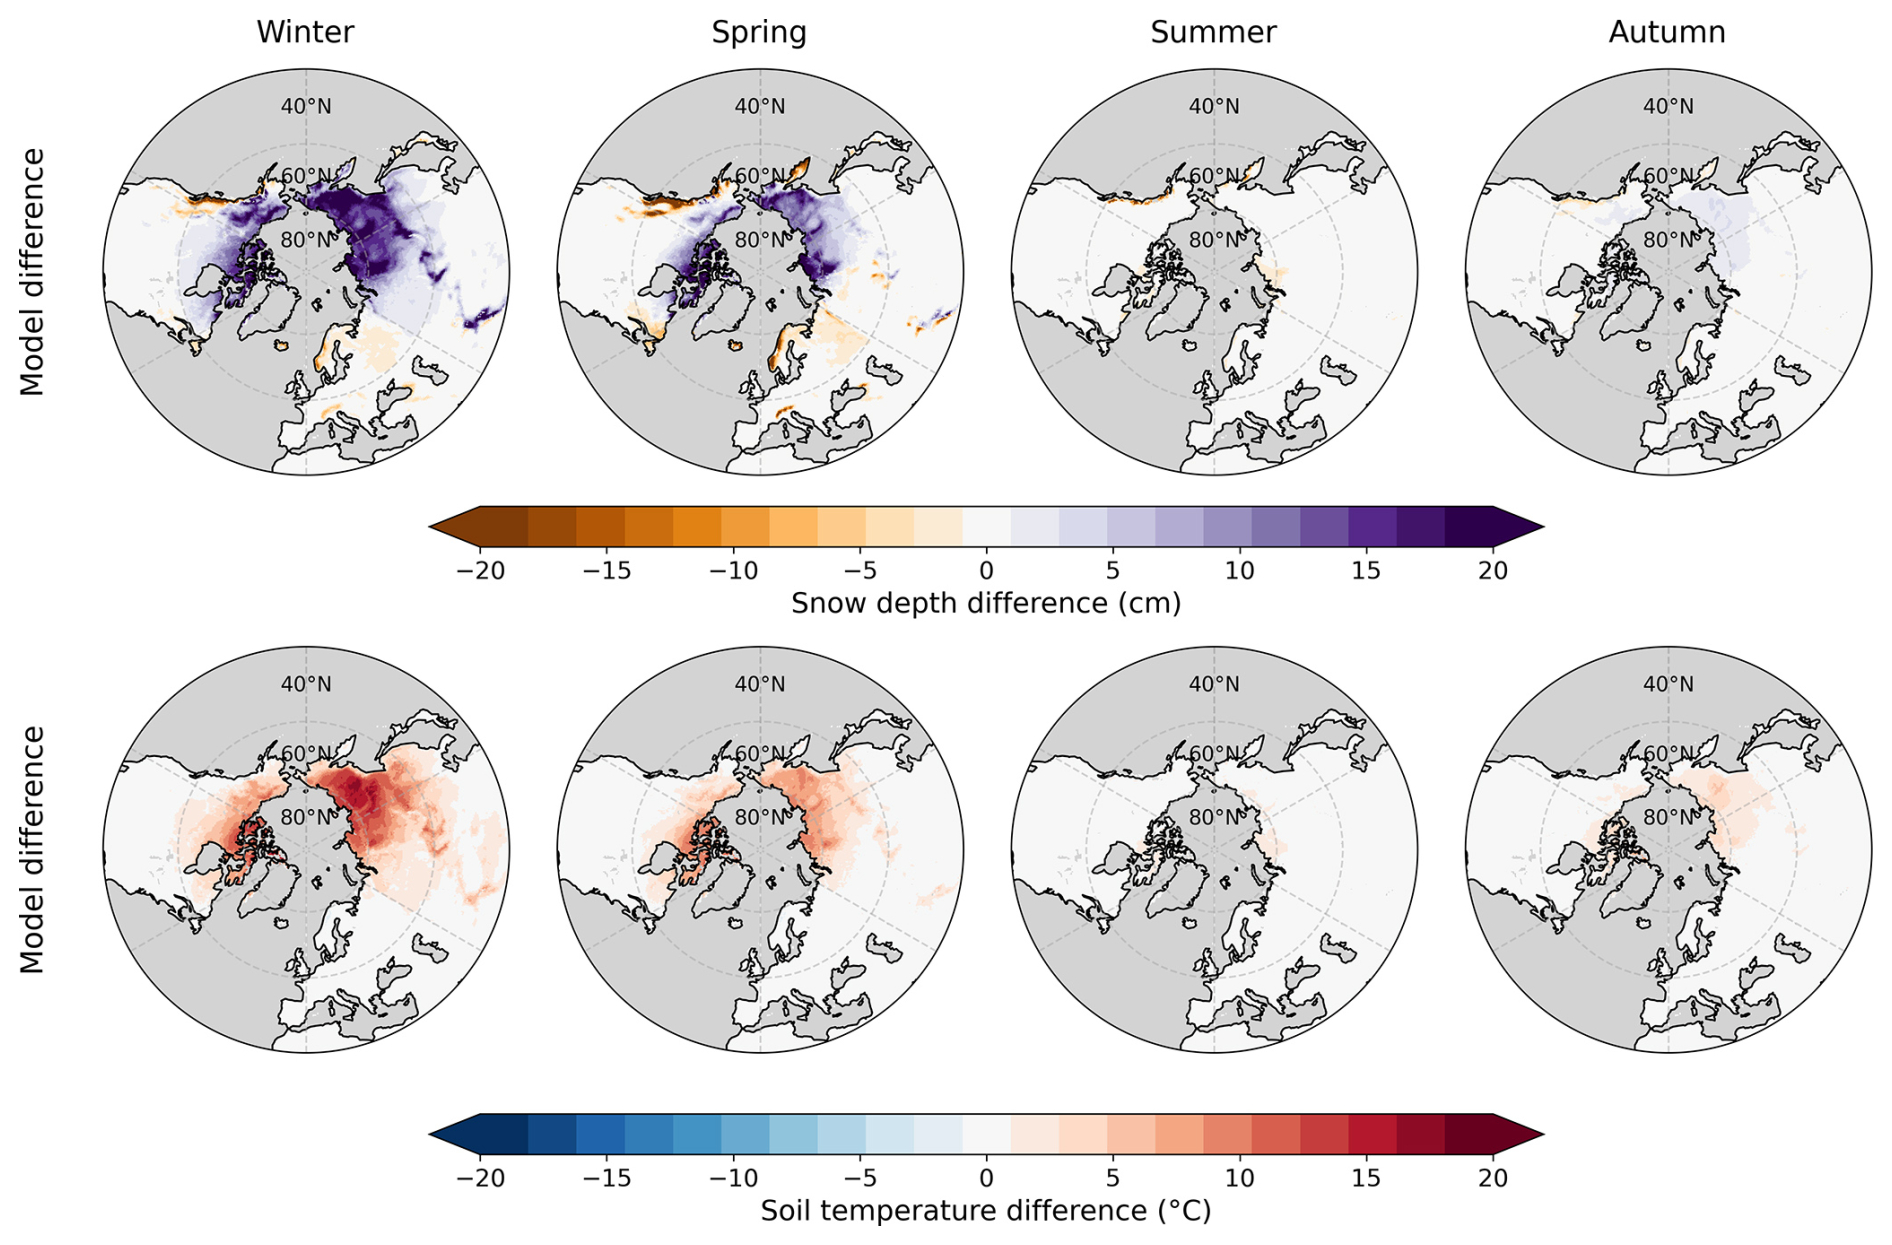
Figure B3Seasonal climatological mean differences (1986–2022) between the new and old JSBACH setups (model difference) for snow depth (upper panel) and soil temperature at 20 cm depth (lower panel).
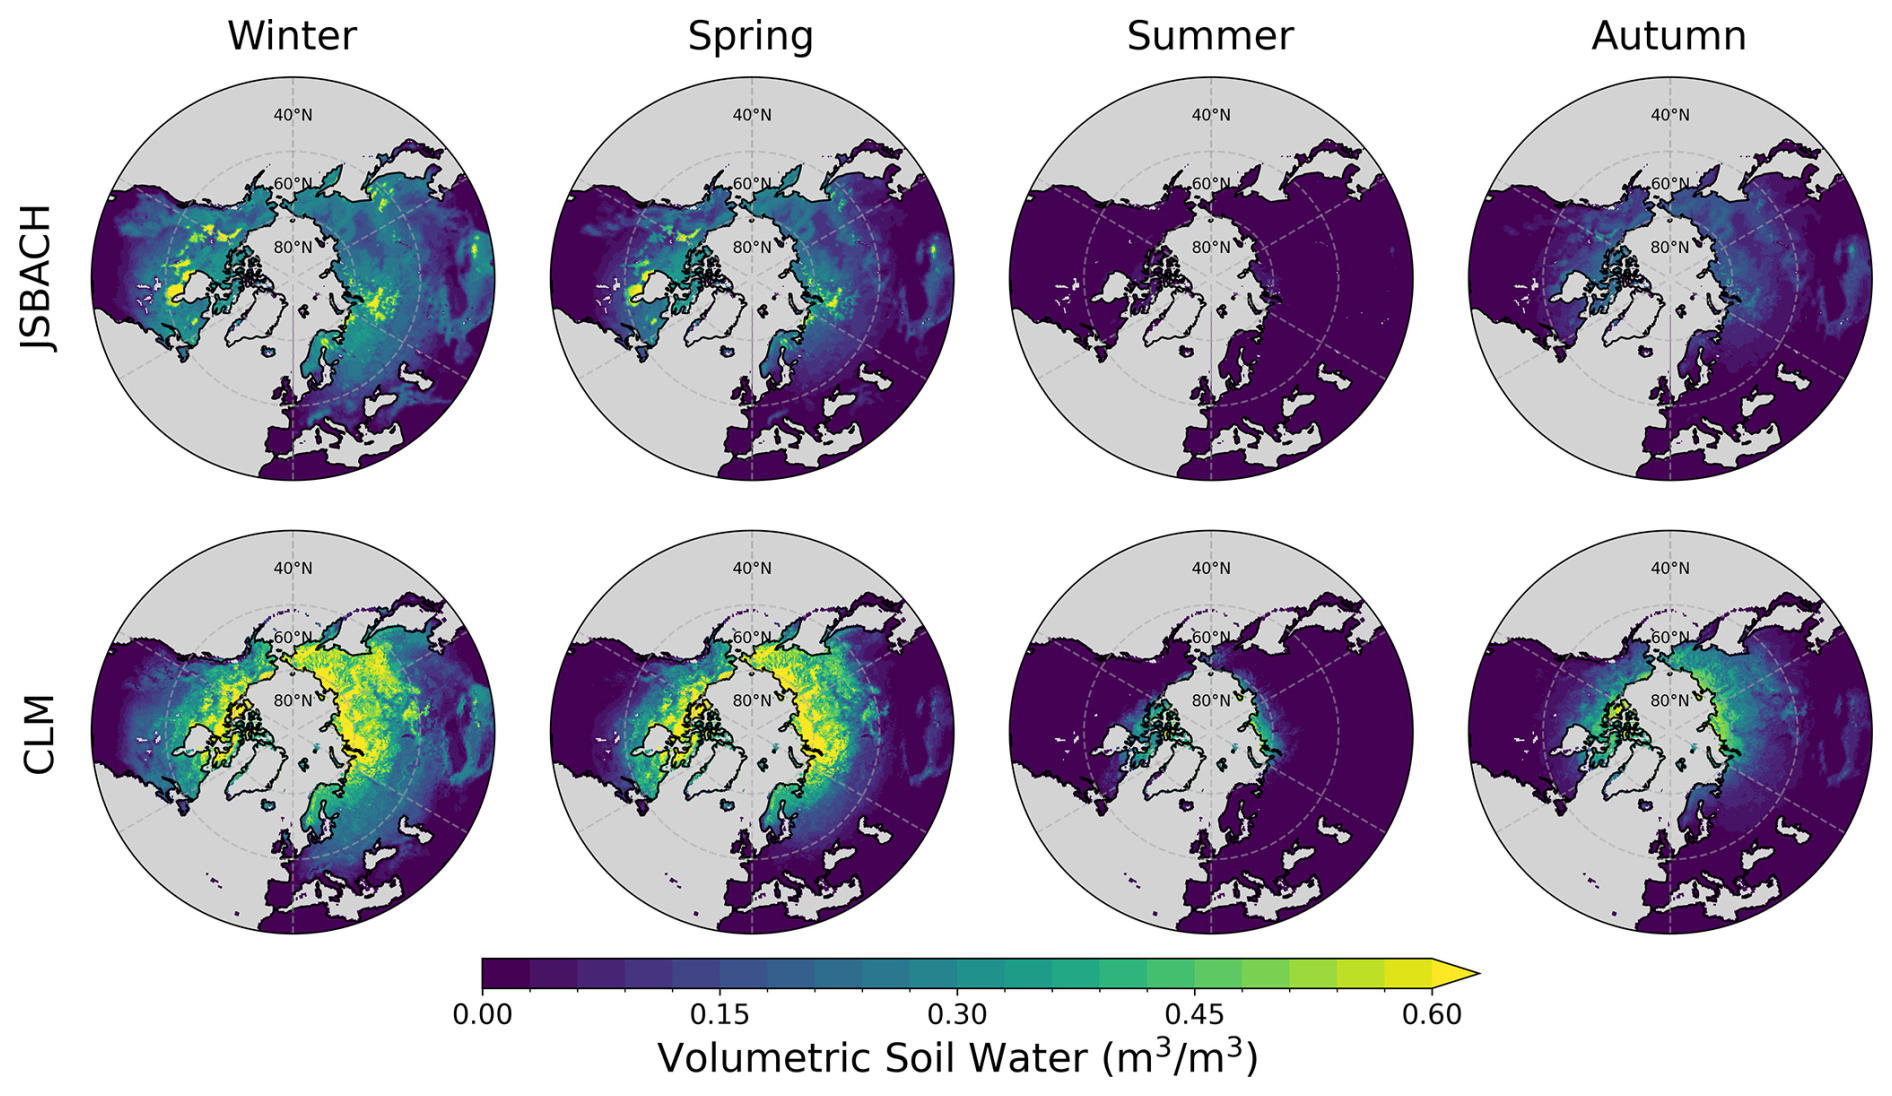
Figure B4Comparison of the seasonal climatology (1986–2022) of soil ice content (0–20 cm) over mid- to high-latitude regions (30–90° N) of the Northern Hemisphere between JSBACH (top row) and CLM (bottom row).
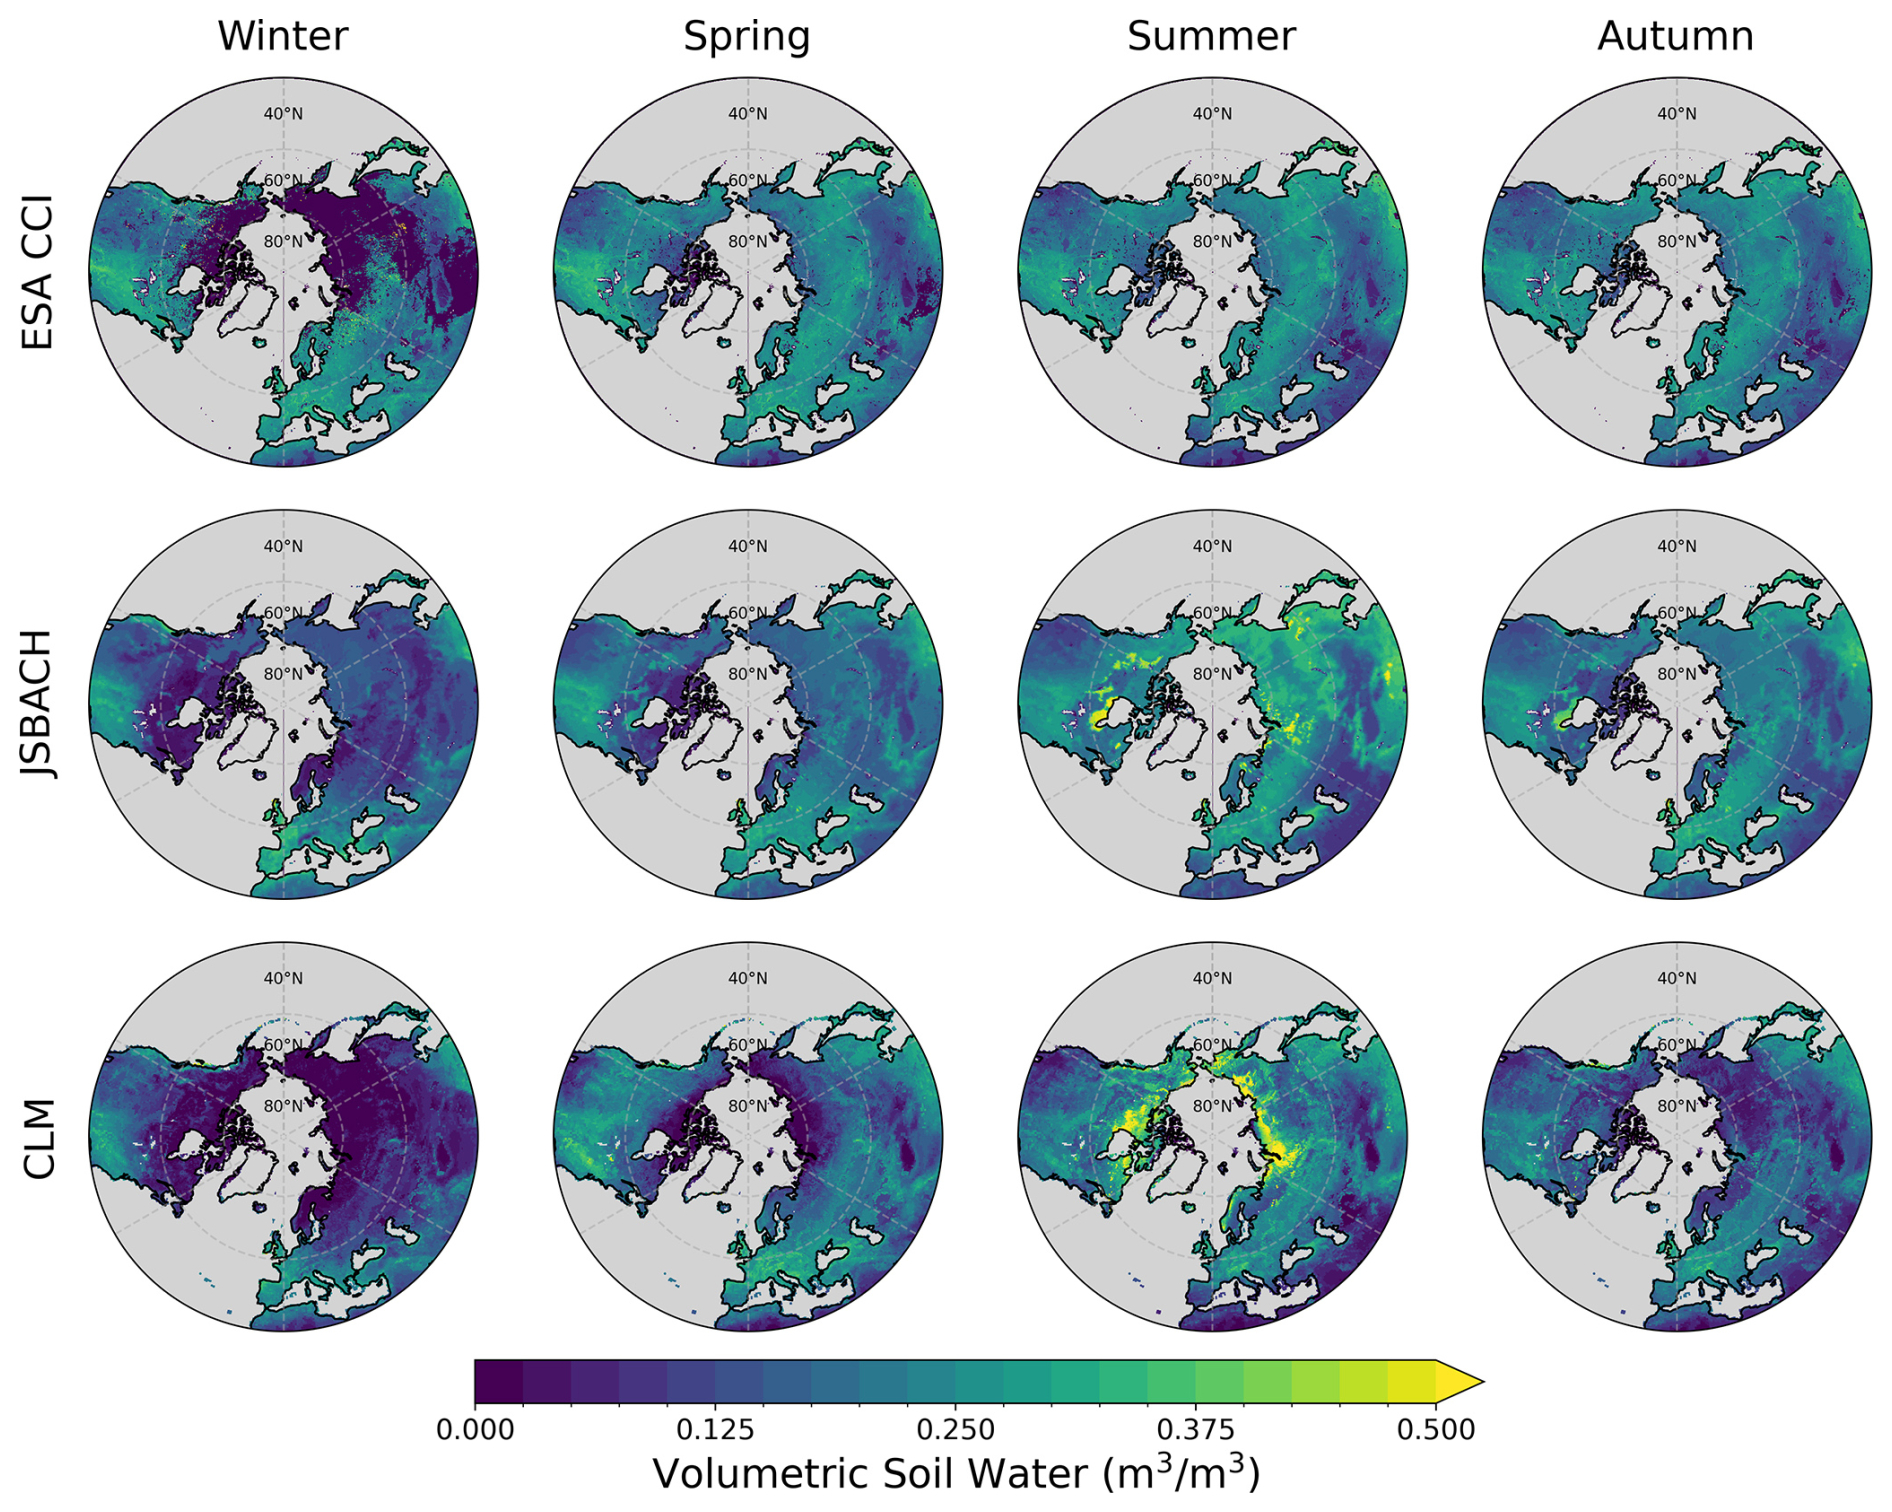
Figure B5Comparison of the seasonal climatology (1986–2022) of top-layer soil liquid water content over mid- to high-latitude regions (30–90° N) of the Northern Hemisphere, as derived from satellite data (ESA-CCI; top row) and simulated by models: JSBACH (middle row) and CLM (bottom row).
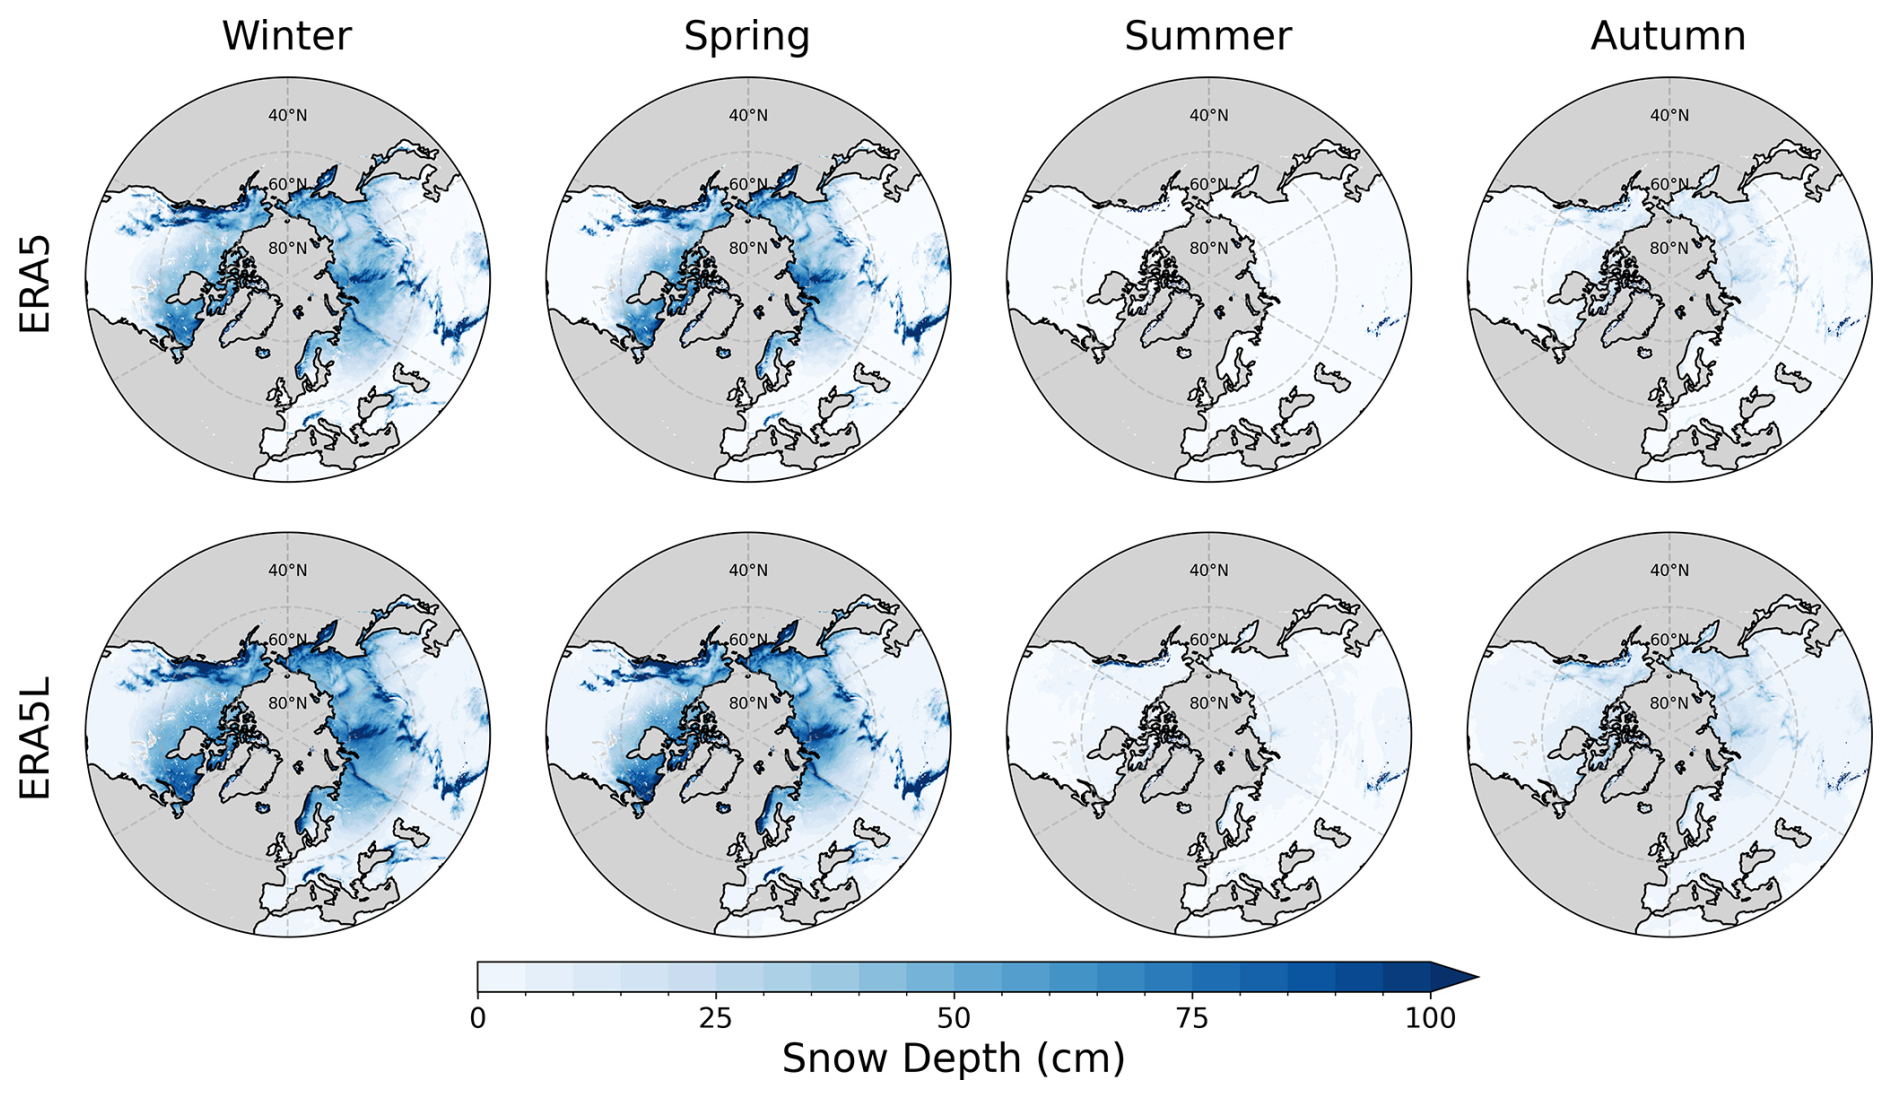
Figure B6Comparison of the seasonal climatology (1986–2022) of SD over mid- to high-latitude regions (30–90° N) of the Northern Hemisphere between ERA5 (top row) and ERA5L (bottom row).
The scripts used for data processing and analysis are available on Zenodo: https://doi.org/10.5281/zenodo.18110147 (Parmar et al., 2025). Also, a detailed report describing the improvements implemented in JSBACH is available at the same link. CLM model code: https://github.com/CMCC-Foundation/CTSM (last access: 30 March 2024). JSBACH model code: https://gitlab.dkrz.de/jsbach/jsbach/-/tree/bcaeb223249befb8c251efff29096fbe848b1b03 (last access: 16 June 2025).
ERA5-Land daily averaged data (1950–2022) were obtained from the Copernicus Climate Change Service (C3S) Climate Data Store (CDS; Muñoz-Sabater et al. (2021, 2024); https://doi.org/10.24381/cds.e9c9c792). Daily observational data from RIHMI-WDC were retrieved from http://meteo.ru/data/.
MP and BA designed the research framework and defined the methodology. MP conducted the JSBACH simulation with the help of TS and KF and CLM simulation with the help of AS, DP, and MB. MP collected the data, carried out the code development and calculations, and generated all figures; ZL helped in verifying the code implementation. AS, KF, and ZL provided methodological and statistical guidance for the data analysis. MP led the interpretation of the results with contributions from all co-authors. The results were discussed collectively by all authors. MP drafted the original manuscript, and all authors contributed to reviewing, editing, and approving the final version.
The contact author has declared that none of the authors has any competing interests.
Publisher's note: Copernicus Publications remains neutral with regard to jurisdictional claims made in the text, published maps, institutional affiliations, or any other geographical representation in this paper. The authors bear the ultimate responsibility for providing appropriate place names. Views expressed in the text are those of the authors and do not necessarily reflect the views of the publisher.
Mittal Parmar gratefully acknowledges funding from the DWD IDEA S4S project FS-SF (4823IDEAP2). This work made use of computational resources provided by the Deutsches Klimarechenzentrum (DKRZ), granted by its Scientific Steering Committee (WLA) under project ID bb1064, as well as resources from the Center for Scientific Computing (CSC) at Goethe University Frankfurt and the JUNO computing facilities at CMCC, Bologna. The authors thank Danny Risto (Goethe University Frankfurt), Silvio Gualdi and Enrico Scoccimarro from CMCC, Bologna, for their valuable insights and support throughout this research. The authors acknowledge the use of AI-assisted tools (e.g., ChatGPT and DeepSeek) for support with code scripting and rephrasing parts of the manuscript. We also acknowledge funding from the European Research Council under the European Union’s Horizon 2020 research and innovation program as part of the Q-Arctic project (grant agreement No 951288) to T. S. and from the China Scholarship Council (CSC) sponsorship to Z. L. (No.202006040064).
This research has been supported by the Bundesministeriums für Verkehr, Bau und Stadtentwicklung (grant no. DWD IDEA-S4S 4823IDEAP2).
This open-access publication was funded by Goethe University Frankfurt.
This paper was edited by Hanna Lee and reviewed by three anonymous referees.
Akyurek, Z., Kuter, S., Karaman, Ç. H., and Akpınar, B.: Understanding the Snow Cover Climatology over Turkey from ERA5-Land Reanalysis Data and MODIS Snow Cover Frequency Product, Geosciences, 13, 311, https://doi.org/10.3390/geosciences13100311, 2023. a
Anderson, E. A.: A point energy and mass balance model of a snow cover, Stanford University, https://repository.library.noaa.gov/view/noaa/6392 (last access: 14 October 2025), 1976. a
Bender, E., Lehning, M., and Fiddes, J.: Changes in Climatology, Snow Cover, and Ground Temperatures at High Alpine Locations, Frontiers in Earth Science, 8, https://doi.org/10.3389/feart.2020.00100, 2020. a
Bian, Q., Xu, Z., Zhao, L., Zhang, Y.-F., Zheng, H., Shi, C., Zhang, S., Xie, C., and Yang, Z.-L.: Evaluation and Intercomparison of Multiple Snow Water Equivalent Products over the Tibetan Plateau, J. Hydrometeorol., 20, 2043–2055, https://doi.org/10.1175/JHM-D-19-0011.1, 2019. a
Boli, C., Siqiong, L., Shihua, L., Yu, Z., and Di, M.: Effects of the soil freeze-thaw process on the regional climate of the Qinghai-Tibet Plateau, Climate Research, 59, 243–257, https://doi.org/10.3354/cr01217, 2014. a
Brovkin, V., Raddatz, T., Reick, C. H., Claussen, M., and Gayler, V.: Global biogeophysical interactions between forest and climate, Geophys. Res. Lett., 36, 2009GL037543, https://doi.org/10.1029/2009GL037543, 2009. a
Brown, J., Ferrians, O. J. J., Heginbottom, J. A., and Melnikov, E. S.: Circum-Arctic map of permafrost and ground ice conditions, US Geological Survey, Reston, VA, https://doi.org/10.13140/RG.2.1.2994.9040, 1997. a
Burke, E. J., Zhang, Y., and Krinner, G.: Evaluating permafrost physics in the Coupled Model Intercomparison Project 6 (CMIP6) models and their sensitivity to climate change, The Cryosphere, 14, 3155–3174, https://doi.org/10.5194/tc-14-3155-2020, 2020. a
Calonne, N., Flin, F., Morin, S., Lesaffre, B., Du Roscoat, S. R., and Geindreau, C.: Numerical and experimental investigations of the effective thermal conductivity of snow, Geophys. Res. Letters, 38, https://doi.org/10.1029/2011GL049234, 2011. a
Cao, B., Gruber, S., Zheng, D., and Li, X.: The ERA5-Land soil temperature bias in permafrost regions, The Cryosphere, 14, 2581–2595, https://doi.org/10.5194/tc-14-2581-2020, 2020. a, b
Cao, B., Arduini, G., and Zsoter, E.: Brief communication: Improving ERA5-Land soil temperature in permafrost regions using an optimized multi-layer snow scheme, The Cryosphere, 16, 2701–2708, https://doi.org/10.5194/tc-16-2701-2022, 2022. a, b, c
Cao, Z., Nan, Z., Hu, J., Chen, Y., and Zhang, Y.: A new 2010 permafrost distribution map over the Qinghai–Tibet Plateau based on subregion survey maps: a benchmark for regional permafrost modeling, Earth Syst. Sci. Data, 15, 3905–3930, https://doi.org/10.5194/essd-15-3905-2023, 2023. a
Chang, Y., Lyu, S., Luo, S., Li, Z., Fang, X., Chen, B., Li, R., and Chen, S.: Estimation of permafrost on the Tibetan Plateau under current and future climate conditions using the CMIP5 data, Int. J. Climatol., 38, 5659–5676, https://doi.org/10.1002/joc.5770, 2018. a
Chen, C., Peng, X., Frauenfeld, O. W., Zhao, Y., Yang, G., Tian, W., Li, X., Du, R., and Li, X.: Comprehensive Assessment of Seasonally Frozen Ground Changes in the Northern Hemisphere Based on Observations, J. Geophys. Res.-Atmos., 127, e2022JD037306, https://doi.org/10.1029/2022JD037306, 2022. a, b
Danabasoglu, G., Lamarque, J.-F., Bacmeister, J., Bailey, D., DuVivier, A., Edwards, J., Emmons, L., Fasullo, J., Garcia, R., Gettelman, A., Hannay, C., Holland, M. M., Large, W. G., Lauritzen, P. H., Lawrence, D. M., Lenaerts, J. T. M., Lindsay, K., Lipscomb, W. H., Mills, M. J., Neale, R., Oleson, K. W., Otto-Bliesner, B., Phillips, A. S., Sacks, W., Tilmes, S., van Kampenhout, L., Vertenstein, M., Bertini, A., Dennis, J., Deser, C., Fischer, C., Fox-Kemper, B., Kay, J. E., Kinnison, D., Kushner, P. J., Larson, V. E., Long, M. C., Mickelson, S., Moore, J. K., Nienhouse, E., Polvani, L., Rasch, P. J., and Strand, W. G.: The community earth system model version 2 (CESM2), J. Adv. Model. Earth Sy., 12, e2019MS001916, https://doi.org/10.1029/2019MS001916, 2020. a
De Vrese, P., Georgievski, G., Gonzalez Rouco, J. F., Notz, D., Stacke, T., Steinert, N. J., Wilkenskjeld, S., and Brovkin, V.: Representation of soil hydrology in permafrost regions may explain large part of inter-model spread in simulated Arctic and subarctic climate, The Cryosphere, 17, 2095–2118, https://doi.org/10.5194/tc-17-2095-2023, 2023. a, b
De Vries, D. A.: Thermal Properties of Soils, in: Physics of Plant Environment, edited by: van Wijk, W. R., North-Holland Publishing Company, Amsterdam, 1963. a, b
Ekici, A., Beer, C., Hagemann, S., Boike, J., Langer, M., and Hauck, C.: Simulating high-latitude permafrost regions by the JSBACH terrestrial ecosystem model, Geosci. Model Dev., 7, 631–647, https://doi.org/10.5194/gmd-7-631-2014, 2014. a, b, c
Farouki, O. T.: The thermal properties of soils in cold regions, Cold Reg. Sci. Technol., 5, 67–75, https://doi.org/10.1016/0165-232X(81)90041-0, 1981. a
Frauenfeld, O. W. and Zhang, T.: An observational 71-year history of seasonally frozen ground changes in the Eurasian high latitudes, Environ. Res. Lett., 6, 044024, https://doi.org/10.1088/1748-9326/6/4/044024, 2011. a, b
Frauenfeld, O. W., Zhang, T., Barry, R. G., and Gilichinsky, D.: Interdecadal changes in seasonal freeze and thaw depths in Russia, J. Geophys. Res.-Atmos., 109, 2003JD004245, https://doi.org/10.1029/2003JD004245, 2004. a
González-Rouco, J. F., Steinert, N. J., García-Bustamante, E., Hagemann, S., De Vrese, P., Jungclaus, J. H., Lorenz, S. J., Melo-Aguilar, C., García-Pereira, F., and Navarro, J.: Increasing the Depth of a Land Surface Model. Part I: Impacts on the Subsurface Thermal Regime and Energy Storage, J. Hydrometeorol., 22, 3211–3230, https://doi.org/10.1175/JHM-D-21-0024.1, 2021. a
Gruber, S.: Derivation and analysis of a high-resolution estimate of global permafrost zonation, The Cryosphere, 6, 221–233, https://doi.org/10.5194/tc-6-221-2012, 2012. a
Guo, D., Wang, H., and Li, D.: A projection of permafrost degradation on the Tibetan Plateau during the 21st century, J. Geophys. Res., 117, 2011JD016545, https://doi.org/10.1029/2011JD016545, 2012. a
Guo, H. and Yang, Y.: Spring snow-albedo feedback from satellite observation, reanalysis and model simulations over the Northern Hemisphere, Sci. China Earth Sci., 65, 1463–1476, https://doi.org/10.1007/s11430-021-9913-1, 2022. a
Heise, E., Ritter, B., and Schrodin, R.: COSMO Technical Report No. 9: Operational Implementation of the Multilayer Soil Model, https://doi.org/10.5676/DWD_PUB/NWV/COSMO-TR_9, 2006. a, b
Hersbach, H., Bell, B., Berrisford, P., Hirahara, S., Horányi, A., Muñoz‐Sabater, J., Nicolas, J., Peubey, C., Radu, R., Schepers, D., Simmons, A., Soci, C., Abdalla, S., Abellan, X., Balsamo, G., Bechtold, P., Biavati, G., Bidlot, J., Bonavita, M., De Chiara, G., Dahlgren, P., Dee, D., Diamantakis, M., Dragani, R., Flemming, J., Forbes, R., Fuentes, M., Geer, A., Haimberger, L., Healy, S., Hogan, R. J., Hólm, E., Janisková, M., Keeley, S., Laloyaux, P., Lopez, P., Lupu, C., Radnoti, G., De Rosnay, P., Rozum, I., Vamborg, F., Villaume, S., and Thépaut, J.: The ERA5 global reanalysis, Q. J. Roy. Meteorol. Soc., 146, 1999–2049, https://doi.org/10.1002/qj.3803, 2020. a, b
Hua, H., Wang, J., Zohner, C. M., Peñuelas, J., Ran, Y., and Wu, C.: Accelerated land surface greening caused by earlier permafrost thawing, Nat. Commun., https://doi.org/10.1038/s41467-025-67644-1, 2025. a
Jan, A., Ogden, F. L., Kindl da Cunha, L. L., McDaniel, R., Flowers, T., and Jennings, K. S.: Evaluating Soil Freeze Thaw Approaches for Hydrologic Models Using the Next Generation Water Resources Modeling Framework, AGU Fall Meeting Abstracts, 2022, 2022AGUFM.H45I1501J, 2022. a
Jin, H., He, R., Cheng, G., Wu, Q., Wang, S., Lü, L., and Chang, X.: Changes in frozen ground in the Source Area of the Yellow River on the Qinghai–Tibet Plateau, China, and their eco-environmental impacts, Environ. Res. Lett., 4, 045206, https://doi.org/10.1088/1748-9326/4/4/045206, 2009. a
Johansen, O.: Thermal conductivity of soils, https://apps.dtic.mil/sti/html/tr/ADA044002/ (last access: 15 October 2025), 1977. a
Jordan, R. E.: A One-dimensional temperature model for a snow cover: technical documentation for SNTHERM.89, https://hdl.handle.net/11681/11677 (last access: 20 October 2025), 1991. a
Jungclaus, J. H., Lorenz, S. J., Schmidt, H., Brovkin, V., Brüggemann, N., Chegini, F., Crüger, T., De‐Vrese, P., Gayler, V., Giorgetta, M. A., Gutjahr, O., Haak, H., Hagemann, S., Hanke, M., Ilyina, T., Korn, P., Kröger, J., Linardakis, L., Mehlmann, C., Mikolajewicz, U., Müller, W. A., Nabel, J. E. M. S., Notz, D., Pohlmann, H., Putrasahan, D. A., Raddatz, T., Ramme, L., Redler, R., Reick, C. H., Riddick, T., Sam, T., Schneck, R., Schnur, R., Schupfner, M., Von Storch, J. ‐S., Wachsmann, F., Wieners, K. ‐H., Ziemen, F., Stevens, B., Marotzke, J., and Claussen, M.: The ICON Earth System Model Version 1.0, J. Adv. Model. Earth Sy., 14, e2021MS002813, https://doi.org/10.1029/2021MS002813, 2022. a
Kouki, K., Luojus, K., and Riihelä, A.: Evaluation of snow cover properties in ERA5 and ERA5-Land with several satellite-based datasets in the Northern Hemisphere in spring 1982–2018, The Cryosphere, 17, 5007–5026, https://doi.org/10.5194/tc-17-5007-2023, 2023. a, b
Koven, C. D., Riley, W. J., Subin, Z. M., Tang, J. Y., Torn, M. S., Collins, W. D., Bonan, G. B., Lawrence, D. M., and Swenson, S. C.: The effect of vertically resolved soil biogeochemistry and alternate soil C and N models on C dynamics of CLM4, Biogeosciences, 10, 7109–7131, https://doi.org/10.5194/bg-10-7109-2013, 2013a. a
Koven, C. D., Riley, W. J., and Stern, A.: Analysis of Permafrost Thermal Dynamics and Response to Climate Change in the CMIP5 Earth System Models, J. Climate, 26, 1877–1900, https://doi.org/10.1175/JCLI-D-12-00228.1, 2013b. a
Langer, M., Nitzbon, J., Groenke, B., Assmann, L.-M., Schneider von Deimling, T., Stuenzi, S. M., and Westermann, S.: The evolution of Arctic permafrost over the last 3 centuries from ensemble simulations with the CryoGridLite permafrost model, The Cryosphere, 18, 363–385, https://doi.org/10.5194/tc-18-363-2024, 2024. a
Lawrence, D. M. and Slater, A. G.: The contribution of snow condition trends to future ground climate, Clim. Dynam., 34, 969–981, https://doi.org/10.1007/s00382-009-0537-4, 2010. a, b
Lawrence, D. M., Slater, A. G., Romanovsky, V. E., and Nicolsky, D. J.: Sensitivity of a model projection of near‐surface permafrost degradation to soil column depth and representation of soil organic matter, J. Geophys. Res.-Earth, 113, 2007JF000883, https://doi.org/10.1029/2007JF000883, 2008. a
Lawrence, D. M., Slater, A. G., and Swenson, S. C.: Simulation of Present-Day and Future Permafrost and Seasonally Frozen Ground Conditions in CCSM4, J. Climate, 25, 2207–2225, https://doi.org/10.1175/JCLI-D-11-00334.1, 2012. a
Lawrence, D. M., Fisher, R. A., Koven, C. D., Oleson, K. W., Swenson, S. C., Bonan, G., Collier, N., Ghimire, B., Van Kampenhout, L., Kennedy, D., Kluzek, E., Lawrence, P. J., Li, F., Li, H., Lombardozzi, D., Riley, W. J., Sacks, W. J., Shi, M., Vertenstein, M., Wieder, W. R., Xu, C., Ali, A. A., Badger, A. M., Bisht, G., Van Den Broeke, M., Brunke, M. A., Burns, S. P., Buzan, J., Clark, M., Craig, A., Dahlin, K., Drewniak, B., Fisher, J. B., Flanner, M., Fox, A. M., Gentine, P., Hoffman, F., Keppel‐Aleks, G., Knox, R., Kumar, S., Lenaerts, J., Leung, L. R., Lipscomb, W. H., Lu, Y., Pandey, A., Pelletier, J. D., Perket, J., Randerson, J. T., Ricciuto, D. M., Sanderson, B. M., Slater, A., Subin, Z. M., Tang, J., Thomas, R. Q., Val Martin, M., and Zeng, X.: The Community Land Model Version 5: Description of New Features, Benchmarking, and Impact of Forcing Uncertainty, J. Adv. Model. Earth Sy., 11, 4245–4287, https://doi.org/10.1029/2018MS001583, 2019. a, b, c, d
Li, S., Nan, Z., and Zhao, L.: Impact of soil freezing and thawing process on thermal exchange between atmosphere and ground surface, J. Glaciol. Geocryol, 24, 506–511, 2002. a, b
Li, T., Chen, Y.-Z., Han, L.-J., Cheng, L.-H., Lv, Y.-H., Fu, B.-J., Feng, X.-M., and Wu, X.: Shortened duration and reduced area of frozen soil in the Northern Hemisphere, The Innovation, 2, 100146, https://doi.org/10.1016/j.xinn.2021.100146, 2021. a, b, c
Li, X., Jin, R., Pan, X., Zhang, T., and Guo, J.: Changes in the near-surface soil freeze–thaw cycle on the Qinghai-Tibetan Plateau, Int. J. Appl. Earth Obs., 17, 33–42, https://doi.org/10.1016/j.jag.2011.12.002, 2012. a
Luo, S., Fang, X., Lyu, S., Ma, D., Chang, Y., Song, M., and Chen, H.: Frozen ground temperature trends associated with climate change in the Tibetan Plateau Three River Source Region from 1980 to 2014, Climate Research, 67, 241–255, https://doi.org/10.3354/cr01371, 2016. a
Luo, S., Wang, J., Pomeroy, J. W., and Lyu, S.: Freeze–Thaw Changes of Seasonally Frozen Ground on the Tibetan Plateau from 1960 to 2014, J. Climate, 33, 9427–9446, https://doi.org/10.1175/JCLI-D-19-0923.1, 2020. a, b, c
Luo, Z., Risto, D., and Ahrens, B.: Assessing uncertainties in modeling the climate of the Siberian frozen soils by contrasting CMIP6 and LS3MIP, The Cryosphere, 19, 6547–6576, https://doi.org/10.5194/tc-19-6547-2025, 2025. a
Matthes, H., Damseaux, A., Westermann, S., Beer, C., Boone, A., Burke, E., Decharme, B., Genet, H., Jafarov, E., Langer, M., Parmentier, F., Porada, P., Gagne‐Landmann, A., Huntzinger, D., Rogers, B. M., Schädel, C., Stacke, T., Wells, J., and Wieder, W. R.: Advances in Permafrost Representation: Biophysical Processes in Earth System Models and the Role of Offline Models, Permafrost Periglac., 36, 302–318, https://doi.org/10.1002/ppp.2269, 2025. a
Muñoz-Sabater, J., Dutra, E., Agustí-Panareda, A., Albergel, C., Arduini, G., Balsamo, G., Boussetta, S., Choulga, M., Harrigan, S., Hersbach, H., Martens, B., Miralles, D. G., Piles, M., Rodríguez-Fernández, N. J., Zsoter, E., Buontempo, C., and Thépaut, J.-N.: ERA5-Land: a state-of-the-art global reanalysis dataset for land applications, Earth System Science Data, 13, 4349–4383, https://doi.org/10.5194/essd-13-4349-2021, 2021. a, b
Muñoz Sabater, J., Comyn-Platt, E., Hersbach, H., Bell, B., Berrisford, P., Biavati, G., Horányi, A., Muñoz Sabater, J., Nicolas, J., Peubey, C., Radu, R., Rozum, I., Schepers, D., Simmons, A., Soci, C., Dee, D., Thépaut, J.-N., Cagnazo, C., and Cucchi, M.: ERA5-land post-processed daily-statistics from 1950 to present, Copernicus Climate Change Service (C3S) Climate Data Store (CDS) [data set], https://doi.org/10.24381/cds.e9c9c792, 2024. a
Niu, G.-Y. and Yang, Z.-L.: Effects of Frozen Soil on Snowmelt Runoff and Soil Water Storage at a Continental Scale, J. Hydrometeorol., 7, 937–952, https://doi.org/10.1175/JHM538.1, 2006. a, b
Osokin, N. I., Samoylov, R. S., Sosnovskiy, A. V., Sokratov, S. A., and Zhidkov, V. A.: Model of the influence of snow cover on soil freezing, Ann. Glaciol., 31, 417–421, https://doi.org/10.3189/172756400781820282, 2000. a
Pan, Y., Li, X., and Li, S.: Effects of different soil thermal conductivity schemes on the simulation of permafrost on the Tibetan Plateau, Geoderma, 442, 116789, https://doi.org/10.1016/j.geoderma.2024.116789, 2024. a
Parmar, M., Fröhlich, K., Stacke, T., Sanna, A., Luo, Z., Peano, D., Benassi, M., and Ahrens, B.: Evaluation of representation of seasonally frozen ground characteristics in Land Surface Models: JSBACH and CLM, Zenodo [software], https://doi.org/10.5281/zenodo.18110147, 2025. a
Peng, X., Zhang, T., Cao, B., Wang, Q., Wang, K., Shao, W., and Guo, H.: Changes in Freezing-Thawing Index and Soil Freeze Depth Over the Heihe River Basin, Western China, Arct. Antarct. Alp. Res., 48, 161–176, https://doi.org/10.1657/AAAR00C-13-127, 2016. a
Peng, X., Zhang, T., Frauenfeld, O. W., Wang, K., Cao, B., Zhong, X., Su, H., and Mu, C.: Response of seasonal soil freeze depth to climate change across China, The Cryosphere, 11, 1059–1073, https://doi.org/10.5194/tc-11-1059-2017, 2017. a
Peng, X., Zhang, T., Frauenfeld, O. W., Du, R., Wei, Q., and Liang, B.: Soil freeze depth variability across Eurasia during 1850–2100, Climatic Change, 158, 531–549, https://doi.org/10.1007/s10584-019-02586-4, 2020. a
Peng, X., Zhang, T., Frauenfeld, O. W., Mu, C., Wang, K., Wu, X., Guo, D., Luo, J., Hjort, J., Aalto, J., Karjalainen, O., and Luoto, M.: Active Layer Thickness and Permafrost Area Projections for the 21st Century, Earth’s Future, 11, e2023EF003573, https://doi.org/10.1029/2023EF003573, 2023. a
Raddatz, T. J., Reick, C. H., Knorr, W., Kattge, J., Roeckner, E., Schnur, R., Schnitzler, K.-G., Wetzel, P., and Jungclaus, J.: Will the tropical land biosphere dominate the climate–carbon cycle feedback during the twenty-first century?, Clim. Dynam., 29, 565–574, https://doi.org/10.1007/s00382-007-0247-8, 2007. a
Ran, Y., Li, X., Cheng, G., Nan, Z., Che, J., Sheng, Y., Wu, Q., Jin, H., Luo, D., Tang, Z., and Wu, X.: Mapping the permafrost stability on the Tibetan Plateau for 2005–2015, Science China Earth Sciences, 64, 62–79, https://doi.org/10.1007/s11430-020-9685-3, 2021. a
Ran, Y., Li, X., Cheng, G., Che, J., Aalto, J., Karjalainen, O., Hjort, J., Luoto, M., Jin, H., Obu, J., Hori, M., Yu, Q., and Chang, X.: New high-resolution estimates of the permafrost thermal state and hydrothermal conditions over the Northern Hemisphere, Earth Syst. Sci. Data, 14, 865–884, https://doi.org/10.5194/essd-14-865-2022, 2022. a, b, c
Reick, C. H., Raddatz, T., Brovkin, V., and Gayler, V.: Representation of natural and anthropogenic land cover change in MPI‐ESM, J. Adv. Model. Earth Sy., 5, 459–482, https://doi.org/10.1002/jame.20022, 2013. a
Reick, C. H., Gayler, V., Goll, D., Hagemann, S., Heidkamp, M., Nabel, J. E. M. S., Raddatz, T., Roeckner, E., Schnur, R., and Wilkenskjeld, S.: JSBACH 3 – The land component of the MPI Earth System Model: documentation of version Berichte zur Erdsystemforschung, 240, https://doi.org/10.17617/2.3279802, 2021. a, b, c
Risto, D., Fröhlich, K., and Ahrens, B.: Snow Representation over Siberia in Operational Seasonal Forecasting Systems, Atmosphere, 13, 1002, https://doi.org/10.3390/atmos13071002, 2022. a
Sarpong, R. and Nazemi, A.: Benchmarking Snow Fields of ERA5-Land in the Northern Regions of North America, EGUsphere [preprint], https://doi.org/10.5194/egusphere-2024-4150, 2025. a
Schmidt, M. W. I., Torn, M. S., Abiven, S., Dittmar, T., Guggenberger, G., Janssens, I. A., Kleber, M., Kögel-Knabner, I., Lehmann, J., Manning, D. A. C., Nannipieri, P., Rasse, D. P., Weiner, S., and Trumbore, S. E.: Persistence of soil organic matter as an ecosystem property, Nature, 478, 49–56, https://doi.org/10.1038/nature10386, 2011. a
Schneck, R., Gayler, V., Nabel, J. E. M. S., Raddatz, T., Reick, C. H., and Schnur, R.: Assessment of JSBACHv4.30 as a land component of ICON-ESM-V1 in comparison to its predecessor JSBACHv3.2 of MPI-ESM1.2, Geosci. Model Dev., 15, 8581–8611, https://doi.org/10.5194/gmd-15-8581-2022, 2022. a, b, c
Schuur, E. A. G., Vogel, J. G., Crummer, K. G., Lee, H., Sickman, J. O., and Osterkamp, T. E.: The effect of permafrost thaw on old carbon release and net carbon exchange from tundra, Nature, 459, 556–559, https://doi.org/10.1038/nature08031, 2009. a
Slater, A. G. and Lawrence, D. M.: Diagnosing Present and Future Permafrost from Climate Models, J. Climate, 26, 5608–5623, https://doi.org/10.1175/JCLI-D-12-00341.1, 2013. a, b
Slater, A. G., Bohn, T. J., McCreight, J. L., Serreze, M. C., and Lettenmaier, D. P.: A multimodel simulation of pan‐Arctic hydrology, J. Geophys. Res.-Biogeo., 112, 2006JG000303, https://doi.org/10.1029/2006JG000303, 2007. a
Steinert, N. J., Debolskiy, M. V., Burke, E. J., García-Pereira, F., and Lee, H.: Evaluating permafrost definitions for global permafrost area estimates in CMIP6 climate models, Environ. Res. Lett., 19, 014033, https://doi.org/10.1088/1748-9326/ad10d7, 2024. a
Steurer, P. M. and Crandell, J. H.: Comparison of methods used to create estimate of air-freezing index, J. Cold Reg. Eng., 9, 64–74, 1995. a
Stuurop, J. C., Van Der Zee, S. E. A. T. M., and French, H. K.: The influence of soil texture and environmental conditions on frozen soil infiltration: A numerical investigation, Cold Reg. Sci. Technol., 194, 103456, https://doi.org/10.1016/j.coldregions.2021.103456, 2022. a
Verseghy, D. L.: Class – A Canadian land surface scheme for GCMS. I. Soil model, Int. J. Climatol., 11, 111–133, https://doi.org/10.1002/joc.3370110202, 1991. a
Wang, K., Zhang, T., and Zhong, X.: Changes in the timing and duration of the near-surface soil freeze/thaw status from 1956 to 2006 across China, The Cryosphere, 9, 1321–1331, https://doi.org/10.5194/tc-9-1321-2015, 2015. a
Wang, W., Rinke, A., Moore, J. C., Ji, D., Cui, X., Peng, S., Lawrence, D. M., McGuire, A. D., Burke, E. J., Chen, X., Decharme, B., Koven, C., MacDougall, A., Saito, K., Zhang, W., Alkama, R., Bohn, T. J., Ciais, P., Delire, C., Gouttevin, I., Hajima, T., Krinner, G., Lettenmaier, D. P., Miller, P. A., Smith, B., Sueyoshi, T., and Sherstiukov, A. B.: Evaluation of air–soil temperature relationships simulated by land surface models during winter across the permafrost region, The Cryosphere, 10, 1721–1737, https://doi.org/10.5194/tc-10-1721-2016, 2016. a, b
Wang, X. and Chen, R.: Influence of snow cover on soil freeze depth across China, Geoderma, 428, 116195, https://doi.org/10.1016/j.geoderma.2022.116195, 2022. a, b
Wang, X. and Chen, R.: Freezing and thawing characteristics of seasonally frozen ground across China, Geoderma, 448, 116966, https://doi.org/10.1016/j.geoderma.2024.116966, 2024. a
Wigmosta, M. S., Vail, L. W., and Lettenmaier, D. P.: A distributed hydrology‐vegetation model for complex terrain, Water Resour. Res., 30, 1665–1679, https://doi.org/10.1029/94WR00436, 1994. a
Yang, S., Li, R., Wu, T., Wu, X., Zhao, L., Hu, G., Zhu, X., Du, Y., Xiao, Y., Zhang, Y., Ma, J., Du, E., Shi, J., and Qiao, Y.: Evaluation of soil thermal conductivity schemes incorporated into CLM5.0 in permafrost regions on the Tibetan Plateau, Geoderma, 401, 115330, https://doi.org/10.1016/j.geoderma.2021.115330, 2021. a
Yang, S., Li, R., Zhao, L., Wu, T., Wu, X., Zhang, Y., Shi, J., and Qiao, Y.: Evaluation of the Performance of CLM5.0 in Soil Hydrothermal Dynamics in Permafrost Regions on the Qinghai–Tibet Plateau, Remote Sensing, 14, 6228, https://doi.org/10.3390/rs14246228, 2022. a
Zhang, T.: Distribution of seasonally and perennially frozen ground in the northern hemisphere, in: Proceedings of the 8th International Conference on Permafrost, 21–25 July 2003, Zurich, Switzerland, 1289–1294, https://www.researchgate.net/publication/272792615_Distribution_of_seasonally_and_perenially_frozen_ground_in_the_Northern_Hemisphere (last access: 10 October 2025), 2003. a
Zhang, T.: Influence of the seasonal snow cover on the ground thermal regime: An overview, Rev. Geophys., 43, 2004RG000157, https://doi.org/10.1029/2004RG000157, 2005. a, b
Zhang, T., Osterkamp, T. E., and Stamnes, K.: Effects of Climate on the Active Layer and Permafrost on the North Slope of Alaska, U.S.A., Permafrost Periglac., 8, 45–67, https://doi.org/10.1002/(SICI)1099-1530(199701)8:1<45::AID-PPP240>3.0.CO;2-K, 1997. a
Zhang, T., Heginbottom, J. A., Barry, R. G., and Brown, J.: Further statistics on the distribution of permafrost and ground ice in the Northern Hemisphere1, Polar Geography, 24, 126–131, https://doi.org/10.1080/10889370009377692, 2000. a
Zhang, T., Frauenfeld, O. W., Serreze, M. C., Etringer, A., Oelke, C., McCreight, J., Barry, R. G., Gilichinsky, D., Yang, D., Ye, H., Ling, F., and Chudinova, S.: Spatial and temporal variability in active layer thickness over the Russian Arctic drainage basin, J. Geophys. Res.-Atmos., 110, 2004JD005642, https://doi.org/10.1029/2004JD005642, 2005. a
Zhang, W., Shen, Y., Wang, X., Kang, S., Chen, A., Mao, W., and Zhong, X.: Snow cover controls seasonally frozen ground regime on the southern edge of Altai Mountains, Agr. Forest Meteorol., 297, 108271, https://doi.org/10.1016/j.agrformet.2020.108271, 2021. a
Zhao, Z., Fu, R., Liu, J., Dai, L., Guo, X., Du, Y., Hu, Z., and Cao, G.: Response of Seasonally Frozen Ground to Climate Changes in the Northeastern Qinghai-Tibet Plateau, Frontiers in Environmental Science, 10, 912209, https://doi.org/10.3389/fenvs.2022.912209, 2022. a
Zheng, D., Van Der Velde, R., Su, Z., Wen, J., and Wang, X.: Assessment of Noah land surface model with various runoff parameterizations over a Tibetan river, J. Geophys. Res.-Atmos., 122, 1488–1504, https://doi.org/10.1002/2016JD025572, 2017. a, b