the Creative Commons Attribution 4.0 License.
the Creative Commons Attribution 4.0 License.
 | 14 May 2025
Predicting avalanche danger in northern Norway using statistical models
Rune Grand Graversen
Snow avalanches are one of the most impactful natural hazards in mountainous areas. Thus, the assessment and forecasting of avalanche danger are of great importance for the protection of life and property. A changing climate may lead to changes in avalanche danger, although the manifestation is unclear. Since climate change is regionally different, an assessment of potential avalanche-danger changes should be conducted on a regional basis. Here the focus is on avalanche danger in the Troms region in northern Norway, i.e. a region in the Arctic. To estimate the linkage between avalanche danger and weather conditions in this region, we utilise expert assessments of regional avalanche-danger level (ADL), the 3 km Norwegian Reanalysis (NORA3), and snow-cover information from the snow model seNorge. Random forest (RF) models are trained and optimised for a binary case and for a four-level case. The binary-case RF model exhibits a much higher overall accuracy (76 %) than the four-level case RF model (57 %), which is due to the latter model often misclassifying ADL 1 as ADL 2 and ADL 4 as ADL 3. Still, the misclassification difference is seldom larger than one ADL, and the distribution of the frequencies of the different ADLs is reproduced. The most important predictive features are related to new snow and wind accumulated and averaged over several days. The binary-case RF model is used to hindcast avalanche-day frequency (ADF) from 1970 to 2024. In this period, the spring season (March–May) shows a small increase in ADF, whereas the winter season (December–February) exhibits negative trends. Moreover, the ADF is found to be correlated with the Arctic Oscillation (AO) index especially in winter, although this correlation appears to have deteriorated in recent years. Given recent advances in skill of representing the AO in decadal prediction systems, this is an encouraging result for the predictability of future avalanche-danger tendencies in northern Norway.
- Article
(2916 KB) - Full-text XML
-
Supplement
(721 KB) - BibTeX
- EndNote


Environmental and climate indicators associated with, for example, natural hazards and human activities, both on land (e.g. the danger of avalanches and landslides) and at sea (e.g. changes in nutrient concentration or stratification essential for fishery), represent important information when it comes to society planning and policy-making, especially under changing conditions. Prediction of such indicators, for instance avalanches that are a large risk to life and property, is of great importance, especially in densely populated areas or tourism hot spots. Other environmental indicators, such as nutrient concentration, may be related more to the conditions for industry, farming, and fishery and are thus strongly important for the planning of these industries and their infrastructure (e.g. agricultural and marine spatial planning). However, because of the great complexity of the environment in which these indicators emerge, they are often not directly modelled, implying a paucity of information and hampering of planning for the present and especially the future. Nonetheless, some information may be inferred indirectly, i.e. from other environmental properties that are directly modelled. This may be done using statistical methods that quantitatively relate the indicator in question to the modelled properties. One type of such properties for which a rich pedigree of direct modelling and observational monitoring exist is meteorological data. Thus, these data and their changes are often used to infer knowledge about – and changes in – indicators that are not directly modelled. An important benefit of this is that a diverse set of modelled future scenarios exists for meteorological data. This offers the opportunity to investigate potential future changes of environmental parameters based on climate scenarios.
One environmental indicator that is associated with natural hazards and that is related to meteorological parameters is snow avalanche danger or hazard (e.g. Statham et al., 2018). The terms danger and hazard are synonyms in this context (e.g. Statham, 2008; Engeset et al., 2018b), but according to Müller et al. (2016a), the former is more often used in Europe, while the latter is more typical in North America. In the following, avalanche danger is used.
Avalanche danger aggregates information about the likelihood of occurrence as well as the size of avalanches to a single integer – the avalanche-danger level (ADL; e.g. Müller et al., 2016b). A standardised five-level ADL scale was agreed upon by the European Avalanche Warning Services (EAWS) in 1993 and subsequently (in 1994) adopted in North America as well (e.g. Statham et al., 2010; Schweizer et al., 2020). However, the North American scale was later revised with a focus on risk communication (Statham et al., 2010). The ADL is typically forecast regionally by a team of experts based on (1) snowpack stability, (2) the frequency of snowpack stability, and (3) avalanche size (e.g. Müller et al., 2023). As Pérez-Guillén et al. (2022) noted, ADL forecasting still follows the experience-based approach already described by LaChapelle (1980). Nonetheless, in recent years advances have been made in incorporating physical (snowpack) modelling in the forecast (Morin et al., 2020). Moreover, in Switzerland an approach relying exclusively on machine-learning models (i.e. without expert input as in Schweizer and Föhn, 1996) to predict regional ADL with promising accuracy rivalling that of human experts (see e.g. Techel and Schweizer, 2017) has been developed for dry avalanches (Pérez-Guillén et al., 2022) and was implemented operationally for the first time in the winter of 2021/22 (Pérez-Guillén et al., 2025). Employing machine learning to robustly predict ADL offers the possibility of (1) hindcasting and potentially connecting ADL to known climate patterns, (2) providing quicker and more fine-resolution predictions of ADL based on numerical weather forecasts (e.g. van Herwijnen et al., 2023), and (3) obtaining prediction of ADL based on numerically modelled future climate change scenarios. The latter is highly important for future planning for stakeholders (e.g. ski-tourism industry or infrastructure departments) as a changing climate likely impacts avalanche occurrence and danger (e.g. Castebrunet et al., 2014; Laute and Beylich, 2018; Dyrrdal et al., 2020; Mayer et al., 2024).
In this study we follow an approach similar to Pérez-Guillén et al. (2022) to train machine-learning models to predict ADL in northern Norway. In northern Norway snow avalanches are among the most important natural hazards, causing road closures and access disruptions to towns, as well as casualties associated with, for example, skiing, riding a snowmobile, driving cars, or even being in houses. In an analysis of the Norwegian mass movement database (https://skredregistrering.no/, last access: 9 May 2025) and records from Varsom (https://varsom.no/, last access: 9 May 2025), Dyrrdal et al. (2020) found that between 1730 and January 2020 in Troms, 307 casualties were caused by snow avalanches.
While deterministic prediction of avalanche release will likely remain out of reach for the time being (Schweizer et al., 2003; Dkengne Sielenou et al., 2021), the possibility of using weather data to forecast avalanches was recognised decades ago (e.g. Atwater, 1954; LaChapelle, 1966). In the years since, many studies have focused on statistical prediction of avalanche occurrence from meteorological data (e.g. Judson and Erickson, 1973; Bakkehøi, 1987; Davis et al., 1999; Kronholm et al., 2006; Jomelli et al., 2007; Jaedicke et al., 2008; Hendrikx et al., 2005, 2014; Gauthier et al., 2017; Mayer et al., 2023; Viallon-Galinier et al., 2023; Hao et al., 2023). These studies are based on observational avalanche records and typically focus on small regions with strong observational coverage. As observational records for larger regions are likely incomplete (e.g. Schweizer et al., 2020), especially in the sparsely populated regions such as northern Norway (Jaedicke et al., 2008), direct forecasting of the probability of avalanche occurrence for larger areas appears so far infeasible. Instead, as indicated above, the forecasting of ADL is more promising. While there have long been attempts to forecast ADL with the help of statistical models (mostly nearest-neighbour methods; Schweizer and Föhn, 1996; Brabec and Meister, 2001), this research has gained more momentum only in recent years (Dekanová et al., 2018; Joshi et al., 2018, 2020; Fromm and Schönberger, 2022; Pérez-Guillén et al., 2022; Blagovechshenskiy et al., 2023; Sharma et al., 2023; Pérez-Guillén et al., 2025; Fromm and Schönberger, 2024; Maissen et al., 2024). However, the nearest-neighbour model of Brabec and Meister (2001) based on data from 60 manual weather stations in Switzerland yielded only a 52 % prediction accuracy. In contrast, the expert system of Schweizer and Föhn (1996), tested in the Davos region in Switzerland, achieved up to 73 % accuracy, although only in the case where an expert was allowed to interact with the forecast. Schirmer et al. (2009) compared several different machine-learning methods to forecast avalanche danger. Notably, they also included snow-stratigraphy data from simulations with the physically based snow-cover model SNOWPACK (Bartelt and Lehning, 2002; Lehning et al., 2002a, b). They found the best method (73 % cross-validated accuracy) to be a nearest-neighbour classifier, which, however, included the ADL from the previous day as input. While this may improve the accuracy with respect to daily ADL, it likely deteriorates the performance for days when the ADL changes compared to the previous day (e.g. Pérez-Guillén et al., 2022). Recently, focusing on regional dry-snow avalanche conditions in the Swiss Alps, Pérez-Guillén et al. (2022) achieved the best results of predicting ADL based on meteorological and SNOWPACK-simulated snow-stratigraphy data with a random forest (RF) classifier (about 75 %). Their approach is purely data-driven and does not require expert inputs. The Pérez-Guillén et al. (2022) RF model has since been used in a test setting for operational ADL forecasting in Switzerland with an agreement rate with human experts of about 70 % (Pérez-Guillén et al., 2025). It may be noted that the RF model has become a generally popular method in avalanche forecasting; however, it appears to be mostly used for forecasting avalanche activity (e.g. Möhle et al., 2014; Dkengne Sielenou et al., 2021; Mayer et al., 2023, 2024; Viallon-Galinier et al., 2023) and not ADL. Contrarily, there has been a number of studies using an artificial neural network (ANN) to predict ADL in different mountain regions. However they report considerably different accuracies. For example, Dekanová et al. (2018), building on earlier work by Stephens et al. (1994), used an ANN to predict avalanche danger in the Western Tatras (Slovakia) based on weather station data, obtaining accuracies of 59 %–66 %. A somewhat higher accuracy of about 71 % was obtained by Joshi et al. (2020), who used an ANN-model chain first to predict snowpack information and subsequently ADLs. Conversely, Blagovechshenskiy et al. (2023) reported much higher accuracies of 77 %–91 % for an ANN trained for the Ile Alatau Ridge in Kazakhstan. It is generally difficult to compare prediction accuracies across the different studies as they concern contrasting topographies and climates as well as different kinds of warning regions (e.g. in Norway the average warning-region size is about 9000 km2, as shown in Table S1 and Fig. S1 in the Supplement, while in Switzerland it is 200 km2; Pérez-Guillén et al., 2025). Moreover, the data quality and the chosen predictive features also differ between studies. Thus, one reason for the discrepancies may be that Blagovechshenskiy et al. (2023) used information about the snow stratigraphy as predictive features, while the information of Dekanová et al. (2018) about snow was confined to “actual snow depth” and “new snow depth” (see their Table 2), and Joshi et al. (2020) used snowpack information predicted by an ANN based on meteorological data. Furthermore, there are differences in the generation of the ADL data set, as Blagovechshenskiy et al. (2023) had to reconstruct most of the ADLs based on actual avalanche observations, while Dekanová et al. (2018) and Joshi et al. (2020) were able to use a historical record of ADL forecasts. Sharma et al. (2023), who trained and optimised an ANN using the same data as Pérez-Guillén et al. (2022), reported a best-case accuracy of about 77 % with respect to their validation data. However, unfortunately no information about the split into training and validation data is provided. If the validation data are chosen randomly, temporal correlations may cause severe overestimation of model accuracy. A further reason for the comparatively high accuracy of Sharma et al. (2023) is likely that their data were confined to dry-snow avalanches. These points may explain the discrepancy in model performance with Fromm and Schönberger (2022), who obtained an accuracy of only 48 % for an ANN trained on meteorological and SNOWPACK-simulation data (i.e. similar to Sharma et al., 2023) for a ski resort in the Austrian and Swiss Alps. As test data, they used one whole winter which was excluded from the training data, and they considered any type of avalanche. They also noted that in contrast to Pérez-Guillén et al. (2022) and Sharma et al. (2023), they did not focus on regional ADL but instead on a much smaller region, i.e. a single ski resort. The resort is strongly influenced by artificial and intentional avalanche triggering, potentially further hampering direct comparability to the other studies.
So far, the only study investigating statistically the relation between avalanches and weather data in northern Norway is Jaedicke et al. (2008), although this aspect was not the main focus of that study, and instead of ADL they predicted avalanche activity. Moreover, Dyrrdal et al. (2020) investigated climate indices specifically related to avalanches in the Troms region in northern Norway, but they did not statistically relate these indices to avalanche danger. Recently, van Herwijnen et al. (2024) investigated the transferability of statistical models trained to predict Alpine snowpack stability to the Arctic snowpack, in particular the snowpack on Kvaløya in the Troms county. Their findings indicate that, while there is some potential for transferability, the unique characteristics of the Arctic snowpack deteriorate the accuracies of Alpine-trained models. This suggests that statistical models that predict avalanche-related parameters such as snowpack stability and avalanche danger should be trained on regional data representative of the specific regional conditions. A reason for the historically marginal focus on statistical avalanche prediction in northern Norway may be due to the sparse avalanche observations in this region (Jaedicke et al., 2008), implying that avalanche prediction models based on observational avalanche records are likely biased. We note that the analysis in Jaedicke et al. (2008) may suffer from this problem. To circumvent this shortcoming, we here instead rely on the expert ADL assessments published by the Norwegian Water Resources and Energy Directorate (NVE). Our aim is to train and optimise random forest models to (1) predict avalanche danger and make progress towards operational data-driven avalanche-danger forecasting and (2) predict avalanche danger on an aggregated scale (binary case) to produce hindcasts and future projections (in upcoming work) of the number of avalanche days in northern Norway.
The study is structured as follows: Sect. 2 first explains the expert ADL assessments (2.1), the NORA3 reanalysis (2.2), and the seNorge model (2.3), and it finally gives an overview of the avalanche-danger prediction features calculated from the NORA3 data and the seNorge output (2.4). Section 3 describes the RF model (3.1) and the technique we use to balance the training data (3.2). In Sect. 4 the RF optimisation and feature selection procedure is presented, and in Sect. 5 the four-level (5.1) and binary (5.2) RF models are evaluated. The binary-case RF model is used in Sect. 6 to perform a hindcast of the number of avalanche days, which is then connected to known climate patterns. Section 7 offers a summary and concluding remarks.
2.1 Avalanche danger
In northern Norway avalanche observations are sparse and many avalanches remain undetected. Thus, using avalanche observation catalogues as training data for statistical models to predict avalanches likely introduces biases leading to incorrect or at least uncertain prediction. To avoid this potential bias, we here instead employ the daily avalanche-danger level (ADL) assessment as described in Sect. 1. In Norway the ADL assessment is produced under the scope of the Norwegian Avalanche Warning Service (NAWS), which was established in January 2013 (Engeset, 2013; Müller et al., 2013; Engeset et al., 2018b). The NAWS is a member of the EAWS, and the ADL assessment follows the EAWS standards (Engeset, 2013). The ADLs are generated and published by a team of experts from the Norwegian Water Resources and Energy Directorate (NVE), the Norwegian Meteorological Institute (MET), and the Norwegian Public Roads Administration (NPRA) at https://varsom.no/ (last access: 9 May 2025; see Johnsen, 2013; Engeset et al., 2018a), aggregating knowledge from snow and weather observations as well as numerical-weather-prediction modelling output. Due to the sparse network of automatic weather stations in the Norwegian mountain areas, an important part of the information for the forecasters comes from the qualitative assessments of field observers (Kosberg et al., 2013). For mainland Norway (i.e. excluding Svalbard), avalanche warnings are published daily from 1 December to 31 May (Varsom, 2025b) for 23 warning regions with an average size of about 9000 km2. However, note that in special cases avalanche warnings are sometimes published also in November and June. For 19 further warning regions (average size about 11 000 km2), avalanche warnings are published on days with ADL 4 or 5 (see Table S1 and Fig. S1 for more detail on the Norwegian warning regions). The avalanche warnings are published before 16:00 LT (Varsom, 2025a) for 3 d at a time, with a nowcast for the day of production and a forecast for the next 2 d. However, on days with ADL 4 or 5, warnings are typically published already before 12:00 LT (Engeset, 2013). We here use the nowcast data available via NVE's Regobs platform (https://www.regobs.no/, last access: 9 May 2025, Engeset et al., 2018a), which is conveniently accessible with the Python library Regobslib (https://pypi.org/project/regobslib/, last access: 9 May 2025). Even though the NAWS has published ADLs since 2013, we here use ADL data from the avalanche seasons of only 2016/17 to 2023/24, since the warning-region setup was changed in 2016 (Karsten Müller, personal communication, 2024).
In describing the avalanche danger by a single value per region, the ADL constitutes a large reduction in complexity. In fact, the avalanche forecaster considers several different avalanche problems (APs). In accordance with the EAWS's standards, the NAWS uses the following APs (EAWS, 2025): new snow (loose and slab), wind-drifted snow (slab), persistent weak layer (slab), wet snow (loose and slab), and gliding snow. Based on the estimated likelihood (based, in turn, on distribution and sensitivity) and size of avalanches, the forecaster determines a danger level per AP (Müller et al., 2023). The final ADL in a given region is taken as the highest danger level among the different APs. Hence, the ADL is a result of different APs that are related to different meteorological conditions, complicating the relation between ADL and meteorological data and thus the modelling of this relation. However, considering only one AP reduces the amount of available data, making a robust training of statistical models more difficult. Also, at least some of the APs may be related to similar meteorological conditions, and we thus believe it is still feasible to focus on the general ADL. In future work we will attempt a more detailed decomposition into the different APs.
Here, the ADLs from the northern Norwegian A-type regions of Nord-Troms, Lyngen, Tromsø, Sør-Troms, and Indre Troms are considered (average size about 6800 km2). The regions are depicted in Fig. 1. From Fig. 2a, it is clear that there is considerable variation in the frequency of the different ADLs, with level 2 being the most frequent and level 4 the least frequent, while level 5 was never forecast in northern Norway. Hence, the ADL scale in this study is constrained to four levels. The figure also shows that the frequency of the ADLs is similar across the different regions. Conversely, the ADL frequency varies across the different recorded years (Fig. 2b), especially between levels 1 and 2. For example, in 2020 there were almost no days with level 1 but many more days with level 2 than in the other years. In contrast, in 2018 and 2021 there were much fewer days with level 2 and many more with level 1 compared to the other years. The distribution of ADLs per year is important information when it comes to the splitting of training and test data for the statistical models. Figure 2c shows the distribution of ADLs for the test data (winters ending in 2021 and 2023) and the training data (remaining years) used in this study.

Figure 1Study region. The black square in the inset indicates the location of the study region in Norway. The topography information is taken from NORA3.
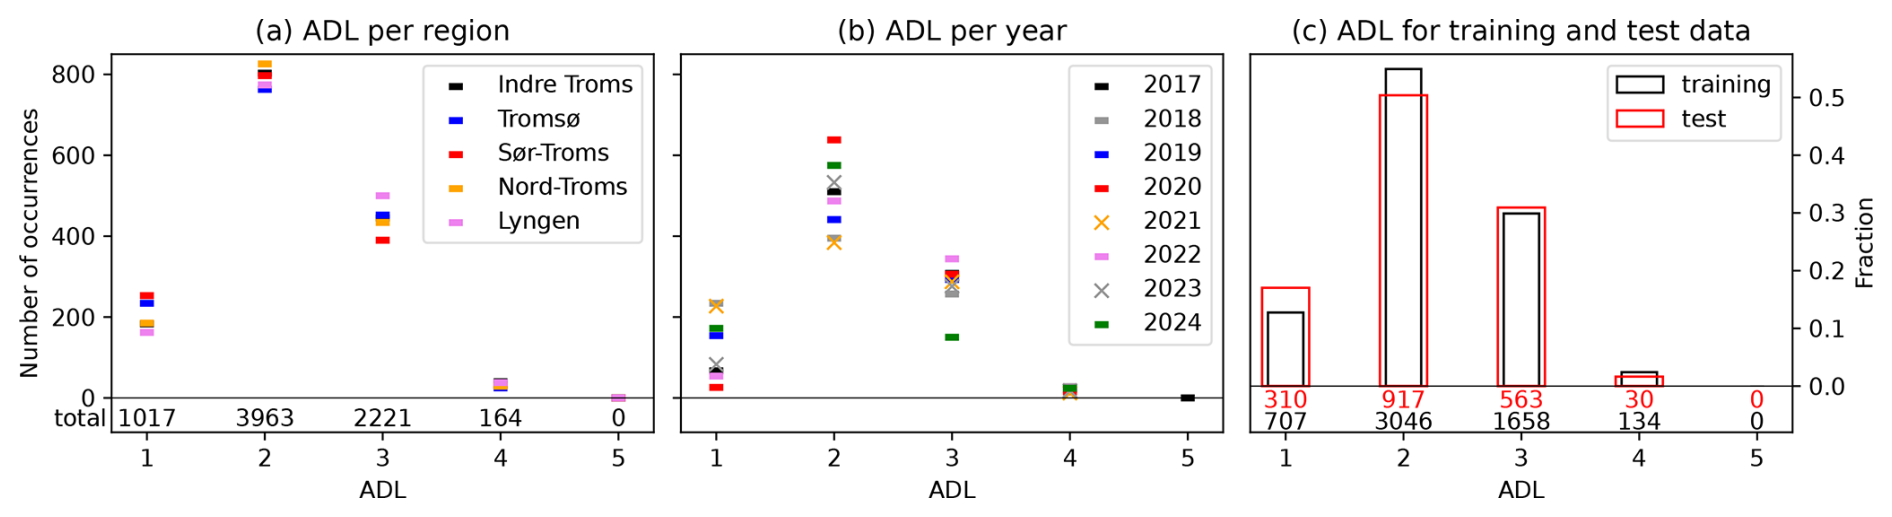
Figure 2Summary of the avalanche-danger level (ADL) data in northern Norway from winter 2016/17 to 2023/24. In panel (a) the number of days per ADL per region is shown, panel (b) shows the number of ADL days per year (× markers indicate the test data), and panel (c) depicts the fraction of winter days on which a given ADL was determined separated into (red) test (winters ending in 2021 and 2023) and (black) training (remaining years) data.
As Pérez-Guillén et al. (2022) discussed, one source of noise in the ADL data is forecast error, i.e. incorrect labels. For example Techel and Schweizer (2017) found that the regional forecasts match local nowcasts only 71 % of the time. Pérez-Guillén et al. (2022) thus attempted to generate a refined subset of their ADL data by including additional information such as observational data and the outcomes of several verification studies. For northern Norway, no such verification studies exist, although there is one study that compared remote-sensing-derived avalanche activity with forecast ADLs, which indicated that ADL forecasts are conservative (Eckerstorfer et al., 2017). Attempts are currently underway to increase remote-sensing coverage and detection algorithm quality, but the probability of detection has been found to depend on the type of avalanche and is overall only about 57 % (Müller et al., 2021). Furthermore, while there are in situ observational avalanche records in northern Norway, these are very sparse due to the comparatively large area and the low population density. Even using a combination of in situ and remote-sensing observations to tidy up our ADL data would strongly reduce our available data so as to make robust training of a statistical model infeasible. With these reservations in mind we are here bound to use the raw ADL forecast data.
In this study, we consider two types of avalanche-danger scales. First, we employ the full ADL scale (henceforth the four-level case). Second, we generate a binary scale (henceforth the binary case) where the ADLs 1 and 2 are combined to “non-avalanche day” (non-AvD) and the ADLs 3 and 4 are combined to “avalanche day” (AvD). We call the number of avalanche days per winter season the avalanche-day frequency (ADF). Due to its higher accuracy compared to the four-level case (see Sect. 5), the binary-case model will give a more robust, albeit rougher, estimate of the general tendency of avalanche danger. Furthermore, the ADF appears related to avalanche activity, since Pérez-Guillén et al. (2024a) in a case study in the Swiss Alps using an automated seismic avalanche detection system found that on days with no avalanche, the mean ADL was 1.9±0.8, while on days with at least one avalanche, it was 3.2±0.5, hence providing a clearly binary appearance. Similarly, in an investigation of Swiss backcountry GPX tracks as a proxy for non-avalanche events, Techel et al. (2024) found that for non-events the median probability of ADL ≥3 was only 0.14, while for events it was 0.58. Hence, on a day with ADL 3 or 4, avalanche events are likely, while they are unlikely on days with ADL 1 or 2, justifying our definition of AvD and non-AvD. We use the binary-case model in a hindcast of the ADF to find potential linkages to known climate patterns/modes (see Sect. 6).
2.2 NORA3
The meteorological data used in this study are taken from the 3 km Norwegian Reanalysis (NORA3). NORA3 is an atmospheric hindcast for the North Sea, the Norwegian Sea, and the Barents Sea as well as the Scandinavian Peninsula, including further parts of northern and western Europe and north-west Russia (Haakenstad et al., 2021). More precisely, it may be viewed as falling somewhere between a hindcast and a full reanalysis as it includes data assimilation only for surface parameters (Haakenstad et al., 2021; Haakenstad and Breivik, 2022). NORA3 provides a regional downscaling to a 3 km horizontal resolution of the latest version of the European Centre for Medium-Range Weather Forecasts (ECMWF) reanalysis, ERA5, with a 31 km horizontal resolution (Hersbach et al., 2020). To produce NORA3, the non-hydrostatic convection-permitting numerical weather model HARMONIE-AROME (Bengtsson et al., 2017) was run on a 3 km horizontal resolution and with 65 vertical layers, using ERA5 fields as initial and boundary conditions. At the time of writing, data availability covers the period from January 1970 to September 2024 and is constantly updated with a few months lag.
Pertinent to the present study, NORA3 has been found to significantly improve the representation of 2 m temperature, 10 m wind, and daily precipitation, particularly regarding extremes and in coastal and mountainous areas compared to its host reanalysis (ERA5) and its predecessor (NORA10; Reistad et al., 2011). These improvements appear mostly due to the higher resolution as well as the resolved deep convection (Haakenstad et al., 2021; Haakenstad and Breivik, 2022). Still, Haakenstad and Breivik (2022) reported at least two biases that may be important for the present study, namely a significant underestimation of spring temperatures as well as too-long-lasting snow cover in regions with few observations.
Previous studies that attempted to relate weather data to avalanches note that meteorological parameters above a certain elevation are most important regarding avalanche release (e.g. Kronholm et al., 2006; Laute and Beylich, 2018; Dyrrdal et al., 2020). We have conducted our analysis using several different elevation thresholds, selecting grid cells between 400 and 900 m a.s.l., 500 and 1000 m, 600 and 1100 m, and 300 and 1300 m. However, the choice of elevation threshold had little impact on the final results. The results presented here are based on the elevation interval 400–900 m, and the number of grid cells selected per region is shown in Table 1.
Table 1Number of selected grid cells between elevation levels 400 and 900 m a.s.l. for the NORA3 grid cell selection.

2.3 seNorge
The NORA3 reanalysis lacks data on the snow conditions at the surface. Thus, in order to obtain information about parameters related to snow cover, e.g. the snow depth and density and snow water equivalent (SWE), we employ the snow model seNorge (Saloranta, 2012) version 1.1.1 (Saloranta, 2014, 2016). Due to a lack of both in situ and satellite observational data on snow, seNorge is the main tool used to provide information on snow for the avalanche warning system in Norway (Saloranta, 2012; Morin et al., 2020). Daily gridded (1 km resolution) snow maps are generated with seNorge and published on https://www.senorge.no/ (last access: 9 May 2025).
The tool seNorge is a simple process-based single-layer snowpack model demanding little computational resources, thus being convenient for application to large high-resolution grids (Saloranta, 2016; Morin et al., 2020). The model consists of two sub-modules for (1) snowpack water balance and (2) snow compaction and density, calculating the snow water equivalent, the melt/refreeze rate, and run-off as well as snow depth and density, respectively. As input data, seNorge only requires daily temperature and precipitation.
To keep our snow and weather data consistent, we rerun the seNorge model using NORA3 daily 2 m air temperature and total precipitation amount as input. To obtain reasonable initialisation data for seNorge, the model was first run for the years 1970 through 1975, with the initial values being zero everywhere. The final simulation outputs from 1975 were then used as model initialisation data for 1970, and the model was run from 1970 through 2024 to produce the snow-cover data.
2.4 Avalanche-danger prediction features
Based on the NORA3 weather data, several parameters are constructed to be used as potential predictors of ADL, partly following earlier studies (e.g. Hendrikx et al., 2014; Gauthier et al., 2017; Pérez-Guillén et al., 2022). An overview of these potential predictors is presented in Table 2. They include the accumulated new liquid precipitation r1 on the day of the publication of the ADL nowcast (see Sect. 2.1), as well as the new liquid precipitation accumulated during 1 to 6 d before and including the day of the nowcast (r2, …, r7). Equivalently, solid precipitation is represented by the features s1, …, s7. The hourly precipitation-amount values from NORA3 were classified as liquid or solid based on the hourly 2 m air temperature being larger or smaller than 0 °C, respectively. The daily total precipitation sum, including both rain and snow, is represented by Ptot. The parameters rh, rh2, …, rh7 correspond to the daily and 2–7 d averages of the relative humidity. The maximum and minimum of 2 m air temperature (tmax, tmin) and 10 m wind speed (wmax) represent the daily maximum and minimum of hourly values from NORA3, respectively. The diurnal cycles dtr, dtr1, dtr2, and dtr3 represent the difference between the maximum and minimum hourly 2 m air temperatures on the day of and up to 3 d before the ADL nowcast. The thermal amplitudes dtrd1, dtrd2, and dtrd3 represent the largest thermal range of hourly 2 m air temperatures between the day of and 1 to 3 d before the nowcast. The ftc is a Boolean flag indicating if a freeze–thaw cycle was present on the day of the nowcast, i.e. if the daily tmax was larger than 0 °C and the daily tmin was smaller than 0 °C. The positive-degree days (pdd) are calculated as the 7 d sum (including the day of the nowcast) of the daily mean 2 m air temperature (t1) for days with t1>0 °C. The drift index (wdrift) combines precipitation and wind (see Table 2) to represent the effect of snow drift (Hendrikx et al., 2005). The cubed drift index (wdrift3) is also included as this is more in line with the current understanding of snow transport by wind (Hendrikx et al., 2014). Further parameters include the net short-wave and long-wave radiation at the surface (nsw and nlw, respectively) averaged over 1 to 7 d. As described in Sect. 2.3, we also use parameters generated with the seNorge snow model. These are the snow water equivalent (SWE), snow depth (SDP), snow density (SD), and melt/refreeze rate (MR). The parameters are included as daily and 2 d to up to 7 d means.
Table 2Potential predictors constructed from NORA3 meteorological data. The nowcast day refers to the day of publication of the avalanche-danger nowcast (see Sect. 2.1 for details). The capitalised abbreviations indicate that the parameter in question was derived with the seNorge model. See the text for more details on the parameter definition.

The predictive features are calculated for all days for which ADLs are available, covering the period of winter 2016/17 to 2023/24. The avalanche period is considered as lasting from December to May, including these months, although in a few cases, there are ADLs for days in late November and early June. The data are split into a training and a test data set. To avoid a potential overestimation of model skill due to intra-seasonal correlation, we use the two full avalanche seasons of 2020/21 and 2022/23 as test data and the remaining seasons as training data. The two test seasons are rather different in terms of ADL frequencies (see Fig. 2), thus covering at least some interseasonal variation. When training the statistical models, we average the predictive features for each of the five avalanche regions separately (Fig. 1). However, we train one model for all five regions combined because there are not enough data to robustly train a statistical model per region (especially for level 4 with only 164 cases for all regions combined; see Fig. 2a). We note that we have tested taking the 90th percentile of the grid cells per region instead of the average, but this had no impact on our final results.
In the following we introduce the random forest (RF) model used to predict avalanche danger based on meteorological data and then give a brief description of the oversampling method used to balance the data.
3.1 Random forest
The random forest (RF; Breiman, 2001) model is a non-linear supervised classifier based on an aggregation of weaker classifiers (the decision tree). The decision tree (DT; Breiman et al., 1984) establishes splitting rules for the continuous features to predict the discrete target variable (i.e. the ADL). The splitting rules are here obtained by minimising the Gini index of diversity (e.g. Breiman et al., 1984):
where N is the number of classes in the data and pi is the probability of correctly classifying item i. Higher and lower Gini indices correspond to greater and smaller misclassification, respectively. The user may determine both the number of splitting rules setting the depth of the DT and the minimum number of data samples that must remain after a split.
The RF grows multiple DTs, and the final outcome (i.e. the ADL based on a specific set of predictive feature values) is obtained by the majority vote of the outcome of the individual DTs. Using a large number of DTs typically helps to prevent overfitting. As another measure to prevent overfitting, the individual DTs are trained on bootstrapped subsets of the data.
The RF method offers the possibility to gauge the importance of the individual predictive features in the prediction of the target variable. This is done by calculating the average impurity decrease computed across all DTs in the RF due to the respective predictive feature.
Note that while an individual DT may be humanly understandable (given it is not too large), the RF typically consists of hundreds of DTs, thereby becoming a “black box”. However, due to the large number of features (up to 109 features are considered potential predictors here), a black box model is likely unavoidable when it comes to ADL prediction. Furthermore, promising efforts have recently been undertaken employing explanation models to explain the role of the individual predictive features in the ADL predictions of an RF model (Pérez-Guillén et al., 2025).
In the context of the prediction of snow avalanches, the RF method has become quite popular. However, it seems to be mostly used for the prediction of avalanche activity based on avalanche observations (e.g. Möhle et al., 2014; Dkengne Sielenou et al., 2021; Mayer et al., 2023, 2024; Viallon-Galinier et al., 2023), and Pérez-Guillén et al. (2022) appear to be the first applying an RF to ADL prediction.
Here we use the RF implementation in the Python library scikit-learn version 1.5.1 (https://scikit-learn.org/, last access: 9 May 2025).
3.2 Class balancing – synthetic minority oversampling
Since our avalanche-danger data are highly imbalanced, i.e. the different ADLs have different frequencies (Sect. 2.1, Fig. 2), we employ the widely used (e.g. García et al., 2016; Fernandéz et al., 2018) synthetic minority oversampling technique (SMOTE; Chawla et al., 2002; Fernandéz et al., 2018) to oversample the minority classes. The SMOTE algorithm selects a random instance from the minority class and searches for the k nearest neighbours (k=10 in the present study). Then one of these neighbours is randomly chosen, and the synthetic instance is generated by interpolating in the feature space between the original instance and the selected neighbour. The new synthetic instance may be visualised as a random point along a “line segment” between the original instance and the selected neighbour (Fernandéz et al., 2018, see their Fig. 1). We here use the implementation of the SMOTE algorithm in the Python library imbalanced-learn version 0.12.3 (https://imbalanced-learn.org/, last access: 9 May 2025). In this implementation the SMOTE algorithm is applied to each minority class separately, oversampling to the same frequency as the majority class. We note that we have tested several other methods to balance the class frequency (SVMSMOTE, ADASYN; see e.g. Fernandéz et al., 2018, for a brief review), but this did not improve the overall accuracy or the distribution of the predicted results.
As mentioned above, our focus in this study is the random forest (RF) model, and the model optimisation and feature selection procedure mostly follows Pérez-Guillén et al. (2022). However, note that we here consider both the four-level case and the binary case (see Sect. 2.1). Consequently, the optimisation and feature selection procedure is conducted separately for these cases.
The RF model is a complex machine-learning method incorporating several hyperparameters which may be tuned to optimise the model. We start by performing a randomised grid search over several hyperparameters using the full set of 109 features (see Sect. 2.4). During the grid search, a 3-fold cross-validation is performed employing the F1-macro score (i.e. the unweighted mean of F1 scores for each class; see Appendix A) to gauge model performance. Since our training data comprise six winter seasons, the folds are constructed such that in each fold four winters are used to train the model and the remaining two winters are used for validation. As described in Sect. 3.2, we use the SMOTE algorithm to oversample the minority classes and balance the data before optimising the RF model. Note that in the binary case the balancing was undertaken after the aggregation from ADL to AvD and non-AvD. The RF with the set of hyperparameters achieving the best (i.e. highest) F1-macro score is then used to gauge the importance of the individual predictive features as described in Sect. 3.1. In a next step, the cross-correlation (Pearson R) between all the predictive features is calculated. Those features which exhibit R2>0.9 with another feature of greater importance are then removed. This leaves 53 and 54 features in the four-level and the binary case, respectively. Their feature importances are shown in Fig. 3. Employing only the remaining 53 and 54 features, we perform another grid search around the best hyperparameters found in the first step. This yields the final set of hyperparameters as shown in Table B1 in Appendix B. Finally, we test the optimal number of features to be included. As can be seen in Fig. 4a, for the four-level case median performance is highest for 30 features, although the improvement from 20 to 30 is only marginal. However, in an analysis of the confusion matrices (not shown), we find that including 30 features improves the prediction of instances with ADL 4. Thus, we choose 30 features for the four-level case. For the binary case there is a considerable increase in median model performance from 10 to 20 features, while including more than 20 features improves the performance only very little (Fig. 4b). Hence, we choose 20 features in the binary case. The features above the black lines in Fig. 3 constitute the final sets of features used in further analysis. Figure 4 shows the RF performance derived from a 3-fold cross-validation (i.e. using four winters as training and two winters as test data). The same optimal feature numbers are obtained in a 6-fold cross-validation (i.e. using five winters as training and one winter as test data, which essentially corresponds to a leave-one-out cross-validation; see Fig. S2 in the Supplement). Note that Pérez-Guillén et al. (2022) similarly found 30 to be the optimum number of predictive features, although they used different features (including SNOWPACK-derived snow-stratigraphy parameters; compare their Fig. 5 with our Fig. 3a).
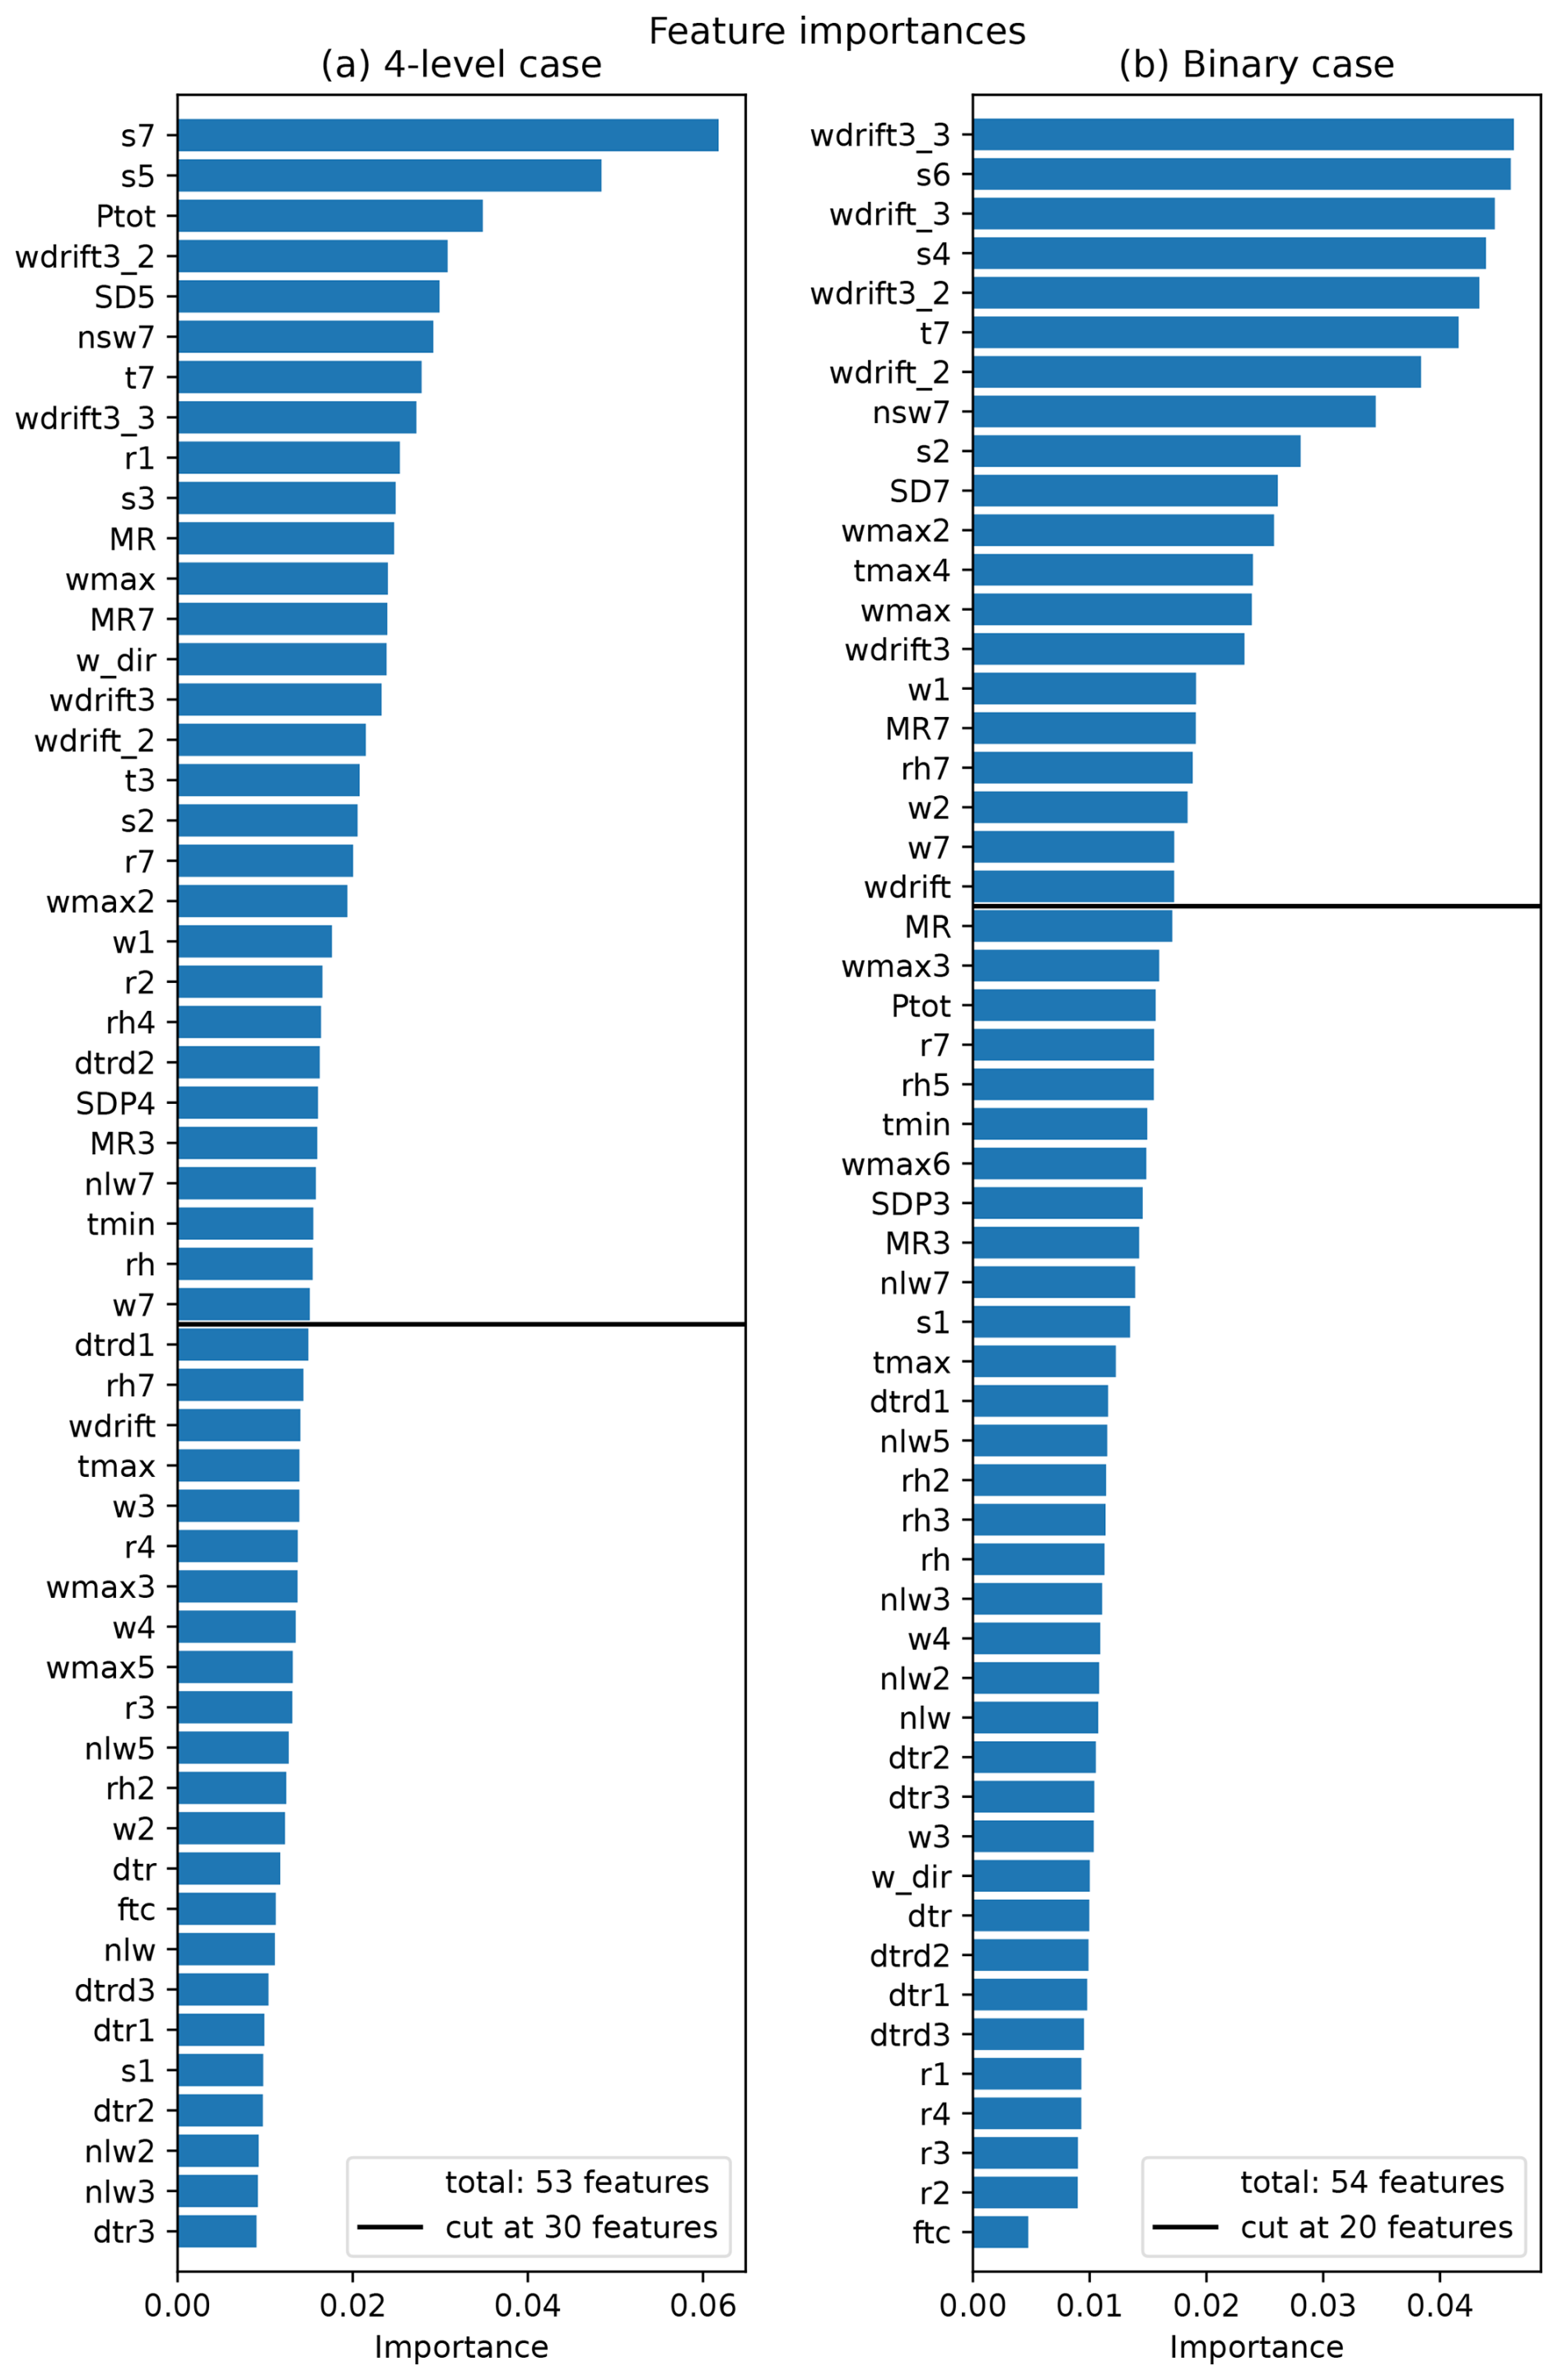
Figure 3Feature importances for the random forest models trained for (a) the four-level case and (b) the binary case. The horizontal black lines indicate the cutoff point determined in the optimal feature number test described in the text. For a description of the features see Table 2.
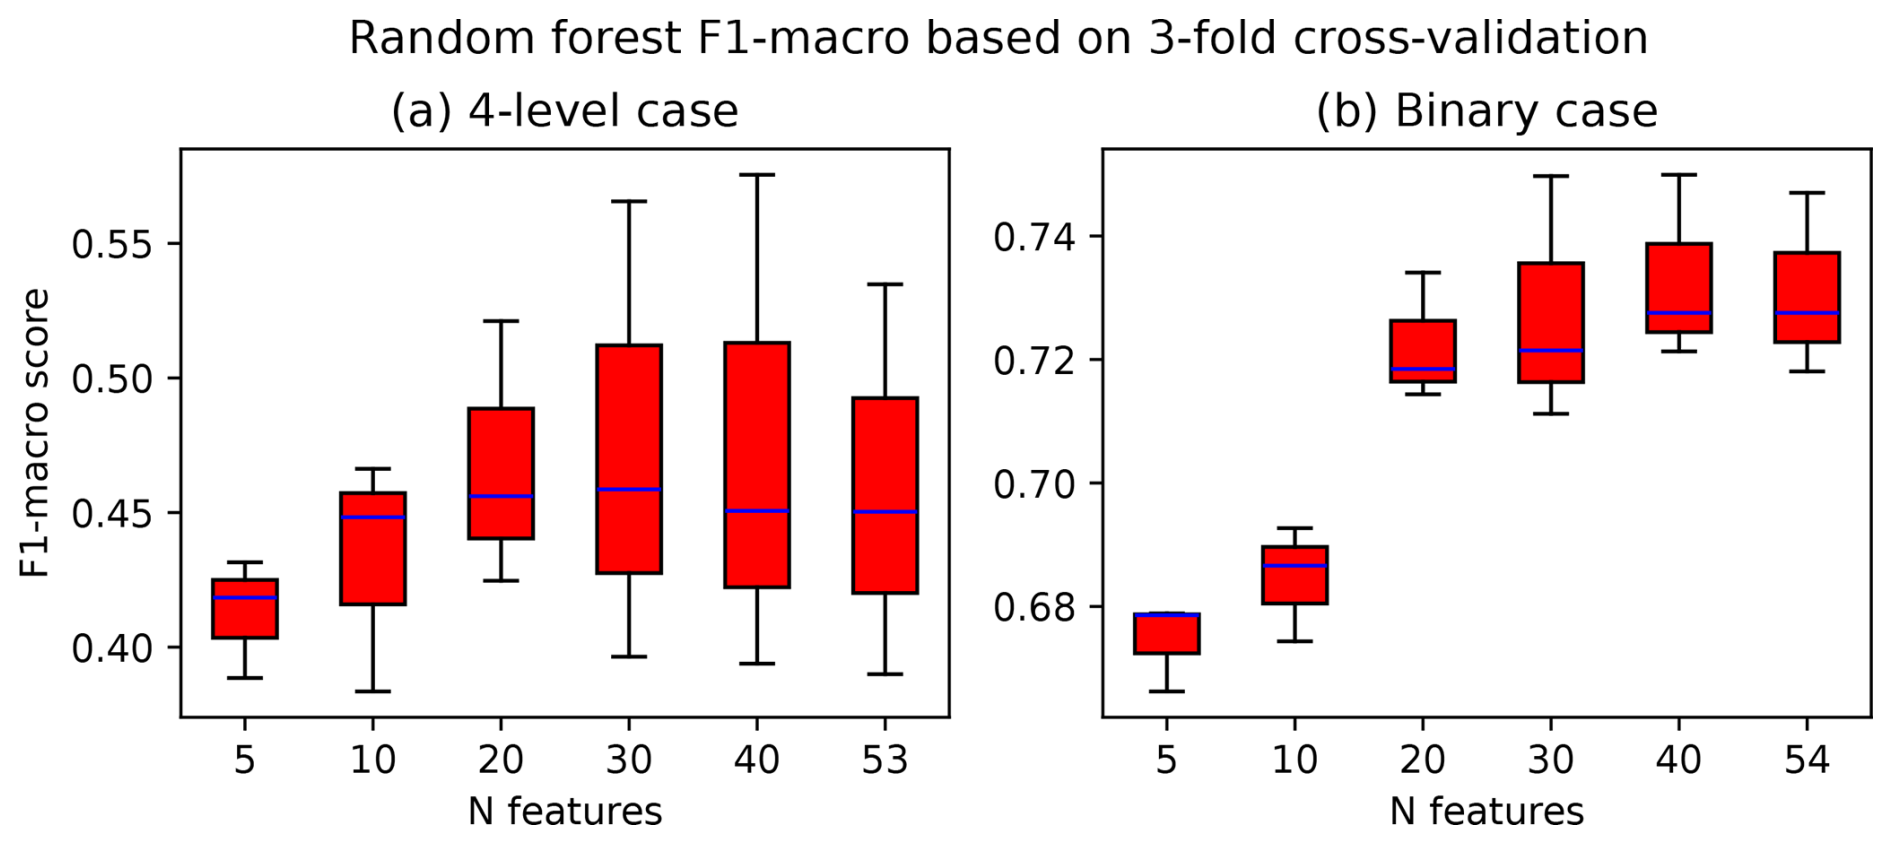
Figure 4The F1-macro skill score of the random forest dependent on the number of included features based on a 3-fold cross-validation for (a) the four-level case and (b) the binary case. Note the different y-axis scales. See Fig. S2 for the results of a 6-fold cross-validation.
Generally, the most important parameters in both the four-level and the binary case are related to new snow accumulating over several days (e.g. s4, s5, s6) together with snow density (SD5, SD7) and wind drift (e.g. wdrift3_2, wdrift_3). This is expected and broadly consistent with Pérez-Guillén et al. (2022, 2025) as well as other studies which, however, investigate avalanche activity instead of ADL (e.g. Gauthier et al., 2017; Jaedicke et al., 2008; Bakkehøi, 1987; Kronholm et al., 2006; Hao et al., 2023), since both new snow and wind, especially associated with storms (e.g. Davis et al., 1999), are prominent avalanche triggers (see e.g. Jaedicke et al., 2008; Dyrrdal et al., 2020, specifically for northern Norway). A parameter associated with the net short-wave radiation (nsw7) is among the most important features in both the four-level and the binary case. This is remarkable, since for most of the northern Norwegian winter polar-night conditions persist, meaning the sun does not rise and there is no short-wave radiation. Indeed, while nsw7 never exceeds 2 W m−2 in winter (December through February), in spring (March through May) typical values are between 30 and 50 W m−2 (see Fig. S3 in the Supplement). Accordingly, the importance of nsw7 should be concentrated in the spring months. This parameter is likely related directly to melting and refreezing (e.g. nsw7 and MR7 are highly correlated; see Fig. S4 in the Supplement) but also to clouds. As clouds are linked to precipitation and wind, this partly explains its comparatively high importance. Furthermore, as documented by Conway et al. (1988), on southerly slopes, avalanches are often released after the snow has been warmed by solar radiation. A few features directly related to temperature are among the most important features, mostly as longer averages (t7). However, it is unclear how these temperature features impact avalanche danger since, as noted by Kronholm et al. (2006), higher temperatures can have both stabilising and destabilising effects on the snowpack. Higher temperatures may, for example, lead to more meltwater that can percolate through the snowpack (destabilising), while they may also decrease the time during which weak layers are present in the snowpack (stabilising). The features related to temperature change (e.g. dtrd2) are of minor importance in the four-level case and are not among the variables used in the binary case at all, indicating that short-term temperature changes (up to 3 d) are not important for the ADL in our analysis. For the four-level case, some rain-related features (e.g. r1, r7) are used in the final model. However, their importance is generally lower than that of snow and total precipitation. This indicates that wet-snow avalanches, which are often caused by rain-on-snow events (e.g. Conway et al., 1988; Heywood, 1988), mostly do not determine the general ADL. As described in Sect. 2.1, we here consider only the general ADL. Focusing instead on individual avalanche problems would likely lead to a different set of most important predictive features used in the RF model, being more directly connected to the specific type of avalanche (wind slab, wet snow, etc.).
The model performance is evaluated with respect to both the original unbalanced test data and the balanced test data. For the latter, the minority classes were oversampled using the SMOTE technique (Sect. 3.2) to equalise class frequencies in the same manner as for the training data. Summaries of the model performance with respect to the unbalanced test data (i.e. the winter seasons 2020/21 and 2022/23) for the four-level and binary cases are presented in Tables 3 and 5, respectively. Heat maps of the corresponding confusion matrices are shown in Fig. 5, and Table 4 gives the difference of the forecast to the true ADL and AvD/non-AvD. The performance with respect to the balanced test data is shown in the Supplement (see Tables S2 and S3 in the Supplement for the four-level and binary case, respectively, as well as Fig. S5 for the confusion matrices). Our following discussion is focused on the four-level case (Sect. 5.1), including a comparison of our results to previous studies. The results of the binary case are presented only briefly (Sect. 5.2), as the authors are unaware of previous similar work.
Table 3Classification report for the four-level case with unbalanced test data. The ADL is the avalanche-danger level. Precision (Prec.), recall (Rec.), F1 score, and overall accuracy (Acc.) are defined in Appendix A. Support corresponds to the number of occurrences of the ADL in question. The macro average indicates the unweighted average over all ADLs, and the weighted average indicates the average weighted with respect to the support of each ADL. See Table S2 for the classification report with respect to the balanced test data.
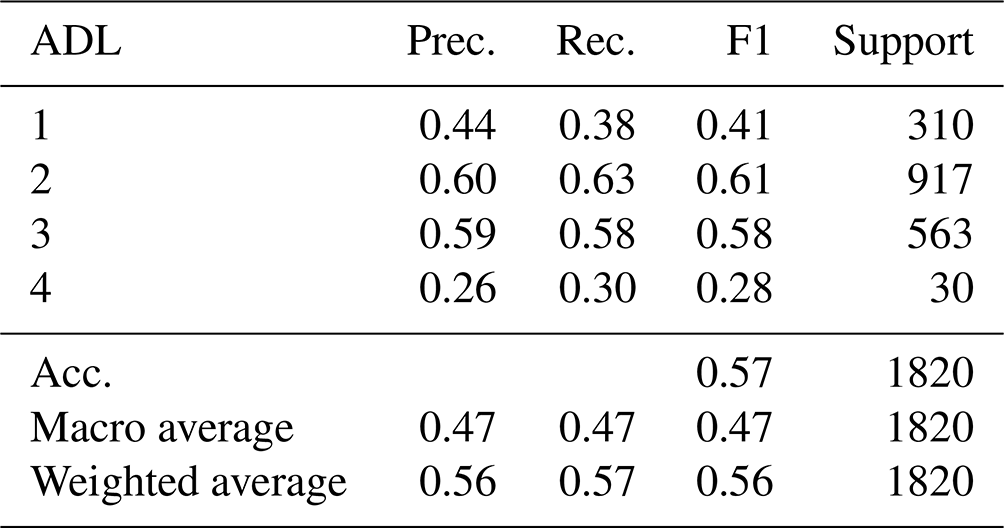
Table 4Difference between true and predicted danger level for the four-level and binary cases. The numbers are the percentages of days with the given danger level difference between predicted and true level. The columns Unbal. and Bal. refer to the performance with respect to the unbalanced and balanced test data, respectively.
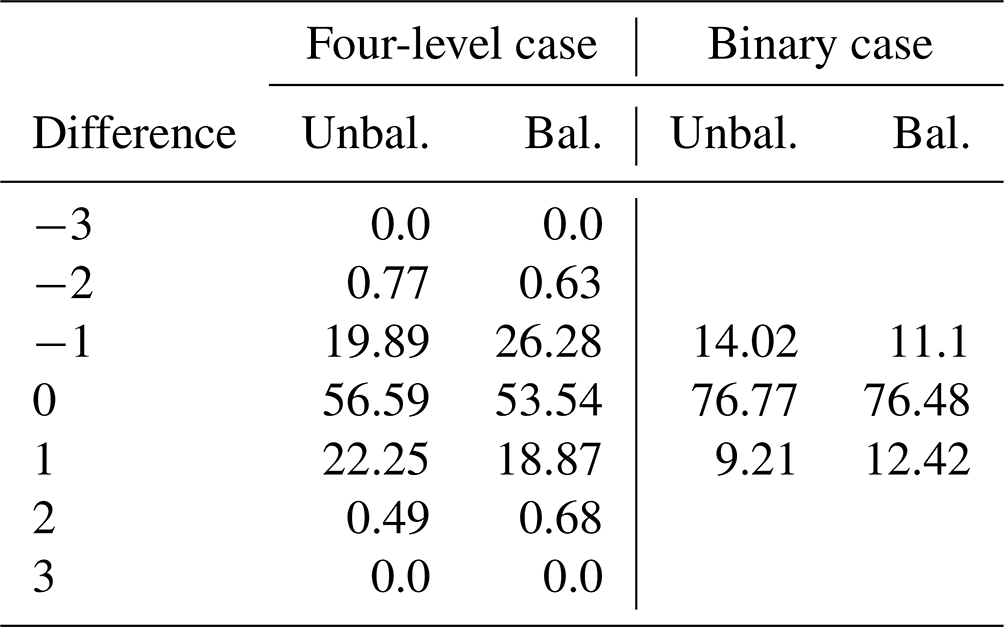
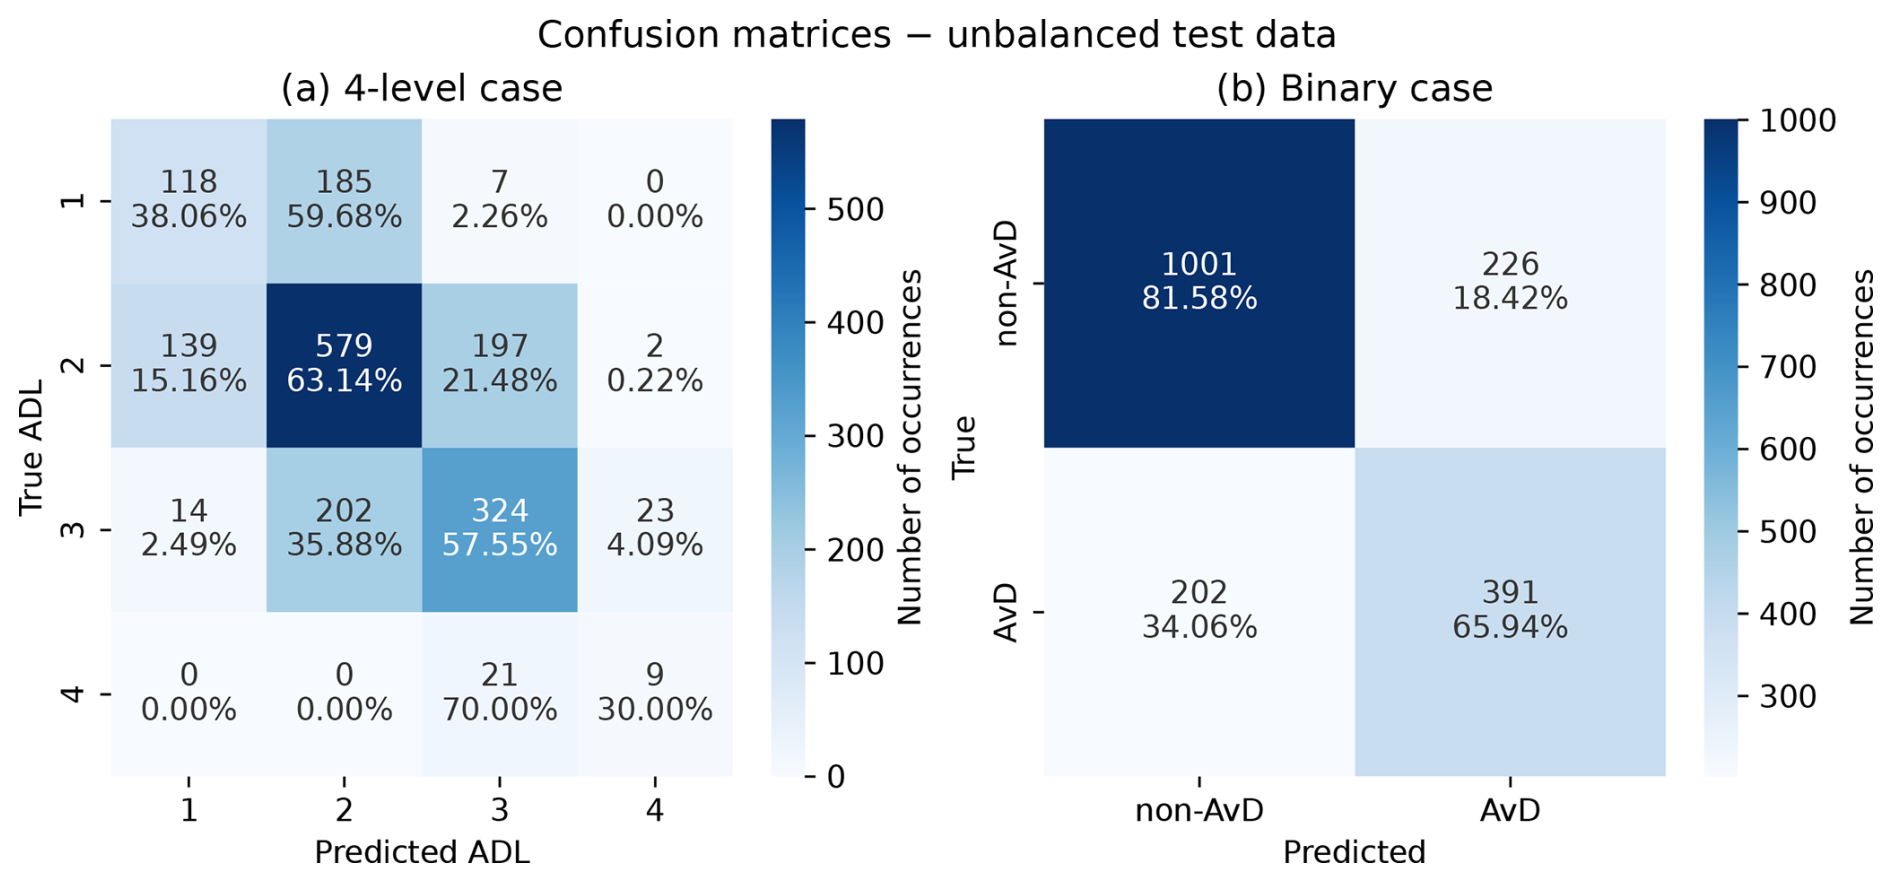
Figure 5Confusion matrices for the random forest classification with respect to the unbalanced test data for (a) the four-level case with avalanche-danger levels (ADLs) and (b) the binary case with non-avalanche days (non-AvD) and avalanche days (AvD). The values on the diagonals correspond to the recall scores shown in Tables 3 and 5, respectively. For the confusion matrices with respect to the balanced test data see Fig. S5.
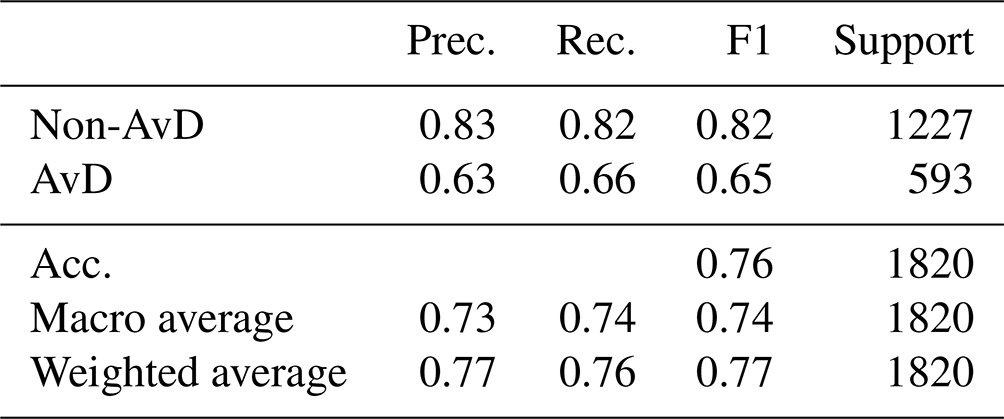
Table 5As Table 3 but for the binary case. The rows non-AvD and AvD represent non-avalanche days and avalanche days, respectively. See Table S3 for the balanced test data.
5.1 Four-level case
The overall accuracy in the four-level case is 57 % (see Table 3). Considering the confusion matrix (Fig. 5a) it is evident that while most of the ADL-2 and ADL-3 cases are classified correctly, ADL 1 is most often misclassified as ADL 2. Most ADL-4 cases are also misclassified as ADL 3. Thus, a large part of the misclassification is due to the confounding of levels 1 and 2 and levels 3 and 4. While this means that a large fraction of instances is misclassified, the misclassification difference exceeds one ADL only in about 2 % of cases (see Table 4). The leftmost column in Table 4 based on the unbalanced test data shows that more cases have a classification difference of +1 than a difference of −1, indicating that our RF model has a tendency to over-predict the ADL. However this is likely due to most cases being either ADL 1 or 2 (Fig. 6), and most ADL-1 cases are misclassified as ADL 2 (Fig. 5a). Accordingly, for the balanced test data (Table 4, second column) the situation is reversed, exhibiting an under-prediction of ADL (see also the confusion matrix for the balanced test data in Fig. S5a). From Fig. 6 it appears that the overall frequencies of the individual ADLs are reproduced for the unbalanced test data. However, this is not true for the balanced test data, where a severe overrepresentation of ADLs 2 and 3 is evident while ADLs 1 and 4 are strongly underrepresented. The confusion matrix based on the balanced test data (Fig. S5a) shows that about half of the ADL-1 and 4 cases are misclassified as ADL 2 and 3, respectively. This indicates that many of the synthetically generated cases for ADLs 1 and 4 are interpreted by the RF model as ADL-2 and ADL-3 days, respectively.

Figure 6Frequencies of occurrence of (squares) predicted and (circles) true test data danger levels for (a) the four-level case with avalanche-danger levels (ADLs) and (b) the binary case with non-avalanche days (non-AvD) and avalanche days (AvD). Shown are both the (black) unbalanced and (grey) balanced test data.
The overall accuracy of 57 % in the four-level case appears low compared to other studies (Schweizer and Föhn, 1996; Schirmer et al., 2009; Dekanová et al., 2018; Joshi et al., 2020; Pérez-Guillén et al., 2022; Sharma et al., 2023; Blagovechshenskiy et al., 2023) although it is slightly higher than in Fromm and Schönberger (2022) and Brabec and Meister (2001). Most of these studies used meteorological station data as well as sophisticated information on snow and/or SNOWPACK simulations, which may partly explain their better performance. As previously mentioned, Sharma et al. (2023) did not clarify if they selected their validation data randomly or used whole winters. We note that this has an immense influence on the purported model performance: when we randomly select 33 % of the data as test data, accuracies exceeding 85 % are obtained (both for the four-level and the binary case; not shown). This indicates that strong temporal correlations exist, confounding the model performance when test/validation data are chosen randomly. A further reason for the lower model performance here than in Pérez-Guillén et al. (2022) is that they had 20 years of data available and focused only on dry-snow avalanches, while we are restricted to 8 years of data and use the general ADL including all avalanche types/problems (see Sect. 2.1). Here we acquiesce to the noisier ADL data to have more training data available for our model, given that our training data set covers only six seasons. However, in future work we will attempt a more detailed analysis with respect to the different avalanche problems. Further reasons may explain (at least in part) the higher accuracies in most of the other studies. For example, Schweizer and Föhn (1996) let a human expert interact with their system, likely increasing the accuracy. Schirmer et al. (2009) used the ADL from the previous day, which increased the model performance. However, Pérez-Guillén et al. (2022) found that this strongly reduced the model accuracy for days where the ADL changes from the previous day. Thus, we here refrain from using the previous-day ADL as predictive feature. Another reason for not including the previous-day ADL in our statistical model is that our aim is to apply the model in a hindcast setting (Sect. 6) as well as to future climate change projections (in upcoming work) of avalanche danger for which previous-day ADL does not exist. As discussed by Fromm and Schönberger (2022), the extent and scale of the investigated region likely also impacts the results. They concentrated on a much smaller region which is more strongly affected by accidental and intentional avalanche release, potentially confounding their results compared to studies focusing, like here, on larger areas (e.g. Pérez-Guillén et al., 2022; Sharma et al., 2023; Schirmer et al., 2009). Notably, our warning regions in northern Norway have an average size of about 6800 km2 (see Table S1), while in Switzerland the average size is about 200 km2 (Pérez-Guillén et al., 2025). The smaller warning regions potentially imply a clearer connection of avalanche danger to meteorological conditions and thus generally less noisy data, which may explain part of the higher prediction accuracies of the Swiss models. More fundamentally, the different climates and topographies of the different study regions generally complicate comparisons among studies. Much of the cited work was conducted in central Europe (i.e. in the mid-latitudes), while our study area is in northern Norway and thus in the Arctic. The mountains in the Alps are often higher and the climate is more continental than in the fjord landscape of northern Norway. This leads to different snow and avalanche characteristics (e.g. van Herwijnen et al., 2024) and potentially implies differences in predictability, thus hampering comparability across studies.
Despite the relatively low overall accuracy, the fraction of misclassification larger than one ADL is similar to that found by Pérez-Guillén et al. (2022). However, Pérez-Guillén et al. (2022) generally obtained smaller differences in misclassification across the different classes, leading to their higher overall accuracy. Misclassifying ADL 4 as ADL 3 is especially undesirable since most avalanche accidents occur when the published ADL is 3 (see Fig. 4 in SLF, 2024; McClung, 2000). We have tested different class weights with a focus on ADLs 3 and 4 during the model training process, but this did not significantly reduce the misclassification. This indicates that our data are too noisy to effectively distinguish between ADLs 3 and 4, likely due to the considerable size of the warning regions (see Fig. S1 and Table S1).
Judging from the comparison of the model performance with respect to the unbalanced and balanced test data, our RF model has a tendency to over-predict the occurrence of the most frequent classes despite the efforts undertaken to balance the training and cross-validation test data (see Sect. 4). Another interpretation is that the model over-predicts the frequency of the medium classes (ADLs 2 and 3) at the expense of the more extreme classes (ADLs 1 and 4), which may be, at least in part, due to our decision of averaging over multiple grid cells to generate the predictive features (see Sect. 2.2). However, we have tested taking the 90th percentile instead of the average over the grid cells, but this led to similar frequencies being predicted for ADLs 2 and 3 (not shown). More fundamentally, we again point to the large warning regions in Norway. Various meteorological conditions may simultaneously be prevalent within a given region, implying a noisy relationship between the weather data and the ADLs, likely contributing to the high rates of misclassification. A decrease of warning-region size may be necessary for a clearer relationship between weather data and ADLs to substantially reduce misclassification and increase prediction accuracy.
We note that we have trained an artificial neural network (ANN) with the structure suggested in Sharma et al. (2023) on the training–test data setup presented here. The performance of the ANN was found to be similar to that of the RF model (not shown).
5.2 Binary case
For the binary case the overall accuracy is 0.76 (see Table 5), being much higher than in the four-level case. The higher accuracy is explained by the frequent confounding of ADLs 1 and 2 and ADLs 3 and 4, which in the binary case are aggregated into non-AvD and AvD, respectively. From Table 5 and Fig. 5b it appears that our binary-case RF model is better at predicting non-AvDs than AvDs. This concurs with the results from the four-level case, showing a better performance in predicting ADLs 1 and 2 than ADLs 3 and 4 (Fig. 5a and Table 3). Moreover, as expected from the results of the four-level case, the binary-case model to some degree tends to under-predict the AvDs with respect to the unbalanced test data, while for the balanced test data the AvDs are slightly over-predicted (Table 4). The authors are unaware of previous work similarly aggregating ADLs to AvDs and non-AvDs.
Figure 7 shows the 1970–2024 hindcast of the avalanche-day frequency (ADF) in the Nord-Troms region. The figures for the other regions are presented in the Supplement (Fig. S6). The ADF here refers to the number of avalanche days (AvD; i.e. days with ADL 3 or 4) per season. While the evolution of ADF is not the same in the different regions, there are strong similarities regarding certain features which may be observed in Fig. 7 and which are briefly summarised in the following. There is little to no trend in the full-season avalanche data from 1970 to 2024 (see Table S4 in the Supplement for linear trends). However, there is a phase of high ADF in the 1990s, mostly due to high ADF in winter (December through February) since the spring (March through May) ADF generally varies less. We note that the increase in ADF in the 1990s is consistent with a simultaneous rise in avalanche activity in Iceland (Keylock, 2003), and it coincides with high values of avalanche indicators for western Norway (Saloranta et al., 2024, see their Fig. 2). The phase of high ADF in the 1990s is accompanied by an increase in ADF variance (full season), with a considerable subsequent decrease in variance in 2000–2010, increasing slightly again after 2010. The ADF variance before 1990 is mostly due to spring ADF, as little variance is evident for winter ADF in this period. In the 1990s the variance in winter and spring appears to be in phase, causing the strong full-season ADF variance. However, in general, spring and winter ADF change in opposite ways over time. In spring there is a small overall increasing trend in ADF, while there is a small decrease in winter. However, the statistical significance of these trends is only moderate with p values of about 0.1±0.05 (see Table S4). These results appear broadly consistent with the recent analysis of avalanche indicators in Norway by Saloranta et al. (2024), who found only few significant trends for the period 1961–2020.
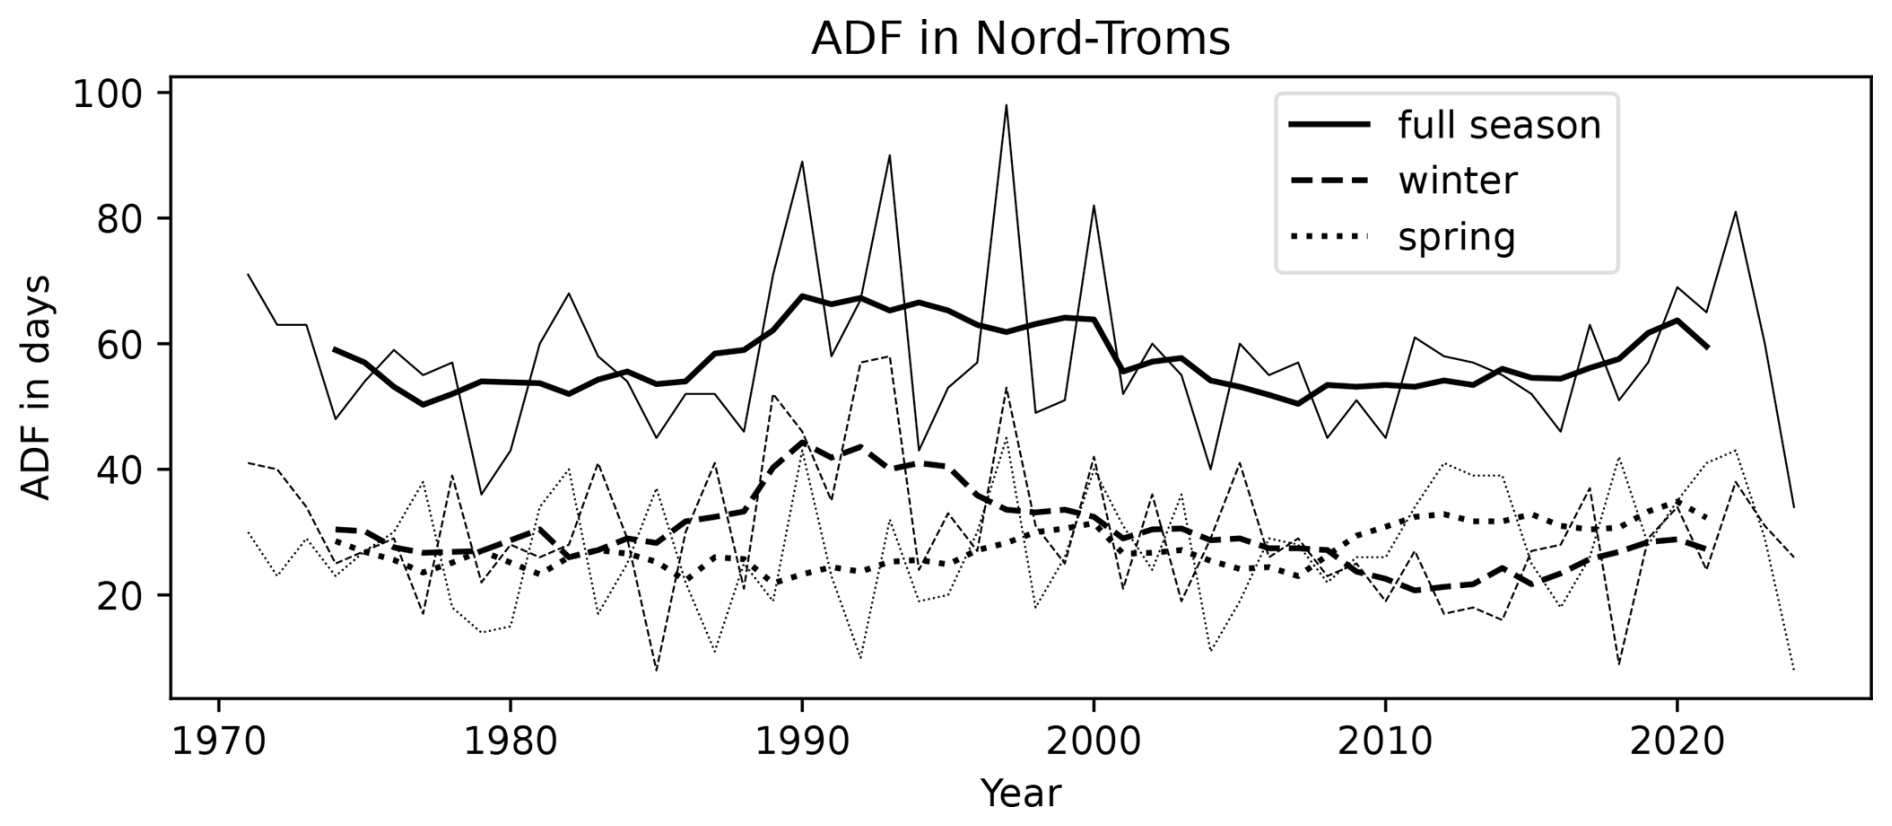
Figure 7Avalanche-day frequency (ADF) in Nord-Troms for the full season (solid), winter (dashed), and spring (dotted) for 1970–2024. The thin lines correspond to annual data, and the thick lines represent a 7-year rolling mean. See Fig. S6 for the other regions.
One of the most prevalent features of the ADF hindcast is the peak of winter ADF around 1990 in the 7-year rolling mean which is due to a phase of exclusively high ADF in these years. This is remarkable, since this period is known for exhibiting exceptionally high index values of the North Atlantic Oscillation (NAO; see e.g. Hurrell, 1995; Wanner et al., 2001) as well as of the Arctic Oscillation (AO; see e.g. Thompson and Wallace, 1998). The NAO is a measure of the sea-level pressure (SLP) difference between the Icelandic Low and the Azores High and is one of the most well-established and pronounced climate patterns influencing European climate (e.g. Hurrell, 1995; Wanner et al., 2001). The NAO index used here corresponds to the index by Hurrell (1995), which can be obtained from the National Center for Atmospheric Research's website (NCAR, 2024). The AO may be viewed as an extension of the NAO to the whole Northern Hemisphere and interpreted as the surface signature of modulations of the polar vortex at higher elevation (Wanner et al., 2001; Thompson and Wallace, 1998, 2001). The AO data were obtained from the website of the National Oceanic and Atmospheric Administration (NOAA, 2024).
Many studies have investigated and found a linkage between the NAO/AO and the weather conditions in Europe, especially in winter (see e.g. the review by Wanner et al., 2001). The NAO has also been related specifically to precipitation in northern Europe, including northern Norway, by Uvo (2003). This study found that winter precipitation in the Troms region exhibits correlation coefficients with the NAO index of up to 0.5–0.6 (see her Fig. 4). Uvo (2003) also notes that changes in precipitation due to NAO changes are connected to wind and topography. That is, stronger westerly winds induced by a higher NAO index are intercepted by the mountains in the proximity of the Norwegian cost, inducing precipitation there. However, she observed that since the westerly winds generated by the Icelandic Low and the Azores High do not reach northern Norway directly, this region is only intermediately influenced by the NAO. Consistently, Rogers (1997) found that North Atlantic storm activity (see also Alexandersson et al., 2000), which likely impacts wind and precipitation in northern Europe, is more strongly influenced by low-frequency SLP anomalies in the extreme north-eastern Atlantic than by the NAO. This appears to agree with the findings of Thompson and Wallace (2001), who showed that there is an increase in variance of the North Atlantic storm track associated with a high AO index, meaning that more storms reach the far north, inducing stronger winds and more precipitation there. At low AO index, conditions correspond more to blocking events, preventing storms from reaching further north. Note that the AO index is better correlated with Arctic SLP than the NAO index (see Fig. S7 in the Supplement).
To the authors' knowledge, the only studies trying to relate the NAO directly to avalanches in Europe are Keylock (2003), Jomelli et al. (2007), García et al. (2009), García-Sellés et al. (2010), and recently Bee et al. (2024). García et al. (2009) and García-Sellés et al. (2010) investigated avalanche activity in the Pyrenees (north-eastern Spain) and found a negative correlation. Conversely, Jomelli et al. (2007) found no correlation of avalanche activity and NAO in the French Alps. Bee et al. (2024) studied two regions in the western and eastern Italian Alps. Similar to the French Alps, no correlation was found for the western region, while the eastern region exhibited a negative correlation, consistent with the results from the Pyrenees. Finally, Keylock (2003) investigated avalanche activity in Iceland, hence in a location more closely related to our region of interest than those in the other studies. He tentatively concluded that while the NAO may not affect avalanche size distribution, a positive phase of the NAO likely increases avalanche activity. We note that Laute and Beylich (2018) also pointed to a potential linkage between avalanche activity and the NAO in western Norway, as a positive NAO index corresponds with higher winter precipitation there. However, they do not investigate the linkage directly.
Consistent with Keylock (2003) and the discussion above regarding the influence of the NAO and AO on northern Norwegian weather, we find that the northern Norwegian ADF is correlated with both NAO and AO but more so with the latter (compare Figs. 8 and S7). The correlation is particularly strong for 7-year rolling means of both quantities, indicating a stronger linkage at decadal compared to annual scales, although there is considerable variation across the five different regions (Figs. 8d and S9 in the Supplement). Notably, Figs. 8b, d, S9, and S10 in the Supplement reveal that while the correlations for annual means are not particularly strong (R=0.3–0.5), they are more consistent across regions than for the 7-year rolling means (R=0.2–0.8), at least in the winter months (December through February). Furthermore, comparing the lead–lag correlations in Figs. S9 and S10, it appears that the clearest correlation between ADF and AO is in the winter months, with a singular peak at AO-lag-year 0 for both annual and 7-year rolling means. In the spring months (March through May) there is more variation across regions, and while there are correlation peaks at AO-lag-year 0, there are further peaks at lead-year 3 and lag-year 4 in the annual means. Thus, we concentrate our further correlation analysis on the winter months.

Figure 8(a) Annual winter hindcast of avalanche-day frequency (ADF, red) and Arctic Oscillation (AO) index (black) for Nord-Troms. (b) Correlation coefficients of full-season, winter, and spring ADF with AO index for all regions. Panels (c) and (d) are the same as (a) and (b), respectively, but for 7-year rolling means. Black and grey colours in panels (b) and (d) indicate p values smaller and larger than 0.05, respectively, based on a Wald test with a t distribution. See Fig. S8 in the Supplement for a comparison of ADF and the North Atlantic Oscillation (NAO) index.
The 7-year rolling mean time series of the winter ADF and AO index show the strong peak in both quantities in the 1990s. The ADF and AO index decrease subsequently, but while the AO index increases again quite strongly after about 2010, the ADF shows only a small increase. This development is seen in all regions except Indre Troms, where the ADF corresponds more strongly to the AO index (see also the high correlation of the ADF and AO index in this region shown in Fig. 8d).
Since the ADF is here fully determined by the meteorological conditions, we investigate the predictive features and their correspondence with the AO index in the winter months. Figure 9 shows 7-year rolling means of ADF, the AO index, and w3 and s3 for Nord-Troms. Note that the most important predictive feature in the binary case is wdrift3_3, which is a combination of w3 and s3. We decided here to show both components, as the single parameter wdrift3_3 is more difficult to interpret and may obscure compensating variance of s3 and w3. It is evident that both features follow the AO index quite closely, but while s3 increases with the AO index (with a slight lag) after 2010, w3 shows little change. The discrepancy in the development after 2010 in s3 and w3 likely causes the slower increase in ADF predicted by the RF model. Thus, there is an apparent decoupling of wind speed from the AO index after 2010, causing a weakening of the correspondence of ADF and the AO index in most regions. We note that the decoupling after 2010 is even stronger for the correspondence of ADF with the NAO index (see Fig. S8c). So far, we have no compelling explanation for this. However, it must be remembered that the AO index is not the only climate mode influencing Scandinavian weather. We have investigated several more climate indices that are important for northern European wind and precipitation, and we find that the 7-year rolling mean of the Polar/Eurasian (PE) pattern index shows apparently unprecedented low values in the decade 2010–2020, especially in winter (see Fig. S11 in the Supplement). This is remarkable since, as Panagiotopoulos et al. (2002) pointed out, the PE pattern index has a structure similar to the AO. The index representing another important climate mode, the Scandinavian (SCA) pattern, exhibits consistently high values in winter around 2010, with a subsequent decrease (Fig. S12 in the Supplement). A low PE pattern index and a high SCA pattern index have been associated with a weaker polar vortex, likely weakening the westerly winds in the Arctic (e.g. Gao et al., 2017; Panagiotopoulos et al., 2002). Consistently, a higher SCA index has also been associated with weakened storm-track activity over northern Europe (Bueh and Nakamura, 2007). Hence, the anomalous states of other climate modes may cause the recent apparent decoupling of the AO and northern Norwegian wind speed and, thus, the weakening of the correspondence of the AO index with the northern Norwegian ADF.

Figure 9Avalanche-day frequency (ADF, red), 3 d mean wind speed (w3, orange), and 3 d sum of new snow (s3, blue) in Nord-Troms and the Arctic Oscillation (AO) index (black). The values correspond to 7-year rolling means.
In this study we implement a machine-learning approach for purely data-driven statistical prediction of avalanche-danger level (ADL) based on gridded meteorological (NORA3) and snow (seNorge) information in northern Norway. Two avalanche-danger scales are considered: (1) the original ADLs (four-level case) and (2) the binary case where ADLs 1 and 2 and ADLs 3 and 4 are aggregated to non-avalanche day (non-AvD) and avalanche day (AvD), respectively. For each case a random forest (RF) classifier is optimised and predictive features are selected. The RF model accuracy is considerably higher for the binary case (76 %) than for the four-level case (57 %), consistent with the frequent misclassification of ADL 1 as ADL 2 and ADL 4 as ADL 3 in the latter case. The accuracy in the four-level case is comparable to or even higher than in some earlier studies (Brabec and Meister, 2001; Fromm and Schönberger, 2022) but lower than in many others (Schirmer et al., 2009; Dekanová et al., 2018; Joshi et al., 2020; Pérez-Guillén et al., 2022; Sharma et al., 2023; Blagovechshenskiy et al., 2023). However, these studies, including our work, differ in type and quality of data, in background climate and topography, and in warning-region size. Thus, the comparison of accuracies between different studies should be regarded with care. We exploit the whole available NORA3 record to perform a hindcast of the avalanche-day frequency (ADF), which we define as the number of AvDs per season and which we interpret as a measure of avalanche activity. While there appears to be no general trend, there is noticeable variation over time, with a conspicuous peak in ADF in the 1990s, especially in the winter months (December through February). We connect this peak with a well-known Northern Hemispheric climate mode that has been shown to impact European climate, the Arctic Oscillation (AO). The ADF exhibits significant correlation with the AO, especially as a 7-year rolling mean.
Within the last decade, decadal prediction systems have shown an improvement of skill in representing and predicting AO and European winters (e.g. Riddle et al., 2013; Scaife et al., 2014; Kang et al., 2014; Stockdale et al., 2015; Athanasiadis et al., 2017, 2020). Given the here-found connection between ADF and AO, this is encouraging with respect to potential predictability of at least the decadal tendency of avalanche activity in northern Norway. However, the indication that the strength of the connection between the ADF and the AO has weakened in recent years, potentially due to the influence of other climate modes and/or as a direct effect of climate change, means that the value of AO predictability for avalanche forecasting remains uncertain.
An important advantage of a fully data-driven approach to predict avalanche danger and activity based on gridded weather/snow data is the potential to generate future projections of those metrics based on climate change scenario simulations (see e.g. Castebrunet et al., 2014; Mayer et al., 2024). Such simulations are mostly conducted by global climate models (GCMs) with too-coarse resolutions to be usable for avalanche prediction. Thus, regional downscalings are required to produce appropriate data. For Norway such data are available via the Nordic Convection Permitting Climate Projections (NorCP; Lind et al., 2023). In future work we plan to apply our machine-learning model to the NorCP data and generate ADF and ADL projections for northern Norway. However, the likely importance of (regional) climate modes for the development of avalanche activity, as described above, must be taken into account when considering future climate projections. It is not guaranteed that climate modes such as the AO are sufficiently represented in the GCMs and/or NorCP. Even if present, their variability will likely be out of phase with actual future development.
As of now the snowpack information for Norway is confined to data based on the simple snow model seNorge. Efforts are currently underway in cooperation with the Norwegian Water Resources and Energy Directorate (NVE) to implement the much more detailed model SNOWPACK to be run based on gridded meteorological data (Herla et al., 2024). In future research we plan to use the snow-stratigraphy information from SNOWPACK in our machine-learning approach to predict ADL and ADF. However, we note that results appear to deviate when it comes to the impact of including SNOWPACK output in ADL prediction machine-learning models: while Schirmer et al. (2009) found an improvement due to the inclusion of SNOWPACK data, the results of Fromm and Schönberger (2022) suggested no improvement, and in later work they used simpler snow information (similar to the seNorge data used here; Schönberger and Fromm, 2024; Fromm and Schönberger, 2024). Furthermore, Pérez-Guillén et al. (2025) found that predictions were mostly driven by precipitation variables and only to a lesser extent by snowpack-stability variables. Hence, the impact of the SNOWPACK information on our model performance in Norway remains to be seen.
Finally, the ADLs as used here do not distinguish between the different avalanche problems. This likely makes the ADL data noisy with respect to their relation to meteorological and snow data because different avalanche problems are caused by different weather and snow conditions. Here we opt for the general ADL as it guarantees a larger data set and it aggregates avalanche problems that may be related to similar weather conditions. However, in upcoming research we aim to disentangle the different avalanche problems. The most feasible approach appears to be to select the most frequent avalanche problem to ensure data availability to robustly train a statistical model and at the same time filter some of the noise due to the other, less frequent avalanche problems.
High-quality information on avalanche danger is of great importance as it enables stakeholders and people in general to make well-informed decisions affecting their life and property. Our study represents an initial step towards automated avalanche-danger prediction in northern Norway that may be used to support and improve expert forecasts. As ongoing and future climate change likely impacts avalanche characteristics, knowledge about potential future changes of these characteristics is valuable. Our methodology can be used to study future changes in avalanche danger and activity based on future-scenario climate-model projections. This information may assist governments and stakeholders in planning of future infrastructure and organisation to prepare for and adapt to environmental conditions in a changing climate.
To evaluate and compare model performance, several performance metrics (e.g. Sokolova and Lapalme, 2009) are employed, similar to earlier studies (e.g. Fromm and Schönberger, 2022; Pérez-Guillén et al., 2022). We use hits (a), false alarms (b), misses (c), and correct non-events (d) (see Table A1) to calculate the following performance metrics:
the accuracy or percentage of correctly classified samples;
the precision score, representing the fraction of hits among the positive forecasts (i.e. hits and false alarms);
the recall score, representing the fraction of hits among the positive observations (i.e. hits and misses); and
the F1 score, which corresponds to the harmonic mean of precision and recall. Following Pérez-Guillén et al. (2022) we use the F1-macro score in the cross-validation during the model optimisation procedure (Sect. 4). A macro score represents the unweighted mean of the score over all classes, thus treating all classes equally (e.g. Sokolova and Lapalme, 2009). As noted by Sokolova and Lapalme (2009), precision, recall, and hence the F1 score are invariant to changes in the classification of correct non-events.
Table A1Structure of the binary confusion matrix (see e.g. Sokolova and Lapalme, 2009; Wilks, 2011).

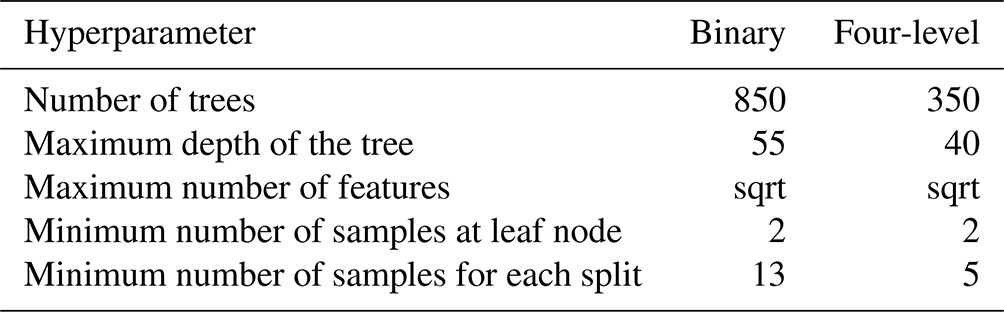
Table B1 lists the hyperparameters found to optimise the performance of the random forest model during the grid-search procedures. However, we note that we found little variation of the model performance when testing several different hyperparameter combinations.
Table B1The sets of hyperparameters used in the random forest models. The row “Maximum number of features” refers to the number of features considered at each split in the decision trees. “sqrt” indicates the square root of the number of all features.
The programming language Python was used to perform the data analysis and generate the figures. The random forest model was generated using the Python library scikit-learn (Pedregosa et al., 2011). The neural network was generated with the help of the library Keras (Chollet et al., 2015). The maps were produced with the library Cartopy (Met Office, 2010–2024). The code for running the seNorge model (based on NORA3 input), for producing the NORA3-based predictive features, and for generating the random forest and neural network models is available on Zenodo (Eiselt, 2024a). The random forest and neural network models are also available on Zenodo (Eiselt, 2024b), as are the predictive features (Eiselt, 2024c).
The supplement related to this article is available online at https://doi.org/10.5194/tc-19-1849-2025-supplement.
KUE and RGG conceived and designed the study. Material preparation, data collection, and analysis were performed by KUE. The first draft of the manuscript was written by KUE with comments and revisions from RGG. The revisions based on the reviewer comments were made by KUE with comments from RGG.
The contact author has declared that neither of the authors has any competing interests.
Publisher's note: Copernicus Publications remains neutral with regard to jurisdictional claims made in the text, published maps, institutional affiliations, or any other geographical representation in this paper. While Copernicus Publications makes every effort to include appropriate place names, the final responsibility lies with the authors.
The authors are grateful to an anonymous reviewer, to Cristina Pérez-Guillén, and to the editor, Jürg Schweizer, for helpful comments, suggestions, and references, leading to strong improvements of our manuscript. We would like to thank Debmita Bandyopadhyay, Konstantinos Christakos, Karsten Müller, and Daniel Krieger for valuable suggestions. Furthermore, we especially thank Christopher D'Amboise from the University of Tromsø and Håvard Thorset from the Norwegian Meteorological Institute for many interesting conversations and suggestions. Finally, we thank Samuel Kočiščák for his help with the Slovak avalanche yearbook. The research was conducted under the IMPETUS project (https://www.climate-impetus.eu, last access: 9 May 2025). The random forest models were optimised and trained on the Saga supercomputer at the University of Tromsø (UiT) provided by UNINETT Sigma2, under the project NN9348k.
This research has been supported by Horizon 2020 (grant no. 101037084).
This paper was edited by Jürg Schweizer and reviewed by Cristina Pérez-Guillén and one anonymous referee.
Alexandersson, H., Tuomenvirta, H., Smith, T., and Iden, K.: Trends of storms in NW Europe derived from an updated pressure data set, Clim. Res., 14, 71–73, https://doi.org/10.3354/cr014071, 2000. a
Athanasiadis, P., Bellucci, A., Scaife, A., Hermanson, L., Materia, S., Sanna, A., Borrelli, A., MacLachlan, C., and Gualdi, S.: A multisystem view of wintertime NAO seasonal predictions, J. Climate, 30, 1461–1475, https://doi.org/10.1175/JCLI-D-16-0153.1, 2017. a
Athanasiadis, P., S. Yeager, Y.-O. K., Bellucci, A., Smith, D. W., and Tibaldi, S.: Decadal predictability of North Atlantic blocking and the NAO, npj Climate and Atmospheric Science, 3, 20, https://doi.org/10.1038/s41612-020-0120-6, 2020. a
Atwater, M. M.: Snow avalanches, Sci. Am., 190, 26–31, https://doi.org/10.1038/scientificamerican0154-26, 1954. a
Bakkehøi, S.: Snow avalanche prediction using a probabilistic method, in: Avalanche Formation, Movement and Effects, vol. 162 of Proceedings and Reports, edited by: Salm, B. and Gubler, H., International Association of Hydrological Sciences, 549–555, https://iahs.info/uploads/dms/6852.549-555-162-Bakkeh%C3%B8i.pdf (last access: 9 May 2025), 1987. a, b
Bartelt, P. and Lehning, M.: A physical SNOWPACK model for the Swiss avalanche warning Part I: Numerical model, Cold Reg. Sci. Technol., 35, 123–145, https://doi.org/10.1016/S0165-232X(02)00074-5, 2002. a
Bee, C., Zugliani, D., and Rosatti, G.: A correlation between avalanches and teleconnection indices in the Italian Alps, in: International Snow Science Workshop Proceedings 2024, Tromsø, Norway, 147–152, http://arc.lib.montana.edu/snow-science/item/3126 (last access: 23–29 September 2024), 2024. a, b
Bengtsson, L., Andrae, U., Aspelien, T., Batrak, Y., Calvo, J., de Rooy, W., Gleeson, E., Hansen-Sass, B., Homleid, M., Hortal, M., Ivarsson, K.-I., Lenderink, G., Niemelä, S., Nielsen, K. P., Onvlee, J., Rontu, L., Samuelsson, P., Muñoz, D. S., Subias, A., Tijm, S., Toll, V., Yang, X., and Køltzow, M. Ø.: The HARMONIE-AROME Model Configuration in the ALADIN-HIRLAM NWP System, Mon. Weather Rev., 146, 1919–1935, https://doi.org/10.1175/MWR-D-16-0417.1, 2017. a
Blagovechshenskiy, V., Medeu, A., Gulyayeva, T., Zhdanov, V., Ranova, S., Kamalbekova, A., and Aldabergen, U.: Application of Artificial Intelligence in the Assessment and Forecast of Avalanche Danger in the Ile Alatau Ridge, Water-Sui., 15, 1438, https://doi.org/10.3390/w15071438, 2023. a, b, c, d, e, f
Brabec, B. and Meister, R.: A nearest-neighbor model for regional avalanche forecasting, Ann. Glaciol., 32, 130–134, https://doi.org/10.3189/172756401781819247, 2001. a, b, c, d
Breiman, L.: Random forests, Mach. Learn., 45, 5–32, https://doi.org/10.1023/A:1010933404324, 2001. a
Breiman, L., Friedman, J., Stone, C. J., and Olshen, R. A.: Classification and Regression Trees, Wadsworth International Group, Belmont, CA, https://doi.org/10.1201/9781315139470, 1984. a, b
Bueh, C. and Nakamura, H.: Scandinavian pattern and its climatic impact, Q. J. Roy. Meteor. Soc., 133, 2117–2131, https://doi.org/10.1002/qj.173, 2007. a
Castebrunet, H., Eckert, N., Giraud, G., Durand, Y., and Morin, S.: Projected changes of snow conditions and avalanche activity in a warming climate: the French Alps over the 2020–2050 and 2070–2100 periods, The Cryosphere, 8, 1673–1697, https://doi.org/10.5194/tc-8-1673-2014, 2014. a, b
Chawla, N. V., Bowyer, K. W., Hall, L. O., and Kegelmeyer, W.-P.: SMOTE: Synthetic Minority Over-sampling Technique, J. Artif. Intell. Res., 16, 321–357, https://doi.org/10.1613/jair.953, 2002. a
Chollet, F. et al.: Keras, https://keras.io (last access: 9 May 2025), 2015. a
Conway, H., Breyfogle, S., and Wilbour, C. R.: Observations relating to wet snow stability, in: Proceedings: 1988 International Snow Science Workshop, Whistler, BC, 211–222, http://arc.lib.montana.edu/snow-science/item/643 (last access: 12–15 October 1988), 1988. a, b
Davis, R. E., Elder, K., Howlett, D., and Bouzaglou, E.: Relating storm and weather factors to dry slab avalanche activity in Alta, Utah, and Mammoth Mountain, California, using classification and regression trees, Cold Reg. Sci. Technol., 30, 79–89, https://doi.org/10.1016/S0165-232X(99)00032-4, 1999. a, b
Dekanová, M., Duchoň, F., Dekan, M., Kyzek, F., and Biskupič, M.: Avalanche forecasting using neural network, in: Proceedings of the IEEE ELEKTRO, Mikulov, Czech Republic, 21–23 May 2018, 1–5, https://doi.org/10.1109/ELEKTRO.2018.8398359, 2018. a, b, c, d, e, f
Dkengne Sielenou, P., Viallon-Galinier, L., Hagenmuller, P., Naveau, P., Morin, S., Dumont, M., Verfaillie, D., and Eckert, N.: Combining random forests and class-balancing to discriminate between three classes of avalanche activity in the French Alps, Cold Reg. Sci. Technol., 187, 103276, https://doi.org/10.1016/j.coldregions.2021.103276, 2021. a, b, c
Dyrrdal, A. V., Isaksen, K., Jacobsen, J. K. S., and Nilsen, I. B.: Present and future changes in winter climate indices relevant for access disruptions in Troms, northern Norway, Nat. Hazards Earth Syst. Sci., 20, 1847–1865, https://doi.org/10.5194/nhess-20-1847-2020, 2020. a, b, c, d, e
EAWS: Avalanche Problems, https://www.avalanches.org/standards/avalanche-problems/, last access: 7 February 2025, 2025. a
Eckerstorfer, M., Malnes, E., and Müller, K.: A complete snow avalanche activity record from a Norwegian forecasting region using Sentinel-1 satellite radar data, Cold Reg. Sci. Technol., 144, 39–51, https://doi.org/10.1016/j.coldregions.2017.08.004, 2017. a
Eiselt, K.-U.: kei070/Python-Avalanche-Library: v1.0.2 (v1.0.2), Zenodo [code], https://doi.org/10.5281/zenodo.14871372, 2024a. a
Eiselt, K.-U.: Avalanche danger prediction models, Zenodo [data set], https://doi.org/10.5281/zenodo.14529772, 2024b. a
Eiselt, K.-U.: Avalanche danger predictive features (NORA3, seNorge, northern Norway), Zenodo [data set], https://doi.org/10.5281/zenodo.14528579, 2024c. a
Engeset, R. V.: National Avalanche Warning Service for Norway – established 2013, in: International Snow Science Workshop Grenoble, Chamonix Mont-Blanc, France, 7–11 October 2013, 301–310, http://arc.lib.montana.edu/snow-science/item/1853 (last access: 9 May 2025), 2013. a, b, c
Engeset, R. V., Ekker, R., Humstad, T., and Landrø, M.: Varsom: Regobs – A common real-time picture of the hazard situation shared by mobile information technologiy, in: Proceedings, International Snow Science Workshop, Innsbruck, Austria, 7–12 October 2018, 1573–1577, http://arc.lib.montana.edu/snow-science/item/2822 (last access: 9 May 2025), 2018a. a, b
Engeset, R. V., Pfuhl, G., Landrø, M., Mannberg, A., and Hetland, A.: Communicating public avalanche warnings – what works?, Nat. Hazards Earth Syst. Sci., 18, 2537–2559, https://doi.org/10.5194/nhess-18-2537-2018, 2018b. a, b
Fernandéz, A., García, S., Herrera, F., and Chawla, N. V.: SMOTE for learning from imbalanced data: Progress and challenges, marking the 15 year anniversary, J. Artif. Intell. Res., 61, 863–905, https://doi.org/10.1613/jair.1.11192, 2018. a, b, c, d
Fromm, R. and Schönberger, C.: Estimating the danger of snow avalanches with a machine learning approach using a comprehensive snow cover model, Mach. Learn. Appl., 10, 100405, https://doi.org/10.1016/j.mlwa.2022.100405, 2022. a, b, c, d, e, f, g
Fromm, R. and Schönberger, C.: Generating maps for operational avalanche warning with machine learning algorithms, in: International Snow Science Workshop Proceedings 2024, Tromsø, Norway, 184–188, http://arc.lib.montana.edu/snow-science/item/3131 (last access: 23–29 September 2024), 2024. a, b
Gao, T., Yu, J.-Y., and Paek, H.: Impacts of four northern-hemisphere teleconnection patterns on atmospheric circulations over Eurasia and the Pacific, Theor. Appl. Climatol., 129, 815–831, https://doi.org/10.1007/s00704-016-1801-2, 2017. a
García, C., Martí, G., Oller, P., Moner, I., Gavaldà, J., Martínez, P., and Peña, J. C.: Major avalanches occurrence at regional scale and related atmospheric circulation patterns in the Eastern Pyrenees, Cold Reg. Sci. Technol., 59, 106–118, https://doi.org/10.1016/j.coldregions.2009.07.009, 2009. a, b
García, S., Luengo, J., and Herrera, F.: Tutorial on practical tips of the most influential data preprocessing algorithms in data mining, Knowl.-Based Syst., 98, 1–29, https://doi.org/10.1016/j.knosys.2015.12.006, 2016. a
García-Sellés, C., Peña, J. C., Martí, G., Oller, P., and Martínez, P.: WeMOI and NAOi influence on major avalanche activity in the Eastern Pyrenees, Cold Reg. Sci. Technol., 64, 137–145, https://doi.org/10.1016/j.coldregions.2010.08.003, 2010. a, b
Gauthier, F., Germain, D., and Hétu, B.: Logistic models as a forecasting tool for snow avalanches in a cold maritime climate: northern Gaspésie, Québec, Canada, Nat. Hazards, 89, 201–232, https://doi.org/10.1007/s11069-017-2959-3, 2017. a, b, c
Haakenstad, H. and Breivik, Ø.: NORA3. Part II: Precipitation and temperature statistics in complex terrain modeled with a nonhydrostatic model, J. Appl. Meteorol. Clim., 61, 1549–1572, https://doi.org/10.1175/JAMC-D-22-0005.1, 2022. a, b, c
Haakenstad, H., Breivik, Ø., Furevik, B. R., Reistad, M., Bohlinger, P., and Aarnes, O. J.: NORA3: A nonhydrostatic high-resolution hindcast of the North Sea, the Norwegian Sea, and Barents Sea, J. Appl. Meteorol. Clim., 60, 1443–1464, https://doi.org/10.1175/JAMC-D-21-0029.1, 2021. a, b, c
Hao, J., Zhang, X., Li, P. C. L., Zhang, G., and Li, C.: Impacts of climate change on snow avalanche activity along a transportation corridor in the Tianshan Mountains, Int. J. Disast. Risk Sc., 14, 510–522, https://doi.org/10.1007/s13753-023-00475-0, 2023. a, b
Hendrikx, J., Owens, I., Carran, W., and Carran, A.: Avalanche activity in an extreme matitime climate: the application of classification trees for forecasting, Cold Reg. Sci. Technol., 43, 104–116, https://doi.org/10.1016/j.coldregions.2005.05.006, 2005. a, b
Hendrikx, J., Murphy, M., and Onslow, T.: Classification trees as a tool for operational avalanche forecasting on the Seward Highway, Alaska, Cold Reg. Sci. Technol., 97, 113–120, https://doi.org/10.1016/j.coldregions.2013.08.009, 2014. a, b, c
Herla, F., Widforss, A., Binder, M., Müller, K., Horton, S., Reisecker, M., and Mitterer, C.: Establishing an operational weather & snowpack model chain in Norway to support avalanche forecasting, in: International Snow Science Workshop Proceedings 2024, Tromsø, Norway, 168–175, http://arc.lib.montana.edu/snow-science/item/3129 (last access: 23–29 September 2024), 2024. a
Hersbach, H., Bell, B., Berrisford, P., Hirahara, S., Horányi, A., Muñoz-Sabater, J., Nicolas, J., Peubey, C., Radu, R., Schepers, D., Simmons, A., Soci, C., Abdalla, S., Abellan, X., Balsamo, G., Bechtold, P., Biavati, G., Bidlot, J., Bonavita, M., Chiara, G. D., Dahlgren, P., Dee, D., Diamantakis, M., Dragani, R., Flemming, J., Forbes, R., Fuentes, M., Geer, A., Haimberger, L., Healy, S., Hogan, R. J., Hólm, E., Janisková, M., Keeley, S., Laloyaux, P., Lopez, P., Lupu, C., Radnoti, G., de Rosnay, P., Rozum, I., Vamborg, F., Villaume, S., and Thépaut, J.-N.: The ERA5 global reanalysis, Q. J. Roy. Meteor. Soc., 146, 1999–2049, https://doi.org/10.1002/qj.3803, 2020. a
Heywood, L.: Rain on snow avalanche events – Some observations, in: Proceedings: 1988 International Snow Science Workshop, Whistler, BC, 125–136, http://arc.lib.montana.edu/snow-science/item/627 (last access: 12–15 October 1988), 1988. a
Hurrell, J. W.: Decadal trends in North Atlantic Oscillation: regional temperatures and precipitation, Science, 269, 676–679, https://doi.org/10.1126/science.269.5224.67, 1995. a, b, c
Jaedicke, C., Solheim, A., Blikra, L. H., Stalsberg, K., Sorteberg, A., Aaheim, A., Kronholm, K., Vikhamar-Schuler, D., Isaksen, K., Sletten, K., Kristensen, K., Barstad, I., Melchiorre, C., Høydal, Ø. A., and Mestl, H.: Spatial and temporal variations of Norwegian geohazards in a changing climate, the GeoExtreme Project, Nat. Hazards Earth Syst. Sci., 8, 893–904, https://doi.org/10.5194/nhess-8-893-2008, 2008. a, b, c, d, e, f, g
Johnsen, E. R.: Modern forms of communication avalanche danger – A Norwegian case, in: International Snow Science Workshop Grenoble, Chamonix Mont-Blanc, France, 7–11 October 2013, 423–427, http://arc.lib.montana.edu/snow-science/item/1829 (last access: 9 May 2025), 2013. a
Jomelli, V., Delval, C., Grancher, D., Escande, S., Brunstein, D., Hetu, B., Filion, L., and Pech, P.: Probabilistic analysis of recent snow avalanche activity and weather in the French Alps, Cold Reg. Sci. Technol., 47, 180–192, https://doi.org/10.1016/j.coldregions.2006.08.003, 2007. a, b, c
Joshi, J. C., Kumar, T., Srivastava, S., Sachdeva, D., and Ganju, A.: Application of Hidden Markov Model for avalanche danger simulations for road sectors in North-West Himalaya, Nat. Hazards, 93, 1127–1143, https://doi.org/10.1007/s11069-018-3343-7, 2018. a
Joshi, J. C., Kaur, P., Kumar, B., Singh, A., and Satyawali, P. K.: HIM-STRAT: a neural network-based model for snow cover simulation and avalanche hazard prediction over North-West Himalaya, Nat. Hazards, 103, 1239–1260, https://doi.org/10.1007/s11069-020-04032-6, 2020. a, b, c, d, e, f
Judson, A. and Erickson, B. J.: Predicting avalanche intensity from weather data: A statistical analysis, US Forest Service research paper RM-112, US Rocky Mountain Forest and Range Experiment Station, Fort Collins, CO, http://catalog.hathitrust.org/Record/007410988 (last access: 9 May 2025), 1973. a
Kang, D., Lee, M.-I., Im, J., D. Kim, H.-M. K., Kang, H.-S., Schubert, S. D., Arribas, A., and MacLachlan, C.: Prediction of the Arctic Oscillation in boreal winter by dynamical seasonal forecasting systems, Geophys. Res. Lett., 41, 3577–3585, https://doi.org/10.1002/2014GL060011, 2014. a
Keylock, C. J.: The North Atlantic Oscillation and snow avalanching in Iceland, Geophys. Res. Lett., 30, 58, https://doi.org/10.1029/2002GL016272, 2003. a, b, c, d
Kosberg, S., Müller, K., Landrø, M., Ekker, R., and Engeset, R.: Key to success for the Norwegian Avalanche Center: Merging of theoretical and practical knowledge, in: International Snow Science Workshop Grenoble, Chamonix Mont-Blanc, 2013, 316–319, http://arc.lib.montana.edu/snow-science/item/1855 (last access: 9 May 2025), 2013. a
Kronholm, K., Vikhamar-Schuler, D., Jaedicke, C., Isaksen, K., Sorteberg, A., and Kristensen, K.: Forecasting snow avalanche days from meteorological data using classification trees; Grasdalen, western Norway, in: Proceedings of the 2006 International Snow Science Workshop, Telluride, Colorado, 786–795, https://iahs.info/uploads/dms/069040.pdf (last access: 9 May 2025), 2006. a, b, c, d
LaChapelle, E. R.: Avalanches – A modern synthesis, Int. Assoc. Hydrol. Sci., 69, 75–84, https://iahs.info/uploads/dms/069040.pdf (last access: 9 May 2025), 1966. a
LaChapelle, E. R.: The fundamental processes in conventional avalanche forecasting, J. Glaciol., 26, 75–84, https://doi.org/10.3189/S0022143000010601, 1980. a
Laute, K. and Beylich, A. A.: Potential effects of climate change on future snow avalanche activity in western Norway deduced from meteorological data, Geogr. Ann. A, 10, 163–184, https://doi.org/10.1080/04353676.2018.1425622, 2018. a, b, c
Lehning, M., Bartelt, P., Brown, B., and Fierz, C.: A physical SNOWPACK model for the Swiss avalanche warning: Part III. Meteorological forcing, thin layer formation and evaluation, Cold Reg. Sci. Technol., 35, 169–184, https://doi.org/10.1016/S0165-232X(02)00072-1, 2002a. a
Lehning, M., Bartelt, P., Brown, B., Fierz, C., and Satyawali, P.: A physical SNOWPACK model for the Swiss avalanche warning: Part II. Snow microstructure, Cold Reg. Sci. Technol., 35, 147–167, https://doi.org/10.1016/S0165-232X(02)00073-3, 2002b. a
Lind, P., Belušić, D., Médus, E., Dobler, A., Pedersen, R. A., Wang, F., Matte, D., Kjellström, E., Landgren, O., Lindstedt, D., Christensen, O. B., and Christensen, J. H.: Climate change information over Fenno-Scandinavia produced with a convection-permitting climate model, Clim. Dynam., 61, 519–541, https://doi.org/10.1007/s00382-022-06589-3, 2023. a
Maissen, A., Techel, F., and Volpi, M.: A three-stage model pipeline predicting regional avalanche danger in Switzerland (RAvaFcast v1.0.0): a decision-support tool for operational avalanche forecasting, Geosci. Model Dev., 17, 7569–7593, https://doi.org/10.5194/gmd-17-7569-2024, 2024. a
Mayer, S., Techel, F., Schweizer, J., and van Herwijnen, A.: Prediction of natural dry-snow avalanche activity using physics-based snowpack simulations, Nat. Hazards Earth Syst. Sci., 23, 3445–3465, https://doi.org/10.5194/nhess-23-3445-2023, 2023. a, b, c
Mayer, S., Hendrick, M., Michel, A., Richter, B., Schweizer, J., Wernli, H., and van Herwijnen, A.: Impact of climate change on snow avalanche activity in the Swiss Alps, The Cryosphere, 18, 5495–5517, https://doi.org/10.5194/tc-18-5495-2024, 2024. a, b, c, d
McClung, D. M.: Predictions in avalanche forecasting., Ann. Glaciol., 31, 377–381, https://doi.org/10.3189/172756400781820507, 2000. a
Met Office: Cartopy: a cartographic python library with a Matplotlib interface, Exeter, Devon, https://scitools.org.uk/cartopy (last access: 9 May 2025), 2010–2024. a
Möhle, S., Bründl, M., and Beierle, C.: Modeling a system for decision support in snow avalanche warning using balanced random forest and weighted random forest, in: International Conference on Artificial Intelligence: Methodology, Systems, and Applications, edited by: Agre, G., Hitzler, P., Krisnadhi, A. A., and Kuznetsov, S. O., Springer, Cham, 81–91, https://doi.org/10.1007/978-3-319-10554-3_8, 2014. a, b
Morin, S., Horton, S., Techel, F., Bavay, M., Coléou, C., Fierz, C., Gobiet, A., Hagenmuller, P., Lafaysse, M., Ližar, M., and Mitterer, C.: Application of physical snowpack models in support of operational avalanche hazard forecasting: A status report on current implementations and prospects for the future, Cold Reg. Sci. Technol., 170, 102910, https://doi.org/10.1016/j.coldregions.2019.102910, 2020. a, b, c
Müller, K., Kosberg, S., Landrø, M., and Engeset, R. V.: Report from the first operational winter of the Norwegian Avalanche Centre, International Snow Science Workshop Grenoble, Chamonix Mont-Blanc, France, 7–11 October 2013, 311–315, http://arc.lib.montana.edu/snow-science/item/1854 (last access: 9 May 2025), 2013. a
Müller, K., Mitterer, C., Engeset, R., Ekker, R., and Kosberg, S.: Combining the conceptual model of avalanche hazard with the Bavarian matrix, in: International Snow Science Workshop 2016 Proceedings, Breckenridge, CO, USA, 3–7 October 2016, 472–479, http://arc.lib.montana.edu/snow-science/item/2309 (last access: 9 May 2025), 2016a. a
Müller, K., Stucki, T., Mitterer, C., Nairz, P., Konetschny, H., Feistl, T., Coleou, C., Berbenni, F., and Chiambretti, I.: Towards an improved European auxiliary matrix for assessing avalanche danger levels, in: International Snow Science Workshop 2016 Proceedings, Breckenridge, CO, USA, 3–7 October 2016, 1229–1231, http://arc.lib.montana.edu/snow-science/item/2445 (last access: 9 May 2025), 2016b. a
Müller, K., Eckerstorfer, M., Grahn, J., Malnes, E., Humstad, R. E. T., and Widforss, A.: Norway's operational avalanche activity monitoring system unsing Sentinel-1, in: 2021 IEEE International Geoscience and Remote Sensing Symposium IGARSS, 11–16 July 2021, Brussels, Belgium, 236–238, https://doi.org/10.1109/IGARSS47720.2021.9553152, 2021. a
Müller, K., Techel, F., Mitterer, C., Feistl, T., Sofia, S., Roux, N., Palmgren, P., Bellido, G. M., and Bertranda, L.: The EAWS Matrix, a look-up table for regional avalanche danger level assessment, and its underlying concept, in: International Snow Science Workshop Proceedings 2023, Bend, Oregon, 8–13 October 2023, 540–546, http://arc.lib.montana.edu/snow-science/item/2930 (last access: 9 May 2025), 2023. a, b
NCAR: Hurrell North Atlantic Oscillation (NAO) Index (station-based), https://climatedataguide.ucar.edu/climate-data/hurrell-north-atlantic-oscillation-nao-index-station-based, last access: 2 December 2024. a
NOAA: Climate Variability: Arctic Oscillation, https://www.climate.gov/news-features/understanding-climate/climate-variability-arctic-oscillation, accessed: 2 December 2024. a
Panagiotopoulos, F., Shahgedanova, M., and Stephenson, D.: A review of Northern Hemisphere winter-time teleconnection patterns, J. Phys, 12, 27–47, https://doi.org/10.1051/jp4:20020450, 2002. a, b
Pedregosa, F., Varoquaux, G., Gramfort, A., Michel, V., Thirion, B., Grisel, O., Blondel, M., Prettenhofer, P., Weiss, R., Dubourg, V., Vanderplas, J., Passos, A., Cournapeau, D., Brucher, M., Perrot, M., and Duchesnay, E.: Scikit-learn: Machine Learning in Python, J. Mach. Learn. Res., 12, 2825–2830, 2011. a
Pérez-Guillén, C., Techel, F., Hendrick, M., Volpi, M., van Herwijnen, A., Olevski, T., Obozinski, G., Pérez-Cruz, F., and Schweizer, J.: Data-driven automated predictions of the avalanche danger level for dry-snow conditions in Switzerland, Nat. Hazards Earth Syst. Sci., 22, 2031–2056, https://doi.org/10.5194/nhess-22-2031-2022, 2022. a, b, c, d, e, f, g, h, i, j, k, l, m, n, o, p, q, r, s, t, u, v, w, x, y
Pérez-Guillén, C., Simeon, A., Techel, F., Volpi, M., Sovilla, B., and van Herwijnen, A.: Integrating automated avalanche detections for validating and explaining avalanche forecast models, in: International Snow Science Workshop Proceedings 2024, Tromsø, Norway, 23–29 September 2024, 52–57, http://arc.lib.montana.edu/snow-science/item/3111 (last access: 9 May 2025), 2024a. a
Pérez-Guillén, C., Techel, F., Volpi, M., and van Herwijnen, A.: Assessing the performance and explainability of an avalanche danger forecast model, Nat. Hazards Earth Syst. Sci., 25, 1331–1351, https://doi.org/10.5194/nhess-25-1331-2025, 2025. a, b, c, d, e, f, g, h
Reistad, M., Breivik, Ø., Haakenstad, H., Aarnes, O. J., Furevik, B. R., and Bidlot, J.: A high-resolution hindcast of wind and waves for the North Sea, the Norwegian Sea, and the Barents Sea, J. Geophys. Res., 116, C05019, https://doi.org/10.1029/2010JC006402, 2011. a
Riddle, E. E., Butler, A. H., Furtado, J. C., Cohen, J. L., and Kumar, A.: CFSv2 ensemble prediction of the wintertime Arctic Oscillation, Clim. Dynam., 41, 1099–1116, https://doi.org/10.1007/s00382-013-1850-5, 2013. a
Rogers, J. C.: North Atlantic Storm Track Variability and Its Association to the North Atlantic Oscillation and Climate Variability of Northern Europe, J. Climate, 10, 1635–1647, https://doi.org/10.1175/1520-0442(1997)010<1635:NASTVA>2.0.CO;2, 1997. a
Saloranta, T., Müller, K., and Wickström, S.: Trends in hydrometeorological avalanche indicators in Norway and Svalbard in 1961–2020, in: International Snow Science Workshop Proceedings 2024, Tromsø, Norway, 23–29 September 2024, 643–647, http://arc.lib.montana.edu/snow-science/item/3203 (last access: 9 May 2025), 2024. a, b
Saloranta, T. M.: Simulating snow maps for Norway: description and statistical evaluation of the seNorge snow model, The Cryosphere, 6, 1323–1337, https://doi.org/10.5194/tc-6-1323-2012, 2012. a, b
Saloranta, T. M.: Simulating more accurate snow maps for Norway with MCMC parameter estimation method, The Cryosphere Discuss., 8, 1973–2003, https://doi.org/10.5194/tcd-8-1973-2014, 2014. a
Saloranta, T. M.: Operational snow mapping with simplified data assimilation using the seNorge snow model, J. Hydrol., 538, 314–325, https://doi.org/10.1016/j.jhydrol.2016.03.061, 2016. a, b
Scaife, A. A., Arribas, A., Blockley, E., Brookshaw, A., Clark, R. T., Dunstone, N., Eade, R., Fereday, D., Folland, C. K., M. Gordon, L. H., Knight, J. R., Lea, D. J., MacLachlan, C., Maidens, A., Martin, M., Peterson, A. K., Smith, D., Vellinga, M., Wallace, E., Waters, J., and Williams, A.: Skillful long-range prediction of European and North American winters, Geophys. Res. Lett., 41, 2514–2519, https://doi.org/10.1002/2014GL059637, 2014. a
Schirmer, M., Lehning, M., and Schweizer, J.: Statistical forecasting of regional avalanche danger using simulated snow-cover data, J. Glaciol., 55, 761–768, https://doi.org/10.3189/002214309790152429, 2009. a, b, c, d, e, f
Schönberger, C. and Fromm, R.: Generating maps for operational avalanche warning with machine learning algorithms, in: Proceedings of the INTERPRAEVENT 2024, Vienna, Austria, 10–13 June, 432–435, https://www.interpraevent.at/en/proceeding/proceedings-ip-2024 (last access: 9 May 2025), 2024. a
Schweizer, J. and Föhn, P. M. B.: Avalanche forecasting – an expert system approach, J. Glaciol., 42, 318–332, https://doi.org/10.3189/S0022143000004172, 1996. a, b, c, d, e
Schweizer, J., Jamieson, J. B., and Schneebeli, M.: Snow avalanche formation, Rev. Geophys., 41, 1016, https://doi.org/10.1029/2002RG000123, 2003. a
Schweizer, J., Mitterer, C., Techel, F., Stoffel, A., and Reuter, B.: On the relation between avalanche occurrence and avalanche danger level, The Cryosphere, 14, 737–750, https://doi.org/10.5194/tc-14-737-2020, 2020. a, b
Sharma, V., Kumar, S., and Sushil, R.: A neural network model for automated prediction of avalanche danger level, Nat. Hazards Earth Syst. Sci., 23, 2523–2530, https://doi.org/10.5194/nhess-23-2523-2023, 2023. a, b, c, d, e, f, g, h, i, j
SLF: Long-term statistics, https://www.slf.ch/en/avalanches/avalanches-and-avalanche-accidents/long-term-statistics/ (last accessed: 7 February 2025), 2024. a
Sokolova, M. and Lapalme, G.: A systematic analysis of performance measures for classification tasks, Inform. Process. Manag., 45, 427–437, https://doi.org/10.1016/j.ipm.2009.03.002, 2009. a, b, c, d
Statham, G.: Avalanche hazard, danger and risk – A practical explanation, in: Proceedings, International Snow Science Workshop, Whistler, BC, 21–27 September 2008, 224–227, https://arc.lib.montana.edu/snow-science/objects/P__8153.pdf (last access: 9 May 2025), 2008. a
Statham, G., Haegeli, P., Birkeland, K. W., Greene, E., Israelson, C., Tremper, B., Stethem, C., McMahon, B., White, B., and Kelly, J.: The North American public avalanche danger scale, in: Proceedings of the 2010 International Snow Science Workshop, Squaw Valley, CA, 17–22 October 2010, 117–123, http://arc.lib.montana.edu/snow-science/item/353 (last access: 9 May 2025), 2010. a, b
Statham, G., Haegeli, P., Greene, E., Birkeland, K., Israelson, C., Tremper, B., Stethem, C., McMahon, B., White, B., and Kelly, J.: A conceptual model of avalanche hazard, Nat. Hazards, 90, 663–691, https://doi.org/10.1007/s11069-017-3070-5, 2018. a
Stephens, J., Adams, E., Huo, X., Dent, J., Hicks, J., and McCarty, D.: Use of neural networks in avalanche hazard forecasting, in: Proceedings of the 1994 International Snow Science Workshop, Snowbird, Utah, USA, 30 October–3 November 1994, 327–340, http://arc.lib.montana.edu/snow-science/item/1348 (last access: 9 May 2025), 1994. a
Stockdale, T. N., Molteni, F., and Ferranti, L.: Atmospheric initial conditions and the predictability of the Arctic Oscillation, Geophys. Res. Lett., 42, 1173–1179, https://doi.org/10.1002/2014GL062681, 2015. a
Techel, F. and Schweizer, J.: On using local avalanche danger level estimates for regional forecast verification, Cold Reg. Sci. Technol., 144, 52–62, https://doi.org/10.1016/j.coldregions.2017.07.012, 2017. a, b
Techel, F., Helfenstein, A., Mayer, S., Pérez-Guillén, C., Purves, R., Ruesch, M., Schmudlach, G., Soland, K., and Winkler, K.: Human vs. machine – Comparing model predictions and human forecasts of avalanche danger and snow stability in the Swiss Alps, in: International Snow Science Workshop Proceedings 2024, Tromsø, Norway, 31–38, http://arc.lib.montana.edu/snow-science/item/3108 (last access: 9 May 2025), 2024. a
Thompson, D. W. J. and Wallace, J. M.: The Arctic oscillation signature in the wintertime geopotential height and temperature fields, Geophys. Res. Lett., 25, 1297–1300, https://doi.org/10.1029/98GL00950, 1998. a, b
Thompson, D. W. J. and Wallace, J. M.: Regional Climate Impacts of the Northern Hemisphere Annular Mode, Science, 293, 1297–1300, https://doi.org/10.1126/science.1058958, 2001. a, b
Uvo, C. B.: Analysis and regionalization of northern European winter precipitation based on its relationship with the North Atlantic oscillation, Int. J. Climatol., 23, 1185–1194, https://doi.org/10.1002/joc.930, 2003. a, b
van Herwijnen, A., Mayer, S., Pérez-Guillén, C., Techel, F., Hendrick, M., and Schweizer, J.: Date-driven models used in operational avalanche forecasting in Switzerland, in: International Snow Science Workshop Proceedings 2023, Bend, Oregon, 8–13 October 2023, 321–326, http://arc.lib.montana.edu/snow-science/item/2895 (last access: 9 May 2025), 2023. a
van Herwijnen, A., Muccioli, M., Wever, N., Saiet, E., Mayer, S., and Pugno, N.: Is Arctic snow different from alpine snow? Delving into the complexities of snow cover properties and snow instability, in: International Snow Science Workshop Proceedings 2024, Tromsø, Norway, 23–29 September 2024, 401–408, http://arc.lib.montana.edu/snow-science/item/3165 (last access: 9 May 2025), 2024. a, b
Varsom: Avalanche Warnings, https://www.varsom.no/en/avalanches/avalanche-warnings/, last access: 7 February 2025a. a
Varsom: Ski touring in Norway, https://www.varsom.no/en/avalanches/ski-touring-in-norway-important-information, last access: 7 February 2025b. a
Viallon-Galinier, L., Hagenmuller, P., and Eckert, N.: Combining modelled snowpack stability with machine learning to predict avalanche activity, The Cryosphere, 17, 2245–2260, https://doi.org/10.5194/tc-17-2245-2023, 2023. a, b, c
Wanner, H., Brönnimann, S., Casty, C., Gyalistras, D., Luterbacher, J., Schmutz, C., Stephenson, D. B., and Xoplaki, E.: North Atlantic Oscillation – Concepts And Studies, Surv. Geophys., 22, 321–381, https://doi.org/10.1023/A:1014217317898, 2001. a, b, c, d
Wilks, D. S.: Statistical methods in the atmospheric sciences, 3rd edn., Academic Press, Oxford, UK, ISBN 13: 978-0-12-751966-1, ISBN 10: 0-12-751966-1, 2011. a
- Abstract
- Introduction
- Data
- Methods
- Random forest optimisation and feature selection
- Model evaluation
- Hindcasting avalanche danger (1970–2024)
- Summary and conclusions
- Appendix A: Model evaluation metrics
- Appendix B: Random forest hyperparameter set
- Code and data availability
- Author contributions
- Competing interests
- Disclaimer
- Acknowledgements
- Financial support
- Review statement
- References
- Supplement