the Creative Commons Attribution 4.0 License.
the Creative Commons Attribution 4.0 License.
 | 31 Jul 2020
Historical Northern Hemisphere snow cover trends and projected changes in the CMIP6 multi-model ensemble
Lawrence Mudryk
María Santolaria-Otín
Gerhard Krinner
Martin Ménégoz
Chris Derksen
Claire Brutel-Vuilmet
Mike Brady
Richard Essery
This paper presents an analysis of observed and simulated historical snow cover extent and snow mass, along with future snow cover projections from models participating in the World Climate Research Programme Coupled Model Intercomparison Project Phase 6 (CMIP6). Where appropriate, the CMIP6 output is compared to CMIP5 results in order to assess progress (or absence thereof) between successive model generations. An ensemble of six observation-based products is used to produce a new time series of historical Northern Hemisphere snow extent anomalies and trends; a subset of four of these products is used for snow mass. Trends in snow extent over 1981–2018 are negative in all months and exceed km2 yr−1 during November, December, March, and May. Snow mass trends are approximately −5 Gt yr−1 or more for all months from December to May. Overall, the CMIP6 multi-model ensemble better represents the snow extent climatology over the 1981–2014 period for all months, correcting a low bias in CMIP5. Simulated snow extent and snow mass trends over the 1981–2014 period are stronger in CMIP6 than in CMIP5, although large inter-model spread remains in the simulated trends for both variables. There is a single linear relationship between projected spring snow extent and global surface air temperature (GSAT) changes, which is valid across all CMIP6 Shared Socioeconomic Pathways. This finding suggests that Northern Hemisphere spring snow extent will decrease by about 8 % relative to the 1995–2014 level per degree Celsius of GSAT increase. The sensitivity of snow to temperature forcing largely explains the absence of any climate change pathway dependency, similar to other fast-response components of the cryosphere such as sea ice and near-surface permafrost extent.
- Article
(6821 KB) - Full-text XML
- BibTeX
- EndNote


It is imperative that Earth system models properly treat seasonal snow cover in order to account for a number of important energy and water cycle processes.
-
Like summer sea ice in the Arctic, spring snow cover over land has a cooling effect on the climate system (Flanner et al., 2011). The magnitude of this cooling influence has declined alongside observed reductions in spring snow cover over recent decades (Zhang et al., 2019; Letterly et al., 2018).
-
Snow cover influences the carbon balance across biomes and seasons. Across tundra regions in winter, snow cover insulation of the underlying soil is a key factor in driving winter season carbon fluxes from northern permafrost (Natali et al., 2019). Across the boreal forest in spring, gross primary production and carbon uptake during the subsequent months are directly related to the timing of spring melt such that earlier snow loss drives greater carbon uptake (Pulliainen et al., 2017). The net effect of these processes on large-scale carbon budgets remains uncertain.
-
Freshwater from snowmelt is a volatile natural resource, subject to interannual variability and trends in temperature and precipitation. Observed and projected changes to seasonal snow cover, particularly in mountain regions, have profound impacts on the quantity, quality, and timing of water availability (Verfaillie et al., 2018; Fyfe et al., 2017; Marty et al., 2017).
Observational evidence shows that snow cover is changing across midlatitude (Mudryk et al., 2017), alpine (Hock et al., 2020), and subarctic and Arctic regions (Brown et al., 2017; Meredith et al., 2020). These changes are challenging to synthesize because of a high degree of region-to-region and season-to-season variability in trends and because of the range of metrics by which snow can be characterized including snow extent, snow cover duration, and snow mass. While snow extent anomalies and trends are strongly related to surface temperature (Mudryk et al., 2017; Brutel-Vuilmet et al., 2013; Robinson and Dewey, 1990), snow mass changes are more challenging to diagnose because of the competing influences of temperature and precipitation and the influence of additional processes such as sublimation through the snow accumulation season (Sospedra-Alfonso and Merryfield, 2017).
Over the past three generations of climate models (assessed through subsequent phases of the Coupled Model Intercomparison Project – CMIP3, CMIP5, and CMIP6), land surface models have increased in complexity, while moving to a finer spatial resolution. The treatment of snow within these models has grown more sophisticated, particularly with respect to sub-grid heterogeneity and snow layering and parameterizations involving albedo, thermal conductivity, snow density, surface exchange, and snow–vegetation interactions (Essery et al., 2012; Qu and Hall, 2007). Some improvements in the simulation of snow extent and snow mass were noted between the Atmospheric Model Intercomparison Project Phase 1 (AMIP-1) and Phase 2 (AMIP-2) models (Frei et al., 2005, 1998). An assessment of the literature, however, shows relatively small differences in Coupled Model Intercomparison Project Phase 3 (CMIP3) vs. Phase 5 (CMIP5) model performance at the continental scale, indicating that our understanding of how key snow processes influence model performance has improved only modestly (Cécile Ménard, personal communication, 2019, based on forthcoming analysis of point-scale simulations).
In general, CMIP3 and CMIP5 historical simulations have reasonable snow extent and snow mass climatologies, albeit with greater uncertainty in alpine areas (particularly western Canada, Norway, and the Tibetan Plateau–Himalayas; Brown et al., 2017; Brown and Mote, 2009). Both generations of models tend to underestimate observed spring snow extent reductions compared to observations (Derksen and Brown, 2012; Flanner et al., 2009; Frei et al., 2003). Explanations include reduced snow sensitivity (snow loss per degree of warming; Mudryk et al., 2017), underestimated spring warming over extra-tropical land (Brutel-Vuilmet et al., 2013), and biases in climatological snow cover (low bias in simulated snow means there is less snow to lose; Thackeray et al., 2016). Projected spring snow extent loss in CMIP5 models was primarily explained by extratropical temperature trends, so scenario dependence for the magnitude of snow loss emerges after 2050 (Thackeray et al., 2016; Meredith et al., 2020). The patterns of snow cover duration and seasonal maximum snow mass projections are similar between CMIP3 and CMIP5 models (Brown and Mote, 2009; Brown et al., 2017). Snow mass is projected to increase in the coldest parts of the Northern Hemisphere continents and decrease across most midlatitude (Brown et al., 2017; Raisanen, 2008) and alpine areas (Fyfe et al., 2017; Verfaillie et al., 2018), while snow cover duration is expected to decrease everywhere (Brown et al., 2017; Brown and Mote, 2009). An increased frequency of low-snow years emerges at 2 ∘C global warming (Diffenbaugh et al., 2013).
In part, the lack of dramatic forward progress between CMIP3 and CMIP5 is directly tied to continued problematic approaches to snow modeling. For instance, unrealistic vegetation parameters and distribution are related to errors in snow albedo simulations (Wang et al., 2016; Thackeray et al., 2015; Loranty et al., 2014), and some CMIP5 models continue to use physically unrealistic snow albedo values (Thackeray et al., 2019). Also, despite increases in model resolution since CMIP3, even the highest-resolution models in CMIP6 are still expected to have challenges simulating snow in mountain regions without appropriate downscaling (Verfaillie et al., 2018). In addition to these continuing issues, the choice of evaluation data may also play a role, in that nearly all CMIP3 and many CMIP5 studies used a single snow product for evaluation; hence interpretation is prone to biases in the chosen dataset. In this study, we quantify historical trends in Northern Hemisphere snow extent and snow mass from an updated ensemble of gridded datasets. We compare these trends to historical simulations from the multi-model ensemble available from CMIP6 (Eyring et al., 2016) and CMIP5 (Taylor et al., 2012) to identify changes in model performance relative to historical observations. Projections of snow extent and snow mass from a range of Shared Socioeconomic Pathways (SSPs) from the CMIP6 ScenarioMIP (O'Neill et al., 2016) illustrate the potential range in future snow conditions.
2.1 Multi-dataset historical snow extent and snow mass time series
There are numerous gridded products that utilize various combinations of surface observations, remote sensing, land surface models, and reanalysis products to provide long time series for quantifying continental trends in snow extent and snow mass and assess climate model simulations. However, all these datasets have uncertainties related to sparse observation networks, satellite retrieval algorithm uncertainties, simplified model parameterizations, and/or forcing uncertainty. Overall, this means there is no single “best” dataset from which variability and trends in seasonal snow can be diagnosed. Instead, the challenge is to combine independent datasets in a meaningful way to mitigate uncertainty attributed to individual techniques (Krinner et al., 2018; Mudryk et al., 2015), much like multi-model ensembles and large initial condition ensembles (e.g., Kay et al., 2015) are used across the climate modeling community. The ideal dataset for comparison with coupled model ensembles would be a single, bias-free, observational record with uncertainty due only to interannual variability. Analysis of such a record would yield an accurate trend with a simply interpretable uncertainty due to record length and sampling uncertainty and would provide the most straightforward way to compare the observed trend with those from coupled model ensembles (which contain further spread due to model structure and parametrization as well and internal variability). In reality, observational records are not ideal and different datasets may contain additional uncertainty in their variability due to technical issues. Our goal here is to combine anomalies from an ensemble of observation-based estimates in order to mitigate the most prominent trend biases of the individual datasets and estimate the irreducible interannual variability.
The use of multiple observation-based snow datasets (Mudryk et al., 2018, 2017; Thackeray et al., 2016) evaluated through coordinated experiments like the Satellite Snow Product Intercomparison and Evaluation Exercise (SnowPEx; Mortimer et al., 2020) represents a shift from the use of single snow datasets typical of many CMIP3 and early CMIP5 model evaluation studies (Brutel-Vuilmet et al., 2013; Derksen and Brown, 2012; Brown and Mote, 2009). As discussed in Sect. 4.1, this shift results in a different interpretation of the ability of the models to reproduce historical trends. In this study, we construct a representation of historical snow extent and snow mass using six datasets that all cover the complete 1981–2018 time period. For snow extent we can extend the record back to 1967 based on one of these six component datasets, and for certain months we can further extend the record back to 1922. A summary of the datasets is provided in Table 1.
Table 1Snow products combined to produce multi-dataset snow cover extent and snow mass datasets.
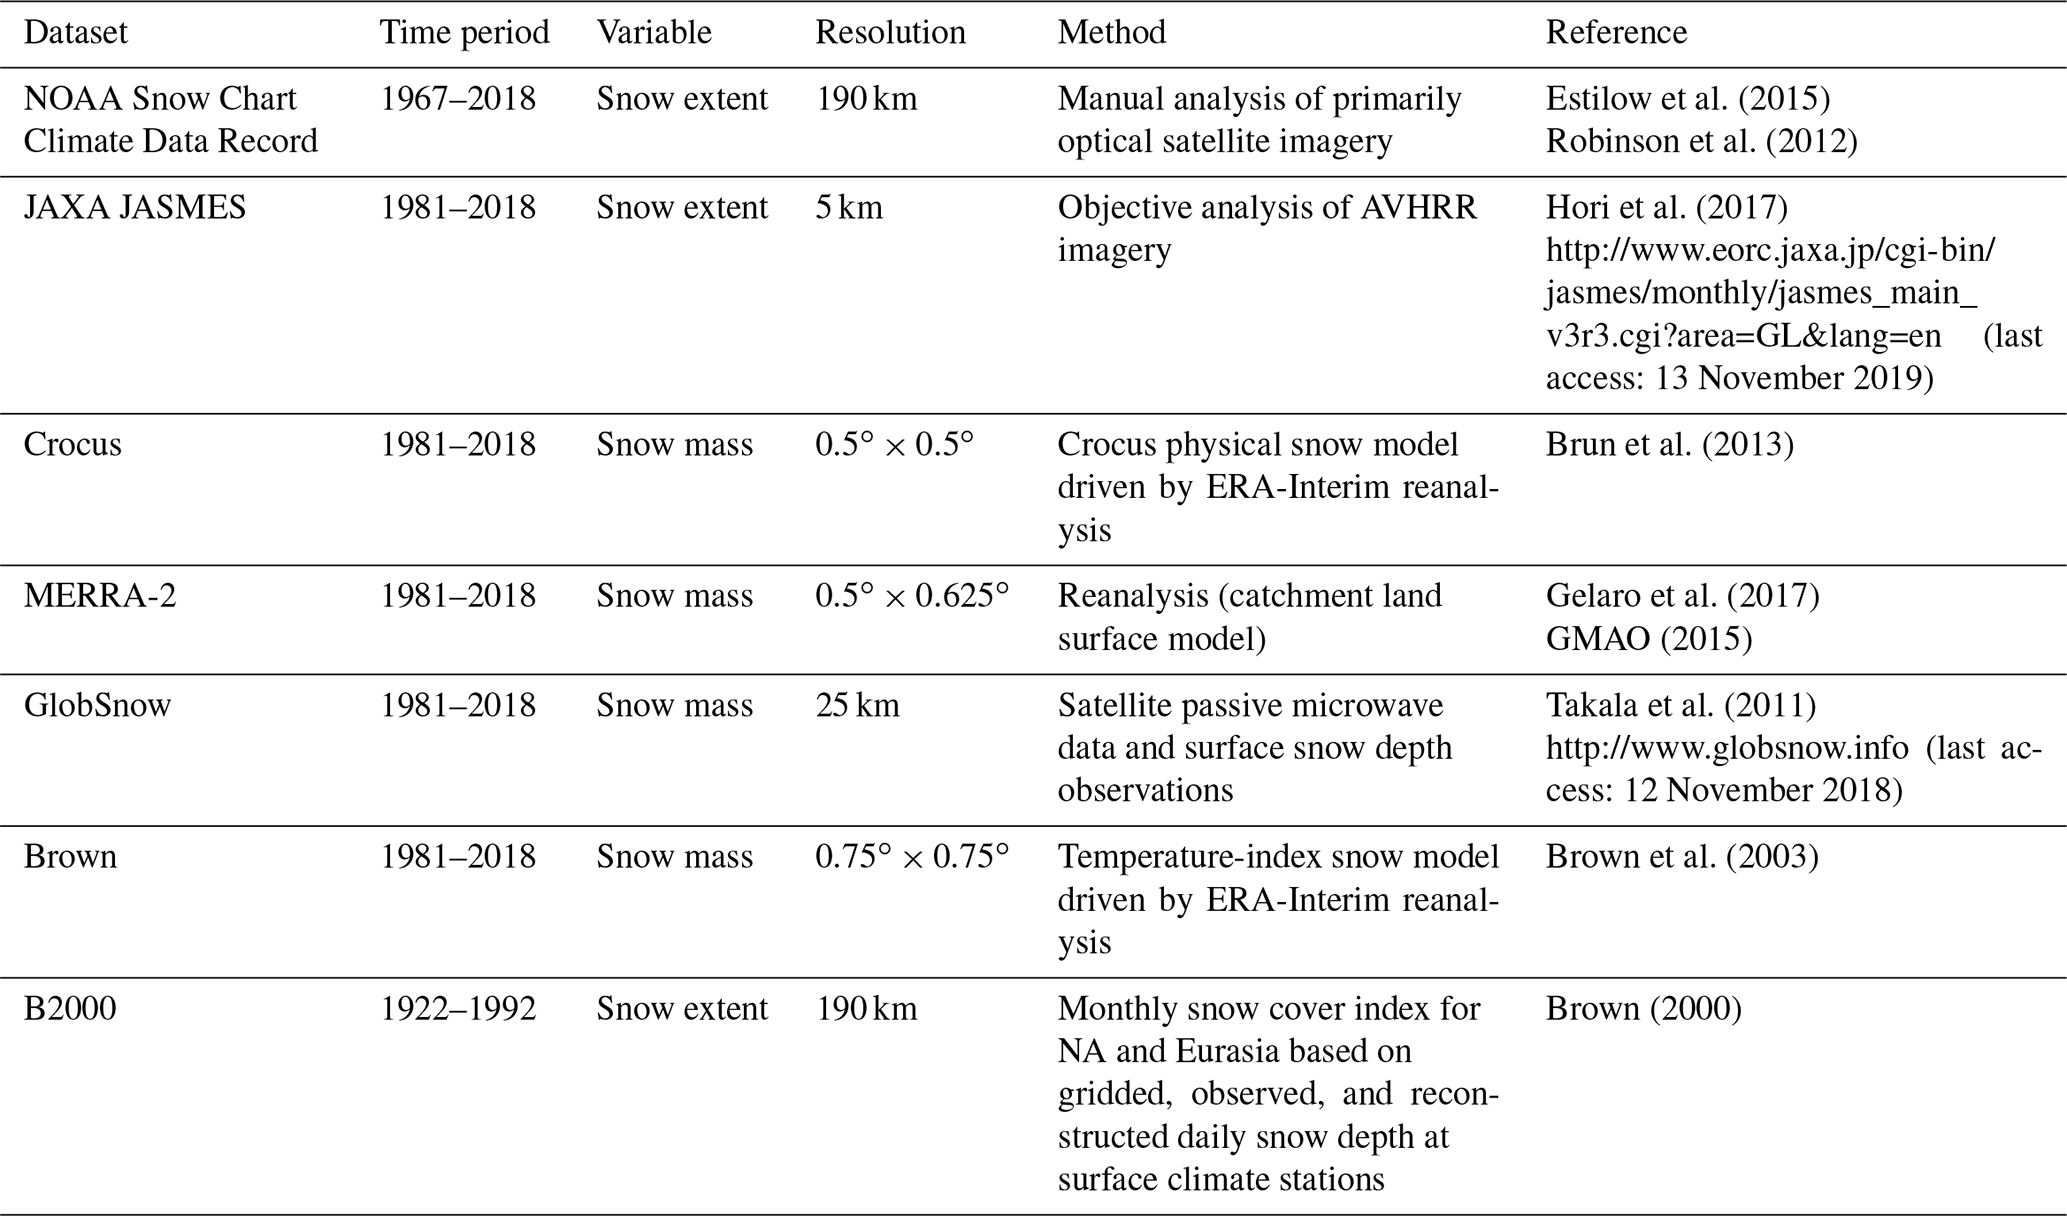
The NOAA and JASMES datasets provide a direct estimate of snow extent and were obtained from the references noted in Table 1 as total Northern Hemisphere (NH) snow extent time series. The four gridded snow mass datasets were regridded to 0.5∘ resolution, and time series were calculated for each product by integrating the volume of snow water over the NH land area and multiplying by the density of water. Because the GlobSnow product is masked over complex topography at the native GlobSnow grid spacing of 25 km, snow mass was replaced in the 0.5∘ grid cells which contain mountains with a blend of the GlobSnow data (if any) and the mean value from the other three data sources. The weighting for the blend was determined by the mountain fraction of the grid cell area (defined using a 5 arcmin resolution topographic map as regions with a slope greater than 2∘). For grid cells with no mountainous terrain, unaltered regridded GlobSnow data were used. As the fraction of mountainous terrain increases, the weight applied to the GlobSnow data is linearly reduced, reaching zero for grid cells containing only mountainous terrain. In midwinter, approximately 25 % of snow-covered grid cells are blended with less than 50 % GlobSnow.
Snow extent time series were also calculated from these four snow mass datasets by applying a threshold of 4 mm to daily snow water equivalent fields, averaging to yield monthly fractional snow cover and summing the average monthly land area under snow. In order to merge all six snow extent datasets, the climatology and standard deviation of each dataset were adjusted as follows based in part on the methodology used in Brown et al. (2010) and Brown and Robinson (2011). Each dataset's climatology was replaced by the climatology of the NOAA data record, and each dataset's variability was adjusted to that of the ensemble mean standard deviation. This was accomplished by first calculating standardized anomalies using each dataset's own climatology and standard deviation (1981–2014) and then de-standardizing using the ensemble mean standard deviation and the climatology of the NOAA data record. The NOAA climatology was used because lacking additional verification data we assume it is the best estimate of the true historical snow extent. By contrast, we expect the variability of the six-component dataset to be more accurate than any single dataset and in particular more accurate than that of the NOAA dataset alone, which may be artificially high during the spring based on several lines of evidence (e.g., Mudryk et al., 2017).
These adjusted time series were averaged over the 1981–2018 period and this average time series was merged with the adjusted NOAA time series over the 1967–1980 period. This methodology ensures that the transition between the pre- and post-1981 periods does not contain any discontinuities due to changes in climatology (e.g., whether the full time series were simply averaged together) or variability (e.g., whether unadjusted anomalies were averaged together).
Over the 1981–2018 period, 95 % uncertainty bounds were determined from the standard error:
which depends on the standard deviation, s, of the n datasets included.
Over the 1967–1980 period, 95 % uncertainty bounds were determined from the standard error of forecast:
where SEres(x) is the standard error of the residuals from a best-fit line, x is the standardized anomaly of the sequence of years of the analysis period, and n is the number of years of the analysis period.
For certain months, the Northern Hemisphere snow extent time series can be extended back to 1922 through the interpolation of a fixed network of surface snow depth observations, described in Brown (2000) and labeled as B2000 in Table 1. These observations have sufficient spatial coverage to estimate relative changes in snow extent from year to year in the form of an index, but they are not estimates of the actual snow extent. Limitations in the mutual availability and coverage of surface observations over North America and Eurasia mean that hemispheric estimates are only available for March and April. These March and April indices are converted into units of snow extent separately over each continent using the same process described above. Each index is standardized based on the 1972–1991 period. The index climatology is matched to NOAA's climatology calculated over the same period for the appropriate month and continent. We chose the 1972–1991 reference period because we expect that the NOAA climatology over 1972–1991 is more representative of earlier 20th century snow cover (whereas snow cover will have already responded to warming temperatures by the latter portion of the record). We rescale the variability of each index using the six-member ensemble mean standard deviation for the appropriate month and continent. This process has an implicit assumption that the variability sampled in the B2000 index over 1972–1991 is comparable to that from the ensemble mean snow extent time series over the 1981–2014 period. The rescaled indices for each continent are then summed together to obtain a historical estimate of Northern Hemisphere snow cover extent from 1922 to 1991. Uncertainty is calculated using the standard error of forecast; however we consider additional uncertainty due to the choice of reference periods used for matching the climatology and standard deviation. The 95 % uncertainty bounds are calculated for all possible selections of sequential 20-year climatological periods from the NOAA record in combination with all possible sequential 20-year estimates of variability from the six-member ensemble. The maximum and minimum uncertainty bounds calculated from these combinations are used to define the range for each year.
Monthly snow extent trends were computed from the average of the six adjusted time series described above; monthly snow mass trends were computed from the average of the four unadjusted snow mass time series.
2.2 Model simulations and analyses
The standard period used in this paper for evaluating the CMIP5 (Taylor et al., 2012) and CMIP6 (Eyring et al., 2016) model outputs is 1981 to 2014. The historical period for which simulations were driven by observed climate forcing data ends in 2014 for CMIP6 and 2005 for CMIP5. Observed CO2 emissions between 2006 and 2014 reasonably follow those of the RCP8.5 emission scenario (Hayhoe et al., 2017); therefore we use the first 9 years (2006–2014) of the RCP8.5 simulations to complement the historical simulations for CMIP5. For CMIP6 projections, we restrict our analysis to the four Tier 1 SSPs (O'Neill et al., 2016): SSP1-2.6, SSP2-4.5, SSP3-7.0, and SSP5-8.5.
To evaluate climatological means, we analyze the “first” ensemble member for each model (r1i1p1 in CMIP5 and r1i1p1f1 in CMIP6, respectively). A handful of models had no r1i1p1f1 variant. In these cases the r1i1p1f2 variant was chosen (e.g., the CNRM models, MIROC-ESM, UKESM) and barring that the r1i1p1f3 variant (HadGEM). For trend analyses, the least-squares median trend of each model's ensemble is used. NorESM realization r1i1p1f1 had 10 years of missing data and was ignored for trends; realization r2i1p1f1 was used for its climatology. A special treatment is applied to CMIP5, because the 1981–2014 reference period covers both the historical and the RCP8.5 scenario simulations. In order to identify the median CMIP5 simulation over this reference period, we concatenated the first ensemble members of the historical and the RCP8.5 scenario simulations for analyses of climatological means. For analyses of trends, we constructed a bootstrap pseudo-ensemble for each model by combining all historical and scenario ensemble members, yielding nH × nS bootstrap ensemble members for a model that had nH members in its historical ensemble and nS members in its scenario ensemble. We then identified the median snow cover and snow mass trend from this bootstrap ensemble.
In this paper, snow cover fraction (variable “snc”), snow mass (“snw”), and surface air temperature (“tas”) are used. Snow extent is not obtained from snow water equivalent by applying a threshold of 5 mm, as suggested in Brutel-Vuilmet et al. (2013). Instead, snow extent is computed directly from the snow cover fraction calculated in the models. Implications of this choice are evaluated in the discussion section.
Because we focus on seasonal snow cover, model output is masked to only take into account ice-free continental grid points. Unfortunately, not all model groups had made these time-independent model masks (land fraction, “sftlf”; ice-sheet fraction, “sftgif”) available at the time of writing. We therefore used the masks from the CNRM-CM6-1 coupled model (Voldoire et al., 2019) for all other models by interpolating these masks to the corresponding grid of each model. Some models accumulate permanent snow in specific areas such as the northern parts of the Canadian Archipelago or Tibet. This means that very high snow mass can occur in the specific areas where snow does not melt entirely in summer, effectively transforming the corresponding model grid points into ice caps. This would alter our hemispheric snow mass diagnostics that are supposed to be limited to seasonal snow. We therefore limit model snow mass to a maximum of 500 kg m−2. Although this value can be exceeded for seasonal snow cover in localized regions, it should represent a reasonable maximum for snow mass at the resolution of the model simulations.
Table 2Number of CMIP5 and CMIP6 model realizations with available snow cover fraction (“snc”), snow water equivalent (“snw”), and surface air temperature (“tas”) for both historical and RCP8.5 and SSP5–8.5 experiments.
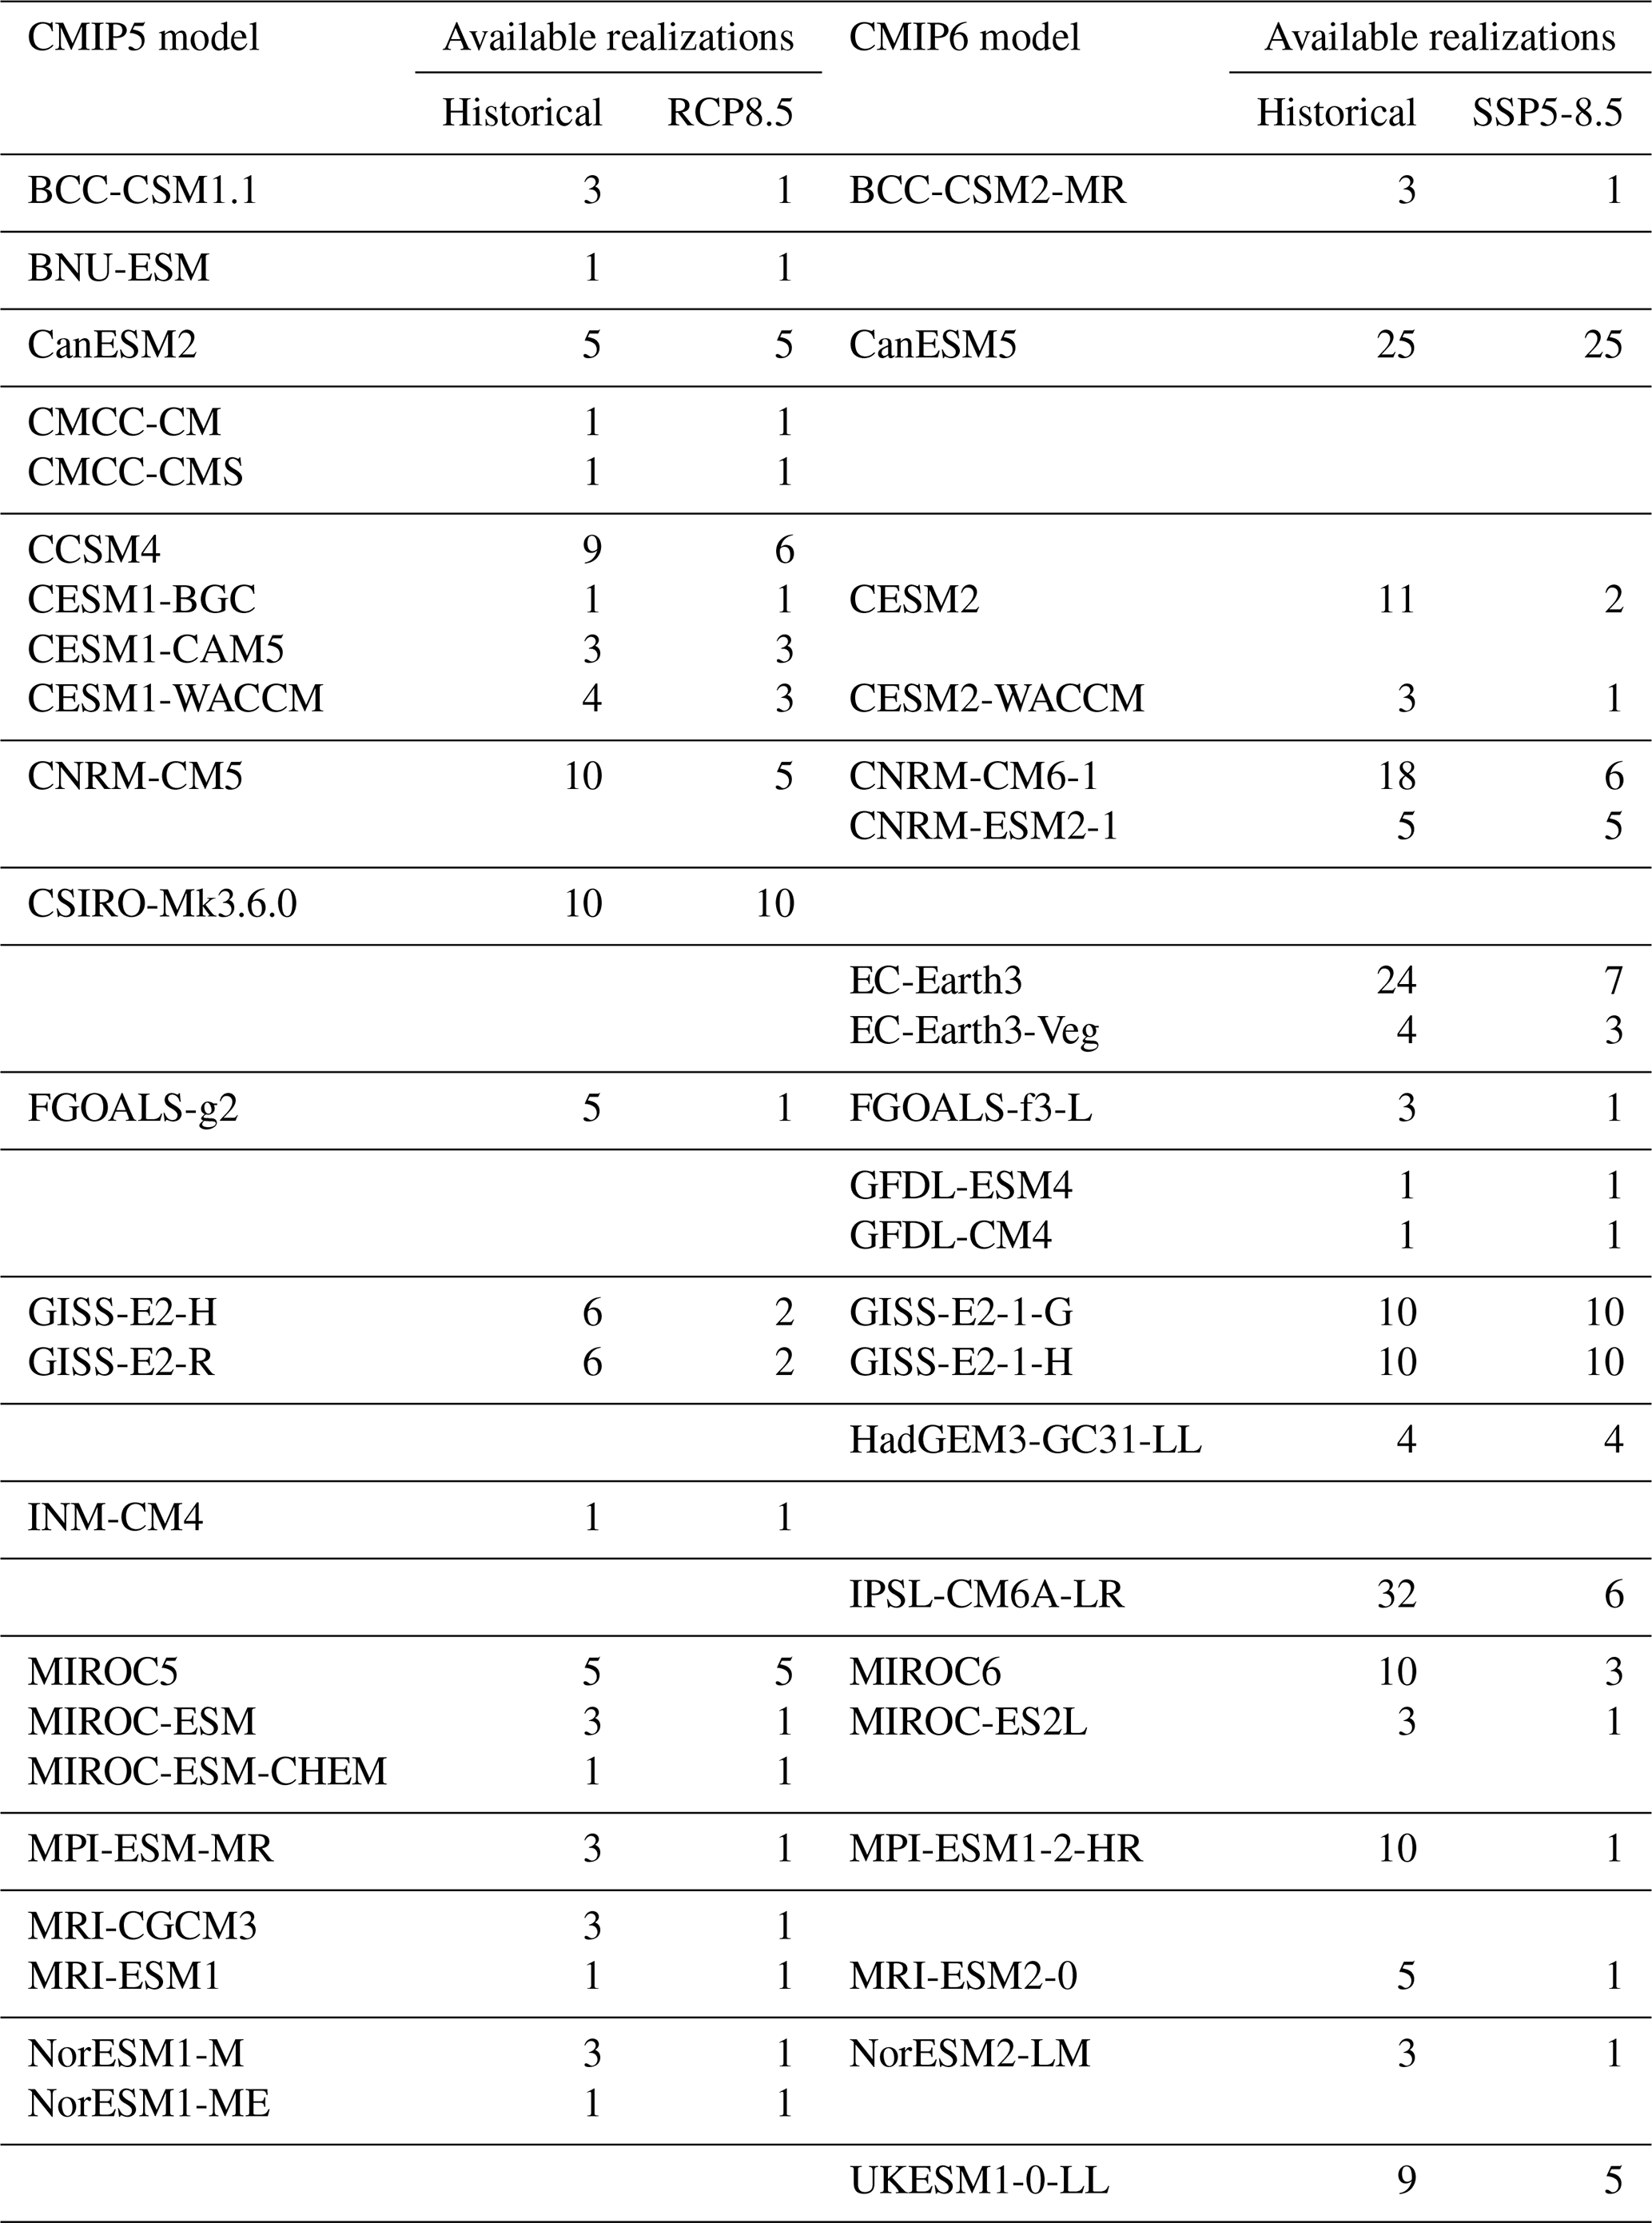
We used the CMIP5–CMIP6 database as available on the Institut Pierre et Simon Laplace Calcul Intensif pour le Climat, l'Atmosphère et la Dynamique (IPSL CICLAD; http://ciclad-web.ipsl.jussieu.fr/, last access: 31 December 2019) computer center in December 2019. Snow cover fraction, snow water equivalent, and surface temperature over the 1981–2014 period were available for 23 CMIP5 models at the time of writing (see Table 2). This is a somewhat more extensive ensemble of opportunity than analyzed by Mudryk et al. (2017) and Thackeray et al. (2016). For CMIP6 (see again Table 2), 21 models have these variables available over the 1981–2014 period. Contrary to Krinner and Flanner (2018), we did not restrict the multi-model ensemble to only one model per modeling group. Because of strong similarity between multiple models emanating from a single modeling group or sharing a common development history (Masson and Knutti, 2011), this decision could result in effectively overweighting certain groups of models that in reality are only slightly different versions of one another. However, by using medians of the multi-model ensemble for both climatological means and trends, we reduce possible misleading effects of this choice. For analysis of model projections we do not examine simulated trends. Hence the multi-model ensembles are based on the first realization available for each model.
3.1 Observation-based trends of snow extent and snow mass
While the NOAA climate record represents an established “baseline” dataset for assessing climatological snow extent at the hemispheric scale, no such equivalent dataset exists for climatological snow mass. Furthermore, the potential for biases in trends calculated from reanalysis due to abrupt changes in input (e.g., Mortimer et al., 2020) and the presence of established trend biases in the NOAA record (see Sect. 4.1 for a discussion) have prompted the use of the multi-dataset approach described in Sect. 2.1. We argue that this approach should reduce the potential for biased model evaluation related to uncertainty in an individual product. Previous applications of similar approaches have resulted in improved model verification of seasonal forecasts (Sospedra-Alfonso et al., 2016) and have produced more robust diagnosis of historical climate model simulations (e.g., Thackeray et al., 2016) compared to the use of a single dataset (Derksen and Brown, 2012).
Before evaluating the model simulations, we illustrate the monthly snow extent and snow mass trends and anomalies (1981–2018) from the multi-dataset ensemble in Fig. 1. Snow extent trends are negative in all months and exceed km2 during November, December, March, and May. Snow mass trends are consistently negative: trends are approximately −5 Gt yr−1 or more for all months between November and June. Both snow extent and snow mass trends are near zero during the summer because there is very little land area with snow cover.
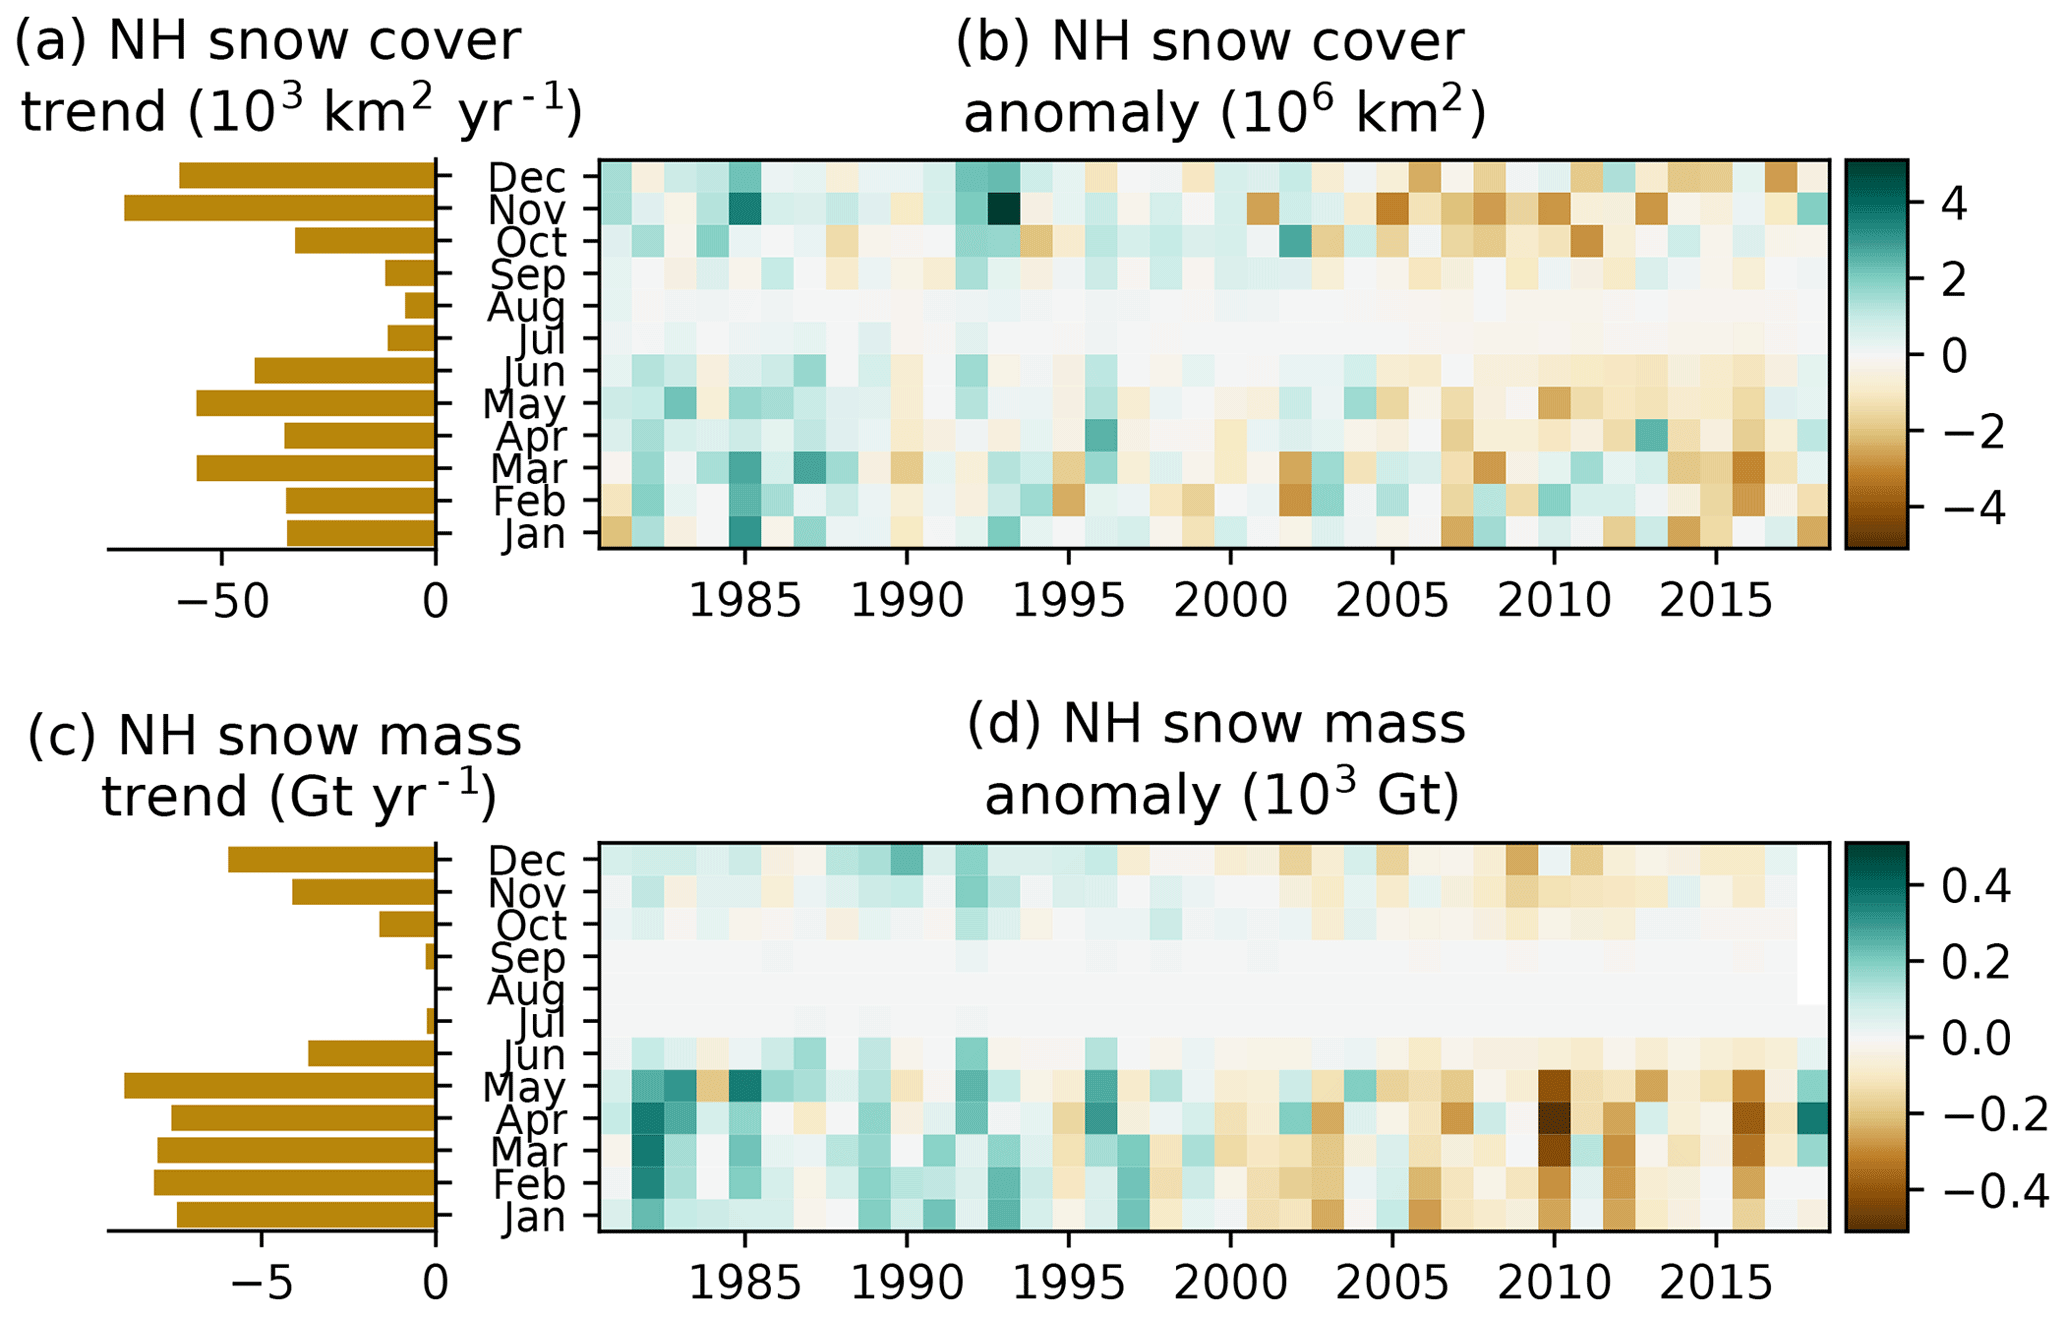
Figure 1Observation-based NH snow extent (a, b) and snow mass (c, d) trends (a, c) and anomalies (b, d) for January 1981 through December 2018 relative to 1981–2014.
Figure 2 shows a nearly 100-year time series of Northern Hemisphere snow extent, produced by combining gridded station observations (1922–1992; Brown, 2000) available for March and April with the multi-dataset record shown in Fig. 1 (described in Sect. 2.1). The overlap period shows good agreement between the two independent time series, albeit with greatly reduced uncertainty during the recent era. There is a high degree of interannual variability through the full data record. NH snow extent peaked over the 1950 to 1970 period (particularly evident in March), with reductions since 1980 consistent with the combined datasets shown in Fig. 1.
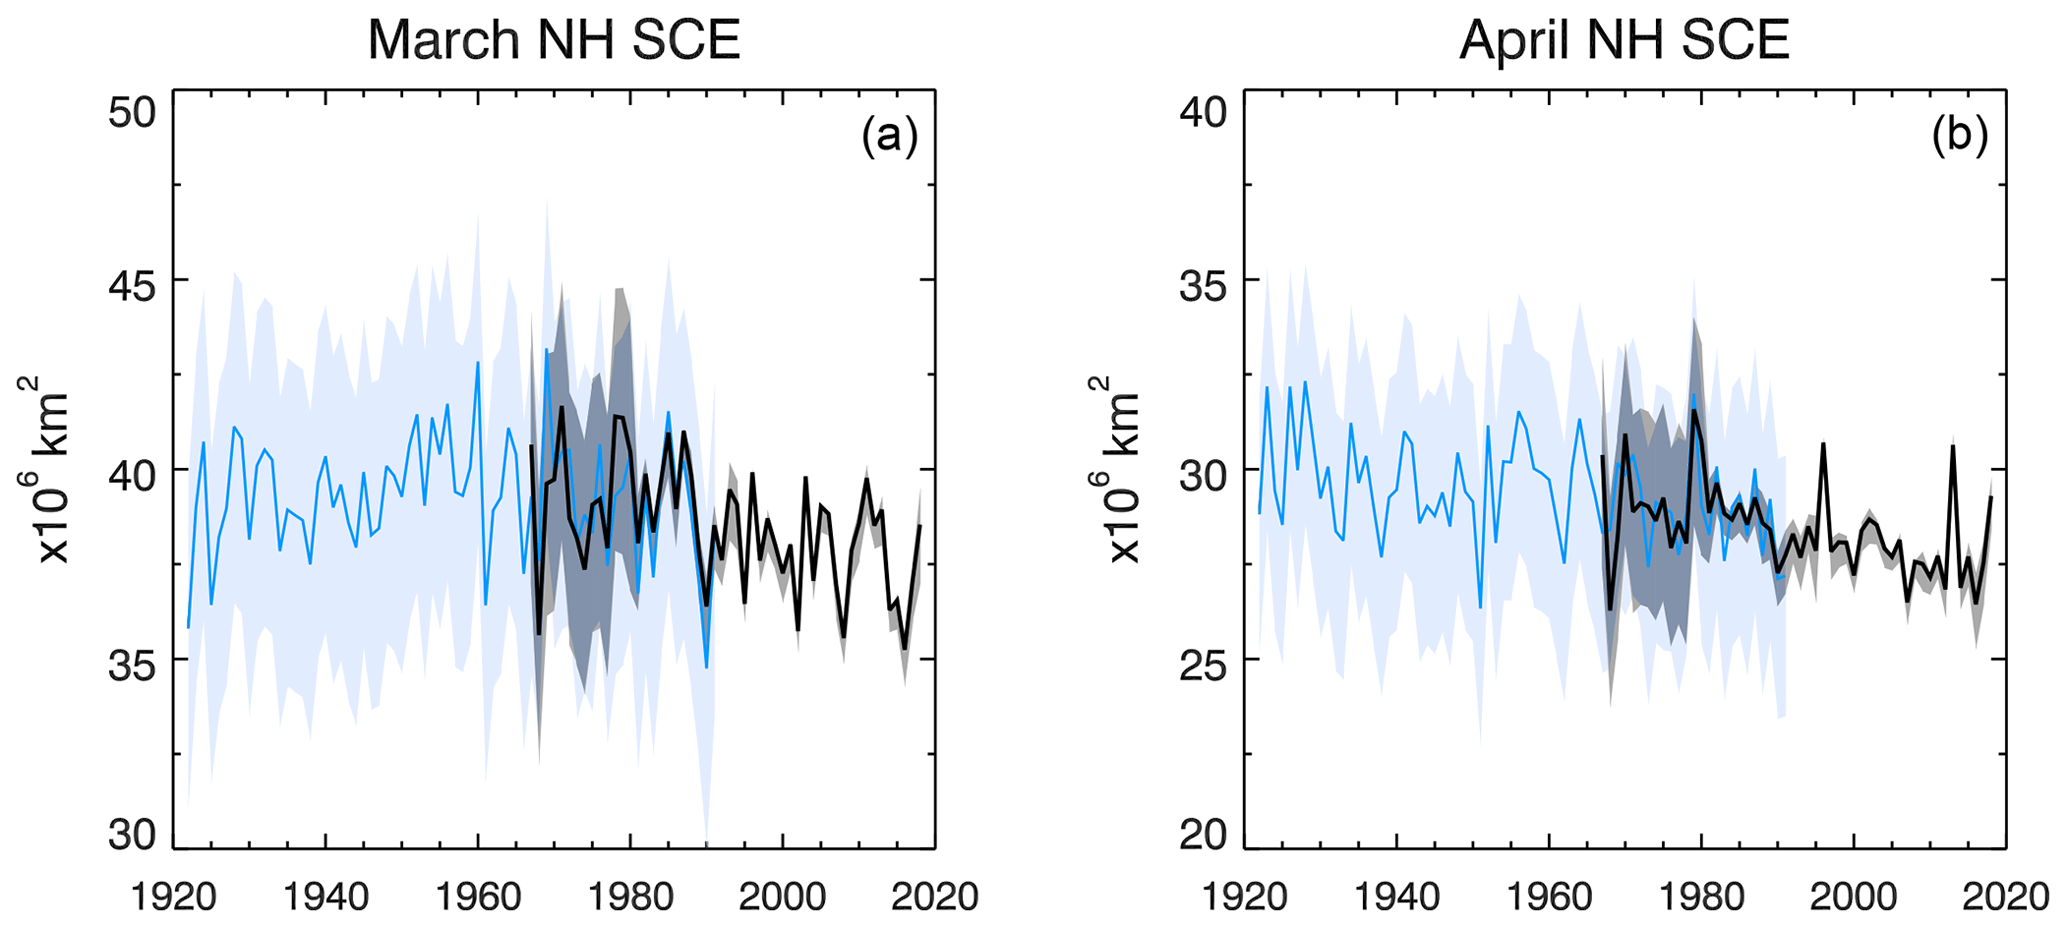
Figure 2Northern Hemisphere snow extent spanning 1922–2018 for March (a) and April (b). Snow extent estimates (solid) and uncertainty (shading) are based on station observations (blue) over the 1922–1991 period and the multi-dataset record (black) over the 1967–2018 period.
3.2 Historical simulations
Examining the historical model output, Fig. 3 indicates that overall the CMIP6 multi-model ensemble better represents the snow extent climatology over the 1981–2014 period for all months (Fig. 3b), correcting a low bias in CMIP5 relative to the multi-dataset observational ensemble (Fig. 3a). One model family (EC-Earth3 and EC-Earth3-Veg; Wyser et al., 2019) is a clear outlier due to the simulation of very high snow cover extent (dots above the box and whiskers in Fig. 3b). These climatologies are statistical outliers from January to October; while not statistical outliers during November and December, they are still at the origin of the large spread towards high values. This high snow extent is linked to very high snow cover fractions even for low snow mass values (see Sect. 4.2). If this obvious outlier is not considered, the inter-model spread is lower for CMIP6 compared to CMIP5.
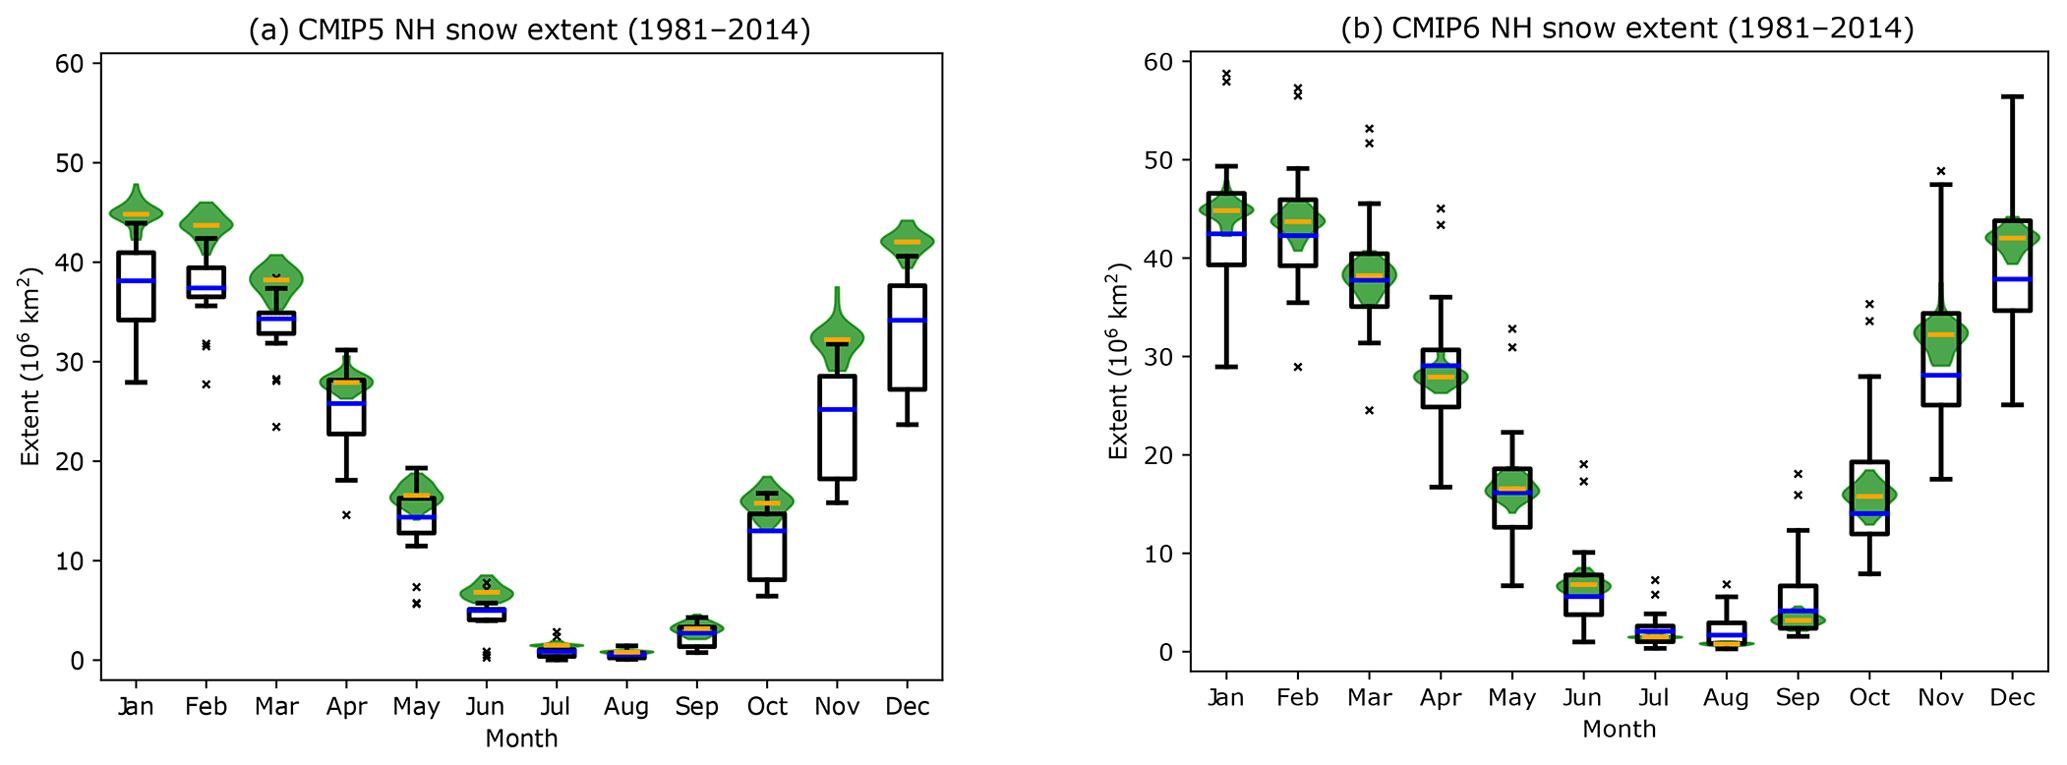
Figure 3Simulated CMIP5 (a) and CMIP6 (b) monthly mean 1981–2014 NH snow extent. The green violins (yellow bar: median year) represent the observed interannual distribution. The boxes and whiskers represent the individual models' (first ensemble member) 1981–2014 average from the CMIP5–CMIP6 multi-model ensembles (red bar: median model).
The higher climatological snow extent in CMIP6 models relative to CMIP5 might in part be due to a climatological snow mass increase relative to CMIP5 (Fig. 4). Hemispheric-scale snow extent and snow mass are not always correlated in observational datasets (e.g., Ge and Gong, 2008). Higher simulated snow mass, however, tends to lead to higher simulated snow extent due to the connected parameterizations of these variables (e.g., snow cover fraction increases with snow mass until a critical threshold when complete snow cover occurs on the grid cell scale). The reduced spread in the lower part of the simulated snow mass range (third and fourth quartiles) in CMIP6 leads to a more significant high bias in the more recent CMIP exercise (in the sense of a reduced overlap of the inter-model distribution with the interannual range of observed NH snow mass). Correspondingly, the upper part of the CMIP6 ensemble range (first and second quartiles) features models with higher biases than seen in CMIP5. An important consideration, however, is that the observational snow mass ensemble is likely biased low due to underestimation of snow mass in high-elevation areas (Wrzesien et al., 2018; see Sect. 4.1 for a more complete discussion of this issue).

Differences in the geographic patterns of CMIP5 and CMIP6 spring and autumn snow cover (Fig. 5) reflect the overall higher CMIP6 snow extent evident in Fig. 3. The proportion of models simulating more than 50 % snow cover in spring and autumn increases along the southern border of the snow-covered regions in both northern Eurasia and North America. The increase is particularly strong and widespread in autumn (Fig. 5d–f), resulting in the reduced CMIP6 bias from October onwards. CMIP6 also has an increased fraction of models simulating overly extensive snow cover in Eurasia and North America during both seasons consistent with the outlier models already mentioned.
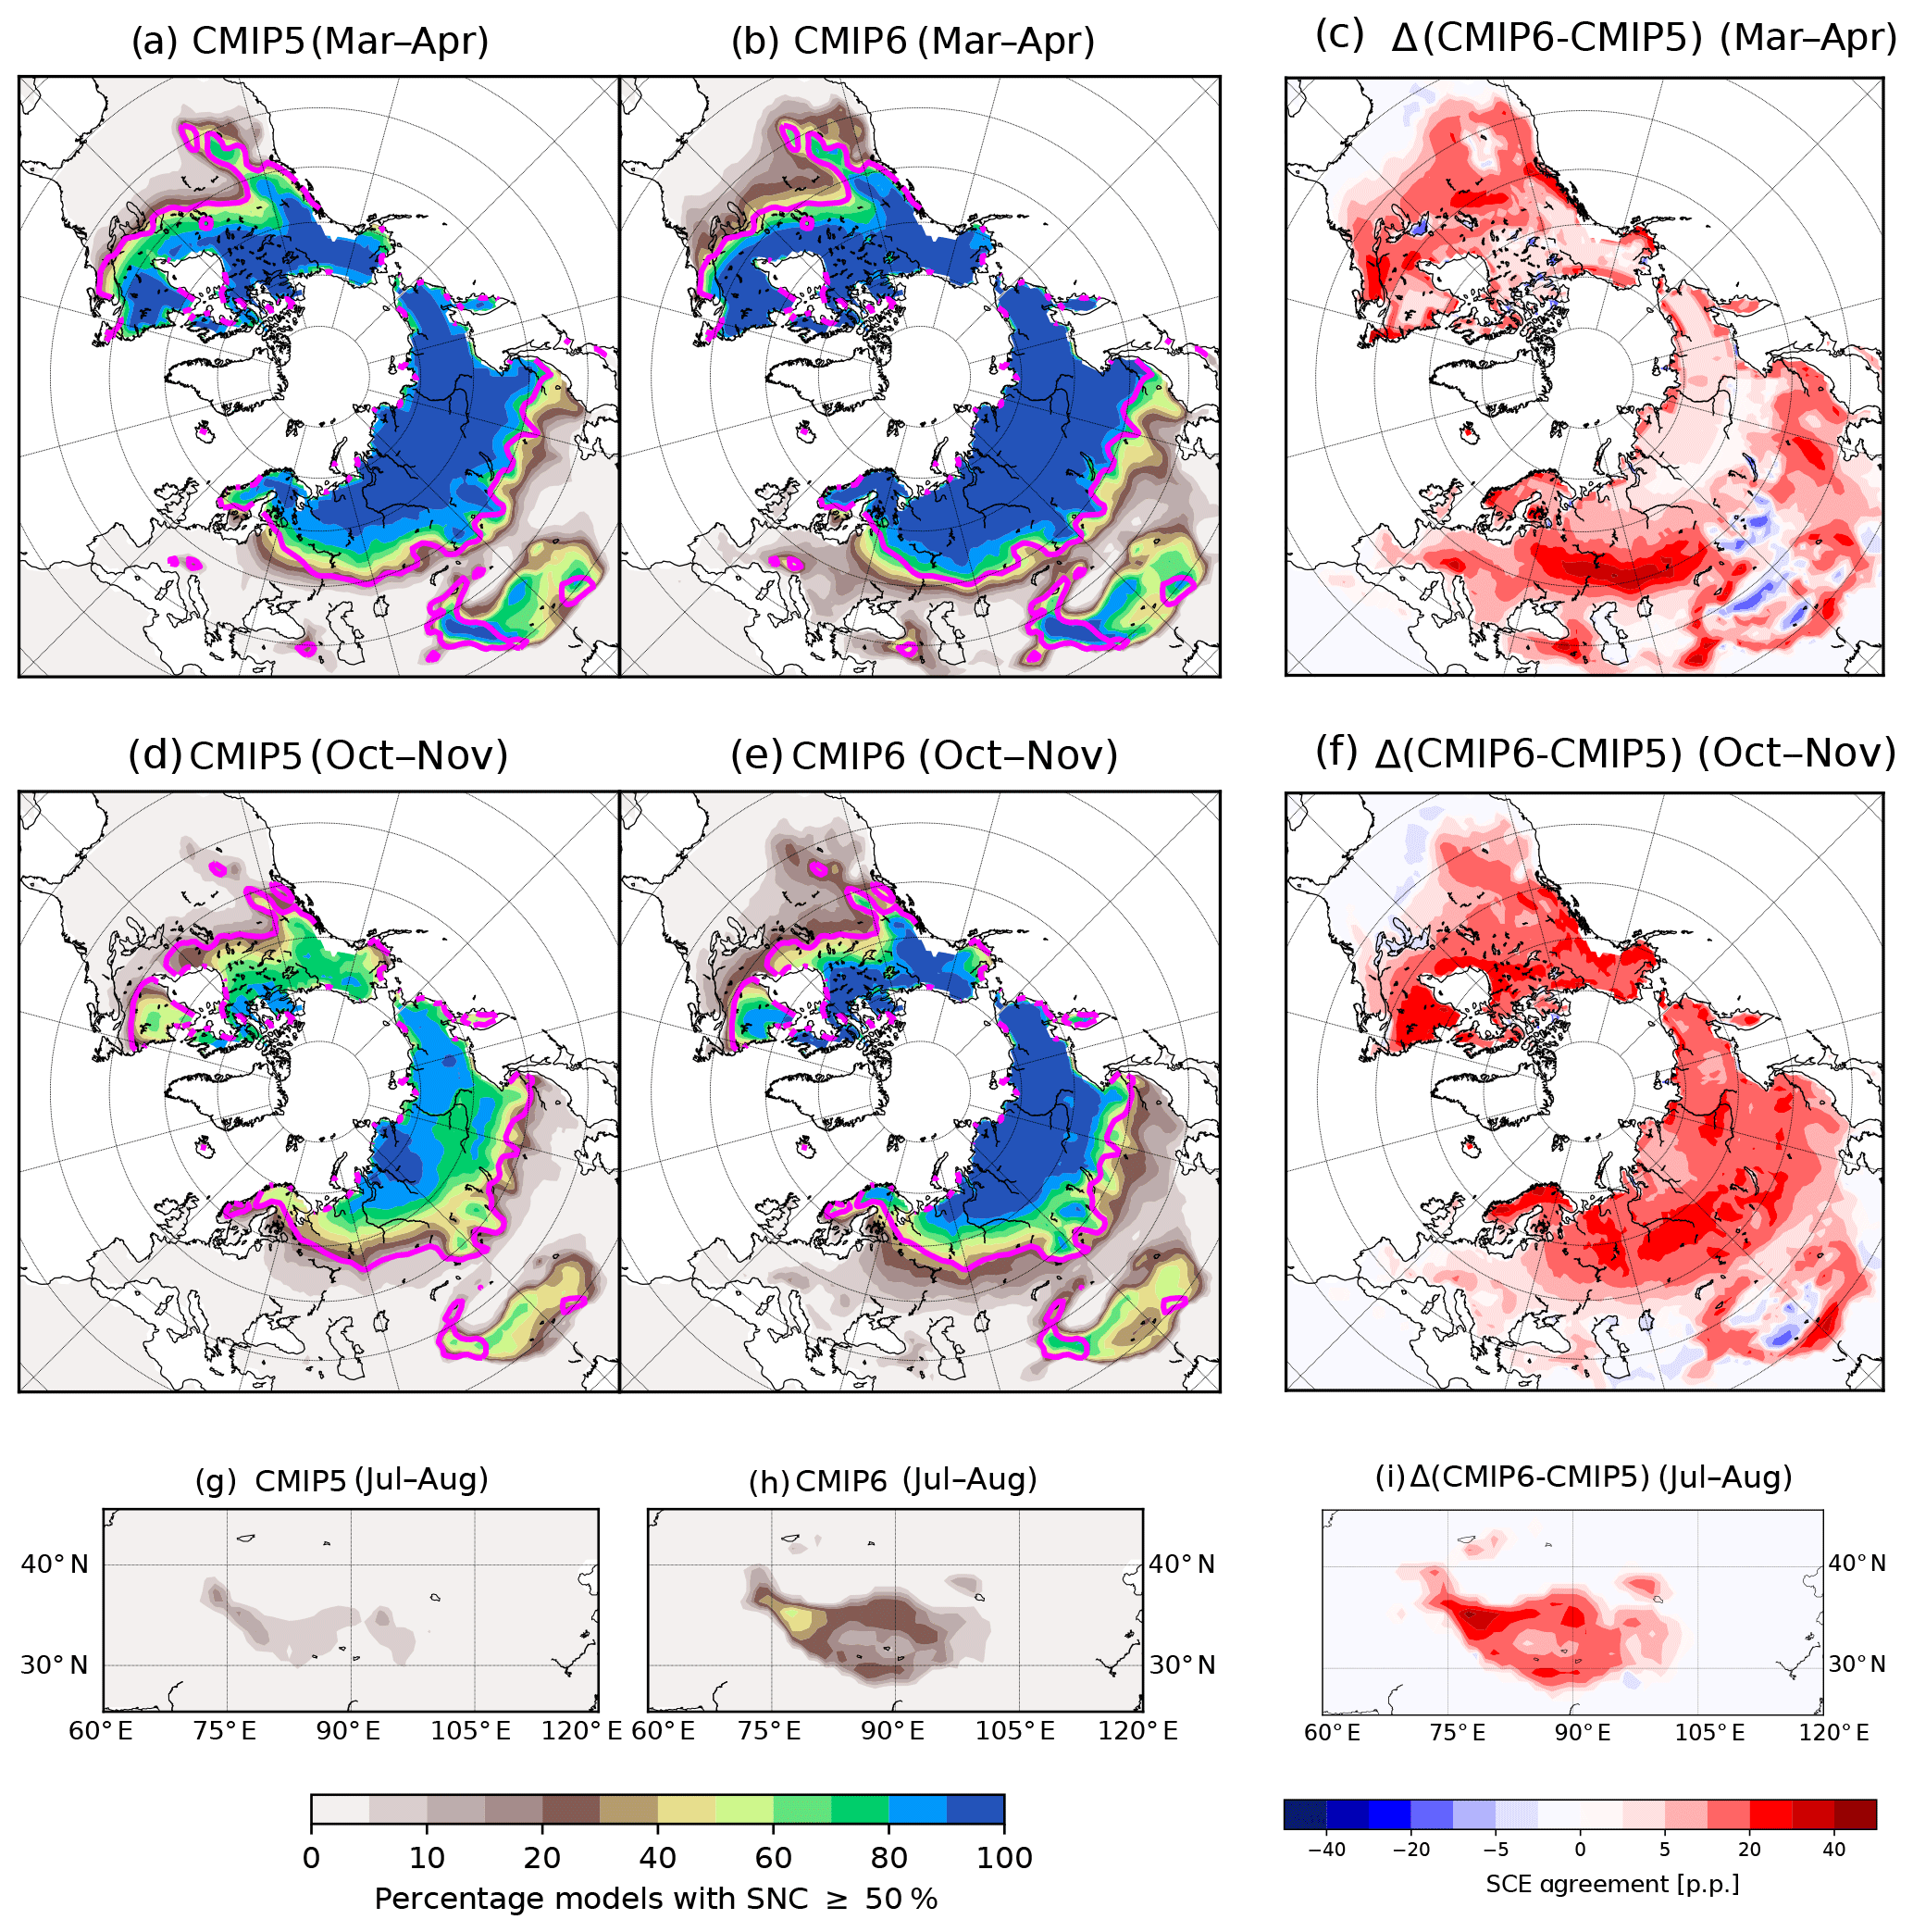
Figure 5Percentage of models simulating more than 50 % snow cover in the Northern Hemisphere during March–April (a–c) and October–November (d–e) for 1981–2014, for CMIP5 (a, d) and CMIP6 (b, e). The 50 % snow cover frequency line from the NOAA data for the same months during that period is shown in pink. Percentage of models simulating more than 50 % snow cover in high-mountain Asia during July–August for 1981–2014, for CMIP5 (g) and CMIP6 (h). Differences (CMIP6 minus CMIP5) are shown in panels (c, f, and i).
There is a notable increase in the simulated spring snow cover across the Tibetan Plateau in CMIP6, which strengthens a regional positive bias already present in CMIP5 simulations (Fig. 5a–c). This bias persists through the summer: more than 20 % of CMIP6 models simulate persistent summer snow cover on the Tibetan Plateau, and more than half of the models simulate persistent snow cover in excess of 50 % areal fraction in the Hindu Kush area further west (Fig. 5h). In South America (not shown), the CMIP6 ensemble simulates a median annual maximum snow extent of about 295 000 km2 (mean of approximately 400 000 km2, heavily influenced by some outliers), which is in good agreement with the average 1979–2006 annual maximum extent of about 320 000 km2 estimated from satellite passive microwave data (Foster et al., 2009).
In summary, while some regional differences in snow cover are evident, the improved hemispheric statistics for snow extent seen in Fig. 3 are generally consistent with the geographic patterns shown in Fig. 5. While there is some apparent skill degradation in some areas such as the Tibetan Plateau, there is a clear improvement in the mean model agreement with observations at the hemispheric scale, particularly in October–November, that is not due to compensation of biases in different regions.
Simulated snow extent and snow mass trends over the 1981–2014 period (Fig. 6) are stronger for most months in CMIP6 than in CMIP5 with respect to the inter-model median (note that the observed trends are computed over the 1981–2014 period for consistency with the CMIP6 ensemble and thus slightly different from the 1981–2017/18 trends given in Fig. 1). As discussed in Sect. 2.1, the observational uncertainty shown on the graph is meant to estimate uncertainty due to historical interannual variability and does not represent the larger spread in trends among individual datasets. Differences between CMIP5 and CMIP6 are most apparent during the autumn months of October and November and during the spring months of April and May. This change is not simply due to the increased snow extent (Fig. 3) because the CMIP6 trends are approximately twice as strong as CMIP5, while the increase in climatological snow extent was more modest. The observed snow extent and snow mass trends generally fall within the range of both ensembles, although this is expected given the very large inter-model spread in the simulated trends for both variables.
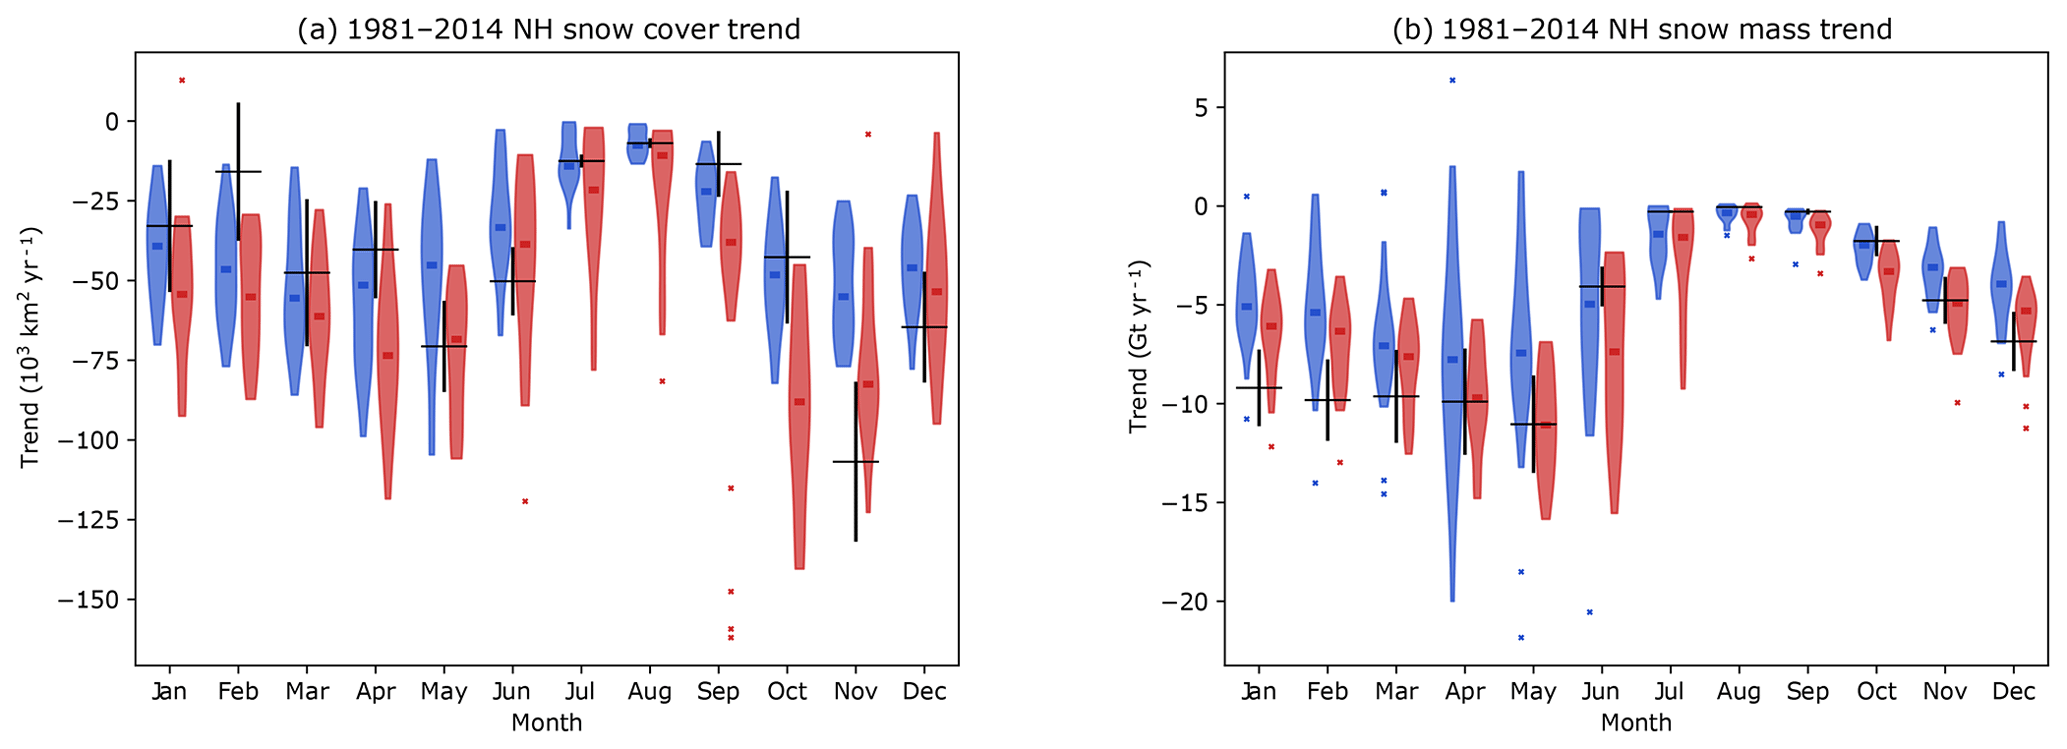
Figure 6Northern Hemisphere trends of snow extent (a) and snow mass (b) between 1981 and 2014, for CMIP5 (blue) and CMIP6 (red). The violins span the model range after the removal of outliers. The observed trends are represented by the black crosses, with the height of the cross representing the 1σ uncertainty of the observed trend.
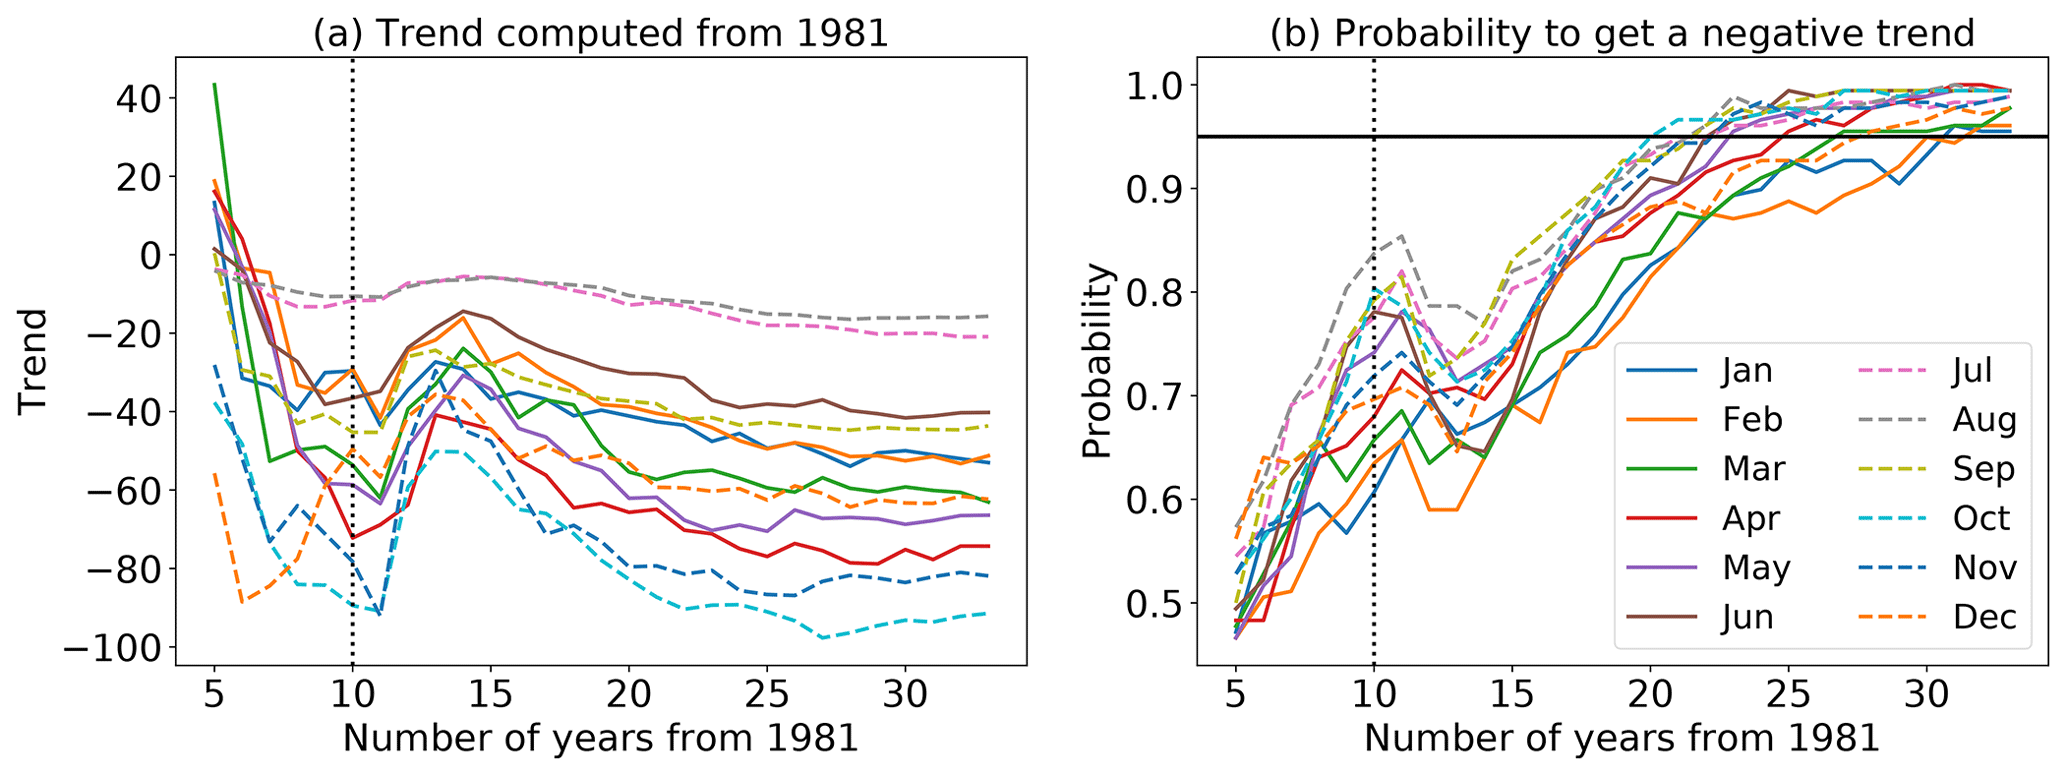
Figure 7(a) Northern Hemisphere monthly trends of snow extent in CMIP6 models over 1981–2014 computed with 178 members from 21 CMIP6 models as a function of the number of years from 1981 and starting from a 5-year time series. (b) Probability of negative monthly trends estimated from the full ensemble members. The horizontal bar highlights a probability of 95 %, and the vertical bars correspond to the year of the Pinatubo eruption.
In order to determine whether the 34-year trends calculated above are representative of an anthropogenic forcing signal, CMIP6 ensemble-mean values for monthly NH snow extent trends were computed over periods of various lengths (starting in 1981) from 5 to 34 years as shown in Fig. 7a. When considering very short periods (5 years), the ensemble-mean monthly trends span random values that can be either positive or negative. Over longer periods, these trends all converge toward negative values with magnitudes that are stronger during the autumn and spring seasons. The trends all become more positive after the 10th year (1991), following the eruption of Mount Pinatubo, an indication of the response of NH snow extent to the subsequent tropospheric cooling forced by the eruption. The probability of obtaining a negative trend is shown in Fig. 7b, estimated from the range of trends in the 178-member ensemble. After 5 years, this probability is close to 0.5 (roughly equal numbers of positive and negative trends found within the ensemble), highlighting the influence of internal climate variability on snow extent at these short timescales. After 20 years, this probability ranges between 0.7 and 0.9, with lower values in spring compared to autumn, suggesting a higher interannual variability in spring than in autumn. Finally, after 30 years the probability of obtaining a negative trend is larger than 95 % for all months. This result indicates that requiring a minimum of 30 years would be justified in order to confidently differentiate anthropogenically driven snow extent trends from internal variability.
3.3 Model projections
The projected CMIP6 snow cover extent and snow mass changes shown in Fig. 8 share the broad features of the CMIP5 projections (e.g., Brutel-Vuilmet et al., 2013; not shown here). The different scenarios start to diverge in about 2040, approximately 25 years after the start of the projection period. Under SSP1-2.6, stabilization of the multi-model mean snow cover extent occurs around 2060 at about −18 % (±7 %) relative to the 1995–2014 average in spring (Fig. 8a), and at about −20 % (±7 %) in autumn (Fig. 8b). Unabated greenhouse gas emissions underlying SSP5-8.5 lead to continuous and ongoing snow cover losses which reach −55 % (±10 %) in spring and −60 % (±10 %) in autumn by the end of the 21st century. The stabilized loss of snow cover by mid-century under SSP1-2.6 compared to continued reductions to the end of the century under SSP5-8.5 is consistent with CMIP5 simulations under RCP2.6 vs. RCP8.5 (Meredith et al., 2020).
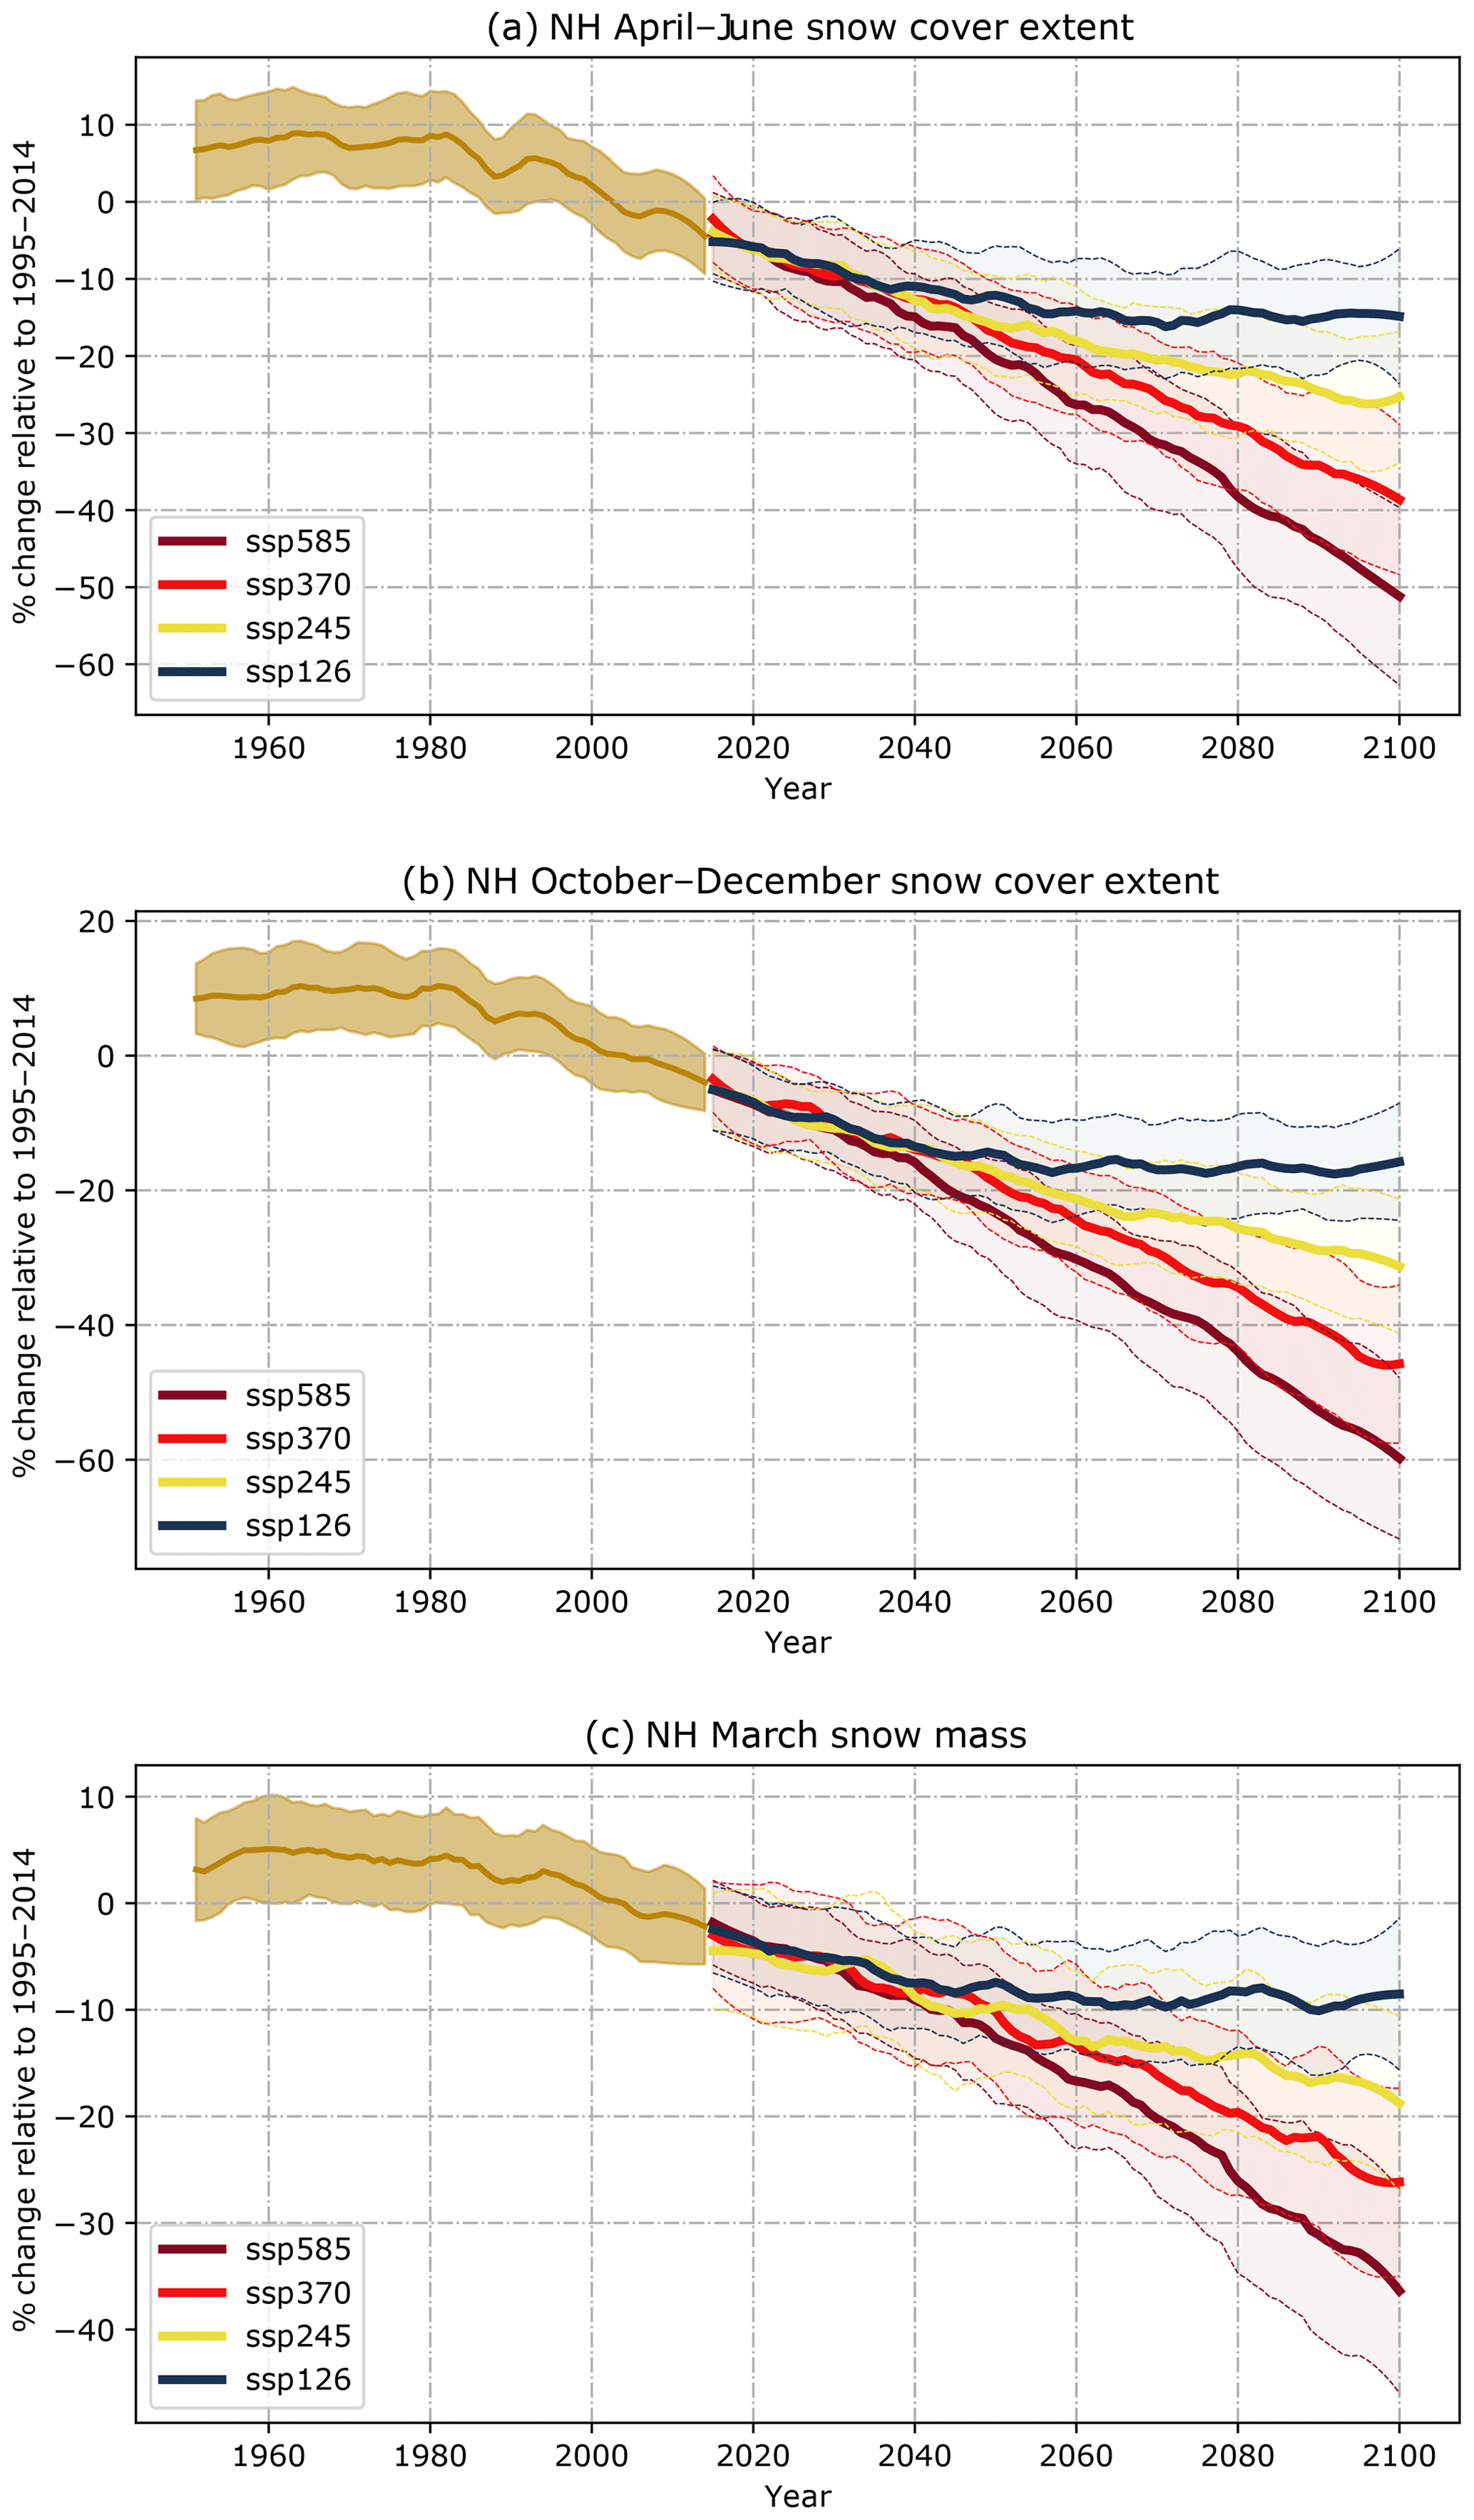
Figure 8Time series of (a) NH spring (April–June) and (b) autumn (October–December) snow cover extent and (c) March snow mass changes (relative to the 1995–2014 average); multi-model mean of the first ensemble members of the historical and scenario runs with inter-model standard deviation.
Projections of March snow mass (which captures the approximate timing of maximum NH snow mass) evolve similarly to snow extent, with somewhat lower losses relative to 1995–2014 ( by the end of the century in SSP5-8.5). Similar to snow cover extent, March snow mass reductions plateau after mid-century in SSP1-2.6 but continue to decline under all other SSPs. This overall reduction in peak NH snow mass will cause notable water cycle impacts (e.g., Berghuijs et al., 2014; Diffenbaugh et al., 2013). A more detailed analysis is required to confirm whether snow mass is projected to increase for the same high-latitude regions and scenarios as simulated by CMIP5 models (e.g., Eurasian and North American Arctic under RCP8.5; see Brown et al., 2017).
The difference in snow cover evolution projected for the various greenhouse gas concentration pathways can be distilled down to a rather simple relationship when the projected snow extent is plotted as a function of the global-mean surface air temperature (GSAT), as shown in Fig. 9 for projected spring snow extent changes under four scenarios. There is a single linear relationship between spring snow extent and GSAT changes valid across all scenarios. This finding suggests that Northern Hemisphere spring snow extent will decrease by about 8 % relative to the 1995–2014 level per degree Celsius of GSAT increase, which is somewhat weaker than the currently observed sensitivity (Mudryk et al., 2017). We also note that there is no significant difference in this linear relationship between CMIP6 models with high equilibrium climate sensitivity and those with low equilibrium climate sensitivity (not shown).
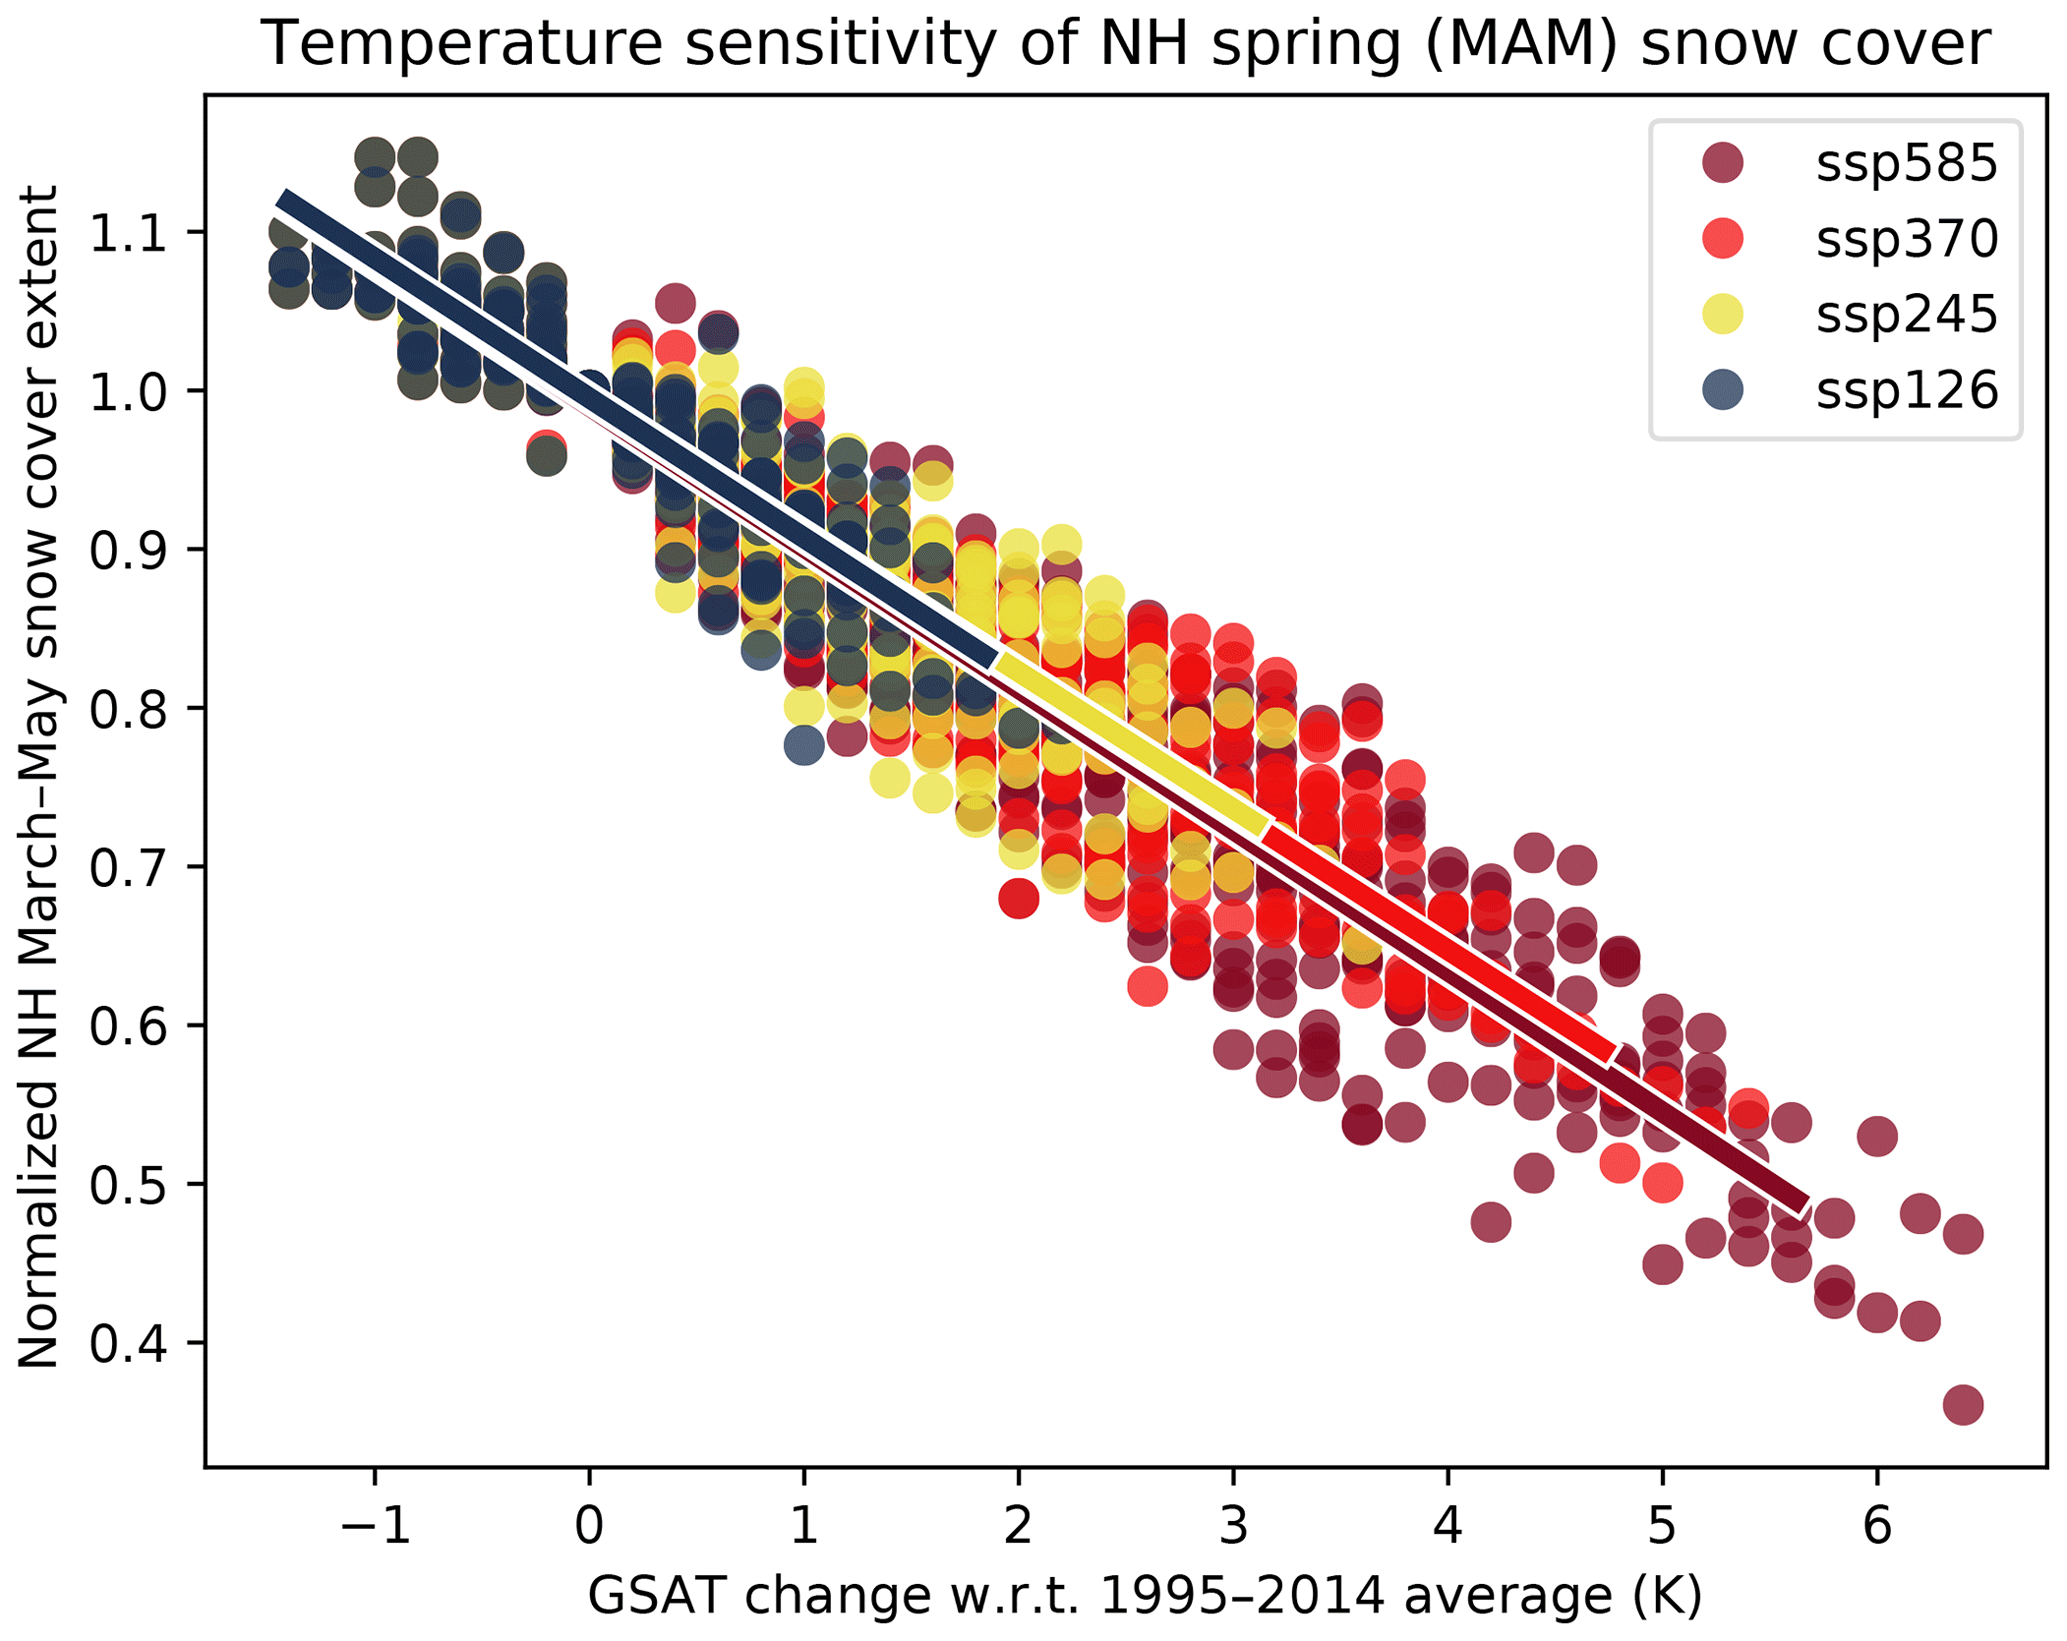
Figure 9Spring (March to May) NH snow cover extent against GSAT (relative to the 1995–2014 average) for the CMIP6 Tier 1 scenarios (SSP1-2.6, SSP2-4.5, SSP3-7.0, and SSP5-8.5), with linear regressions. Each data point represents the average snow extent from one CMIP6 simulation (first ensemble member for each available model). The average is taken over all pentads from the given simulation which fall into the given temperature bin.
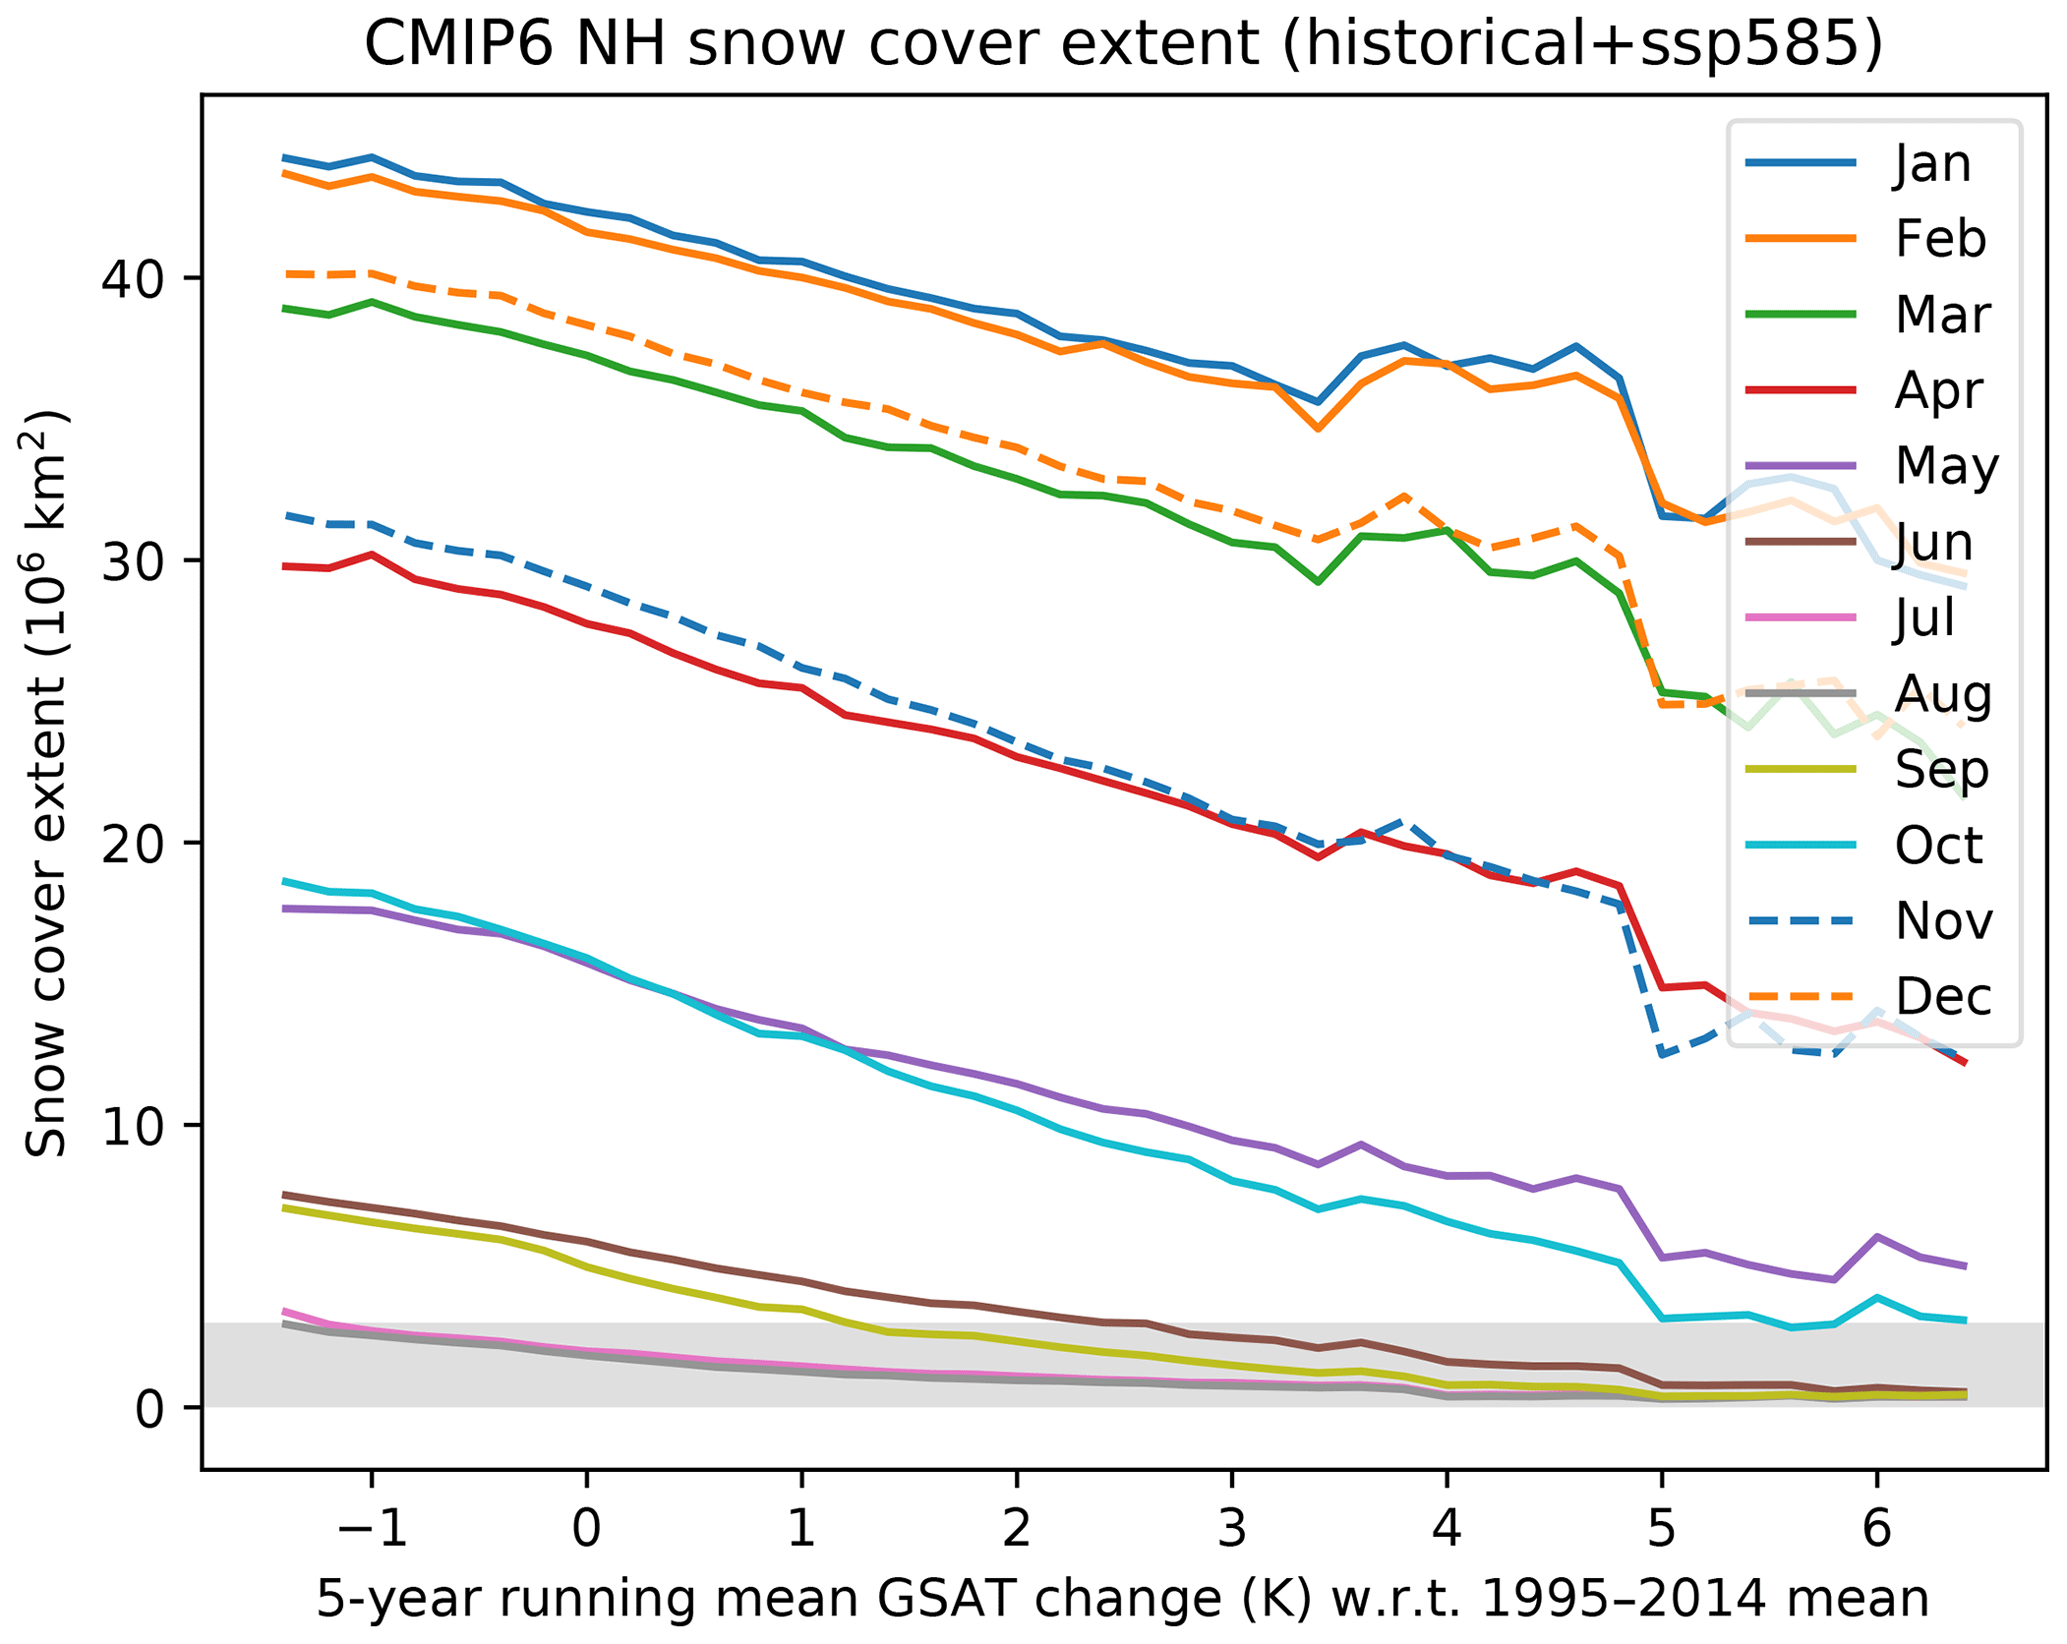
Figure 10Multi-model mean CMIP6 projected Northern Hemisphere snow extent as a function of 5-year mean GSAT for SSP5-8.5. The shaded region delineates when projected Northern Hemisphere snow extent drops below 3 million km2. This threshold is approximately the same fraction of the maximum snow extent as the corresponding fraction used to define the Arctic Ocean as ice-free.
Given this single linear relationship for all scenarios, we thus restrict further analysis to SSP5-8.5. This scenario leads to the strongest GSAT changes over the 21st century and thereby allows exploration of the sensitivity of snow cover to GSAT across the largest range of projected temperature changes. Figure 10 demonstrates that the snow cover reductions projected as a function of GSAT change are nearly linear for all months in the multi-model mean over the entire SSP5-8.5 temperature projection range, except for summer months (July to September), for which linearity necessarily breaks down when the land surface is essentially snow-free. While there appears to be a slightly stronger sensitivity (increased snow loss) during autumn months compared to spring, further investigation shows this is due to larger simulated warming in the Northern Hemisphere during these months. Scaling snow loss by Northern Hemisphere extratropical warming (>30∘ N) rather than GSAT shows slightly stronger sensitivity during the spring than during autumn consistent with Mudryk et al. (2017). The kink in the time series near 3.5 K (relative to 1995–2014) is due to changes in the number of models available as this level of warming corresponds roughly to the end of the 21st century beyond which fewer modeling groups contributed realizations. The increase in the snow-free season in the Northern Hemisphere can be traced by examining when total snow extent drops below a given threshold. For example, using a threshold of 3 million km2 as shaded in the figure, June and September are projected to be essentially snow-free at 2.5 K of warming relative to 1995–2014.
4.1 Observation-based trends
Strong snow extent trends are apparent over the 1981–2018 period based on an ensemble of six observation-based products. An extended dataset covering 1922 to 2018 provides no evidence of previous multi-decadal periods of sustained loss of snow cover during March and April comparable to that observed in recent decades. This loss of snow cover is consistent with numerous studies over the past decade which have documented the emergence of dramatic snow cover extent reductions (e.g., Allchin and Dery, 2019; Hernández-Henríquez et al., 2015; Dery and Brown, 2007). Historical trends in snow extent are strongly associated with extratropical surface temperature warming (Mudryk et al., 2017; Thackeray et al., 2016). The strong negative snow extent trends during October and November in Fig. 1 are consistent with dramatically warmer surface temperatures across the Arctic during autumn driven by summer sea ice loss (Serreze et al., 2009).
The six-dataset ensemble used in this study provides clear evidence that snow extent reductions from October to December are comparable to or even larger than those in March–June. However, negative autumn snow extent trends have not been consistently reported previously in the literature, with some studies even reporting a snow extent increase during October (e.g., Cohen et al., 2014). While the NOAA snow chart data record continues to show a positive trend in October, it is not replicated by other datasets (Mudryk et al., 2017, 2014; Brown and Derksen, 2013), including the recent Hori et al. (2017) dataset based on optical satellite data. Increased snow extent in October remains physically unrealistic given the concurrent surface temperature trends (Mudryk et al., 2017). While the NOAA dataset remains an important component of the observational ensemble used in this study, it provides a cautionary tale against relying on single datasets to establish a climate baseline, particularly for trends.
Winter season snow extent trends are influenced by both temperature and precipitation. While events such as cold-air outbreaks related to the behavior of the stratospheric polar vortex can have a notable impact on continental-scale snow cover during the winter, the negative winter snow extent trends in Fig. 1 indicate that warming temperatures across the marginal snow cover zone have resulted in less snow extent (and snow mass). Complete diagnosis of the snow mass trend drivers requires coordinated analysis of temperature and precipitation datasets (e.g., Sospedra-Alfonso et al., 2015), which is beyond the scope of the current study.
An ensemble of four datasets indicate reductions in total Northern Hemisphere snow mass over the 1981–2018 period. While we consider this mean trend robust, it is likely that the historical snow mass climatology derived from the gridded products used in this study is biased low. This low bias is expected because gridded products underestimate snow mass in alpine areas due to coarse grid cell resolution and uncertainty in precipitation forcing across these regions (Wrzesien et al., 2018). While this may impact the climatology used for historical model evaluation in Fig. 4, the same resolution-related bias also influences climate models in mountain regions (e.g., Fyfe et al., 2017), which have an even coarser resolution than the gridded products. In this sense, we expect climatological biases relative to “reality” to be in the same direction for both observations and models.
Further work is needed to explore provocative hydrological impacts of changing snow cover that have emerged from recent analysis. For example, observations from western North America show that when snow melt is initiated earlier in spring due to warming surface temperatures the subsequent melt rate is lower, which impacts the production of meltwater volume (Musselman et al. 2017).
4.2 Historical simulations
Successive editions of the CMIP exercise provide an excellent opportunity to evaluate progress in the realism of consecutive generations of climate models. In this study, we focused on the most fundamental hemispheric-scale snow metrics: snow extent and snow mass. Concerning snow extent, a low bias during most months in CMIP5 is largely corrected in CMIP6, even though some models simulate excessive snow cover extent for all months (Fig. 3). Hemispheric snow mass is overestimated in both CMIP5 and CMIP6 (Fig. 4), which warrants an analysis of the relationship between snow cover extent/fraction and snow mass at the continental and grid point scales.
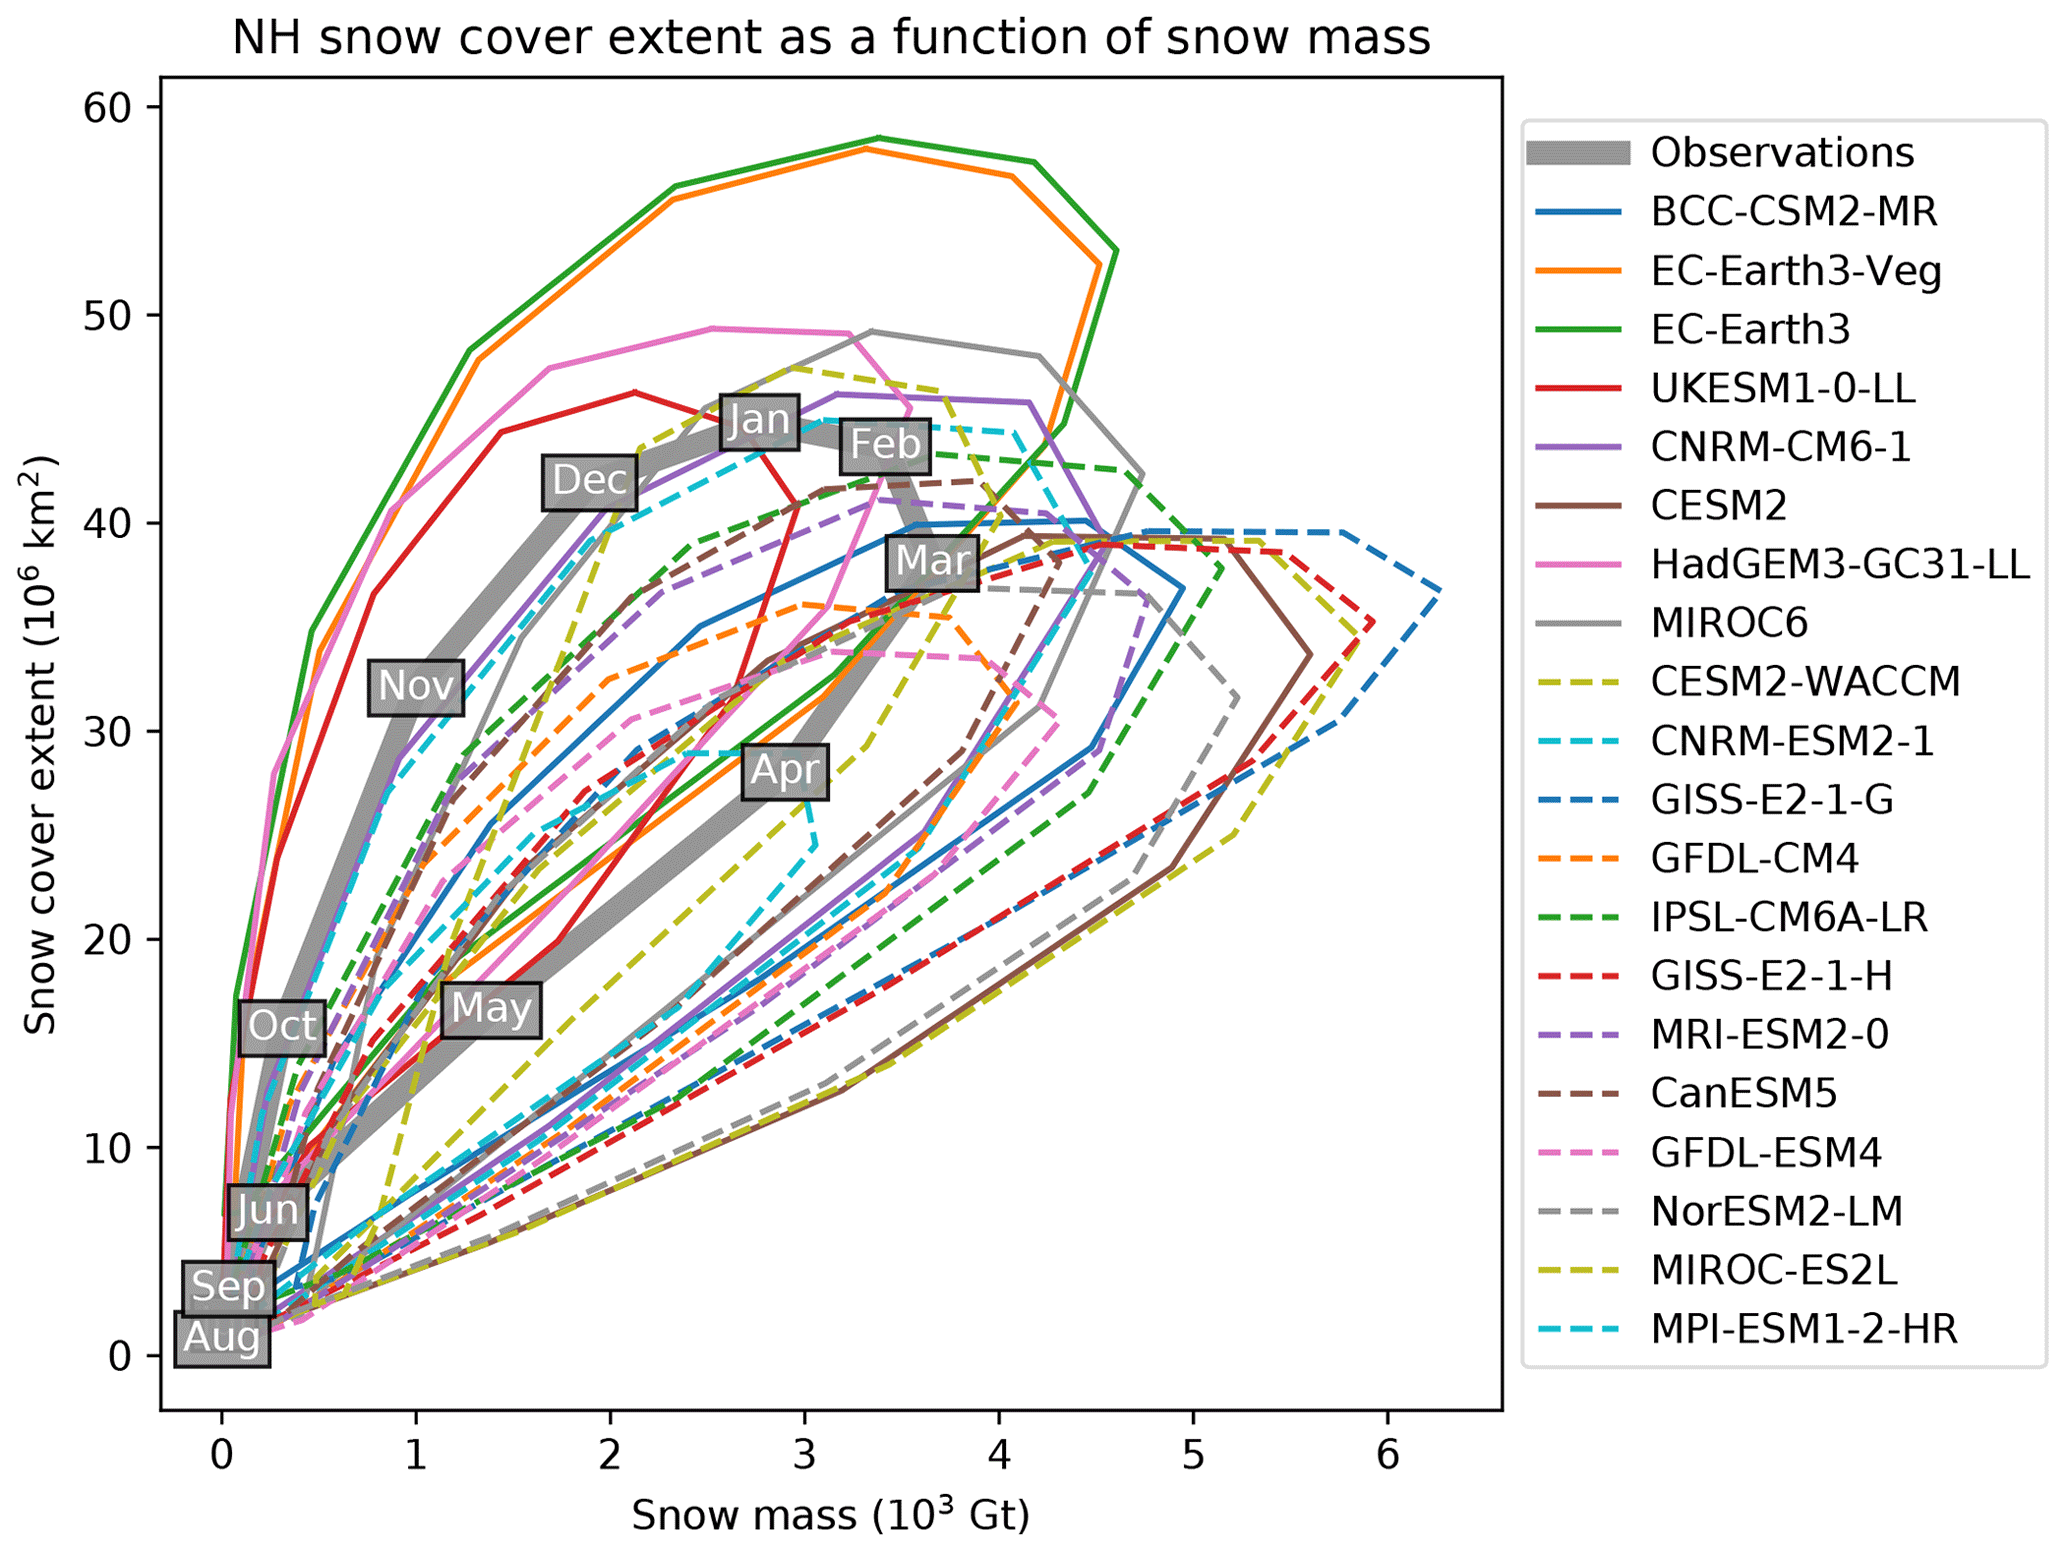
Figure 11Relationship between the 1981–2014 monthly mean hemispheric snow cover extent and monthly mean total hemispheric snow mass in the observation-based ensemble mean and the CMIP6 models. Summer months are located near (0∕0) and data run clockwise through the annual cycle; that is, autumn is on the upper branch and spring is on the lower branch of the curves.
At the hemispheric scale, the main feature of the observed month-to-month relationship between NH snow extent and snow mass (Fig. 11) is a hysteresis arising from (1) a steep snow extent increase in autumn at relatively low total snow mass (corresponding to a thin snowpack but expanding snow extent) and (2) quickly decreasing spring snow mass coincident with snow line retreat during the melt season. CMIP6 models necessarily capture this essential dynamic of global snow cover at the seasonal scale because the annual snow cycle begins and ends with an essentially snow-free NH. However, nearly all models increase snow extent too slowly given increases in snow mass during the buildup to peak snow mass and decrease the snow extent too slowly during the snowmelt period (the slope for the model simulations falls below observations in Fig. 11). Also, nearly all models overestimate the peak snow mass (as already shown in Fig. 4). Only two model families (the ECMWF and Hadley Centre models) systematically overestimate snow extent for a given total snow mass.
To shed light on why most models incorrectly represent the observed snow extent vs. snow mass relationship during the snow onset season (upper branch of the hysteresis in Fig. 11), we show the relationship between snow cover fraction and snow mass at the model grid point scale for selected models and observations during November in Fig. 12. The heat map for observations (Fig. 12a) shows a rapid increase in snow cover fraction for low values of snow mass, attaining 100 % at about 10 kg m−2. EC-Earth3 (Wyser et al., 2019), which is one of the models exhibiting too steep a hemispheric snow extent increase in autumn (Fig. 12b), clearly overestimates the grid-point-scale snow cover fraction at low values of snow mass, reaching 100 % almost immediately. Conversely, CESM2 (e.g., Gettelmann et al., 2019) is one of the models exhibiting too weak a slope in the snow extent vs. snow mass relationship at the hemispheric scale (Fig. 11). Consistently, it seems to attain 100 % snow cover too late at the grid point scale (at about 30 to 40 kg m−2; Fig. 12d), although the parameterization implemented in this model is observationally based (Niu and Yang, 2007). MIROC6 (Tatebe et al., 2019), which uses a relationship described by Nitta et al. (2014), closely follows the observed relationships at both the hemispheric (Fig. 11) and grid point (Fig. 12a) scales, as seen in Fig. 12c. The analysis at the grid point scale effectively reveals the model parameterizations linking the (usually diagnosed) snow cover fraction to the prognostic snow mass. Based on this analysis, it is tempting to recommend implementing a functional relationship that follows the maximum of the observed distribution. However, while a simple linear relationship attaining 100 % at 20 kg m−2 might be a satisfactory representation at the hemispheric scale, more sophisticated parameterizations are likely necessary for representation of snow cover fraction in mountainous areas (e.g., Helbig et al. 2015).

Figure 12Relationship between autumn (November) snow mass and snow cover fraction at 1∘ resolution for Crocus–ERA-I snow mass vs. NOAA snow cover (a, for 1995–2014) and on model grid scale for some selected CMIP6 models (b–d, 1981–2014). The color shading indicates the relative density of grid points on an arbitrary logarithmic scale.
Excessive snow mass at the hemispheric scale is another feature of the CMIP6 models (Figs. 4 and 11), although further work is also needed to clarify the potential impact of a low snow mass bias across mountain regions in the gridded products used for evaluation. In addition to evaluation product biases, several other reasons are possible for this overestimate: an underestimate of snowpack sublimation, excessive simulated solid precipitation rates, insufficient melt of early-season snow, or some combination of these issues. Excessive solid precipitation rates have been reported as the main reason for an overestimate of snow cover and snow depth in an intercomparison of reanalyses on the Tibetan Plateau (Orsolini et al., 2019). It might also be the reason for the strong positive snow cover and snow duration bias seen in the CMIP6 ensemble in that region; however, this hypothesis requires further focused analyses. There is no apparent overestimate by the coupled models for winter season (November to March) precipitation estimates (1981–2014) across Northern Hemisphere high-latitude (>50∘ N) ice-free land areas when compared to Global Precipitation Climatology Project data (GPCP; Adler et al., 2003). On average, the models even seem to underestimate the winter precipitation rates. The median CMIP6 value is about 93 % (range 65–104 %) of the GPCP precipitation rate for these months. Although precipitation climatologies are known to be problematic in high latitudes and GPCP observations were reported to be biased high in Eurasia (Behrangi et al., 2016), a high precipitation bias seems unlikely to be the reason for the excessive snow mass in most CMIP6 models. A full analysis of snow mass budget terms (for example as carried out in Sospedra-Alfonso et al., 2016) is required to fully address this issue. Historical offline simulations from the “Land-Hist” experiment (part of the CMIP6 Land Surface, Snow and Soil Moisture Model Intercomparison Project – LS3MIP; van den Hurk et al., 2016) provide a useful resource for this future analysis.
4.3 Projections
The Earth system is highly complex and non-linear in many aspects. Northern Hemisphere snow cover properties depend on temperature and precipitation over the snow accumulation and ablation seasons, but snowmelt, for example, is also heavily determined by available solar radiation at the surface, and the incoming top-of-the-atmosphere solar radiation that this depends on is not a function of anthropogenic climate change. Surface characteristics such as vegetation and topography vary regionally and latitudinally, which could be expected to induce differential responses of snow cover to climate change. Furthermore, regional climate change (temperature, precipitation) is not necessarily linearly related to GSAT change. All these complexities make it a priori surprising that the projected snow extent could essentially be proportional to future GSAT changes. The CMIP6 ensemble, however, strongly suggests that, on a hemispheric scale, future snow extent changes can be rather unambiguously related to GSAT, the fundamental metric of future global climate change (Fig. 9).
Concerning other cryospheric elements of the climate system, similar linear relationships have been reported for sea ice (Notz and Stroeve, 2016) and near-surface (top 2 m) permafrost (Burke et al., 2020). A common characteristic of sea ice, near-surface permafrost, and seasonal snow is that they respond quickly (in a few years or less, down to monthly timescales for snow) to surface climate conditions. This fast response largely explains the absence of any climate change pathway dependency. However, the near linearity of the snow cover response, which only breaks down once almost no snow is left, remains remarkable. It clearly links future large-scale snow cover changes to global temperature changes, and thus via a linear relationship between global temperature changes and cumulative CO2 emissions (Collins et al., 2013) to humanity's future socioeconomic choices. However, such a clear link on the hemispheric scale does not necessarily imply that snow cover changes at regional to watershed scales can be predicted in a similarly straightforward way. It remains a challenge to produce trustworthy projections of snow cover changes at the scale required for the management of water resources and ecosystems. In this respect, regional and even hemisphere-scale biases in the simulated current-day snow extent and mass, as shown in Figs. 3–6, clearly warrant continued caution in the interpretation and usage of climate model output.
This paper presented an evaluation of first-order characteristics of Northern Hemisphere snow cover by CMIP6 models against an updated ensemble of gridded snow products (six for snow extent; four for snow mass). This updated dataset reveals strong negative NH snow extent trends in early winter and spring and consistently strong, negative snow mass trends from November through May. The spring snow extent reductions have continued unabated over the past 15 years and are strongly associated with extratropical temperature trends. The multi-dataset analysis in this paper provides robust evidence of a similar decline during the snow onset season. Because NH land areas are essentially snow-free through the summer period, warming temperatures in autumn effectively delay the snowfall events required to initiate the snow cover season and advance the snowline. Snow mass trends are negative through the entire snow season, rapidly increasing in magnitude during autumn to remain and remaining greater than −5 Gt yr−1 through May. Snow mass trend attribution is more complicated than snow cover extent since it is influenced by cumulative drivers over the entire accumulation season, including temperature, precipitation, and sublimation.
Compared to CMIP5, the more recent CMIP6 ensemble better represents the recent (1981–2014) observed mean monthly NH snow extent. The increased climatological NH snow extent in CMIP6 should have impacts on the simulated radiative forcing and surface albedo feedback, particularly in spring when solar radiation fluxes are rapidly increasing and snow cover extent is still high; however, analysis of these effects is beyond the scope of this article.
The NH snow mass is biased high in both CMIP5 and CMIP6, but because of the reduced spread in the CMIP6 ensemble (as available at the time of writing), the high bias appears more significant in CMIP6 than in CMIP5. The contradiction between a correctly simulated snow extent and an overestimated snow mass seems at least in part to be explained by skewed parameterized relationships between grid point snow mass and snow cover fraction in many models. Further work is also needed on the observational side to better constrain uncertainty in the determination of snow mass model bias.
Trends in snow mass and snow extent are both stronger in CMIP6 than in CMIP5, particularly snow extent during the shoulder seasons. While such trends appear generally realistic when compared to observed monthly trends, the observed trends cover a very large uncertainty range, so it is difficult to determine if there are any notable differences between the two ensembles.
NH snow extent exhibits a linear response to GSAT changes for all months, only becoming nonlinear at higher warming levels when NH snow cover completely vanishes during some months. This remarkable linear relationship shows no emission pathway dependency. In all scenarios, a given GSAT change can be, within uncertainties, related to the same NH snow extent change of about for the winter months.
The analyses presented here will most certainly be followed by more detailed focus on snow-related characteristics of CMIP6 output, for example concerning attribution of observed changes to human activity, snow–albedo feedback intensity, the role of snow cover in regional climate change, and others. In particular the existence of the new CMIP6 land-only simulations, carried out within LS3MIP (van den Hurk et al., 2016), will allow for a consistent analysis of snow-related processes using a hierarchy of simulations of increasing complexity. We hope that analysis of snow-related biases in this suite of simulations will help in attributing model deficiencies to shortcomings in the land models, the driving atmospheric models, or biases in the simulated coupled land–atmosphere–ocean system.
The multi-dataset historical snow extent and snow water equivalent time series described in Sect. 2.1 are publically available from Environment and Climate Change Canada (https://doi.org/10.18164/cc133287-1a07-4588-b3b8-40d714edd90e, Mudryk et al., 2020). The model data used in this analysis (listed in Table 2) are available from the Earth System Grid Federation (https://esgf.llnl.gov, last access: 31 December 2019). Data references for specific model and experiment combinations are available via http://bit.ly/CMIP6_Citation_Search
LM, MS, GK, and MM performed analysis and produced figures. LM, GK, and CD wrote the original draft. LM constructed the observation-based time series. CB and MB obtained model data. All authors contributed to manuscript review and editing.
The authors declare that they have no conflict of interest.
We acknowledge the World Climate Research Programme (WCRP), which, through its Working Group on Coupled Modelling, coordinated and promoted CMIP6. We thank the climate modeling groups for producing and making available their model output, the Earth System Grid Federation (ESGF) for archiving the data and providing access, and the multiple funding agencies who support CMIP6 and ESGF. We also thank the CliC core project of WCRP for supporting ESM-SnowMIP.
This paper was edited by Mark Flanner and reviewed by two anonymous referees.
Adler, R. F., Huffman, G. J., Chang, A., Ferraro, R., Xie, P., Janowiak, J., Rudolf, B., Schneider, U., Curtis, S., Bolvin, D., Gruber, A., Susskind, J., and Arkin, P.: The Version 2 Global Precipitation Climatology Project (GPCP) Monthly Precipitation Analysis (1979-Present, J. Hydrometeorol., 4, 1147–1167, 2003.
Allchin, M. I. and Déry, S. J.: Shifting Spatial and Temporal Patterns in the Onset of Seasonally Snow-Dominated Conditions in the Northern Hemisphere, 1972–2017, J. Climate, 32, 4981–5001, https://doi.org/10.1175/JCLI-D-18-0686.1, 2019.
Behrangi, A., Christensen, M., Richardson, M., Lebsock, M., Stephens, G., Huffman, G., Bolvin, D., Adler, R., Gardner, A., Lambrigtsen, B., and Fetzer, E.: Status of high-latitude precipitation estimates from observations and reanalyses, J. Geophys. Res.-Atmos., 121, 4468– 4486, https://doi.org/10.1002/2015JD024546, 2016.
Berghuijs, W., Woods, R., and Hrachowitz, M.: A precipitation shift from snow towards rain leads to a decrease in streamflow, Nat. Clim. Change, 4, 583–586, https://doi.org/10.1038/NCLIMATE2246, 2014.
Brown, R. D.: Northern Hemisphere snow cover variability and change, 1915–1997, J. Climate, 13, 2339–2355, 2000.
Brown, R. and Derksen, C.: Is Eurasian October snow cover extent increasing? Environ. Res. Lett., 8, 024006 https://doi.org/10.1088/1748-9326/8/2/024006, 2013.
Brown, R. and Mote, P.: The response of Northern Hemisphere snow cover to a changing climate, J. Climate, 22, 2124–2145, 2009.
Brown, R. D. and Robinson, D. A.: Northern Hemisphere spring snow cover variability and change over 1922–2010 including an assessment of uncertainty, The Cryosphere, 5, 219–229, https://doi.org/10.5194/tc-5-219-2011, 2011.
Brown, R. D., Brasnett, B., and Robinson, D.: Gridded North American monthly snow depth and snow water equivalent for GCM evaluation, Atmos.-Ocean, 41, 1–14, https://doi.org/10.3137/ao.410101, 2003.
Brown, R., Derksen, C., and Wang, L.: A multi-dataset analysis of variability and change in Arctic spring snow cover extent, 1967–2008, J. Geophys. Res., 115, D16111, https://doi.org/10.1029/2010JD013975, 2010.
Brown, R., Vikhamar Schuler, D., Bulygina, O., Derksen, C., Luojus, K., Mudryk, L., Wang, L., and Yang, D.: Arctic terrestrial snow cover. in: Snow, Water, Ice and Permafrost in the Arctic (SWIPA) 2017, Arctic Monitoring and Assessment Programme (AMAP), Oslo, Norway, 25–64, 2017.
Brun, E., Vionnet, V., Boone, A., Decharme, B., Peings, Y., Vallette, R., Karbou, F., and Morin, S.: Simulation of northern Eurasian local snow depth, mass, and density using a detailed snowpack model and meteorological reanalyses, J. Hydrometeorol., 14, 203–219, 2013.
Brutel-Vuilmet, C., Ménégoz, M., and Krinner, G.: An analysis of present and future seasonal Northern Hemisphere land snow cover simulated by CMIP5 coupled climate models, The Cryosphere, 7, 67–80, https://doi.org/10.5194/tc-7-67-2013, 2013.
Burke, E. J., Zhang, Y., and Krinner, G.: Evaluating permafrost physics in the CMIP6 models and their sensitivity to climate change, The Cryosphere Discuss., https://doi.org/10.5194/tc-2019-309, in review, 2020.
Cohen, J., Furtado, J., Jones, J., Barlow, M., Whittleson, D., and Enekhabi, D.: Linking Siberian snow cover to precursors of stratospheric variability, J. Climate, 27, 5422–5432, 2014.
Collins, M., Knutti, R., Arblaster, J., Dufresne, J-L., Fichefet, T., Friedlingstein, P., Gao, X., Gutowski, W., Johns, T., Krinner, G., Shongwe, M., Tebaldi, C., Weaver, A., and Wehner, M.: Long-term Climate Change: Projections, Commitments and Irreversibility, in: Climate Change 2013: The Physical Science Basis. Contribution of Working Group I to the Fifth Assessment Report of the Intergovernmental Panel on Climate Change, edited by: Stocker, T. F., Qin, D., Plattner, G-K., Tignor, M., Allen, S., Boschung, J., Nauels, A., Xia, Y., Bex, V., and Midgley, P., Cambridge University Press, Cambridge, UK and New York, NY, USA, 2013.
Derksen, C. and Brown, R.: Spring snow cover extent reductions in the 2008–2012 period exceeding climate model projections, Geophys. Res. Lett., 39, L19504, https://doi.org/10.1029/2012GL053387, 2012.
Dery, S. and Brown, R.: Recent Northern Hemisphere snow cover extent trends and implications for the snow-albedo feedback, Geophys. Res. Lett., 34, L22504, https://doi.org/10.1029/2007GL031474, 2007.
Diffenbaugh, N., Scherer, M., and Ashfaq. M.: Response of snow-dependent hydrologic extremes to continued global warming, Nat. Clim. Change, 3, 379–384, https://doi.org/10.1038/NCLIMATE1732, 2013.
Essery, R., Morin, S., Lejeune, Y., and Ménard, C.: A comparison of 1701 snow models using observations from an alpine site, Adv. Water Res., 55, 131–148, https://doi.org/10.1016/j.advwatres.2012.07.013, 2012.
Estilow, T. W., Young, A. H., and Robinson, D. A.: A long-term Northern Hemisphere snow cover extent data record for climate studies and monitoring, Earth Syst. Sci. Data, 7, 137–142, https://doi.org/10.5194/essd-7-137-2015, 2015.
Eyring, V., Bony, S., Meehl, G. A., Senior, C. A., Stevens, B., Stouffer, R. J., and Taylor, K. E.: Overview of the Coupled Model Intercomparison Project Phase 6 (CMIP6) experimental design and organization, Geosci. Model Dev., 9, 1937–1958, https://doi.org/10.5194/gmd-9-1937-2016, 2016.
Flanner, M. G., Zender, C. S., Hess, P. G., Mahowald, N. M., Painter, T. H., Ramanathan, V., and Rasch, P. J.: Springtime warming and reduced snow cover from carbonaceous particles, Atmos. Chem. Phys., 9, 2481–2497, https://doi.org/10.5194/acp-9-2481-2009, 2009.
Flanner, M., Shell, K., Barlage, M., Perovich, D., and Tschudi, M.: Radiative forcing and albedo feedback from the Northern Hemisphere cryosphere between 1979 and 2008, Nat. Geosci., 4, 151–155, https://doi.org/10.1038/ngeo1062, 2011.
Foster, J., Hall D, Kelly R., and Chiu, L.: Seasonal snow extent and snow mass in South America using SMMR and SSM/I passive microwave data (1979–2006), Remote Sens. Environ., 113, 291–305, 2009.
Frei, A. and Robinson, D.: Evaluation of snow extent and its variability in the Atmospheric Model Intercomparison Project, J. Geophys. Res., 103, D8, 8859–8872, 1998.
Frei, A., Miller, J., and Robinson, D.: Improved simulations of snow extent in the second phase of the Atmospheric Model Intercomparison Project (AMIP-2), J. Geophys. Res., 108, D12, 4369–4384, https://doi.org/10.1029/2002JD003030, 2003.
Frei, A., Brown, R., Miller, J., and Robinson, D.: Snow mass over North America: Observations and results from the second phase of the Atmospheric Model Intercomparison Project, J. Hydrometeorol., 6, 681–695, 2005.
Fyfe, J., Derksen, C., Mudryk, L., Flato, G., Santer, B., Swart, N., Molotch, N., Zhang, X., Wan, H., Arora V., Scinocca, J., and Jiao, Y.: Large near-term projected snowpack loss over the western United States, Nat. Commun., 8, 14996, https://doi.org/10.1038/NCOMMS14996, 2017.
Ge, Y. and Gong, G.: Observed inconsistencies between snow extent and snow depth variability at regional/continental scales, J. Climate, 21, 1066–1082, https://doi.org/10.1175/2007JCLI1829.1, 2008.
Gelaro, R., McCarty, W., Suárez, M. J., Todling, R., Molod, A., Takacs, L., Randles, C. A., Darmenov, A., Bosilovich, M. G., Reichle, R., Wargan, K., Coy, L., Cullather, R., Draper, C., Akella,S., Buchard, V., Conaty, A., da Silva, A. M., Gu, W., Kim, G., Koster, R., Lucchesi, R., Merkova, D., Nielsen, J. E., Partyka, G., Pawson, S., Putman, W., Rienecker, M., Schubert, S. D., Sienkiewicz, M., and Zhao, B.: The Modern-Era Retrospective Analysis for Research and Applications, Version 2 (MERRA-2), J. Climate, 30, 5419–5454. https://doi.org/10.1175/JCLI-D-16-0758.1, 2017.
Gettelman, A., Hannay, C., Bacmeister, J. T., Neale, R. B., Pendergrass, A. G., Danabasoglu, G., Lamarque, J-F., Fasullo, J., Bailey, D., Lawrence, D., and Mills, M.: High climate sensitivity in the Community Earth System Model Version 2 (CESM2), Geophys. Res. Lett., 46, 8329–8337, https://doi.org/10.1029/2019GL083978, 2019.
GMAO (Global Modeling and Assimilation Office): MERRA-2 tavg1_2d_lnd_Nx: 2d, 1-Hourly, Time-Averaged, Single-Level, Assimilation, Land Surface Diagnostics V5.12.4, Greenbelt, MD, USA, Goddard Earth Sciences Data and Information Services Center (GESDISC), https://doi.org/10.5067/RKPHT8KC1Y1T (last access: 20 August 2019), 2015.
Hayhoe, K., Edmonds, J., Kopp, R., LeGrande, A., Sanderson, B., Wehner, M., and Wuebbles, D.: Climate models, scenarios, and projections, in: Climate Science Special Report: Fourth National Climate Assessment, Volume I, edited by: Wuebbles, D., Fahey, D., Hibbard, K., Dokken, D., Stewart, B., Maycock, T., US Global Change Research Program, Washington, DC, USA, 133–160, https://doi.org/10.7930/J0WH2N54, 2017.
Helbig, N., van Herwijnen, A., Magnusson, J., and Jonas, T.: Fractional snow-covered area parameterization over complex topography, Hydrol. Earth Syst. Sci., 19, 1339–1351, https://doi.org/10.5194/hess-19-1339-2015, 2015.
Hernández-Henríquez, M., Déry, S., and Derksen, C.: Polar amplification and elevation-dependence in trends of Northern Hemisphere snow cover extent, 1971–2014, Environ. Res. Lett., 10, 044010, https://doi.org/10.1088/1748-9326/10/4/044010, 2015.
Hock, R., Rasul, G., Adler, C., Cáceres, B., Gruber, S., Hirabayashi, Y., Jackson, M., Kääb, A., Kang, S, Kutuzov, S., Milner A., Molau, U., Morin, S., Orlove, B., and Steltzer, H.: High Mountain Areas, in: IPCC Special Report on the Ocean and Cryosphere in a Changing Climate, edited by: Pörtner, H.-O., Roberts, D., Masson-Delmotte, V., Zhai, P., Tignor, M., Poloczanska, E., Mintenbeck, K., Alegría, A., Nicolai, M., Okem, A., Petzold, J., Rama, B., and Weyer, N.: High Mountain Areas, in: IPCC Special Report on the Ocean and Cryosphere in a Changing Climate, in press, 2020.
Hori, M., Sugiura, K., Kobayashi, K., Aoki, T., Tanikawa, T., Kuchiki, K., Niwano, M., and Enomoto, H.: A 38-year (1978–2015) Northern Hemisphere daily snow cover extent product derived using consistent objective criteria from satellite-borne optical sensors, Remote Sens. Environ., 191, 402–418, https://doi.org/10.1016/j.rse.2017.01.023, 2017.
Kay, J. E., Deser, C. Phillips, A., Mai, A., Hannay, C., Strand, G., Arblaster, J., Bates, S., Danabasoglu, G., Edwards, J., Holland, M., Kushner, P., Lamarque, J., Lawrence, D., Lindsay, K., Middleton, A., Munoz E., Neale, R., Oleson, K., Polvani, L., and Vertenstein, M.: The Community Earth System Model (CESM) large ensemble project: A community resource for studying climate change in the presence of internal climate variability, B. Am. Meteorol. Soc., 96, 1333–1349, https://doi.org/10.1175/BAMS-D-13-00255.1, 2015.
Krinner, G. and Flanner, M.: Striking stationarity of large-scale climate model bias patterns under strong climate change, P. Natl. Acad. Sci. USA, 115, 38, 9462–9466, https://doi.org/10.1073/pnas.1807912115, 2018.
Krinner, G., Derksen, C., Essery, R., Flanner, M., Hagemann, S., Clark, M., Hall, A., Rott, H., Brutel-Vuilmet, C., Kim, H., Ménard, C. B., Mudryk, L., Thackeray, C., Wang, L., Arduini, G., Balsamo, G., Bartlett, P., Boike, J., Boone, A., Chéruy, F., Colin, J., Cuntz, M., Dai, Y., Decharme, B., Derry, J., Ducharne, A., Dutra, E., Fang, X., Fierz, C., Ghattas, J., Gusev, Y., Haverd, V., Kontu, A., Lafaysse, M., Law, R., Lawrence, D., Li, W., Marke, T., Marks, D., Ménégoz, M., Nasonova, O., Nitta, T., Niwano, M., Pomeroy, J., Raleigh, M. S., Schaedler, G., Semenov, V., Smirnova, T. G., Stacke, T., Strasser, U., Svenson, S., Turkov, D., Wang, T., Wever, N., Yuan, H., Zhou, W., and Zhu, D.: ESM-SnowMIP: assessing snow models and quantifying snow-related climate feedbacks, Geosci. Model Dev., 11, 5027–5049, https://doi.org/10.5194/gmd-11-5027-2018, 2018.
Letterly, A., Key, J., and Liu, Y.: Arctic climate: changes in sea ice extent outweigh changes in snow cover, The Cryosphere, 12, 3373–3382, https://doi.org/10.5194/tc-12-3373-2018, 2018.
Loranty, M., Berner, L., Goetz, S., Jin, Y., Randerson, J.: Vegetation controls on northern high latitude snow-albedo feedback: observations and CMIP5 model simulations, Glob. Change Biol., 20, 594–606, https://doi.org/10.1111/gcb.12391, 2014.
Marty, C., Tilg, A.-M., and Jonas, T: Recent evidence of large-scale receding snow water equivalents in the European Alps, J. Hydrometeorol., 18, 4, 1021–1031, https://doi.org/10.1175/JHM-D-16-0188.1, 2017
Masson, D. and Knutti, R.: Climate model genealogy, Geophys. Res. Lett., 38, L08703, https://doi.org/10.1029/2011GL046864, 2011.
Meredith, M., Sommerkorn, M., Cassotta, S., Derksen, C., Ekaykin, A., Hollowed A., Kofinas, G., Mackintosh, A., Melbourne-Thomas, J., Muelbert, M., Ottersen, G., Pritchard, H., and Schuur, E.: Polar Regions, in: IPCC Special Report on the Ocean and Cryosphere in a Changing Climate, edited by: Pörtner, H.-O., Roberts, D., Masson-Delmotte, V., Zhai, P., Tignor, M., Poloczanska, E., Mintenbeck, K., Alegría, A., Nicolai, M., Okem, A., Petzold, J., Rama, B., and Weyer, N.: Polar Regions, in: IPCC Special Report on the Ocean and Cryosphere in a Changing Climate, in press, 2020.
Mortimer, C., Mudryk, L., Derksen, C., Luojus, K., Brown, R., Kelly, R., and Tedesco, M.: Evaluation of long-term Northern Hemisphere snow water equivalent products, The Cryosphere, 14, 1579–1594, https://doi.org/10.5194/tc-14-1579-2020, 2020.
Mudryk, L., Kushner, P., and Derksen, C.: Interpreting observed Northern Hemisphere snow trends with large ensembles of climate simulations, Clim. Dynam., 43, 345–359, https://doi.org/10.1007/s00382-013-1954-y, 2014.
Mudryk, L., Derksen, C., Kushner, P., and Brown, R.: Characterization of Northern Hemisphere snow water equivalent datasets, 1981–2010, J. Climate, 28, 8037–8051, 2015.
Mudryk, L., Kushner, P., Derksen, C., and Thackeray, C.: Snow cover response to temperature in observational and climate model ensembles, Geophys. Res. Lett., 44, 919–926, https://doi.org/10.1002/2016GL071789, 2017.
Mudryk, L. R., Derksen, C., Howell, S., Laliberté, F., Thackeray, C., Sospedra-Alfonso, R., Vionnet, V., Kushner, P. J., and Brown, R.: Canadian snow and sea ice: historical trends and projections, The Cryosphere, 12, 1157–1176, https://doi.org/10.5194/tc-12-1157-2018, 2018.
Mudryk, L., Santolaria-Otín, M., Krinner, G., Ménégoz, M., Derksen, C., Brutel-Vuilmet, C., Brady, M., and Essery, R.: Northern Hemisphere Blended Snow Extent and Snow Mass Time Series, Environment and Climate Change Canada, https://doi.org//10.18164/cc133287-1a07-4588-b3b8-40d714edd90e, 2020.
Musselman, K., Clark, M., Liu, C., Ikeda, K., and Rasmussen, R.: Slower snowmelt in a warmer world, Nat. Clim. Change, 7, 214–219, https://doi.org/10.1038/NCLIMATE3225, 2017.
Natali, S. M., Watts, J. D., Rogers, B. M., Potter, S., Ludwig, S. M., Selbmann, A. K., Sullivan, P. F., Abbott, B. W., Arndt, K. A., Birch, L., Björkman, M. P., Bloom, A. A., Celis, G., Christensen, T. R., Christiansen, C. T., Commane, R., Cooper, E. J., Crill, P., Czimczik, C., Davydov, S., Du, J., Egan, J. E., Elberling, B., Euskirchen, E. S., Friborg, T., Genet, H., Göckede, M., Goodrich, J. P., Grogan, P., Helbig, M., Jafarov, E. E., Jastrow, J. D., Kalhori, A. A. M., Kim, Y., Kimball, J. S., Kutzbach, L., Lara, M. J., Larsen, K. S., Lee, B. Y., Liu, Z., Loranty, M. M., Lund, M., Lupascu, M., Madani, N., Malhotra, A., Matamala, R., McFarland, J., McGuire, A. D., Michelsen, A., Minions, C., Oechel, W. C., Olefeldt, D., Parmentier, F. J. W., Pirk, N., Poulter, B., Quinton, W., Rezanezhad, F., Risk, D., Sachs, T., Schaefer, K., Schmidt, N. M., Schuur, E. A. G., Semenchuk, P. R., Shaver, G., Sonnentag, O., Starr, G., Treat, C. C., Waldrop, M. P., Wang, Y., Welker, J., Wille, C., Xu, X., Zhang, Z., Zhuang, Q., and Zona, D.: Large loss of CO2 in winter observed across the northern permafrost region, Nat. Clim. Change, 9, 852–857, https://doi.org/10.1038/s41558-019-0592-8, 2019.
Nitta, T., Yoshimura, K., Takata, K., O'ishi, R., Sueyoshi, T., Kanae, S., Oki, T., Abe-Ouchi, A., and Liston, G.: Representing variability in subgrid snow cover and snow depth in a global land model: offline validation, J. Climate, 27, 3318–3330, https://doi.org/10.1175/JCLI-D-13-00310.1, 2014.
Niu, G.-Y. and Yang, Z.-L.: An observation-based formulation of snow cover fraction and its evaluation over large North American river basins, J. Geophys. Res., 112, D21101, https://doi.org/10.1029/2007JD008674, 2007.
Notz, D. and Stroeve, J.: Observed Arctic sea-ice loss directly follows anthropogenic CO2 emission, Science, 354, 6313, 747–750, https://doi.org/10.1126/science.aag2345, 2016.
O'Neill, B. C., Tebaldi, C., van Vuuren, D. P., Eyring, V., Friedlingstein, P., Hurtt, G., Knutti, R., Kriegler, E., Lamarque, J.-F., Lowe, J., Meehl, G. A., Moss, R., Riahi, K., and Sanderson, B. M.: The Scenario Model Intercomparison Project (ScenarioMIP) for CMIP6, Geosci. Model Dev., 9, 3461–3482, https://doi.org/10.5194/gmd-9-3461-2016, 2016.
Orsolini, Y., Wegmann, M., Dutra, E., Liu, B., Balsamo, G., Yang, K., de Rosnay, P., Zhu, C., Wang, W., Senan, R., and Arduini, G.: Evaluation of snow depth and snow cover over the Tibetan Plateau in global reanalyses using in situ and satellite remote sensing observations, The Cryosphere, 13, 2221–2239, https://doi.org/10.5194/tc-13-2221-2019, 2019.
Qu, X. and Hall, A: What controls the strength of snow-albedo feedback?, J. Climate, 20, 3971–3981, https://doi.org/10.1175/JCLI4186.1, 2007.
Pulliainen, J., Aurela, M., Laurila, T,. Aalto, T., Takala, M., Salminen, M., Kulmala, M., Barr, A., Heimann, M., Lindroth, A., Laaksonen, A., Derksen, C., Mäkelä, A., Markkanen, T., Lemmetyinen, J., Susiluoto, J., Dengel, S., Mammarella, I., Tuovinen, J.-P., and Vesala, T.: Early snowmelt significantly enhances boreal springtime carbon uptake, P. Natl. Acad. Sci. USA, 114, 42, 11081–11086, https://doi.org/10.1073/pnas.1707889114, 2017.
Räisänen, J.: Warmer climate: less or more snow? Clim. Dynam., 30, 307–319, https://doi.org/10.1007/s00382-007-0289-y, 2008.
Robinson, D. and Dewey, K.: Recent secular variations in the extent of Northern Hemisphere snow cover, J. Geophys. Res., 17, 10, 1557–1560 https://doi.org/10.1029/GL017i010p01557, 1990.
Robinson, D. A., Estilow, T. W., and NOAA CDR Program: NOAA Climate Data Record (CDR) of Northern Hemisphere (NH) Snow Cover Extent (SCE), Version 1. [r01], NOAA National Centers for Environmental Information, https://doi.org/10.7289/V5N014G9 (last access: 13 January 2020), 2012.
Serreze, M. C., Barrett, A. P., Stroeve, J. C., Kindig, D. N., and Holland, M. M.: The emergence of surface-based Arctic amplification, The Cryosphere, 3, 11–19, https://doi.org/10.5194/tc-3-11-2009, 2009.
Sospedra-Alfonso, R. and Merryfield, W.: Influences of temperature and precipitation on historical and future snowpack variability over the Northern Hemisphere in the second generation Canadian Earth System Model, J. Climate, 30, 4633–4656, https://doi.org/10.1175/JCLI-D-16-0612.1, 2017.
Sospedra-Alfonso, R., Melton, J., and Merryfield, W.: Effects of temperature and precipitation on snowpack variability in the Central Rocky Mountains as a function of elevation, Geophys. Res. Lett., 42, 11, 4429–4438, https://doi.org/10.1002/2015GL063898, 2015.
Sospedra-Alfonso, R., Merryfield, W., and Kharin, V.: Representation of Snow in the Canadian Seasonal to Interannual Prediction System. Part II: Potential Predictability and Hindcast Skill, J. Hydrometeorol., 17, 2511–2535, https://doi.org/10.1175/JHM-D-16-0027.1, 2016.
Takala, M., Luojus, K., Pulliainen, J., Derksen, C., Lemmetyinen, J., Kärnä, J.-P., and Koskinen, J.: Estimating Northern Hemisphere snow water equivalent for climate research through assimilation of space-borne radiometer data and ground-based measurements, Remote Sens. Environ., 115, 3517–3529, https://doi.org/10.1016/j.rse.2011.08.014, 2011.
Tatebe, H., Ogura, T., Nitta, T., Komuro, Y., Ogochi, K., Takemura, T., Sudo, K., Sekiguchi, M., Abe, M., Saito, F., Chikira, M., Watanabe, S., Mori, M., Hirota, N., Kawatani, Y., Mochizuki, T., Yoshimura, K., Takata, K., O'ishi, R., Yamazaki, D., Suzuki, T., Kurogi, M., Kataoka, T., Watanabe, M., and Kimoto, M.: Description and basic evaluation of simulated mean state, internal variability, and climate sensitivity in MIROC6, Geosci. Model Dev., 12, 2727–2765, https://doi.org/10.5194/gmd-12-2727-2019, 2019.
Taylor, K. E., Stouffer, R., and Meehl, G.: An Overview of CMIP5 and the experiment design, B. Am. Meteorol. Soc., 93, 485–498, https://doi.org/10.1175/BAMS-D-11-00094.1, 2012.
Thackeray, C., Fletcher, C., and Derksen, C.: Quantifying the skill of CMIP5 models in simulating seasonal albedo and snow cover evolution, J. Geophys. Res., 120, 12, 5831–5849, https://doi.org/10.1002/2015JD023325, 2015.
Thackeray, C., Fletcher, C., Mudryk, L., and Derksen, C.: Quantifying the uncertainty in historical and future simulations of Northern Hemisphere spring snow cover, J. Climate, 29, 8647–8663, https://doi.org/10.1175/JCLI-D-16-0341.1, 2016.
Thackeray, C., Fletcher, C., and Derksen, C.: Diagnosing the impacts of Northern Hemisphere surface albedo biases on climate, J. Climate, 32, 1777–1795 https://doi.org/10.1175/JCLI-D-18-0083.1, 2019.
van den Hurk, B., Kim, H., Krinner, G., Seneviratne, S. I., Derksen, C., Oki, T., Douville, H., Colin, J., Ducharne, A., Cheruy, F., Viovy, N., Puma, M. J., Wada, Y., Li, W., Jia, B., Alessandri, A., Lawrence, D. M., Weedon, G. P., Ellis, R., Hagemann, S., Mao, J., Flanner, M. G., Zampieri, M., Materia, S., Law, R. M., and Sheffield, J.: LS3MIP (v1.0) contribution to CMIP6: the Land Surface, Snow and Soil moisture Model Intercomparison Project – aims, setup and expected outcome, Geosci. Model Dev., 9, 2809–2832, https://doi.org/10.5194/gmd-9-2809-2016, 2016.
Verfaillie, D., Lafaysse, M., Déqué, M., Eckert, N., Lejeune, Y., and Morin, S.: Multi-component ensembles of future meteorological and natural snow conditions for 1500 m altitude in the Chartreuse mountain range, Northern French Alps, The Cryosphere, 12, 1249–1271, https://doi.org/10.5194/tc-12-1249-2018, 2018.
Voldoire, A., Saint-Martin, D., Sénési, S., Decharme, B., Alias, A., Chevallier, M., Colin, J., Guérémy, J.-F., Michou, M., Moine, M.-P., Nabat, P., Roehrig, R., Salas y Mélia, D., Séférian, R., Valcke, S., Beau, I., Belamari, S., Berthet, S., Cassou, C., Cattiaux, J., Deshayes, J., Douville, H., Ethé, C., Franchistéguy, L., Geoffroy, O., Lévy, C., Madec, G., Meurdesoif, Y., Msadek, R., Ribes, A., Sanchez-Gomez, E., Terray, L., and Waldman, R.: Evaluation of CMIP6 DECK experiments with CNRM-CM6-1, J. Adv. Model. Earth Sy., 11, 2177– 2213, https://doi.org/10.1029/2019MS001683, 2019.
Wang, L., Cole, J., Bartlett, P., Verseghy, D., Arora, V., Derksen, C., Brown, R., and von Salzen, K.: Investigating the spread of surface albedo in snow covered forests in CMIP5 models, J. Geophys. Res., 121, 1104–1119, https://doi.org/10.1002/2015JD023824, 2016.
Wrzesien, M. L., Durand, M. T., Pavelsky, T. M., Kapnick, S. B., Zhang, Y., Guo, J., & Shum, C. K.: A new estimate of North American mountain snow accumulation from regional climate model simulations, Geophys. Res. Lett., 45, 1423– 1432, https://doi.org/10.1002/2017GL076664, 2018.
Wyser, K., van Noije, T., Yang, S., von Hardenberg, J., O'Donnell, D., and Döscher, R.: On the increased climate sensitivity in the EC-Earth model from CMIP5 to CMIP6, Geosci. Model Dev. Discuss., https://doi.org/10.5194/gmd-2019-282, in review, 2019.
Zhang, R., Wang, H., Fu, Q., Rasch, P., and Wang, X.: Unraveling driving forces explaining significant reduction in satellite-inferred Arctic surface albedo since the 1980s, P. Natl. Acad. Sci. USA, 116, 48, 23947–23953, https://doi.org/10.1073/pnas.1915258116, 2019.