
the Creative Commons Attribution 4.0 License.
the Creative Commons Attribution 4.0 License.
 | 22 Sep 2026
Numerical modeling on the mechanisms of chlorine chemistry in snowpack and their impact on secondary atmospheric pollution
Shengjin Xie

Aijun Xiu
Hong Qi
Shengrui Tong
Qianjie Chen
Chao Gao
Hongmei Zhao
Shichun Zhang
Stephen Dauda Yabo
Yiming Liu
Siting Li
Mengduo Zhang
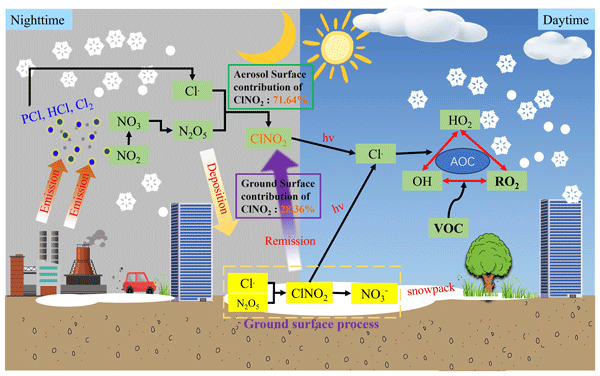
Snow with high albedo enhances atmospheric photochemical reactions, influencing key oxidative processes. Nitryl chloride (ClNO2), as a strong oxidizing species, is generated by the heterogeneous reaction between dinitrogen pentoxide (N2O5) and chloride adsorbed on aerosol and the ground surfaces. After sunrise, the photolysis of ClNO2 rapidly releases highly reactive chlorine radicals (Cl•), which contributes to the formation of secondary pollutants. However, the pollution mechanisms in high-latitude, snow-covered regions associated with increased chlorine emissions remain unclear. In this study, we employed the WRF-CAMx model (Weather Research and Forecasting Model-Comprehensive Air Quality Model with extensions) with a modified chemical mechanism (CB6r2h_lts, Carbon Bond 6 revision 2 with heterogeneous chemistry for low-temperature and snow-covered conditions) that incorporated heterogeneous N2O5 reactions and ClNO2 photolysis on ground surfaces to assess their impact on regional atmosphere under snow-covered conditions in Northeast China. Our findings reveal that under snow-covered conditions, the YU20 aerosol scheme (from study by Yu et al., 2020) outperforms the BT09 scheme (from study by Bertram and Thornton, 2009) in simulating N2O5 and ClNO2 concentrations within the CAMx model. Incorporating anthropogenic chlorine emissions and ground surface chemistry significantly improved model performance for ClNO2, reducing the mean bias (MB) from −105.78 to 2.66 pptv and increasing the index of agreement (IOA) from 0.39 to 0.86. These processes resulted in a maximum hourly increase of 3.65 µg m−3 in PM2.5 (relative contribution: 15.34 %) and 3.41 ppbv in MDA8 O3 (5.68 %). Notably, ground surface chemical processes were identified as the dominant source of nocturnal ClNO2, contributing approximately 28 % to nighttime accumulation across Northeast China. These findings not only highlight the pivotal role of chlorine chemistry in atmospheric processes under snow-covered conditions, but also provide crucial support for the refinement of the mechanisms governing the flux exchange of chemical substances between the atmosphere and the cryosphere.
- Article
(10717 KB) - Full-text XML
-
Supplement
(2918 KB) - BibTeX
- EndNote


Reactive nitrogen and chlorine atoms are prominent active gases in the atmosphere, influencing the budget of the atmospheric oxidizing capacity (AOC) (Yang et al., 2022; Sun et al.,2026). N2O5 serves as a key species in nocturnal chemical reactions within the troposphere. It undergoes heterogeneous reactions with chlorine-containing aerosols and the surfaces of various media (vegetation, soil, snow, and buildings, etc.) to form nitryl chloride (ClNO2) (Wang et al., 2017, 2020; Jeong et al., 2023). Photolysis of ClNO2 in the atmosphere produces highly reactive chlorine atoms (Cl) which react with alkanes at rates approximately two orders of magnitude faster than hydroxyl radicals (OH) (Jeong et al., 2023). Therefore, accurately quantifying the impact of N2O5 absorption coefficient (γ(N2O5)) and ClNO2 yield (ϕ(ClNO2)) at different interfaces is crucial for clarifying the contribution of ClNO2 to pollutants formation.
The γ(N2O5) represents the net probability of N2O5 undergoing irreversible uptake by an aerosol surface upon collision. Accurately quantifying γ(N2O5) values under varying environmental conditions remains challenging. This parameter demonstrably fluctuates in response to changes in nitrate concentration, liquid moisture content, chloride abundance, and organic matter content (Mentel et al.,1999; Thornton and Abbatt, 2005; Bertram and Thornton, 2009; Mielke et al., 2013; Gaston et al., 2014; McDuffie et al., 2018b; Tham et al., 2018; Yu et al., 2020).
Prominent among existing parameterizations is that of Bertram and Thornton (2009), who proposed a method for calculating the uptake coefficient of N2O5 on particulate matter surfaces (Reactions R1–R4) and the production yield of ClNO2 (ϕ(ClNO2)) from environmental chamber experiments. This framework has been implemented in numerous regional air quality models (Dai et al., 2020; Li et al., 2016; Yu et al., 2020). However, field-based determinations consistently yield lower values than laboratory-derived estimates. Yu et al. (2020) synthesized observational data from multiple regions across China to refine γ(N2O5) estimates, demonstrating that laboratory-based parameterizations systematically overestimate this coefficient when compared against ambient measurements. Subsequent field investigations in North China confirmed that the suppression of γ(N2O5) is mainly driven by reduced aerosol liquid water content (ALWC), high particulate nitrate (PNO3), and particle morphological characteristics (Wang et al., 2020). This finding offers a mechanistic explanation for the discrepancies between model simulations and ambient observations.
In Reactions (R1)–(R4), (g), (aq), and (l) denote the gas phase, aqueous phase, and liquid phase, respectively. However, compared to aerosols, research on the heterogeneous hydrolysis process of N2O5 on snowpack remains limited (George et al., 1994; Hanson and Ravishankara, 1991; Lopez-Hilfiker et al., 2012; McNamara et al., 2021). Field observations have confirmed that ice and snow surfaces in the nighttime boundary layer of high-latitude cold regions catalyze the heterogeneous hydrolysis of N2O5, leading to ClNO2 production (Apodaca et al., 2008; Huff et al., 2011; Wang et al., 2020). An upward net flux of ClNO2 was observed in near-surface snowpack regions, suggesting that saline snowpack may be a source of ClNO2 (McNamara et al., 2021).
From the perspective of snowpack modeling, accurately quantifying the N2O5 adsorption coefficient and the ϕ(ClNO2) on the snowpack, and coupling them into a one-dimensional numerical model, can provide valuable insights into the contribution of surface snow to this process (McNamara et al., 2020; Wang et al., 2020; Kulju et al., 2022; Jeong et al., 2023). In urban areas, winter snowpack can contribute up to 60 % of near-surface ClNO2, according to one-dimensional numerical models (Jeong et al., 2023). However, one-dimensional models have limitations in representing the complexity of air-snow exchanges. In contrast, our use of a three-dimensional air quality model, combined with dynamic calculations of surface chemical processes, allows for a more accurate representation of the crucial bidirectional flux exchange between the atmosphere and snow cover.
Northeast China experiences a long period of snow cover in winter, and the heating season lasts up to half a year. Large-scale coal burning has significantly increased chlorine emissions in the atmosphere (Liu et al., 2018; Li et al., 2024). These chlorides adsorb onto particulate matter surfaces, some of which are deposited onto snow, where they undergo heterogeneous reactions with N2O5 to produce ClNO2 (McNamara et al., 2019; Wang et al., 2019; Jeong et al., 2023). These conditions establish the region as an ideal setting for investigating chlorine chemistry fluxes and for performing numerical simulations of air-snow interactions. In this study, we modified the WRF-CAMx model to include a parameterization for N2O5 hydrolysis on aerosols and a coupled (3D) surface chemistry module to analyze the impacts on regional particulate matter and ozone formations under snow-cover condition in Northeast China.
2.1 Field Observations
Field observations of N2O5, ClNO2 and many other chemical species were conducted at the monitoring station of Northeast Institute of Geography and Agroecology (NIGA), Chinese Academy of Sciences from 23 February to 3 March 2024 in Northeast China. The DLS site is in the experimental farmland in the northern suburbs of Changchun City (Fig. 1), with coordinates (44.0° N, 125.4° E). During the observation period, the campaign was characterized by recurrent snowfall events that maintained a continuous snow cover at the surface. N2O5 and ClNO2 were measured using an iodide-adduct chemical ionization mass spectrometer (CIMS).
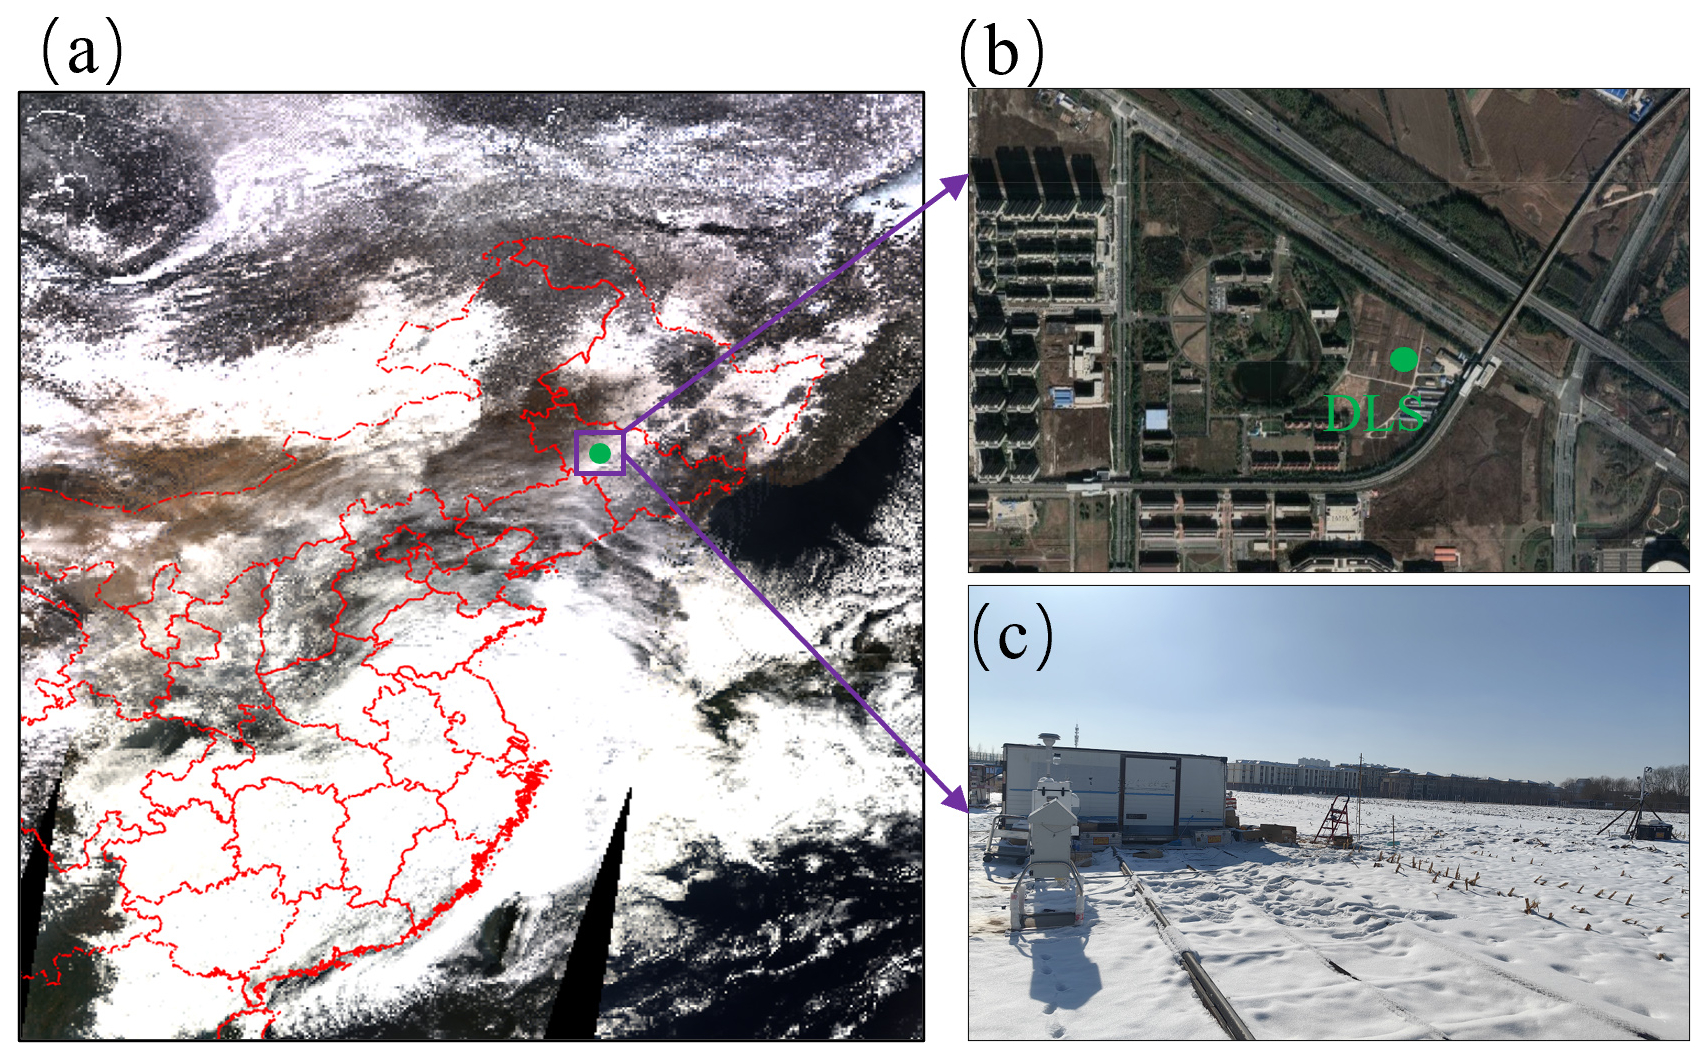
Figure 1Sampling site (DLS) information: (a) Satellite-derived snow cover image (data source: National Snow and Ice Data Center, https://nsidc.org/data, last access: 17 September 2026). (b) Traffic conditions around the sampling site at the Northeast Institute of Geography and Agroecology, Chinese Academy of Sciences (NIGA), Jilin Province, China (Imagery © 2026 Airbus, Map data © 2026 Google, https://earth.google.com/, last access: 17 September 2026). (c) The observation station surrounded by snow-covered farmland.
2.2 WRF-CAMx Model and Configuration
The CAMx v7.1 model, incorporating the newly developed low-temperature halogen chemical mechanism (CB6r2h_lts), was employed to simulate the spatio-temporal distributions of atmospheric pollutants (Ramboll, 2021; Emery et al., 2024). The modeling domain was configured to cover the whole Northeast region of China, consisting of 76 × 78 grid cells with a horizontal resolution of 27 km × 27 km and 29 vertical layers, with the model top located at 17 083 m (50 hPa). The model simulation period with a 13 d spin-up was set from 10 February to 2 March 2024. Boundary and initial conditions were derived from the Whole Atmosphere Community Climate Model (WACCM, https://www2.acom.ucar.edu/gcm/waccm, last access: 17 September 2026). Two anthropogenic emission inventories were employed: the Multi-resolution Emission Inventory for China (MEIC; http://meicmodel.org.cn/, last access: 17 September 2026), which was processed to represent the Northeastern China region, and the Emissions Database for Global Atmospheric Research (EDGAR; https://edgar.jrc.ec.europa.eu/, last access: 17 September 2026), used for areas outside China. The anthropogenic chlorine emissions inventory for China (ACEIC) compiled by Sun Yat-sen university was adopted (Li et al., 2024). Chlorine emissions from anthropogenic sources are set to zero in the emission inventory (Table S1 in the Supplement). Meteorological input data for the CAMx model were obtained fromWRFV3.7.1, which utilizes a data nudging method (guv, gt, gq = 0.0001 s−1). More detailed configuration of WRF-CAMx is listed in Table S2.
2.3 Localization of N2O5 adsorption reaction coefficients and ClNO2 productionon aerosol surfaces
The γ(N2O5) is influenced by the particulate nitrate (PNO3), organic matter, Cl−, and aerosol liquid water content (ALWC) (Reactions R5–R7). Currently, the heterogeneous reaction parameters of N2O5 on aerosols in most air quality models (such as CAMx, CMAQ, etc.) are based on laboratory experiments (Bertram and Thornton, 2009). However, based on field observations, Yu et al. (2020) directly measured γN2O5 in ambient aerosols from two rural areas in northern China and Nanjing using an in-situ aerosol flow tube system. The parameters of aerosol surfaces in the above two studies (BT09 and YU20) are shown in Table S3.
Where represents the volume-to-surface-area ratio of particles (units: m), serves as a key morphological parameter alongside KH, the dimensionless Henry's law constant (KH= [N2O5]aq [N2O5]g). To account for H2O limitation in nitrate-free particles, the rate coefficient for R2f is treated as a function of liquid water content and redefined as k′2f in Reaction (R6). The yield of ClNO2, ϕ(ClNO2), is given by Reaction (R7). The fitted constants k3/k2b, k4/k2b, k3/k4 are showed (Table S2).
2.4 Coupling Heterogeneous Chemical Processes of N2O5 on the ground Surface
The surface chemistry module is activated to simulate gas flux exchange between the atmosphere and the ground, accounting for the chemical reactions of N2O5 on surfaces such as snow, vegetation, buildings and soil (Karamchandani et al., 2015). However, the parameter in the surface chemistry module is calculated as a one-dimensional plane, leading to an underestimation of the results of the model. To address this, we revised the surface chemistry module to dynamically calculate the parameter based on 3D surfaces within each grid cell. To support this revision, we gathered data on surface area of buildings in Northeast China through field investigation and satellite retrieval. The detailed description of revising the surface chemistry module is shown in Fig. S1.
N2O5 deposited on snowpack surfaces undergoes simultaneous reactions with hydrochloric acid and water (Table 1), similar to the chemical reactions on aerosol surfaces. The calculation processes for γ(N2O5) and ϕ(ClNO2) on snow grains, which depend on the temperature of the snow, are presented in Text S1 in the Supplement. Under low-temperature conditions, ϕ(ClNO2) is relatively high, reaching values over 0.80. At a temperature close to approximately 273 K (0 °C), both the γ(N2O5) and ϕ(ClNO2) showed a decreasing trend toward zero (Fig. S2).
Table 1Revised heterogeneous N2O5 reactions in CAMx model.
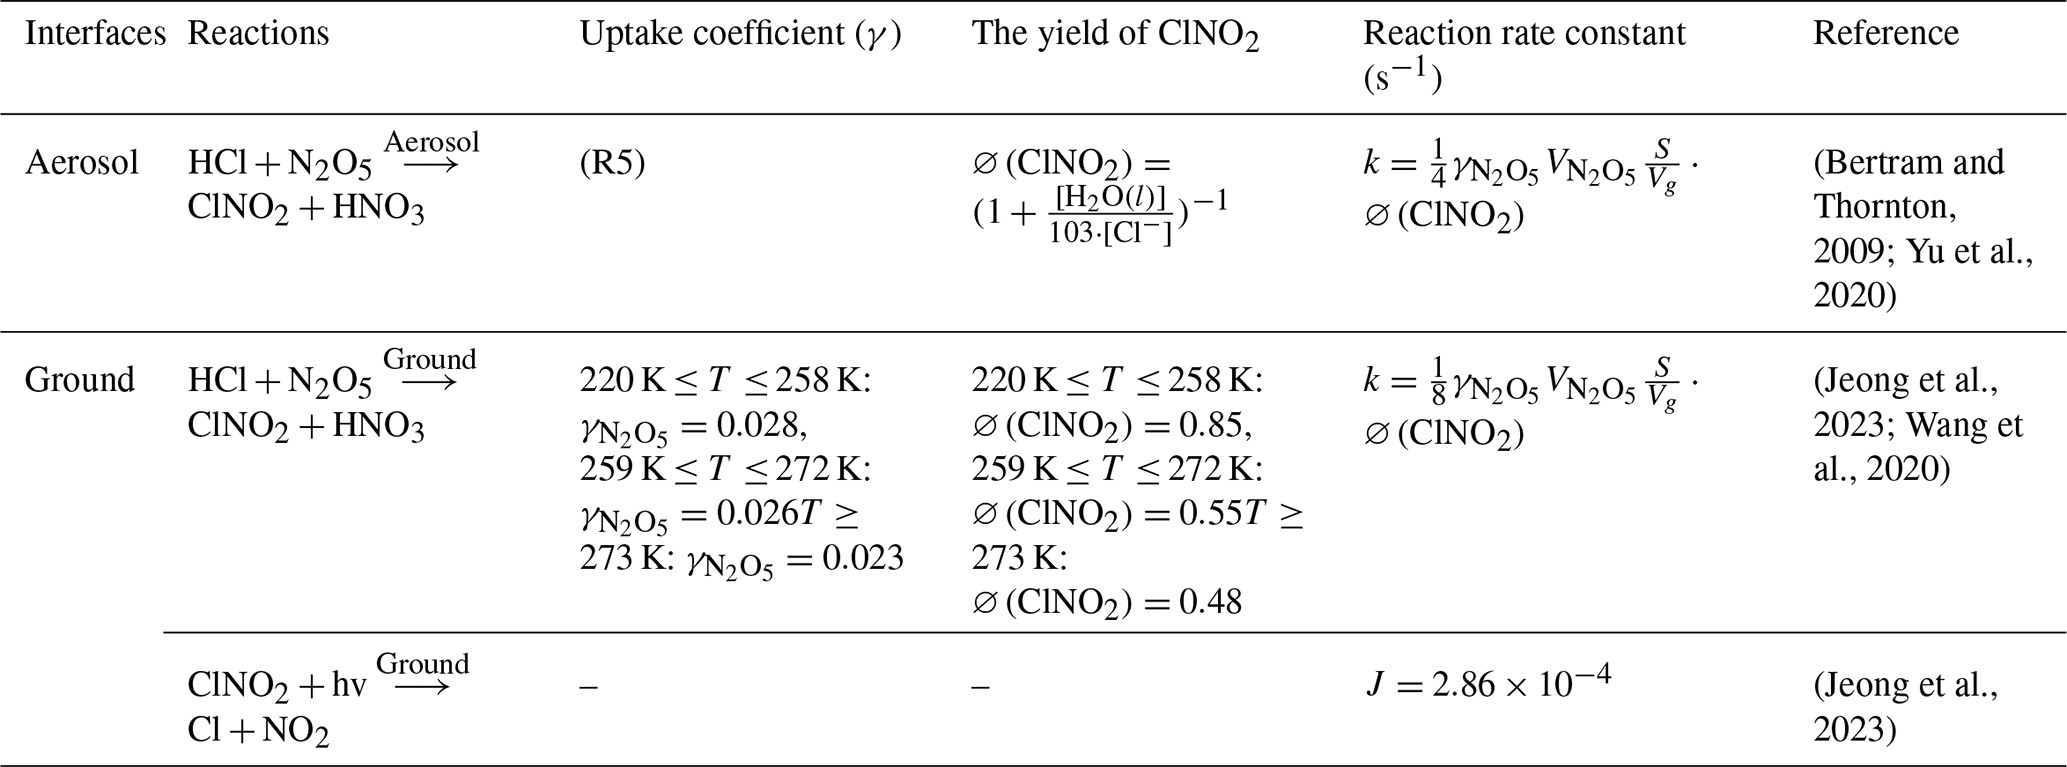
T represents the surface temperature; K is the reaction rate constant (s−1); J indicates the photolysis rate constant (s−1). ∅ (ClNO2) denotes the yield, without units.
2.5 Scenarios setting
This study investigates the impact of various aerosol schemes, ground chemistry models, and anthropogenic chlorine emissions through six scenarios: B1, Y0, Y1, Y2, Y3, and Y4 (Table 2).
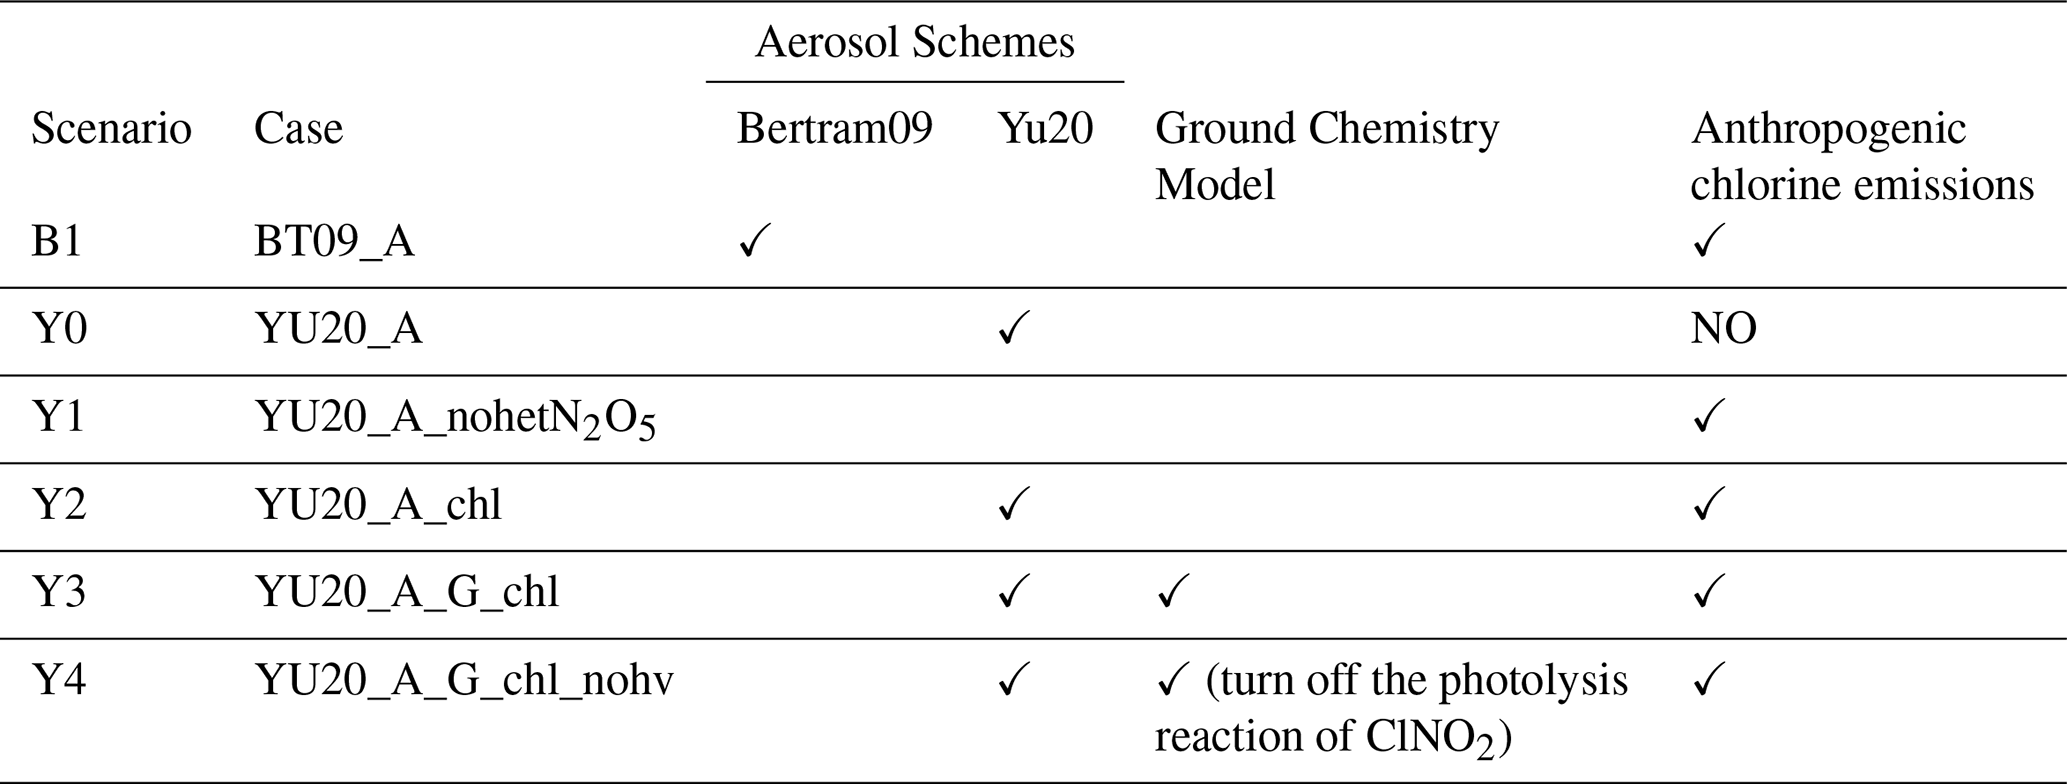
Sensitivity analyses were conducted among different simulation scenarios, with the specific configurations detailed as follows: Y3–Y0: The combined effects of anthropogenic chlorine and heterogeneous chemistry of N2O5; Y2–Y0: The impact of anthropogenic chlorine emissions; Y2–Y1: The contribution of N2O5 heterogeneous chemistry on aerosol surfaces; Y3–Y2: The sensitivity analysis of ground surfaces chemical processes; Y4–Y3: The contribution of ClNO2 surface photolysis.
3.1 Overview of Wintertime Observations
The time series of N2O5 and ClNO2 concentrations is depicted in the Fig. 2 during the observation period. N2O5 concentrations ranged from 0.76 to 424.15 pptv, with an average of 58.73 ± 83.37 pptv. ClNO2 exhibited an average concentration of 102.64 ± 146.43 pptv with a peak value of 902.45 pptv on 27 February. The peaks of N2O5 and ClNO2 exhibit synchronicity at certain time points during T1, T2, T3, T5, and T6. This phenomenon is attributed to the role of N2O5 as the primary precursor of ClNO2. In winter, the northeastern region of China exhibits abundant chloride-containing aerosols, providing a non-limiting reservoir of reactive chloride. Consequently, the formation of ClNO2 is governed predominantly by the availability of N2O5 rather than by chloride supply. This is evidenced by the observation that during T4, when N2O5 mixing ratios remained below ∼120 pptv, no discernible ClNO2 peaks were detected, despite the persistent presence of chloride species. The positive correlation between N2O5 and ClNO2 further supports that the latter's production is precursor-limited under the prevailing winter conditions. Figure 2b presents the average daily variation patterns of these two species, with a general accumulation at night and rapid depletion during the day, and the similar temporal pattern over snow-covered areas has been widely reported in previous studies (Xia et al., 2020; Kulju et al., 2022; Jeong et al., 2023; Li et al., 2025). The average daily values of N2O5 and ClNO2 were 49.21 ± 37.51 and 56.51 ± 30.70 pptv, respectively. ClNO2 concentrations exhibited a pronounced diurnal cycle, accumulating at night and reaching a maximum of 113.45 pptv around 07:00 (UTC+8). Following sunrise, rapid photolysis of ClNO2 led to a sharp decline in its concentrations during daylight hours, accompanied by the release of chlorine atoms (Thornton et al., 2010; Jeong et al., 2023).
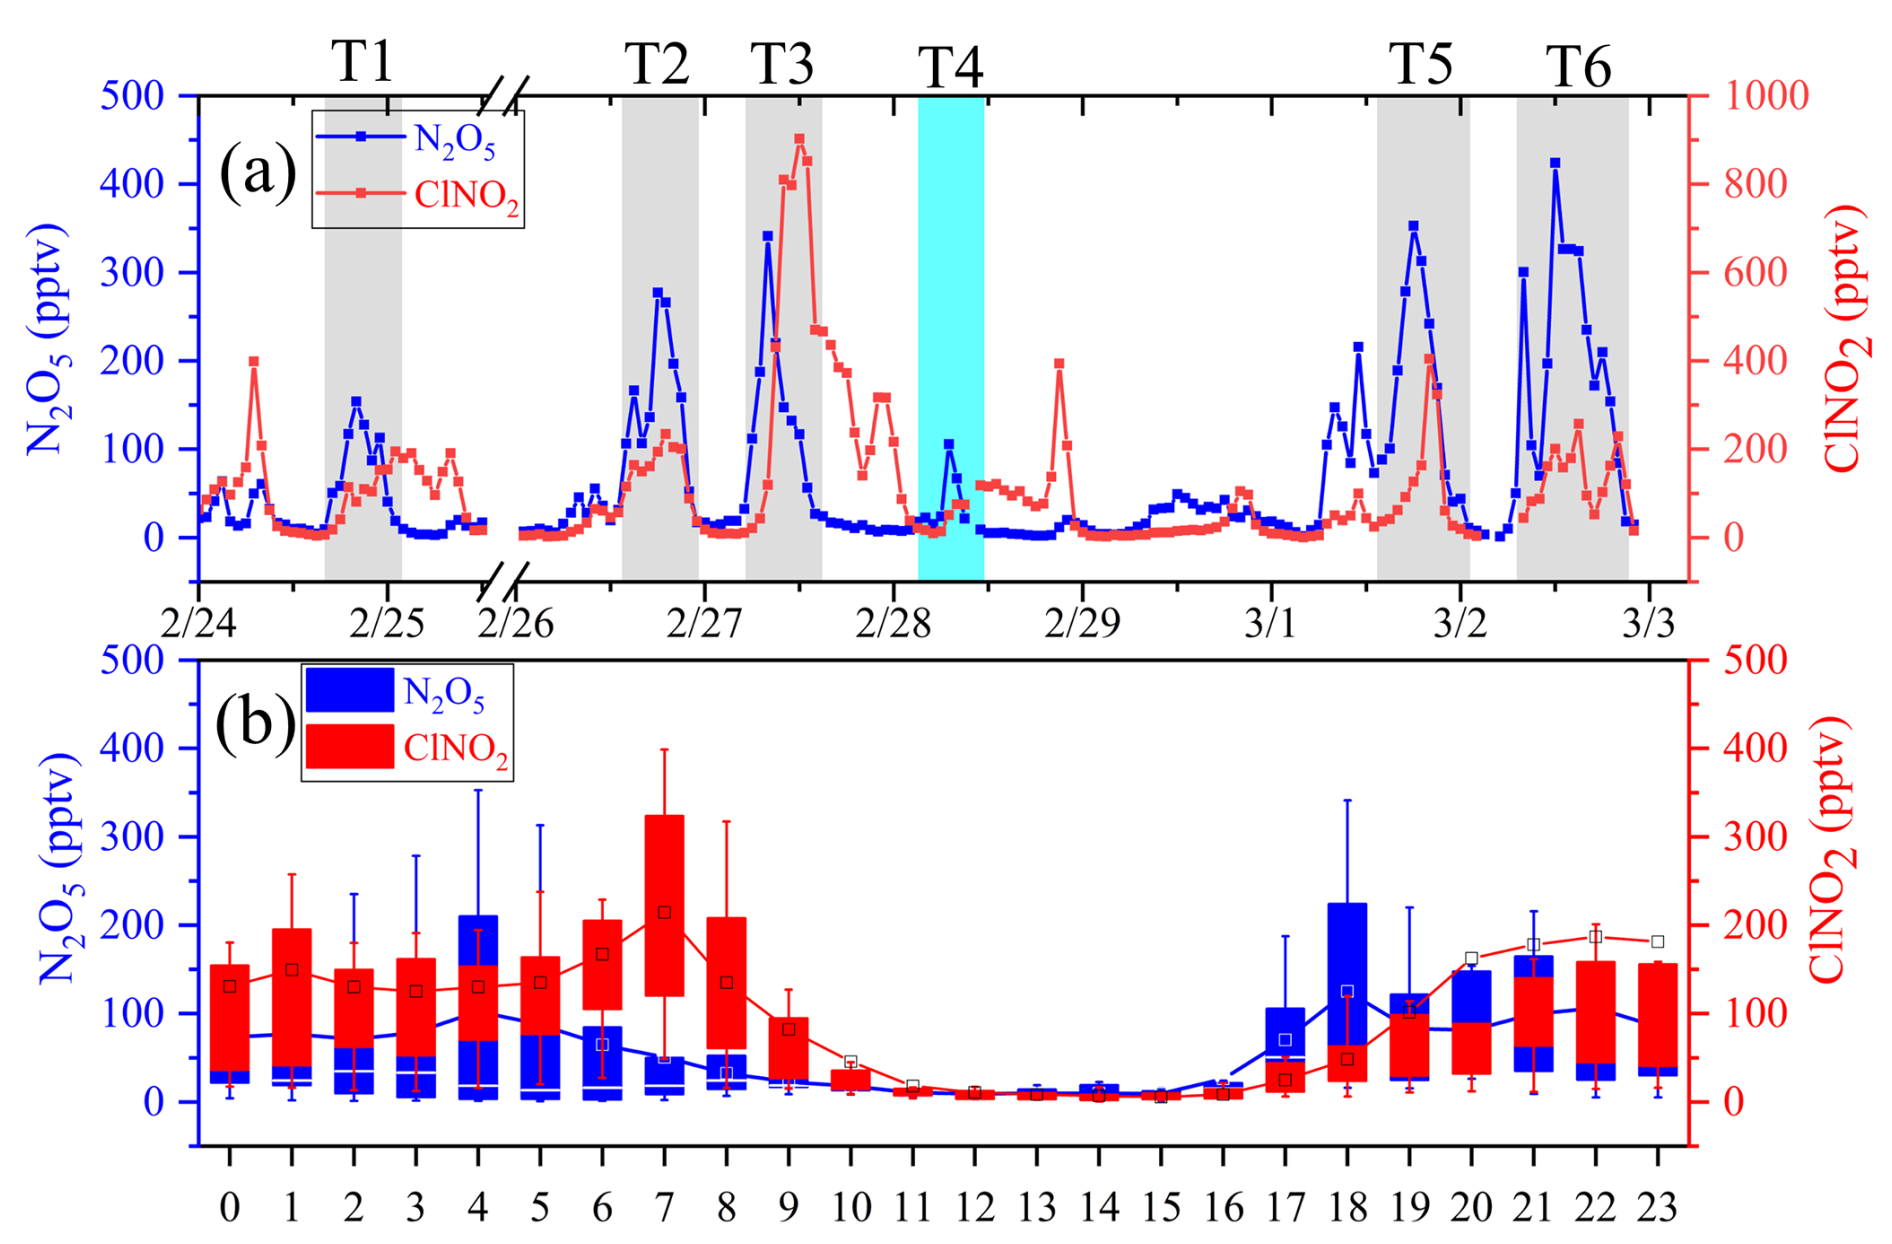
Figure 2Field observations of N2O5 and ClNO2 at the DLS station from 23 February to 3 March 2024. (a) Time series. The gray shaded periods (T1, T2, T3, T5, and T6) represent episodes with concurrent elevated N2O5 and CINO2 peaks, while the cyan shaded period (T4) indicates an episode where no such concurrent peak was observed. The data gap between 14:00 (UTC+8) on 25 February and 10:00 (UTC+8) on 26 February is due to instrument maintenance, during which no measurements were available. (b) Diurnal variation.
3.2 Model performance of the updated heterogeneous N2O5 chemistry on aerosol/ground surfaces
3.2.1 Comparative analysis of aerosol schemes on heterogeneous N2O5 reaction
This study compared the performance of the BT09 and YU20 aerosol schemes within the CAMx model during snow-covered periods (Fig. S3). The YU20 scheme demonstrated significant improvements in the statistical indicators for N2O5 and ClNO2 compared to the BT09 scheme (Table S4). For N2O5, the mean bias (MB) decreased from 114.62 to 69.66, the normalized mean bias (NMB) from 1.92 to 1.16, and the root mean square error (RMSE) from 201.39 to 139.03, while the IOA increased from 0.49 to 0.61. Similarly, for ClNO2, the MB decreased from −29.28 to −16.08, the NMB from −0.28 to −0.16, the RMSE from 100.66 to 99.80, with the index of agreement (IOA) from 0.81 to 0.84. The YU20 scheme is a set of parameter values derived from local observation data in China, making it more representative of the evolution of atmospheric chemical species in the region. Given the above enhancements, the YU20 and BT09 schemes were selected for snow-covered and snow-free regions, respectively, in the subsequent scenario simulations.
The parameters γ(N2O5) and ϕ(ClNO2) are critical parameters for understanding N2O5 heterogeneous chemistry on aerosol surfaces. The BT09 scheme is believed to overestimate the γ(N2O5) (Wagner et al., 2013) and ϕ(ClNO2) (McDuffie et al., 2018a). Yang et al. (2022) further demonstrated that incorporating anthropogenic chlorine and biomass burning emissions into the YU20 parameterization effectively enhanced γ(N2O5) values, emphasizing the advantage of localized schemes for improving model accuracy (Yang et al., 2022). However, Xie et al. (2025) found that the BT09 scheme outperformed YU20 at the Wangdu station in Hebei province of China under snow-free conditions using the WRF-CAMx model. Similarly, Dai et al. (2020) evaluated the emission of PCl from the South China Sea and also found that the BT09 aerosol scheme better captured the peak value of ClNO2 compared to the YU20 scheme.
In contrast, our study found that YU20 performed better than BT09 during snow-covered conditions. This improvement can be attributed to the significant impact of atmospheric humidity changes under snow cover conditions, along with an increase in anthropogenic chlorine emissions (e.g., Cl2, PCI, HCI, and HOCI) during winter in high-latitude regions. These factors together drove changes in species concentrations (chloride ions, and nitrate ions) on aerosol surfaces during the observation period, directly affecting the γ(N2O5) and ϕ(ClNO2) values in the N2O5 aerosol schemes (BT09 or YU20).
3.2.2 Comparison of model simulations with observation
A comparison of atmospheric N2O5 and ClNO2 concentrations before and after model modification is presented in Fig. 3. In the Y0 scenario, N2O5 concentrations averaged 141.81 ± 148.62 pptv, with a peak value of 540.37 pptv. In the Y3 scenario with modified modeling, N2O5 concentrations ranged from 0.0 to 513.03 pptv, with an average value of 33.58 ± 143.92 pptv. While the MB of N2O5 decreased from 64.10 to 56.53 pptv, the NMB from 0.98 % to 0.87 %, and the RMSE from 123.17 to 118.39 pptv, the IOA remained at 0.66 (Table 3). This suggests no significant improvement in model accuracy, likely due to the relatively low re-emission rate of N2O5 deposited on the ground surface, which has a minimal impact on atmospheric N2O5 concentrations.
Table 3Statistical indicators for the simulation results of N2O5 and ClNO2 between Y0 and Y3 scenarios.
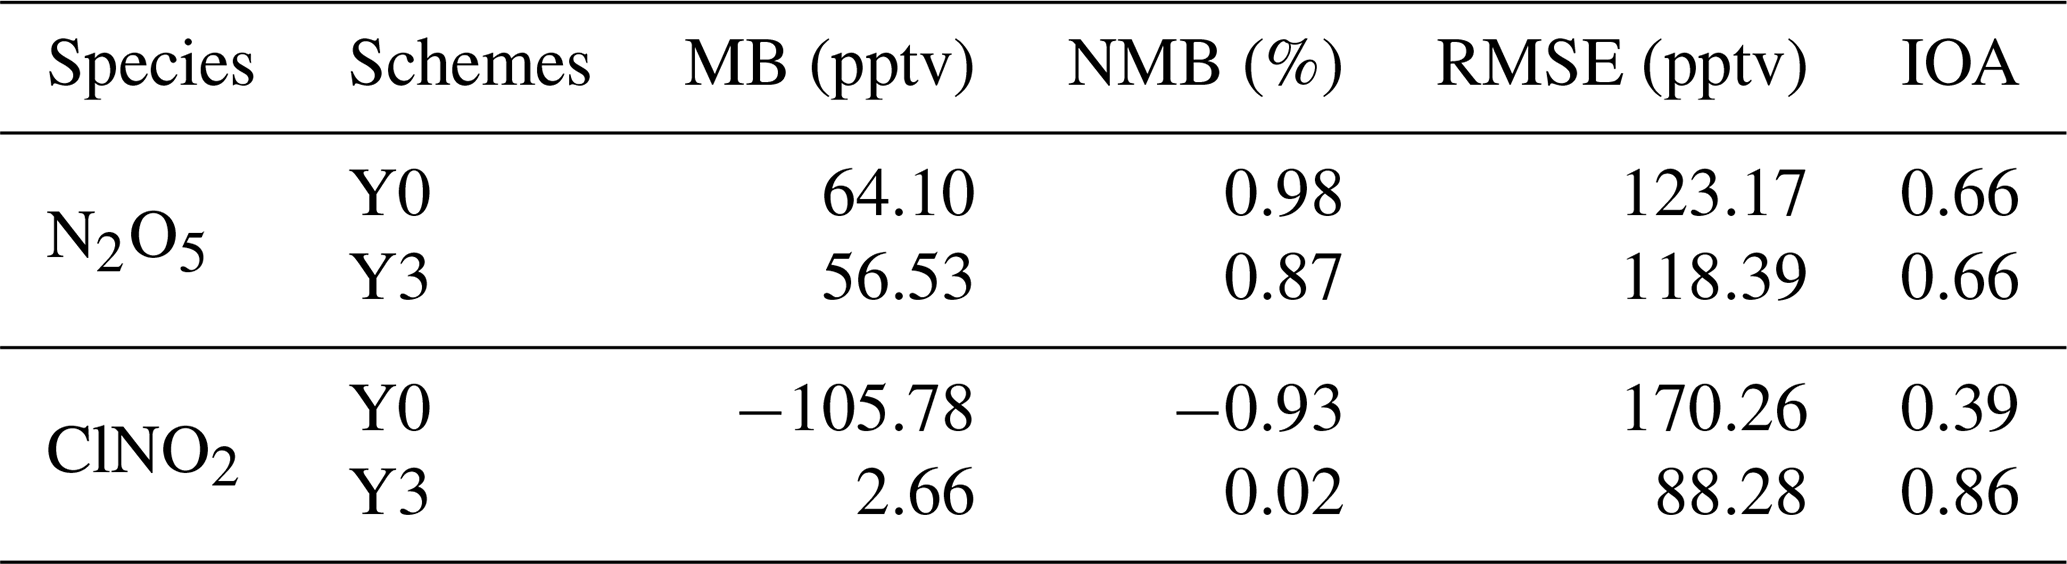
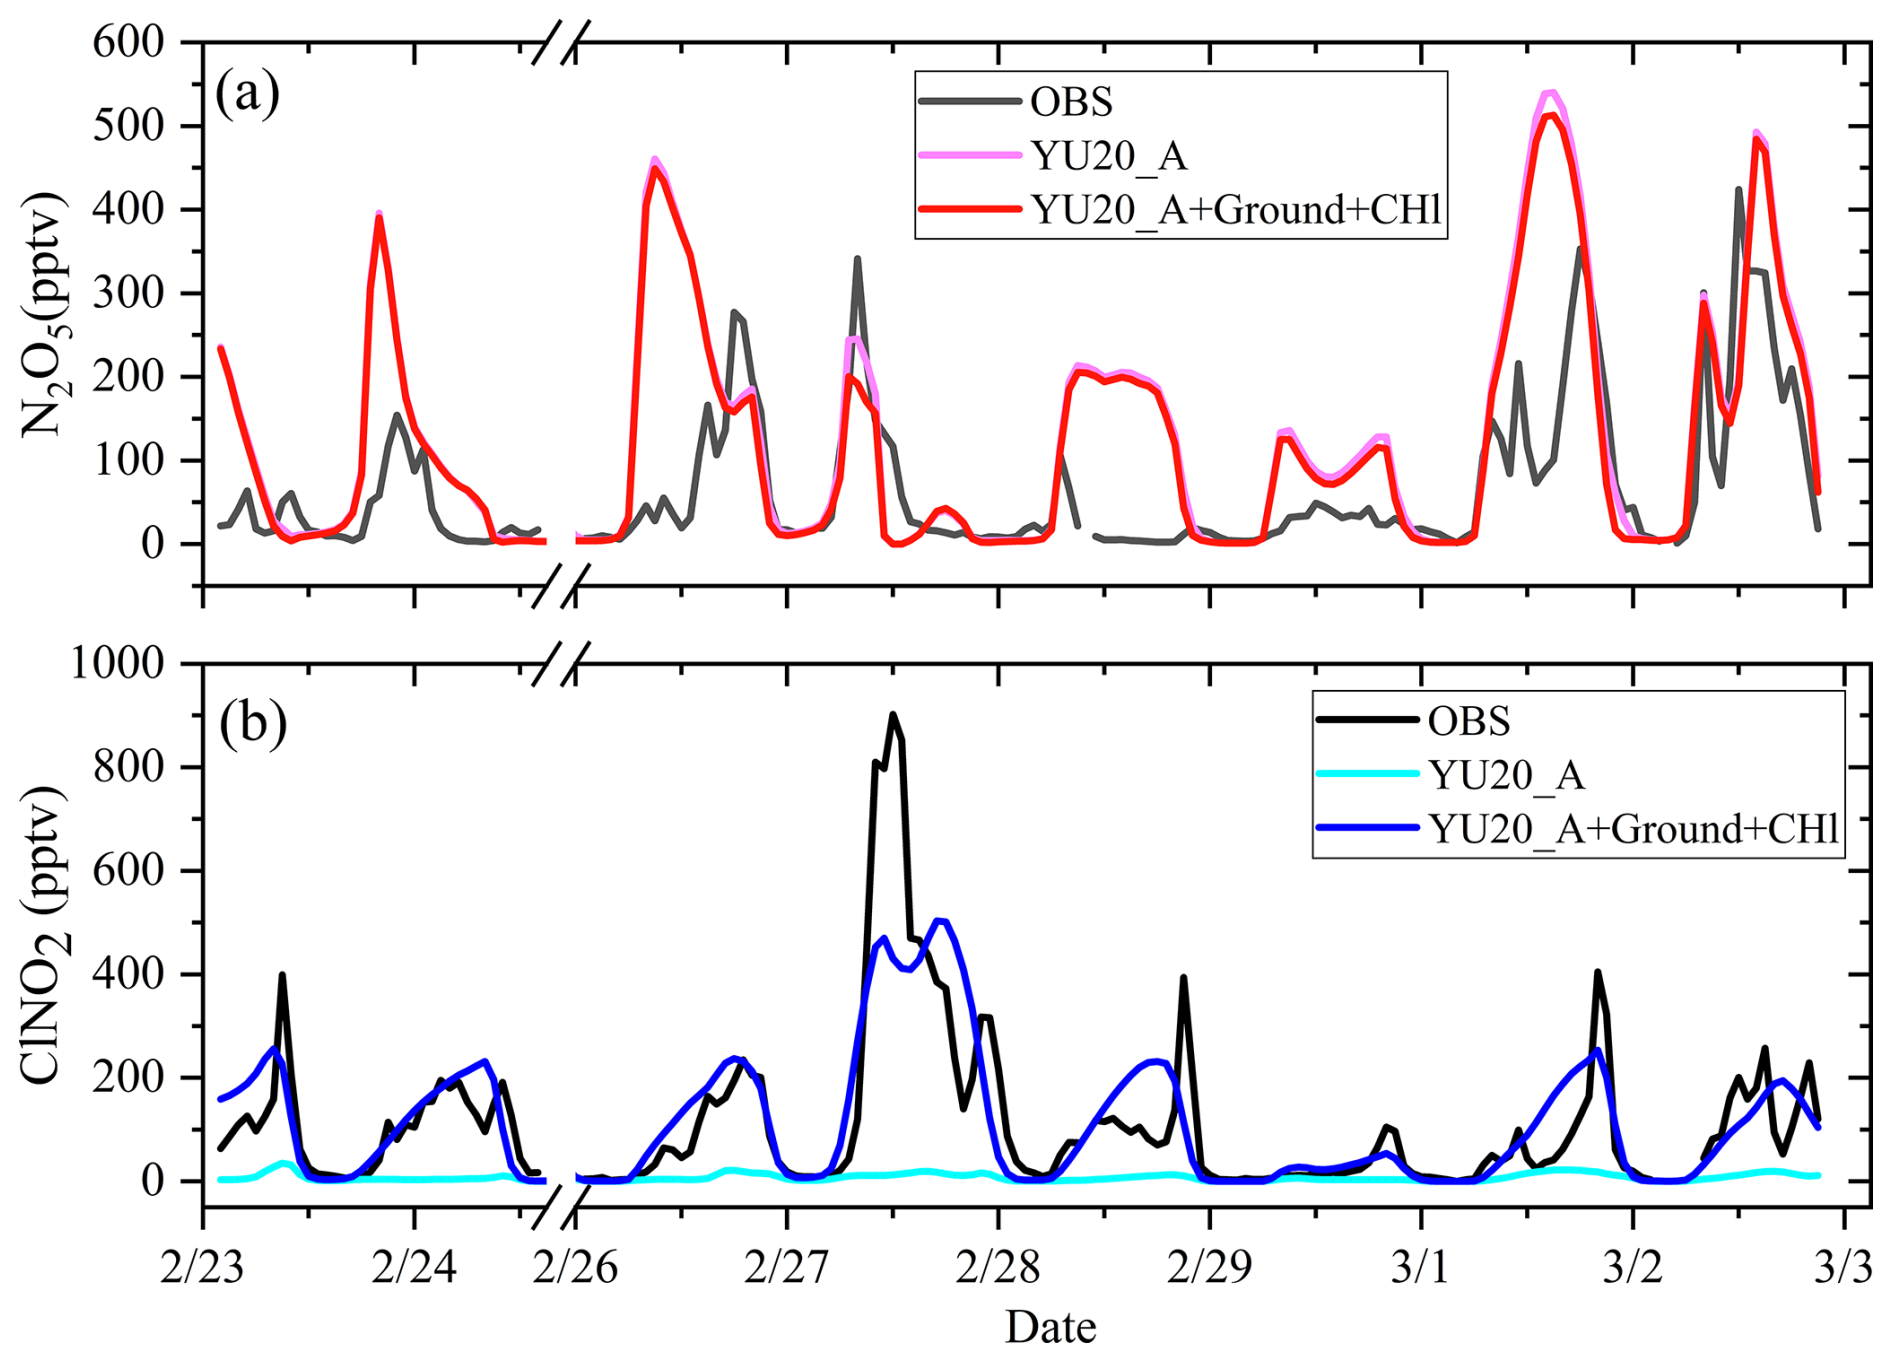
Figure 3Comparison of simulated and observed values for YU20_A (Y0) and YU20_A_G_Chl (Y3) the DLS station in Northeast China: (a) N2O5, (b) ClNO2.
In contrast, the revised model significantly improved the simulation of ClNO2, particularly in capturing peak concentrations. In Y0 scenario, the average ClNO2 concentrations is 7.73 ± 6.96 pptv with a peak value of 35.59 pptv. In contrast, the Y3 scenario showed an expanded range of 0.07 to 503.30 pptv and an increased average concentration of 110.30 ± 117.45 pptv. Additionally, the MB of ClNO2 improved from −105.78 to 2.66 pptv, the NMB increased from −0.93 % to 0.02 %, and the RMSE decreased from 170.26 to 88.28 pptv. The IOA also improved significantly, rising from 0.39 to 0.86 (Table 3). These results demonstrate that incorporating chlorine emissions and surface N2O5 chemical processes into the CAMx model substantially enhanced the simulation accuracy for ClNO2, while the impact on N2O5 remained limited. In addition, we further examine the effects of the revised model on secondary pollutants (PM2.5 and O3) at this site, which are also pronounced. For PM2.5 the MB improves from −10.56 to −1.39 µg m−3, and the IOA increases from 0.68 to 0.91; for O3, the MB decreases from 19.42 to 13.91 µg m−3, while the IOA improves from 0.72 to 0.77 (Table S5). These findings underscore that the updated parameterization not only refines ClNO2 simulation but also yields significant improvements in simulating secondary aerosol and ozone formation.
3.2.3 The Spatial impacts of chlorine emissions and chlorine chemistry
In northern regions of China, residential heating typically extends from early November through March of the following year. During this period, coal combustion releases substantial quantities of particulate chloride (PCl) and HCl into the atmosphere (Liu et al., 2018). To assess the impact of model modifications, we further examined the spatial concentration differences and ratios of PCl, HCl, N2O5, and ClNO2 between Y0 and Y3 (Fig. 4). The spatial concentration differences (e.g., Y3–Y0) are used to quantify the magnitude of changes in simulated pollutant concentrations between different scenarios, while contribution ratios (e.g., (Y3–Y0) Y3) are employed to assess the relative contributions of model modifications. For PCl and HCl, peak spatial concentrations in the Y0 scenario reached 0.43 µg m−3 and 76.96 pptv, respectively. In the Y3 scenario, these ranges increased to 0–0.97 µg m−3 for PCl and 0–77.79 pptv for HCl. The spatial differences in PCl concentrations between the Y0 and Y3 scenarios ranged from 0 to 0.59 µg m−3, with the most significant differences simulated in Heilongjiang and Liaoning provinces, where the contribution rate was approximately 72 %. Meanwhile, the spatial differences in HCl concentrations between the Y0 and Y3 scenarios ranged from 0 to 8.21 pptv with the highest contribution rate was 99.20 % in Heilongjiang province. Regarding N2O5 and ClNO2, the N2O5 concentration peaked at 310.65 pptv in the Y0 scenario, while the maximum spatial concentration increased to 343.29 pptv in the Y3 scenario. The spatial differences in N2O5 between the Y0 and Y3 scenarios ranged from −24.04 to 0.0 pptv (Fig. 4k) with a maximum contribution ratio of 44.87 %, indicating net consumption of N2O5. ClNO2 concentrations peaked at 116.82 pptv in the Y0 scenario and increased to 179.69 pptv in the Y3 scenario. Spatial differences of ClNO2 between the Y0 and Y3 scenarios ranged from 0 to 173.49 pptv (Fig. 4o) with the contribution rate of ClNO2 concentrations exceeding 90 % in most simulated regions. These findings highlight the significant impact of incorporating anthropogenic chlorine emissions and revised chlorine chemical reaction mechanisms on regional ClNO2 concentrations.
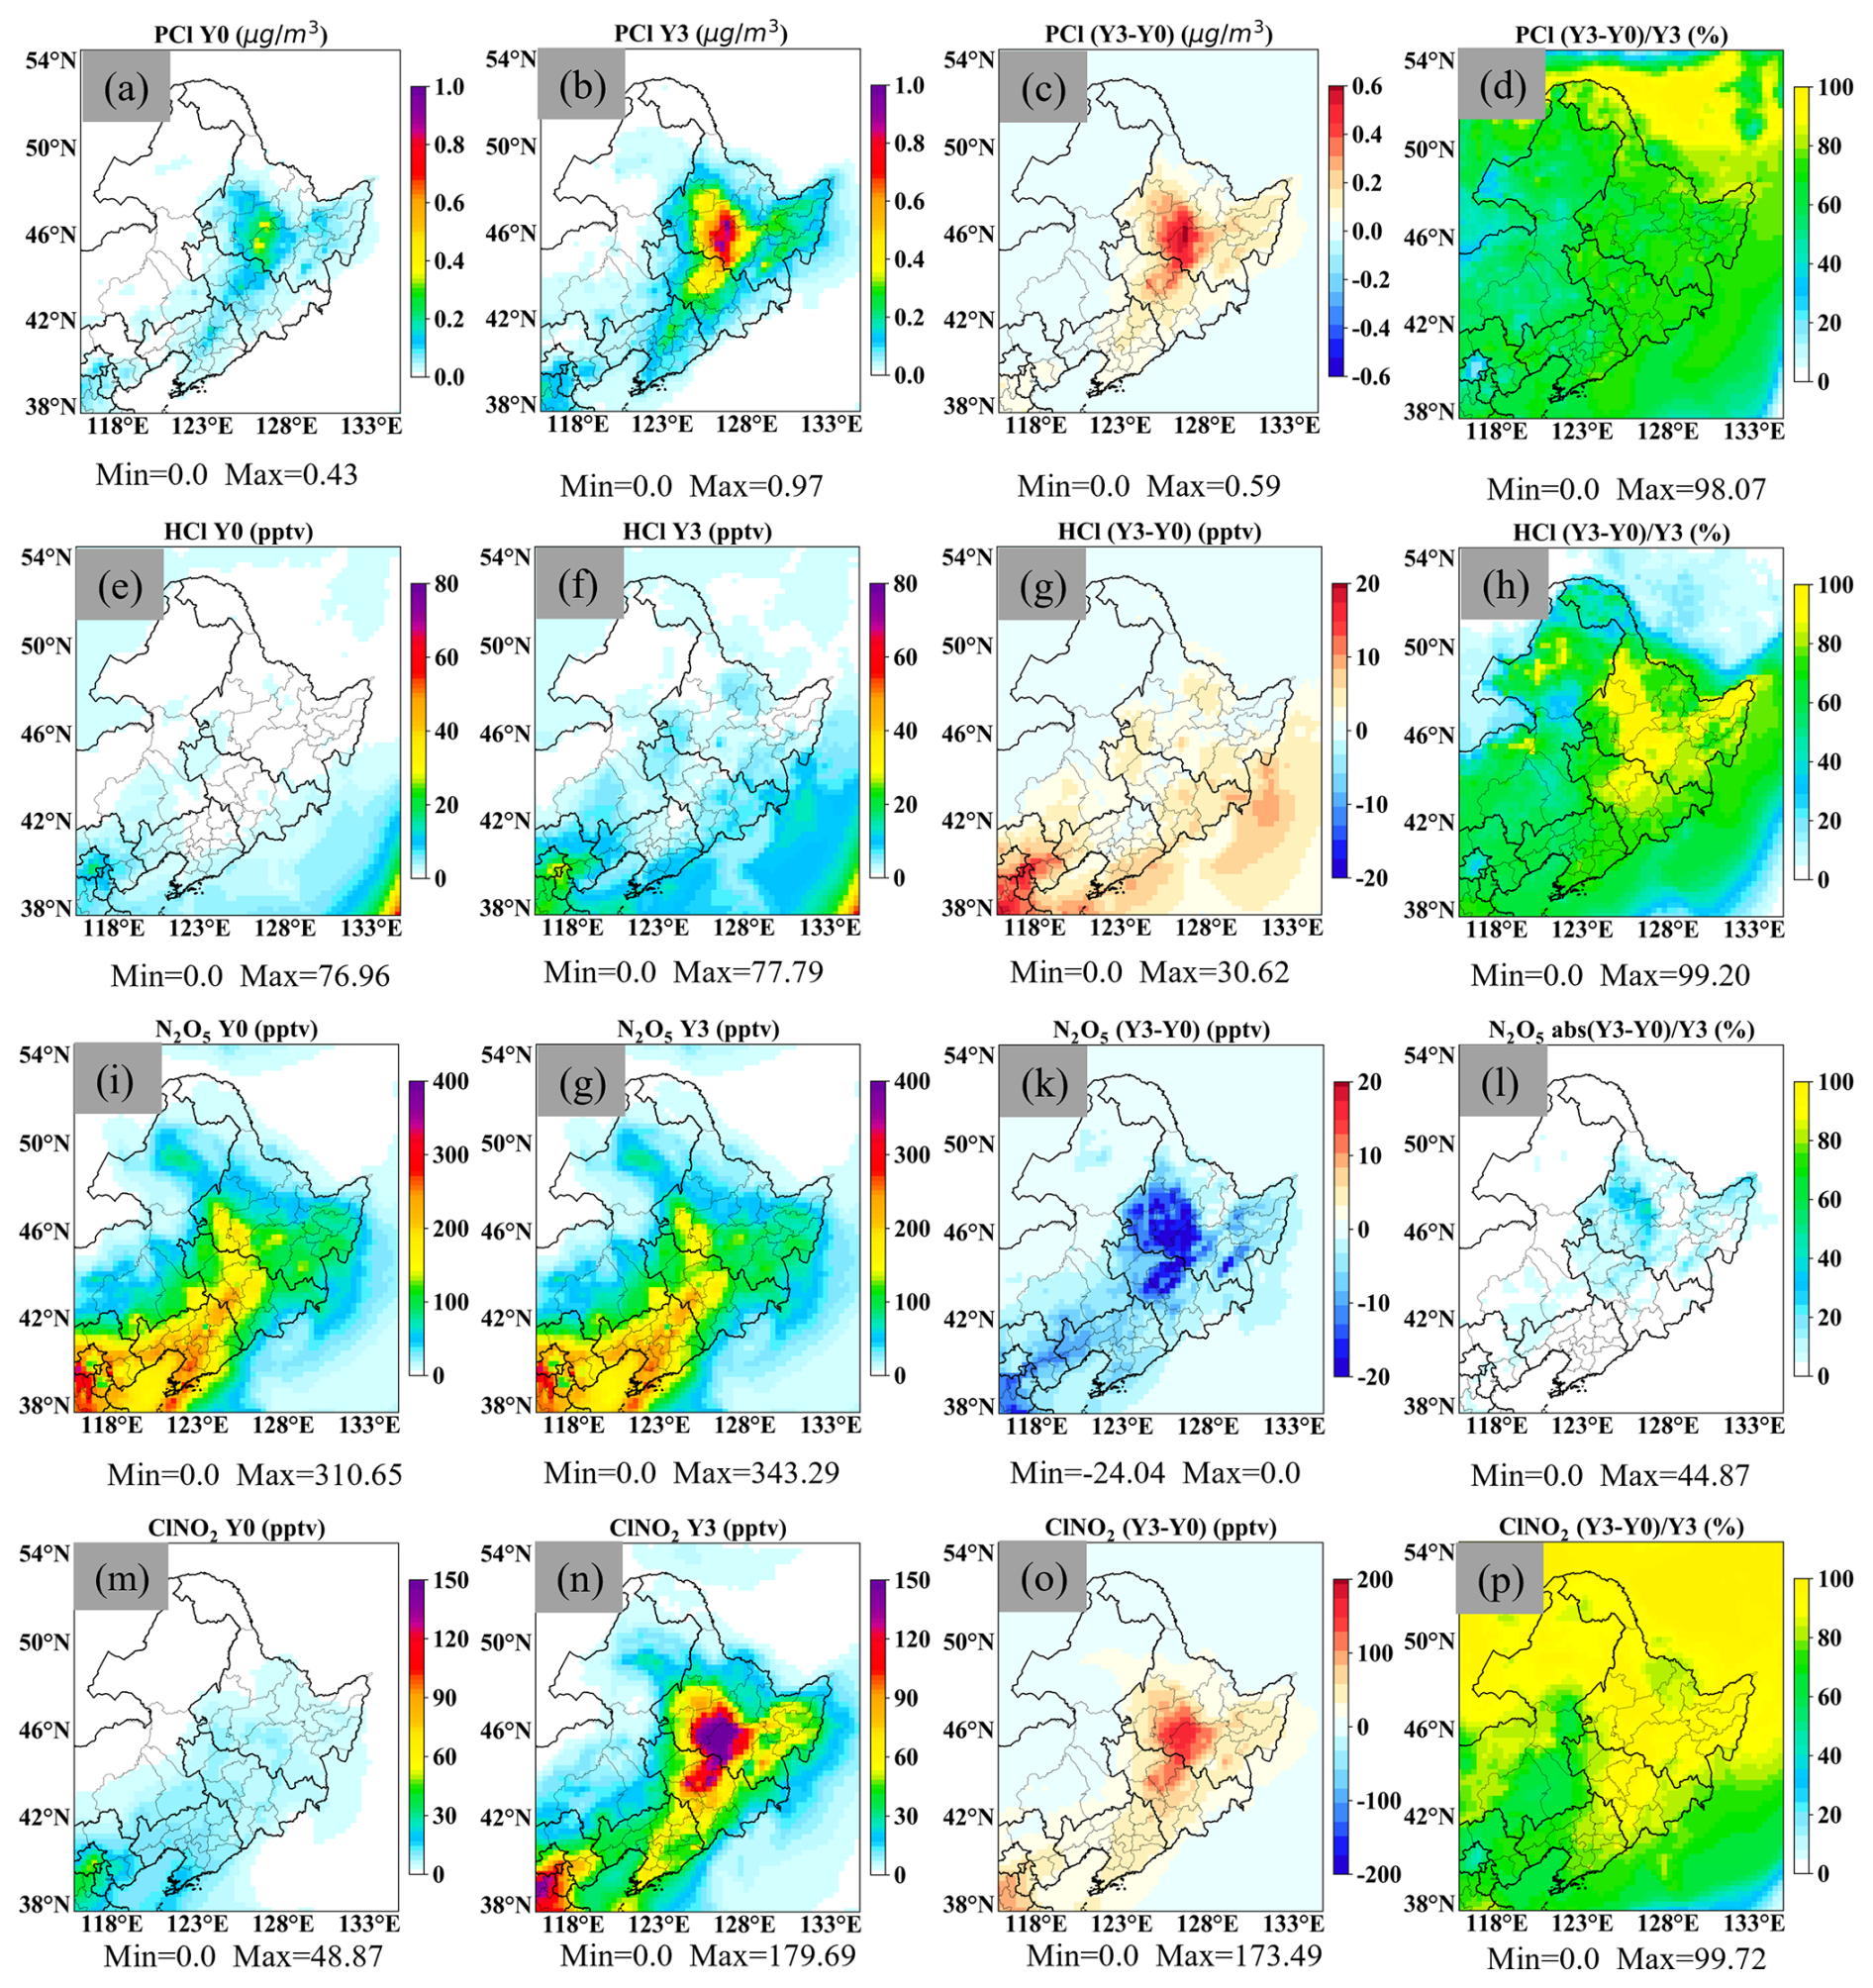
Figure 4The spatial distribution of the impact of chlorine emissions and chlorine chemical reactions on pollutants (PCl, HCl, N2O5, and ClNO2).
3.3 The relative contribution of chlorine emissions and ground surface chlorine chemistry
The comprehensive impact of anthropogenic chlorine emissions and heterogeneous chemical reactions of surface N2O5 on ClNO2 concentration had been quantitatively evaluated by comparing Y0 and Y3 scenarios. Here, we further analyzed the individual effects of chlorine emissions and surface chemical reactions separately.
3.3.1 The impact of chlorine emission on ClNO2
To isolate the contribution of anthropogenic chlorine emissions, the Y0 and Y2 scenarios were established. In the Y2 scenario, the spatial concentrations of PCl and HCl ranged from 0.0 to 0.95 µg m−3 and 0.0 to 77.60 pptv, respectively (Fig. 5b and f). The spatial differences in PCl between the Y0 and Y2 scenarios ranged from 0.0 to 0.58 µg m−3 (Fig. 5c), with an average contribution ratio of 61.02 %. Similarly, the spatial differences in HCl concentrations between the Y0 and Y2 scenarios ranged from 0 to 30.56 pptv, with the highest contribution rate of 99.11 % simulated in Heilongjiang Province, China. Notably, the peak ClNO2 concentration in the Y2 scenario reached 166.82 pptv, with a maximum difference of 151.67 pptv. In most regions of northeastern China, ClNO2 contributions exceeded 50 %.
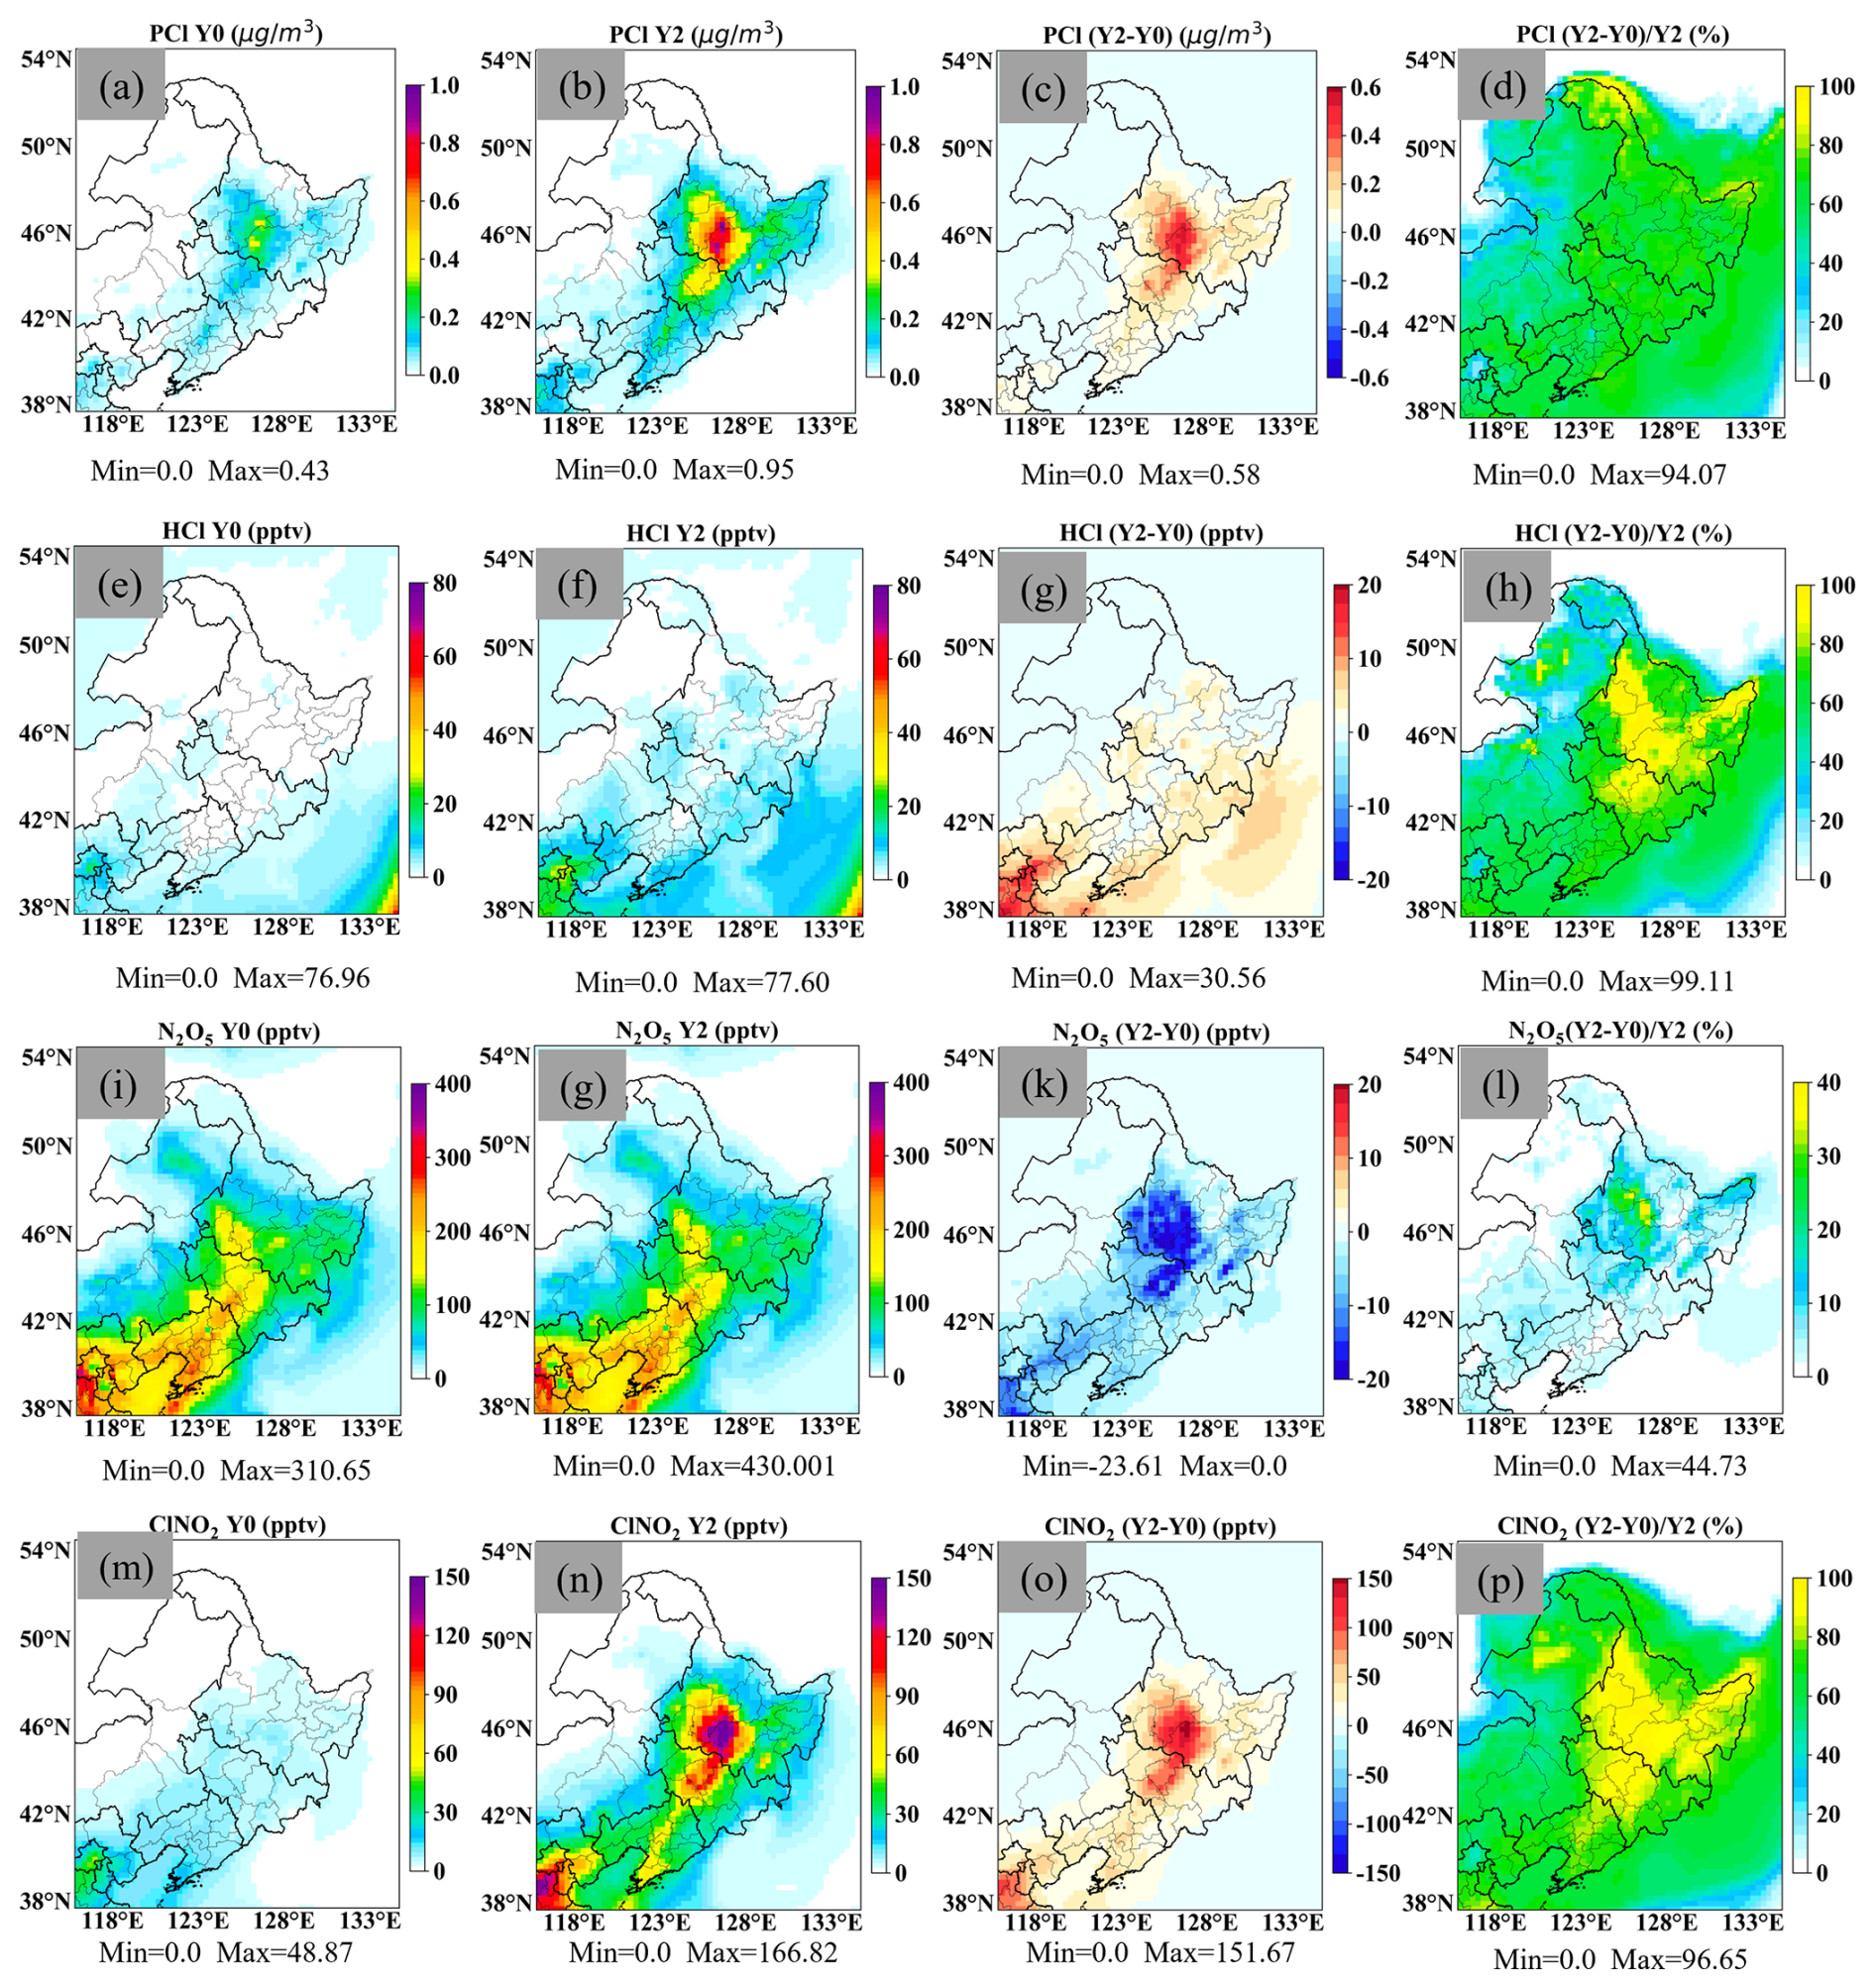
Figure 5The spatial distribution of the impact of chlorine emissions on pollutants (PCl, HCl, N2O5, and ClNO2). Y0 and Y2 denote the YU20_A and YU20_A_chl scenarios, respectively.
For snow-free conditions, Liu et al. (2018) first utilized the ACEIC chlorine emission inventory in the Community Multi-scale Air Quality (CMAQ) modeling system and found that anthropogenic chlorine emissions contributed approximately 100 pptv to ClNO2 concentrations, with a contribution range of 30 %–50 %. Similarly, Hong et al. (2020) using the CMAQ model with ACEIC inventory, further reported that the maximum contribution of chlorine emissions to ClNO2 ranged from 50 to 100 pptv in Liaoning Province, corresponding to a contribution rate of 20 %–50 %. In contrast, the simulated contribution concentration range in Jilin and Heilongjiang Provinces was only 10–50 pptv, with a corresponding contribution rate of 10 %–20 %. However, under snow-covered conditions in this study, simulations using the CAMx model and an updated ACEIC inventory yielded ClNO2 concentrations ranging from 0 to 151.67 pptv, with a contribution range of 50 %–90 %. This suggests that snow cover with higher albedo plays a significant role in the photochemistry of the ClNO2 generation. Additionally, differences in air quality models and simulation periods may also contribute to the variations observed among these studies.
3.3.2 The impact of ground surface chlorine chemistry on ClNO2
The existing air quality models typically underestimate ClNO2 concentrations compared to observed values, suggesting the presence of unknown sources (Wang et al., 2022). To address this gap, we further incorporated two new ground surface chemical reactions including ClNO2 production and consumption reactions (Table 1) into a 3D air quality model to investigate the contribution of these unknown ClNO2 sources.
Figure 6 presents the simulated spatial distributions of monthly mean, nighttime monthly mean, and daytime monthly mean ClNO2 concentrations, along with their corresponding contribution ratios from ground surface chemistry. The spatial differences in ClNO2 between the Y2 and Y3 scenarios ranged from 0.0 to 38.96 pptv, with the contribution ratios of up to 48.20 % simulated in Heilongjiang, Jilin, and the northeastern regions of Liaoning Province (Fig. 6c and d). The higher albedo of snow can facilitate the surface photochemical reactions and lead to rapid ClNO2 photolysis (Chen et al., 2019), which explains significant differences in the concentration of ClNO2between daytime and nighttime. During the daytime, ClNO2 concentrations in both the Y2 and Y3 scenarios ranged from 0 to 70.60 pptv. The maximum spatial difference in ClNO2 between the Y2 and Y3 scenarios was 7.51 pptv, with monthly average contribution ratios reaching up to 23.02 % in the eastern regions of Heilongjiang and Jilin Provinces. In contrast, nighttime ClNO2 concentrations exhibited an accumulation trend. Scenarios Y2 and Y3 simulated maximum nighttime ClNO2 concentrations of 271.07 and 310.04 pptv, respectively. The nighttime spatial maximum difference (72.14 pptv) was approximately ten times greater than that simulated during the day, with a contribution ratio of around 92 % in Heilongjiang and Jilin Provinces.
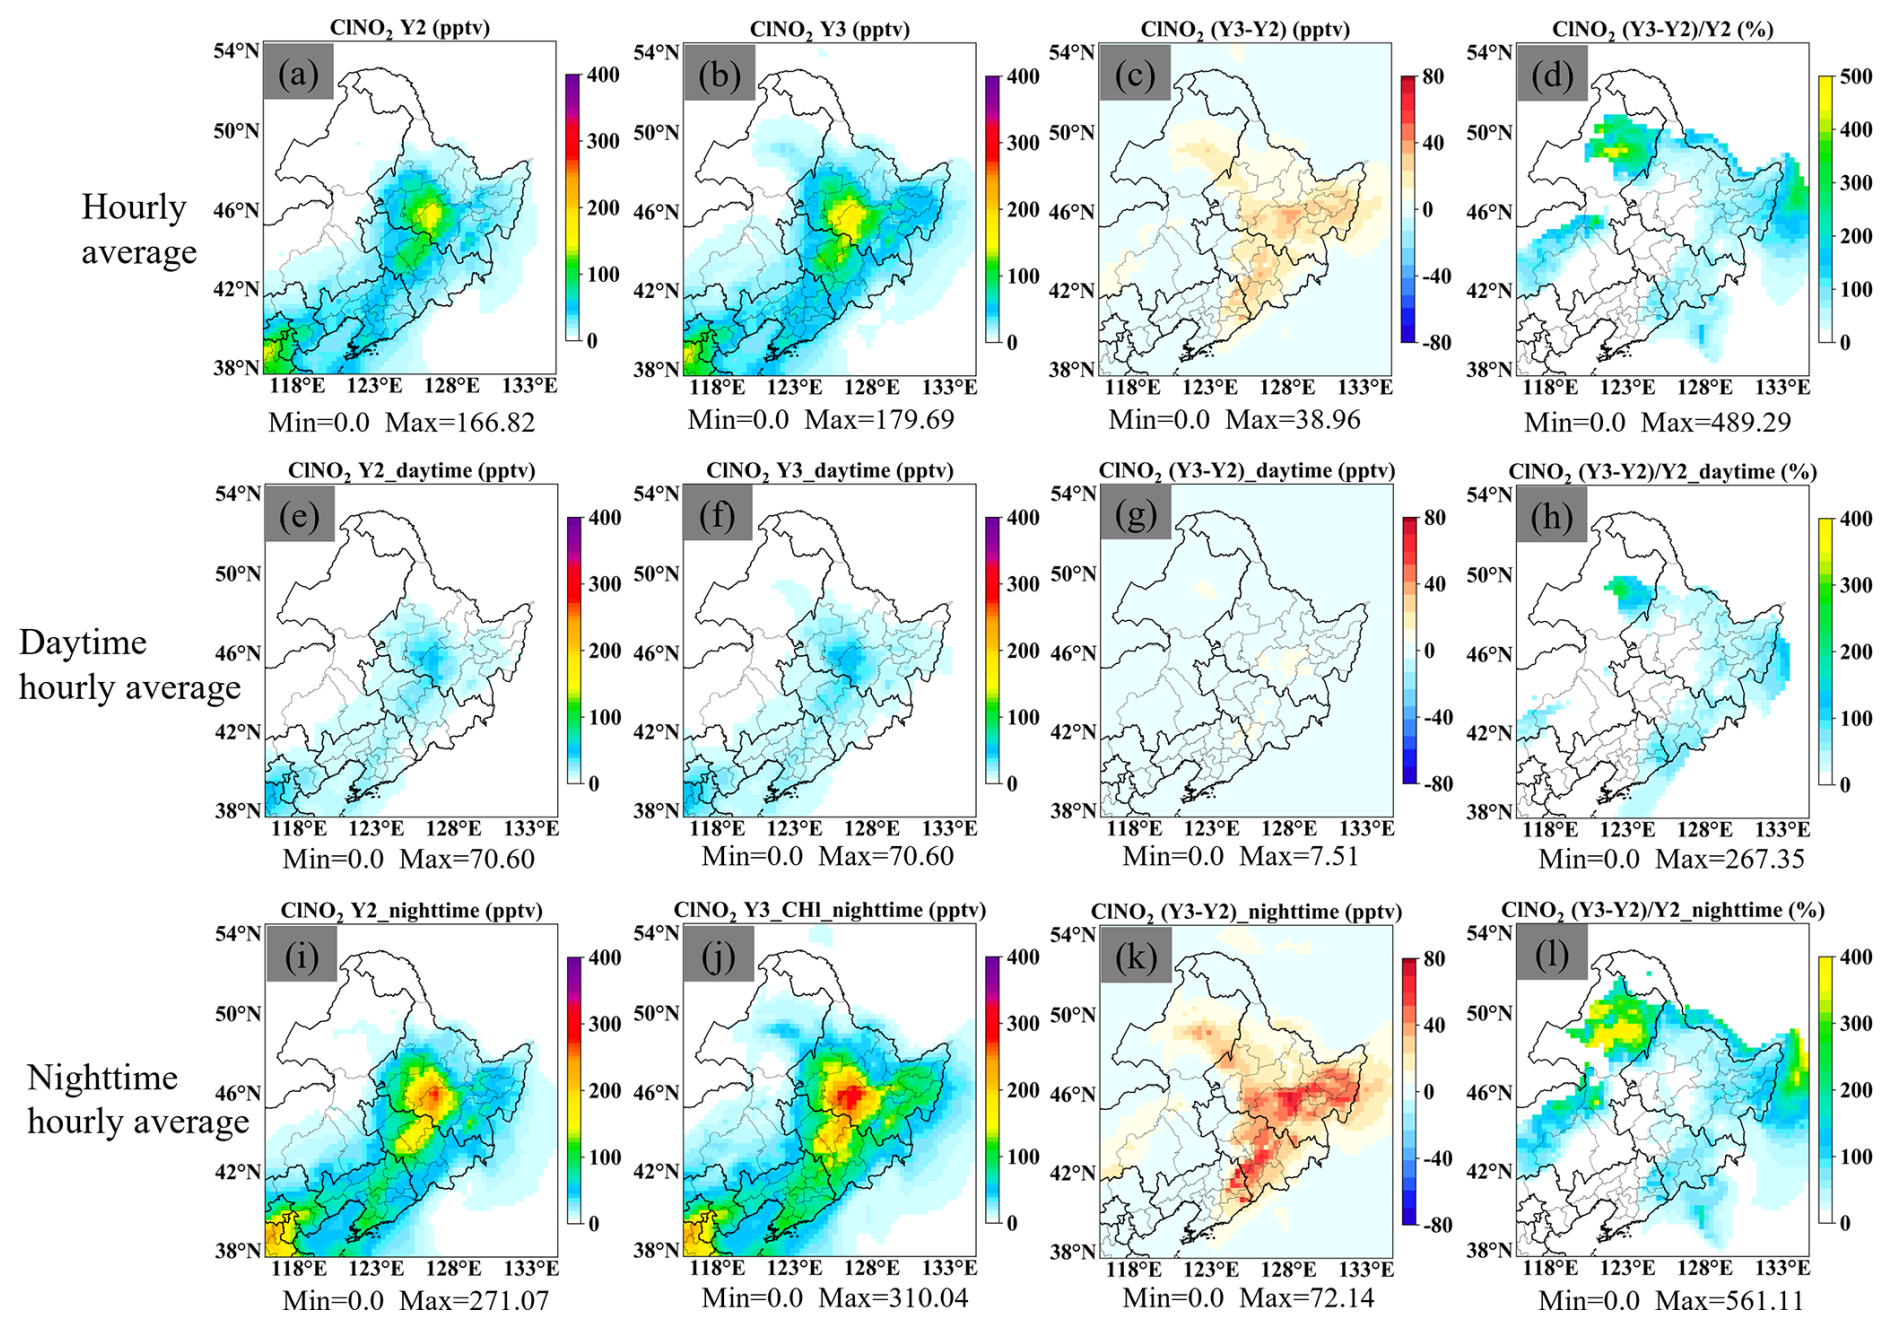
Figure 6The quantitative contribution of ground surface chemistry to hourly atmospheric ClNO2 over northeastern China.
The flux exchange between ground surface chemical processes and the atmosphere is a critical component of atmospheric chemistry. Pollutants deposited on surfaces (soil, snow, vegetation, and buildings) can also undergo heterogeneous chemical reactions.
Snow, in particular, provides a larger reaction interface for heterogeneous chemical while low temperatures influence chemical equilibria and increase atmospheric moisture content, favoring gas deposition processes (McNamara et al., 2021). Consequently, higher ClNO2 and N2O5 concentrations are observed during winter compared to summer (Xia et al., 2021), primarily due to elevated N2O5 levels enhancing ClNO2 production, while lower winter temperatures favor the equilibrium shift of the N2O5–NO3 reaction toward N2O5 formation. Additionally, longer winter nights in high latitudes facilitate N2O5 accumulation under dark conditions (Wagner et al., 2013).
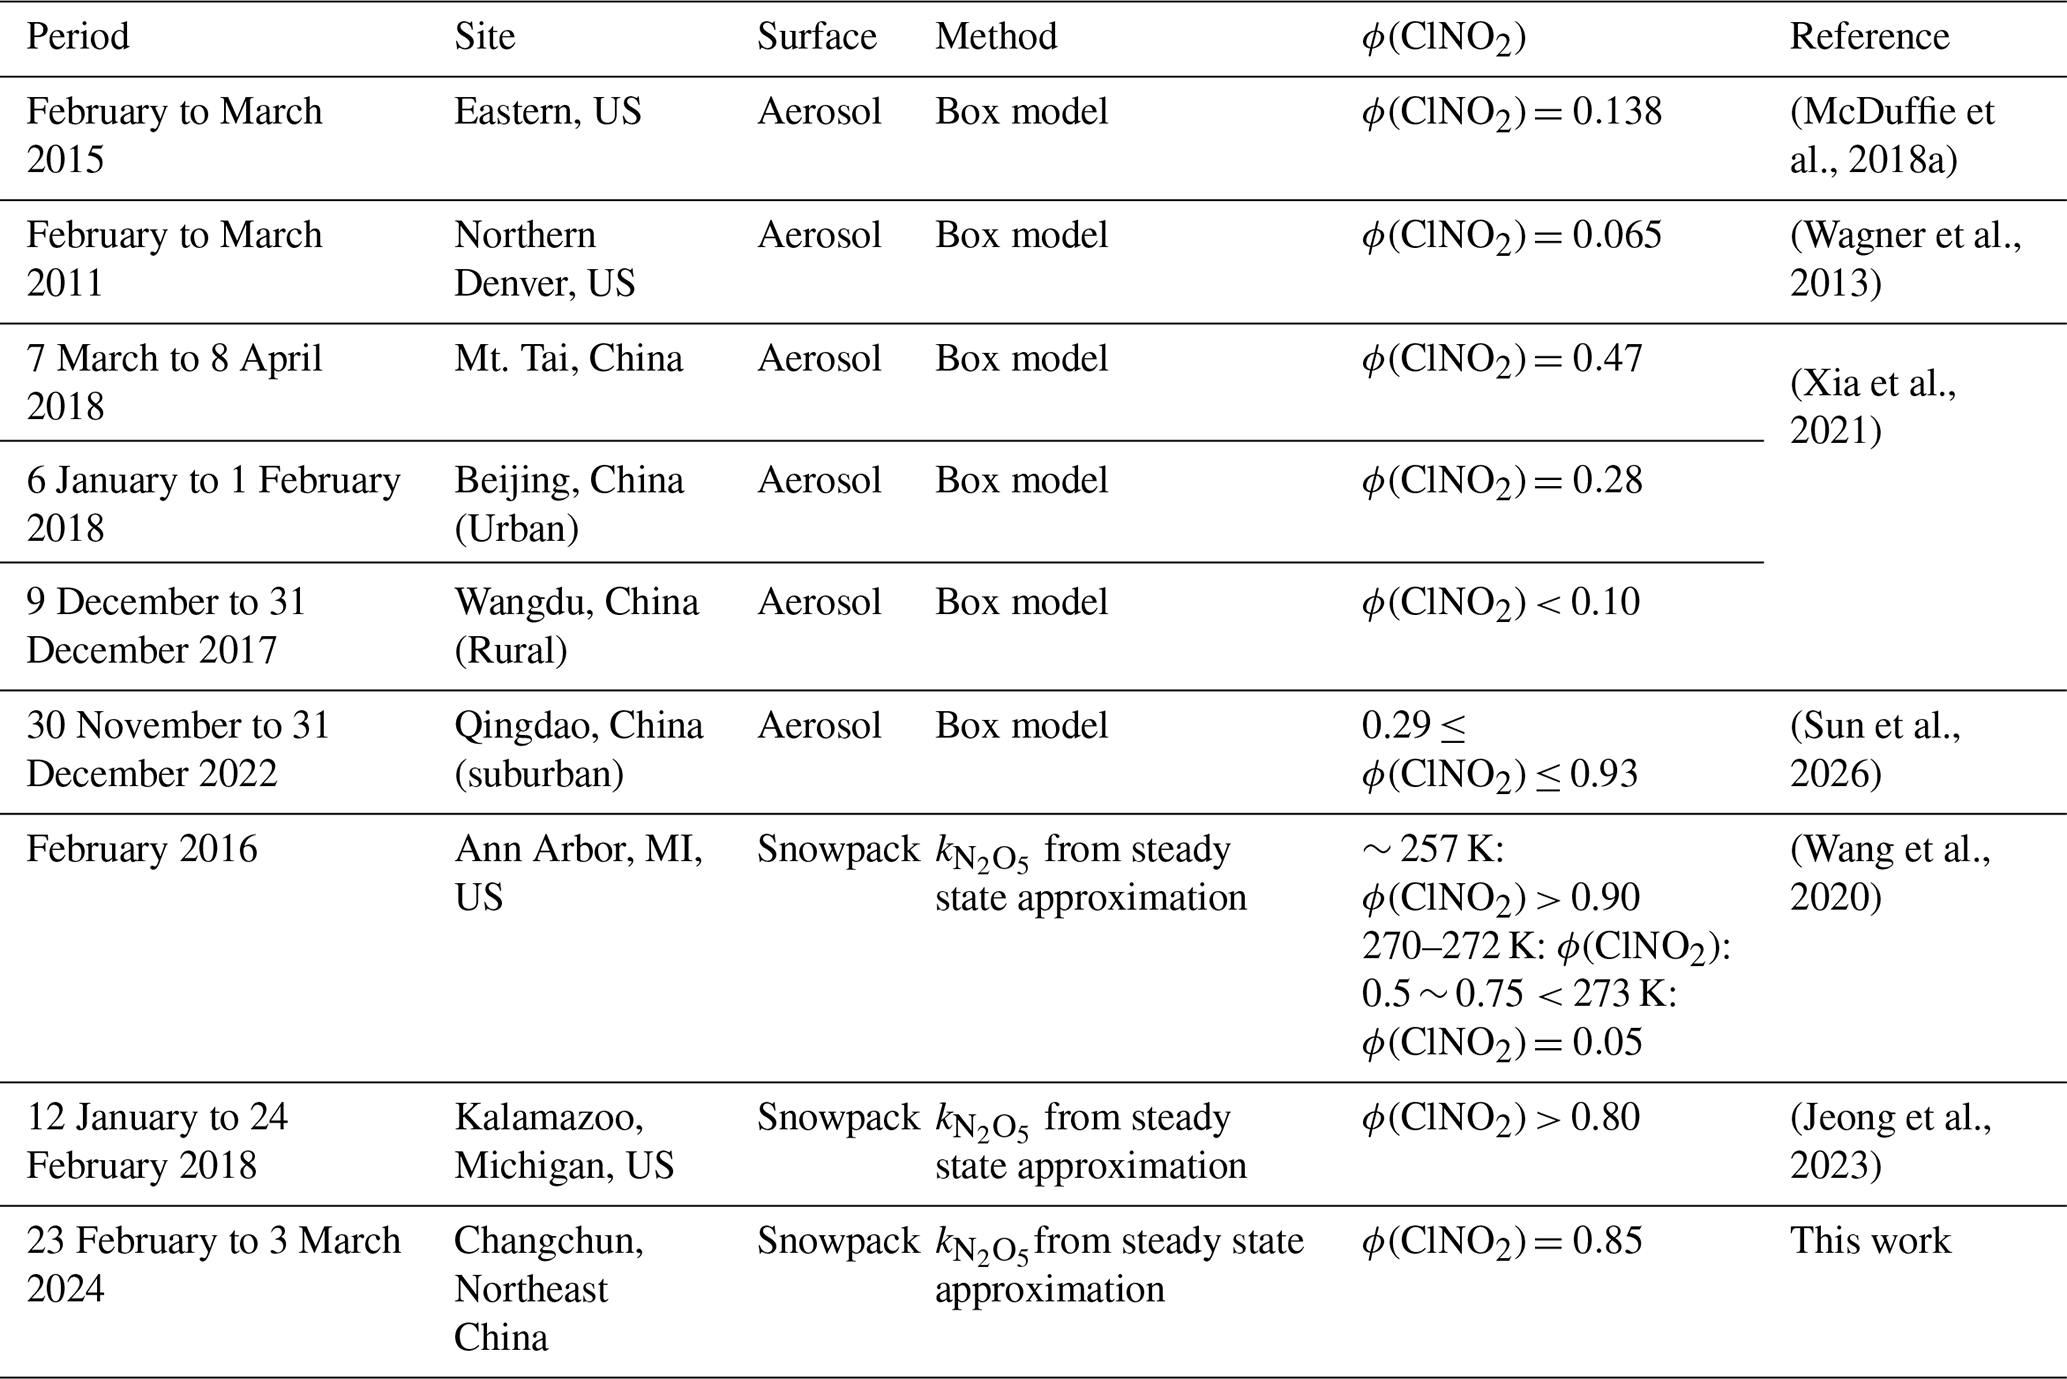
The ClNO2 yield and flux variations serve as key indicators for assessing the significance of surface heterogenous chemical processes. During the snow-covered periods, the φ(ClNO2) values are higher compared to snow free periods, ranging from 0.065 to 1.00 during most winter months in the Northern Hemisphere (Table 4). Notably, over snow surfaces, Wang et al. (2020) and Jeong et al. (2023) reported the φ(ClNO2) values even exceeding 0.80 during winter.
From the perspective of ClNO2 flux variations, McNamara et al. (2021) conducted vertical gas profile observations and snow chamber experiments in Kalamazoo, Michigan, reporting a daily averaged ClNO2 flux of 3 × 10⁷ molec. cm−2 s−1 over snow-covered surfaces, compared to a negative flux of −24 × 107 molec. cm−2 s−1 over snow-free surfaces. Jeong et al. (2023) further integrated a one-dimensional atmospheric boundary layer model with snow modules to investigate the vertical distribution and impact of urban snow cover on ClNO2 emissions in Kalamazoo, Michigan. Their findings showed that the ClNO2 flux was positive on snow-covered nights, averaging 3.7 × 10⁸ molec. cm−2 s−1, but turned negative on snow-free nights, averaging −(2.8 × 10⁹) molec. cm−2 s−1. These findings indicate that under snow-covered conditions, the flux of ClNO2 is positive, whereas under snow-free conditions, it turns negative. Furthermore, the positive flux of ClNO2 during nighttime snow conditions is significantly higher than the daily average flux.
As mentioned above, snow-covered ground surfaces exhibit higher φ(ClNO2) values and larger positive ClNO2 fluxes (Jeong et al., 2023; Kulju et al., 2022; McNamara et al., 2021), particularly at night. In this study, we further integrated the surface chemistry module into the 4D Eulerian model of CAMx, establishing a link for flux exchange between the ground surfaces and the atmosphere. This integration provides a bridge to explore the spatiotemporal variations in ClNO2 concentration and allows for a more nuanced quantification of the impacts of chlorine chemistry on atmospheric oxidizing capacity and regional air quality.
3.4 Contribution of Reactive Chlorine to AOC, PM2.5, and O3
3.4.1 Contribution on Atmospheric Oxidizing Capacity (AOC)
According to previous studies (Lu et al., 2014; Zhu et al., 2022), the incorporation of chlorine chemical reactions can enhance the AOC. The spatial concentrations of oxidizing species (OH, HO2, and RO2) in scenarios Y0, Y1, Y2, and Y3 are shown in (Fig. S5). The contributions of anthropogenic chlorine emissions and N2O5 heterogeneous chemistry under different conditions are illustrated in Fig. S6. Note that Y3–Y0, Y2–Y1, and Y3–Y2 represent contributions from N2O5 heterogeneous chemistry, aerosol surface heterogeneous chemistry, and ground surface heterogeneous chemistry, denoted as Chl_het_N2O5_a+g, Het_N2O5_a, and Het_N2O5_g, respectively.
In the Y3–Y0 scenario, the maximum OH concentration difference reached 3.69 × 105 cm−3 with a maximum relative contribution of 7.59 %. This result is consistent with Wang et al. (2020), who reported a 6 % contribution of anthropogenic chlorine emissions to the AOC in Northeast China for 2014 (Wang et al., 2020). The spatial concentration difference in RO2 ranged from −(4.70 × 10⁶) to 0.17 × 106 cm−3 with a maximum relative contribution of 6.56 %. The HO2 concentration was more regionalized where it primarily concentrated in coastal areas of the Beijing-Tianjin-Hebei region and the Bohai Sea, with the range of −(10.96 × 10⁵) to 7.95 × 105 cm−3 and a relative contribution of approximately 3 % in Northeast China.
In the Y2–Y1 scenario, the spatial OH concentration difference ranged from −(0.15 × 10⁴) to 1.88 × 104 cm−3 with a maximum relative contribution of 6.34 %. The maximum HO2 concentration difference (9.04 × 105 cm−3) exceeded that simulated in the Y3–Y0 scenario. Furthermore, the RO2 difference range −(6.98 × 10⁸) to 0.29 × 108 cm−3 was also larger than in the Y3–Y0 scenario.
In the Y3–Y2 scenario, the OH concentration difference ranged from −(0.12 × 10⁴) to 3.63 × 104 cm−3, and the contribution regions were primarily concentrated in Heilongjiang Province and the four eastern regions of Inner Mongolia with a maximum relative contribution of 7.37 %. The maximum HO2 contribution was 5.98 %, while the RO2 contribution was the smallest at 1.99 %. The results illustrate that under snow cover conditions, chlorine chemistry generally promotes OH generation, inhibits RO2 production, and has varying effects on HO2 production, inhibiting it in Chifeng city while promoting it in other regions of Northeast China (Fig. S6).
The greater spatial distribution differences simulated in Y2–Y1 compared to Y3–Y0 can be attributed to the CB6r2h-lts chemical mechanism, which includes 22 gas-phase chlorine reactions, eight of which Reactions (R8–R15) directly impact the generation and removal of OH, HO2, and RO2. The analysis reveals that the Y2–Y1 scenario had the most significant impact, followed by Y3–Y0, while the contribution of Y3–Y2 was relatively minor.
Where FMCL denotes formyl chloride (HC(O)Cl); MEO2 represents the methyl peroxy radical; AlD2 refers to acetaldehyde and higher aldehydes; XO2H indicates NO-to-NO2 converting peroxy radicals from HCs; XO2N signifies NO-to-organic nitrate converting peroxy radicals; ISPD represents Isoprene product/Isoprene-derived peroxy radical; FORM denotes formaldehyde; ACET indicates acetone; and ISOP represents isoprene.
3.4.2 Contribution on PM2.5
Chlorine emissions and the associated chlorine chemical reactions significantly influence AOC, the formation of particulate matter, and ozone levels. Figure S7 presents the spatial concentration distributions of these species with concentration ranges of 0–128.64 µg m−3 for PM2.5, 0–16.94 µg m−3 for PNH4, 0–13.06 µg m−3 for PSO4, and 0–47.53 µg m−3 for PNO3, respectively. Figure 7 exhibited the differences and contribution ratios of scenarios (Y3–Y0), (Y2–Y1), and (Y3–Y2) on PM2.5 and its components (PNH4, PSO4, and PNO3), respectively.
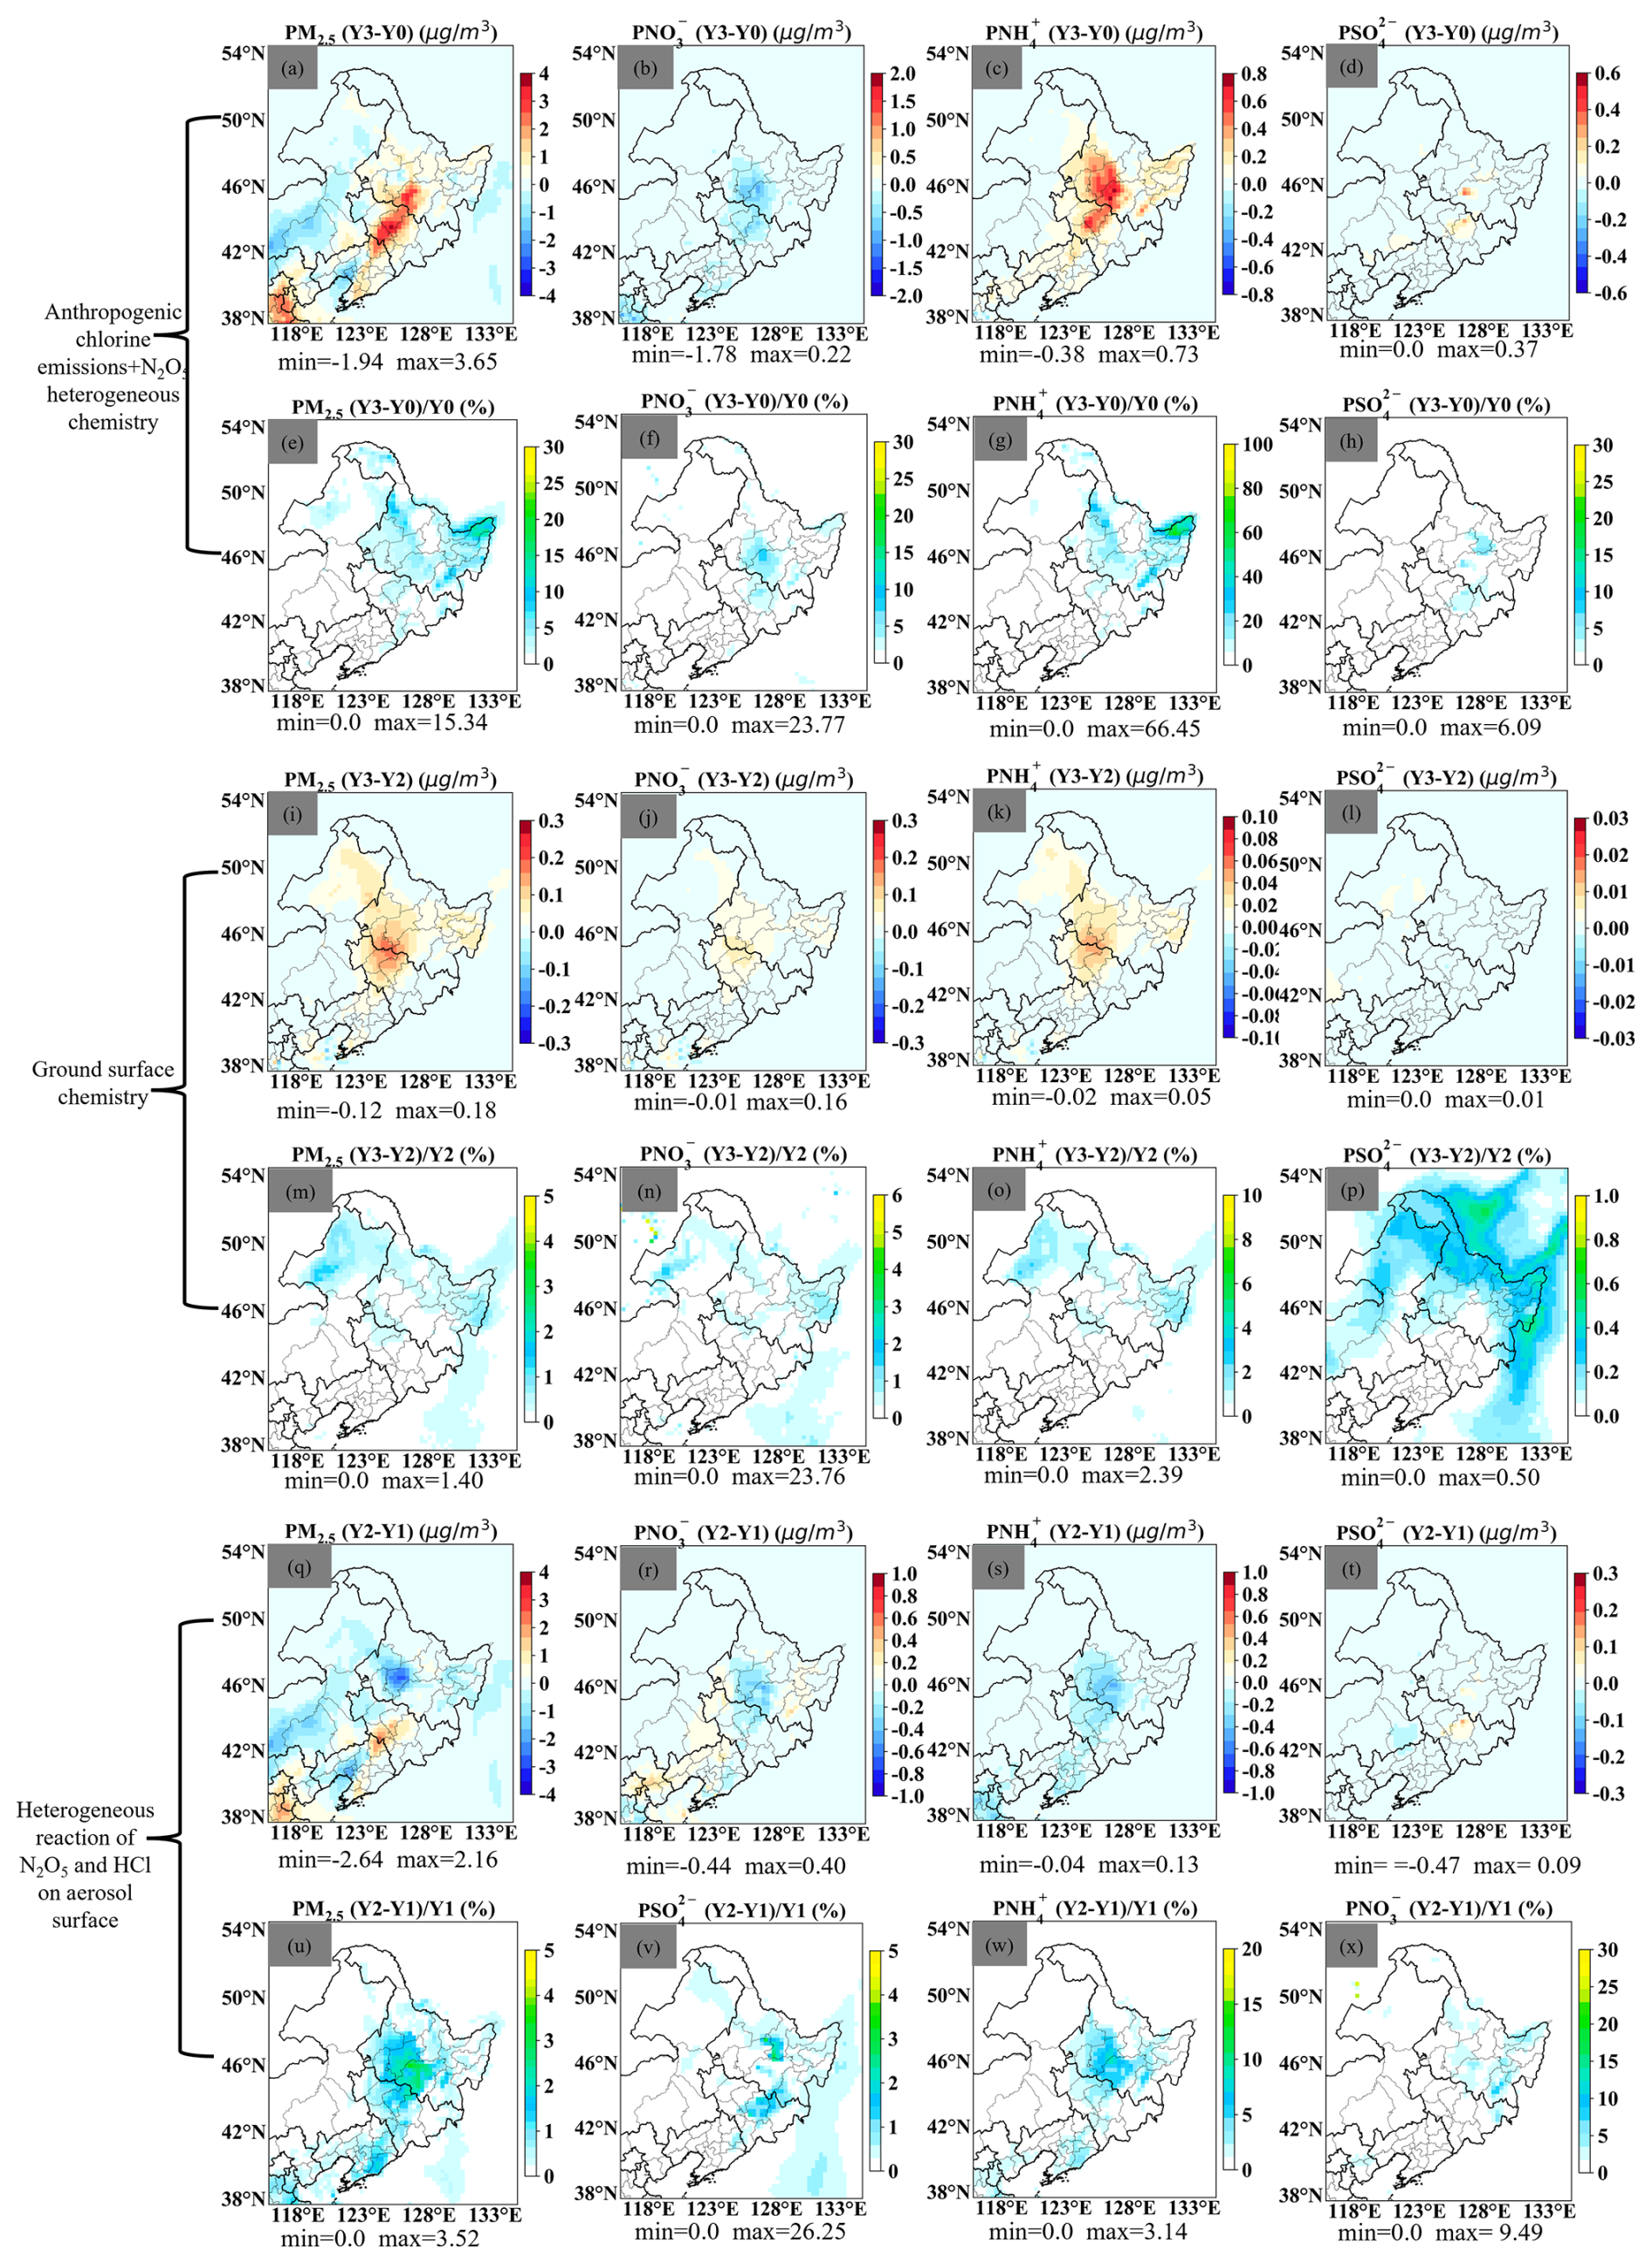
Figure 7The quantitative contribution of different pathways of chlorine chemistry on PM2.5, and its chemical components.
In the Y3–Y0 scenario, chlorine chemistry suppressed PM2.5 formation in the eastern regions of Northeast China with a maximum suppression of 1.94 µg m−3. Conversely, chlorine chemistry promoted PM2.5 formation in most regions of Heilongjiang, Jilin, and Liaoning Provinces with a significant increase of 3.65 µg m−3 and a maximum relative contribution of 15.34 %. The simulation results show that chlorine addition promoted the formation of PNH4 (increased by 0.73 µg m−3) and PSO4 (increased by 0.37 µg m−3) which were primarily concentrated in urban areas such as Harbin and Changchun. In contrast, PNO3 was suppressed, with a minimum difference value of −1.78 µg m−3 and a corresponding relative contribution of 23.77 %.
In the Y2–Y1 scenario, PM2.5 was inhibited in the eastern regions of Heilongjiang and Liaoning Provinces, while an increase was simulated in certain areas of Jilin Province, with concentration differences ranging from −2.64 to 2.16 µg m−3 and a maximum contribution of 3.52 %. Aerosol surface heterogeneous chemistry inhibited PNH4 and PNO3 formation across most of the central and northeastern regions, with maximum relative contributions of 3.14 % and 26.25 %, respectively. The spatial concentration difference in PSO was not significant in the Northeast region with the maximum value of 0.09 µg m−3.
In the Y3–Y2 scenario, the formations of PM2.5, PNO3, PNH4, and PSO were enhanced, with maximum differences of 0.18, 0.16, 0.05, and 0.01 µg m−3, respectively. Compared to Y3–Y0 and Y2–Y1, the spatial concentration difference in Y3–Y2 was relatively minor for these species.
In the Y3–Y2 scenario, the impact on particulate matter is relatively small, primarily due to two factors: (1) the concentration of re-emitted species was low, and the species involved were limited; and (2) highly oxidizing species such as HCl and ClNO2 in rapidly decomposed into other chlorides within the snow, preventing their release into the atmosphere as oxidants and leading to a net loss of chlorine. Additionally, an analysis of ClNO2 photolysis in snow cover revealed a maximum consumption value of 2.88 pptv, with a monthly average maximum concentration of 38.96 pptv on the ground, accounting for approximately 7.40 % (Fig. S8).
3.4.3 Contribution on MDA8 O3
The anthropogenic chlorine emissions and N2O5 heterogeneous chemistry can significantly enhance ozone levels. Previous studies have quantified this effect: Wang et al. (2020) reported that anthropogenic chlorine emissions increased the maximum daily 8 h average (MDA8) O3 concentration by 1.70 ppbv while Yi et al. (2021) found a 6.70 ppbv increase in winter MDA8 O3 concentration in the Yangtze River Delta (YRD) region due to updates in chlorine chemistry processes. Furthermore, Yang et al. (2022) demonstrated that incorporating the anthropogenic chlorine emissions with biomass burning emissions and updating the parameterization of heterogeneous N2O5 and Cl related chemistries, including adjustments of γ(N2O5) and ϕ(ClNO2), led to a 4.5 ppbv increase in the MDA8O3 concentration over China (Yang et al., 2022). In this study, the maximum difference in monthly mean MDA8 O3reached 3.41 ppbv (Fig. 8a), which is smaller than the value simulated (4.74 ppbv) in the Y2–Y1 scenario. This difference is primarily attributed to the adding of chlorine emissions, which suppresses atmospheric oxidation. For example, the maximum difference concentrations of RO2 and HO2 in Y2–Y1 are 0.29 × 10⁸ and 9.04 × 105 cm−3, respectively, while in Y3–Y0, they are 0.17 × 10⁶ and 7.95 × 105 cm−3, respectively (Fig. S6). The maximum contribution concentration of surface heterogenous processes Y3–Y2 to ozone was 1.30 ppbv (Fig. 8c).
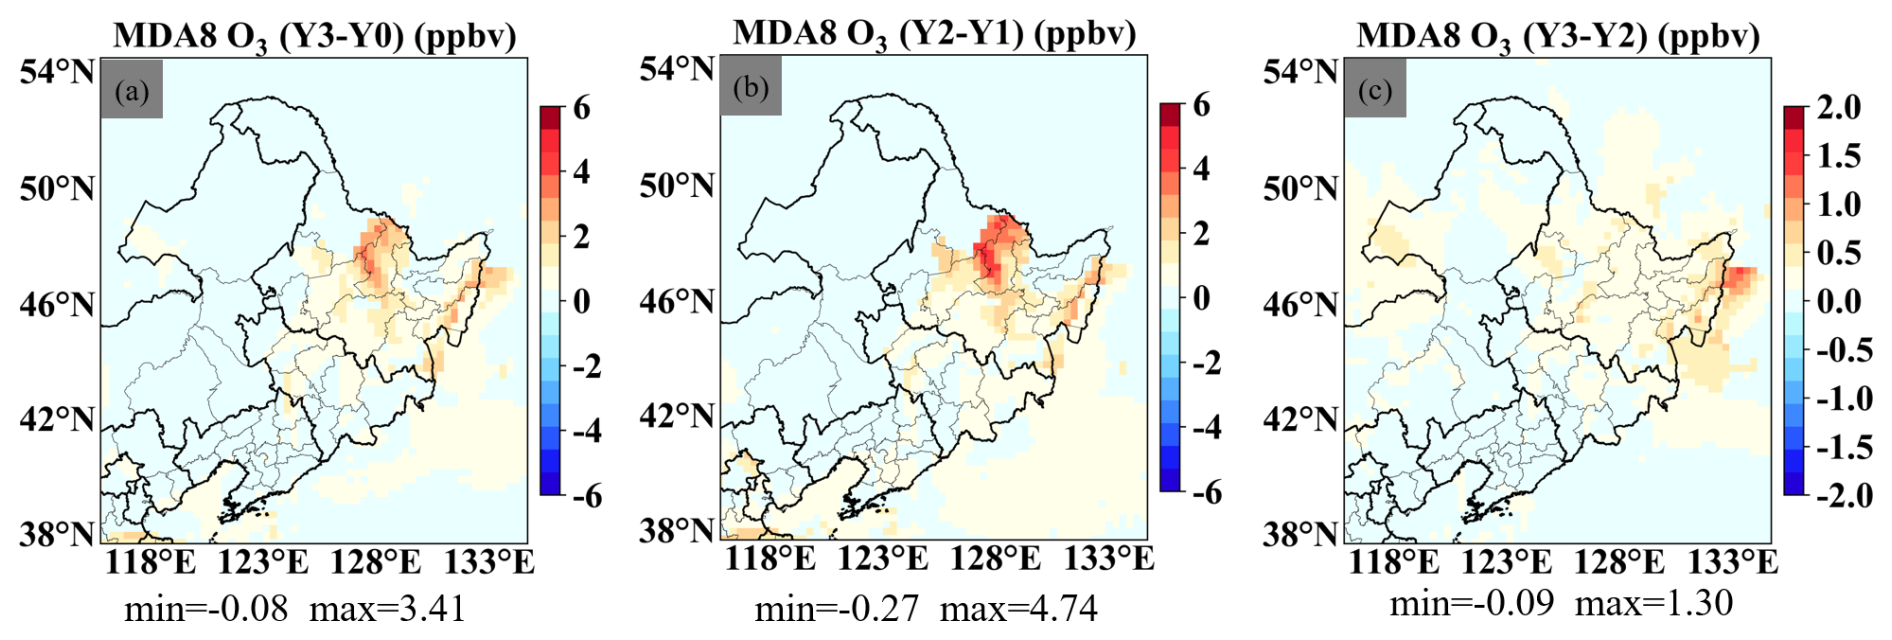
Figure 8The quantitative contribution of different pathways of chlorine chemistry on O3.
To fully understand the dynamic exchange processes between the atmosphere and the ground surfaces, it is essential to quantify the mass of chemical species deposited on various surfaces, such as snow, vegetation, buildings, and soil, which provide sufficiently large reaction interfaces. Incorporating these deposition processes into the air quality models will offer a more comprehensive understanding of ground surface-atmosphere interactions and their impact on atmospheric chemistry. However, the current ground surface chemistry module remains relatively simplified, primarily focusing on the re-emission of species into the atmosphere from predefined reactions. To more accurately represent the full impact of surface chemistry on atmospheric processes, further development and refinement of the ground surface module are necessary.
The mechanisms of heterogeneous N2O5 reactions and ClNO2 photolysis in snow remain incompletely understood. In this study, we employed numerical simulations to compare two different aerosol parameterization schemes involving chlorine chemistry (BT09 and YU20) and incorporated newly heterogeneous N2O5 reactions on ground surfaces in WRF-CAMx model to assess their impacts on regional – scale atmosphere pollution under snow-covered conditions in Northeast China.
The observation results reveal distinct diurnal cycles of N2O5 and ClNO2, characterized by nighttime accumulation during winter, followed by rapid photolysis after sunrise. The formation of ClNO2 is primarily limited by the availability of N2O5 rather than chloride supply, as evidenced by the absence of ClNO2 peaks when N2O5 remained below ∼ 120 pptv. Ground surface chemical processes accounted for about 28 % of the simulated nighttime ClNO2 accumulation in Northeastern China, which emphasizes the critical role of snow-covered surfaces in ClNO2 production.
Furthermore, comparisons between different aerosol schemes demonstrated that the YU20 aerosol scheme outperforms the BT09 scheme in simulating N2O5 and ClNO2 concentrations within the CAMx model. Incorporating anthropogenic chlorine emissions and surface N2O5 heterogeneous chemistry significantly improved the model's performance on the simulated ClNO2 concentrations, reducing the RMSE from 170.26 pptv to 88.28 pptv and increasing the IOA from 0.39 to 0.86. These processes increased hourly PM2.5 concentrations by up to 3.65 µg m−3 (15.34 %) and MDA8 O3 by 3.41 ppbv (5.68 %), promoting particulate matter (PNH4 and PSO4) formation while suppressing PNO3. Regarding regional impacts on the AOC Atmospheric Oxidizing Capacity, PM2.5, and MDA8 O3, the contribution of N2O5 heterogeneous chemistry on aerosol surfaces exceeded the combined effect of anthropogenic chlorine emissions and surface heterogeneous chemistry.
This study provides key insights into the role of the heterogenous chlorine chemistry in atmospheric processes over cold residential regions, and highlights unknown sources of ClNO2 on the ground surfaces during snow cover periods. From a 3D air quality modeling perspective, quantifying the chemical deposition of atmospheric pollutants on diverse surfaces and integrating heterogenous chlorine related reaction processes into ground surface modules are crucial for accurately representing flux exchange between the ground and atmosphere. In the surface chemistry module, although the variation of rate constants for heterogeneous reactions at two snow layers is considered, further optimization is possible. By collecting snow samples at different depths in the field or conducting sensitive experiments in laboratory a long-term quantitative relationship among snow depth, total ion concentration (CT), and liquid brine layer fraction (fbrine) can be established. This will allow for a more precise determination of the parameter values of γ(N2O5) and ϕ(ClNO2) corresponding to different snow depths. Moreover, the snowmelt process requires special attention, as dynamic variations in liquid water content within snow/ice pores significantly affect heterogeneous reaction rate constants. Future studies should incorporate the numerical representation of these variations in models and evaluate the health impacts of regional atmospheric pollution driven by chemical exchanges between the atmosphere and the cryosphere.
Snow satellite data were obtained from the National Snow and Ice Data Center (NSIDC) (https://nsidc.org/data, last access: 17 September 2026), including snow cover fraction, snow density, and snow albedo. The air quality model employed CAMx version 7.10 or later (https://www.camx.com/download/, last access: 17 September 2026). Observational data and model simulation results are available from the corresponding author (XuLei Zhang) upon reasonable request. The modified model code implementing N2O5 heterogeneous chemistry has been deposited on Zenodo and is publicly accessible at https://doi.org/10.5281/zenodo.22821984 (Xie, 2026).
The supplement related to this article is available online at https://doi.org/10.5194/tc-20-5435-2026-supplement.
Shengjin Xie, Xuelei Zhang, and Aijun Xiu designed the experiment. Shengjin Xie revised the code of CAMx and analyzed the data. Xuelei Zhang and Chao Gao provided suggestions for the model revision. Shengrui Tong, Hongmei Zhao, Shichun Zhang, Mengduo Zhang, and Stephen Dauda Yabo contributed to the writing and editing of the manuscript. Qianjie Chen provided the observational data in northeastern China. Yiming Liu and Siting Li supplied the anthropogenic chlorine emissions.
The contact author has declared that none of the authors has any competing interests.
Publisher's note: Copernicus Publications remains neutral with regard to jurisdictional claims made in the text, published maps, institutional affiliations, or any other geographical representation in this paper. The authors bear the ultimate responsibility for providing appropriate place names. Views expressed in the text are those of the authors and do not necessarily reflect the views of the publisher.
We would like to thank Qianjie Chen's team at The Hong Kong Polytechnic University for providing the field observation dataset.
This project was partly supported by National Science Foundation of China (grant nos. 42371154, 42171142, 42305171), the Youth Promotion Association of Chinese Academy of Sciences (grant no. 2022230), and the Excellent Young Scholars Fund of Jilin Province (grant no. 20240602020RC).
This paper was edited by Krystyna Kozioł and reviewed by two anonymous referees.
Apodaca, R. L., Huff, D. M., and Simpson, W. R.: The role of ice in N2O5 heterogeneous hydrolysis at high latitudes, Atmos. Chem. Phys., 8, 7451–7463, https://doi.org/10.5194/acp-8-7451-2008, 2008.
Bertram, T. H. and Thornton, J. A.: Toward a general parameterization of N2O5 reactivity on aqueous particles: the competing effects of particle liquid water, nitrate and chloride, Atmos. Chem. Phys., 9, 8351–8363, https://doi.org/10.5194/acp-9-8351-2009, 2009.
Chen, Q., Edebeli, J., McNamara, S. M., Kulju, K. D., May, N. W., Bertman, S. B., Thanekar, S., Fuentes, J. D., and Pratt, K. A.: HONO, particulate nitrite, and snow nitrite at a midlatitude urban site during wintertime, ACS Earth Space Chem., 3, 811–822, https://doi.org/10.1021/acsearthspacechem.9b00023, 2019.
Dai, J., Liu, Y., Wang, P., Fu, X., Xia, M., and Wang, T.: The impact of sea-salt chloride on ozone through heterogeneous reaction with N2O5 in a coastal region of south China, Atmos. Environ., 236, 117604, https://doi.org/10.1016/j.atmosenv.2020.117604, 2020.
Emery, C., Baker, K., Wilson, G., and Yarwood, G.: Comprehensive Air Quality Model with Extensions: Formulation and Evaluation for Ozone and Particulate Matter over the US, Atmosphere, 15, 1158, https://doi.org/10.3390/atmos15101158, 2024.
Gaston, C. J., Thornton, J. A., and Ng, N. L.: Reactive uptake of N2O5 to internally mixed inorganic and organic particles: the role of organic carbon oxidation state and inferred organic phase separations, Atmos. Chem. Phys., 14, 5693–5707, https://doi.org/10.5194/acp-14-5693-2014, 2014.
George, C., Ponche, J., Mirabel, P., Behnke, W., Scheer, V., and Zetzsch, C.: Study of the uptake of N2O5 by water and NaCl solutions, J. Phys. Chem., 98, 8780–8784, https://doi.org/10.1021/j100086a031, 1994.
Hanson, D. R. and Ravishankara, A. R.: The reaction probabilities of ClONO2 and N2O5 on polar stratospheric cloud materials, J. Geophys. Res.: Atmos., 96, 5081–5090, https://doi.org/10.1029/90jd02613, 1991.
Hong, Y., Liu, Y., Chen, X., Fan, Q., Chen, C., Chen, X., and Wang, M.: The role of anthropogenic chlorine emission in surface ozone formation during different seasons over eastern China, Sci. Total Environ., 723, 137697, https://doi.org/10.1016/j.scitotenv.2020.137697, 2020.
Huff, D. M., Joyce, P. L., Fochesatto, G. J., and Simpson, W. R.: Deposition of dinitrogen pentoxide, N2O5, to the snowpack at high latitudes, Atmos. Chem. Phys., 11, 4929–4938, https://doi.org/10.5194/acp-11-4929-2011, 2011.
Jeong, D., McNamara, S. M., Chen, Q., Mirrielees, J., Edebeli, J., Kulju, K. D., Wang, S., Hayani, L., Kirpes, R. M., and Lata, N. N.: Quantifying the contributions of aerosol-and snow-produced ClNO2 through observations and 1D modeling, ACS Earth Space Chem., 7, 2548–2561, https://doi.org/10.1021/acsearthspacechem.3c00237, 2023.
Karamchandani, P., Emery, C., Yarwood, G., Lefer, B., Stutz, J., Couzo, E., and Vizuete, W.: Implementation and refinement of a surface model for heterogeneous HONO formation in a 3-D chemical transport model, Atmos. Environ., 112, 356–368, https://doi.org10.1016/j.atmosenv.2015.01.046, 2015.
Kulju, K. D., McNamara, S. M., Chen, Q., Edebeli, J., Fuentes, J. D., Bertman, S. B., and Pratt, K. A.: Urban inland wintertime N2O5 and ClNO2 influenced by snow-covered ground, air turbulence, and precipitation, Atmos. Chem. Phys., 22, 2553–2568, https://doi.org/10.5194/acp-22-2553-2022, 2022.
Li, Q., Zhang, L., Wang, T., Tham, Y. J., Ahmadov, R., Xue, L., Zhang, Q., and Zheng, J.: Impacts of heterogeneous uptake of dinitrogen pentoxide and chlorine activation on ozone and reactive nitrogen partitioning: improvement and application of the WRF-Chem model in southern China, Atmos. Chem. Phys., 16, 14875–14890, https://doi.org/10.5194/acp-16-14875-2016, 2016.
Li, S., Liu, Y., Zhu, Y., Jin, Y., Hong, Y., Shen, A., Xu, Y., Wang, H., Wang, H., Lu, X., Fan, S., and Fan, Q.: ACEIC: a comprehensive anthropogenic chlorine emission inventory for China, Atmos. Chem. Phys., 24, 11521–11544, https://doi.org/10.5194/acp-24-11521-2024, 2024.
Li, X., Zhao, W., Yang, Y., Ma, Y., Ye, J., Zhao, H., Zhang, S., Zhang, X., and Xiu, A.: Impact of reactive chlorine on atmospheric oxidative capacity in a snowy polluted environment, Environ. Sci. Technol., 59, 19363–19376, https://doi.org/10.1021/acs.est.5c08841, 2025.
Liu, Y., Fan, Q., Chen, X., Zhao, J., Ling, Z., Hong, Y., Li, W., Chen, X., Wang, M., and Wei, X.: Modeling the impact of chlorine emissions from coal combustion and prescribed waste incineration on tropospheric ozone formation in China, Atmos. Chem. Phys., 18, 2709–2724, https://doi.org/10.5194/acp-18-2709-2018, 2018.
Lopez-Hilfiker, F. D., Constantin, K., Kercher, J. P., and Thornton, J. A.: Temperature dependent halogen activation by N2O5 reactions on halide-doped ice surfaces, Atmos. Chem. Phys., 12, 5237–5247, https://doi.org/10.5194/acp-12-5237-2012, 2012.
Lu, K. D., Rohrer, F., Holland, F., Fuchs, H., Brauers, T., Oebel, A., Dlugi, R., Hu, M., Li, X., Lou, S. R., Shao, M., Zhu, T., Wahner, A., Zhang, Y. H., and Hofzumahaus, A.: Nighttime observation and chemistry of HOx in the Pearl River Delta and Beijing in summer 2006, Atmos. Chem. Phys., 14, 4979–4999, https://doi.org/10.5194/acp-14-4979-2014, 2014.
McDuffie, E. E., Fibiger, D. L., Dubé, W. P., Lopez Hilfiker, F., Lee, B. H., Jaeglé, L., Guo, H., Weber, R. J., Reeves, J. M., and Weinheimer, A. J.: ClNO2 yields from aircraft measurements during the 2015 WINTER campaign and critical evaluation of the current parameterization, J. Geophys. Res.: Atmos., 123, 12–994, https://doi.org/10.1029/2018jd029358, 2018a.
McDuffie, E. E., Fibiger, D. L., Dubé, W. P., Lopez Hilfiker, F., Lee, B. H., Thornton, J. A., Shah, V., Jaeglé, L., Guo, H., and Weber, R. J.: Heterogeneous N2O5 uptake during winter: Aircraft measurements during the 2015 WINTER campaign and critical evaluation of current parameterizations, J. Geophys. Res.: Atmos., 123, 4345–4372, https://doi.org/10.1002/2018jd028336, 2018b.
McNamara, S. M., Raso, A. R., Wang, S., Thanekar, S., Boone, E. J., Kolesar, K. R., Peterson, P. K., Simpson, W. R., Fuentes, J. D., and Shepson, P. B.: Springtime nitrogen oxide-influenced chlorine chemistry in the coastal arctic, Environ. Sci. Technol., 53, 8057–8067, https://doi.org/10.1021/acs.est.9b01797, 2019.
McNamara, S. M., Kolesar, K. R., Wang, S., Kirpes, R. M., May, N. W., Gunsch, M. J., Cook, R. D., Fuentes, J. D., Hornbrook, R. S., and Apel, E. C.: Observation of road salt aerosol driving inland wintertime atmospheric chlorine chemistry, ACS Cent. Sci., 6, 684–694, https://doi.org/10.1021/acscentsci.9b00994, 2020.
McNamara, S. M., Chen, Q., Edebeli, J., Kulju, K. D., Mumpfield, J., Fuentes, J. D., Bertman, S. B., and Pratt, K. A.: Observation of N2O5 deposition and ClNO2 production on the saline snowpack, ACS Earth Space Chem., 5, 1020–1031, https://doi.org/10.1021/acsearthspacechem.0c00317, 2021.
Mentel, T. F., Sohn, M., and Wahner, A.: Nitrate effect in the heterogeneous hydrolysis of dinitrogen pentoxide on aqueous aerosols, Phys. Chem. Chem. Phys., 1, 5451–5457, https://doi.org/10.1039/a905338g, 1999.
Mielke, L. H., Stutz, J., Tsai, C., Hurlock, S. C., Roberts, J. M., Veres, P. R., Froyd, K. D., Hayes, P. L., Cubison, M. J., and Jimenez, J. L.: Heterogeneous formation of nitryl chloride and its role as a nocturnal NOx reservoir species during CalNex‐LA 2010, J. Geophys. Res.: Atmos., 118, 10–638, https://doi.org/10.1002/jgrd.50783, 2013.
Ramboll: The CAMx v7.1 User's Guide, Version 7.1, Ramboll, https://www.camx.com/Files/CAMxUsersGuide_v7.10.pdf (last access: 17 September 2026), 2021.
Sun, W., Chen, X., Jiang, Y., Shen, H., Zong, Z., Xue, L., Wang, X., Yao, X., Gao, Y., and Wang, T.: High levels of ClNO2 enhance wintertime atmospheric oxidation capacity at a coastal site in North China, J. Environ. Sci., 169, 848–855, https://doi.org/10.1016/j.jes.2026.02.027, 2026.
Tham, Y. J., Wang, Z., Li, Q., Wang, W., Wang, X., Lu, K., Ma, N., Yan, C., Kecorius, S., and Wiedensohler, A.: Heterogeneous N2O5 uptake coefficient and production yield of ClNO2 in polluted northern China: roles of aerosol water content and chemical composition, Atmos. Chem. Phys., 18, 13155–13171, https://doi.org/10.5194/acp-18-13155-2018, 2018.
Thornton, J. A. and Abbatt, J. P.: N2O5 reaction on submicron sea salt aerosol: Kinetics, products, and the effect of surface active organics, J. Phys. Chem. A, 109, 10004–10012, https://doi.org/10.1021/jp054183t, 2005.
Thornton, J. A., Kercher, J. P., Riedel, T. P., Wagner, N. L., and Cozic, J.: A large atomic chlorine source inferred from mid-continental reactive nitrogen chemistry, Nature, 464, 271–274, https://doi.org/10.1038/nature08905, 2010.
Wagner, N. L., Riedel, T. P., Young, C. J., Bahreini, R., Brock, C. A., Dubé, W. P., Kim, S., Middlebrook, A. M., Öztürk, F., and Roberts, J. M.: N2O5 uptake coefficients and nocturnal NO2 removal rates determined from ambient wintertime measurements, J. Geophys. Res.: Atmos., 118, 9331–9350, https://doi.org/10.1002/jgrd.50653, 2013.
Wang, H., Peng, C., Wang, X., Lou, S., Lu, K., Gan, G., Jia, X., Chen, X., Chen, J., and Wang, H.: N2O5 uptake onto saline mineral dust: a potential missing source of tropospheric ClNO2 in inland China, Atmos. Chem. Phys., 22, 1845–1859, https://doi.org/10.5194/acp-22-1845-2022, 2022.
Wang, S., McNamara, S. M., Kolesar, K. R., May, N. W., Fuentes, J. D., Cook, R. D., Gunsch, M. J., Mattson, C. N., Hornbrook, R. S., and Apel, E. C.: Urban snowpack ClNO2 production and fate: A one-dimensional modeling Study, ACS Earth Space Chem., 4, 1140–1148, https://doi.org/10.1021/acsearthspacechem.0c00116, 2020.
Wang, X., Wang, H., Xue, L., Wang, T., Wang, L., Gu, R., Wang, W., Tham, Y. J., and Wang, Z.: Observations of N2O5 and ClNO2 at a polluted urban surface site in North China: High N2O5 uptake coefficients and low ClNO2 product yields, Atmos Environ, 156, 125–134, https://doi.org/10.1016/j.atmosenv.2017.02.035, 2017.
Wang, X., Jacob, D. J., Eastham, S. D., Sulprizio, M. P., Zhu, L., Chen, Q., Alexander, B., Sherwen, T., Evans, M. J., Lee, B. H., Haskins, J. D., Lopez-Hilfiker, F. D., Thornton, J. A., Huey, G. L., and Liao, H.: The role of chlorine in global tropospheric chemistry, Atmos. Chem. Phys., 19, 3981–4003, https://doi.org/10.5194/acp-19-3981-2019, 2019.
Wang, X., Jacob, D. J., Fu, X., Wang, T., Breton, M. L., Hallquist, M., Liu, Z., McDuffie, E. E., and Liao, H.: Effects of anthropogenic chlorine on PM2.5 and ozone air quality in China, Environ. Sci. Technol., 54, 9908–9916, https://doi.org/10.1021/acs.est.0c02296, 2020.
Xia, M., Wang, T., Peng, X., Wang, W., Yu, C., Sun, P., Li, Y., Liu, Y., Xu, Z., Wang, Z., Xu, Z., Nie, W., and Ding, A.: Significant production of ClNO2 and possible source of Cl2 from N2O5 uptake at a suburban site in eastern China, EGU General Assembly 2020, Online, 4–8 May 2020, EGU2020-12946, https://doi.org/10.5194/egusphere-egu2020-12946, 2020.
Xia, M., Peng, X., Wang, W., Yu, C., Wang, Z., Tham, Y. J., Chen, J., Chen, H., Mu, Y., Zhang, C., Liu, P., Xue, L., Wang, X., Gao, J., Li, H., and Wang, T.: Winter ClNO2 formation in the region of fresh anthropogenic emissions: seasonal variability and insights into daytime peaks in northern China, Atmos. Chem. Phys., 21, 15985–16000, https://doi.org/10.5194/acp-21-15985-2021, 2021.
Xie, S.: Modified model code for N2O5 heterogeneous chemistry (v7.10 REVSED), Zenodo [data set], https://doi.org/10.5281/zenodo.22821984, 2026.
Xie, S., Qi, H., Xiu, A., Zhang, X., Lu, L., Jiang, J., Liu, Y., and Liu, S.: The impact of anthropogenic chlorine emissions from coal combustion during the winter snow period on atmospheric ClNO2, Environ. Chem., 44, 1356–1369, https://doi.org/10.7524/j.issn.0254-6108.2024081101, 2025.
Yang, X., Wang, Q., Ma, N., Hu, W., Gao, Y., Huang, Z., Zheng, J., Yuan, B., Yang, N., Tao, J., Hong, J., Cheng, Y., and Su, H.: The impact of chlorine chemistry combined with heterogeneous N2O5 reactions on air quality in China, Atmos. Chem. Phys., 22, 3743–3762, https://doi.org/10.5194/acp-22-3743-2022, 2022.
Yi, X., Yin, S., Huang, L., Li, H., Wang, Y., Wang, Q., Chan, A., Traoré, D., Ooi, M. C. G., and Chen, Y.: Anthropogenic emissions of atomic chlorine precursors in the Yangtze River Delta region, China, Sci. Total Environ., 771, 144644, https://doi.org/10.1016/j.scitotenv.2020.144644, 2021.
Yu, C., Wang, Z., Xia, M., Fu, X., Wang, W., Tham, Y. J., Chen, T., Zheng, P., Li, H., Shan, Y., Wang, X., Xue, L., Zhou, Y., Yue, D., Ou, Y., Gao, J., Lu, K., Brown, S. S., Zhang, Y., and Wang, T.: Heterogeneous N2O5 reactions on atmospheric aerosols at four Chinese sites: improving model representation of uptake parameters, Atmos. Chem. Phys., 20, 4367–4378, https://doi.org/10.5194/acp-20-4367-2020, 2020.
Zhu, Q., Laughner, J. L., and Cohen, R. C.: Combining machine learning and satellite observations to predict spatial and temporal variation of near surface OH in North American cities, Environ. Sci. Technol., 56, 7362–7371, https://doi.org/10.1021/acs.est.1c05636, 2022.