
the Creative Commons Attribution 4.0 License.
the Creative Commons Attribution 4.0 License.
 | 22 Sep 2026
Seasonal to decadal evolution of firn properties and impacts on hydrology of the Juneau Icefield
Annika N. Horlings

Juliana Ruef
C. Max Stevens
Mikaila Mannello
Keegan Bellamy
Tahi Wiggins
Bradley Markle
Seth Campbell
Alpine glaciers of Alaska are significant contributors to global sea-level rise. Most Alaskan glaciers lose mass through surface melt due to increasing atmospheric temperatures. Surface melt may be retained or run off in the snow and firn, potentially altering regional glacial hydrology. Here, we used field observations and firn modeling to investigate seasonal to decadal changes in thermal and physical properties of firn on the Juneau Icefield, Alaska, and assessed the resulting impacts on meltwater retention and runoff. First, we found that measured mean density and liquid-water content generally increased up to 5 % and 71 %, respectively, during the 2024 summer season relative to our initial summer measurements. This indicates meltwater retention in the snow and firn, and reveals the potential for local or regional aquifers. Second, from 1980 to 2019, modeled firn thickness decreased at a rate of 1.2–3.3 m per decade and the firn-air content decreased at a rate of 0.43–0.83 m per decade. Third, we found that a reduction in modeled firn cold content was a primary driver of increased meltwater runoff from the firn (0.11–0.16 m i.e. per decade), decreased meltwater refreeze (0.37–0.44 cm i.e. per decade), and onset of seasonal runoff shifted earlier by 4 to 6 d per decade from 1980 to 2019. Our results suggest that firn on the Juneau Icefield and other similar temperate Alaskan alpine glaciers will continue to lose meltwater refreezing and storage capacity, routing increased melt directly into runoff. In addition, inter-seasonal shifts in liquid-water retention may introduce critical uncertainties in mass-balance calculations used for sea-level rise estimates.
- Article
(28431 KB) - Full-text XML
- BibTeX
- EndNote


1.1 Background
Alpine glaciers of Alaska constitute some of the most rapidly changing parts of Earth's cryosphere. Collectively, Alaskan glaciers contribute 22 % of global land-ice loss to sea-level rise and comprise 38 % of worldwide alpine glaciers that are currently undergoing accelerated thinning (The GLAMBIE Team, 2025; Hugonnet et al., 2021). Due to continued atmospheric warming from anthropogenic climate change, Alaskan glaciers are projected to remain a principal contributor to global sea-level rise through the end of the century (Fox-Kemper et al., 2021). Between 2015 and 2100, approximately 30 % of glacier ice in Alaska is expected to contribute 17±4 mm to global sea-level rise under emission scenario RCP 4.5 (Hock et al., 2019).
Most Alaskan glacier mass loss occurs through surface melt (Larsen et al., 2015). The firn layer – the permeable and porous material through which snow transitions into glacier ice – serves a critical connection between the surface and englacial or subglacial hydrological environment. Firn influences the speed and volume of meltwater flow through a glacier, as well as its geochemical composition (The Firn Symposium Team, 2024; Fountain, 1996). Rising atmospheric temperatures and increasing surface melt, in turn, can alter regional glacier hydrology, including firn properties and retention capacity. Understanding firn hydrology is fundamental to characterizing glacier dynamics and mass balance, with broad implications for global sea-level rise, downstream ecology, and regional water resources (The Firn Symposium Team, 2024). However, the transit of surface meltwater through the firn remains understudied (The Firn Symposium Team, 2024; Vandecrux et al., 2020), especially on high-melt and high-accumulation temperate alpine glaciers of Alaska (Stevens et al., 2024), where accumulation zones are located almost entirely in the wet-snow zone (i.e., characterized by warm snow and some degree of runoff). Consequently, our physical understanding of meltwater retention and runoff from the firn at these locations remains incomplete, especially with continued climate changes.
Here, we use a variety of field measurements (stratigraphy, density, and liquid-water content), a modeled surface mass-balance product, and firn modeling to investigate changes in firn properties over seasonal to decadal scales. We focus our study on the evolution of firn hydrology on one Alaskan glacier system: the Juneau Icefield in Lingít Aaní (i.e., Tlingit land in southeast Alaska and northwest British Columbia).
1.2 Firn hydrology
Meltwater flow through the snow and firn is driven by gravity and surface-tension gradients. Flow can occur vertically through a uniform wetting front or through preferential flow paths depending on climatic and subsurface conditions, or laterally along stratigraphic transitions (Moser et al., 2024; Hirashima et al., 2019; Clerx et al., 2022). Surface melt that infiltrates firn either refreezes into ice layers; is retained through the irreducible water content; is temporarily stored in seasonal or perennial features known as firn aquifers; and/or is drained into the englacial system or glacier bed via crevasses or moulins. Ultimately, meltwater discharges as runoff to downstream environments with varying temporal lags dependent in part on firn properties (Colbeck, 1974; Forster et al., 2014; Poinar et al., 2017; Culberg et al., 2021).
The timing and rate of meltwater transit through the firn layer, including retention and runoff, is governed by the thermal and structural properties (e.g., permeability) of the firn – processes that have been investigated using in-situ data, geophysical observations, and modeling (Humphrey et al., 2021; Fountain, 1989; Forster et al., 2014; Ashmore et al., 2020; Culberg et al., 2021; Shadab et al., 2024). Meltwater retention and runoff are influenced by: (1) the amount of meltwater that infiltrates into the firn, which introduces latent and/or sensible heat; (2) the amount of cold content (i.e., the energy required to bring the firn to the melting temperature) available to refreeze meltwater; (3) the pore space available to hold meltwater in the firn (Vandecrux et al., 2020; Humphrey et al., 2021); (4) structural (bulk and microstructural) heterogeneities, which impact permeability (McDowell et al., 2023; Machguth et al., 2016); and (5) the interplay of permeability and slope angle (i.e., on steeper slopes/higher permeability, water can move laterally more easily).
Meltwater refreezes when the cold content of the snow and firn equals or exceeds the amount of heat within the meltwater. At the transition from summer to winter, decreasing firn temperatures may refreeze the irreducible water leftover in the firn (Schneider and Jansson, 2004). Further, following high-melt seasons, formation of ice layers and ice slabs may release latent heat and/or section off portions of the deeper firn. These thermal and hydrological changes alter the firn's densification and response to surface melt by limiting deep melt infiltration, funneling meltwater along gradients, and/or priming firn for firn-aquifer formation through latent-heat release (e.g., Culberg et al., 2021; Machguth et al., 2016).
On many alpine glaciers and some polar ice-sheet regions, firn aquifers form in regions with high summer surface melt (approximately >0.24–0.65 m w.e. yr−1) and high winter snow accumulation (approximately >0.8 m w.e. yr−1) (Forster et al., 2014; Miller et al., 2020). Firn at these locations warms through meltwater infiltration and through refreezing, which may generate latent and sensible heat exchange.
Firn aquifers form when the thermal energy and mass from local meltwater recharge balance or exceed the corresponding thermal energy and mass losses from the aquifer – such as cooling from winter sub-freezing temperatures or drainage into crevasses; Miller et al., 2020). Formation and expansion of firn aquifers have been observed in the Arctic, driven by atmospheric warming and increasing melt (Ochwat et al., 2021; Horlings et al., 2022; Kindstedt et al., 2025). Firn aquifers are increasingly important to glacier dynamics and mass balance because they retain meltwater in the firn and prevent immediate runoff, store mass within the glacier, route water through crevasses to the bed, and/or dampen downstream velocity variations and can change the seasonal behavior of the hydrological system (Miller et al., 2020; Poinar et al., 2017).
In general, meltwater runoff efficiency and timing from the firn are influenced by the interplay of thermal, macrostructural, and microstructural properties of the snow and firn. This paper specifically focuses on the former two. Water exceeding the irreducible water content that cannot percolate downward is available for runoff. The irreducible water content is the residual portion of water retained in the pore space of firn due to capillary forces. While the irreducible water content is generally defined as approximately 6 %–8 % water saturation or 2 %–3 % of unit volume (Schneider and Jansson, 2004; Colbeck, 1974), some studies define the irreducible water content as a density-dependent relation (Coléou and Lesaffre, 1998). Further, meltwater runoff from the firn may be promoted by refreezing processes such as ice-layer formation, which may reduce or impede vertical percolation, increase lateral flow along the ice-layer surface into crevasses, and reduce the retention capacity of the firn (Machguth et al., 2016; Culberg et al., 2021).
Across many alpine glaciers in Alaska, firn volumes have decreased as atmospheric warming has increased (Mannello, 2023; Larsen et al., 2015). However, few studies have characterized firn hydrology within the wet-snow zone or on temperate alpine glaciers that have warm temperatures, high-melt rates, and high snow-accumulation rates, especially on Alaskan glaciers with these qualities (Machguth et al., 2023; Fountain, 1989; Stevens et al., 2024). Recent studies call for increased research on these Alaskan glaciers to understand firn hydrology, as well as for the improvement of glaciological applications such as firn-densification models and geodetic mass-balance calculations for more accurate sea-level rise estimates (Stevens et al., 2024). Quantifying the impact of atmospheric warming and increasing surface melt on firn properties, especially meltwater retention and runoff, is critical in high-melt and high-accumulation alpine environments such as those found in Alaska.
1.3 The Juneau Icefield
In this study, we investigated the evolution of firn hydrology on the Juneau Icefield, an interconnected glacier system in the Coast Range of Lingít Aaní (southeast Alaska/northwest British Columbia). As of 2019, the icefield consisted of over 1050 glaciers drained by 40 outlet glaciers (Davies et al., 2022). Climate on the icefield is predominantly temperate maritime with abundant snowfall, temperate conditions, and rainfall during summer. The eastern part of the icefield is characterized by a drier continental climate. Collectively, the Juneau Icefield is highly vulnerable to climate change. Its sensitivity is a result of an interplay of rising temperatures, increasing equilibrium-line altitudes (ELAs), decreasing albedo, and hypsometrically driven feedbacks, which has led to accelerated ice loss especially since 2005 (Hock et al., 2019; Davies et al., 2024). Mass loss on the icefield is projected to increase in the coming decades, with a potential volume decrease of at least 58 % by 2100 compared to 2010 (Ziemen et al., 2016).
The Juneau Icefield has an expansive accumulation zone in the north (>1500 m elevation) and in the south (>1200 m elevation) (Davies et al., 2024). Substantial loss of firn volume has occurred across the Juneau Icefield in recent decades (Mannello, 2023). While firn volumes and available pore space are decreasing on the icefield, we expected that cold content is the primary limiting factor for refreezing meltwater because the snow and firn are nearly isothermal, and because the available pore space is much greater than the total melt volume that occurs in the accumulation zone.
We motivate this study with two primary questions: (1) How have melt and firn properties changed over seasonal to decadal time scales on the Juneau Icefield? (2) How have these firn changes modulated refreeze and runoff? We hypothesize that the firn thinned and warmed due to increased wintertime temperatures and surface melt. These changes may have consequently increased runoff and altered seasonal timing of firn hydrological processes, depending on site location and specific melt events. We used three modes of investigation in this study: field measurements, a modeled surface mass-balance product, and firn modeling. We analyzed a surface mass-balance product from Ing et al. (2025) to determine changes in surface forcing that drive firn densification and evolution. We collected field measurements on the Juneau Icefield, Alaska during June and July 2024 to primarily investigate short-term changes in firn density, liquid-water content, and stratigraphy. Finally, we contextualized our measurements by simulating the decadal evolution of firn properties from 1980 to 2019 – including density, liquid-water content, meltwater retention, and meltwater runoff – using the Community Firn Model (Stevens et al., 2020).
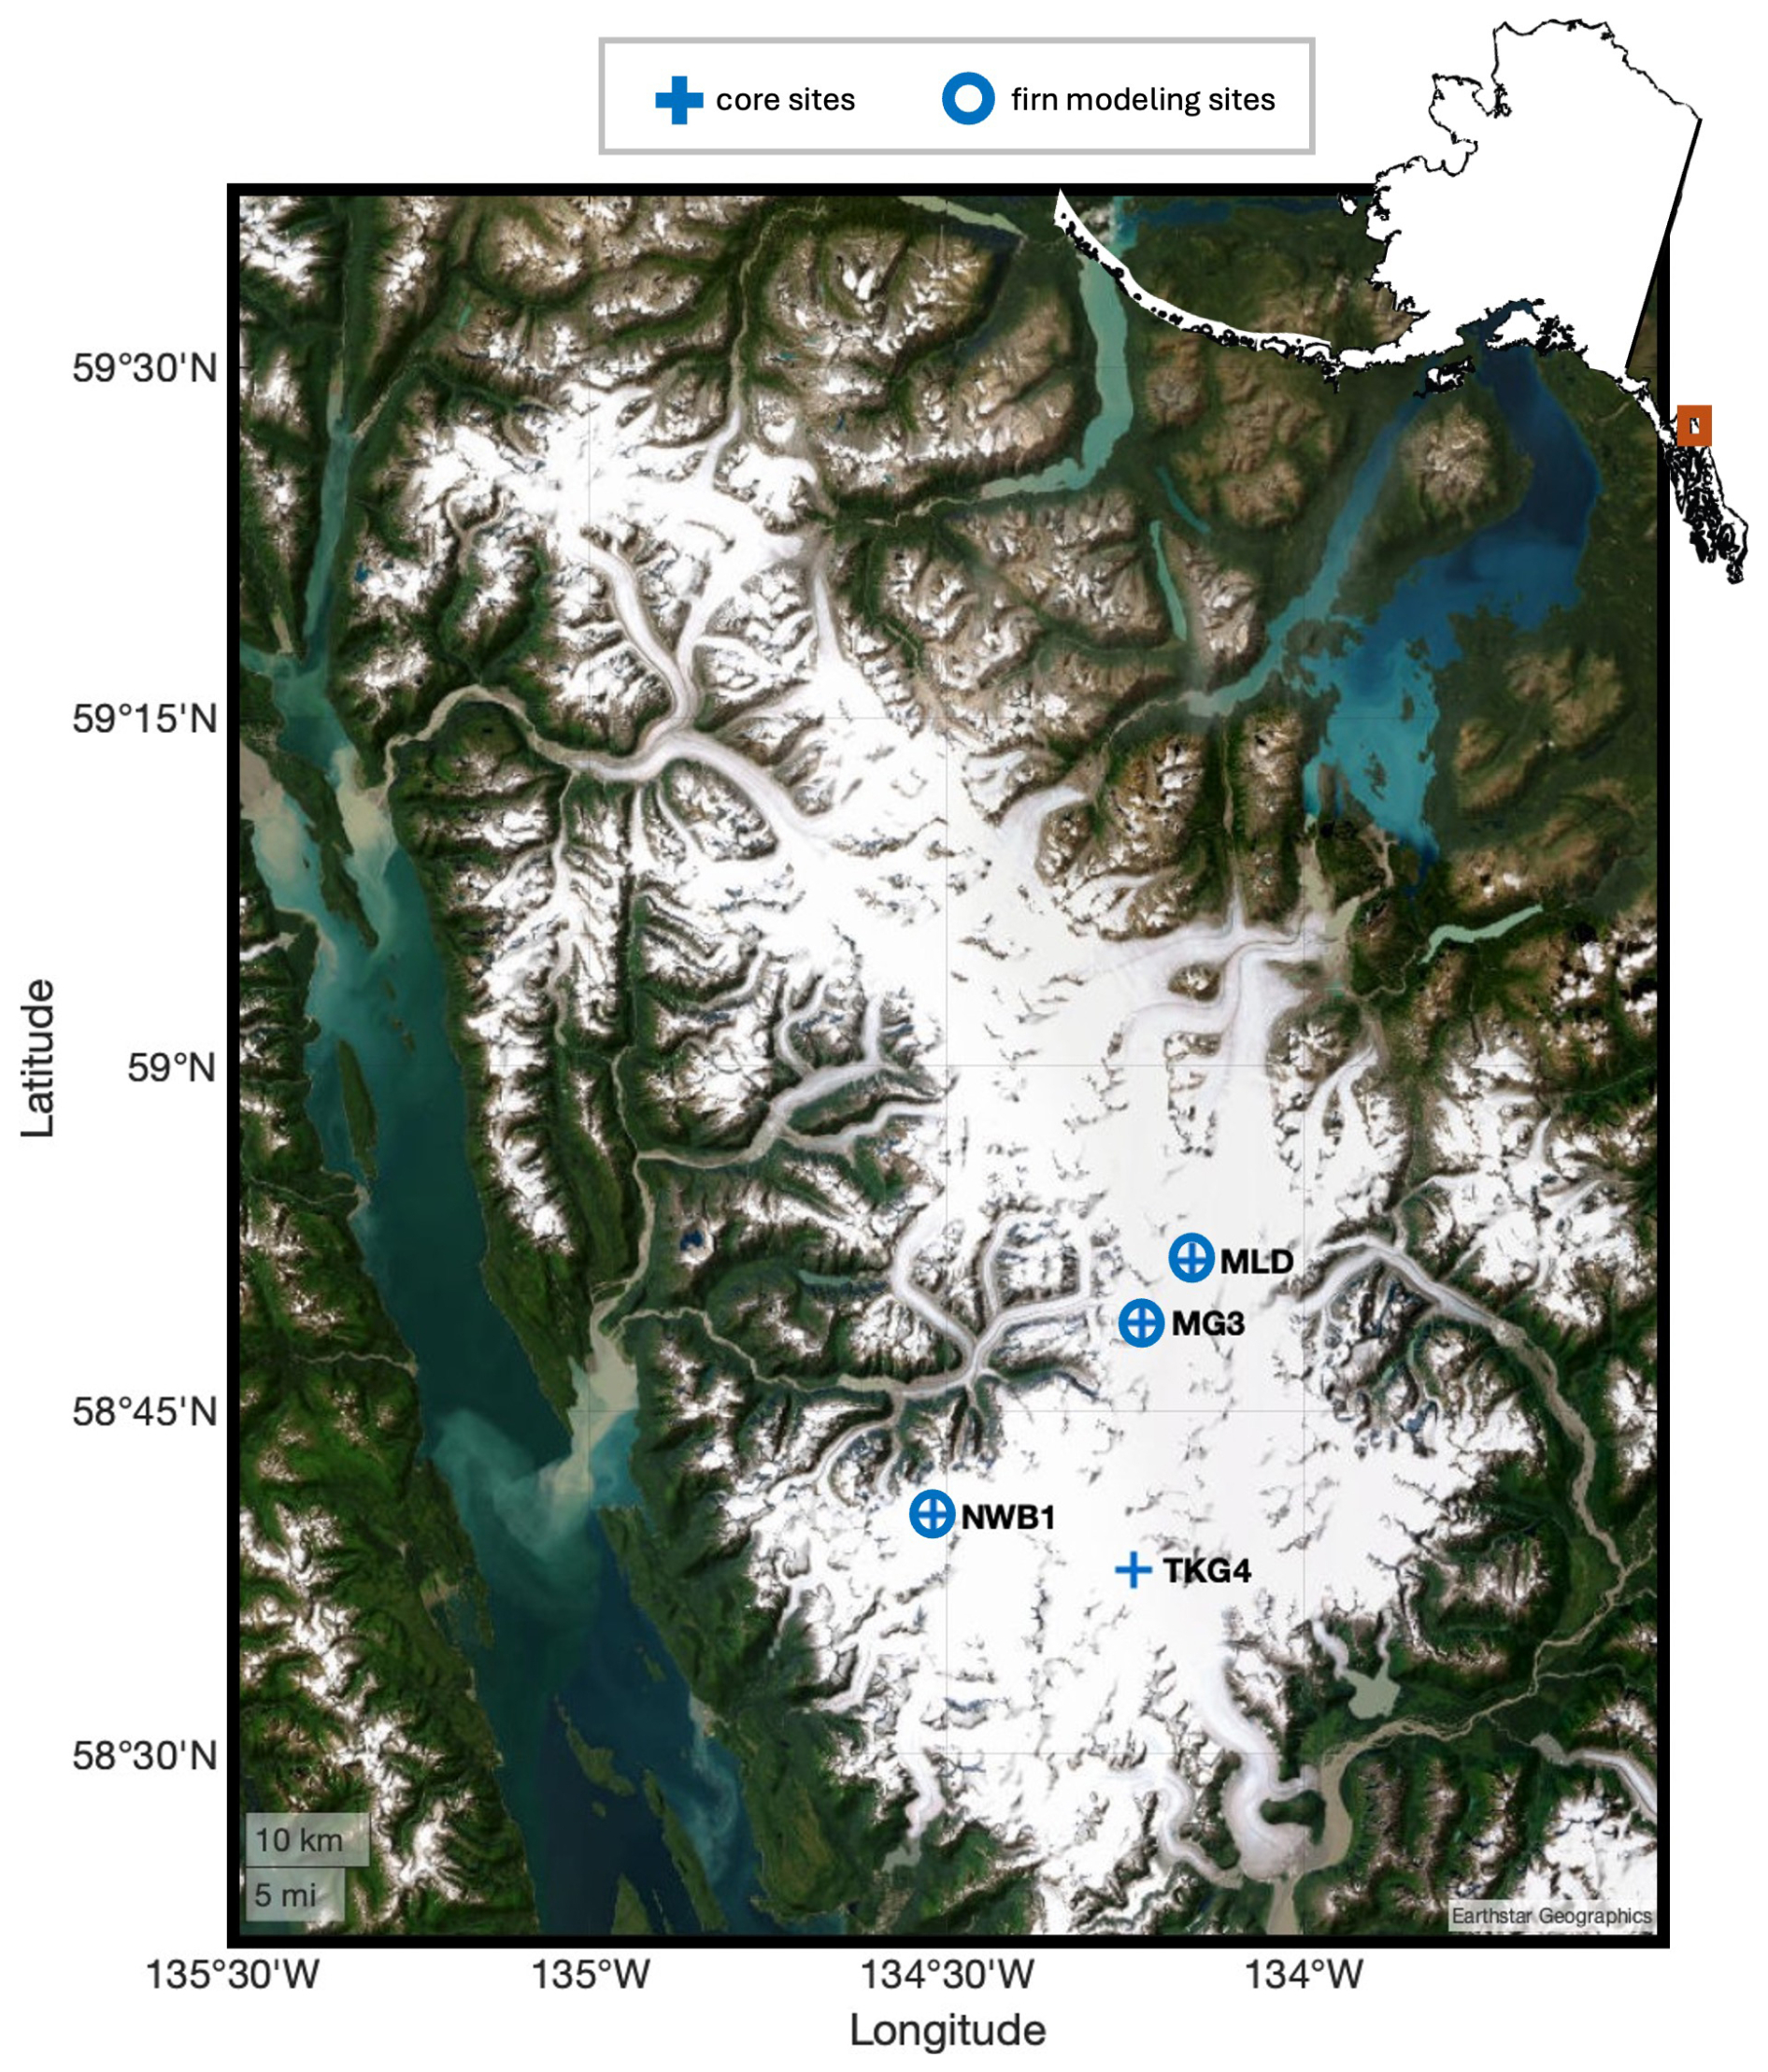
Figure 1Overview map of the Juneau Icefield and the four primary study sites, situated along the Taku Glacier and two of its tributaries (Matthes Glacier and Northwest Branch). Core sites are marked by blue crosses (MLD, MG3, NWB1, and TKG4). Sites that are in the accumulation zone – for which the Community Firn Model was run – are marked by a blue cross and blue circle (MLD, MG3, and NWB1). The brown rectangle represents the icefield region within Alaska. The base map is derived from the Randolph Glacier Inventory (RGI Consortium, 2023).
2.1 Sites
Our study focuses on four distinct sites on the Juneau Icefield: the Matthes and Llewellyn Glacier divide (MLD); intersection of the Matthes and Gilkey Glaciers (MG3); Northwest Branch of the Taku Glacier (NWB1); and a firn-covered site in the current ablation zone of the Taku Glacier (TKG4) (Fig. 1). These sites span different climatic regimes characterized by different altitudes, coastal proximity, and surface-mass balance (Fig. 2; Table 3). All sites also have a rich history of previous repeat mass-balance and snow-density measurements (McNeil et al., 2020). MLD is the site with the highest elevation (Table 3) and lowest melt rate (Table 1); NWB1 has the closest coastal proximity (Table 3) and highest snow-accumulation rates (Table 1); and TKG4 has the lowest snow-accumulation rates and highest melt rates (Table 1). Sites MLD, MG3, and NWB1 are located in the wet-snow zone, while TKG4 is located in the ablation zone. In the results, we discuss climate and firn modeling at the three sites in the accumulation zone only.
2.2 Climate
Between 1980 and 2019, we analyzed climate – including temperature, surface snow melt, snow accumulation, and rainfall – at the three accumulation-zone sites (MLD, NWB1 and MG3) using a reanalyzed, downscaled surface mass-balance (SMB) product from Ing et al. (2025). Ing et al. (2025) simulated historical and future SMB for the Juneau Icefield by forcing the COupled Snowpack and Ice surface energy and mass-balance model in Python (COSIPY) with three different climate reanalyses, which were originally dynamically downscaled to southeast Alaska by Lader et al. (2020). Ing et al. (2025) calibrated the model using the longstanding and rich historical measurement record from the Juneau Icefield.
From the climate products generated by Ing et al. (2025), we selected results from their model that used The Climate Forecast System Reanalysis (CFSR) (Saha et al., 2010) for three primary reasons. First, CFSR was chosen by Lader et al. (2020) because it is one of the top well-performing reanalysis models for southeast Alaska. Second, the output from the CFSR model shows good agreement with automatic weather-station observations at the Juneau airport (Lader et al., 2020). Third, the two alternative reanalyses that Ing et al. (2025) use (i.e., CCSM and GFDL) have higher and lower climate sensitivity compared to the CFSR model, respectively, and bracket the results from CFSR while producing similar means to CFSR (Ing et al., 2025). We use the CFSR climate output from Ing et al. (2025) to determine decadal to interannual climate changes, as well as input to the Community Firn Model. The product's spatial resolution is 0.01° latitude and longitude, and temporal resolution is daily. We use a linear least squares regression to calculate trends and rates of change of climate variables from 1980 to 2019.
2.3 Field measurements
2.3.1 Firn cores
We retrieved 13 firn cores at our four study sites (MLD, MG3, NWB1, TKG4) between 2 June and 25 July 2024. We used a FELICS 2-inch ice-core drill powered by a portable Honda generator to collect repeat cores at all sites (Fig. 3; Table 3). Additionally, to measure surface-melt rates, we installed an ablation stake at MLD, NWB1, and TKG4 and recorded surface-snow height at the time of each firn-core extraction. Repeat firn cores at each site were taken within 1–3 m of each other and retrieved at intervals ranging from one week to one month a part.
2.3.2 Stratigraphy
We recorded the stratigraphy of each firn core, including ice-lens depth in the core, ice-lens continuity, and ice-lens width; qualitative grain-size changes; snow-firn transition; and presence of liquid water. Uncertainty in the stratigraphic record is attributed to ruler accuracy and subjectivity of visual feature identification. We report all layer depths to 1 cm accuracy and relative to the first core's summer-snow surface at the site to account for ablation of the surface. Other reference depths, such as the previous summer surface, were difficult to discern within the cores, and the firn-ice transition was not reached for all cores (Fig. 3).
2.3.3 Density
For firn-core sections, we calculated density from mass (weighing the core samples) and volume (knowing the core length and diameter). Core sections were partitioned every 20 cm except in cases where natural breaks or ice lenses occurred. We report all depths associated with the density measurements relative to the first core's snow surface at the site (Fig. 3).
We follow Ochwat et al. (2021) and Kindstedt et al. (2025) to assess density and its uncertainties. Density (ρ) is defined in terms of mass m and volume V:
where . The variable f is defined as “cylindrical completeness” (0–1) (e.g., Ochwat et al., 2021), a subjective quantity, where 1 represents an intact core and numbers between 0 and 1 represent the fraction of the core's volume that is missing. L is the core-segment length and D is the core's diameter. Density uncertainties can be quantified through random and systematic uncertainties in mass and volume, per propagation of uncertainties:
and
where ; dm=0.3 g (which accounts for residual snow and liquid water on the core surface and the scale accuracy of 0.1 g); cm (which considers rough and/or crumbly edges of the firn core); df=0.1 for f≥0.8 and df=0.2 for f<0.8 (which accounts for more challenging visual inspection of less complete core samples, following Ochwat et al., 2021; Kindstedt et al., 2025).
We analyzed repeat firn cores to examine changes in the mean firn density through the summer season. We calculated mean core density using core sections that spanned identical depth intervals relative to the surface of the first core drilled at each location (representing the earliest core in the summer season). Because we did not take ablation-stake measurements at MG3, we were unable to calculate mean-density changes at that site.
2.3.4 Liquid water content
We used an A2 Photonics WISe sensor (e.g., Webb et al., 2021) to determine liquid water content (LWC) in the snow and firn. The sensor measures dielectric permittivity – the property characterizing the degree of electrical polarization in response to an external electric field – with a 325 cm3 sampling volume and marked uncertainty of 1 % vol LWC. Measurements were sampled at approximately 40 cm spacing on the firn cores for samples without ice lenses. We used Eq. (4) to convert permittivity (k; unitless) to volumetric liquid water content (θw; unitless) (Webb et al., 2021):
where ρs is density (in kg m−3); kw is the relative permittivity of liquid water at 0 °C (unitless); coefficients of 0.0014 and have implicit units of m3 kg−1 and m6 kg−2, respectively; and the bracketed part of the equation accounts for the impact of dry permittivity. For these calculations, we used measured density for ρs because concurrent permittivity and density measurements were available, and dry density cannot be directly measured after melt begins. We acknowledge that this approach may positively bias our LWC calculations.
We calculated mean LWC for repeat firn cores, defining comparable straigraphic intervals across cores based on the ablation rate and core length. Due to the lack of ablation-stake measurements at MG3, calculations of mean LWC changes were not possible at that site, as we could not establish the common depth range shared by repeat cores. Note that our LWC values are reported in percent volume (defined as the volumetric percentage of total volume of the material), and not water saturation (defined as the amount of pore space occupied by liquid water).
2.4 The Community Firn Model
We use the Community Firn Model (CFM) to simulate firn evolution at accumulation-zone sites MLD, MG3, and NWB1. The CFM is an open-source, modular model framework that is designed to simulate the evolution of a variety of firn properties including density, compaction rate, temperature, liquid water content, runoff and refreezing. The model framework includes 13 firn-densification equations in its current version. (Stevens et al., 2020). The CFM uses a one-dimensional Lagrangian framework to track the properties of firn parcels as they compact from the surface into glacier ice. Input to the model includes variables such as snow-accumulation rate, skin temperature, melt rate and surface-snow density.
We simulate the evolution of firn density, temperature, liquid-water content, runoff and refreezing from 1980 to 2019 with the Kuipers Munneke et al. (2015) densification equations. We choose the Kuipers Munneke et al. (2015) densification equations because they were developed to simulate firn densification in north and central Greenland and are often used for melt-affected areas. We also implement a bucket meltwater percolation scheme to handle meltwater flow through the firn.
We specifically use the CFM's bucket scheme, one of many treatments of meltwater retention and flow within water-saturated firn layers. In this bucket scheme, water may percolate downward when the water exceeds the capillary capacity of the firn parcel and will stop either when the water reaches a firn parcel that has enough cold content and pore space for refreezing, or when there is an impermeable layer such as an ice layer in which case the meltwater runs off (The Firn Symposium Team, 2024). If not refrozen or runoff in a particular parcel, the remaining water from each parcel will continue to percolate to the subsequently deeper parcel until all water is refrozen or runoff. While there are limitations with using bucket meltwater percolation schemes, currently, more complex models do not reliably model firn meltwater processes better than approaches that use a simple bucket scheme (Vandecrux et al., 2020; Verjans et al., 2019). Further, recent studies have used bucket schemes successfully in environments similar to our study area (e.g., Ochwat et al., 2021; Kindstedt et al., 2025).
We configured the model to treat ice layers with a density of 830 kg m−3 or greater and a minimum thickness of 10 cm as impermeable. As a result, water that encountered such layers immediately became runoff. We set the irreducible water content as dependent on the dry density, following Coléou and Lesaffre (1998). The CFM uses an enthalpy scheme to simulate heat transfer due to meltwater refreezing.
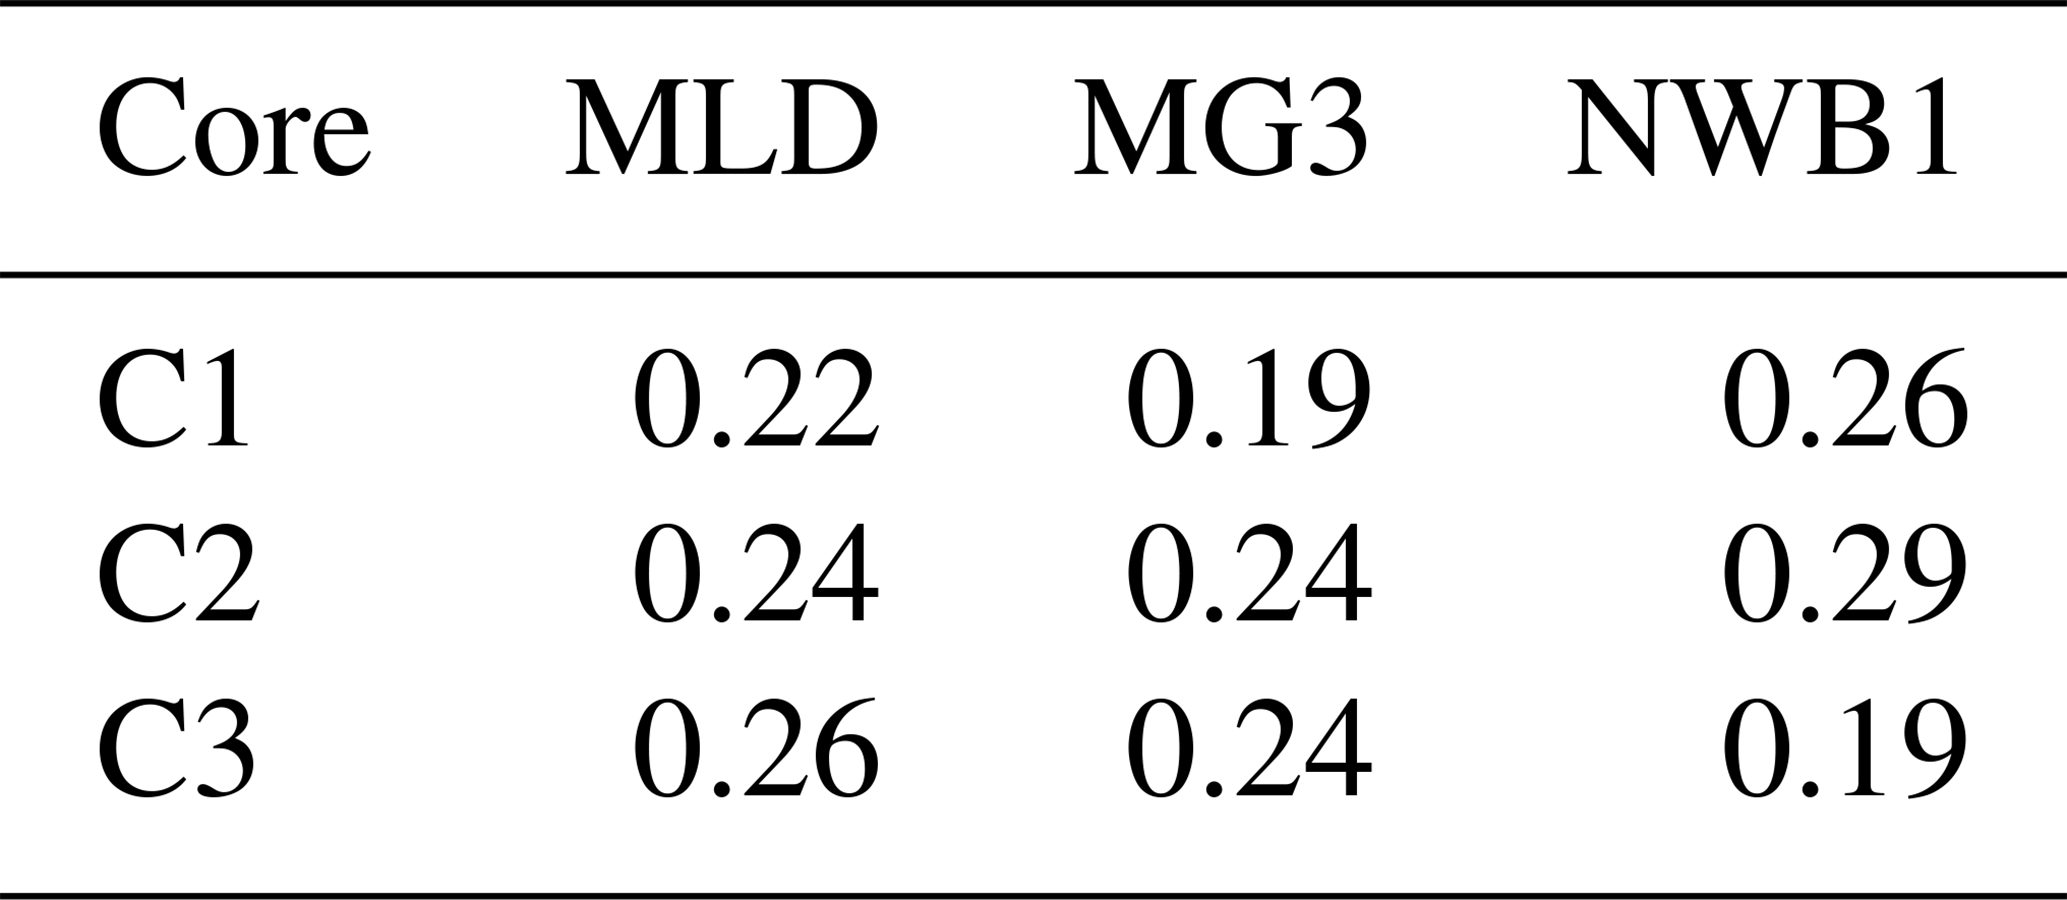
We forced the CFM with the CFSR SMB product from Ing et al. (2025) over 1980 to 2019 (Fig. 2). Consequently, the model outputs are confined to this temporal range and do not temporally overlap with our field measurements, which were taken in June and July 2024. In the model, we also prescribe a surface density of 350 kg m3. Qualitative analysis that tested surface densities showed that 350 kg m3 produced the best fit between the modeled depth-density profile and our measured depth-density profiles. Normalized Root Mean Square Deviation (NRMSD) values between the modeled and measured depth-density profiles are shown in Table 2.
Early in the melt season, the upper snow layer (∼ 350 kg m3) either melts away or densifies, and the modeled surface becomes slightly denser snow (∼400 kg m3) (Figs. A8 and A10). This is in agreement with our measured surface densities from our firn cores (Fig. 4) as well as previously published snow-pit density measurements from the Juneau Icefield (Mannello, 2023).
We spun up the model over 50 years by cycling the 1981–1990 climate interval five times following Medley et al. (2022). This approach was long enough to remove any firn leftover from the model's initial condition. We ran the model with 1 d timesteps, and output firn density, temperature, firn thickness, firn-air content, melt volume, meltwater refreeze, meltwater runoff, and liquid-water content. Where applicable, we report model input and output in units of meters of ice equivalent (m i.e.; multiply by the ratio of the density of glacial ice to density of water, 0.917, to convert to m w.e.). This is to clarify the unit from the abbreviation “i.e.” (id est) used elsewhere.
Further, we quantified the cold content, a key parameter determining the firn's meltwater refreezing capacity. We define the cold content (CC) for the upper 20 m of the firn column following Culberg et al. (2021):
Where c is the heat capacity of ice; ρj, Tj, and dzj are the density, temperature, and thickness of layer j in the model; and Tmelt is the melting temperature of ice.
3.1 Changes in climate
We examined snow accumulation, skin temperature, snow melt, and rainfall at the three sites in the accumulation zone (MLD, MG3, NWB1) for 1980 to 2019 (Figs. 2 and A1; Tables 1 and A1). From 1980 to 2019, mean annual surface temperature was −6.0 (MLD), −5.4 (MG3), and −4.6 (NWB1) °C, and increased at a rate of 0.20 (MLD), 0.16 (MG3), and 0.22 (NWB1) °C per decade. Mean cumulative annual snow accumulation was 2.6 (MLD), 2.4 (MG3), and 2.9 (NWB1) m i.e. a−1, and decreased at a rate of 0.12 (MLD), 0.12 (MG3), and 0.16 (NWB1) m i.e. a−1 per decade from 1980 to 2019. Mean cumulative annual surface-snow melt was 0.9 (MLD), 1.1 (MG3), and 1.5 (NWB1) m i.e. a−1, and increased at 0.11 (MLD), 0.11 (MG3), and 0.16 (NWB1) m i.e. a−1 per decade from 1980 to 2019. Mean cumulative annual rainfall was 0.15 (MLD), 0.18 (MG3), and 0.46 (NWB1) m i.e. a−1, with no long-term change.
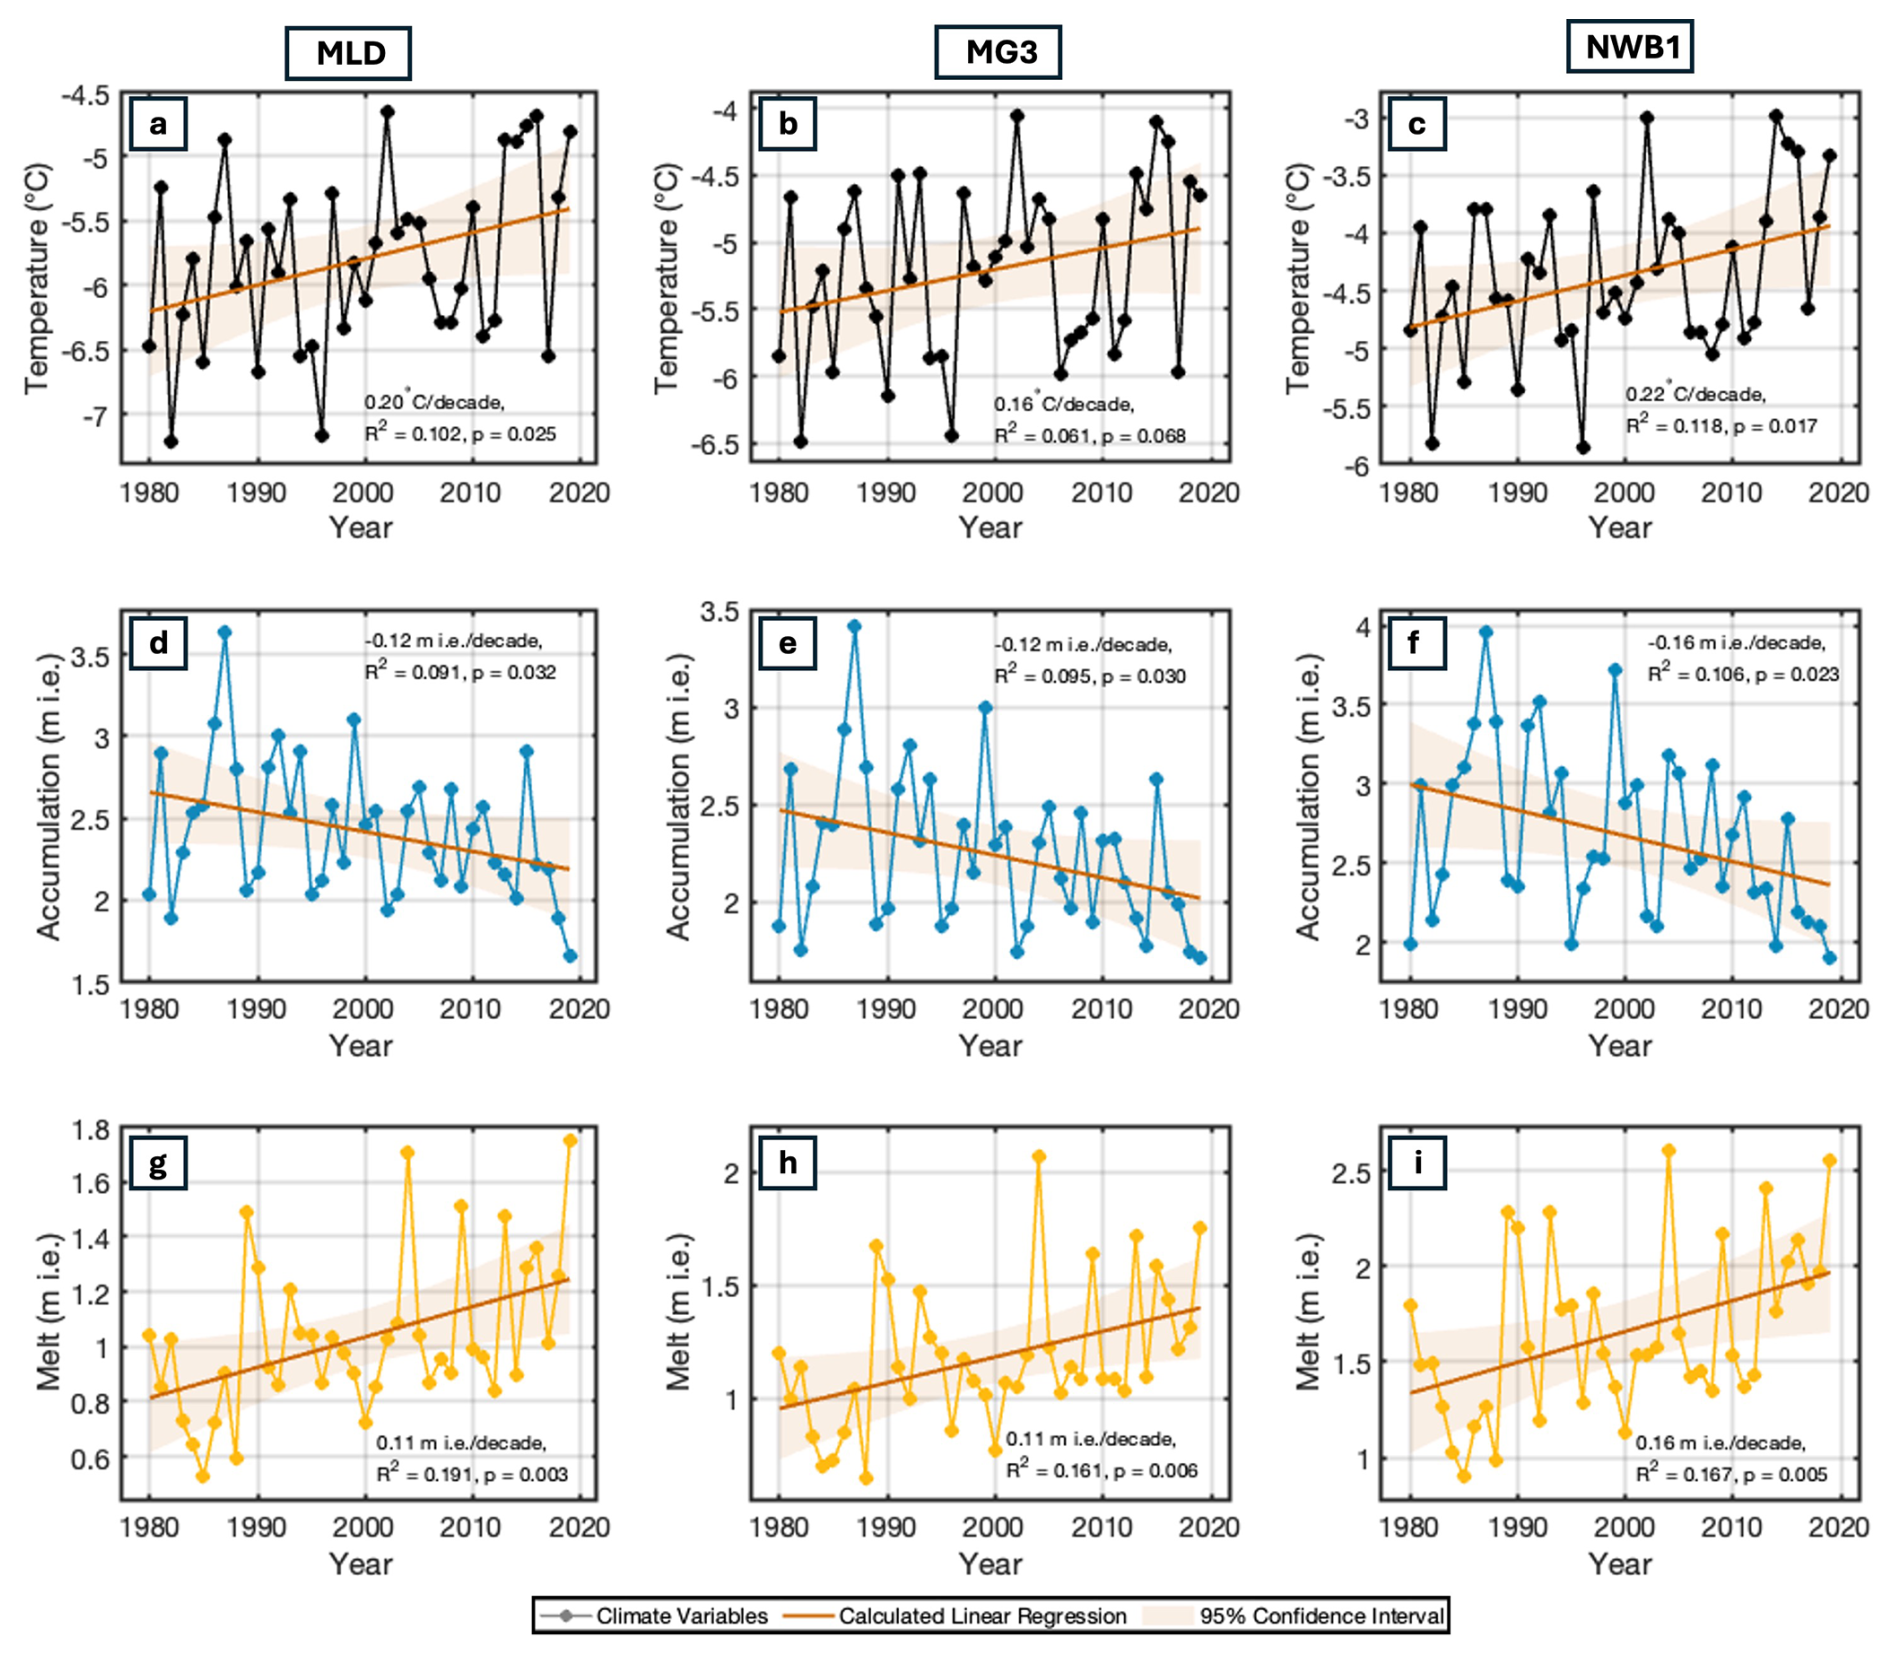
Figure 2Mean annual climate at each site in the accumulation zone (MLD, MG3, NWB1) derived from the product by Ing et al. (2025): mean annual temperature (a–c), cumulative annual snow accumulation (d–f), and cumulative annual surface melt (g–i).
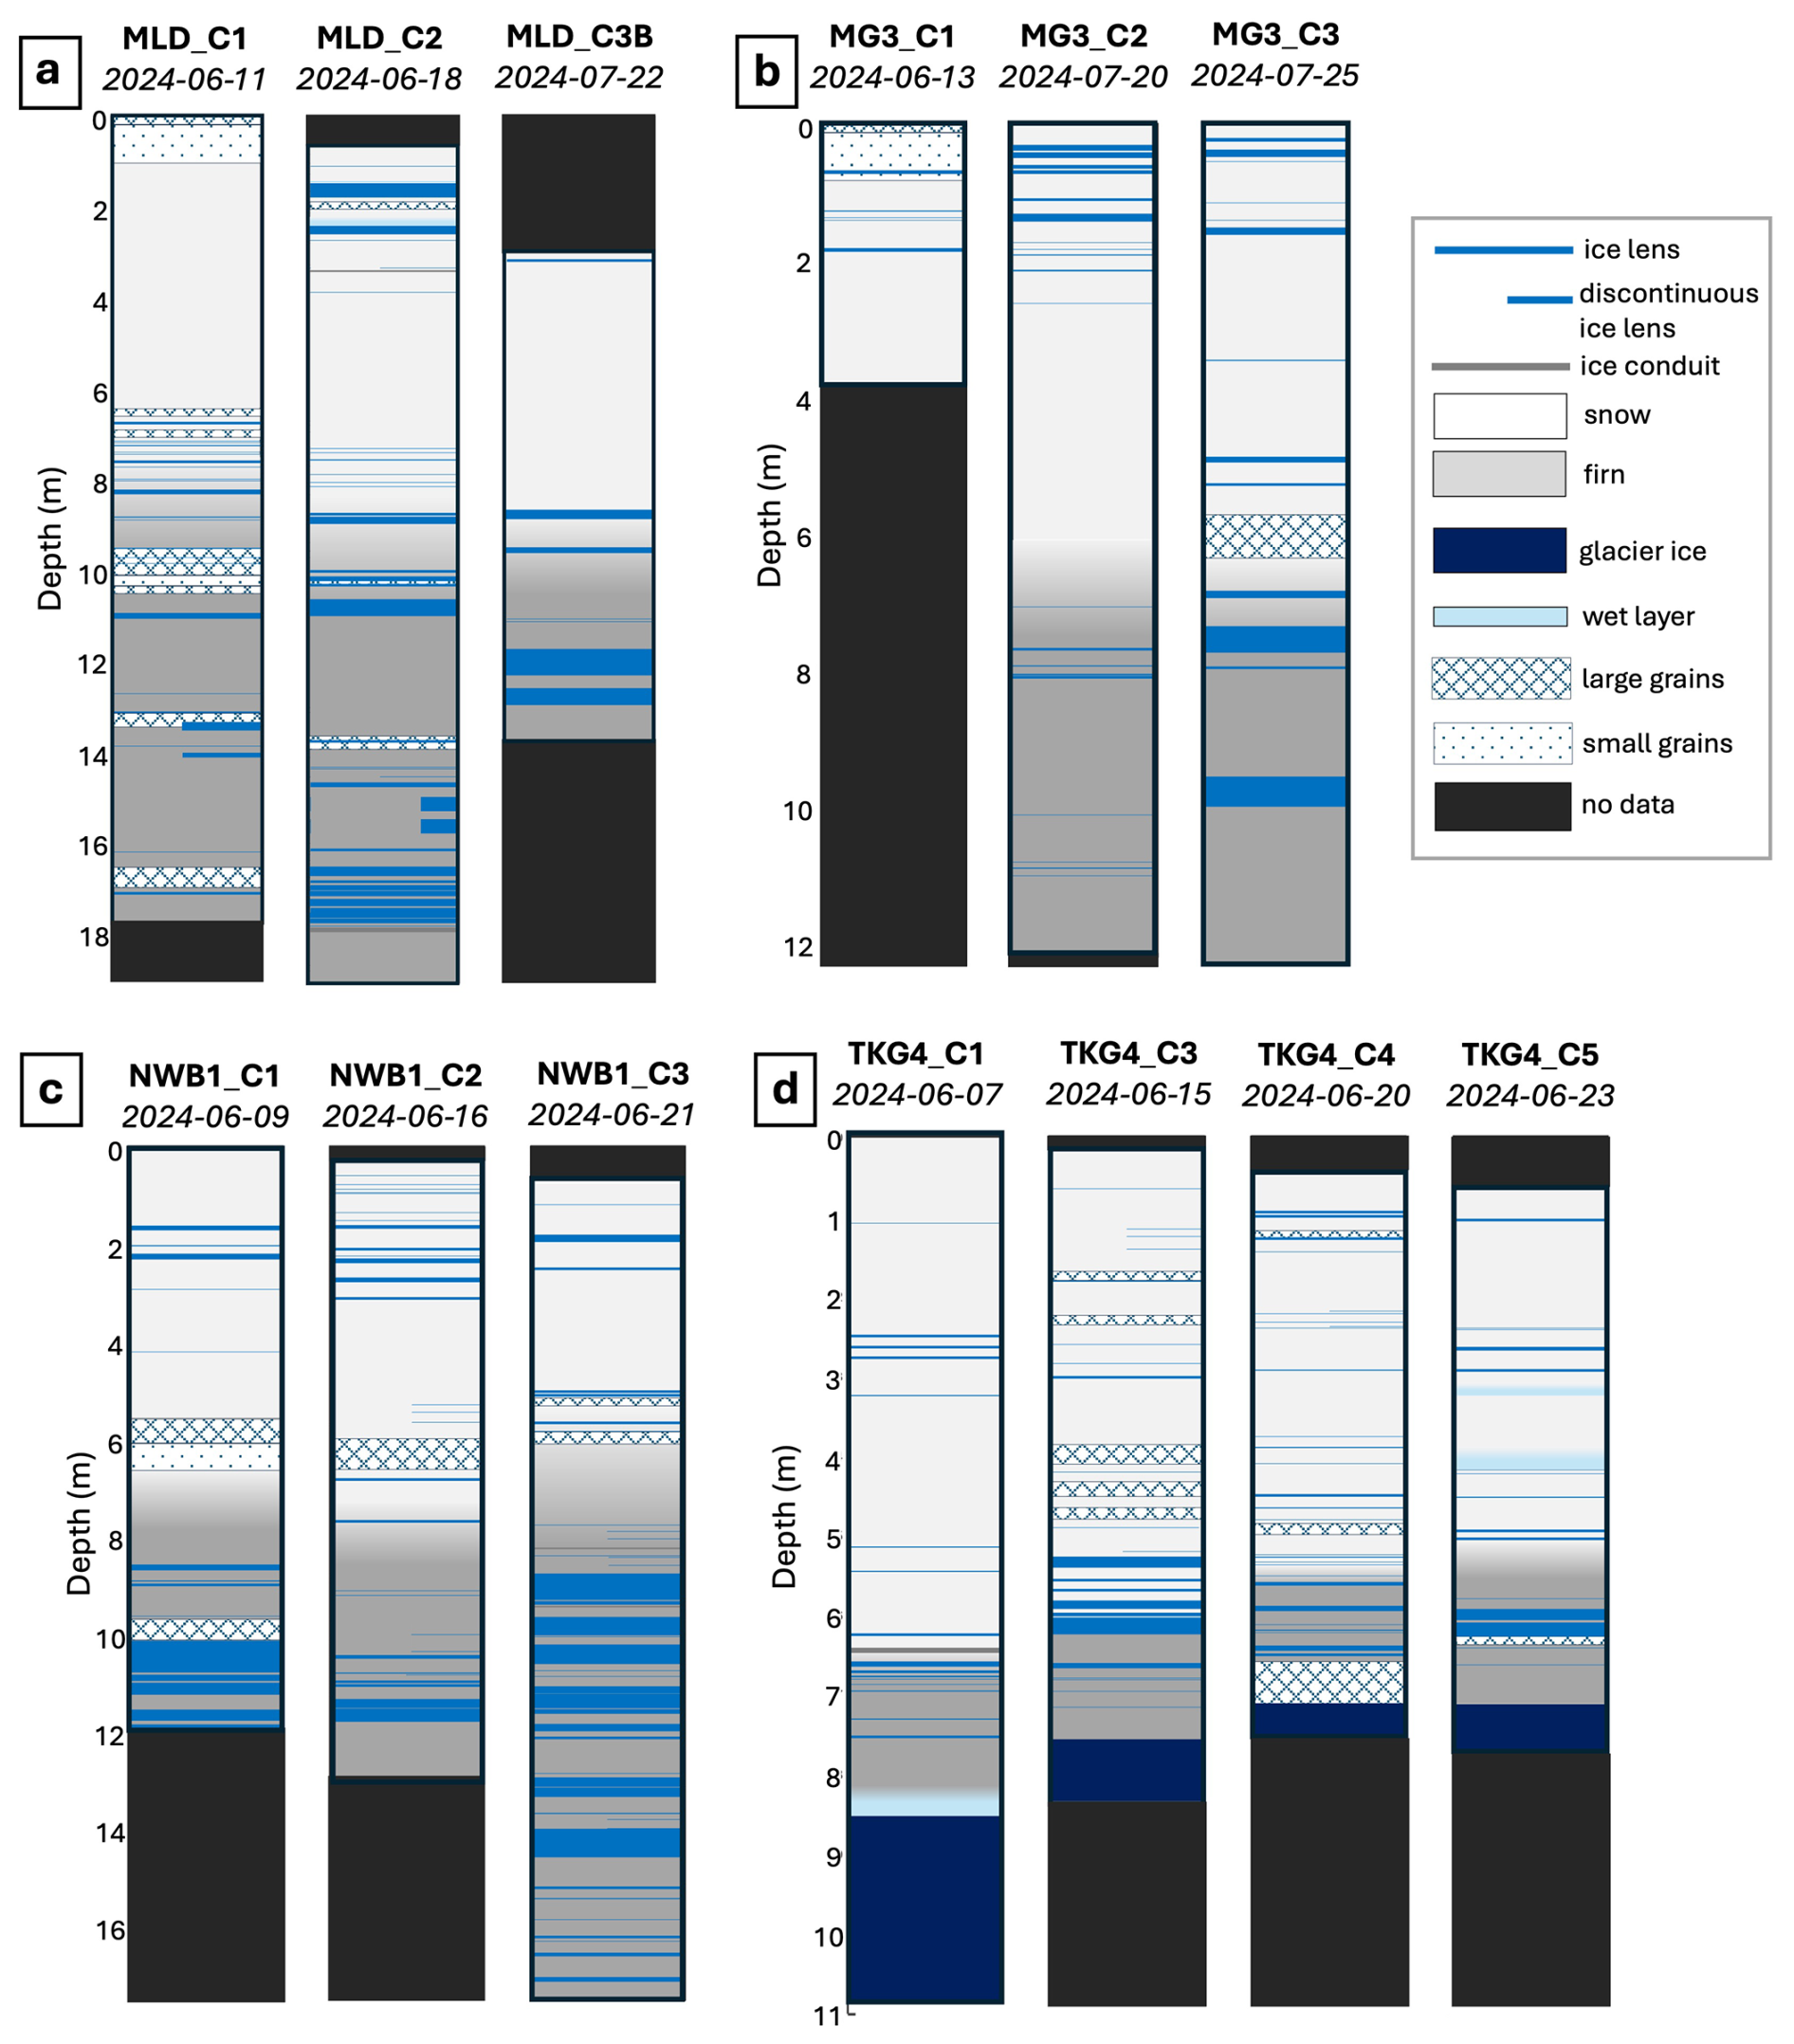
Figure 3Stratigraphy of the repeat firn cores at sites (a) MLD, (b) MG3, (c) NWB1, and (d) TKG4. All surfaces are corrected for ablation, except MG3, where no ablation measurements exist. Repeat cores were taken within 1–3 m of each other. Stratigraphic differences suggest high local variability in the snow and firn structure even in high-melt environments like the Juneau Icefield. Large volumes of liquid water were found at the base of the TKG4_C1 core. Note that there is no TKG4_C2 core, due drill malfunction.
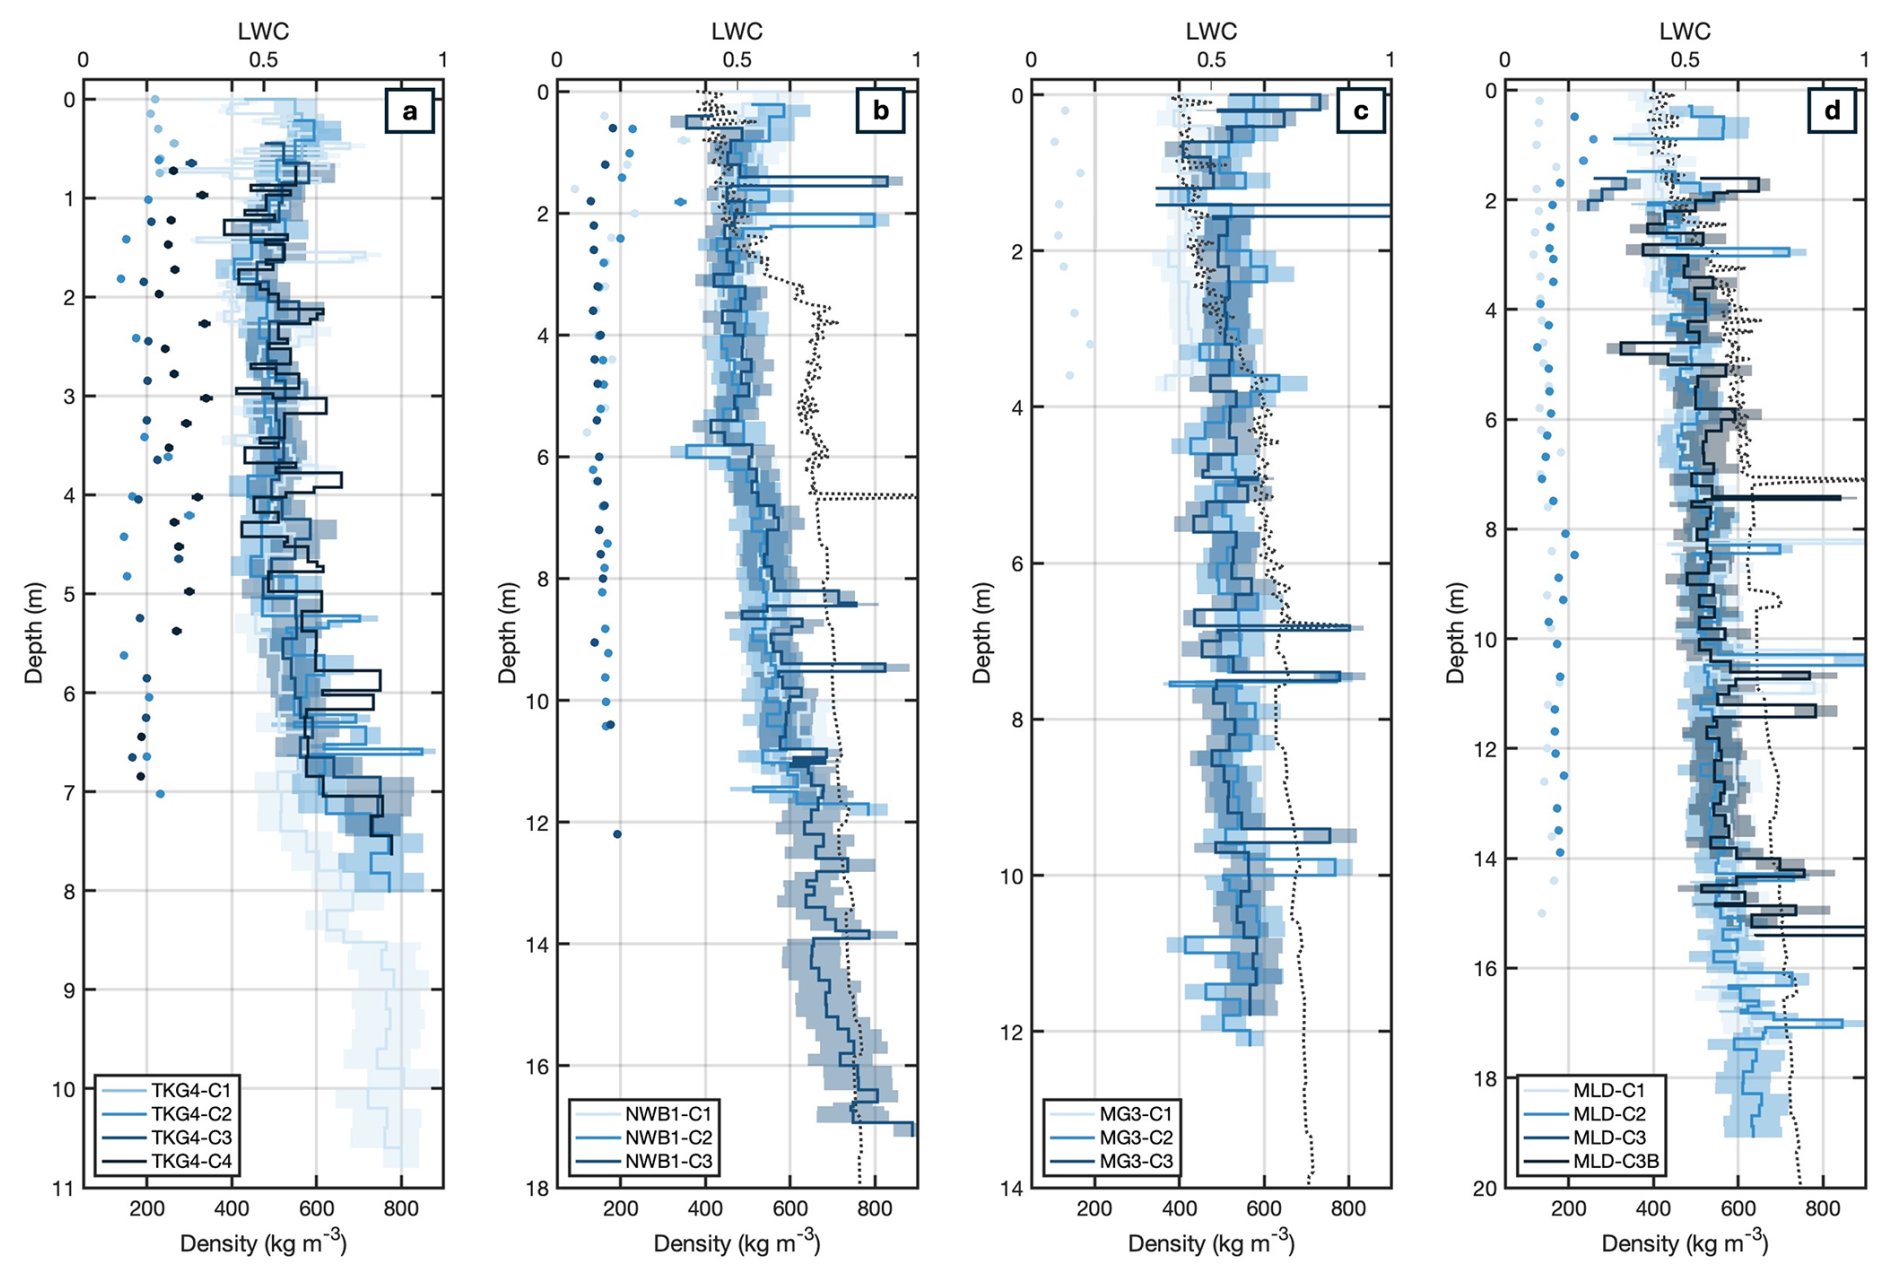
Figure 4Measured density (blue lines), uncertainty estimates for observed density (shaded region), modeled depth-density profile for 1 June 2019 (dotted black line for accumulation zone sites), and measured liquid water content (blue circles). (a) Site TKG4; (b) Site NWB1; (c) Site MG3; (d) Site MLD.
We compared the mean annual cumulative melt and the mean annual cumulative rain to mean annual cumulative snow accumulation (Figs. A3; Table A1). From 1980 to 2019, the melt-to-snow-accumulation ratio increased at a rate of 0.07 (MLD), 0.08 (MG3), and 0.10 (NWB1) per decade; the melt and rain-to-snow-accumulation ratio increased at a rate of 0.08 (MLD), 0.08 (MG3), and 0.11 (NWB1) per decade; and the rain-to-accumulation ratio showed no significant trends.
We also calculated high-melt years, defined as a year that exceeds one standard deviation above the long-term average mean-annual melt. For MLD, there were 6 high-melt years (1989, 2004, 2009, 2013, 2016, and 2019); for MG3, there were 7 high-melt years (1989, 1990, 2004, 2009, 2013, 2015, and 2019); and for NWB1, there were 8 high-melt years (1989, 1990, 1993, 2004, 2009, 2013, 2016, and 2019) between 1980 and 2019. Most high-melt years occurred within the last ten years of the interval, with 1989, 2004, 2009, 2013, and 2019 common to all the three sites.
Table 1Means and linear regression fits for climate over 1980–2019 at the three accumulation-zone sites in this study: MLD, MG3, and NWB1, derived from the climate product from Ing et al. (2025). Additional statistics are shown in Table A1.
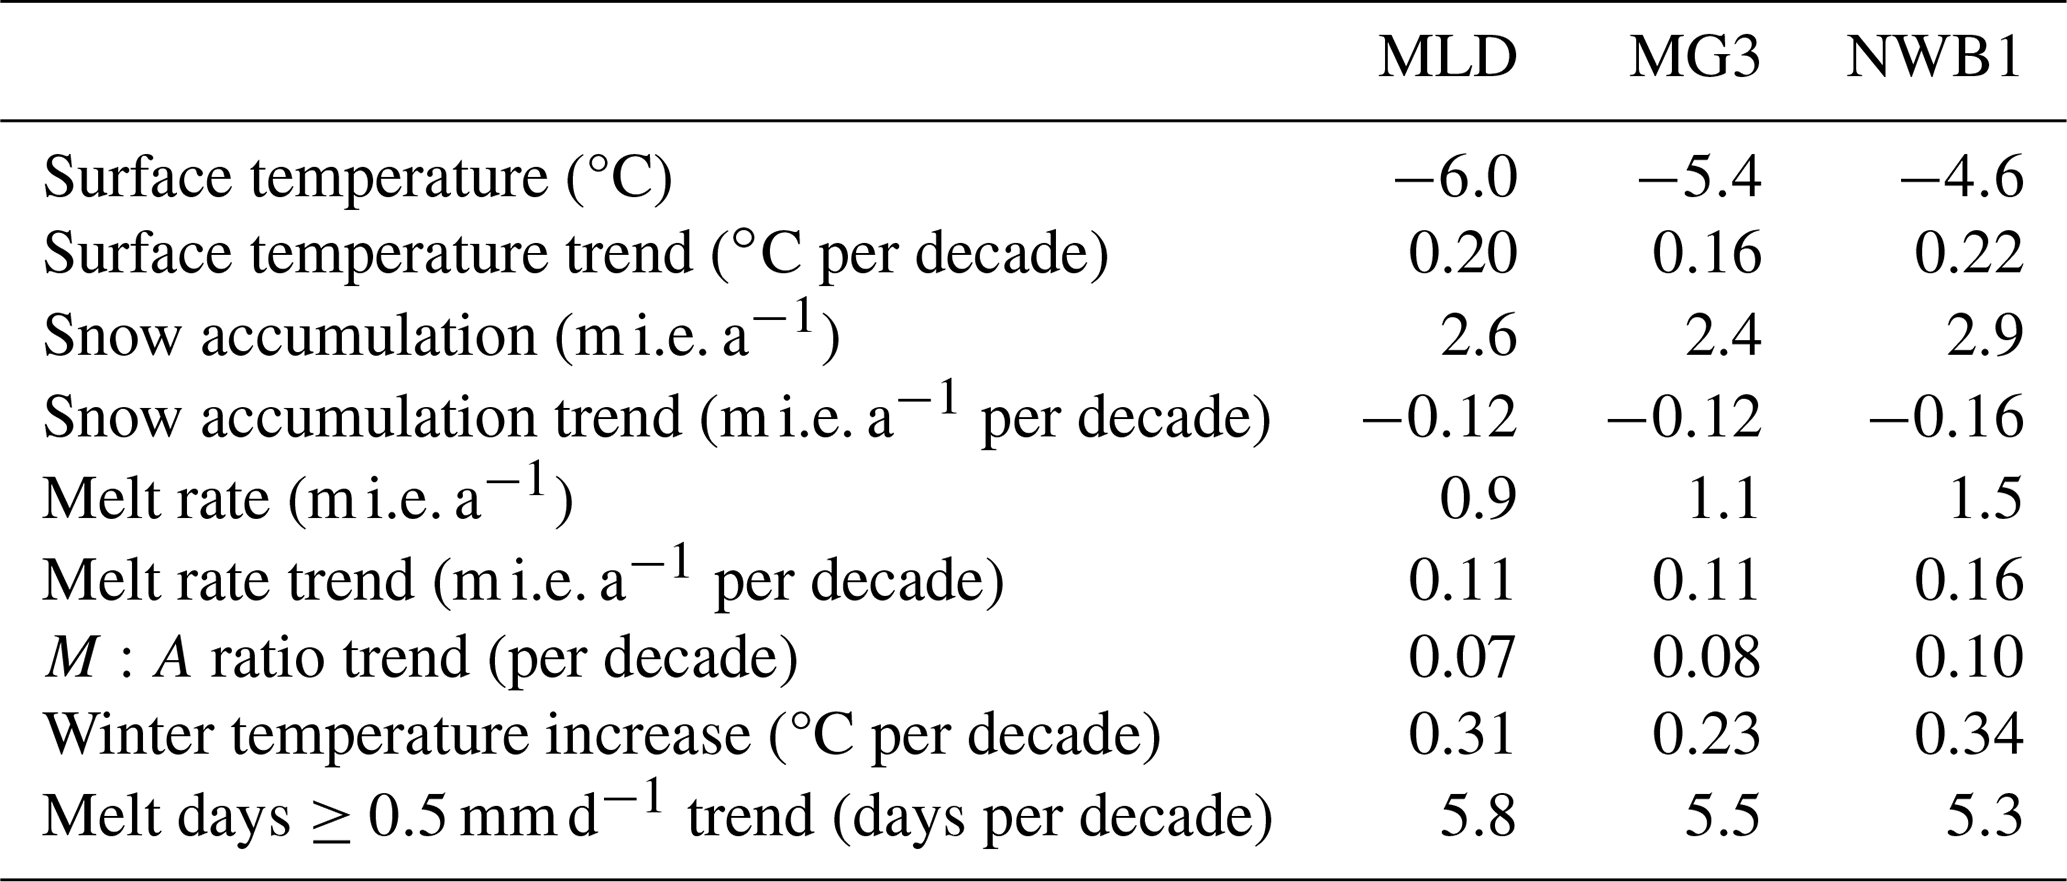
Mean annual winter temperatures (calculated from October to March) were −11 (MLD), −9.8 (MG3), and −8.3 (NWB1) °C and increased at a rate of 0.31 (MLD), 0.23 (MG3), and 0.34 (NWB1) °C per decade from 1980 to 2019 (Fig. A2; Tables 1 and A1). Onset of the melt season was on average 15 May (MLD), 12 May (MG3), and 6 May (NWB1), with no signifcant trends. The intensity of melt increased at all sites, where the number of “melt events” (defined as days with melt ≥0.5 mm d−1) increased at a rate of 5.8 (MLD), 5.5 (MG3), and 5.3 (NWB1) days per decade from 1980 to 2019. Statistics related to all climate analyses are shown in Tables 1 and A1.
3.2 Field measurements
We compared and tracked firn-core changes within an Eulerian framework, accounting for ablation as well as core length to establish consistent reference depth intervals.
Table 2Normalized Root Mean Square Deviation (NRMSD) calculated for modeled depth-density profile for 1 June 2019 and the measured depth-density profiles shown (Fig. 4).
3.2.1 Density
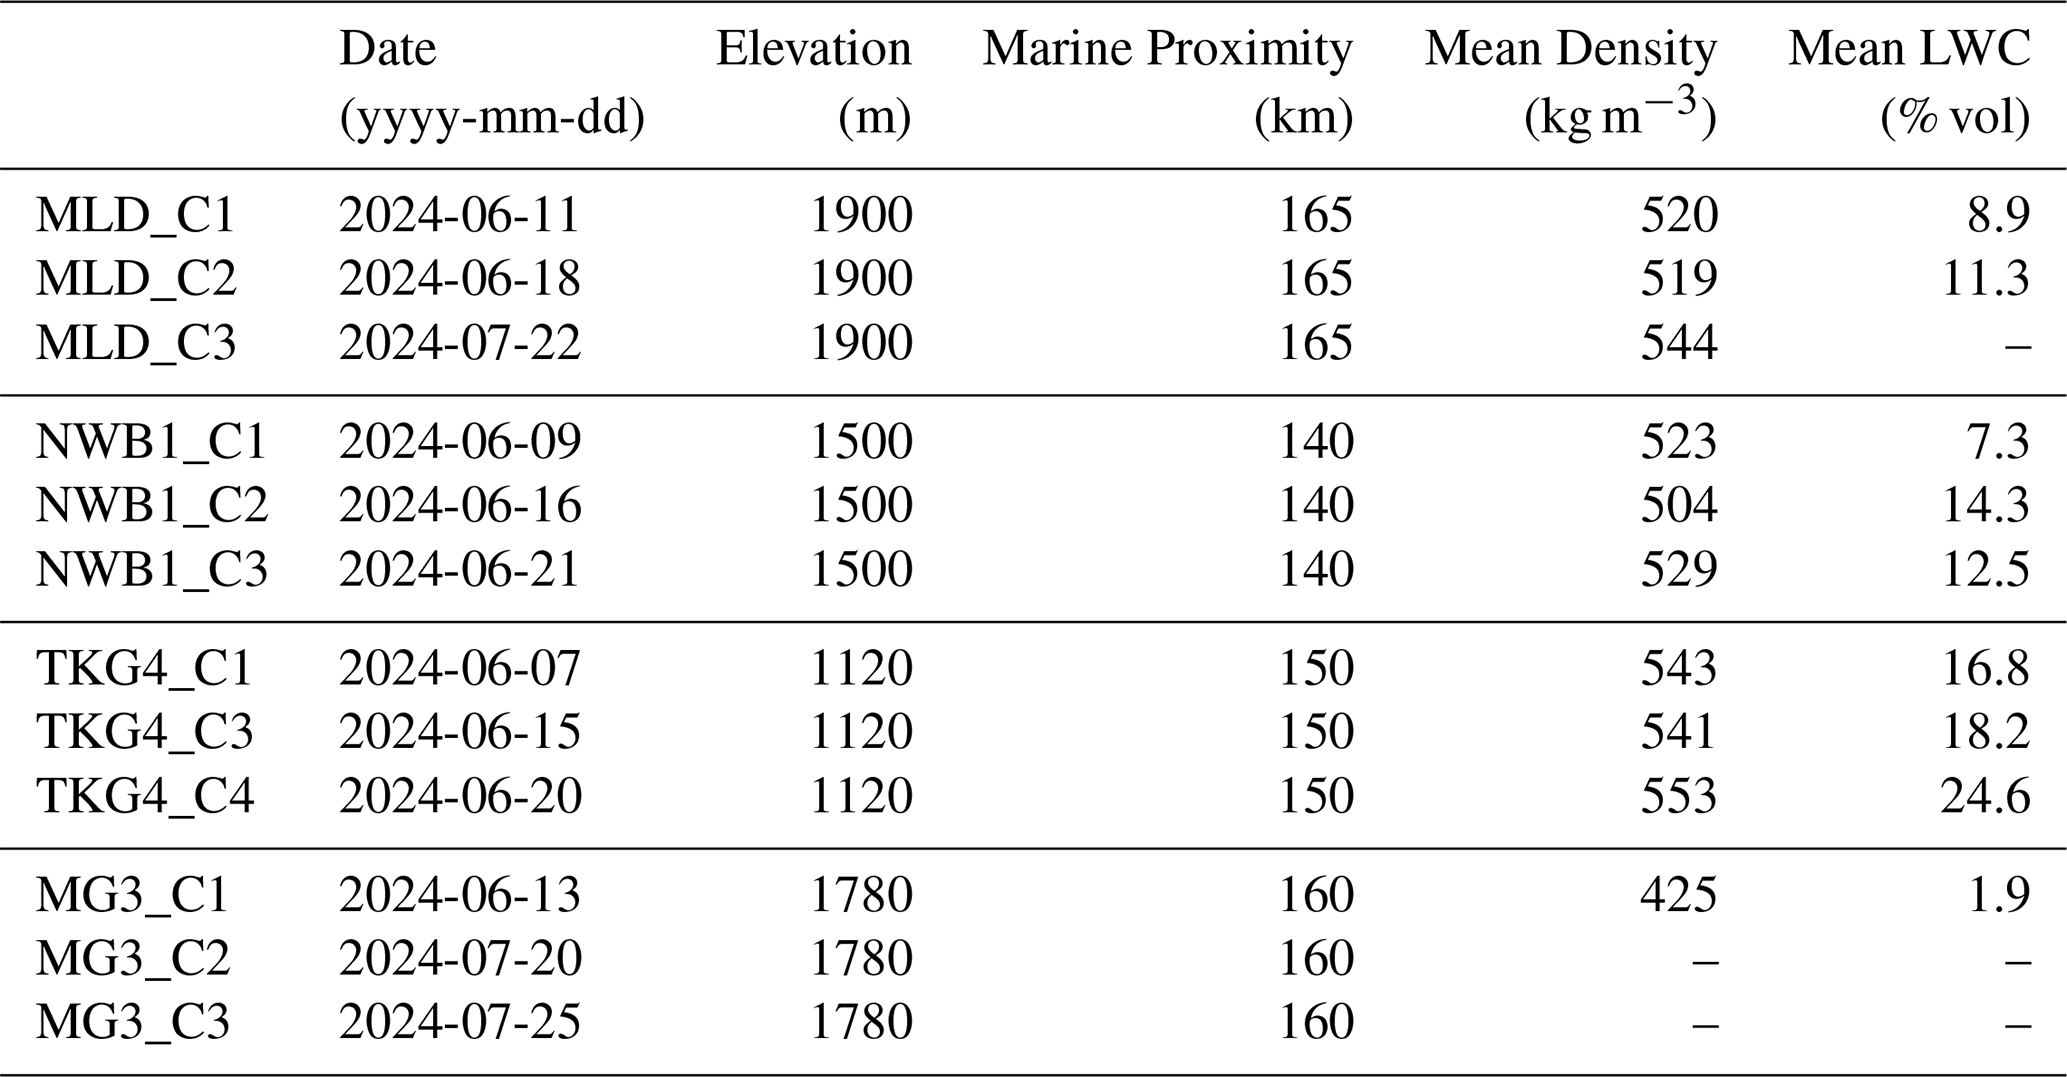
Densities for all repeat cores at MLD, MG3, NWB1, and TKG4 are shown in Fig. 4. Density varies due to ice layers, liquid water, and differences in snow and firn dry density. Mean density for all firn cores through the 2024 summer are shown in Table 3. Note that mean densities also include both liquid and solid phases. Increases in mass occurred at all sites over the season but did not increase linearly or monotonically, with a 4.6 % increase in density at MLD; 1.1 % increase in density at NWB; and 1.8 % increase in density at TKG4 between the first and last repeat firn core at the site. We note that some of the mean density changes observed between repeat firn cores are within the uncertainty range. For example, mean densities remain within uncertainty bounds between the first two cores at MLD and TKG4. Densities decreased between NWB1_C1 and NWB1_C2, however, all mean densities subsequently increased.
3.2.2 Liquid water content
The measured depth-averaged volumetric liquid-water content (LWC) generally ranged from 7 % vol to 25 % vol at all sites (Fig. 4). We collected LWC measurements at approximately 40 cm depth intervals – about every other core sample – until the firn density exceeded the sensor's threshold (approximately 550 kg m−3). Logistical time constraints prevented LWC measurements in July.
Depth-averaged LWC generally, but not always, increased over the summer season (Table 3): with a 27 % increase in LWC at MLD; 71 % increase in LWC at NWB1; and 46 % increase in LWC at TKG4. Site TKG4 generally exhibited the highest LWC of all sites, with a mean core value >16 % vol and highest values at 34 % vol. Liquid water was observed draining from the base of TKG4_C1 (not shown in Fig. 4), although no WISe-sensor measurements were taken on the core. Notably, we did not find liquid water during subsequent sampling at site TKG4. Site NWB1 exhibited high LWC (up to 35 % vol) near the surface but similar lower LWC to MLD at depth (approximately 7 % vol–14 % vol mean LWC) and generally lower LWC than TKG4. For NWB1, mean LWC increased then decreased through the season. In contrast, LWC at MLD increased (by ∼2 % vol–3 % vol) between the first two cores at all depths, especially in the upper 3–4 m. LWC sampling at MG3_C1 was limited to nine times before the drill became immobilized due to freezing. Total uncertainty of LWC measurements accounts for instrument errors (1 % vol) and potential melting of the samples between recovery and measurement (which we designate as 2 % vol).
Table 3Elevation, marine proximity (defined as shortest distance to the Pacific Ocean), and changes in mean density and liquid-water content (LWC) across repeat firn cores, calculated for shared depth intervals unique to each site. Each repeat firn core at a given site was drilled within 1–3 m of each other and retrieved within one week to one month a part. Since ablation was not measured at MG3 and LWC was not measured in MG3_C2 and MG3_C3, we cannot accurately compare core sections and cannot accurately compare mean-density or LWC changes there. Instead, we show the average snow density and LWC for MG3_C1 only.
3.2.3 Stratigraphy
The stratigraphy of all cores was a mixture of snow, firn, ice layers, and some variation in grain size (Fig. 3). Upon retrieval of one core (TKG4_C1), we observed liquid water draining from the deepest core sections. Grain size was only intermittently and qualitatively noted on all cores when significantly large or fine, and therefore we do not provide a detailed description of grain transitions.
In cores MLD_C1 and MLD_C3, the upper 6 and 5 m, respectively, were mainly snow. In contrast, core MLD_C2 had two significant ice layers in the upper 2 m (up to 6 cm thick) and some smaller (0.25 cm) ice layers. At the snow-firn transition for each core at MLD, there were a cluster of ice layers: small to large ice layers in MLD_C1 and MLD_C2 (0.25–3 cm thick), and larger (>0.25 cm) ice layers in MLD_C3 (up to 11 cm thick). Large snow crystals occurred above the snow-firn transition in MLD_C1. Below the snow-firn transition in core MLD_C1, there were three isolated ice layers (1–2 cm), and a multitude of hairline ice layers throughout. In contrast, there were clusters of ice layers (1–2 cm and up to 8.5 cm in thickness) around 10 m in depth and 14–17 m in depth in core MLD_C2. Thick ice layers (3–22 cm thick) clustered also around 10 m in depth in core MLD_C3, shortly before its end at 13 m.
In the upper 0–3 m of the snow in cores NWB_C1, NWB_C2, NWB_C3, there were smaller ice layers (0.25–1 cm in C1; 0.25–2 cm in C2; and 0.25–3 cm in C3). Coarse snow grains existed in the 2–4 m above the snow-firn transition. Below the snow-firn transition, significant ice layers were identified in cores NWB_C1, NWB_C2, NWB_C3 but with variable clustering and thickness. In core NWB_C1, many clustered ice layers (up to 4.5 cm thick) existed from 10–12 m depth. In contrast, in core NWB_C2, several isolated ice layers occurred at 11 m depth (up to 4–5.5 cm thick) but were fewer than core NWB_C2. Core NWB_C3 had the most ice layers at NWB1, with many clustered and isolated ice layers between 8 and 14 m in depth (up to 6 cm thick and multiple >4 cm thick).
We identified small ice layers (0.25–3 cm thick) in the snow of cores TKG4_C1, TKG4_C3, TKG4_C4, and TKG4_C5. From 3–5 m depth in core TKG4_C5, there were 10 and 20 cm portions of liquid-water saturated snow. In TKG4_C1, we encountered liquid water spilling out of the base of the drill at and above the firn-ice transition. In the firn of TKG4_C1, a section of smaller ice layers (0.25–1 cm thick) occurred between 6 and 7.5 m. In TKG4_C4, a section of smaller ice lenses (0.25–3 cm) were present between 5 and 7 m in depth. A section of large ice layers (1–5.5 cm thick) occurred between 5–6.5 m depth in TKG4_C3, and between 6 and 7 m depth in TKG4_C5.
In MG3_C1, there were ice layers from 0–3 m in the snow of all repeat cores. In the upper 1 m of MG_C1, there was a 12 cm section of large crystals. In MG3_C2 and in MG3_C3, there were ice layers (0.25–4 cm thick) in the upper 2 m. In cores MG3_C2 and MG3_C3, there were larger ice layers (> 0.25 cm) in the upper 3 m, whereas in MG3_C1 there were only hairline ice layers. Some small ice layers occured in the firn of MG3_C2 (1–2 cm thick). In contrast, substantial ice layers existed in the firn of MG3_C3 (up to 12.5 cm thick).
Table 4Select modeled firn results from the Community Firn Model (Stevens et al., 2020) using the Kuipers Munneke firn model with a bucket scheme and irreducible water content defined by Coléou and Lesaffre (1998), forced with CFSR climate data derived from Ing et al. (2025) from 1980–2019.
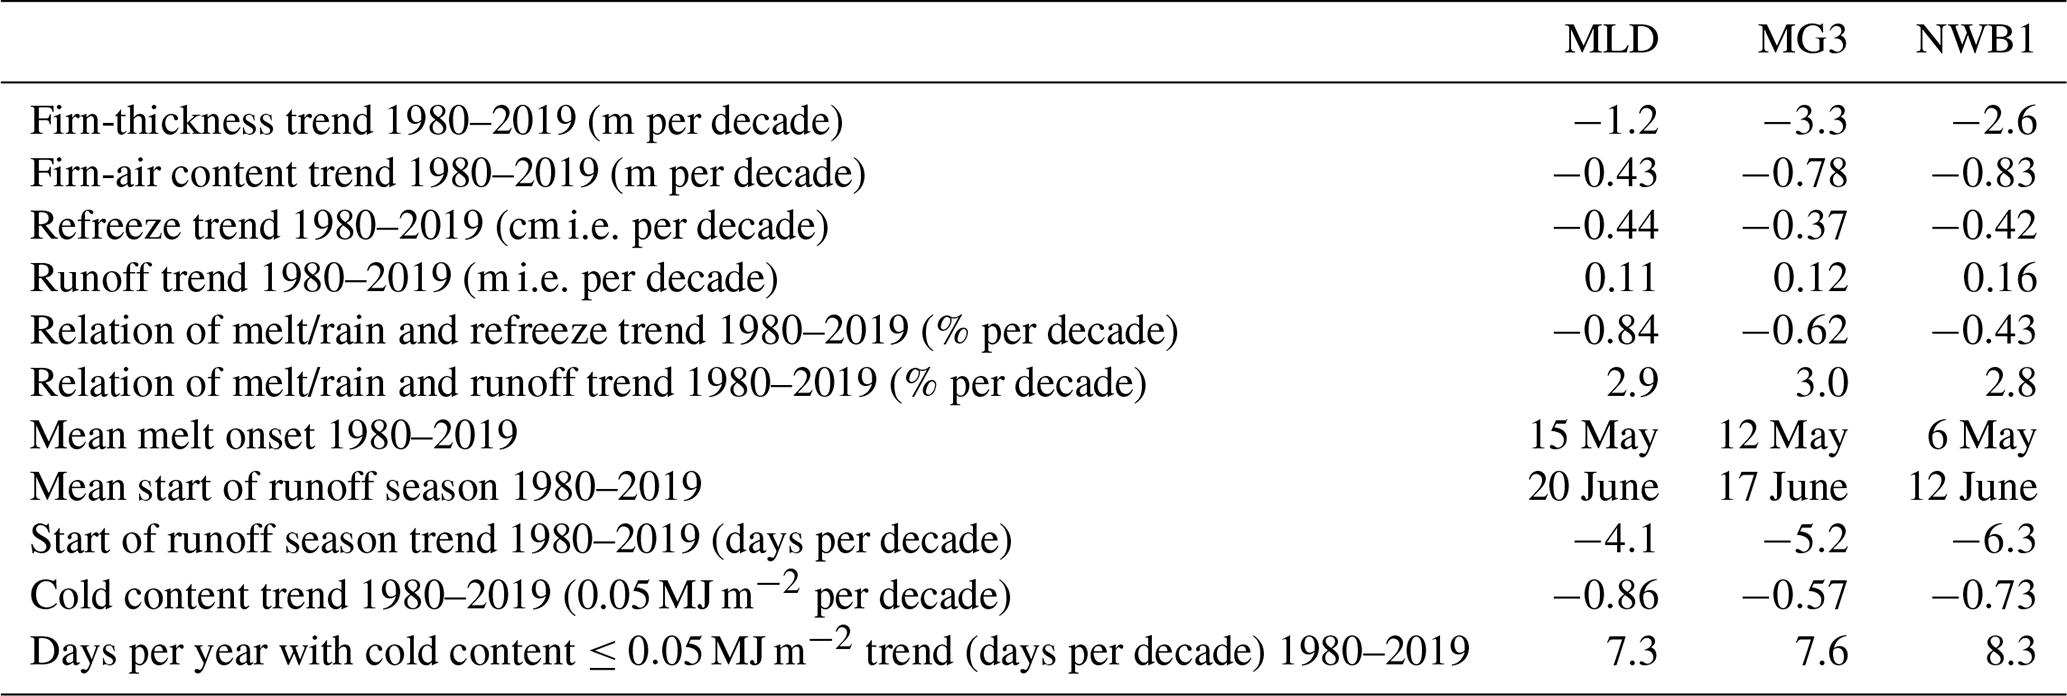
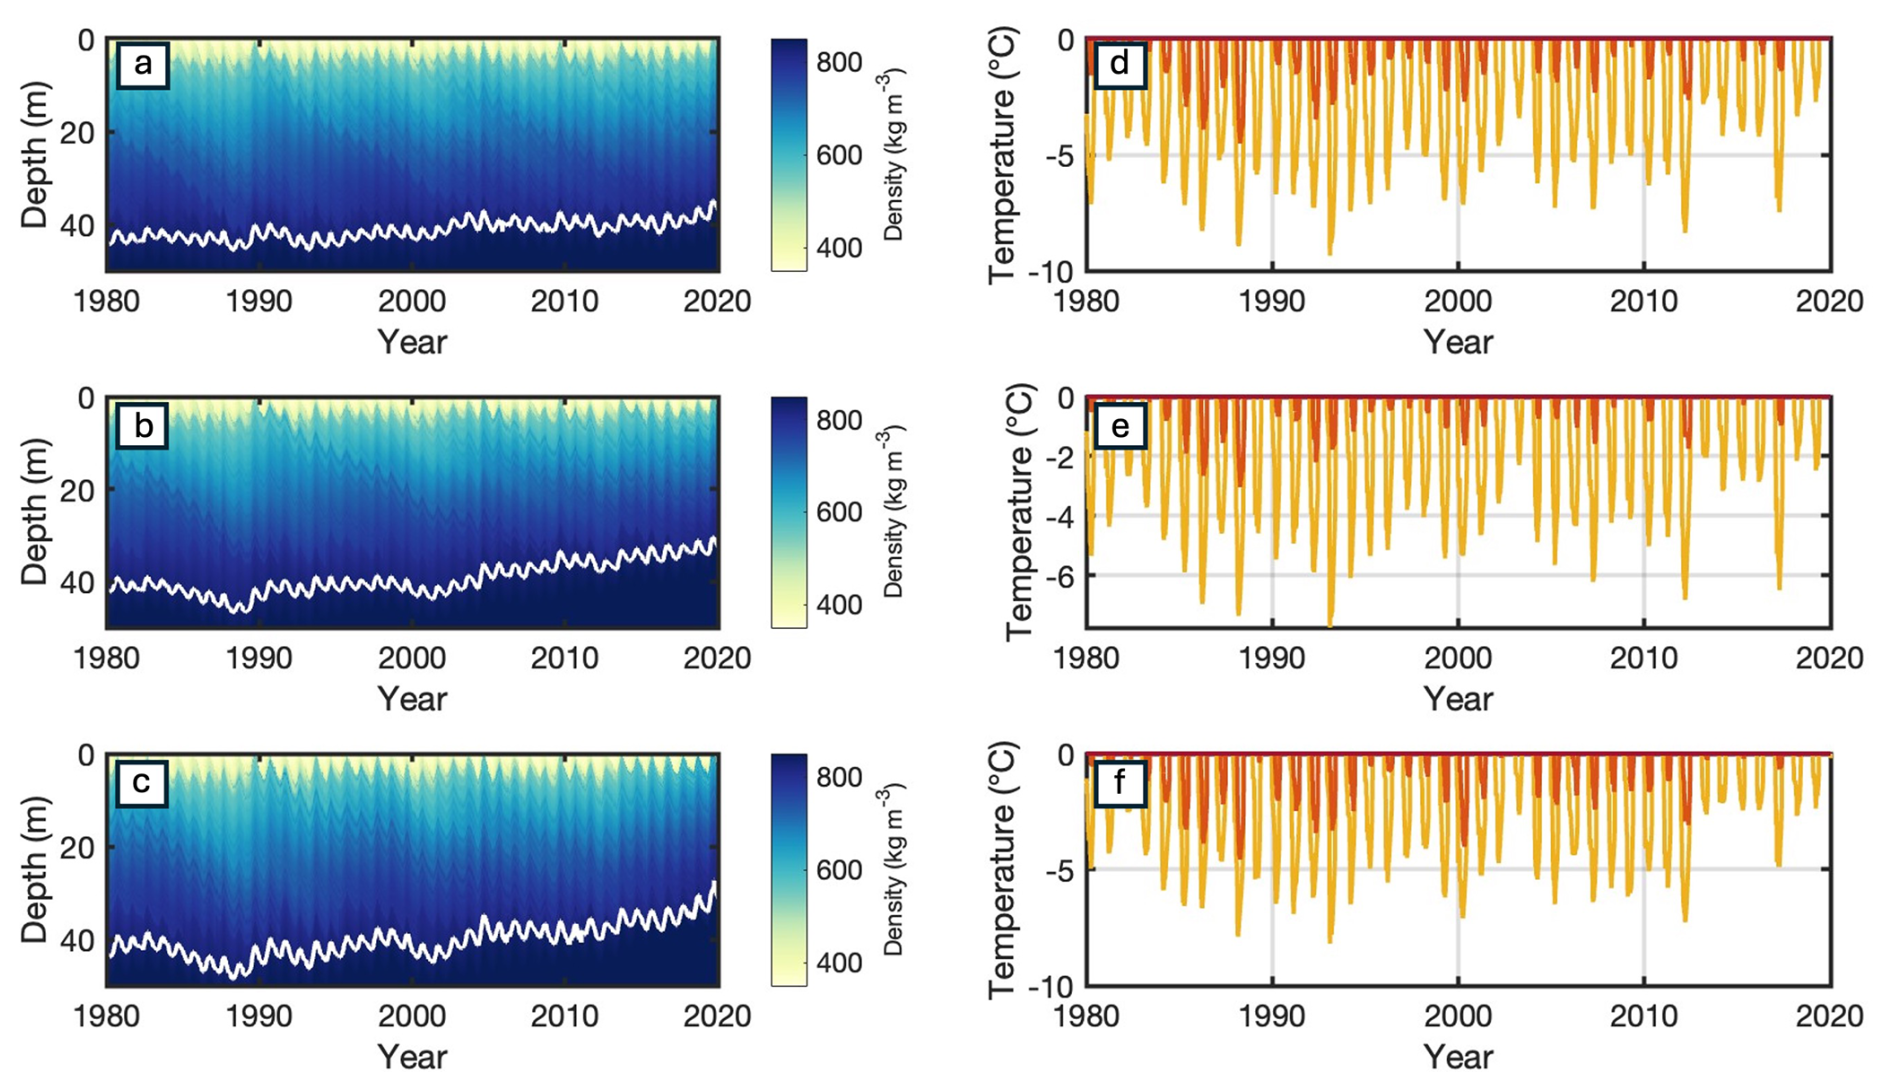
Figure 5Modeled profiles of density (a–c) and modeled firn temperature (d–f) from 1980 to 2019 from the Kuipers Munneke et al. (2015) firn-densification model at the MLD site (a, d); MG3 site (b, e); and NWB1 site (c, f). Temperatures are shown at 3 m depth (light orange), 5 m depth (dark orange), and 8 m depth (red) in (d)–(f). The temperature at 8 m depth was always at 0 °C over this interval, see Fig. A5. Bubble close-off depth (approximately 830 kg m−3) is delineated by the white line on (a)–(c).
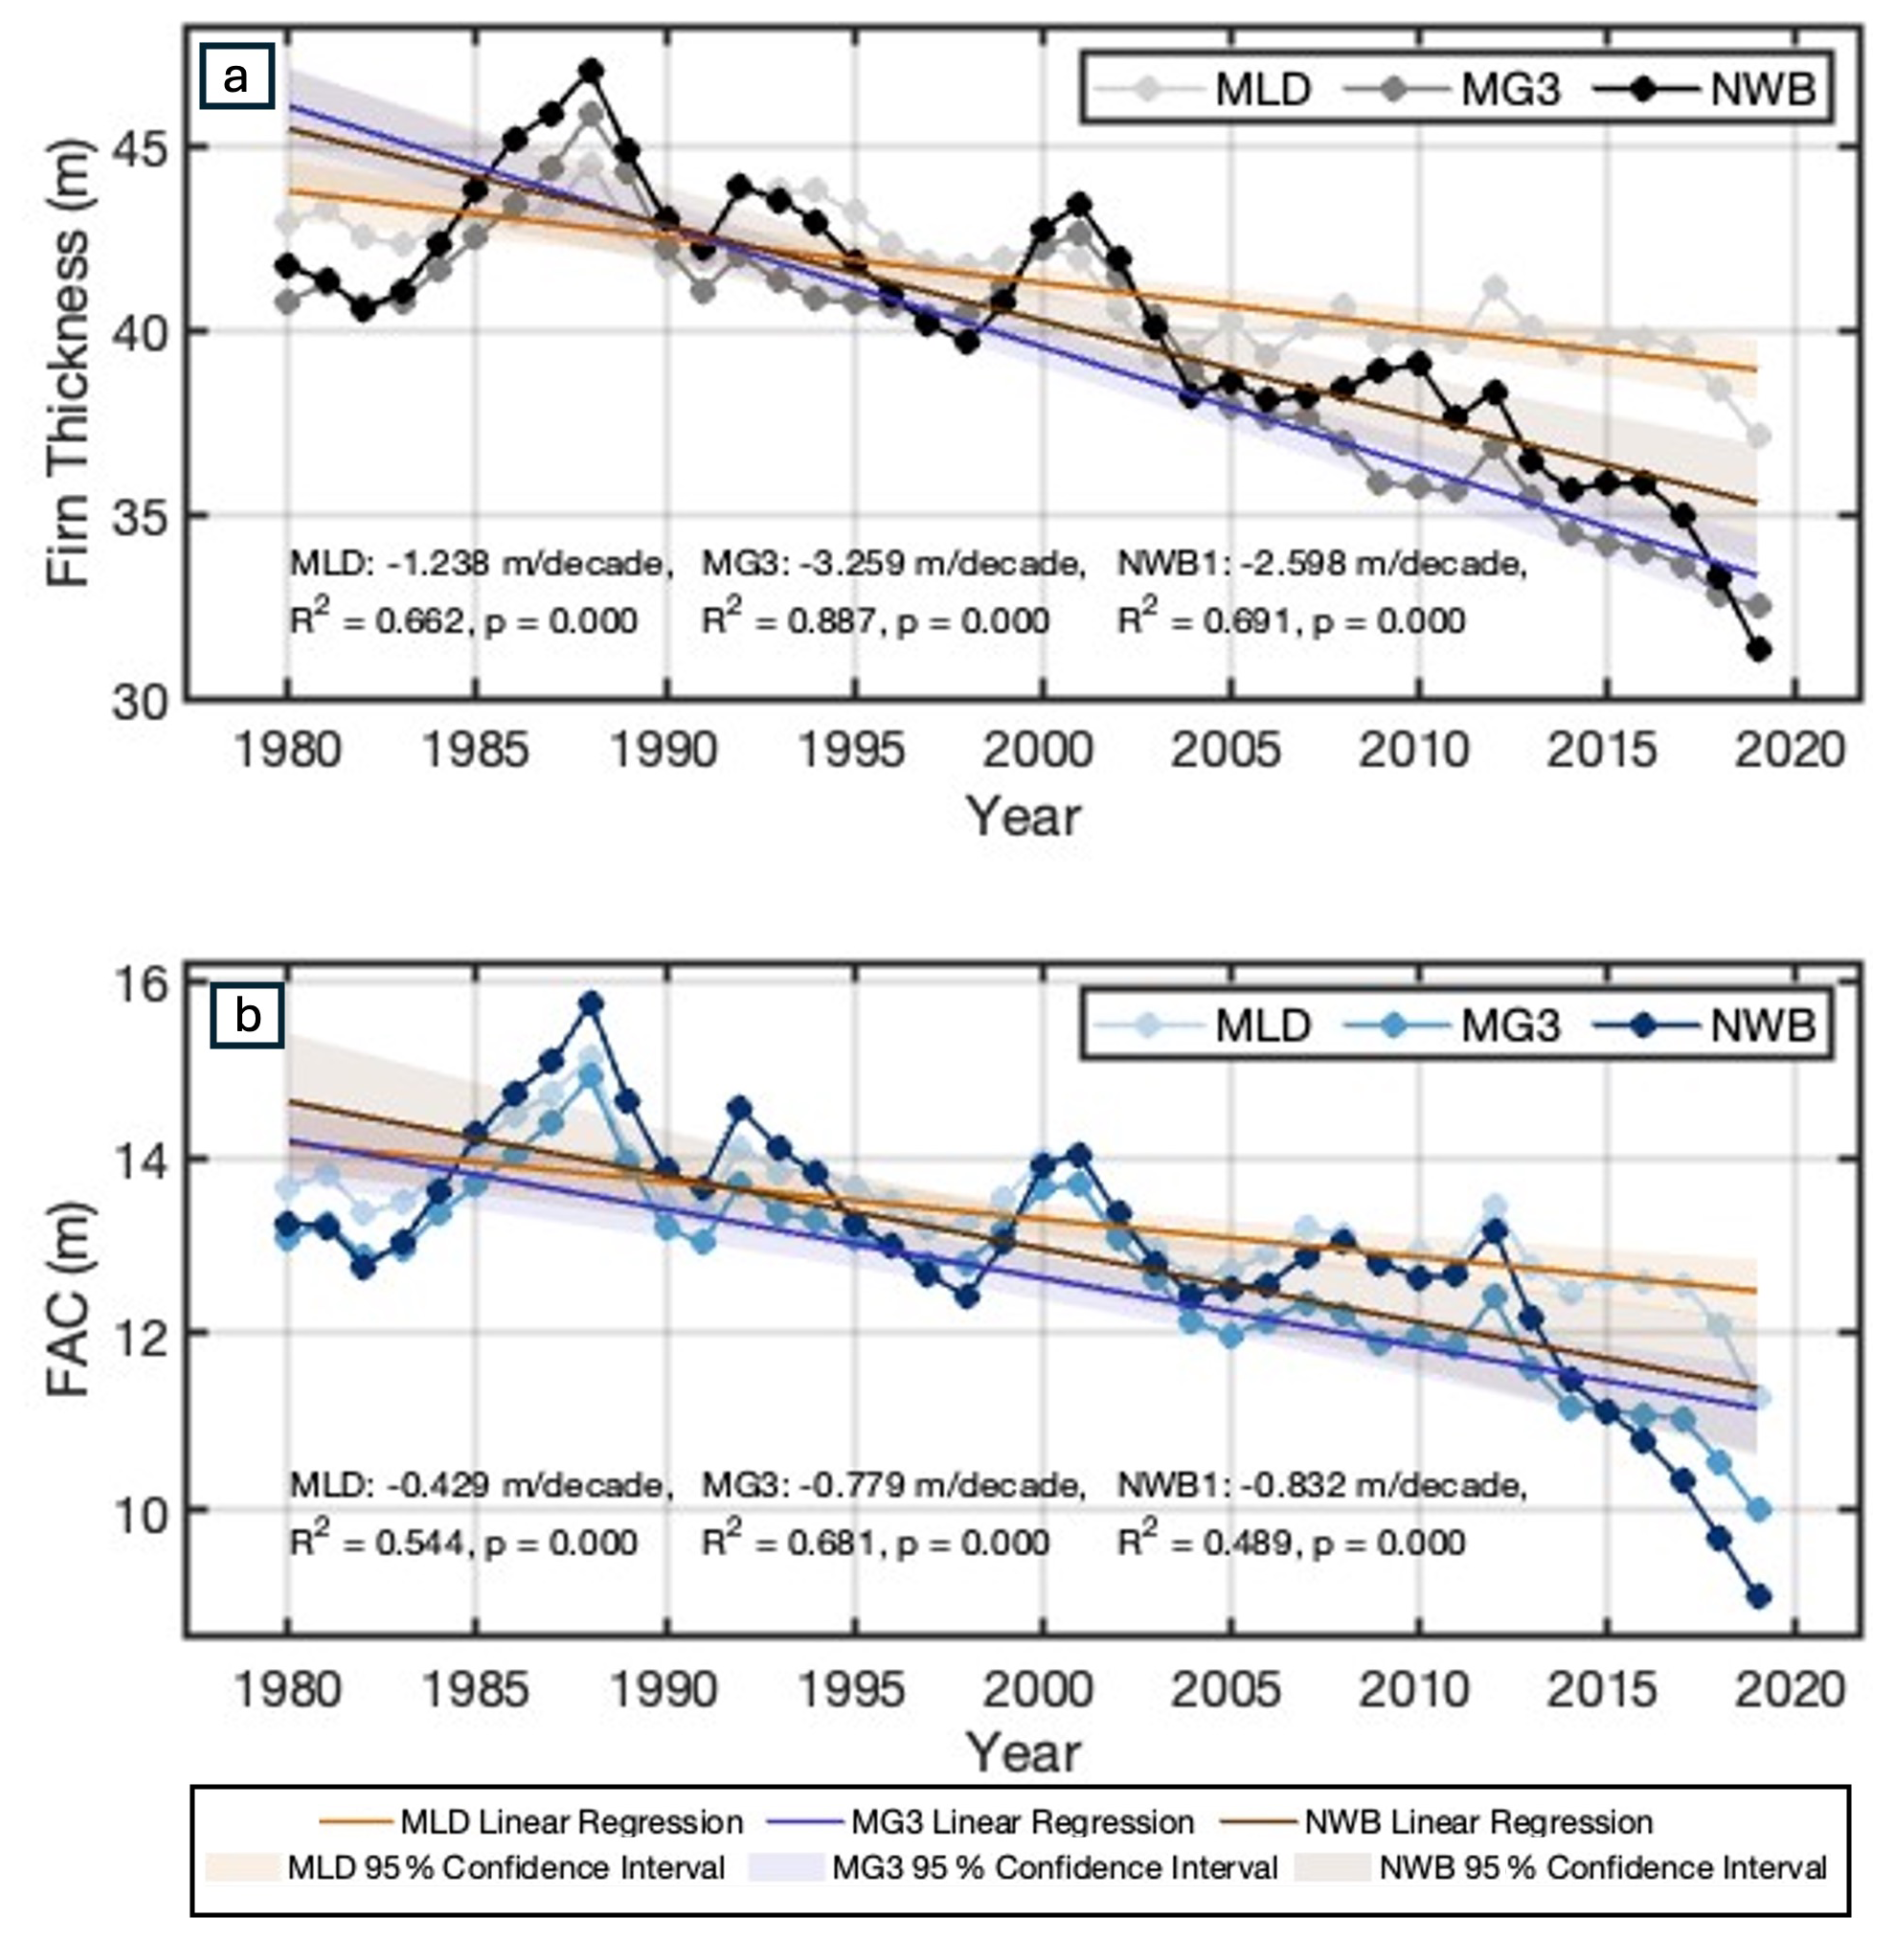
Figure 6Modeled (a) mean annual firn thickness and (b) mean annual firn-air content (FAC) from the Kuipers Munneke et al. (2015) firn-densification model at accumulation-zone sites MLD, MG3, and NWB1 from 1980 to 2019.
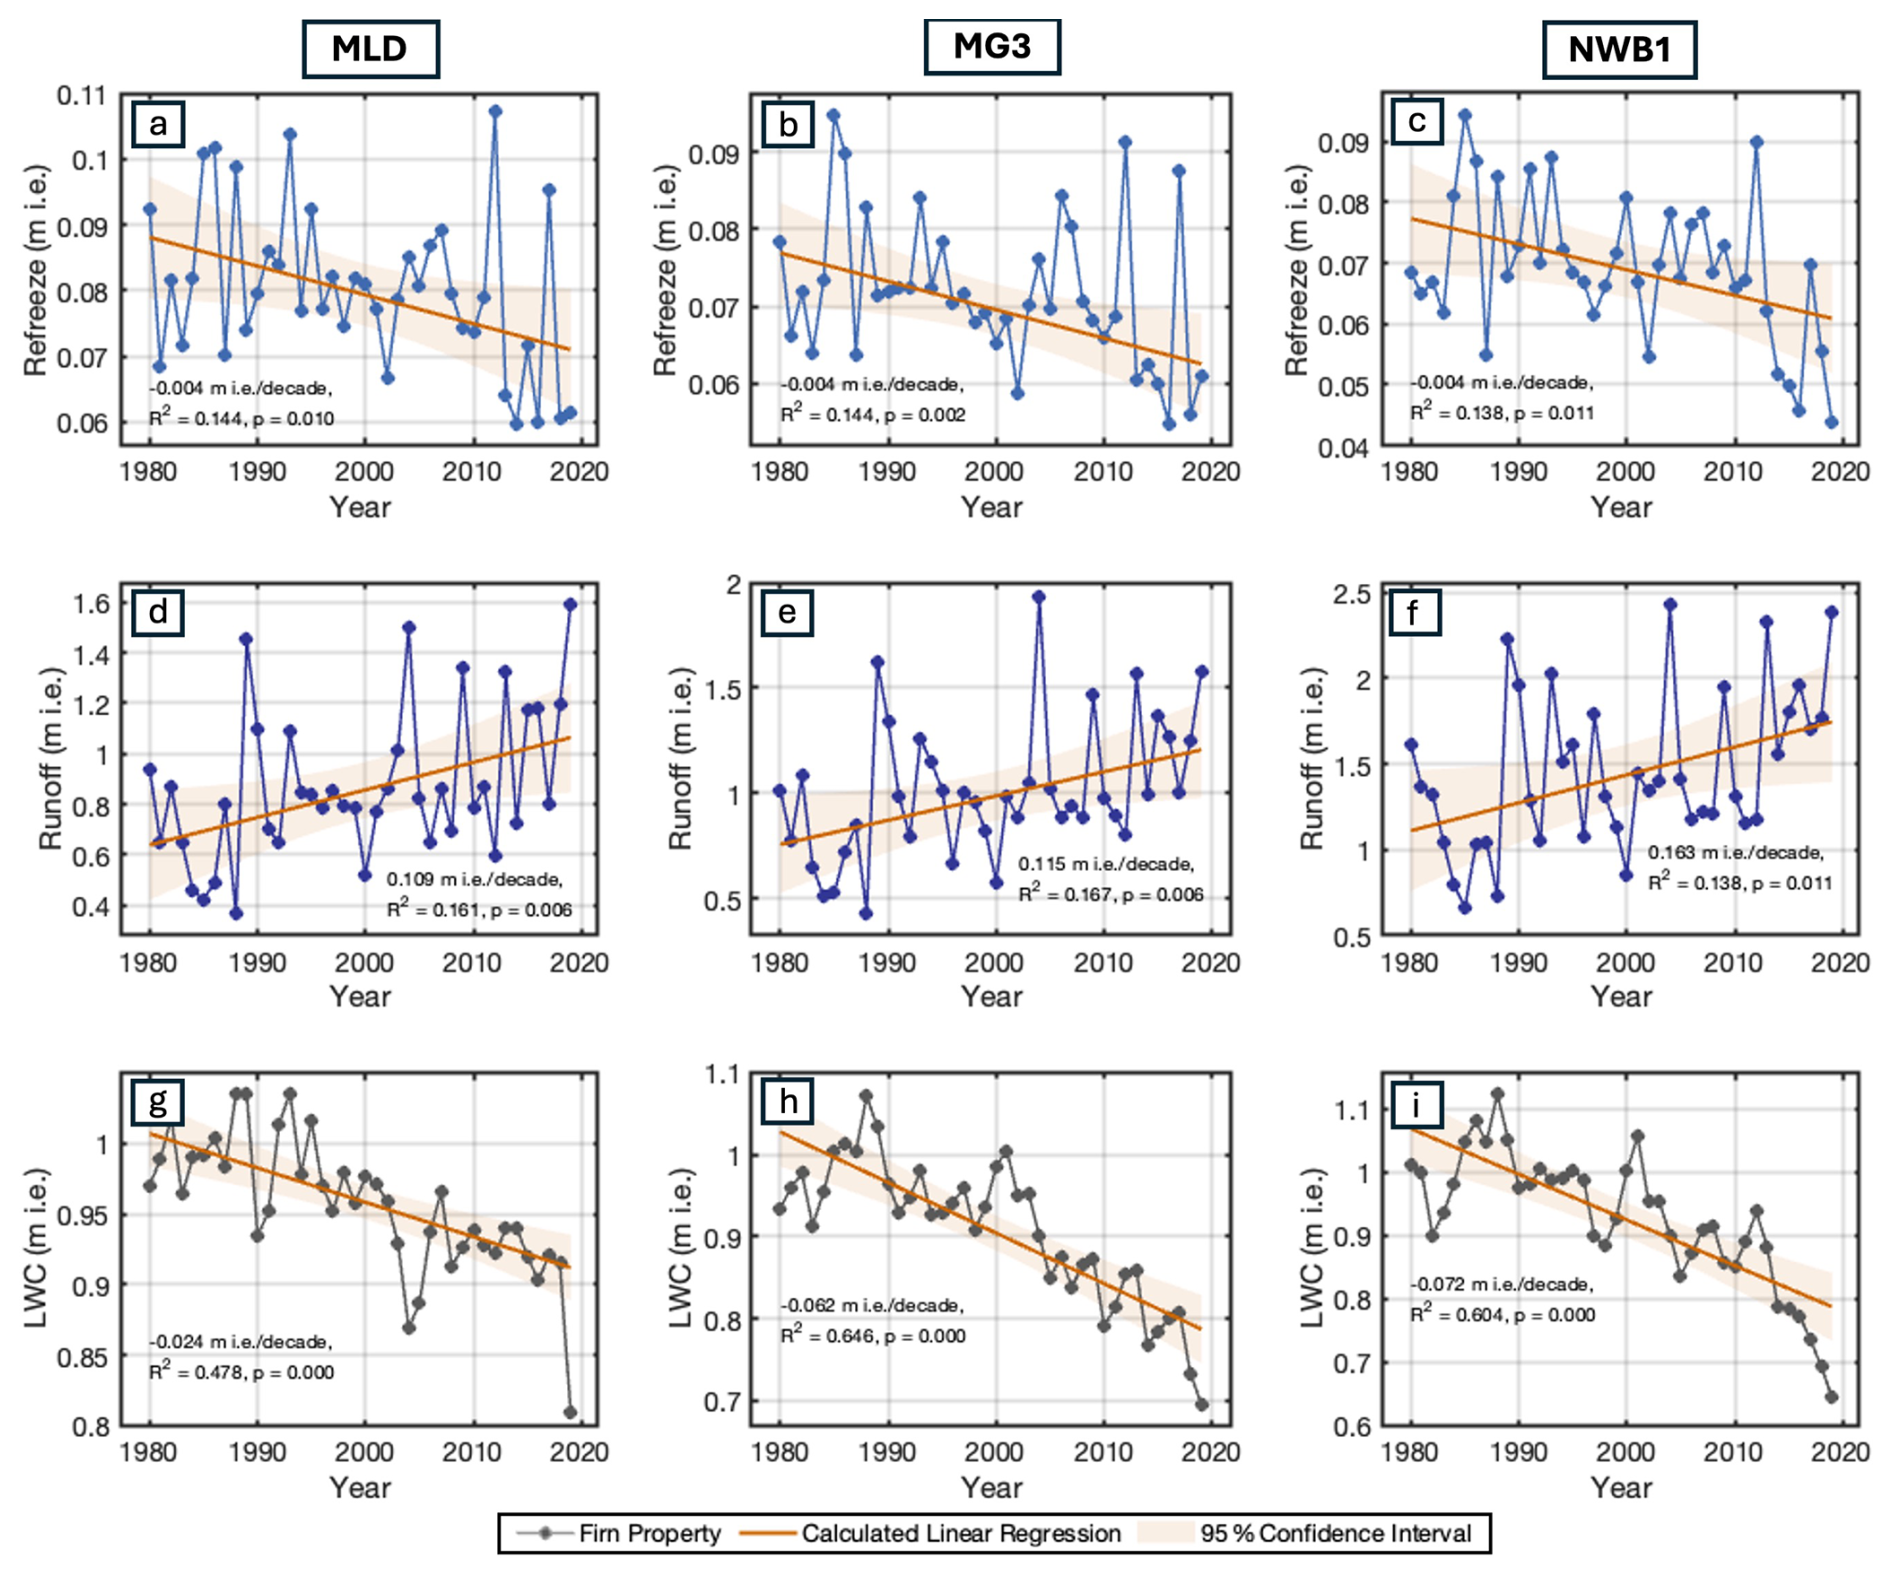
Figure 7Modeled cumulative annual refreeze in the firn (a–c), modeled cumulative annual runoff (d–f), and modeled annual depth-averaged liquid-water content (LWC) in the firn (g–i), from 1980 to 2019.
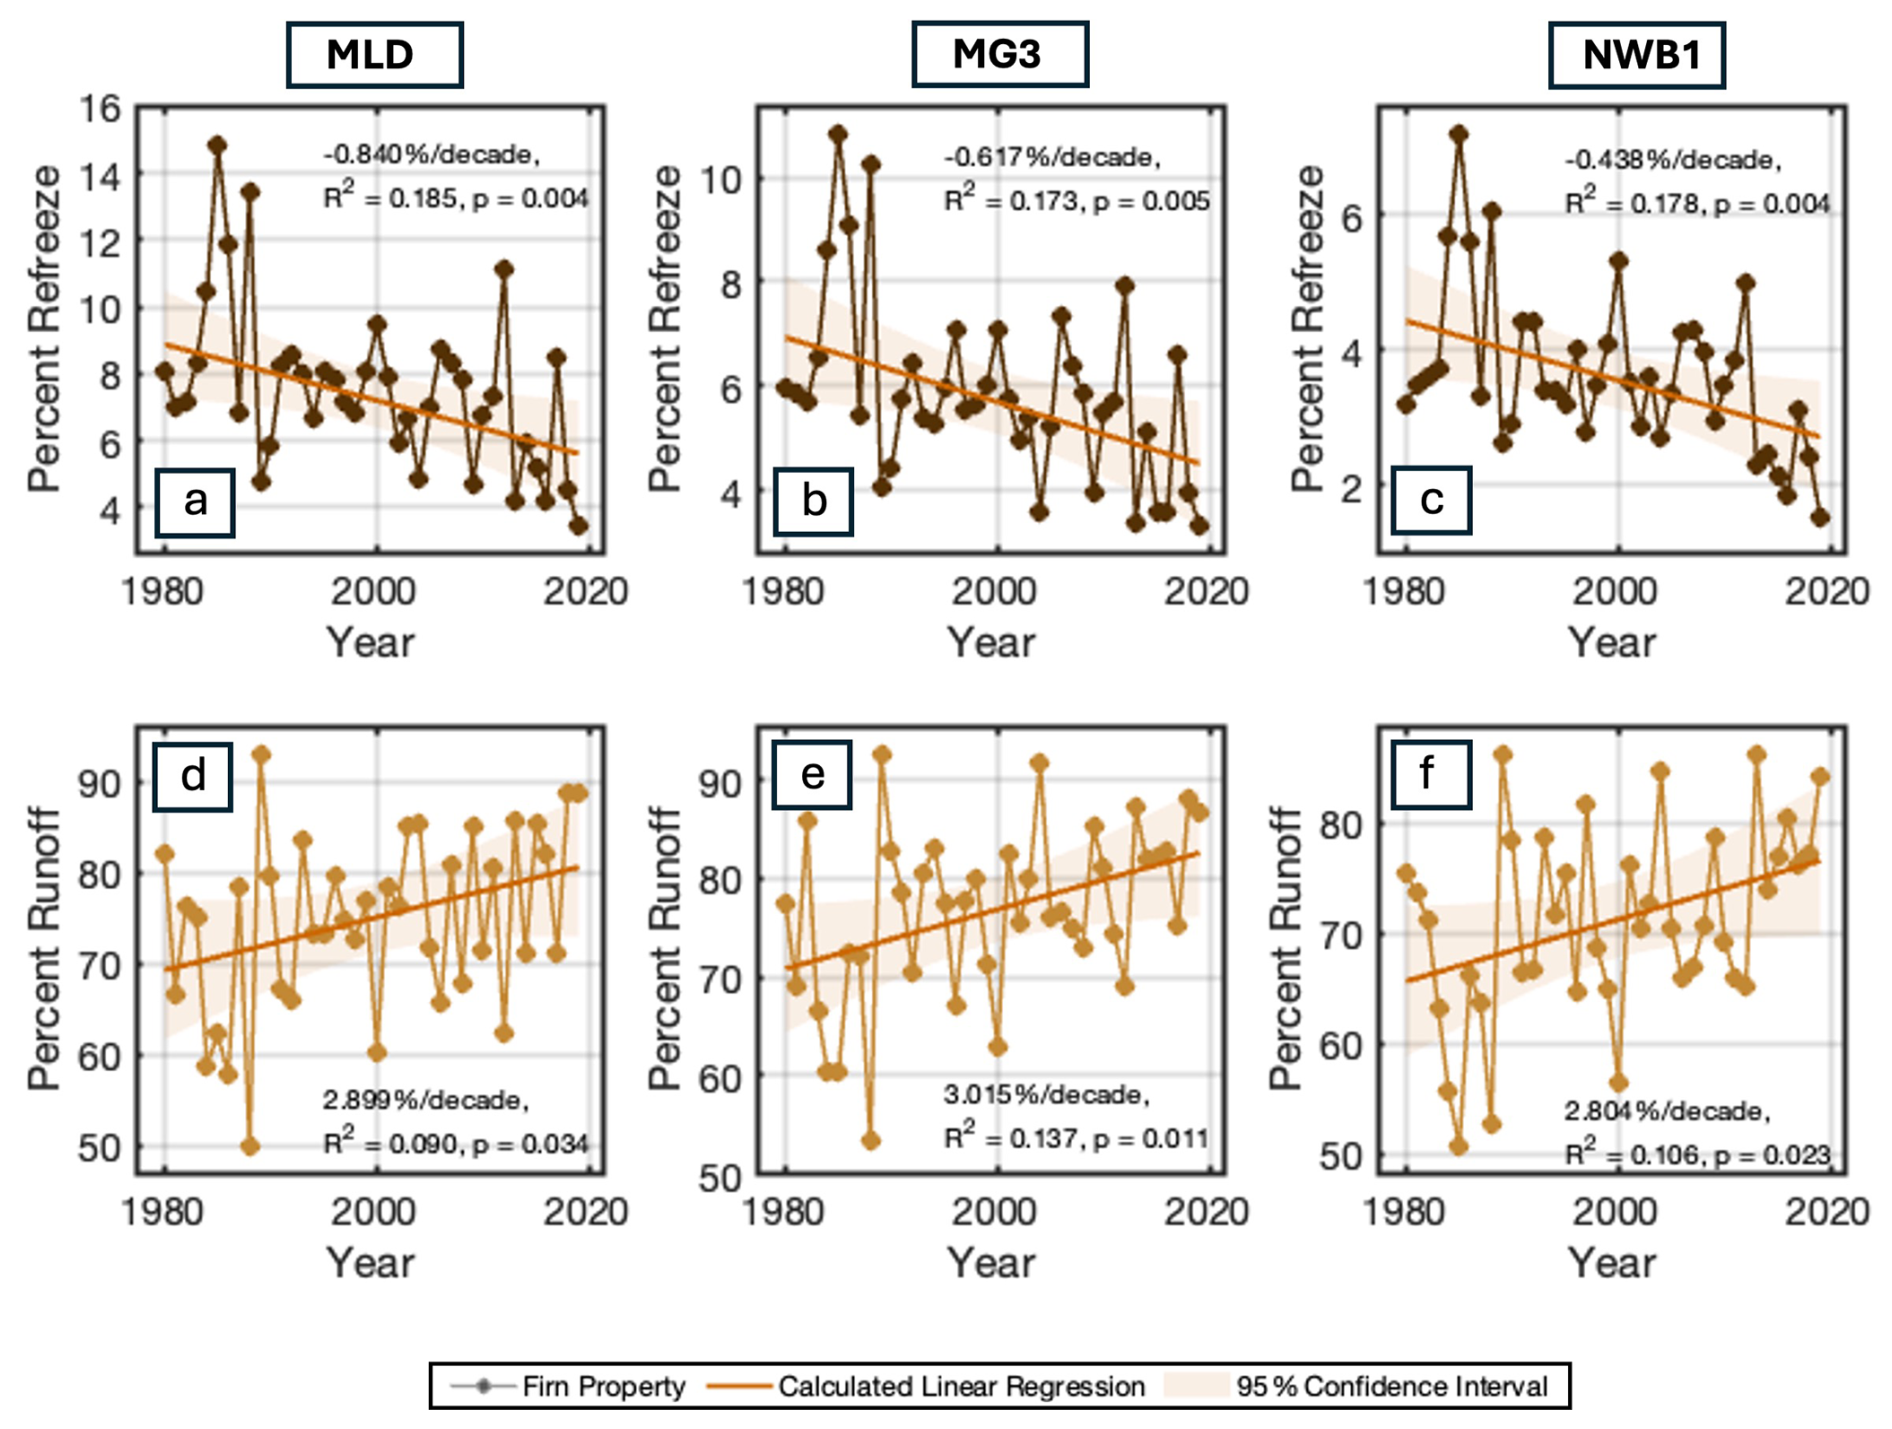
Figure 8Percent of modeled mean annual melt and rain that refroze in the firn (a–c), and percent of modeled mean annual melt and rain that ran off from the firn (d–f) from 1980 to 2019.
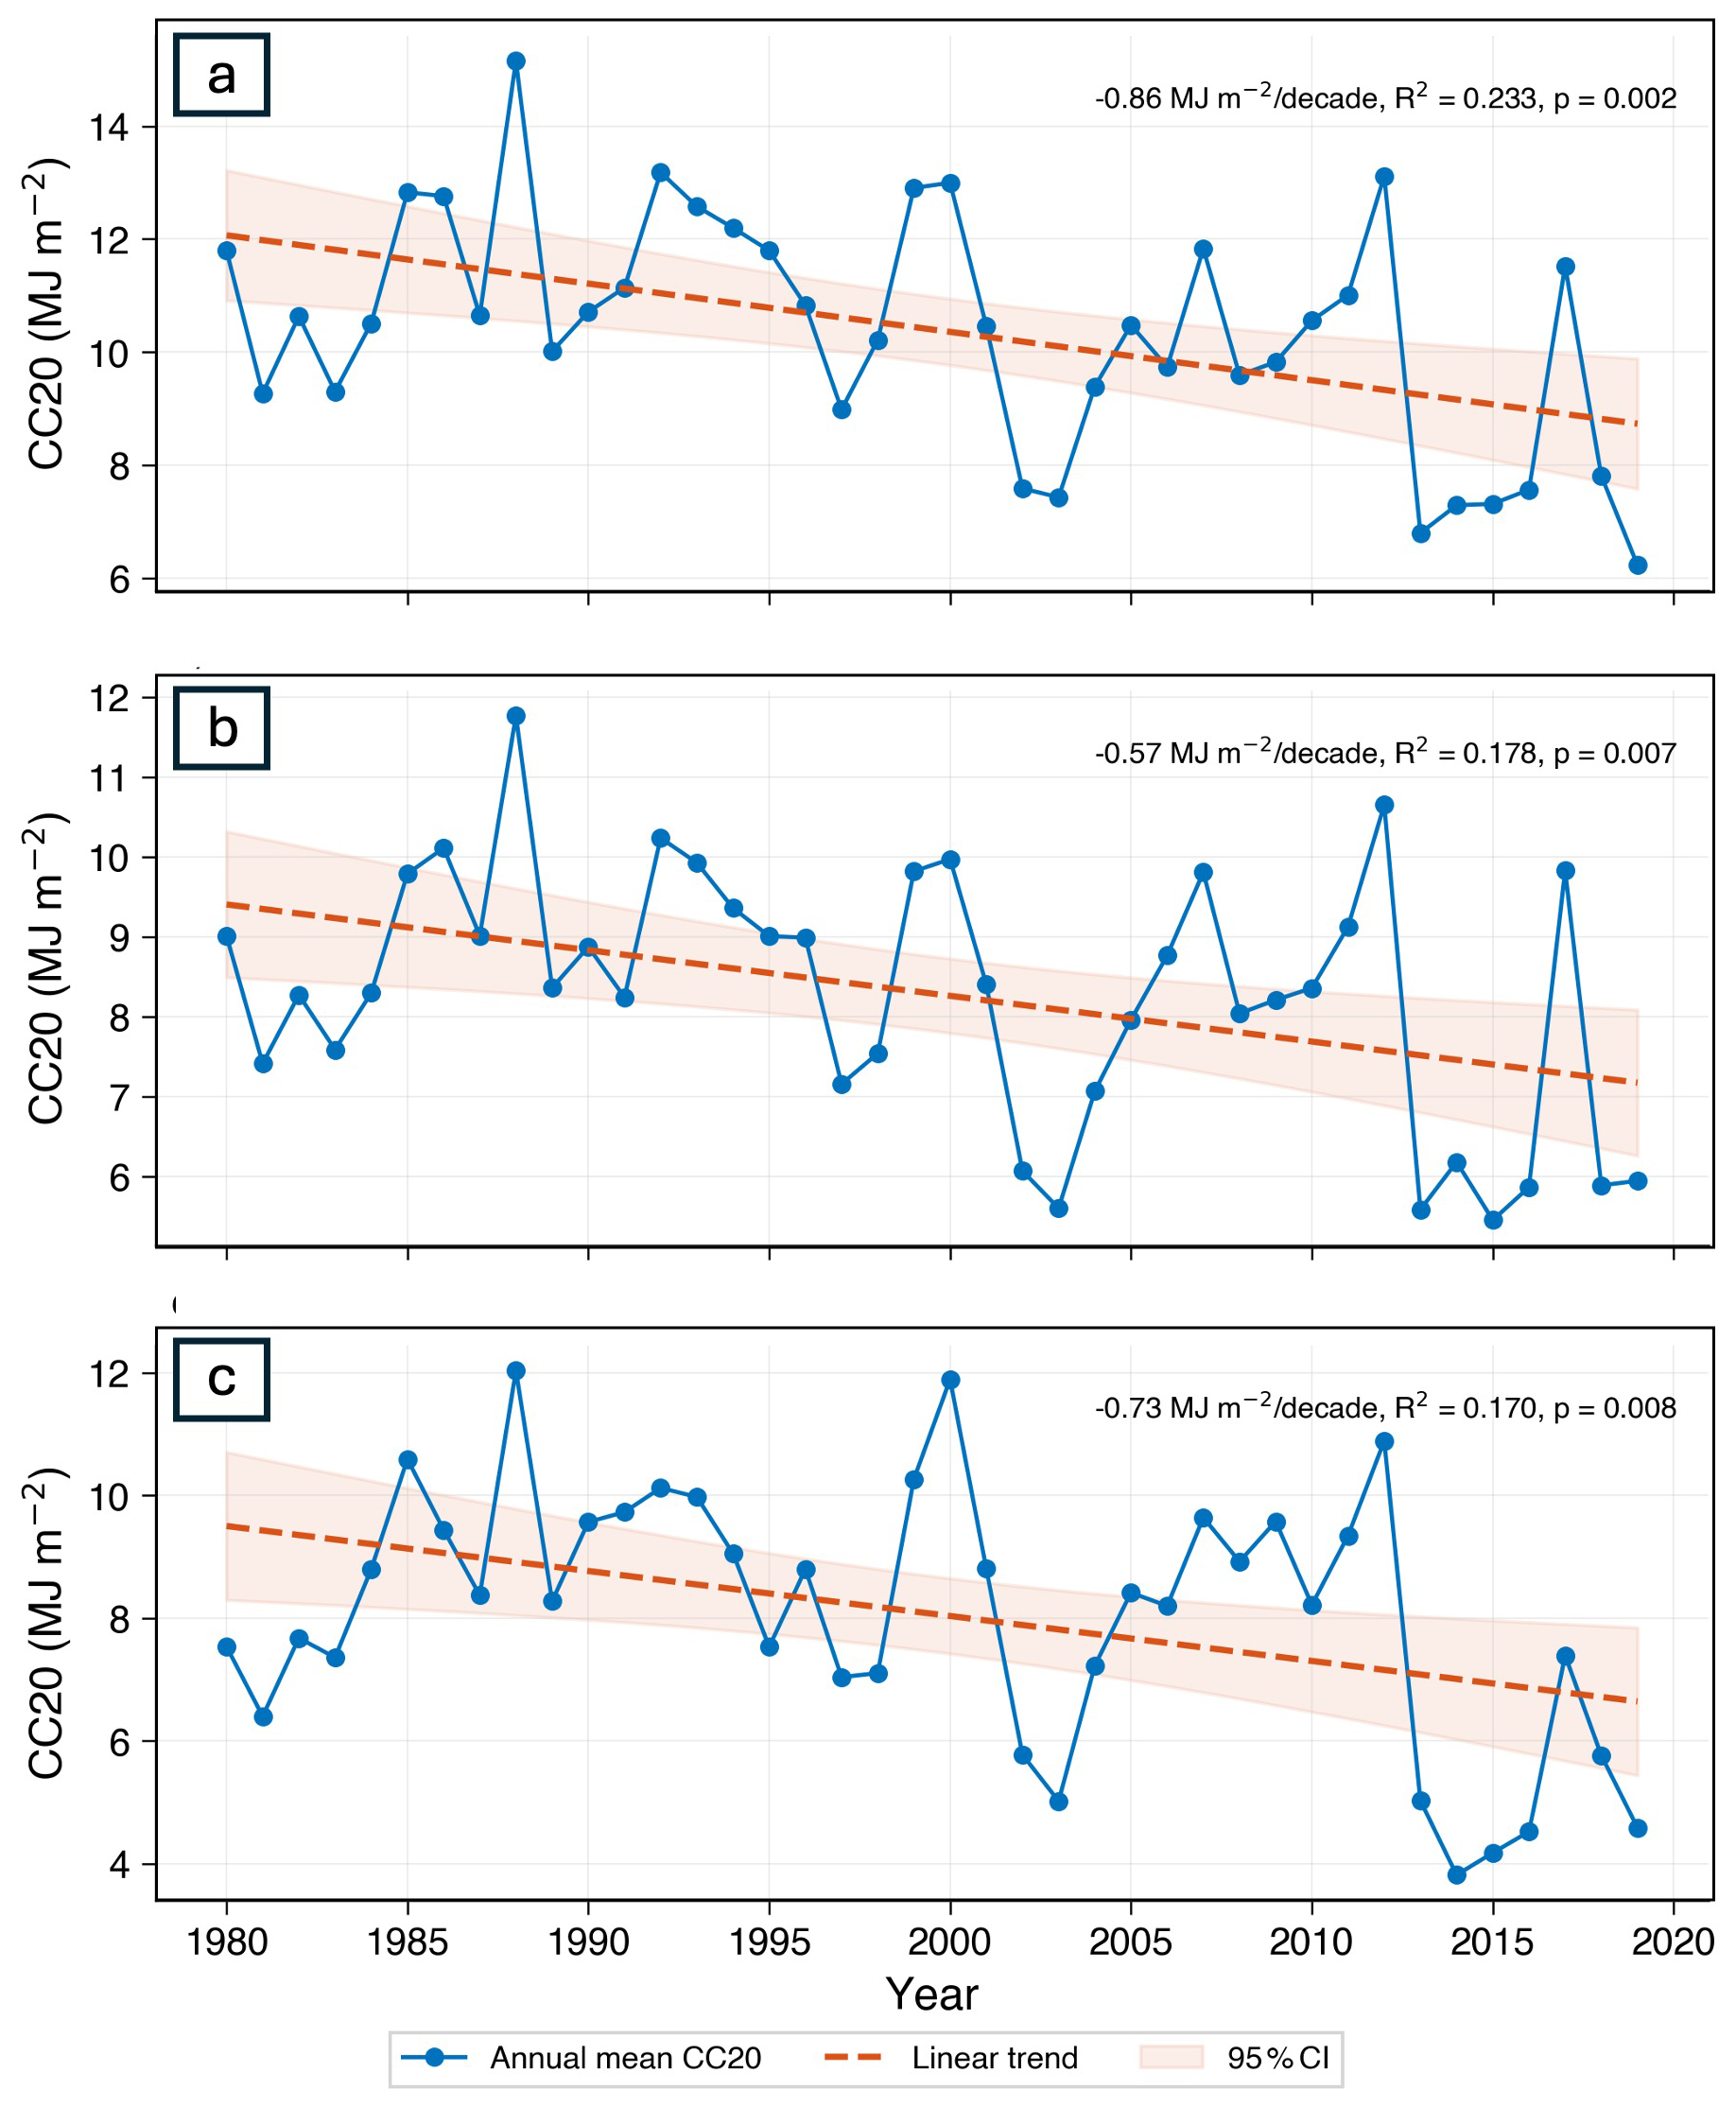
Figure 9Mean annual cold content calculated from model results for the three sites from 1980 to 2019: (a) MLD, (b) MG3, and (c) NWB1.
3.3 Modeling results
To investigate changing firn properties over decadal timescales, we simulated the firn column at study sites in the accumulation zone (MLD, MG3, and NWB1) from 1980 to 2019 using the Community Firn Model. Model results are discussed in relation to a 1 m × 1 m firn column, due to the model's 1-D framework, and are summarized in Table 4. Statistics related to the analyses are shown in Table A2.
From 1980 to 2019, modeled bubble close-off depth decreased (Fig. 5a–c), ice-rich layers were introduced into the firn (Fig. 5a–c), and modeled snow and firn temperatures increased (Fig. 5d–f). Specifically, the 5 m temperature cooled below 0 °C during the winter season less frequently over the period at all sites.
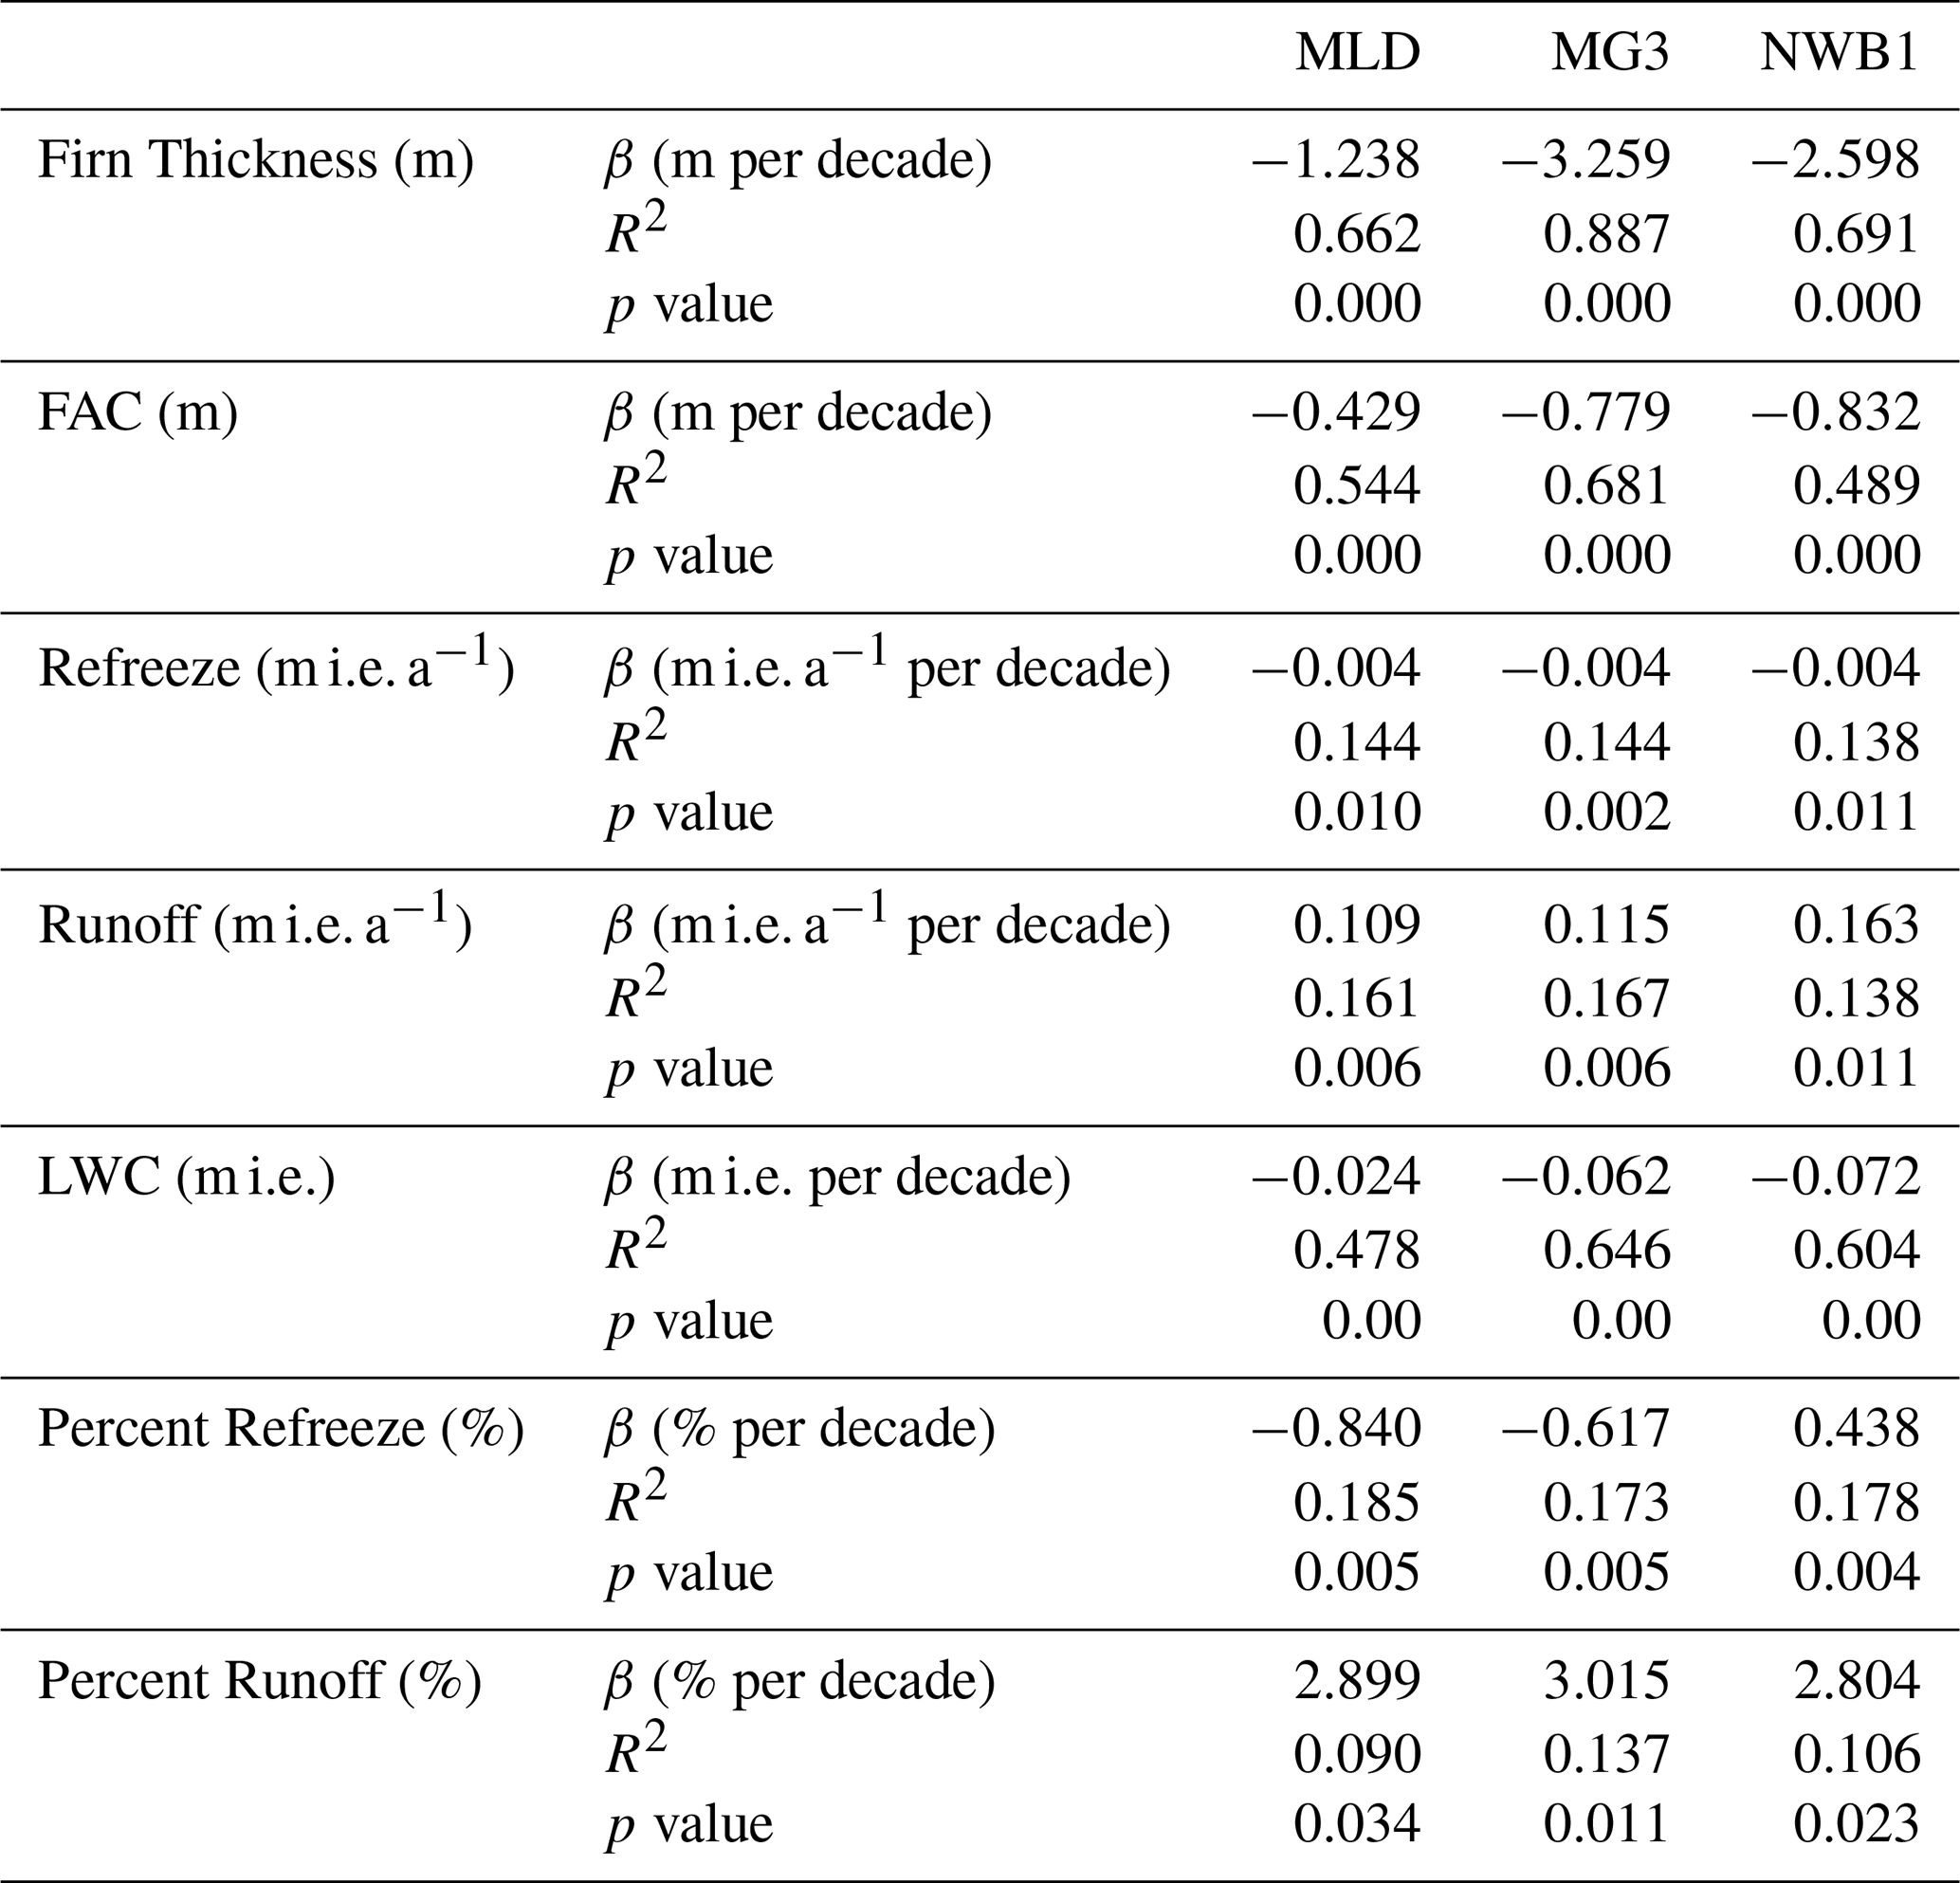
Modeled mean annual firn-column thickness (defined here as from the surface to bubble close-off depth) decreased at a rate of 1.2 m (MLD), 3.3 m (MG3), and 2.6 m (NWB1) per decade from 1980 to 2019 (Fig. 6a; Table 4). Additionally, modeled mean annual firn-air content (FAC) decreased at a rate of 0.43 m (MLD), 0.78 m (MG3), and 0.83 m (NWB1) (Fig. 6b; Table 4) per decade from 1980 to 2019.
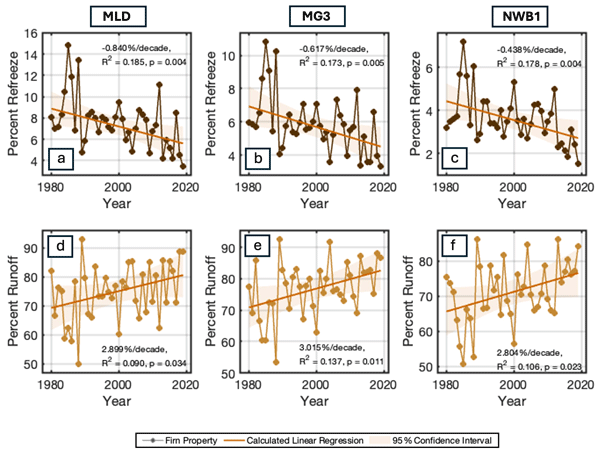
Modeled annual cumulative refreeze in the firn is generally low for all sites (Fig. 7a–c; Table 4), and overall decreased at a rate of 0.4 cm i.e. per decade at all sites, with two recent spikes in annual refreeze in 2012 and 2017. Modeled annual cumulative runoff (Fig. 7d–f; Table 4) from the firn is also highly variable, and generally increased at a rate of 0.11 (MLD), 0.12 (MG3) and 0.16 (NWB1) m i.e. per decade.
Modeled annual depth-averaged liquid-water content (LWC) (Fig. 7g–i) decreased at a rate of 2.4 (MLD), 6.2 (MG3), and 7.2 (NWB1) cm i.e. per decade. Model results also suggest that layers of high LWC are retained inter-annually (Figs. A6 and A7) at or near bubble close-off and in the shallow firn for all sites. Deep layers of high LWC at NWB1 disappear from 2014–2019.
Further, the relation of annual melt and rain to refreeze in the firn decreased while runoff increased (Fig. 8). The relation of melt and rain to refreeze in the firn decreased from 1980 to 2019 at a rate of 0.84 % (MLD), 0.62 % (MG3) and 0.44 % (NWB1) per decade. The relation of melt and rain to run off from the firn increased at a rate of 2.9 % (MLD), 3.0 % (MG3), and 2.8 % (NWB1) per decade.
We defined the onset of the melt season as five consecutive days of melt. The mean day of the melt-season onset was 15 May (MLD); 12 May (MG3); and 6 May (NWB1). Seasonally, a tradeoff exists between runoff and refreeze in the firn. The onset of spring runoff exhibited high variability, advancing earlier in the season by 4.1 (MLD), 5.2 (MG3), and 6.3 (NWB1) days per decade from 1980–2019 (Table 4; Fig. A11).
3.4 Cold content
We quantified the cold content in the upper 20 m of firn at MLD, MG3, and NWB1. Modeled annual mean cold content decreased at all sites from 1980 to 2019 (Table 4) at a rate of 0.86 (MLD), 0.57 (MG3), and 0.73 (NWB1) MJ m−2 per decade (Fig. 9). Modeled winter (November through April) cold content also decreased at a rate of 1.5 (MLD), 1.1 (MG3) and 1.7 (NWB1) MJ m−2 per decade (Fig. A13). Consequently, the number of days with cold content ≤ 0.05 MJ m−2 increased at a rate of 7.3 (MLD); 7.6 (MG3); and 8.3 d per decade (NWB1) (Fig. A12).
In the following sections, we address the central motivations of this study:
-
How has firn on the Juneau Icefield evolved over seasonal to decadal time scales?
-
How have these firn changes modulated refreeze and runoff?
First, our measurements suggest that the mean density and liquid-water content (LWC) increased through June and July of 2024 at the four sites (MLD, NWB1, MG3 and TKG4), indicating local retention of meltwater in the snow and firn during the summer melt season.
Further, model results for the three accumulation-zone sites indicate that firn-column thickness decreased at a rate of 1.2 to 3.3 m per decade from 1980–2019. A substantial portion of this thinning occurred between 2010 and 2019, driven by decreased surface mass balance characterized by increased melt and decreased snow accumulation. From 1980 to 2019, the modeled cold content in the firn decreased at a rate of 0.57–0.86 MJ m−2 per decade while the number of days with near-zero cold content increased by 7.3–8.3 d per decade. This depletion of cold content contributed to increased meltwater runoff from the firn (0.11–0.16 m i.e. per decade), decreased meltwater refreeze in the firn (−0.4 cm i.e. per decade), and an earlier onset of the spring runoff season (4.1–6.3 d earlier per decade).
4.1 Climate
Across the Juneau Icefield, rising atmospheric temperatures drive increasing ELAs and decreased mass balance ( m w.e. a−1) (Ing et al., 2025; Berthier et al., 2018), with a doubling of mass loss during the 1979–2010 to 2010–2020 time periods (Davies et al., 2024). Specifically, previous studies have shown increases in winter temperature and melt on the icefield (Davies et al., 2024), in the context of widespread trends of increasing temperatures and expanding melt seasons in other regions across Alaska (Blaskey et al., 2023; Winski et al., 2018)) and in the Yukon (Kindstedt et al., 2025). At our three study sites, we identified symptoms of these larger changes: increased winter temperatures (0.23–0.34 °C per decade) (Fig. A2), increased melt (0.11–0.16 m i.e. per decade), increased melt intensity, and decreased snow accumulation (0.12–0.16 m i.e. per decade) (Fig. 2) between 1980 and 2019 across all three accumulation-zone sites on the Juneau Icefield, leading to decreased surface mass balance (Fig. A3). Based on our results, these changes have likely driven several primary impacts on the Juneau Icefield's firn: (1) thinning and widespread disappearance of the firn layer, especially since 2012; (2) reduction of total firn-air content; and (3) decreased capacity for meltwater refreezing and increased meltwater runoff. We elaborate on these impacts below.
4.2 Firn changes
Our measurements of LWC in the snow and firn are similar to LWC observations from previous studies for snow on the Juneau Icefield (e.g., volumetric LWC was 1.7 %–5.7 % in 2012, and 2.1 %–16 % in 2021 (Mannello et al., 2025); and a single measurement of 3.5 % in 2018 (Clayton, 2022)). Seasonal snowpack, and snow and firn studies at other locations, such as Colorado and Idaho, US; the Greenland Ice Sheet; and Switzerland find similar magnitudes of LWC, including from geophysical observations (0 % vol–19 % vol, Webb et al., 2018; 0 % vol–10 % vol, Heilig et al., 2018; 4 % vol–5 % vol, Heilig et al., 2015; and over 10 % vol, Bonnell et al., 2021), and from similar measurement techniques to this study (i.e., Denoth meter and Snow Fork) (between 0 % vol–10 % vol; Techel and Pielmeier, 2011).
We found that measured depth-averaged density and liquid water content (LWC) generally, but not always, increased through June and July of 2024 (Table 3). Inter-seasonal variability in the snow's LWC over the summer season has also been observed in previous studies on the icefield (Mannello et al., 2025). Most of our LWC measurements are higher (and at times, substantially higher) than the traditionally accepted definition of the irreducible water saturation (2 %–3 %), which suggests that the water flux out of the firn is not as rapid as its generation, either because the snow and firn do not have high enough permeability, and/or because the hydraulic head is not high enough to accommodate the meltwater flux into the system. Diurnal, seasonal, and spatial variations in LWC in the snow and firn are a result of variable meltwater processes that modulate liquid water flux in and out of the snow and firn (e.g., LWC history, snow-melt rate, rainfall, snow and firn macro- and microstructure, and drainage into crevasses) or variations in slope.
Our measured LWC results indicate retention of meltwater in the snow and firn during the beginning of the melt season on the Juneau Icefield, as well as other transient processes such as meltwater infiltration and draining into crevasses and/or spatial variability of water movement due to microstructure and macrostructure (e.g., discontinuous ice lenses). However, any liquid water that drains is not captured in the measurements. Because the cores were taken within 1–3 m, spatial variability may contribute to uncertainty in the LWC measurements and in comparison between repeat firn cores.
The repeat firn cores also revealed numerous discontinuous horizons, suggesting that layering in the snow and firn across the Juneau Icefield is complex. Differences in stratigraphy between each site and between each repeat firn core (Fig. 3) shows that considerable spatial variability even exists in the snow and firn of high-melt temperate alpine glaciers. These spatiotemporal variations in stratigraphy result from the impacts of snow structures (e.g., sastrugi and wind crusts) and stratigraphic variations (e.g., microstructural and macrostructural layer variations in the snow and firn that translate to differential permeabilities) on snow-melt processes and melt infiltration on the scale of micrometers to meters.
For example, we identified ice layers and lenses that extended across the entire firn core, as well as features that do not (e.g., discontinuous ice layers and ice conduits). Horizontal and continuous ice layers may suggest a more homogeneous wetting front during melt infiltration that is less controlled by stratigraphic barriers, while ice conduits and discontinuous ice layers suggest preferential flow. Very thin ice layers (<0.25 cm) that were observed widely in all firn cores may represent surface refreezing instead of meltwater infiltration into the snow and firn (e.g., Kindstedt et al., 2025). We identified several thick ice layers in the firn (e.g., the largest ice layer was 22 cm in core MLD_C3), as well as clusters of thick ice layers in most cores. These may form from repeated, intense, and/or long melt events, and/or represent a thick stratigraphic barrier to which subsequent liquid water may refreeze onto.
At all three sites, model results suggest that decreasing surface mass balance (increased melt and decreased snow accumulation) contributed to firn thinning from 1980 to 2019. At NWB1, melt actually exceeded accumulation in 2019, which suggests that NWB1 possibly has entered the ablation zone, concurrent with recent icefield-wide ELA increases (Pelto, 2019). Mean annual LWC decreased in the firn column from 1980 to 2019. Factors that also may influence spatial variability of mass balance between sites, and thus firn thickness and thinning on the icefield, include marine proximity and elevation of the site (Mannello, 2023).
4.3 Thermal changes
On the Juneau Icefield, the cold content in the firn governs the capacity of the firn to refreeze meltwater, due to the firn's near-isothermal nature. Available pore space is another parameter that can regulate the firn's capacity for runoff and refreeze; however, it is likely not the primary limiting factor on the icefield because the available pore space exceeded 8–10 m, whereas the total volume of generated melt was an order of magnitude smaller (1–2 m). From 1980 to 2019, firn cold content accumulated seasonally in the upper 20 m, and the firn became fully temperate (T=0 °C) by early summer each year. This annual exhaustion of cold content contrasts sites such as interior Greenland, where a subsurface cold reservoir persists year-round (Vandecrux et al., 2020) and meltwater refreezing in the firn is governed by a variety of factors (including available pore space, cold content, and meltwater availability). The lack of substantial cold content underscores the limited capacity of warm, temperate firn on the Juneau Icefield, and similar glaciers in Alaska, to buffer against meltwater loss to sea-level rise through refreezing.
Warming winter temperatures diminish seasonal replenishment of firn cold content, likely driving the onset of runoff to earlier in the year (4.1–6.3 d per decade from 1980–2019). The runoff and refreeze seasons overlap during late May and early June for the three sites, when there is still enough winter cold content in the upper 3–5 m of the snow/firn column to refreeze some liquid water (rain and/or melt) that is introduced into the system. After the melt season progresses and the snow/firn column becomes entirely isothermal, runoff dominates the firn in mid June to early July until the end of the summer melt season in October. We isolated runoff and refreeze variability from surface-melt and rainfall variability by calculating the respective percentages of melt and rainfall that ran off or refroze. While the amount of surface melt increased at 0.11–0.16 m i.e. per decade from 1980–2019 and the percent melt and rain that ran off from the firn increased (2.8 %–3.0 % per decade), the percent melt and rain that refroze in the firn decreased (0.44 %–0.84 % per decade) from 1980–2019. At some sites, runoff and refreeze did not change symmetrically, which indicates changes in local transient liquid water storage in the firn. We expect that continued winter warming, increasing and intensified melt (i.e., lengthening of the melt season, increase in melt events, and increase in high-melt years), decreasing cold content, and increasing ELAs will continue to deplete firn cold content, increase percent runoff, decrease percent refreeze, and drive an earlier onset of a runoff-dominated processes in the firn.
4.4 Aquifers
Liquid water storage in the firn (i.e., a firn aquifer) may occur if melt and/or rainfall input to temperate firn is greater than the drainage rate, causing the LWC to surpass the irreducible water saturation and for the snow or firn to temporarily accumulate liquid water storage. Previous studies in Greenland show that firn aquifers contain between 5 %–25 % vol liquid water (Koenig et al., 2014) which may persist seasonally to perennially. Seasonal late summer/early autumn firn aquifers have been documented in high-accumulation and high-melt regions of temperate alpine glaciers such as in the Oetztal Alps in Austria, Storglaciären in Sweden, and South Cascade Glacier in the United States (Fountain, 1989; Fountain and Walder, 1998; Jansson et al., 2003; Oerter and Rauert, 1982; Schneider, 1999). Our results suggest that aquifers in the snow and firn may occur locally to regionally in the accumulation zone of the Juneau Icefield, developing during times of high melt and even at the onset of the melt season. This interpretation is supported by: (1) LWC measurements (depth-averaged mean from 7.3 % vol–24.6 % vol in all but MG3_C1) (Figs. 4, A4; Table 3) exceed the irreducible water content, which match or are greater than the observed range of LWC values for Greenland firn aquifers; (2) measured LWC and density increased through June, indicating transient liquid-water retention (Table 3); (3) liquid water drained from the base of the firn at TKG4 (the only site in the ablation zone) in the first core on 7 June 2024, indicating temporary liquid-water storage; and (4) modeled results show interannual liquid-water retention at all sites, supporting the potential for long-term liquid-water storage (Figs. A6 and A7). Specifically, high modeled LWCs mainly arise from using the Coléou and Lesaffre (1998) parametrization to predict the irreducible water content, around 20 % irreducible water saturation for densities near the prescribed impermeable density of 830 kg m−3. These model results demonstrate that there is inadequate cold content to refreeze water and that the firn is capable of retaining meltwater at depth. This, along with the other lines of evidence (1–3), supports our hypothesis that aquifers may occur locally to regionally on the Juneau Icefield.
While modeling indicates liquid-water storage can persist between melt seasons, and our early-season LWC measurements often exceed the irreducible water content, we cannot confidently confirm year-round liquid-water persistence in the snow and firn due to a lack of mid-winter field observations. Determining the precise timing, inter-annual persistence, and spatial evolution of these aquifers on the Juneau Icefield remains challenging to assess due to the spatial and temporal limitations of our fieldwork and datasets. The presence of these potentially widespread aquifers have critical impacts on mass-balance related calculations – including for accurate geodetic mass-balance estimates and corrections to ground-penetrating radar velocities used to estimate SWE (e.g., Stevens et al., 2024; Mannello et al., 2025). In addition, aquifer evolution is also important in understanding hydrological controls on ice dynamics (e.g., through continuous or episodic drainage through crevasses).
4.5 Broader impacts
The Taku Glacier is one of the main outlet glaciers of the Juneau Icefield. Because the accumulation and firn zones constitute approximately 83 % of the Taku Glacier (Pelto et al., 2013), our localized results likely scale to the majority of the glacier and may apply broadly to other locations in the accumulation zone of the Juneau Icefield. Thus, a substantial decrease in refreeze capacity in recent years, along with increase in runoff, may have occurred and expanded across the accumulation zone of the Taku Glacier and broader Juneau Icefield.
To contextualize our results, we perform an idealized calculation to determine the net change in meltwater discharge from the firn of the Taku Glacier routed into the Taku River drainage and Taku Inlet. By scaling the modeled 1980 to 2019 firn runoff across the Taku Glacier's accmulation area (558 km2; Pelto et al., 2013), we estimate that firn runoff from the Taku Glacier may have increased from 1980 to 2019 by 2.1–4.4×10⁸ m3 i.e. This estimate is approximately 32 %–72 % of the total ablation over a single year for the Taku Glacier, assuming the area-averaged ablation rate of 0.83 m w.e. yr−1; (McNeil et al., 2020) over the area of the Taku Glacier (725 km2; McNeil et al., 2020).
While there are substantial uncertainties inherent to this idealized calculation, it generally suggests some capacity of the firn on the Juneau Icefield to modulate downstream hydrology, and indicates that downstream hydrology may adapt as the Juneau Icefield's firn properties evolve. An important next step from this idealized calculation will be to implement a full regional firn-model simulation, to encompass the entire accumulation zone of the Taku Glacier and even the Juneau Icefield.
Because the firn layer modulates timing and volume of water flow through a glacier (Fountain, 1996), we suggest that increased runoff from the firn and decreased refreezing, in tandem with long-term firn thinning, may increase the propagation rate of surface melt and rainfall into downstream hydrology. While some liquid water input is accommodated by refreezing and LWC (both of which decreased in the model from 1980 to 2019), the percent that became runoff from the firn increased across all sites. Consequently, melt and/or rain events may be more promptly propagated downstream, possibly contributing to a higher likelihood for downstream flooding or highly variable stream flow. Depending on melt and rainfall variability, these firn changes may contribute to broader hydrological changes on the Juneau Icefield. For example, earlier shifts of total glacier runoff into downstream environments may contribute to changes in stream temperature and clarity, and consequently may impact species, such as salmon, that prefer certain freshwater conditions (Young et al., 2021).
Future increases in icefield-wide atmospheric temperature will cause increasing surface melt and rising ELAs, which will accelerate glacier mass loss due to hypsometrically controlled feedbacks resulting from the plateau-like nature of the Juneau Icefield (Ing et al., 2025; Davies et al., 2024). We suggest that these feedbacks will continue to deplete the firn, decrease the firn cold content, and increase firn runoff. Subsurface warming and a declining capacity for meltwater retention through refreezing characterize recent temperate Arctic firn changes at large, including in Svalbard, on the Penny Ice Cap (Baffin Island), and on Eclipse Icefield (Yukon) (Noël et al., 2020, 2018; Kindstedt et al., 2025).
Firn warming is less reversible than firn cooling, due to the nonlinear effects of temperature on firn-densification processes that increase densification, decrease pore space and decrease firn thickness. This effect is especially accentuated by latent-heat release due to meltwater refreezing (Thompson-Munson et al., 2024). Therefore, the likelihood of regenerating cold content in systems such as the Juneau Icefield, where long-term firn warming has occurred, is low.
Understanding spatiotemporal variability of internal accumulation in the firn (i.e., liquid water storage from rain and melt, and refreezing) is fundamental to many polar glaciological applications. First, knowing liquid water storage in the firn is critical for accurate calculations of mass balance from geodetic methods, a common method to assess mass change on Alaskan alpine glaciers that often uses a uniform correction factor for volume to mass conversion (Huss, 2013; Stevens et al., 2024). On the Juneau Icefield, we suggest that both transient liquid water and firn aquifers may store significant mass that is not accounted for in the density assumptions used in volume to mass conversions, and will complicate geodetic mass-balance calculations that are not based at the end of the summer season. Second, liquid-water changes impact the radar-wave velocity and the correction of travel time to depth, consequently introducing uncertainties in radar-derived depth in SWE calculations (up to 45 % uncertainties) (Mannello et al., 2025). With liquid-water content changes beginning in June, our results support Mannello et al. (2025), which suggested that radar-derived SWE estimates should consider the spatiotemporal variability of liquid-water content in the snow even during spring surveys of the Juneau Icefield. Third, the timescales of firn-aquifer drainage and other transient liquid-water storage (whether episodic or continuous) in the snow and firn is currently unknown, and may impact downglacier seasonal ice-velocity fluctuations.
4.6 Future work
While the Juneau Icefield remains one of the most studied glacier systems in the world, comprehensive assessments spanning the full firn column and its hydrology have historically been lacking. This study is the first to our knowledge to characterize seasonal to decadal evolution of the icefield's firn hydrology, including meltwater retention and runoff.
We recommend continued research into firn evolution on temperate Alaskan alpine glaciers, including understanding the heterogeneity of meltwater processes, especially in high-melt climate regimes like the Juneau Icefield. Our study is localized to four study sites monitored in June and July of 2024 and contextualized by model simulations from 1980 to 2019. Given these spatial and temporal limitations, future in-situ measurements capturing a full summer season and additional distributed measurements across the icefield are required to constrain broader regional and temporal variability.
Due to a lack of field measurements at large, and/or the limitations of point measurements, firn models are commonly used to determine firn evolution over wide spatiotemporal scales and are invaluable tools for constraining firn evolution. However, there are inherent uncertainties and limitations in how firn-model results can be interpreted. Future studies investigating how uncertainties and variability among climate products manifest in firn-model output would help quantify the uncertainty in firn-model results on the Juneau Icefield and similar glacier systems. We hypothesize that different climate forcings would produce varied firn profiles but that the trends would resemble our results on decadal time scales. In this study, we assumed that using a simple bucket scheme simulates meltwater processes accurately enough to assess the decadal-scale trends in firn properties, following other studies in similar regions (e.g., Ochwat et al., 2021; Kindstedt et al., 2025). However, due to their instantaneous nature, they may not accurately simulate the timing of meltwater runoff or percolation depths because of uncertainties in ice-layer permeability and omission of preferential-flow processes. While we hypothesize that changing the parameterizations in the bucket scheme would have limited effects on decadal trends in our study because, for example, the firn at our sites is temperate and changing the threshold for an impermeable ice lens would not likely change the percent of meltwater that runs off substantially (i.e., ice lenses do not block access to cold porosity in our case). We suggest that future work should explore detailed model intercomparisons, which would be required to fully understand the effects of climate forcing and model physics, but are beyond the scope of the present work.
Alaskan glaciers contribute 22 % of the global land-ice loss to sea-level rise (The GLAMBIE Team, 2025) and, due to continued atmospheric warming, are expected to remain a principal contributor at least through the end of the century (Fox-Kemper et al., 2021). Most Alaskan glaciers lose mass through surface melt, which is often routed through the firn and may be stored temporarily as liquid water or ice, or run off downstream. Here, we used field observations and firn modeling to investigate seasonal to decadal changes in the thermal and physical properties of firn on the Juneau Icefield, Alaska. First, measured mean density and liquid-water content generally increased up to 5 % and 71 %, respectively, during the onset of the 2024 summer season, indicating meltwater retention. Our results suggest that potentially widespread snow and firn aquifers may exist across the icefield. Driven by increased atmospheric temperatures, increased surface melt, and decreased snow accumulation, the modeled firn thickness decreased at a rate of 1.2–3.3 m per decade and the firn-air content decreased at a rate of 0.43–0.83 m per decade from 1980 to 2019. Our results also indicate decreased modeled firn cold content from 1980 to 2019, driving increased meltwater runoff from the firn (0.11–0.16 m i.e. per decade), decreased meltwater refreeze in the firn (0.4 cm i.e. per decade), and a shift of runoff onset 4.1–6.3 d per decade earlier in the season. Our results suggest that firn on the Juneau Icefield and other temperate Alaskan alpine glaciers may continue to lose long-term refreezing capacity. Increasing firn runoff and thinning firn may also propagate surface melt and rainfall to more rapidly integrate into downstream hydrology. In addition, inter-seasonal shifts in liquid-water retention (including firn aquifers) on the Juneau Icefield and similar regions, may introduce critical uncertainties in mass-balance calculations for sea-level rise estimates. Future studies should expand in-situ firn observations across the Juneau Icefield and other temperate Alaskan glaciers to further quantify spatiotemporal variability of meltwater processes and long-term impacts of firn evolution in a warming climate.
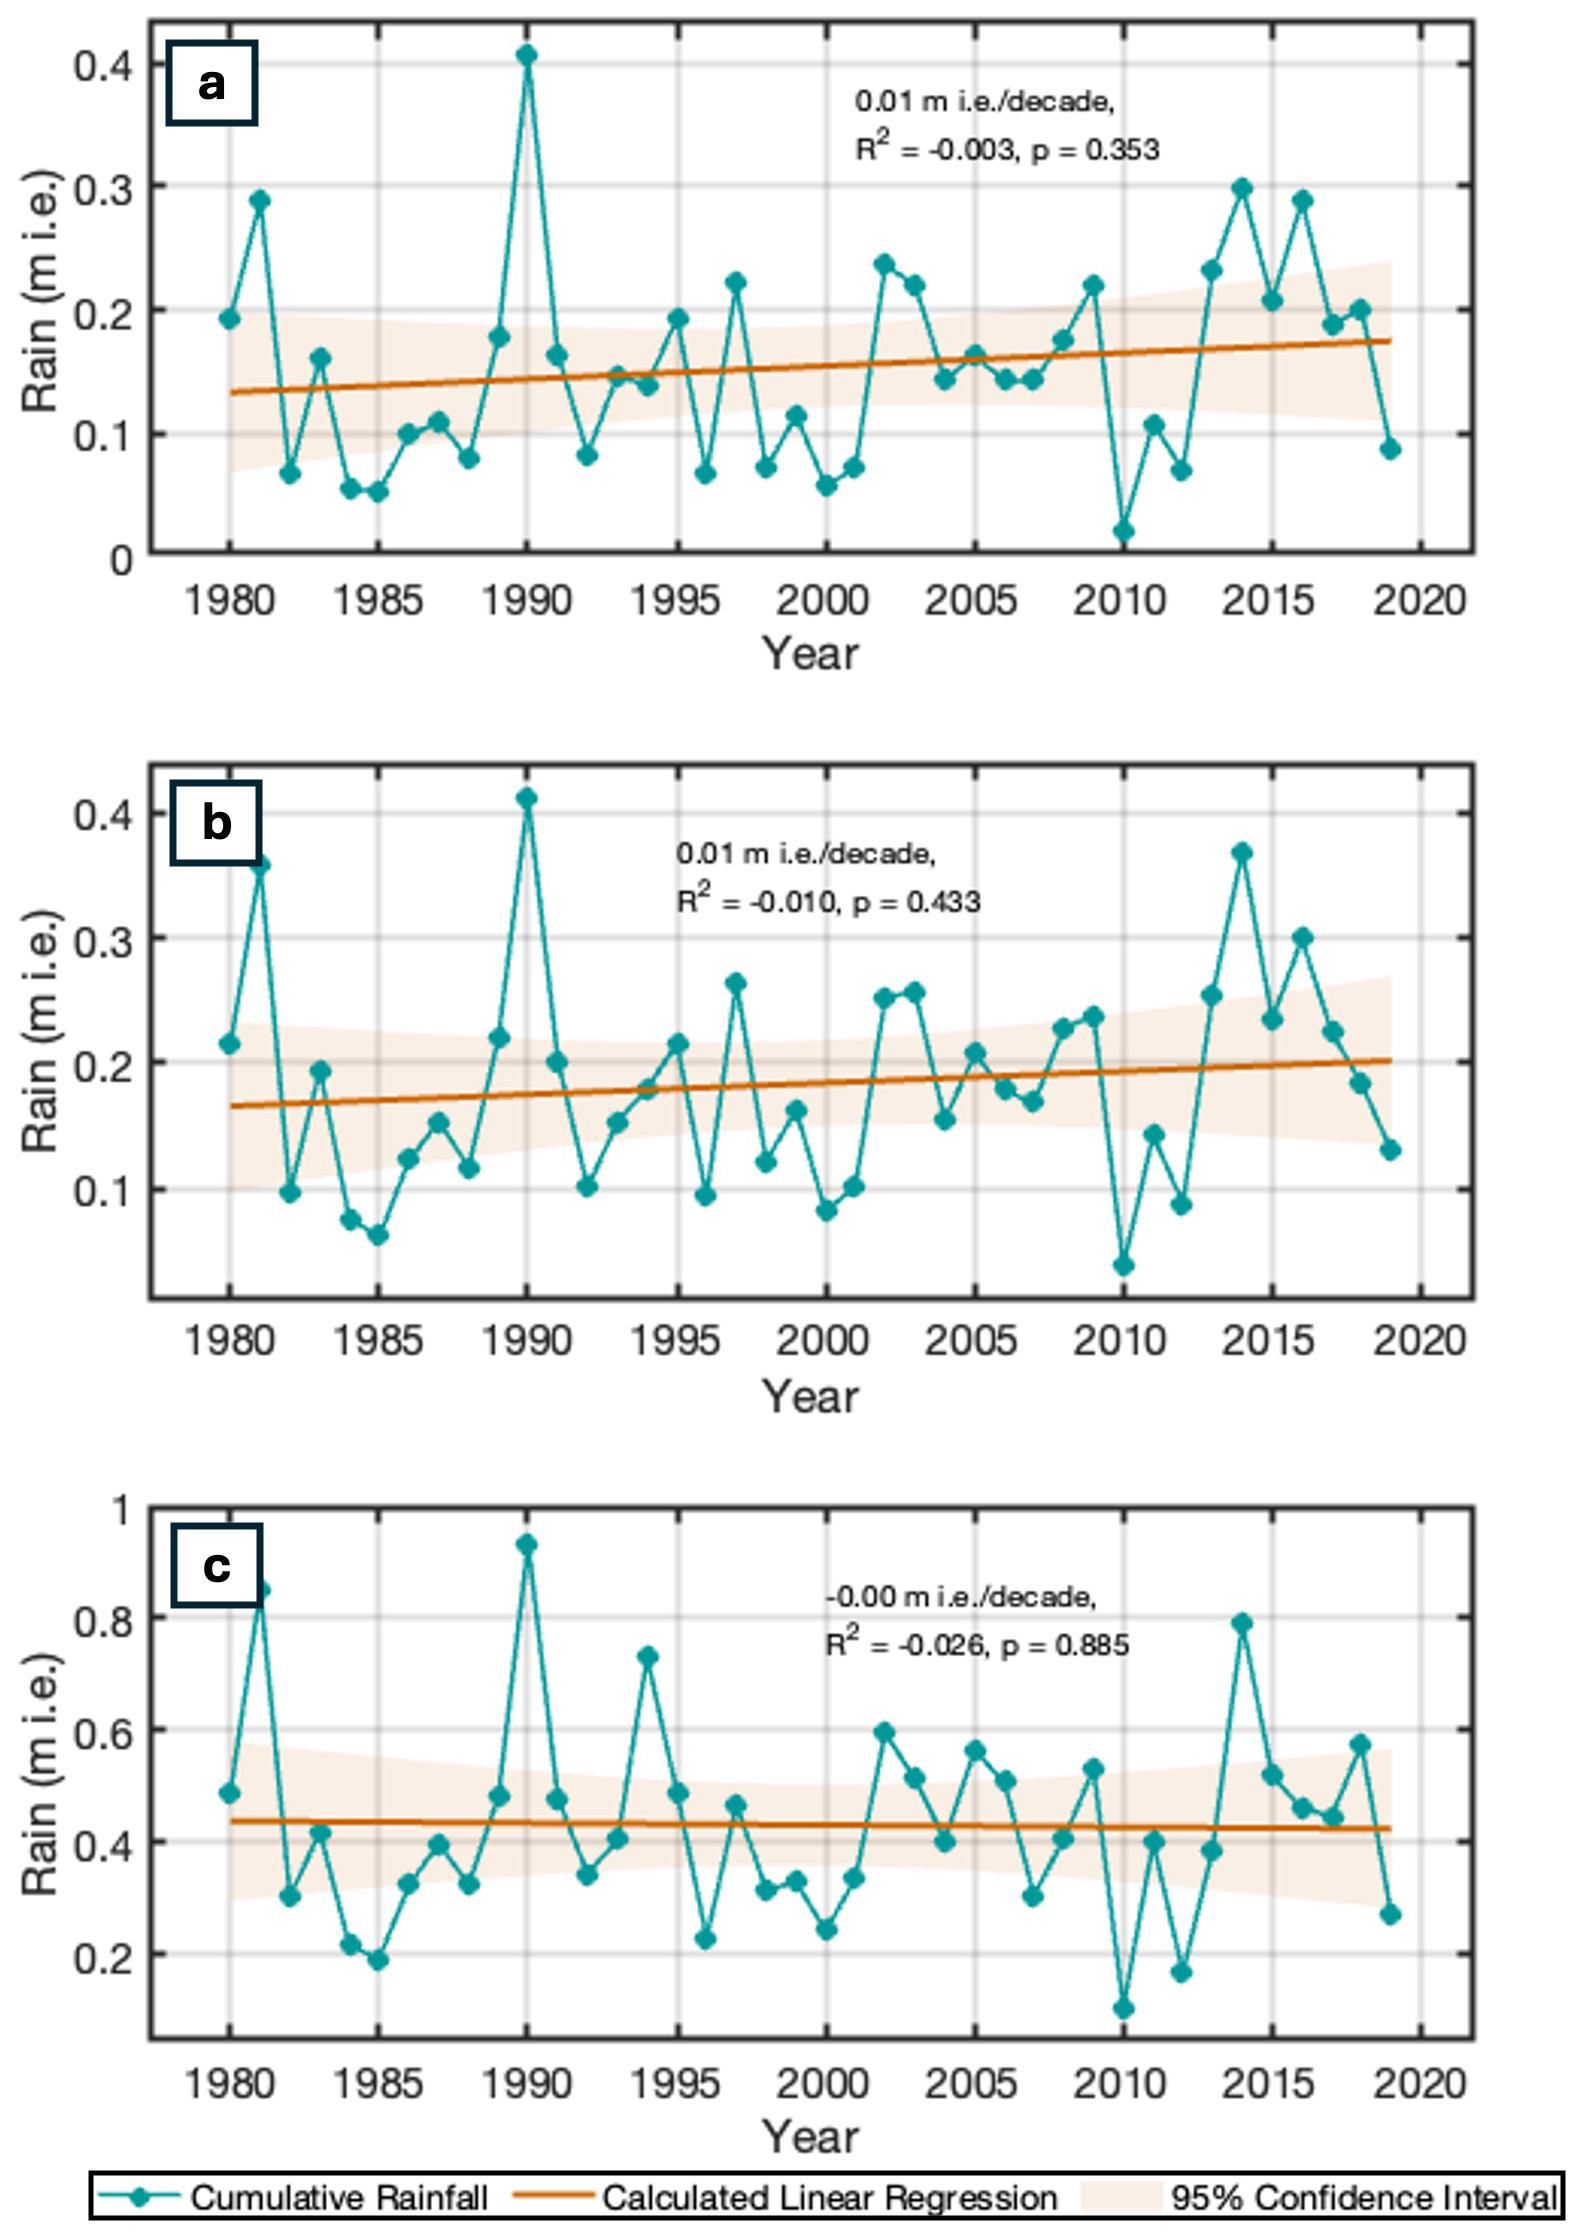
Figure A1Mean annual cumulative rainfall for the three accumulation-zone sites, derived from Ing et al. (2025): (a) MLD; (b) MG3; (c) NWB1.
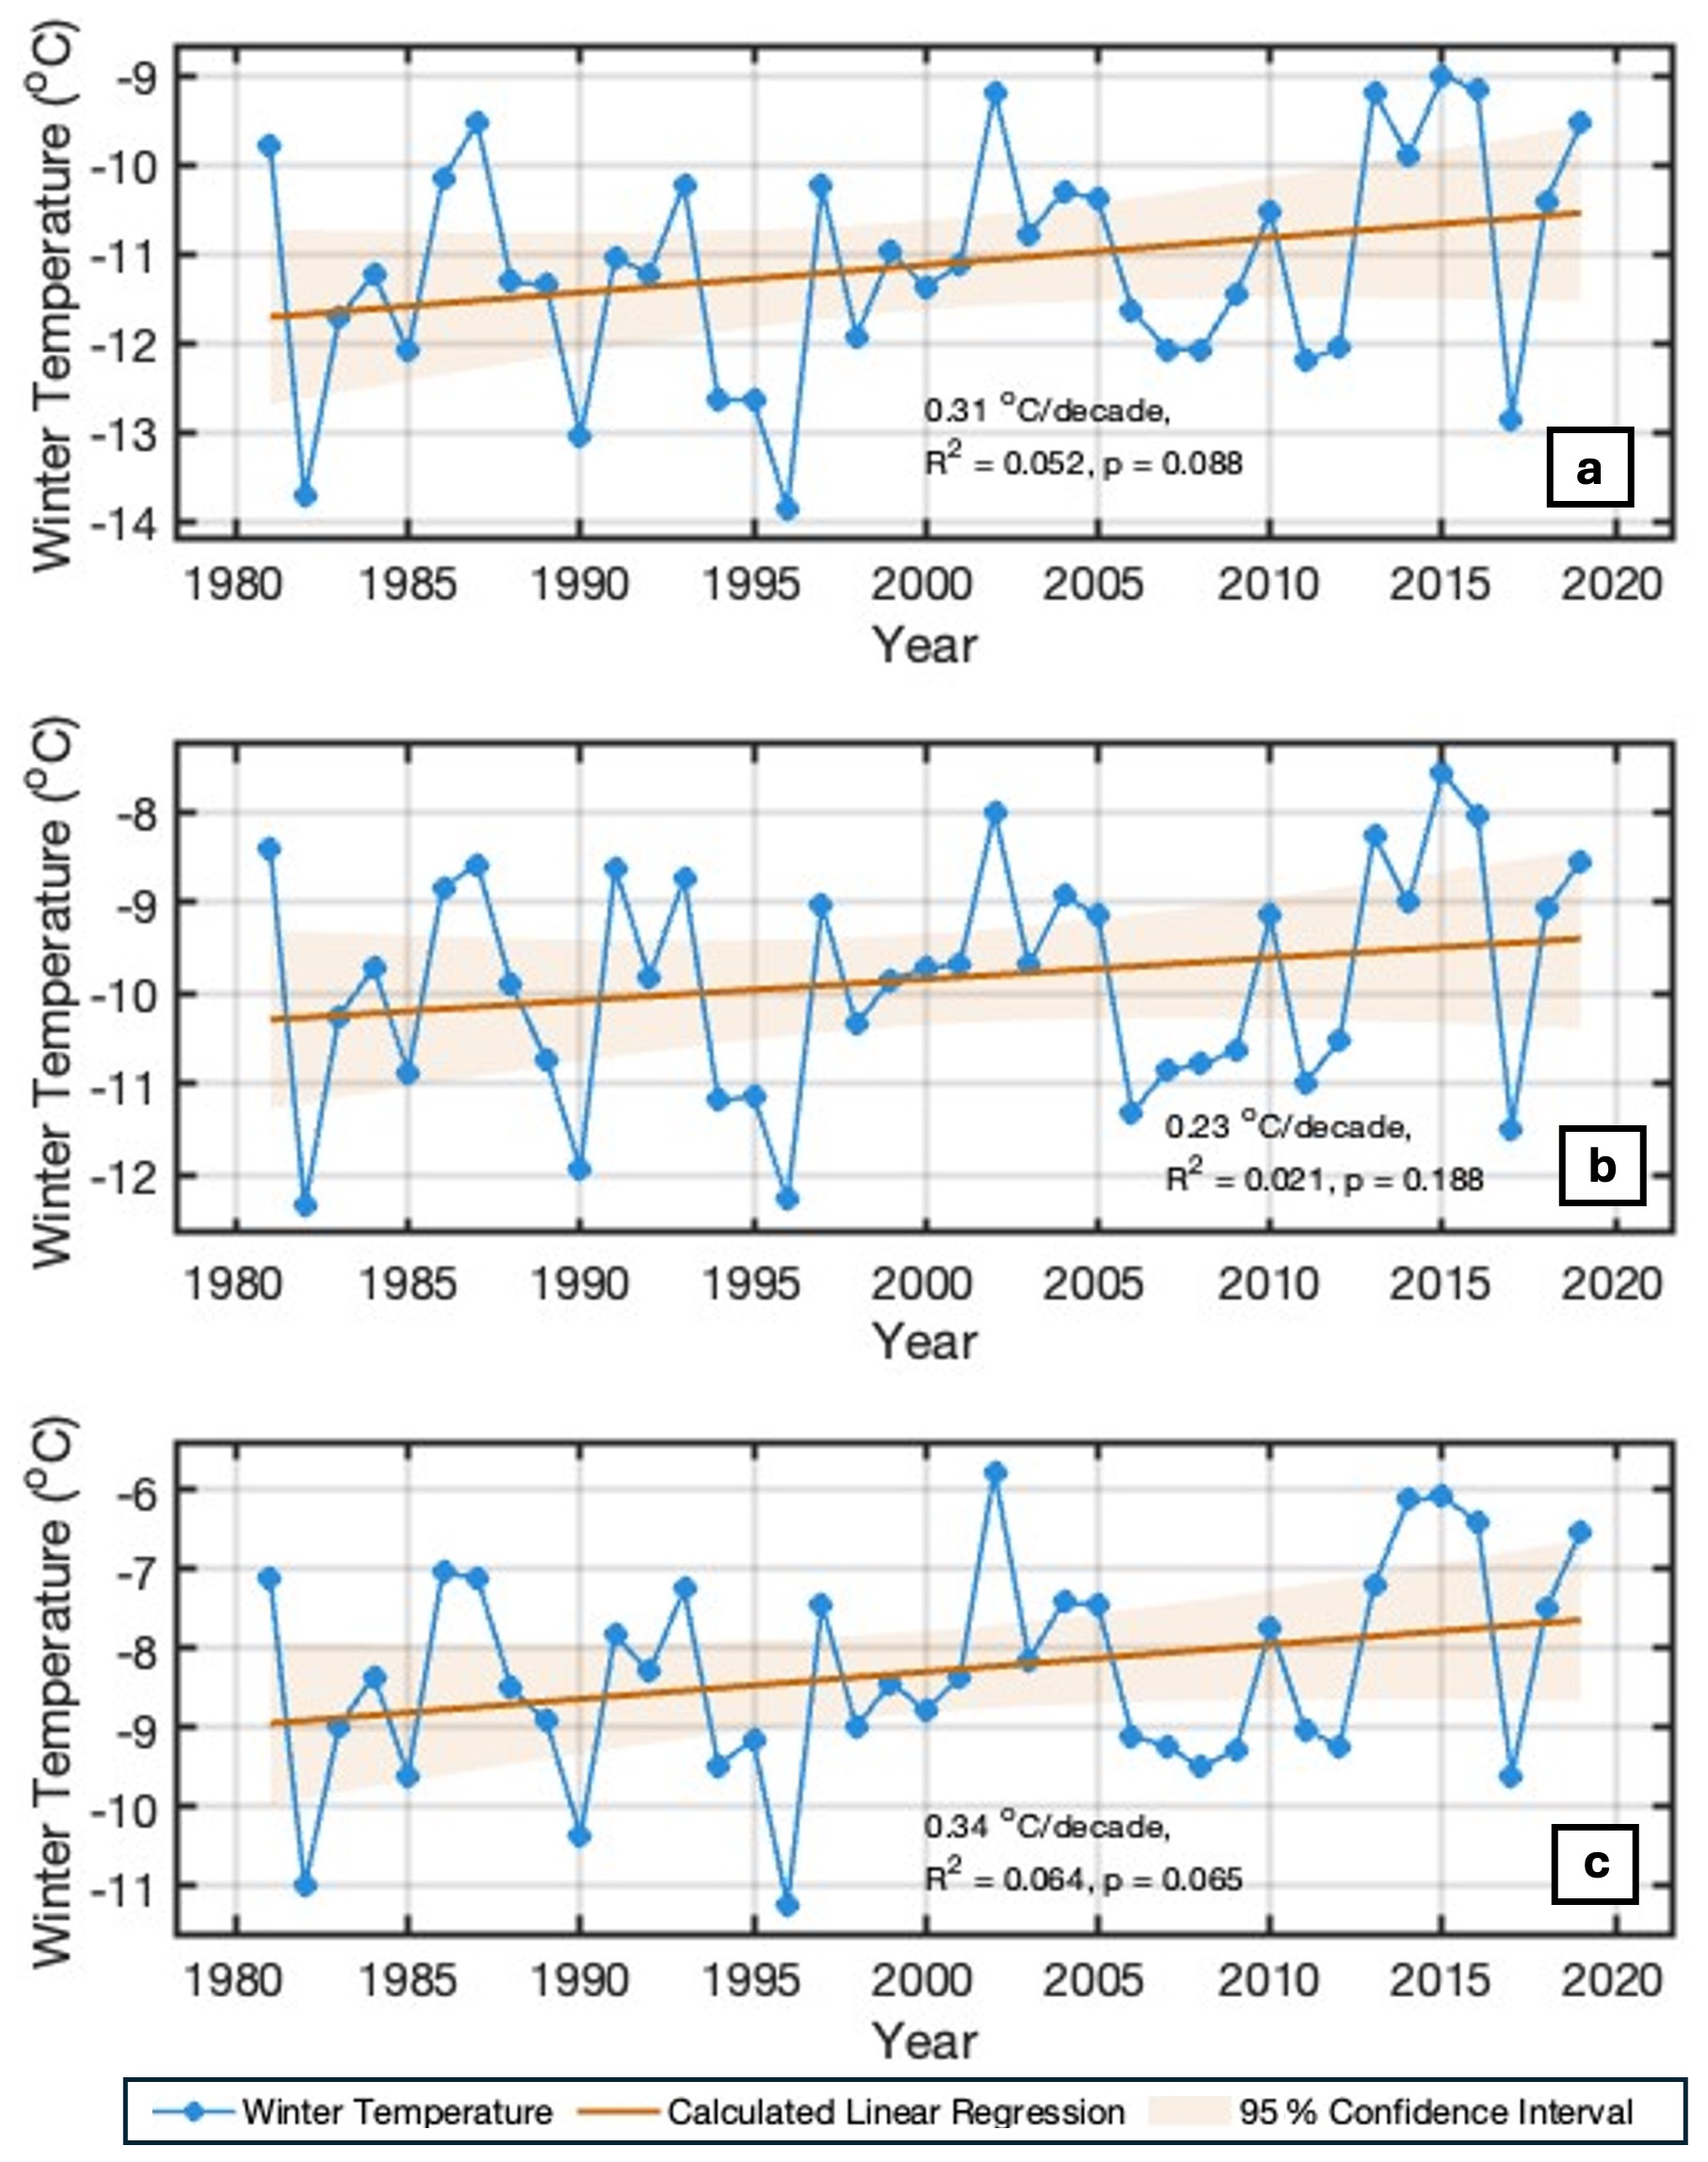
Figure A2Mean annual winter temperatures for the three accumulation-zone sites, derived from Ing et al. (2025): (a) MLD, (b) MG3, and (c) NWB1.
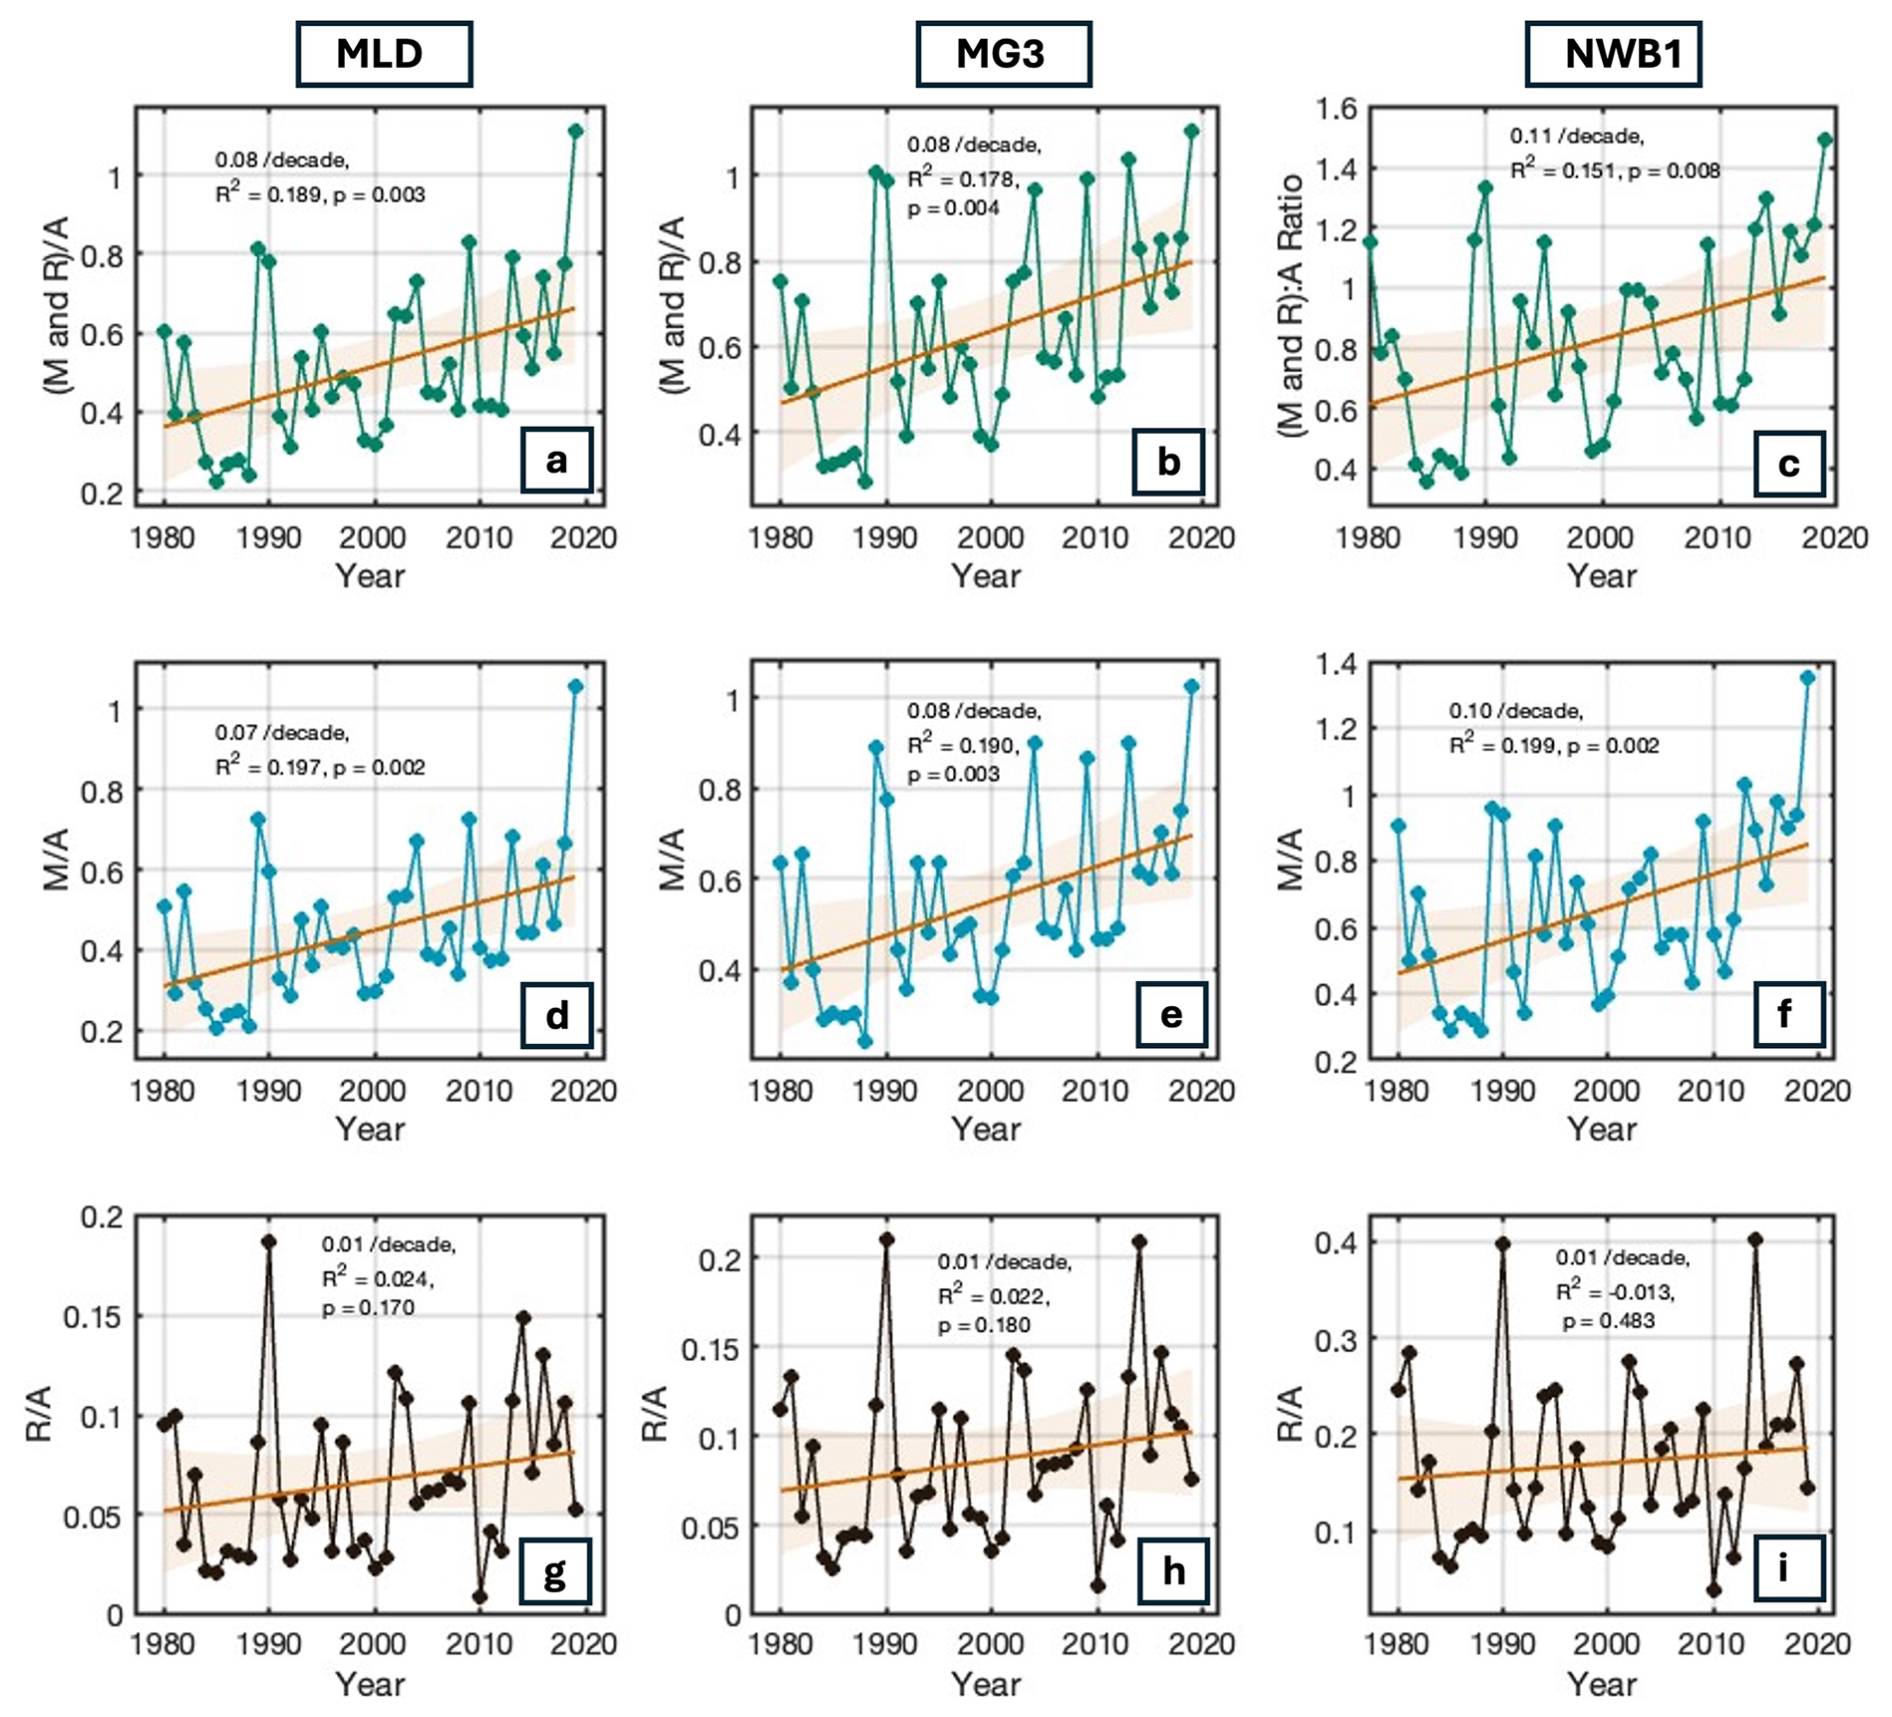
Figure A3Comparison between climate variables from the Ing et al. (2025) product for the three accumulation-zone sites (MLD, MG3, NWB1). Ratio between the sum of cumulative annual melt and rain to the cumulative annual snow accumulation (a–c); ratio between melt and accumulation (d–f); and ratio between rain and accumulation (g–i).
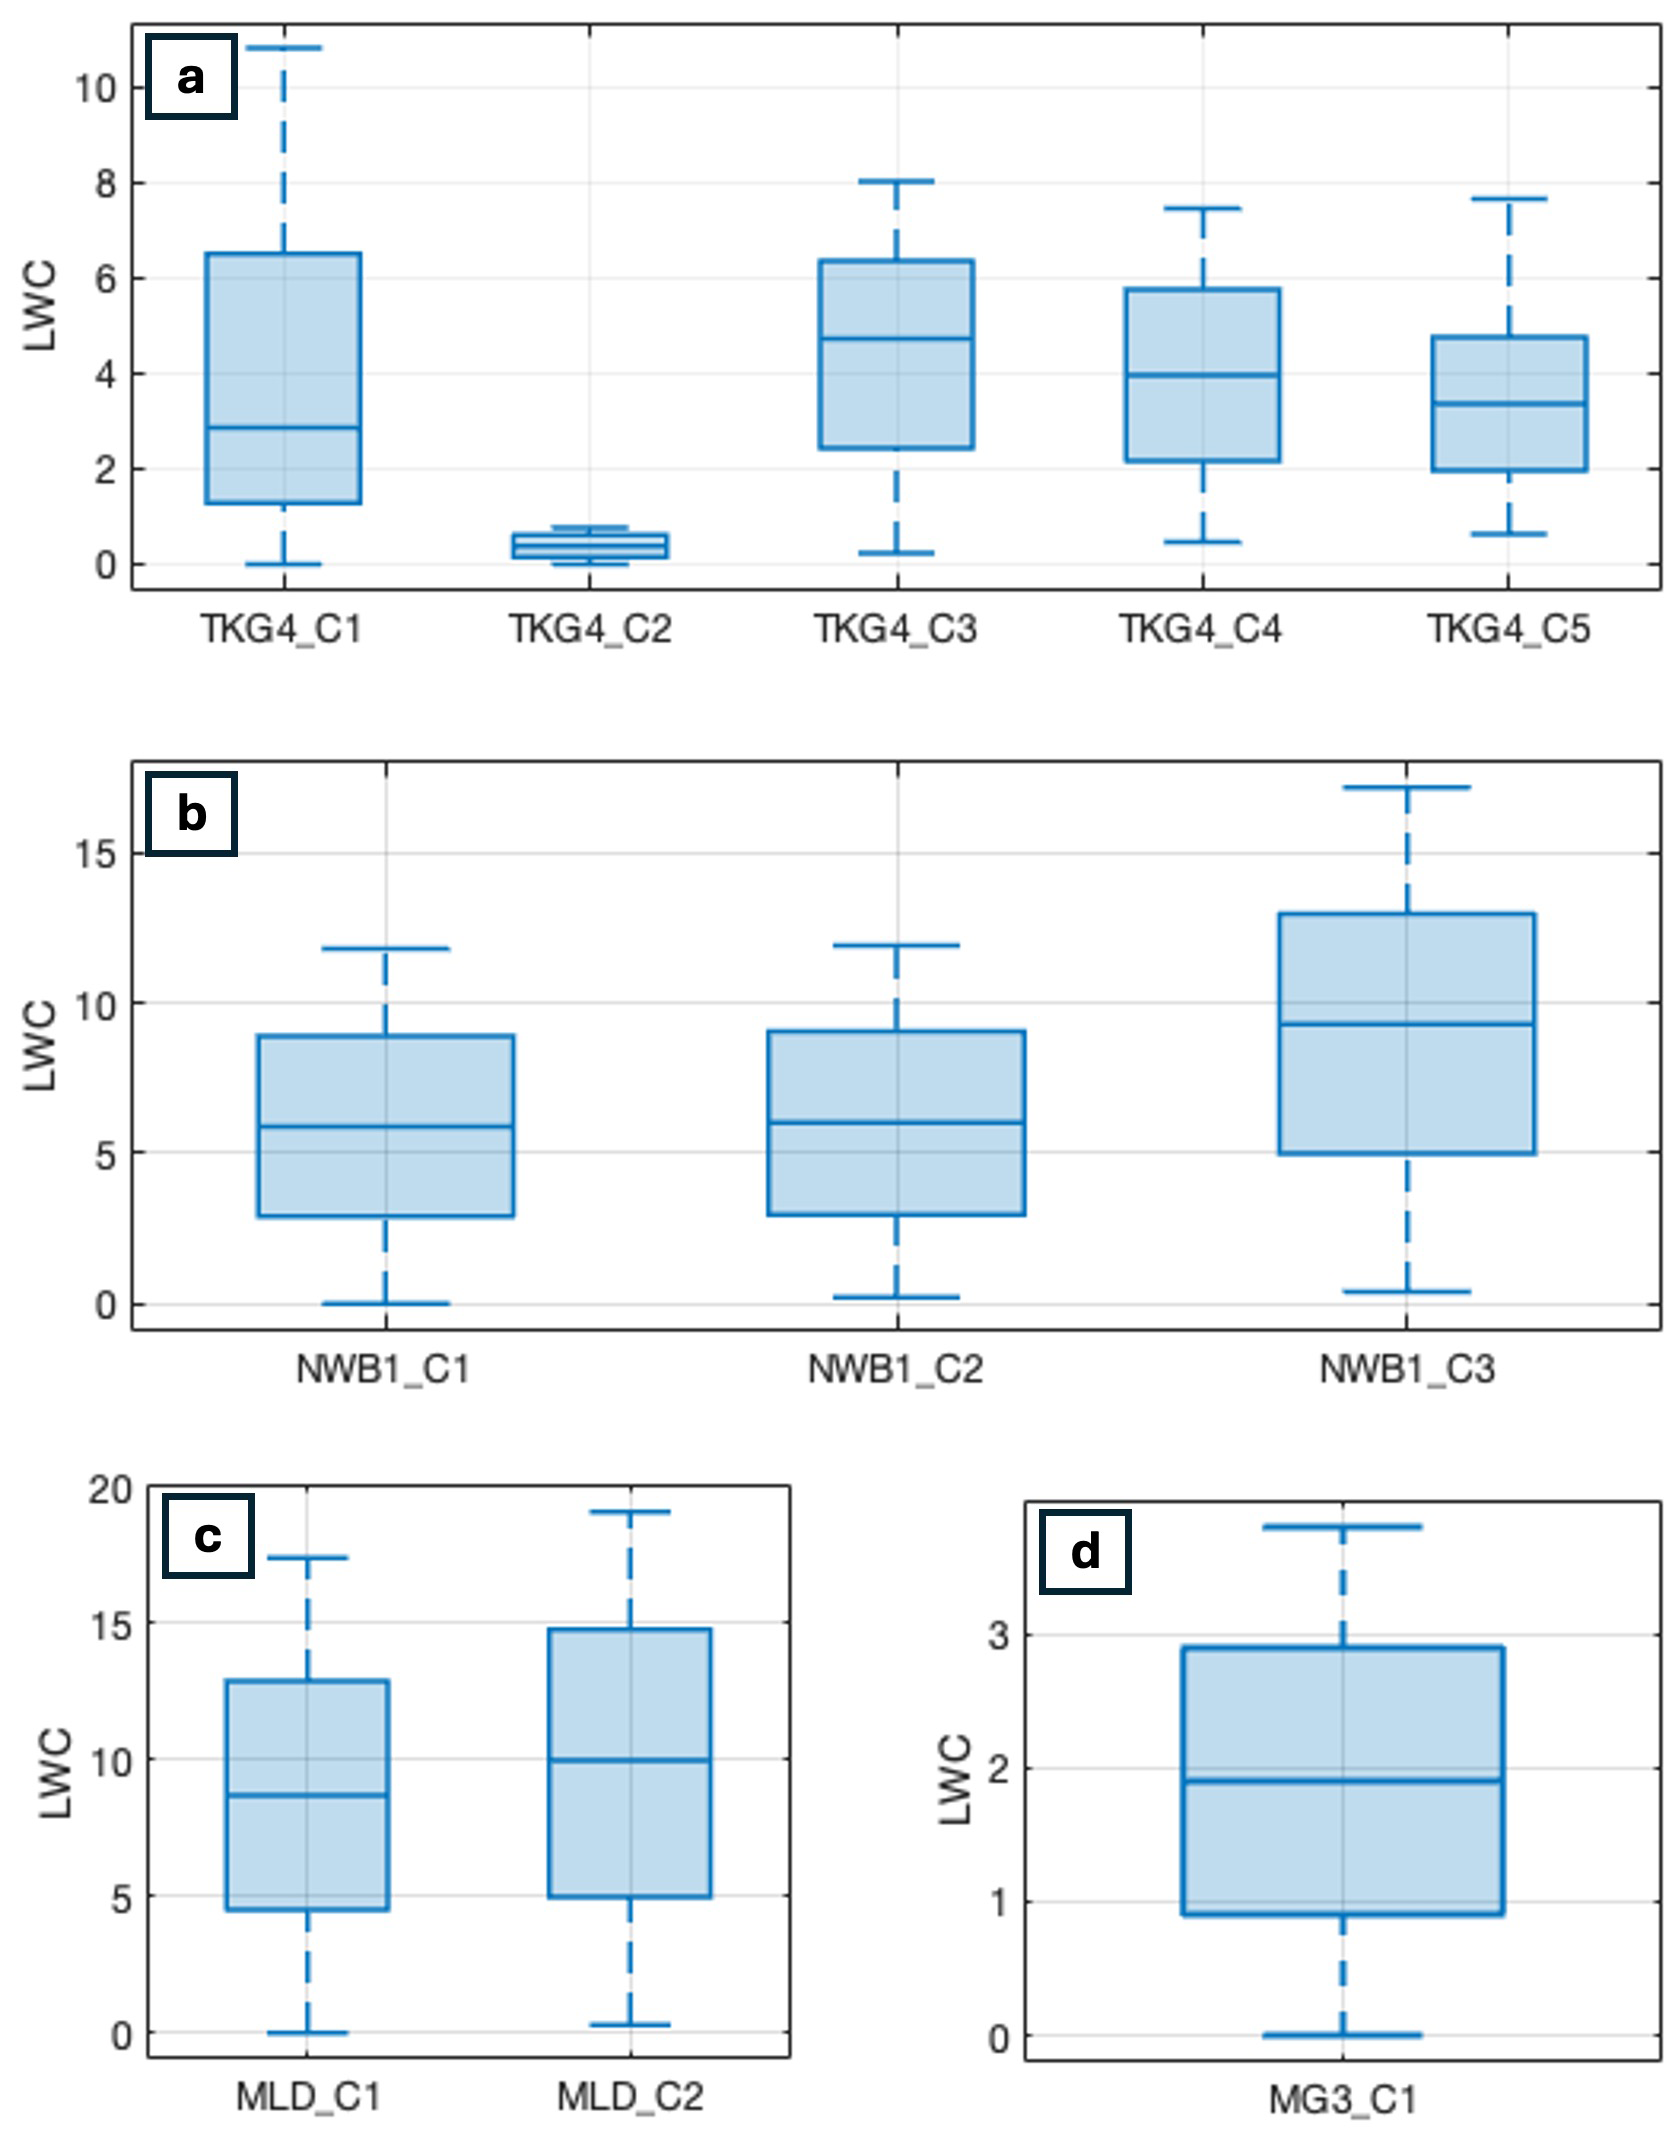
Figure A4Box plots of repeated measurements of liquid water content (LWC) of the full cores at all the four sites: (a) TKG4, (b) NWB1, (c) MLD, and (d) MG3.

Figure A5Modeled firn temperature profiles from 1980 to 2019 for (a) MLD; (b) MG3; and (c) NWB1.

Figure A6Modeled liquid-water content (LWC) profile evolution for the three sites: (a) MLD, (b) MG3, and (c) NWB1.

Figure A7Modeled mean-annual liquid-water content (LWC) profiles for the three sites: (a) MLD, (b) MG3, and (c) NWB1.
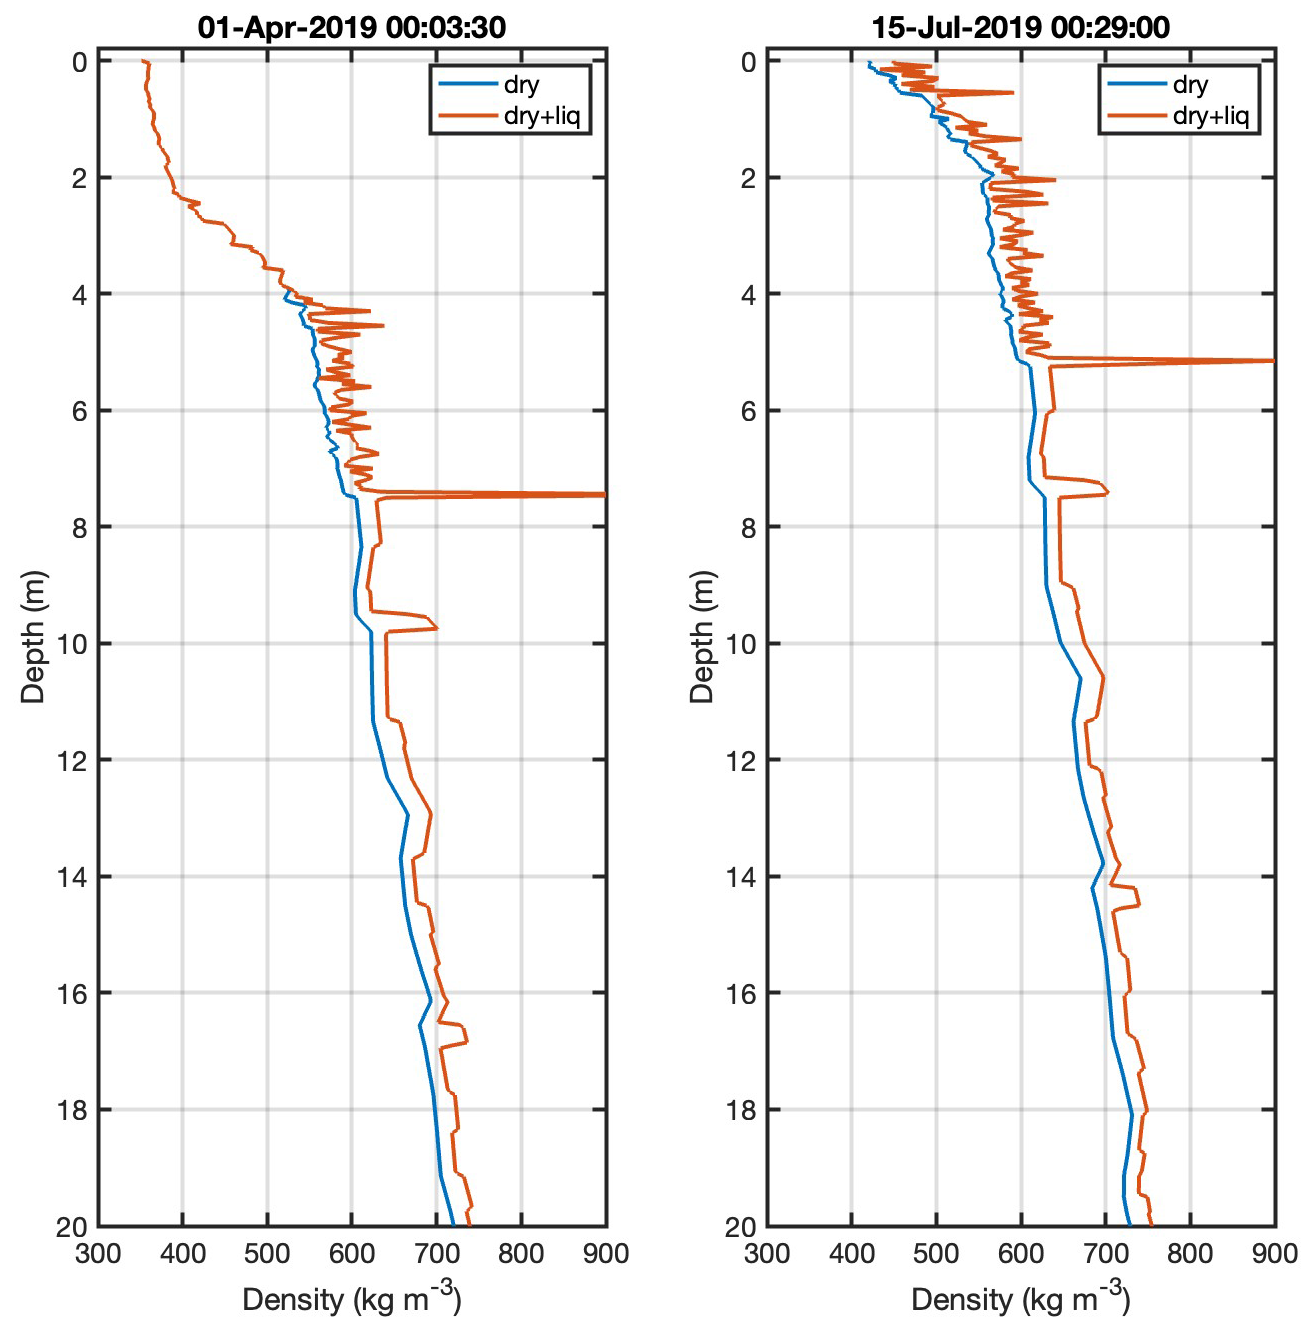
Figure A8Modeled depth-density profiles for April and July of 2019 at Site MLD, showing the ablation of the snow layer, and the dry and wet densities. Modeled dry and wet densities for April are the same until about 4 m depth.

Figure A9Modeled daily mean density (dry + liquid) from 1980–2019 for the three sites: (a) MLD, (b) MG3, and (c) NWB1.
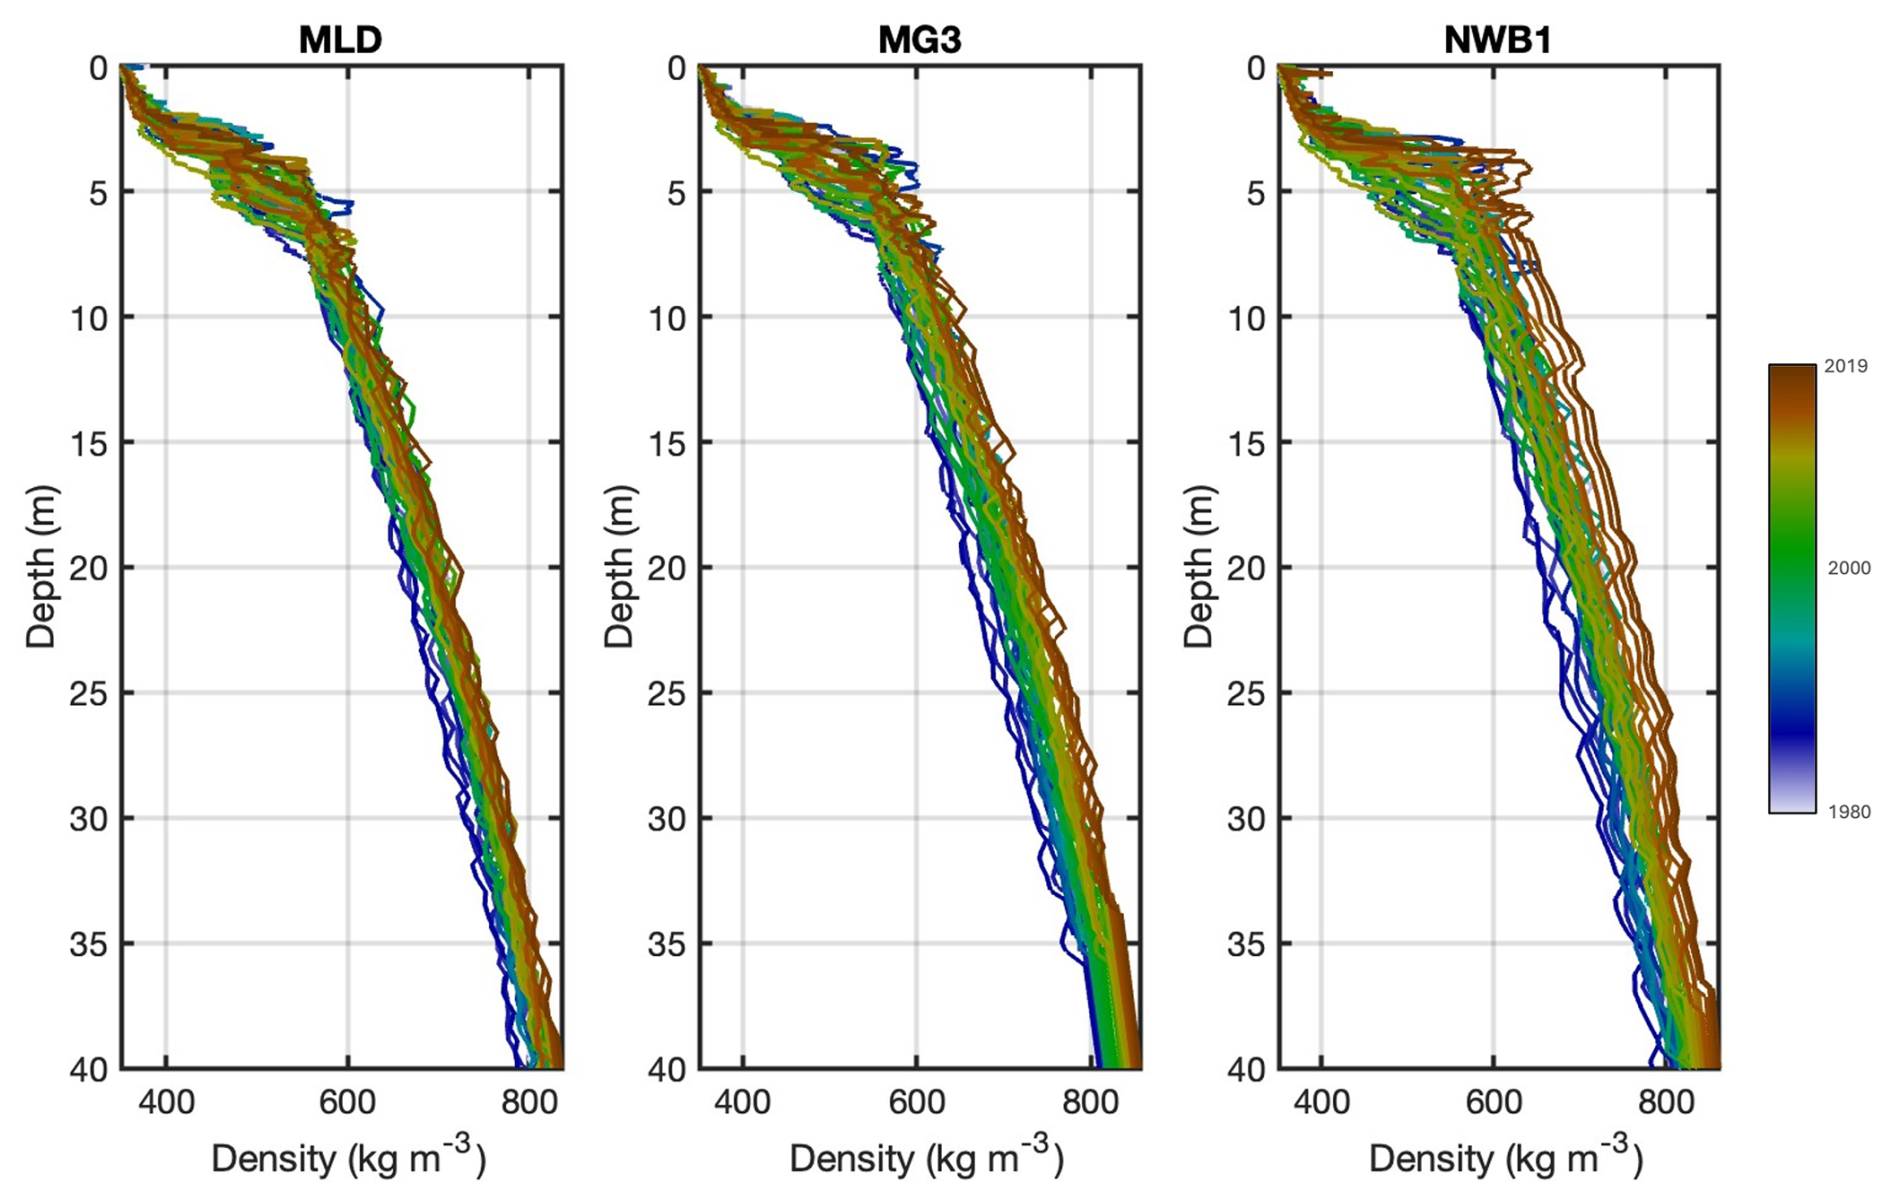
Figure A10Modeled mean annual density (dry + liquid) profiles from 1980–2019 for the three sites: (a) MLD, (b) MG3, and (c) NWB1.
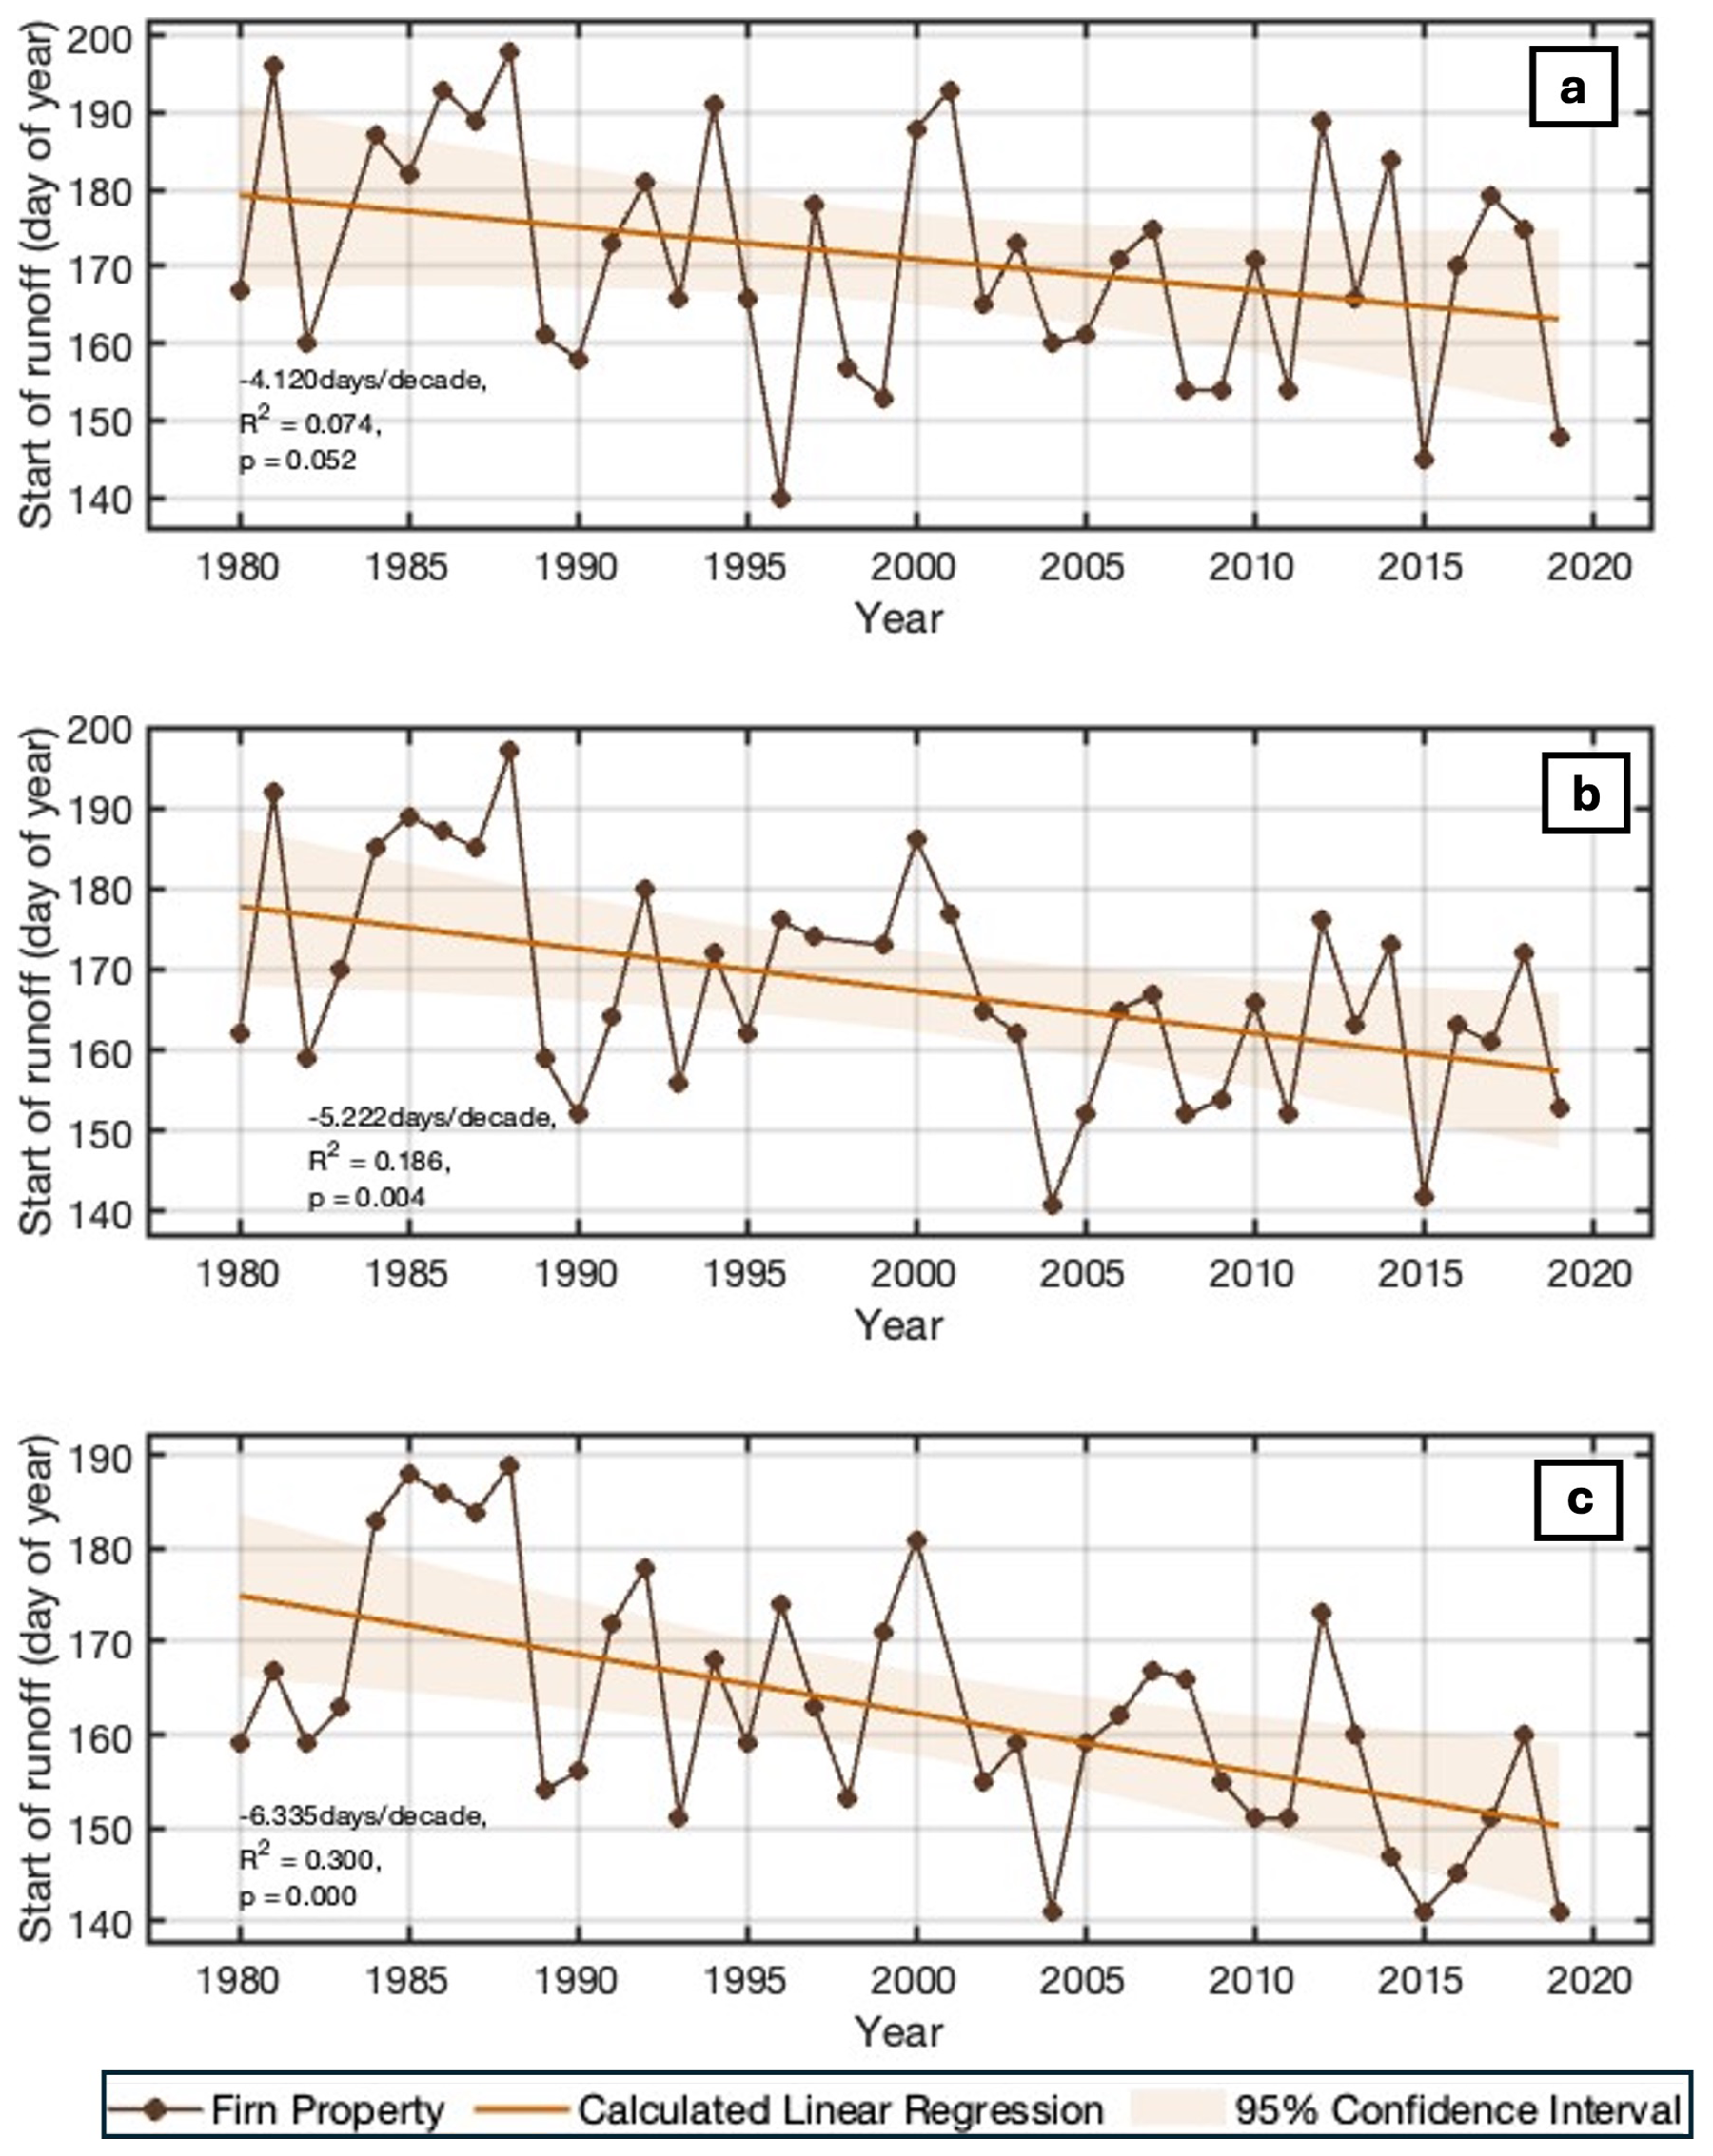
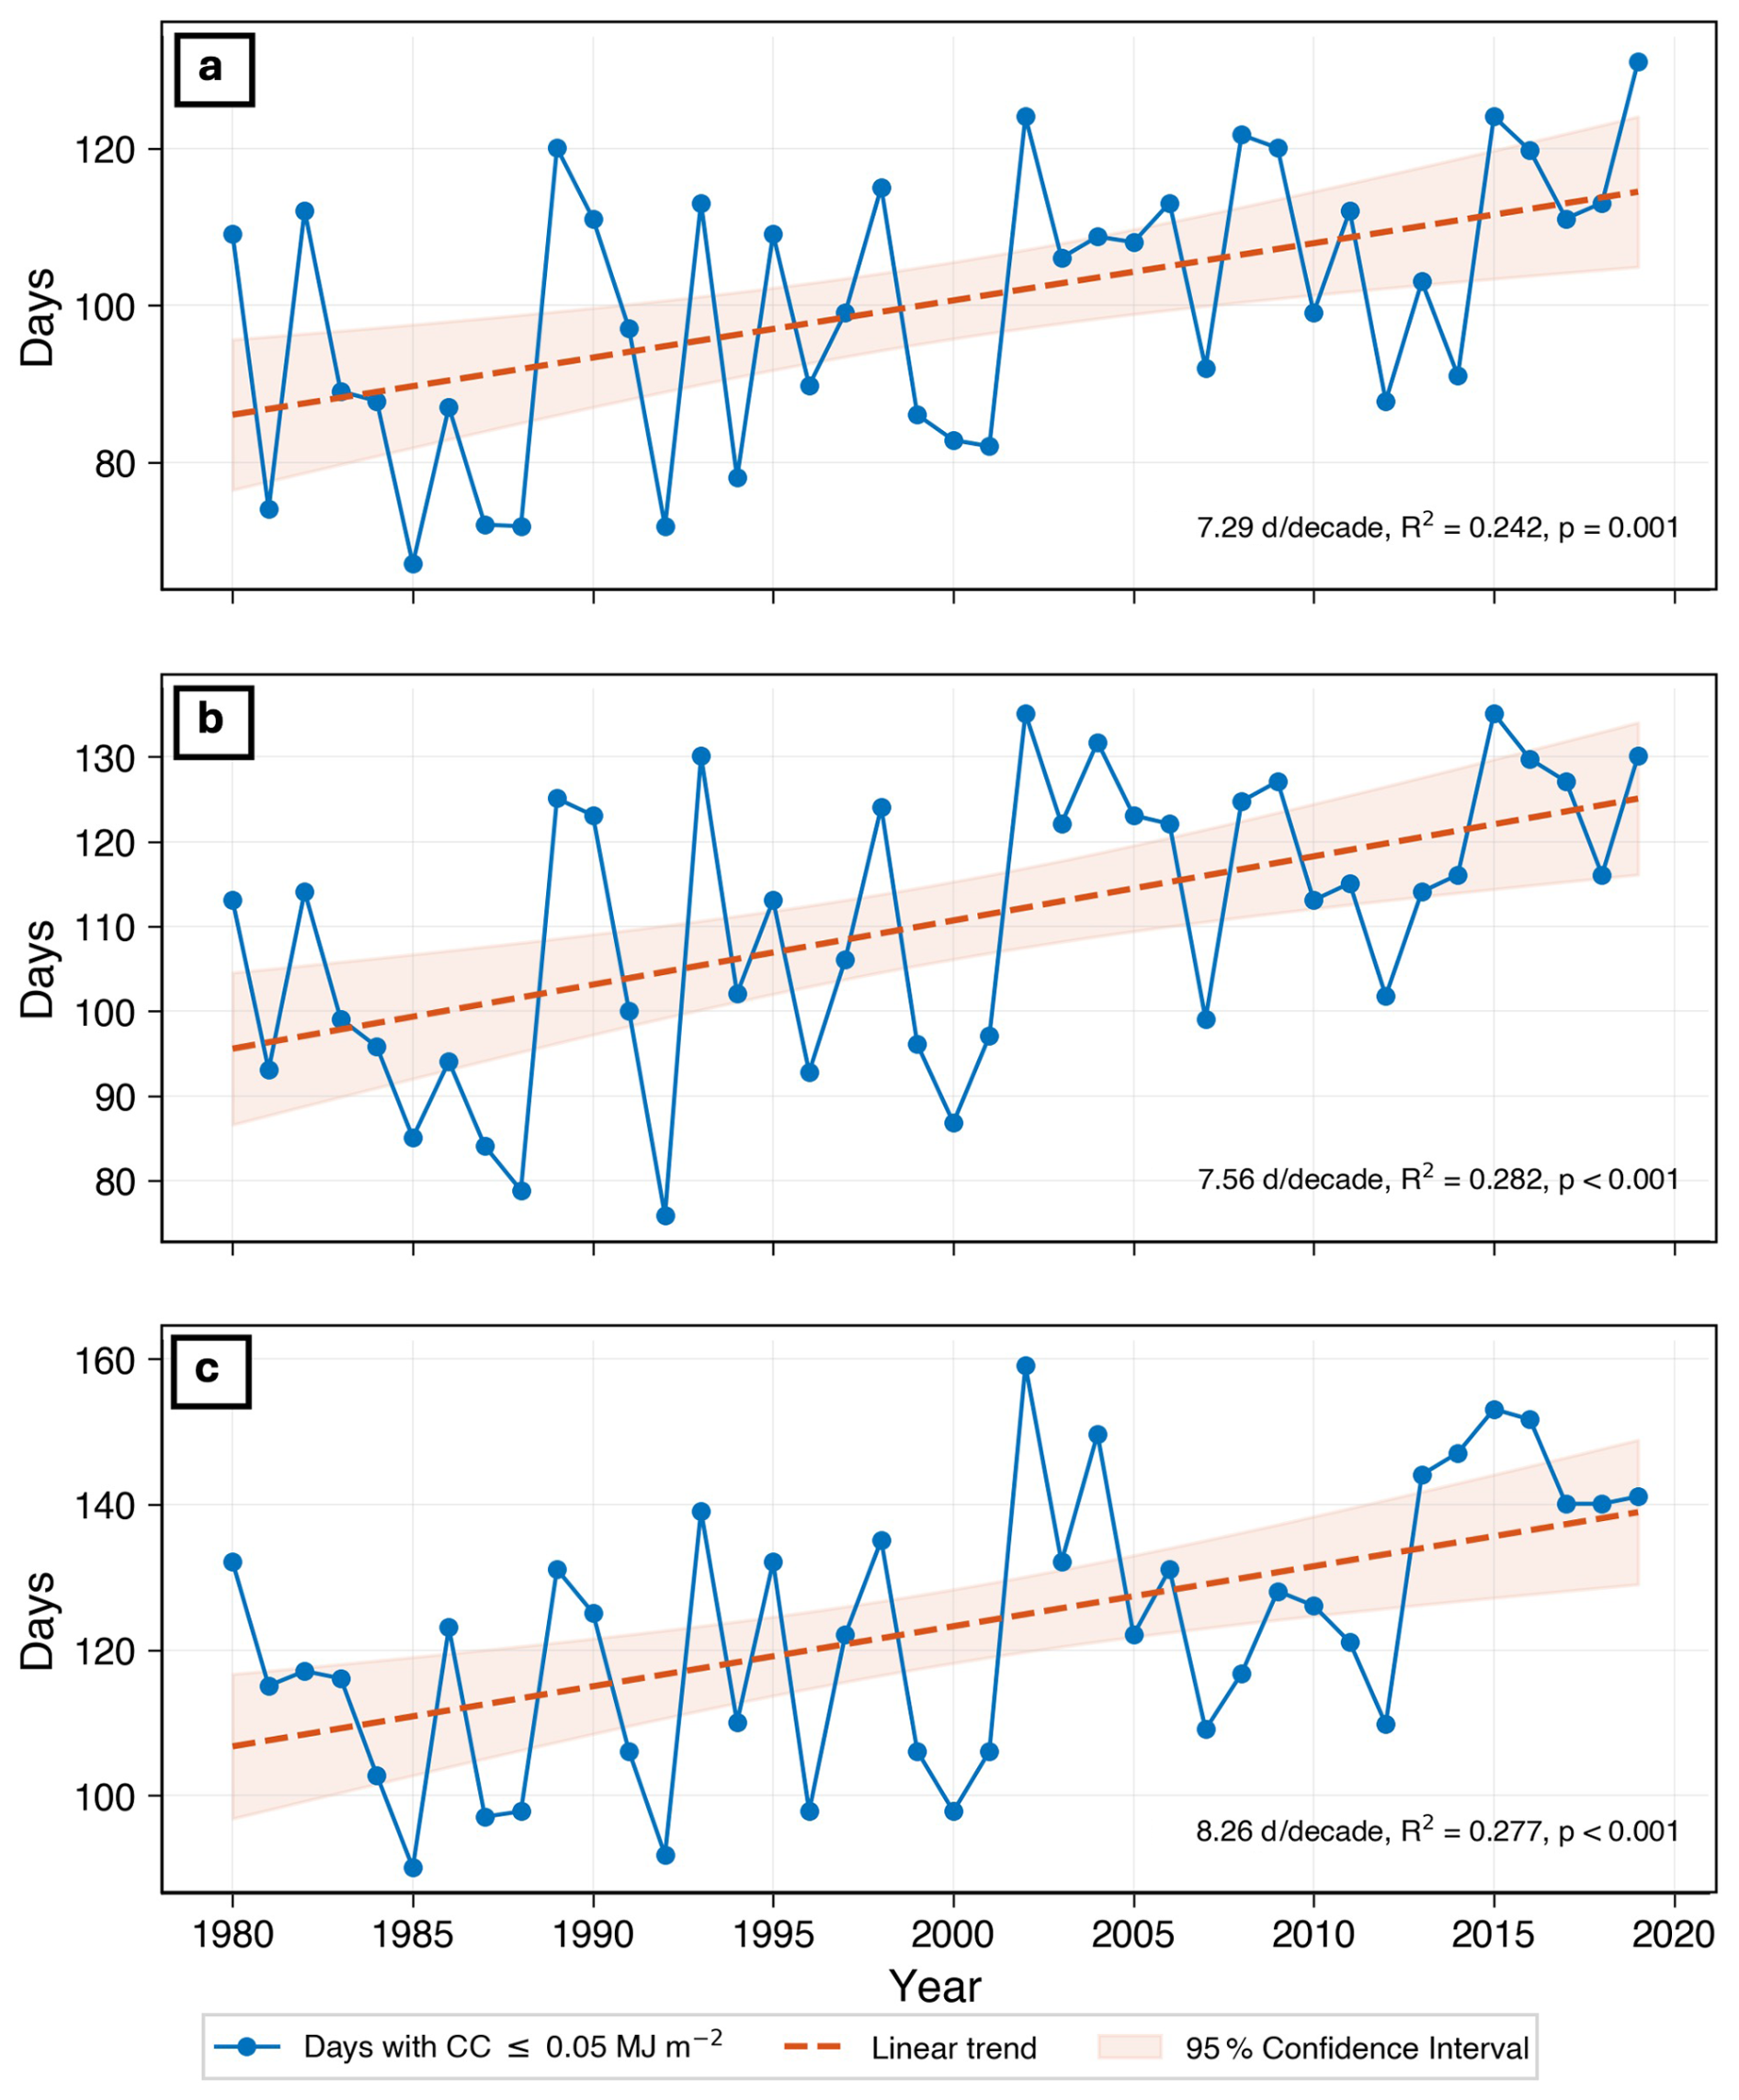
Figure A12Number of days per year with cold content ≤0.05 MJ m−2 for (a) MLD, (b) MG3, and (c) NWB1, derived from the modeled results.
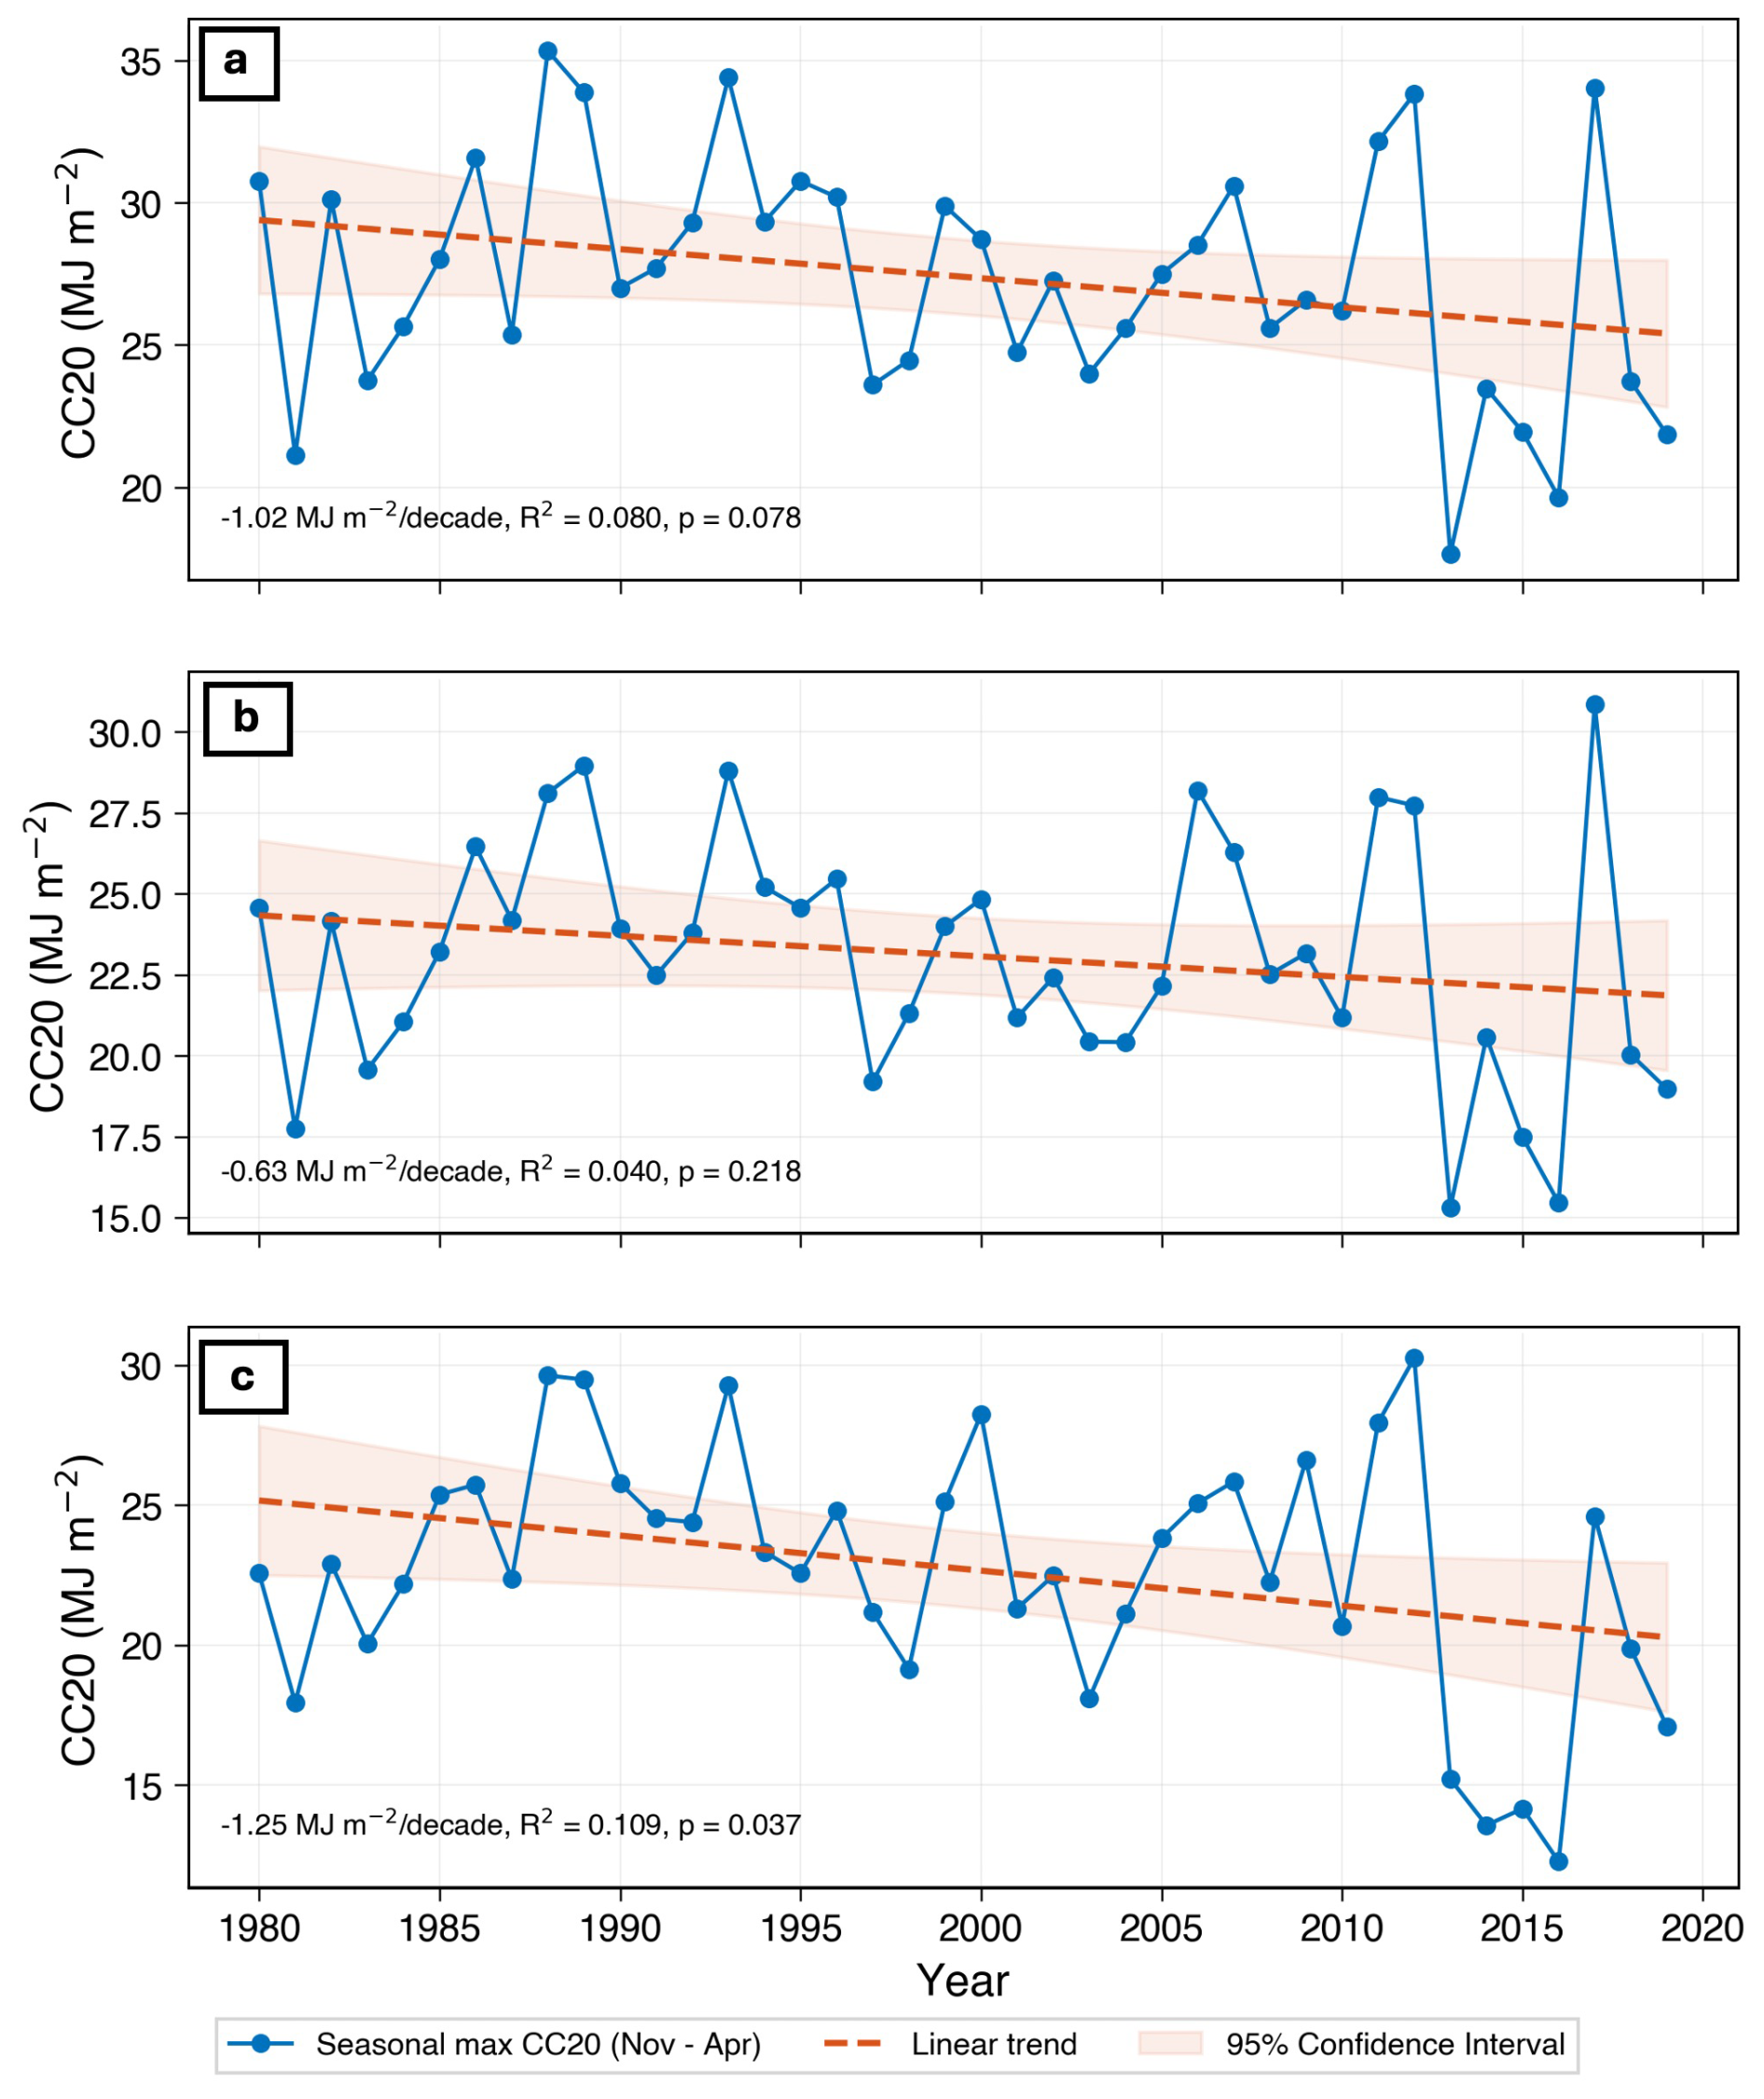
Figure A13Mean winter cold content (November–April) calculated from model results from 1980–2019 for the three sites: (a) MLD, (b) MG3, and (c) NWB1, derived from model results.
Table A1Statistics related to climate results and associated linear regressions.
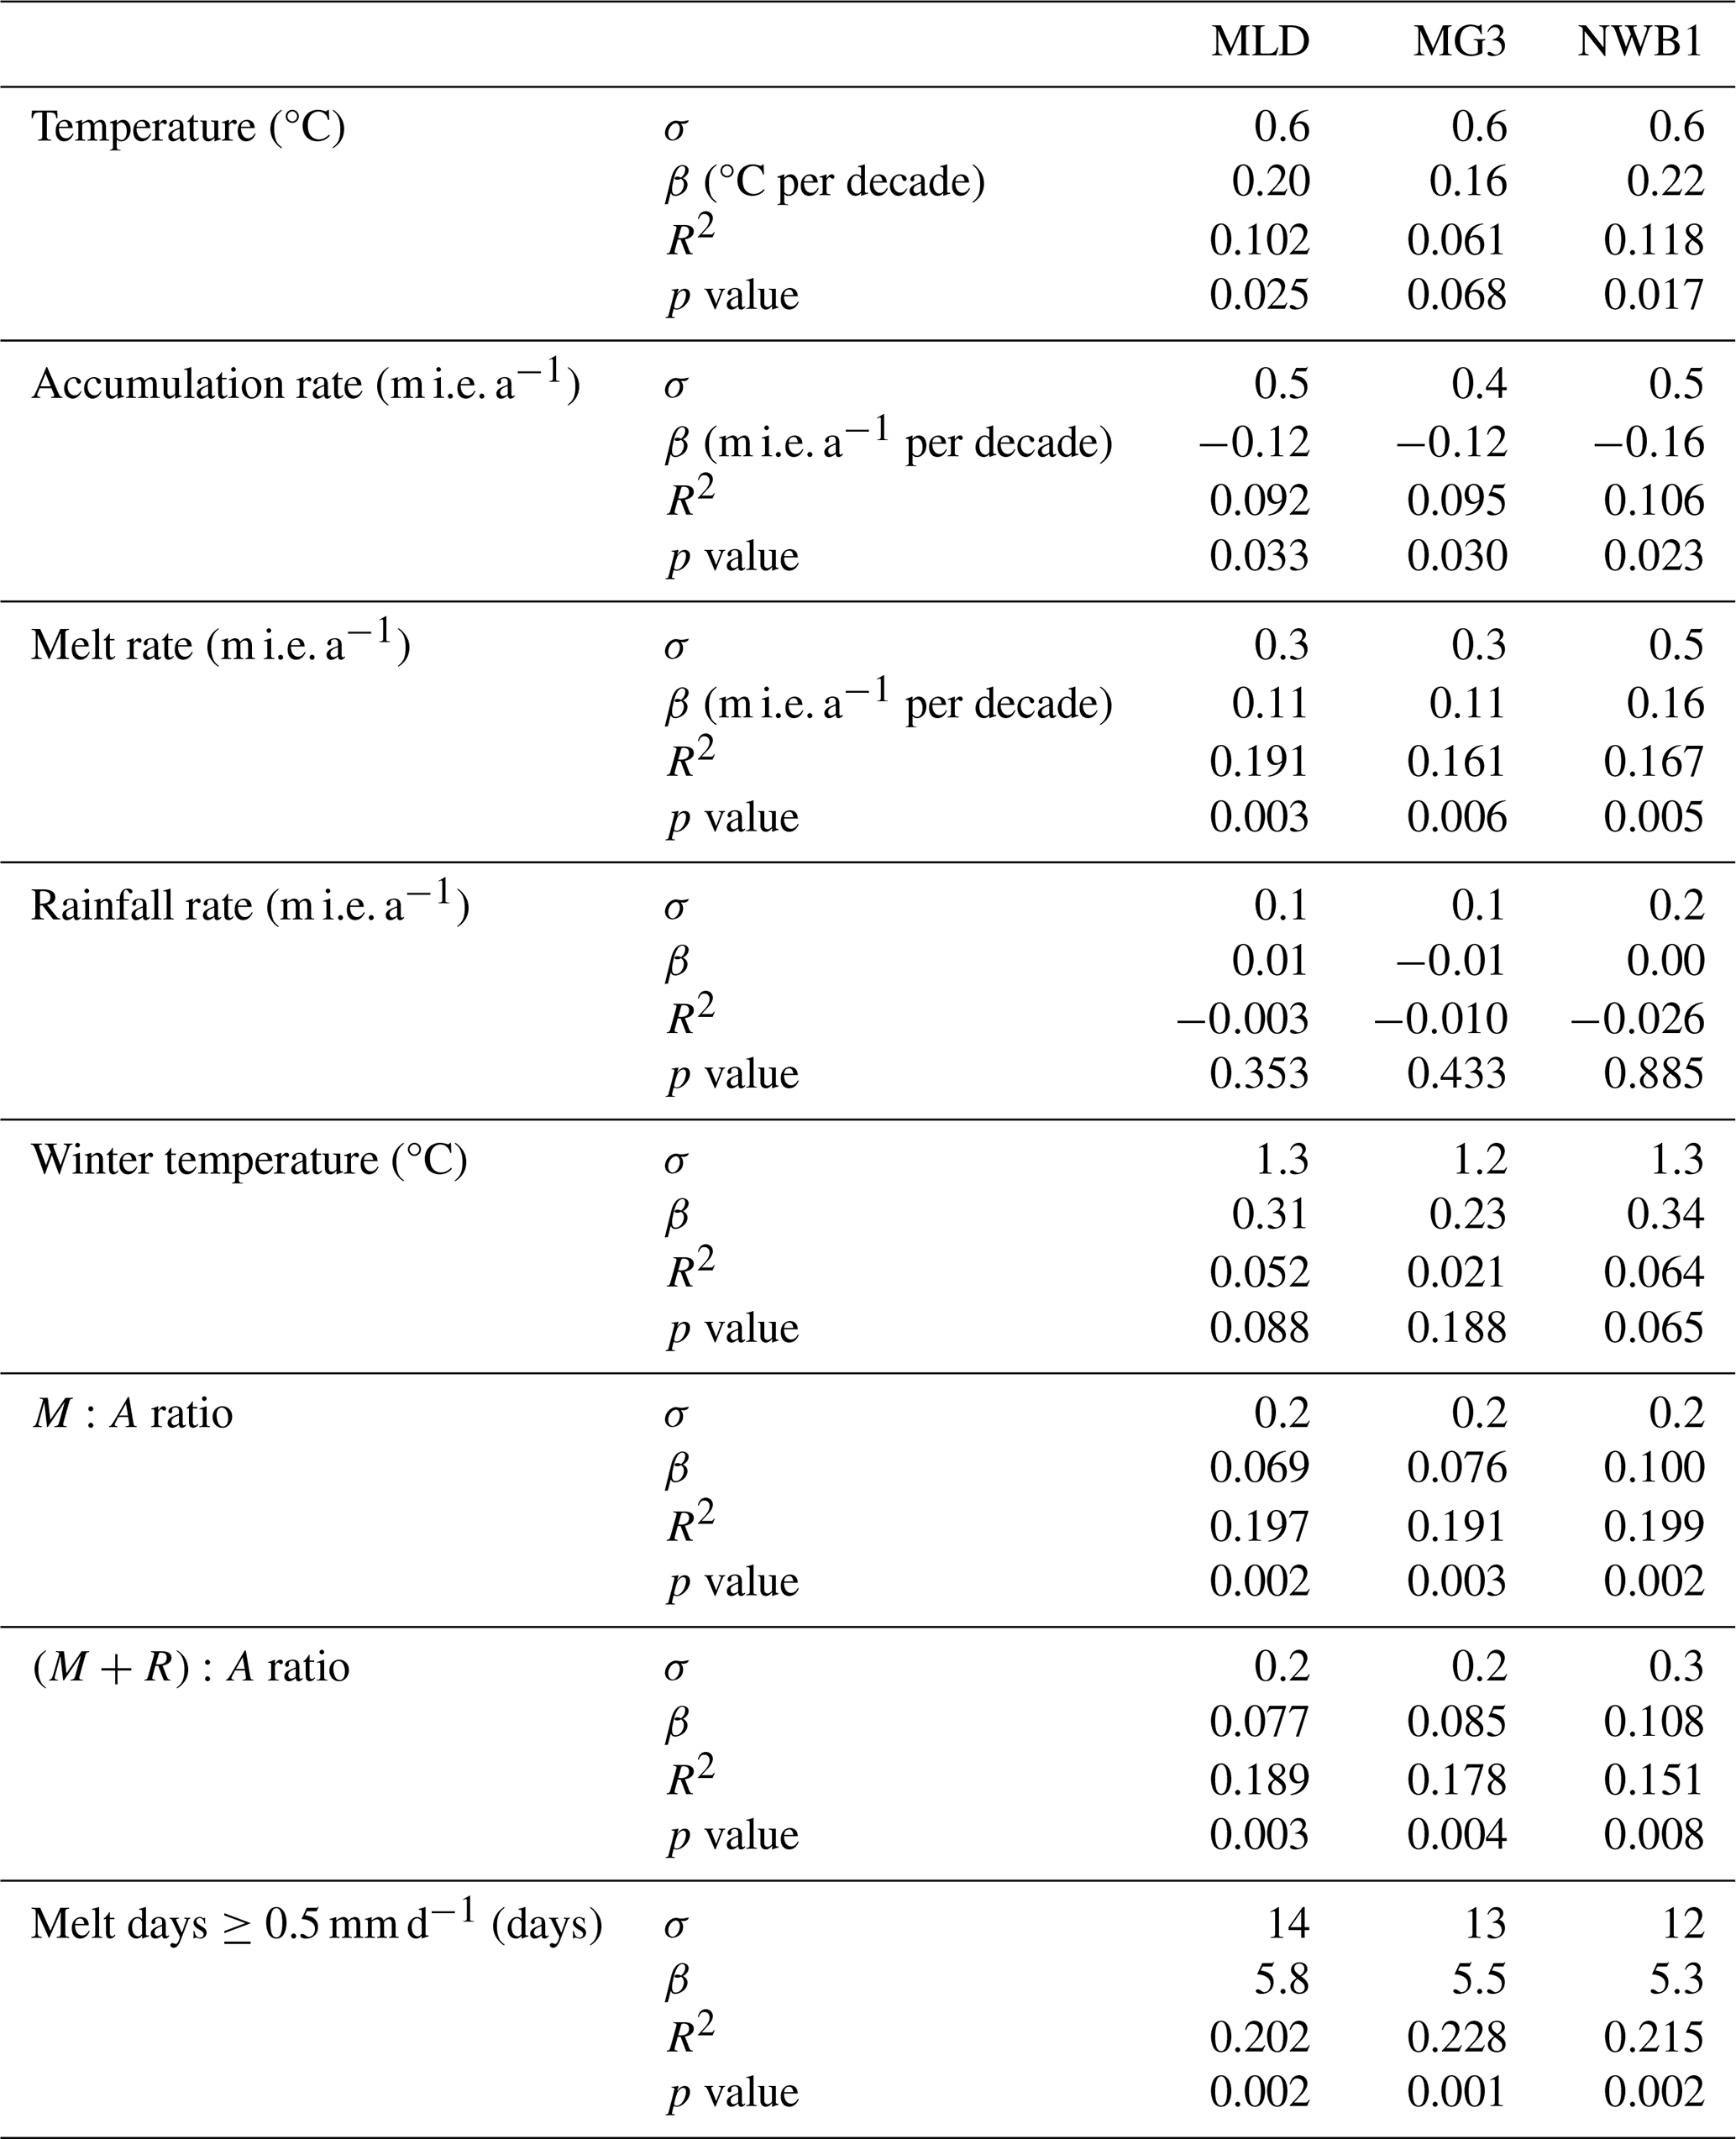
Table A2Statistics related to firn-model results and associated linear regressions.
The CFM code is publicly available at https://github.com/UWGlaciology/CommunityFirnModel (Stevens et al., 2020). Documentation for the CFM is online at https://communityfirnmodel.readthedocs.io (last access: 1 March 2025). Firn-core data and firn-model output are available through the NSF Arctic Data Center at: https://doi.org/10.18739/A2RX93G3P (Horlings et al., 2025). All outputs from this study are also available from the authors without conditions.
ANH conceptualized the study with the mentorship of BM. ANH led the field season and ANH, JR, BM, MM, KB, TW collected the firn cores. SC and BM provided the field equipment. MM and KB conceptualized Wise-sensor measurements. ANH performed the analyses and interpretation of field and climate data, led modeling and interpretation, and wrote the manuscript. CMS contributed to modeling and interpretations. JR performed cold-content calculations. JR, CMS, MM, KB, TW, and BM contributed to writing the manuscript.
The contact author has declared that none of the authors has any competing interests.
Publisher's note: Copernicus Publications remains neutral with regard to jurisdictional claims made in the text, published maps, institutional affiliations, or any other geographical representation in this paper. The authors bear the ultimate responsibility for providing appropriate place names. Views expressed in the text are those of the authors and do not necessarily reflect the views of the publisher.
We thank the Juneau Icefield Research Program (JIRP) for field support. We also are grateful to Lynn Brennan, Erin Towns, and Mari Fromstein for their help in the field. We acknowledge the Tlingit, whose ancestral lands include the Juneau Icefield. We also thank the two anonymous reviewers for their contribution to the peer review of the paper.
A.N.H. was supported by NSF Office of Polar Programs Postdoctoral Award #2318348. C.M.S. was supported by NASA Grant #80NSSC25K7216. Fieldwork for this project was supported by NSF Office of Polar Programs Postdoctoral Award #2318348 and NSF Career Grant #2239668.
This paper was edited by Daniel Farinotti and reviewed by two anonymous referees.
Ashmore, D. W., Mair, D. W., and Burgess, D. O.: Meltwater percolation, impermeable layer formation and runoff buffering on Devon Ice Cap, Canada, J. Glaciol., 66, 61–73, https://doi.org/10.1017/jog.2019.80, 2020. a
Berthier, E., Larsen, C., Durkin, W. J., Willis, M. J., and Pritchard, M. E.: Brief communication: Unabated wastage of the Juneau and Stikine icefields (southeast Alaska) in the early 21st century, The Cryosphere, 12, 1523–1530, https://doi.org/10.5194/tc-12-1523-2018, 2018. a
Blaskey, D., Koch, J. C., Gooseff, M. N., Newman, A. J., Cheng, Y., O’Donnell, J. A., and Musselman, K. N.: Increasing Alaskan river discharge during the cold season is driven by recent warming, Environ. Res. Lett., 18, 024042, https://doi.org/10.1088/1748-9326/acb661, 2023. a
Bonnell, R., McGrath, D., Williams, K., Webb, R., Fassnacht, S. R., and Marshall, H.-P.: Spatiotemporal variations in liquid water content in a seasonal snowpack: implications for radar remote sensing, Remote Sens., 13, 4223, https://doi.org/10.3390/rs13214223, 2021. a
Clayton, W. S.: Measurement of unsaturated meltwater percolation flux in seasonal snowpack using self-potential, J. Glaciol., 68, 25–40, https://doi.org/10.1017/jog.2021.67, 2022. a
Clerx, N., Machguth, H., Tedstone, A., Jullien, N., Wever, N., Weingartner, R., and Roessler, O.: In situ measurements of meltwater flow through snow and firn in the accumulation zone of the SW Greenland Ice Sheet, The Cryosphere, 16, 4379–4401, https://doi.org/10.5194/tc-16-4379-2022, 2022. a
Colbeck, S.: Water flow through snow overlying an impermeable boundary, Water Resour. Res., 10, 119–123, https://doi.org/10.1029/WR010i001p00119, 1974. a, b
Coléou, C. and Lesaffre, B.: Irreducible water saturation in snow: experimental results in a cold laboratory, Ann. Glaciol., 26, 64–68, https://doi.org/10.3189/1998AoG26-1-64-68, 1998. a, b, c, d
Culberg, R., Schroeder, D. M., and Chu, W.: Extreme melt season ice layers reduce firn permeability across Greenland, Nat. Commun., 12, 2336, https://doi.org/10.1038/s41467-021-22656-5, 2021. a, b, c, d, e
Davies, B., Bendle, J., Carrivick, J., McNabb, R., McNeil, C., Pelto, M., Campbell, S., Holt, T., Ely, J., and Markle, B.: Topographic controls on ice flow and recession for Juneau Icefield (Alaska/British Columbia), Earth Surf. Proc. Land., 47, 2357–2390, https://doi.org/10.1002/esp.5383, 2022. a
Davies, B., McNabb, R., Bendle, J., Carrivick, J., Ely, J., Holt, T., Markle, B., McNeil, C., Nicholson, L., and Pelto, M.: Accelerating glacier volume loss on Juneau Icefield driven by hypsometry and melt-accelerating feedbacks, Nat. Commun., 15, 5099, https://doi.org/10.1038/s41467-024-49269-y, 2024. a, b, c, d, e
Forster, R. R., Box, J. E., Van Den Broeke, M. R., Miège, C., Burgess, E. W., Van Angelen, J. H., Lenaerts, J. T., Koenig, L. S., Paden, J., Lewis, C., Gogineni, S. P., Leuschen, C., and McConnell, J. R.: Extensive liquid meltwater storage in firn within the Greenland ice sheet, Nat. Geosci., 7, 95–98, https://doi.org/10.1038/ngeo2043, 2014. a, b, c
Fountain, A. G.: The storage of water in, and hydraulic characteristics of, the firn of South Cascade Glacier, Washington State, USA, Ann. Glaciol., 13, 69–75, https://doi.org/10.3189/S0260305500007667, 1989. a, b, c
Fountain, A. G.: Effect of snow and firn hydrology on the physical and chemical characteristics of glacial runoff, Hydrol. Process., 10, 509–521, https://doi.org/10.1002/(SICI)1099-1085(199604)10:4<509::AID-HYP389>3.0.CO;2-3, 1996. a, b
Fountain, A. G. and Walder, J. S.: Water flow through temperate glaciers, Rev. Geophys., 36, 299–328, https://doi.org/10.1029/97RG03579, 1998. a
Fox-Kemper, B., Hewitt, H., Xiao, C., et al.: Ocean, cryosphere and sea level change. Climate change 2021: the physical science basis. Contribution of Working Group I to the Sixth Assessment Report of the Intergovernmental Panel on Climate Change, Climate Change, https://doi.org/10.1017/9781009157896.011, 2021. a, b
Heilig, A., Mitterer, C., Schmid, L., Wever, N., Schweizer, J., Marshall, H.-P., and Eisen, O.: Seasonal and diurnal cycles of liquid water in snow – Measurements and modeling, J. Geophys. Res.-Earth Surf., 120, 2139–2154, https://doi.org/10.1002/2015JF003593, 2015. a
Heilig, A., Eisen, O., MacFerrin, M., Tedesco, M., and Fettweis, X.: Seasonal monitoring of melt and accumulation within the deep percolation zone of the Greenland Ice Sheet and comparison with simulations of regional climate modeling, The Cryosphere, 12, 1851–1866, https://doi.org/10.5194/tc-12-1851-2018, 2018. a
Hirashima, H., Avanzi, F., and Wever, N.: Wet-snow metamorphism drives the transition from preferential to matrix flow in snow, Geophys. Res. Lett., 46, 14548–14557, https://doi.org/10.1029/2019GL084152, 2019. a
Hock, R., Rasul, G., Adler, C., et al.: High mountain areas, in: IPCC special report on the ocean and cryosphere in a changing climate, 131–202, edited by: Pörtner, H.-O., Roberts, D. C., Masson-Delmotte, V., et al., Cambridge University Press Cambridge, UK, https://doi.org/10.1017/9781009157964, 2019. a, b
Horlings, A. N., Christianson, K., and Miège, C.: Expansion of firn aquifers in southeast Greenland, J. Geophys. Res.-Earth Surf., 127, e2022JF006753, https://doi.org/10.1029/2022JF006753, 2022. a
Horlings, A. N., Ruef, J., Stevens, C. M., Mannello, M. A., Bellamy, K., Wiggins, T., Markle, B., and Campbell, S.: Evolution of snow and firn on the Juneau Icefield, Alaska (2024), Arctic Data Center [data set], https://doi.org/10.18739/A2RX93G3P, 2025. a
Hugonnet, R., McNabb, R., Berthier, E., Menounos, B., Nuth, C., Girod, L., Farinotti, D., Huss, M., Dussaillant, I., Brun, F., and Kääb, A.: Accelerated global glacier mass loss in the early twenty-first century, Nature, 592, 726–731, https://doi.org/10.1038/s41586-021-03436-z, 2021. a
Humphrey, N. F., Harper, J. T., and Meierbachtol, T. W.: Physical limits to meltwater penetration in firn, J. Glaciol., 67, 952–960, https://doi.org/10.1017/jog.2021.44, 2021. a, b
Huss, M.: Density assumptions for converting geodetic glacier volume change to mass change, The Cryosphere, 7, 877–887, https://doi.org/10.5194/tc-7-877-2013, 2013. a
Ing, R. N., Ely, J. C., Jones, J. M., and Davies, B. J.: Surface mass balance modelling of the Juneau Icefield highlights the potential for rapid ice loss by the mid-21st century, J. Glaciol., 71, e11, https://doi.org/10.1017/jog.2024.82, 2025. a, b, c, d, e, f, g, h, i, j, k, l, m, n, o, p, q
Jansson, P., Hock, R., and Schneider, T.: The concept of glacier storage: a review, J. Hydrol., 282, 116–129, https://doi.org/10.1016/S0022-1694(03)00258-0, 2003. a
Kindstedt, I., Winski, D., Stevens, C. M., Skelton, E., Copland, L., Kreutz, K., Mannello, M., Clavette, R., Holmes, J., Albert, M., and Williamson, S. N.: Ongoing firn warming at Eclipse Icefield, Yukon, indicates potential widespread meltwater percolation and retention in firn pack across the St. Elias Range, The Cryosphere, 19, 3655–3680, https://doi.org/10.5194/tc-19-3655-2025, 2025. a, b, c, d, e, f, g, h
Koenig, L. S., Miège, C., Forster, R. R., and Brucker, L.: Initial in situ measurements of perennial meltwater storage in the Greenland firn aquifer, Geophys. Res. Lett., 41, 81–85, https://doi.org/10.1002/2013GL058083, 2014. a
Kuipers Munneke, P., Ligtenberg, S. R. M., Noël, B. P. Y., Howat, I. M., Box, J. E., Mosley-Thompson, E., McConnell, J. R., Steffen, K., Harper, J. T., Das, S. B., and van den Broeke, M. R.: Elevation change of the Greenland Ice Sheet due to surface mass balance and firn processes, 1960–2014, The Cryosphere, 9, 2009–2025, https://doi.org/10.5194/tc-9-2009-2015, 2015. a, b, c, d
Lader, R., Bidlack, A., Walsh, J. E., Bhatt, U. S., and Bieniek, P. A.: Dynamical downscaling for southeast Alaska: Historical climate and future projections, J. Appl. Meteorol. Climatol., 59, 1607–1623, https://doi.org/10.1175/JAMC-D-20-0076.1, 2020. a, b, c
Larsen, C., Burgess, E., Arendt, A., O'neel, S., Johnson, A., and Kienholz, C.: Surface melt dominates Alaska glacier mass balance, Geophys. Res. Lett., 42, 5902–5908, https://doi.org/10.1002/2015GL064349, 2015. a, b
Machguth, H., MacFerrin, M., van As, D., Box, J. E., Charalampidis, C., Colgan, W., Fausto, R. S., Meijer, H. A., Mosley-Thompson, E., and van de Wal, R. S.: Greenland meltwater storage in firn limited by near-surface ice formation, Nat. Clim. Change, 6, 390–393, https://doi.org/10.1038/nclimate2899, 2016. a, b, c
Machguth, H., Tedstone, A. J., and Mattea, E.: Daily variations in Western Greenland slush limits, 2000–2021, J. Glaciol., 69, 191–203, https://doi.org/10.1017/jog.2022.65, 2023. a
Mannello, M.: Spatial and Temporal Variability in Snow Properties and Firn Volume Across the Juneau Icefield in Southeast Alaska, master's thesis, The University of Maine, https://www.proquest.com/dissertations-theses/spatial-temporal-variability-snow-properties-firn/docview/3098795204/se-2 (last access: 5 June 2026), 2023. a, b, c, d
Mannello, M. A., Braddock, S., Campbell, S. W., Skelton, E., Schild, K. M., and McNeil, C.: Constraining snow water equivalent of wet snowpacks in Southeast Alaska, Ann. Glaciol., 66, e21, https://doi.org/10.1017/aog.2025.10014, 2025. a, b, c, d, e
McDowell, I. E., Keegan, K. M., Wever, N., Osterberg, E. C., Hawley, R. L., and Marshall, H.-P.: Firn Core Evidence of Two-Way Feedback Mechanisms Between Meltwater Infiltration and Firn Microstructure From the Western Percolation Zone of the Greenland Ice Sheet, J. Geophys. Res.-Earth Surf., 128, e2022JF006752, https://doi.org/10.1029/2022JF006752, 2023. a
McNeil, C., O'Neel, S., Loso, M., Pelto, M., Sass, L., Baker, E. H., and Campbell, S.: Explaining mass balance and retreat dichotomies at Taku and Lemon Creek Glaciers, Alaska, J. Glaciol., 66, 530–542, https://doi.org/10.1017/jog.2020.22, 2020. a, b, c
Medley, B., Neumann, T. A., Zwally, H. J., Smith, B. E., and Stevens, C. M.: Simulations of firn processes over the Greenland and Antarctic ice sheets: 1980–2021, The Cryosphere, 16, 3971–4011, https://doi.org/10.5194/tc-16-3971-2022, 2022. a
Miller, O., Solomon, D. K., Miège, C., Koenig, L., Forster, R., Schmerr, N., Ligtenberg, S. R., Legchenko, A., Voss, C. I., Montgomery, L., and McConnell, J. R.: Hydrology of a perennial firn aquifer in Southeast Greenland: an overview driven by field data, Water Resour. Res., 56, e2019WR026348, https://doi.org/10.1029/2019WR026348, 2020. a, b, c
Moser, D. E., Thomas, E. R., Nehrbass-Ahles, C., Eichler, A., and Wolff, E.: Review article: Melt-affected ice cores for polar research in a warming world, The Cryosphere, 18, 2691–2718, https://doi.org/10.5194/tc-18-2691-2024, 2024. a
Noël, B., Van De Berg, W. J., Lhermitte, S., Wouters, B., Schaffer, N., and van den Broeke, M. R.: Six decades of glacial mass loss in the Canadian Arctic Archipelago, J. Geophys. Res.-Earth Surf., 123, 1430–1449, https://doi.org/10.1029/2017JF004304, 2018. a
Noël, B., Jakobs, C. L., Van Pelt, W., Lhermitte, S., Wouters, B., Kohler, J., Hagen, J. O., Luks, B., Reijmer, C., Van de Berg, W. J., and van den Broeke, M. R.: Low elevation of Svalbard glaciers drives high mass loss variability, Nat. Commun., 11, 4597, https://doi.org/10.1038/s41467-020-18356-1, 2020. a
Ochwat, N. E., Marshall, S. J., Moorman, B. J., Criscitiello, A. S., and Copland, L.: Evolution of the firn pack of Kaskawulsh Glacier, Yukon: meltwater effects, densification, and the development of a perennial firn aquifer, The Cryosphere, 15, 2021–2040, https://doi.org/10.5194/tc-15-2021-2021, 2021. a, b, c, d, e
Oerter, H. and Rauert, W.: Core drilling on Vernagtferner (Oetztal Alps, Austria) in 1979: tritium contents, Zeitschrift für Gletscherkunde und Glazialgeologie, 1, 13–22, 1982. a
Pelto, M.: Exceptionally high 2018 equilibrium line altitude on Taku Glacier, Alaska, Remote Sens., 11, 2378, https://doi.org/10.3390/rs11202378, 2019. a
Pelto, M., Kavanaugh, J., and McNeil, C.: Juneau Icefield Mass Balance Program 1946–2011, Earth Syst. Sci. Data, 5, 319–330, https://doi.org/10.5194/essd-5-319-2013, 2013. a, b
Poinar, K., Joughin, I., Lilien, D., Brucker, L., Kehrl, L., and Nowicki, S.: Drainage of Southeast Greenland firn aquifer water through crevasses to the bed, Front. Earth Sci., 5, 5, https://doi.org/10.3389/feart.2017.00005, 2017. a, b
RGI Consortium: Randolph Glacier Inventory – A Dataset of Global Glacier Outlines (NSIDC-0770, Version 7), Boulder, Colorado USA, NASA National Snow and Ice Data Center Distributed Active Archive Center [data set], https://doi.org/10.5067/F6JMOVY5NAVZ, 2023. a
Saha, S., Moorthi, S., Pan, H.-L., Wu, X., Wang, J., Nadiga, S., Tripp, P., Kistler, R., Woollen, J., Behringer, D., Liu, H., Stokes, D., Grumbine, R., Gayno, G., Wang, J., Hou, Y.-T., Chuang, H.-y., Juang, H.-M. H., Sela, J., Iredell, M., Treadon, R., Kleist, D., Van Delst, P., Keyser, D., Derber, J., Ek, M., Meng, J., Wei, H., Yang, R., Lord, S., van den Dool, H., Kumar, A., Wang, W., Long, C., Chelliah, M., Xue, Y., Huang, B., Schemm, J.-K., Ebisuzaki, W., Lin, R., Xie, P., Chen, M., Zhou, S., Higgins, W., Zou, C.-Z., Liu, Q., Chen, Y., Han, Y., Cucurull, L., Reynolds, R. W., Rutledge, G., and Goldberg, M.: The NCEP climate forecast system reanalysis, B. Am. Meteorol. Soc., 91, 1015–1058, https://doi.org/10.1175/2010BAMS3001.1, 2010. a
Schneider, T.: Water movement in the firn of Storglaciären, Sweden, J. Glaciol., 45, 286–294, https://doi.org/10.3189/S0022143000001787, 1999. a
Schneider, T. and Jansson, P.: Internal accumulation in firn and its significance for the mass balance of Storglaciären, Sweden, J. Glaciol., 50, 25–34, https://doi.org/10.3189/172756504781830277, 2004. a, b
Shadab, M. A., Adhikari, S., Rutishauser, A., Grima, C., and Hesse, M. A.: A mechanism for ice layer formation in glacial firn, Geophys. Res. Lett., 51, e2024GL109893, https://doi.org/10.1029/2024GL109893, 2024. a
Stevens, C. M., Verjans, V., Lundin, J. M. D., Kahle, E. C., Horlings, A. N., Horlings, B. I., and Waddington, E. D.: The Community Firn Model (CFM) v1.0, Geosci. Model Dev., 13, 4355–4377, https://doi.org/10.5194/gmd-13-4355-2020, 2020 (code available at: https://github.com/UWGlaciology/CommunityFirnModel, last access: ). a, b, c, d
Stevens, C. M., Sass, L., Florentine, C., McNeil, C., Baker, E., and Bollen, K.: Direct measurements of firn-density evolution from 2016 to 2022 at Wolverine Glacier, Alaska, J. Glaciol., 70, e2, https://doi.org/10.1017/jog.2024.24, 2024. a, b, c, d, e
Techel, F. and Pielmeier, C.: Point observations of liquid water content in wet snow – investigating methodical, spatial and temporal aspects, The Cryosphere, 5, 405–418, https://doi.org/10.5194/tc-5-405-2011, 2011. a
The Firn Symposium Team: Firn on ice sheets, Nat. Rev. Earth Environ., 5, 79–99, https://doi.org/10.1038/s43017-023-00507-9, 2024. a, b, c, d
The GLAMBIE Team: Community estimate of global glacier mass changes from 2000 to 2023, Nature, 639, 382–388, https://doi.org/10.1038/s41586-024-08545-z, 2025. a, b
Thompson-Munson, M., Kay, J. E., and Markle, B. R.: Greenland's firn responds more to warming than to cooling, The Cryosphere, 18, 3333–3350, https://doi.org/10.5194/tc-18-3333-2024, 2024. a
Vandecrux, B., Mottram, R., Langen, P. L., Fausto, R. S., Olesen, M., Stevens, C. M., Verjans, V., Leeson, A., Ligtenberg, S., Kuipers Munneke, P., Marchenko, S., van Pelt, W., Meyer, C. R., Simonsen, S. B., Heilig, A., Samimi, S., Marshall, S., Machguth, H., MacFerrin, M., Niwano, M., Miller, O., Voss, C. I., and Box, J. E.: The firn meltwater Retention Model Intercomparison Project (RetMIP): evaluation of nine firn models at four weather station sites on the Greenland ice sheet, The Cryosphere, 14, 3785–3810, https://doi.org/10.5194/tc-14-3785-2020, 2020. a, b, c, d
Verjans, V., Leeson, A. A., Stevens, C. M., MacFerrin, M., Noël, B., and van den Broeke, M. R.: Development of physically based liquid water schemes for Greenland firn-densification models, The Cryosphere, 13, 1819–1842, https://doi.org/10.5194/tc-13-1819-2019, 2019. a
Webb, R., Jennings, K., Fend, M., and Molotch, N.: Combining ground-penetrating radar with terrestrial LiDAR scanning to estimate the spatial distribution of liquid water content in seasonal snowpacks, Water Resour. Res., 54, 10–339, https://doi.org/10.1029/2018WR022680, 2018. a
Webb, R. W., Marziliano, A., McGrath, D., Bonnell, R., Meehan, T. G., Vuyovich, C., and Marshall, H.-P.: In situ determination of dry and wet snow permittivity: Improving equations for low frequency radar applications, Remote Sens., 13, 4617, https://doi.org/10.3390/rs13224617, 2021. a, b
Winski, D., Osterberg, E., Kreutz, K., Wake, C., Ferris, D., Campbell, S., Baum, M., Bailey, A., Birkel, S., Introne, D., and Handley, M.: A 400-year ice core melt layer record of summertime warming in the Alaska Range, J. Geophys. Res.-Atmos., 123, 3594–3611, https://doi.org/10.1002/2017JD027539, 2018. a
Young, J. C., Pettit, E., Arendt, A., Hood, E., Liston, G. E., and Beamer, J.: A changing hydrological regime: Trends in magnitude and timing of glacier ice melt and glacier runoff in a high latitude coastal watershed, Water Resour. Res., 57, e2020WR027404, https://doi.org/10.1029/2020WR027404, 2021. a
Ziemen, F. A., Hock, R., Aschwanden, A., Khroulev, C., Kienholz, C., Melkonian, A., and Zhang, J.: Modeling the evolution of the Juneau Icefield between 1971 and 2100 using the Parallel Ice Sheet Model (PISM), J. Glaciol., 62, 199–214, https://doi.org/10.1017/jog.2016.13, 2016. a