
the Creative Commons Attribution 4.0 License.
the Creative Commons Attribution 4.0 License.
 | 21 Sep 2026
Brief communication: Limitations of medical X-ray computed tomography for estimating ice content in permafrost samples

Jonas Darey
Zakieh Mohammadi
Daniel Fortier
X-ray Computed tomography (CT) is increasingly used to estimate ice contents in permafrost samples. In this study, CT-derived estimates of volumetric ice content obtained from medical CT scans were compared with laboratory measurements for 261 samples from northern Canada (Nunavut and Yukon). The results shows that medical CT systematically underestimates ice content in sediment-rich and organic-poor samples, and overestimated it in ice-rich, organic-rich samples. Agreement improves only when ice contents exceeded ∼75 % and organic matter was approximately 10 % to 20 %. These discrepancies arise from ice occurring at scales smaller than the CT voxel resolution, misclassification of organic matter as ice, and sensitivity to threshold selection. Given these limitations, along with the associated cost and processing effort, medical CT is better suited for visualizing cryostructures and sample heterogeneity than for routine quantification of ice content. While higher-resolution CT systems may help resolve some of these limitations, their ability to provide more accurate quantification in permafrost samples requires further investigation and is identified as a key direction for future research.
- Article
(1188 KB) - Full-text XML
- BibTeX
- EndNote


Quantifying ground ice is fundamental for understanding permafrost stability and predicting thaw-related ground deformation (Hjort et al., 2022; Mohammadi and Hayley, 2023). Historically, descriptive systems by Pihlainen and Johnston (1963) and Linell and Kaplar (1966) have been widely adopted in geotechnical applications in North America. These methods rely on visual assessments, and ice characteristics are described by terms such as hardness (e.g., hard or soft), structure (e.g., clear, porous, or stratified), and colour. Over the years, these two descriptive approaches have proven to be unreliable, inconsistent, and sometimes misleading, being too general to precisely describe permafrost cryostructures. French and Shur (2010) proposed an alternative and more precise way to describe permafrost , in which cryostructures are systematically classified based on the amount and spatial distribution of ground ice, allowing rapid identification of distinct cryofacies.. However, the primarily visual nature of this approach can lead to subjective interpretation and reduced reproducibility when applied by individuals with varying level of experience in permafrost description. These visual logs are typically supplemented by a limited number of laboratory measurements, in which volumetric ice content is determined from mass and volume measured in the frozen state and after oven-drying to constant mass. Despite its simplicity, laboratory measurement is constrained by cost, time, and handling effort, and it is destructive. As a result, spatial coverage is limited and repeat measurements on the same specimen are not possible.
Computed tomography (CT) has been proposed as a non-destructive alternative, providing detailed visualization of permafrost samples and offering the potential for quantitative estimation of ice, sediment, and gas fractions (Calmels and Allard, 2004, 2008; Dillon et al., 2008; Fortier et al., 2012; Lapalme et al., 2017; Fan et al., 2021; Roustaei et al., 2025). Medical CT typically operates at millimetre to sub-millimetre resolution with anisotropic voxels, whereas micro-CT provides much finer, typically isotropic voxel sizes, allowing more detailed imaging of pore-scale structures. However, translating CT imaging into reliable estimates of soil components is not straightforward.
CT images are composed of voxels, which are 3D pixels formed by stacking 2D slices with specific spacing. Each voxel has an in-plane resolution defining the x–y dimensions, while the slice spacing defines the third dimension. The CT resolution sets its detection limit, with features needing to be at least twice the voxel size to be detected (Capowiez et al., 1998). When a voxel contains more than one component, their densities are averaged, producing the partial volume effect (Capowiez et al., 1998), which complicates quantitative analysis and leads to errors in volume estimation. (Roustaei et al., 2025). In the case of permafrost soils, pore ice within fine-grained materials (ice occupying the natural pore spaces within the soil matrix), is commonly unresolved at the resolution of medical CT scanners, which can lead to systematic underestimation of ice content (Calmels and Allard, 2004; Calmels et al., 2010). These errors are further compounded by density threshold segmentation, which often misclassifies materials such as ice, pore ice, and organic matter because of overlapping density range. Organic matter adds another level of complexity, as its density typically spans a wide range due to varying degrees of decomposition, ranging from poorly decomposed fibrous peat to well-decomposed humified organic soils (Calmels et al., 2010; Lapalme et al., 2017). This variability can lead to misclassification in CT-based segmentation, resulting in discrepancies between CT-derived and laboratory-measured ice contents. This study presents a comparison of medical CT-derived and laboratory-measured ice contents was conducted for 261 permafrost samples collected in the Canadian Arctic. The analysis focuses on assessing the suitability of medical CT for quantifying volumetric ice content and on identifying the methodological challenges associated with resolution, partial volume effects, and segmentation approaches. Special attention is given to the impact of organic matter content on the CT-based volumetric ice content estimates.
2.1 Sample provenance
Permafrost cores were collected on Bylot Island, Nunavut under the Arctic Development and Adaptation to Permafrost in Transition program (ADAPT) and during field campaigns in 2016 and 2019 at representative wet and mesic sites (73°09′ N, 80°00′ W; 73°08′ N, 79°58′ W). Additional cores were collected in 2015 near Beaver Creek, Yukon (62°24′ W). The cores were extracted using a portable permafrost core drill with a 10 cm diameter barrel, sealed, labelled, and maintained below 0 °C from field to laboratory until analysis. The cores were subsequently subsampled into segments of approximately 5–20 cm in length for CT scanning and laboratory measurements.
2.2 CT scanning and image processing
The same samples were scanned at Institute National de la Recherche Scientifique (INRS), Quebec City, using a commercial medical CT scanner (Siemens SOMATOM Sensation 64) with voxel resolutions of 0.18–0.24 mm in the x–y plane and 0.4–0.6 mm in the z direction, with minor variations depending on sample size and scan configuration to ensure full coverage of each core. These differences are small relative to the inherent resolution of medical CT and are therefore not expected to significantly affect the CT-based estimations.
Samples were maintained in a frozen state throughout scanning. During CT acquisition, samples were stored in freezers at approximately −20 °C and wrapped in insulating materials (plastic and foam layers) to limit heat exchange. Exposure to ambient conditions during handling and scanning was brief (on the order of minutes), and no phase change was observed. Medical CT scans were relatively rapid, and the duration of scanning did not significantly affect the thermal state of the samples.
CT scan images were processed in Dragonfly (Version 2020.2) to isolate the samples and remove external elements such as the stage, bags, and air. Regions of interest (ROIs) were defined to isolate the sample volume from surrounding elements (e.g., air, sample holder, and wrapping materials) using a classifier trained on 30 ADAPT project samples. The classifier was used to differentiate the sample from the background, not to segment individual phases. The resulting ROIs were visually inspected and corrected where necessary. Ice, sediment, and gas were segmented using published Hounsfield Unit (HU) ranges (gas: −1024 to −321, ice: −320 to 560, sediment: 561 to 3071) (Calmels and Allard, 2004; Calmels et al., 2010; Taina et al., 2008). The segmentation results were visually inspected for each sample to verify that the selected HU ranges adequately captured the main phases and their spatial distribution and adjusted where necessary to ensure consistency in phase identification. Organic matter was not segmented directly due to its variable density, which often caused misclassification as ice or sediment.
2.3 Laboratory measurements
Volumetric ice content was derived from measurements of sample mass and volume in the frozen and oven-dried states, using gravimetric water content and frozen bulk density. All measurements were performed on natural, undisturbed permafrost samples, preserving their in-situ ice content. No artificial saturation or re-freezing procedures were applied prior to analysis. Sample volume was obtained using the water displacement method, whereby the volume of liquid displaced by an immersed vacuum-sealed frozen sample in a plastic bag is measured, providing an accurate estimate of bulk volume even for irregularly shaped specimens. This approach assumes that all water present in the sample at the time of measurement was frozen and therefore contributes to the measured ice content. To minimize disturbance effects, the outer 2–3 mm of each core, potentially covered by drilling mud or minor thaw, was removed prior to analysis.
Measurements were obtained for 261 samples, with organic matter content determined for a subset of 81 samples. Organic matter content was determined for a subset of 81 samples using the loss on ignition (LOI) method: samples were oven-dried at 105 °C, combusted at 550 °C for 4 h, and the mass loss attributed to organic matter. Based on the distribution of measured organic matter, the samples were classified into three groups: <10 %, 10 %–20 %, and >20 % organic matter. The 10 % threshold is approximately the median, and the 20 % threshold isolates the upper tail of the dataset (≈85th percentile), enabling clearer evaluation of organic-rich samples. The dataset, including laboratory and CT-derived volumetric ice contents, is available on Zenodo (https://doi.org/10.5281/zenodo.17451138) (Fortier et al., 2025).
3.1 Comparison of CT and laboratory values
To evaluate the performance of medical CT scans for quantifying ice, laboratory measurements of ice content () were compared with CT-derived estimates () across all 261 samples. While comparison of with excess ice is more appropriate (e.g., Lapalme et al., 2017; Roustaei et al., 2025; Nitzbon et al., 2022), laboratory-measured excess ice content were not available; therefore, total ice content was used as the basis of comparison.
Figure 1 summarizes these comparisons. CT estimates were positively correlated with laboratory values but diverged systematically from the 1:1 line (Fig. 1a). Residuals () showed a mean bias of −12.9 % and a root mean squared deviation of 25.6 %.
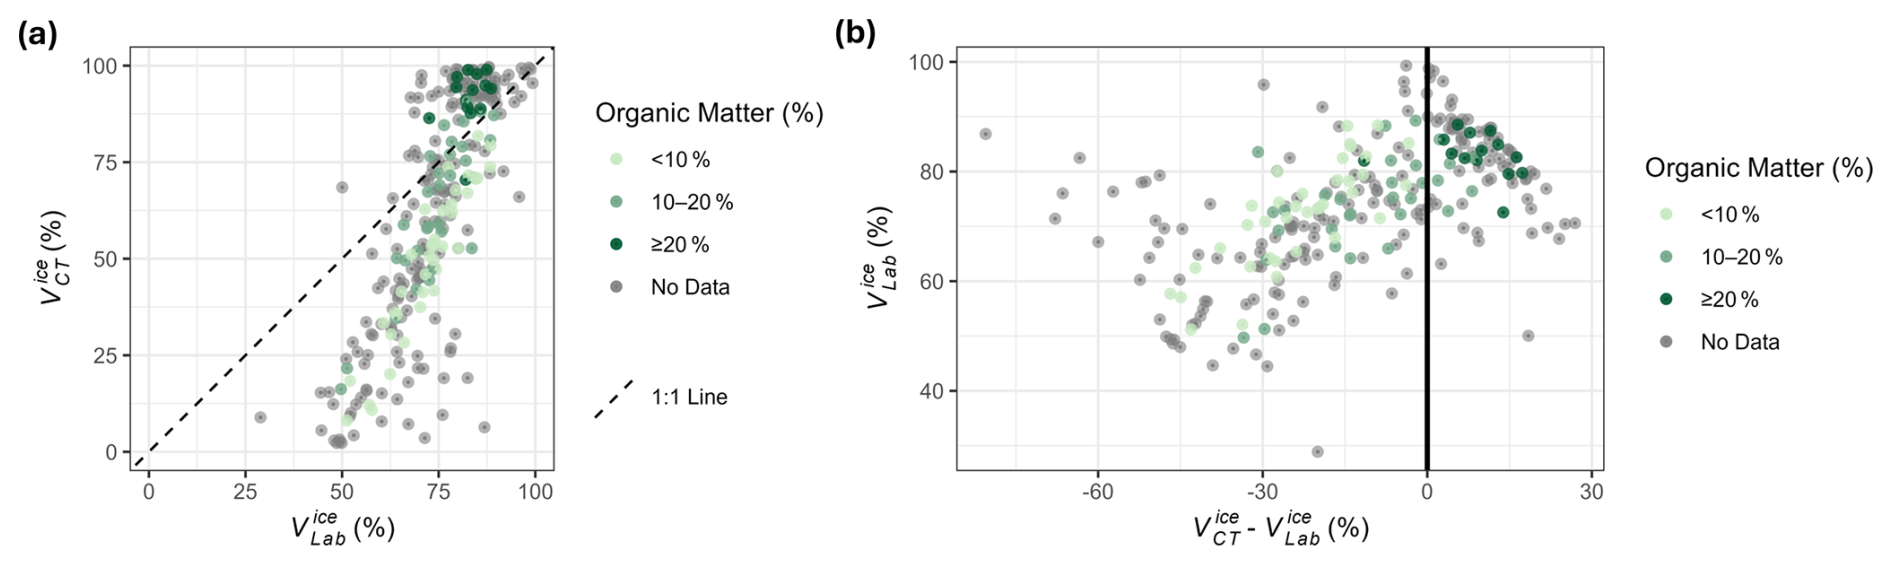
Figure 1(a) Lab-measured () vs. CT-estimated () volumetric ice content. Divergence from the 1:1 line shows bias. Results show systematic underestimation of Vice for ice poor samples, shifting toward systematic overestimation for ice rich samples. (b) Residuals () plotted against lab-measured volumetric ice content.
Figure 1b shows that residuals were strongly dependent on sample composition. For %, generally tends to underestimate , as indicated by negative residuals exceeding 60 % in some cases. For %, a consistent trend of either underestimation or overestimation is more difficult to identify; however, the majority of data points indicate a tendency toward overestimation. Where overestimation occurs (ΔVice>0), residuals generally decrease with increasing from 70 % to 100 %. In the subset with organic matter (OM) data, low-OM samples (0 %–10 %), which in this dataset generally coincide with lower ice contents, consistently showed negative residuals. In contrast, higher-OM samples displayed positive residuals, with the largest positive bias observed in the ≥20 % OM class. Overall, volumetric ice content was underestimated in all low-OM samples and overestimated in nearly all high-OM samples.
3.2 Sensitivity of CT estimates to HU threshold selection
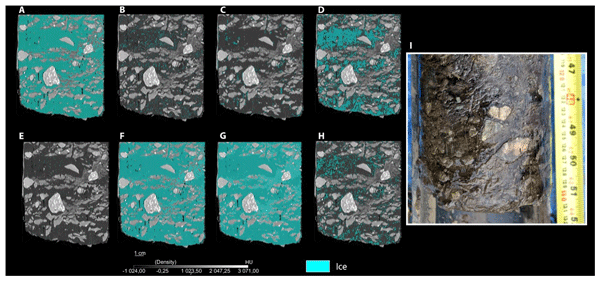
This study also assessed the sensitivity of CT-derived ice content estimates to Hounsfield Unit (HU) thresholds. Previous work has applied widely varying thresholds for ice segmentation, resulting in inconsistent outcomes. To examine this effect, published thresholds were applied to two representative samples. This variability partly reflects differences in material type, as sea ice generally shows less variability in HU values due to its relative homogeneity, whereas permafrost exhibits greater variability because of its heterogeneous composition. As shown in Table 1, estimated ice content varied substantially, from strong underestimation (up to −64 %) to marked overestimation (up to +31 %) relative to laboratory values. Sample 1 from Bylot Island exhibited a broad density range (−1024 to 3071 HU), whereas Sample 2 from Beaver Creek showed a narrower range (−1024 to 2847 HU). Figure 2 illustrates segmentation of a region of interest from Sample 1, where ice is highlighted in blue using the −320 to 560 HU threshold. These results demonstrate that CT-based estimates are highly sensitive to threshold selection, which restricts their reproducibility for volumetric ice quantification.
Table 1Volumetric ice content of two representative samples estimated using HU thresholds from this study and previous literature, with laboratory measurements shown for reference.
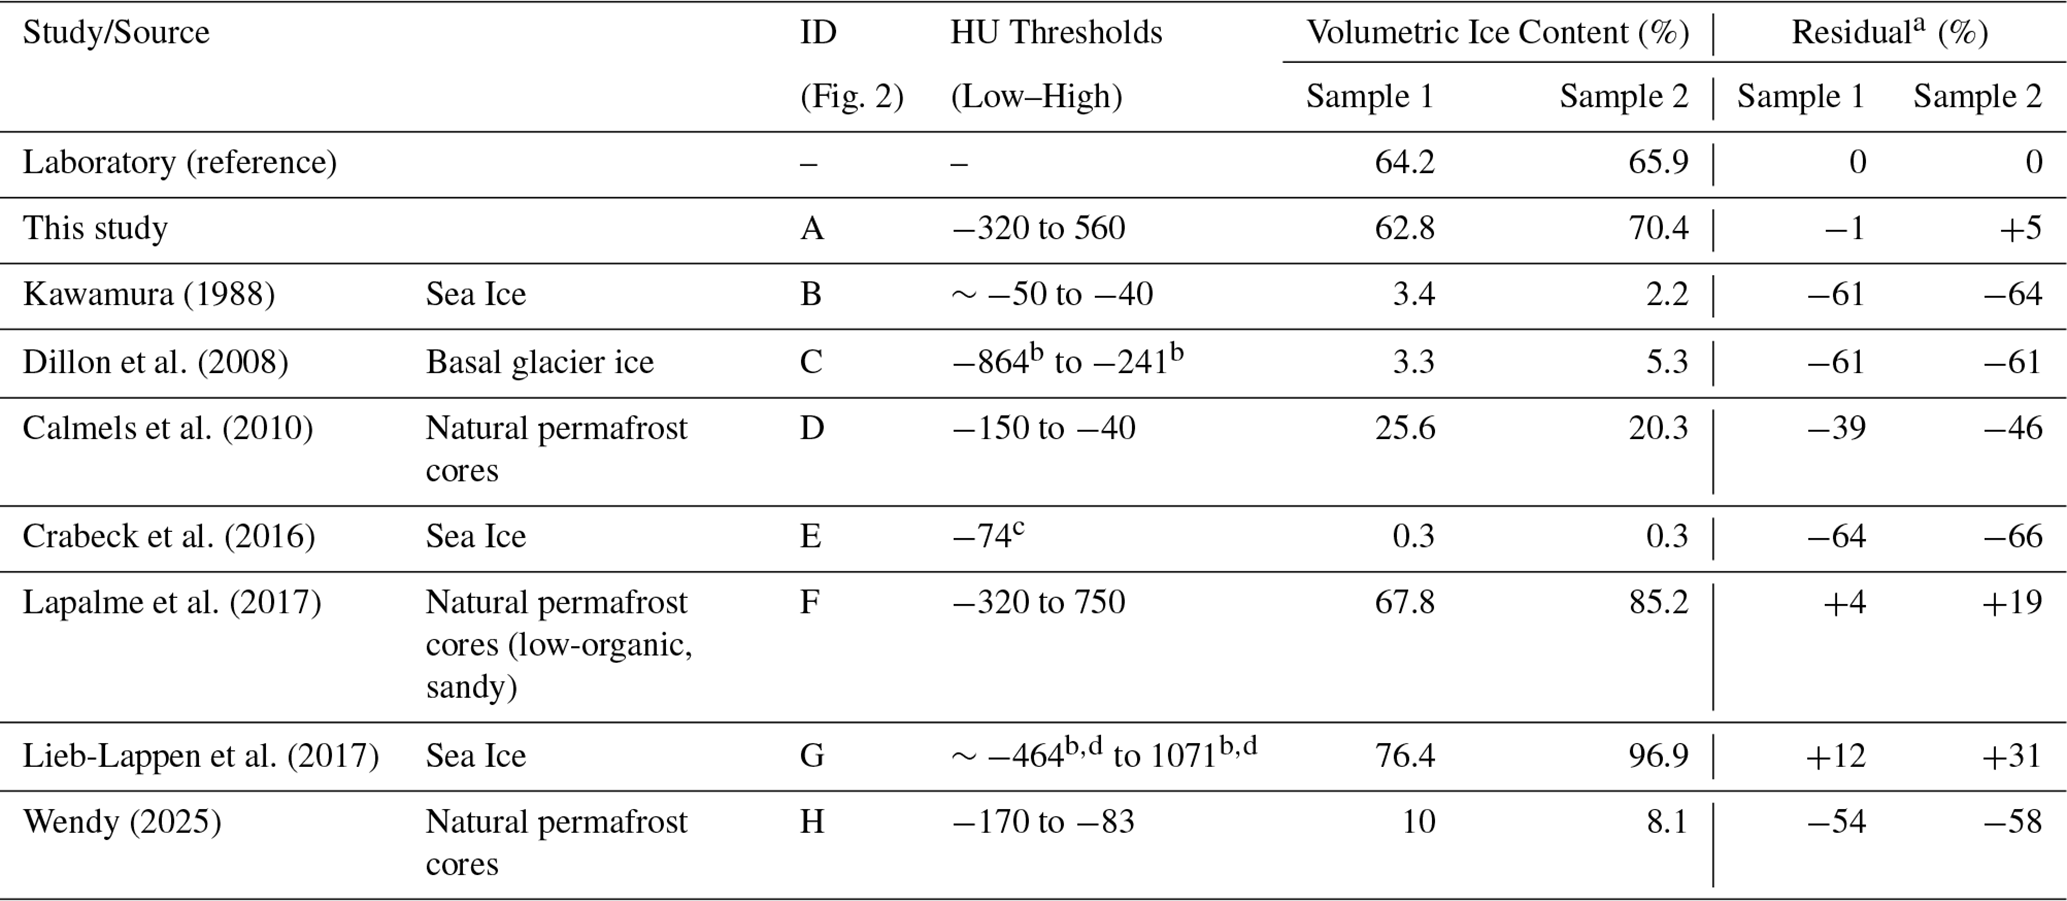
Notes: a Calculated as the difference between laboratory-measured and CT-derived ice content. Negative values indicate underestimation. b Converted from gray levels. c For pure ice. d For sea ice.
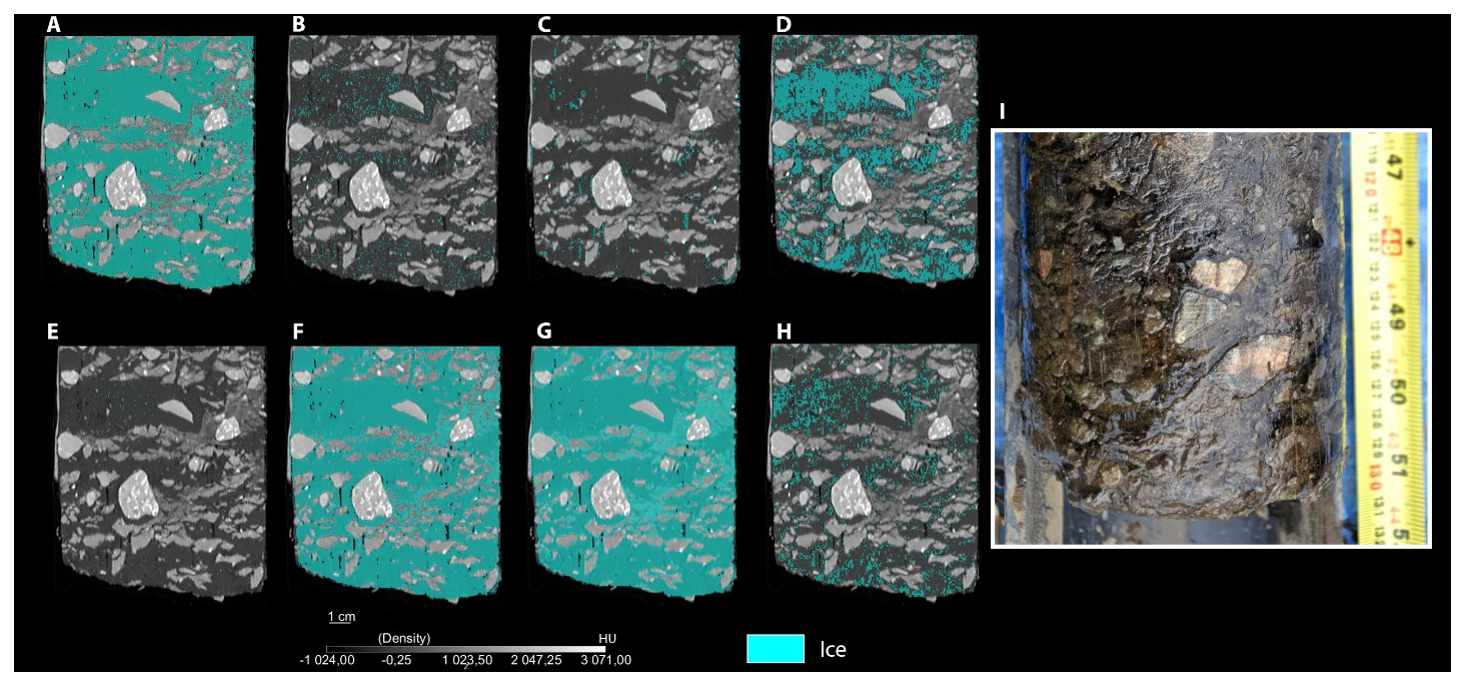
Figure 2Comparison of ice volumes estimated for Sample 1 using the density thresholds from this study (A) and those reported in the literature (B–H), corresponding to study IDs in Table 1. Panel (I) shows a photograph of the sample, consisting of suspended sandy silt and gravel within an ice matrix.
This study highlights the key limitations of commercial medical CT for estimating volumetric ice content of permafrost samples. Scans of 261 permafrost cores clearly demonstrate that medical CT systematically misestimates volumetric ice content, with discrepancies strongly linked to sample composition. Overall, the results indicate CT-derived ice content tending to underestimate laboratory values at lower ice contents and showing a weak tendency toward overestimation at higher ice contents. This limitation is largely results from the mismatch between scanner resolution and the characteristic pore-ice-organic structure of permafrost materials. At the resolution of medical CT, which is much coarser than sediment porosity, pore ice typically occupies volumes smaller than a voxel, and mixed voxels record averaged density values that fall outside the ice range. These partial-volume artifacts lead to systematic underestimation when the sediment fraction is high (Capowiez et al., 1998; Clausnitzer and Hopmans, 2000; Calmels et al., 2010). Organic matter adds further complications. In organic-rich samples, positive residuals arise from the overlap in density between organic matter and ice. Portions of the organic fraction fall within the HU range assigned to ice and are therefore misclassified, producing overestimation (Calmels et al., 2010; Roustaei et al., 2025). This effect was most pronounced in samples with ≥20 % organic matter.
Threshold selection introduces an additional source of error. Published HU ranges vary widely, and applying different thresholds to the same samples in this study produced results that ranged from severe underestimation to substantial overestimation relative to laboratory values. Even when thresholds are calibrated against reference data, unresolved pore ice, organic matter misclassification, and the partial-volume effect introduce uncertainties that limit the transferability of correction factors (Lapalme et al., 2017).
Together, these findings show that systematic underestimation in ice-poor samples, overestimation in organic-rich samples, and sensitivity to HU thresholds all stem from CT imaging artifacts. As a result, empirical corrections may reduce error within a single dataset but cannot overcome the fundamental limitations imposed by CT resolution and material density overlap. The large variability observed in Table 1 further demonstrates that HU-based segmentation is inherently non-unique, as different threshold ranges produce substantially different estimates for the same sample. Consequently, no single or transferable HU threshold can be defined for permafrost materials with varying composition. Therefore, medical CT cannot reliably quantify volumetric ice content using HU-based segmentation and cannot be recommended for this purpose. However, improved approaches based on sample-specific or scan-specific calibration, such as the use of reference materials or density-based normalization, may enhance the robustness of medical CT-derived estimates and partially reduce these uncertainties. Instead, its primary value lies in the qualitative identification of cryostructures and sample heterogeneity within permafrost cores, particularly through the visualization of features such as ice lenticular, layered, reticulate and suspended cryostructures, sedimentary stratifications, and large-scale heterogeneities, which are critical for interpreting permafrost formation processes and mechanical behaviour. Higher-resolution CT (e.g., micro-CT) may reduce partial-volume effects by resolving finer-scale structures and, when combined with calibrated acquisition and advanced segmentation approaches, may further improve the quantitative assessment of ice content in permafrost materials.
The dataset used in this study, including laboratory-derived volumetric ice contents, CT-derived volumetric compositions, and associated metadata, is available at Zenodo (https://doi.org/10.5281/zenodo.17451138; Fortier et al., 2025). Image processing workflows were performed in Dragonfly (Version 2020.2). No custom code was developed beyond standard segmentation and regression analysis.
DF contributed to conceptualization of the study. JD, MR, ZM carried out data curation. JD, MR, ZM performed the formal analysis and data processing. JD conducted the laboratory and CT analyses and supported the overall investigation. DF, JD contributed to methodology development, including creation of the classifier in Dragonfly. DF was responsible for funding acquisition. DF, MR provided supervision and guidance. MZ conducted validation of results. MZ prepared the original draft, and all authors contributed to writing, review, and editing of the manuscript.
At least one of the (co-)authors is a member of the editorial board of The Cryosphere. The peer-review process was guided by an independent editor, and the authors also have no other competing interests to declare.
Publisher's note: Copernicus Publications remains neutral with regard to jurisdictional claims made in the text, published maps, institutional affiliations, or any other geographical representation in this paper. The authors bear the ultimate responsibility for providing appropriate place names. Views expressed in the text are those of the authors and do not necessarily reflect the views of the publisher.
We thank Elisabeth Hardy-Lachance for providing permafrost samples from Bylot Island, Nunavut and Michel Sliger for his help in the laboratory to measure volumetric water content of permafrost samples.
This research has been supported by the Natural Sciences and Engineering Research Council of Canada (grant no. 03891-2015 to Daniel Fortier).
This paper was edited by Hanna Lee and reviewed by Benoit Faucher and two anonymous referees.
Calmels, F. and Allard, M.: Ice segregation and gas distribution in permafrost using tomodensitometric analysis, Permafrost Periglacial, 15, 367–378, https://doi.org/10.1002/ppp.508, 2004.
Calmels, F. and Allard, M.: Segregated ice structures in various heaved permafrost landforms through CT Scan, Earth Surf. Processes Landf., 33, 209–225, https://doi.org/10.1002/esp.1538, 2008.
Calmels, F., Clavano, W., and Froese, D.: Progress on X-ray Computed Tomography (CT) Scanning in Permafrost Studies, in: Proceedings of the 6th Canadian Conference on Permafrost, 63rd Canadian Geotechnical Conference & 6th Canadian Permafrost Conference, Calgary, AB, Canada, 1353–1358, 2010.
Capowiez, Y., Pierret, A., Daniel, O., Monestiez, P., and Kretzschmar, A.: 3D skeleton reconstructions of natural earthworm burrow systems using CAT scan images of soil cores, Biol. Fert. Soils, 27, 51–59, https://doi.org/10.1007/s003740050399, 1998.
Clausnitzer, V. and Hopmans, J. W.: Pore-scale measurements of solute breakthrough using microfocus X-ray computed tomography, Water Resour. Res., 36, 2067–2079, https://doi.org/10.1029/2000WR900076, 2000.
Crabeck, O., Galley, R., Delille, B., Else, B., Geilfus, N.-X., Lemes, M., Des Roches, M., Francus, P., Tison, J.-L., and Rysgaard, S.: Imaging air volume fraction in sea ice using non-destructive X-ray tomography, The Cryosphere, 10, 1125–1145, https://doi.org/10.5194/tc-10-1125-2016, 2016.
Dillon, M., Fortier, D., Kanevskiy, M., and Shur, Y.: Tomodensitometric analysis of basal ice, in: Proceedings of the 9th International Conference on Permafrost (NICOP 2008), University of Alaska Fairbanks, Fairbanks, Alaska, USA, 361–366, https://doi.org/10.13140/2.1.2043.5526, 2008.
Fan, X., Lin, Z., Gao, Z., Meng, X., Niu, F., Luo, J., Yin, G., Zhou, F., and Lan, A.: Cryostructures and ground ice content in ice-rich permafrost area of the Qinghai-Tibet Plateau with Computed Tomography Scanning, J. Mt. Sci., 18, 1208–1221, https://doi.org/10.1007/s11629-020-6197-x, 2021.
Fortier, D., Kanevskiy, M., Shur, Y., Stephani, E., and Dillon, M.: Cryostructures of Basal Glacier Ice as an Object of Permafrost Study: Observations from the Matanuska Glacier, Alaska, in: Proceedings of the 10th International Conference on Permafrost, Salekhard, Russia, 107–112, https://doi.org/10.13140/2.1.4876.2569, 2012.
Fortier, D., Mohammadi, Z., Roustaei, M., and Darey, J.: Dataset supporting “Limitations of Medical X-ray Computed Tomography for Estimating Ice Content in Permafrost Samples”, Zenodo [data set], https://doi.org/10.5281/zenodo.17451138, 2025.
French, H. M. and Shur, Y.: The principles of cryostratigraphy, Earth-Sci. Rev., 101, 190–206, https://doi.org/10.1016/j.earscirev.2010.04.002, 2010.
Hjort, J., Streletskiy, D., Doré, G., Wu, Q., Bjella, K., and Luoto, M.: Impacts of permafrost degradation on infrastructure, Nat. Rev. Earth Environ., 3, 24–38, https://doi.org/10.1038/s43017-021-00247-8, 2022.
Kawamura, T.: Observations of the internal structure of sea ice by X-ray computed tomography, J. Geophys. Res., 93, 2343–2350, https://doi.org/10.1029/JC093iC03p02343, 1988.
Lapalme, C. M., Lacelle, D., Pollard, W., Fortier, D., Davila, A., and McKay, C. P.: Cryostratigraphy and the Sublimation Unconformity in Permafrost from an Ultraxerous Environment, University Valley, McMurdo Dry Valleys of Antarctica, Permafrost Periglacial, 28, 649–662, https://doi.org/10.1002/ppp.1948, 2017.
Lieb-Lappen, R. M., Golden, E. J., and Obbard, R. W.: Metrics for interpreting the microstructure of sea ice using X-ray micro-computed tomography, Cold Reg. Sci. Technol., 138, 24–35, https://doi.org/10.1016/j.coldregions.2017.03.001, 2017.
Linell, K. and Kaplar, C. W.: Description and classification of frozen soils, in: Proceedings of the 1st International Conference on Permafrost, West Lafayette, USA, 481–487, 1966.
Mohammadi, Z. and Hayley, J. L.: Qualitative evaluation of thaw settlement potential in permafrost regions of Canada, Cold Reg. Sci. Technol., 216, 104005, https://doi.org/10.1016/j.coldregions.2023.104005, 2023.
Nitzbon, J., Gadylyaev, D., Schlüter, S., Köhne, J. M., Grosse, G., and Boike, J.: Brief communication: Unravelling the composition and microstructure of a permafrost core using X-ray computed tomography, The Cryosphere, 16, 3507–3515, https://doi.org/10.5194/tc-16-3507-2022, 2022.
Pihlainen, J. A. and Johnston, G.: Guide to a field description of permafrost for engineering purposes, National Research Council of Canada, https://doi.org/10.4224/40003252, 1963.
Roustaei, M., Pumple, J., Harvey, J., and Froese, D.: Ground ice estimation in permafrost samples using industrial computed tomography and multi-sensor core logging and comparison to destructive measurements, The Cryosphere, 19, 4259–4275, https://doi.org/10.5194/tc-19-4259-2025, 2025.
Taina, I. A., Heck, R. J., and Elliot, T. R.: Application of X-ray computed tomography to soil science: A literature review, Can. J. Soil Sci., 88, 1–19, 2008.
Wendy: Processing Script for Cryostratigraphy Using X-ray Computed Tomography Scans of Permafrost Cores, MATLAB Central File Exchange, https://www.mathworks.com/matlabcentral/fileexchange/33010-processing-script-for-cryostratigraphy-using-x-ray-computed-tomography-scans-of-permafrost-cores, last access: 24 October 2025.