
the Creative Commons Attribution 4.0 License.
the Creative Commons Attribution 4.0 License.
 | 14 Sep 2026
On thin glacial ice: New Austrian Glacier Inventory shows accelerating glacier shrinkage and 31 % area loss within two decades

Jakob Abermann
Ayla Akgün
Giulia Bertolotti
Tobias Bolch
Svenja Conzelmann
Codrut-Andrei Diaconu
Iris Hansche
Anne Hartig
Anna Haut
Kay Helfricht
Bernhard Hynek
Marie Sophie Kaucher
Andreas Kellerer-Pirklbauer
Ann Christin Kogel
Julie Krippes
Marcela Violeta Lauria
Christoph Mayer
Jan-Christoph Otto
Rainer Prinz
Sina Prölß
Lorenzo Rieg
Lea Schönleber
Gabriele Schwaizer
Bernd Seiser
Martin Stocker-Waldhuber
Markus Strudl
Martin Verhounik
Harald Zandler
We present the new Austrian glacier inventory, AGI5. Glacier outlines were manually digitized from high-resolution orthoimagery and digital elevation models, using older inventories as a baseline. The delineation of debris-covered ice was supported by visual analysis of multi-temporal imagery and elevation model differencing, depending on data availability. Differences in interpretation between analysts were assessed using a round robin experiment (mapping of selected glaciers by several analysts). The updated inventory reflects glacier extent in 2023 (55 % of total glacier area in Austria), 2022 (43 %), and 2021 (2 %). The total glacier area in AGI5 is 285 ± 12 km2. Most glaciers in Austria (87 %) are smaller than 0.5 km2. These “very small” glaciers comprise 22 % of the total glacier area. Nine glaciers remain larger than 5 km2 and account for more than a quarter of Austria’s glacierized area. Area losses since the previous inventory (2004–2012) amount to 129 ± 23 km2, corresponding to 31 % of the total glacier area. Median area loss rates differ between regions, ranging from 2 %–3 % per year in more heavily glacierized regions to almost 7 % per year in regions with predominantly smaller glaciers. Of 894 glaciers listed in the previous inventory, 95 have disappeared completely or were no longer mappable. Compared to other glacierized regions, Austria's glacier recession since the Little Ice Age (LIA) maximum is well constrained with a LIA inventory, four high-resolution, consistent AGIs from 1969 to 2021–2023, and additional coverage in complementary inventories using different data sources. As glacier loss accelerates, more frequent updates to the AGIs are needed to keep pace with rapid changes.
- Article
(11613 KB) - Full-text XML
-
Supplement
(84380 KB) - BibTeX
- EndNote


Glaciers in the European Alps lost nearly 40 % of their mass between 2000 and 2023 (The GlaMBIE Team, 2025). During recent extreme years, in particular the record breaking summer of 2022, glaciers thinned across all elevation ranges and unprecedented mass loss was recorded throughout the Alps (Berthier et al., 2024; Voordendag et al., 2023; Hartl et al., 2025a; WGMS, 2025; Van Tiel et al., 2026). Regional studies in Austria indicate the same trends, with the complete disappearance of several small glaciers since the mid-2000s, volume change patterns indicative of strong disequilibrium, and progressing disintegration processes of increasingly debris-covered glacier remnants (Kellerer-Pirklbauer and Kulmer, 2019; Fischer et al., 2021a; Hartl et al., 2022, 2025b; Conzelmann et al., 2026a). Given the magnitude of the current changes, it is essential that local and regional glacier monitoring continues to keep pace with ongoing ice loss.
Multi-temporal glacier outlines are a key part of glacier monitoring and form an important prerequisite for assessing glacier volume and mass change (e.g., Paul et al., 2007; Zemp et al., 2014). They support assessments of the impacts of glacier shrinkage on local hydrological systems, runoff patterns, and natural hazards, aid the calibration and validation of glacier evolution models, and ultimately foster sustainable mountain development (Nussbaumer et al., 2017; Gärtner-Roer et al., 2019). To maintain their usefulness for such applications, inventories need to be updated regularly. Paul et al. (2020) suggested decadal updates of global glacier inventories, noting that more frequent updates are required in regions with more rapid change, such as the European Alps. In Switzerland, Linsbauer et al. (2021) stated 6-year repeat inventories as a goal to appropriately monitor regional glacier area evolution.
In Austria, national-scale glacier inventories (AGI) were compiled for glacier state during the Little Ice Age maximum (AGI LIA, Fischer et al., 2015b), the late 1960s (AGI1, Patzelt, 1980; Groß, 1987), late 1990s (AGI2, Lambrecht and Kuhn, 2007), and the mid-2000s (AGI3, Fischer et al., 2015b). The most recent glacier inventories covering all of Austria reflect glacier state in 2015–2016 (AGI4, Buckel et al., 2018; Paul et al., 2020; Sommer et al., 2020) but used differing methodological approaches compared to the earlier AGI. Table 1 summarizes the available glacier inventories.
Fischer et al. (2015b)Groß and Patzelt (2015)Patzelt (1980)Groß (1987)Patzelt (2015)Eder et al. (2000)Lambrecht and Kuhn (2007)Kuhn et al. (2015)Sommer et al. (2020)Paul et al. (2011)Pfeffer et al. (2014)RGI Consortium (2023)Fischer et al. (2015b, a)Sommer et al. (2020)Sommer et al. (2020)Buckel et al. (2018)Buckel and Otto (2018)Paul et al. (2020)Bertolotti et al. (2025)Conzelmann et al. (2026a, b)Helfricht et al. (2024b)Helfricht et al. (2024a)Fischer et al. (2021b)Table 1Overview of inventories covering Austria’s glaciers at global, Alps-wide, national or regional level.

A comprehensive inventory update for glaciers in Austria is urgently needed to account for the rapid area losses and progressing glacier disappearance in recent years. This study presents results of a community effort to compile a new Austrian Glacier Inventory along with area change metrics derived from the resulting dataset. The Fifth Austrian Glacier Inventory (AGI5) follows the approach of prior national inventories (Table 1, AGI 1–3) and is based on manual mapping of glacier outlines from high-resolution orthoimagery and digital elevation models (DEM) derived from airborne laser scanning data. Most glaciers in Austria are small and many are fragmented, partially debris-covered, and no longer have persistent accumulation zones. Despite their relatively small size and limited contribution to total glacier area, data on the distribution of such features provides important context for catchment scale applications related to, for example, hydrology, touristic infrastructure, cartography, or potential hazards (e.g., Intergovernmental Panel on Climate Change (IPCC), 2023; Van Tiel et al., 2021; Mani et al., 2023).
The aims of this study are to (1) delineate glacier ice in Austria for the target years 2021–2023 and enable direct comparisons with prior AGIs by adhering to established ID-numbering systems and definitions, (2) quantify glacier area changes in Austria since the last inventories, (3) discuss the main challenges and sources of uncertainties in compiling regional inventories of rapidly receding mountain glaciers.
2.1 Compilation of the fifth Austrian Glacier Inventory (AGI5)
Efforts to compile a new national glacier inventory, AGI5, evolved from discussions within the Austrian glacier monitoring community and were implemented by the same community. In keeping with the prior AGIs, glaciers were grouped by mountain ranges into 20 inventory subregions (Fig. 1), which were assigned to analysts or groups of analysts for outline mapping. Where possible, the mapping of a given subregion was carried out by analysts who were involved in the prior AGIs for that region and/or otherwise familiar with the area.

Figure 1(a) The black box indicates the location of the 20 subregions and glacierized terrain shown in (b) in Austria. (b) Colors indicate acquisition years of the AGI5 source data for the respective glaciers and regions. Austrian mapping data courtesy of BEV (https://data.bev.gv.at, last access: 28 August 2026). Region outlines © OpenStreetMap contributors, ODbL 1.0.
AGI5 applies the same naming conventions and ID number system as AGI1, 2 and 3 (Table 1). An ID number can be associated with multiple separate glacier fragments if the fragments were previously connected and listed under the same ID. In the following, “glacier” refers to all glacier fragments associated with the same ID even if they are no longer connected. This is in line with the prior AGIs and allows consistent counting of glaciers (the overall number of glaciers does not increase if a glacier splits into two fragments) and per-glacier area change assessments through the AGI time series. In keeping with prior AGI and in contrast to the Swiss national glacier inventories (SGI) and many larger-scale inventories (e.g., Linsbauer et al., 2021; Paul et al., 2020), we use the term “glacier” to refer to any glacial ice identified in the inventory, regardless of feature size or other characteristics, and no minimum feature size is applied in the AGI.
2.1.1 Data basis and general mapping procedure
Glacier outlines were mapped manually using Geographical Information System programs (ArcGIS, QGIS). The AGI3 outlines and, where available, consistent intermediate regional inventories (Table 1) were used as a starting point for the new outlines. The primary data type used for the mapping process was high-resolution regional orthoimagery (spatial resolution: 10–25 cm). Where available, high-resolution DEMs (0.5–1 m) and derived products (hillshades from different illumination angles, elevation change rasters) were used as supporting information or instead of orthophotos depending on data coverage. The georeferenced aerial imagery and DEMs were accessed through governmental open data services. The DEMs are derived from airborne laserscanning surveys and provided by Austrian regional authorities. High-resolution satellite imagery (Pleiades images, 0.5 m; Planet Scope images, 3 m (Planet Labs PBC, 2022)) was used in some cases to compensate for image quality issues in the orthophotos related to snow cover or shading. Table S1 in the supplement provides an overview of the main data sources and acquisition years per subregion. Fig. 2 shows the different available data types for the examples of Großelend Kees in the Ankogel-Hochalmspitze Group and Nördlicher Schalf Ferner in the Ötztal Alps. Großelend Kees (Fig. 2a, b) was mapped using mainly information derived from a 2023 DEM, whereas Nördlicher Schalf Ferner (Fig. 2c, d) was mapped based on multi-temporal orthoimagery.

Figure 2(a) Großelend Kees (centroid coordinates: Long. 13.315°, Lat. 47.025°; Ankogel-Hochalmspitz Group, region 2) as seen in a hillshade generated from a 2023 DEM (September 2023; Province of Carinthia, CC BY 4.0). (b) Großelend Kees elevation change 2023–2010 overlayed on the hillshade (DoD: DEM of Differences). (c, d) Multitemporal orthophotos of Nördlicher Schalf Ferner (centroid coordinates: Long. 10.956°, Lat. 46.796°; Ötztal Alps, region 11; orthophotos: 28 July 2020, 19 August 2023; Province of Tyrol; CC BY 4.0 AT). (a, b) EPSG: 31258; (c, d) EPSG: 31287. Grid in meters. For additional information on data sources see Table S1 in the supplement.
Data availability and acquisition years vary between subregions and Austrian federal provinces. The target year for AGI5 glacier outlines was 2023. Data acquired in 2021 or 2022 was used if no suitable coverage for 2023 was available. Outlines for 2023 were produced for 60 % of glaciers in Austria (55 % of total glacier area). Outlines for 2022 were produced for 39 % of glaciers (43 % of total area). The remaining 1 % of glaciers (2 % of area) were mapped with data acquired in 2021. For the glaciers in the federal province of Vorarlberg (Fig. 1), outlines for 2023 produced for a province-level inventory (Conzelmann et al., 2026a) were incorporated into AGI5.
About 95 % of the total glacier area in Austria was mapped using mainly aerial images. The remaining area was mapped mainly based on DEM derived products (approx. 4 % of area), or high resolution satellite imagery (1 % of area), typically with orthophotos as auxiliary data. In most cases, analysts reported using more than one data type. This mainly refers to using hillshades or elevation change rasters in combination with aerial or satellite imagery, using satellite imagery instead of orthophotos if snow conditions were more favourable in the former, or using imagery from multiple years to assess glacier evolution. As a general guideline and following the approach of AGI3, analysts were asked to use a maximum zoom scale of 1:3000 in both aerial imagery and DEM derivatives as a starting point for mapping. Most analysts mentioned using a higher zoom level for very small features and cases they considered challenging.
Information from field surveys of the glacier margins and relevant local knowledge were incorporated at the discretion of the analysts. Such terrain knowledge was available mainly for glaciers with in situ monitoring programs and a subregion of the Ötztal Alps where an analyst documented debris-covered ice outside of older AGI outlines during site visits over multiple years. In some cases, analysts found that the imagery and data used to delineate AGI5 outlines showed ice where none was mapped in prior outlines due to varying image quality, snow cover, and/or differences in interpretation between analysts. The prior outlines were not modified in these instances. The AGI5 mapping process also revealed several errors in prior inventory attributes, mainly related to wrongly assigned or mistyped ID numbers. Corrections for these cases were issued as updates to the existing AGI3 data publication (Fischer et al., 2015a).
2.1.2 Metadata and quality metrics
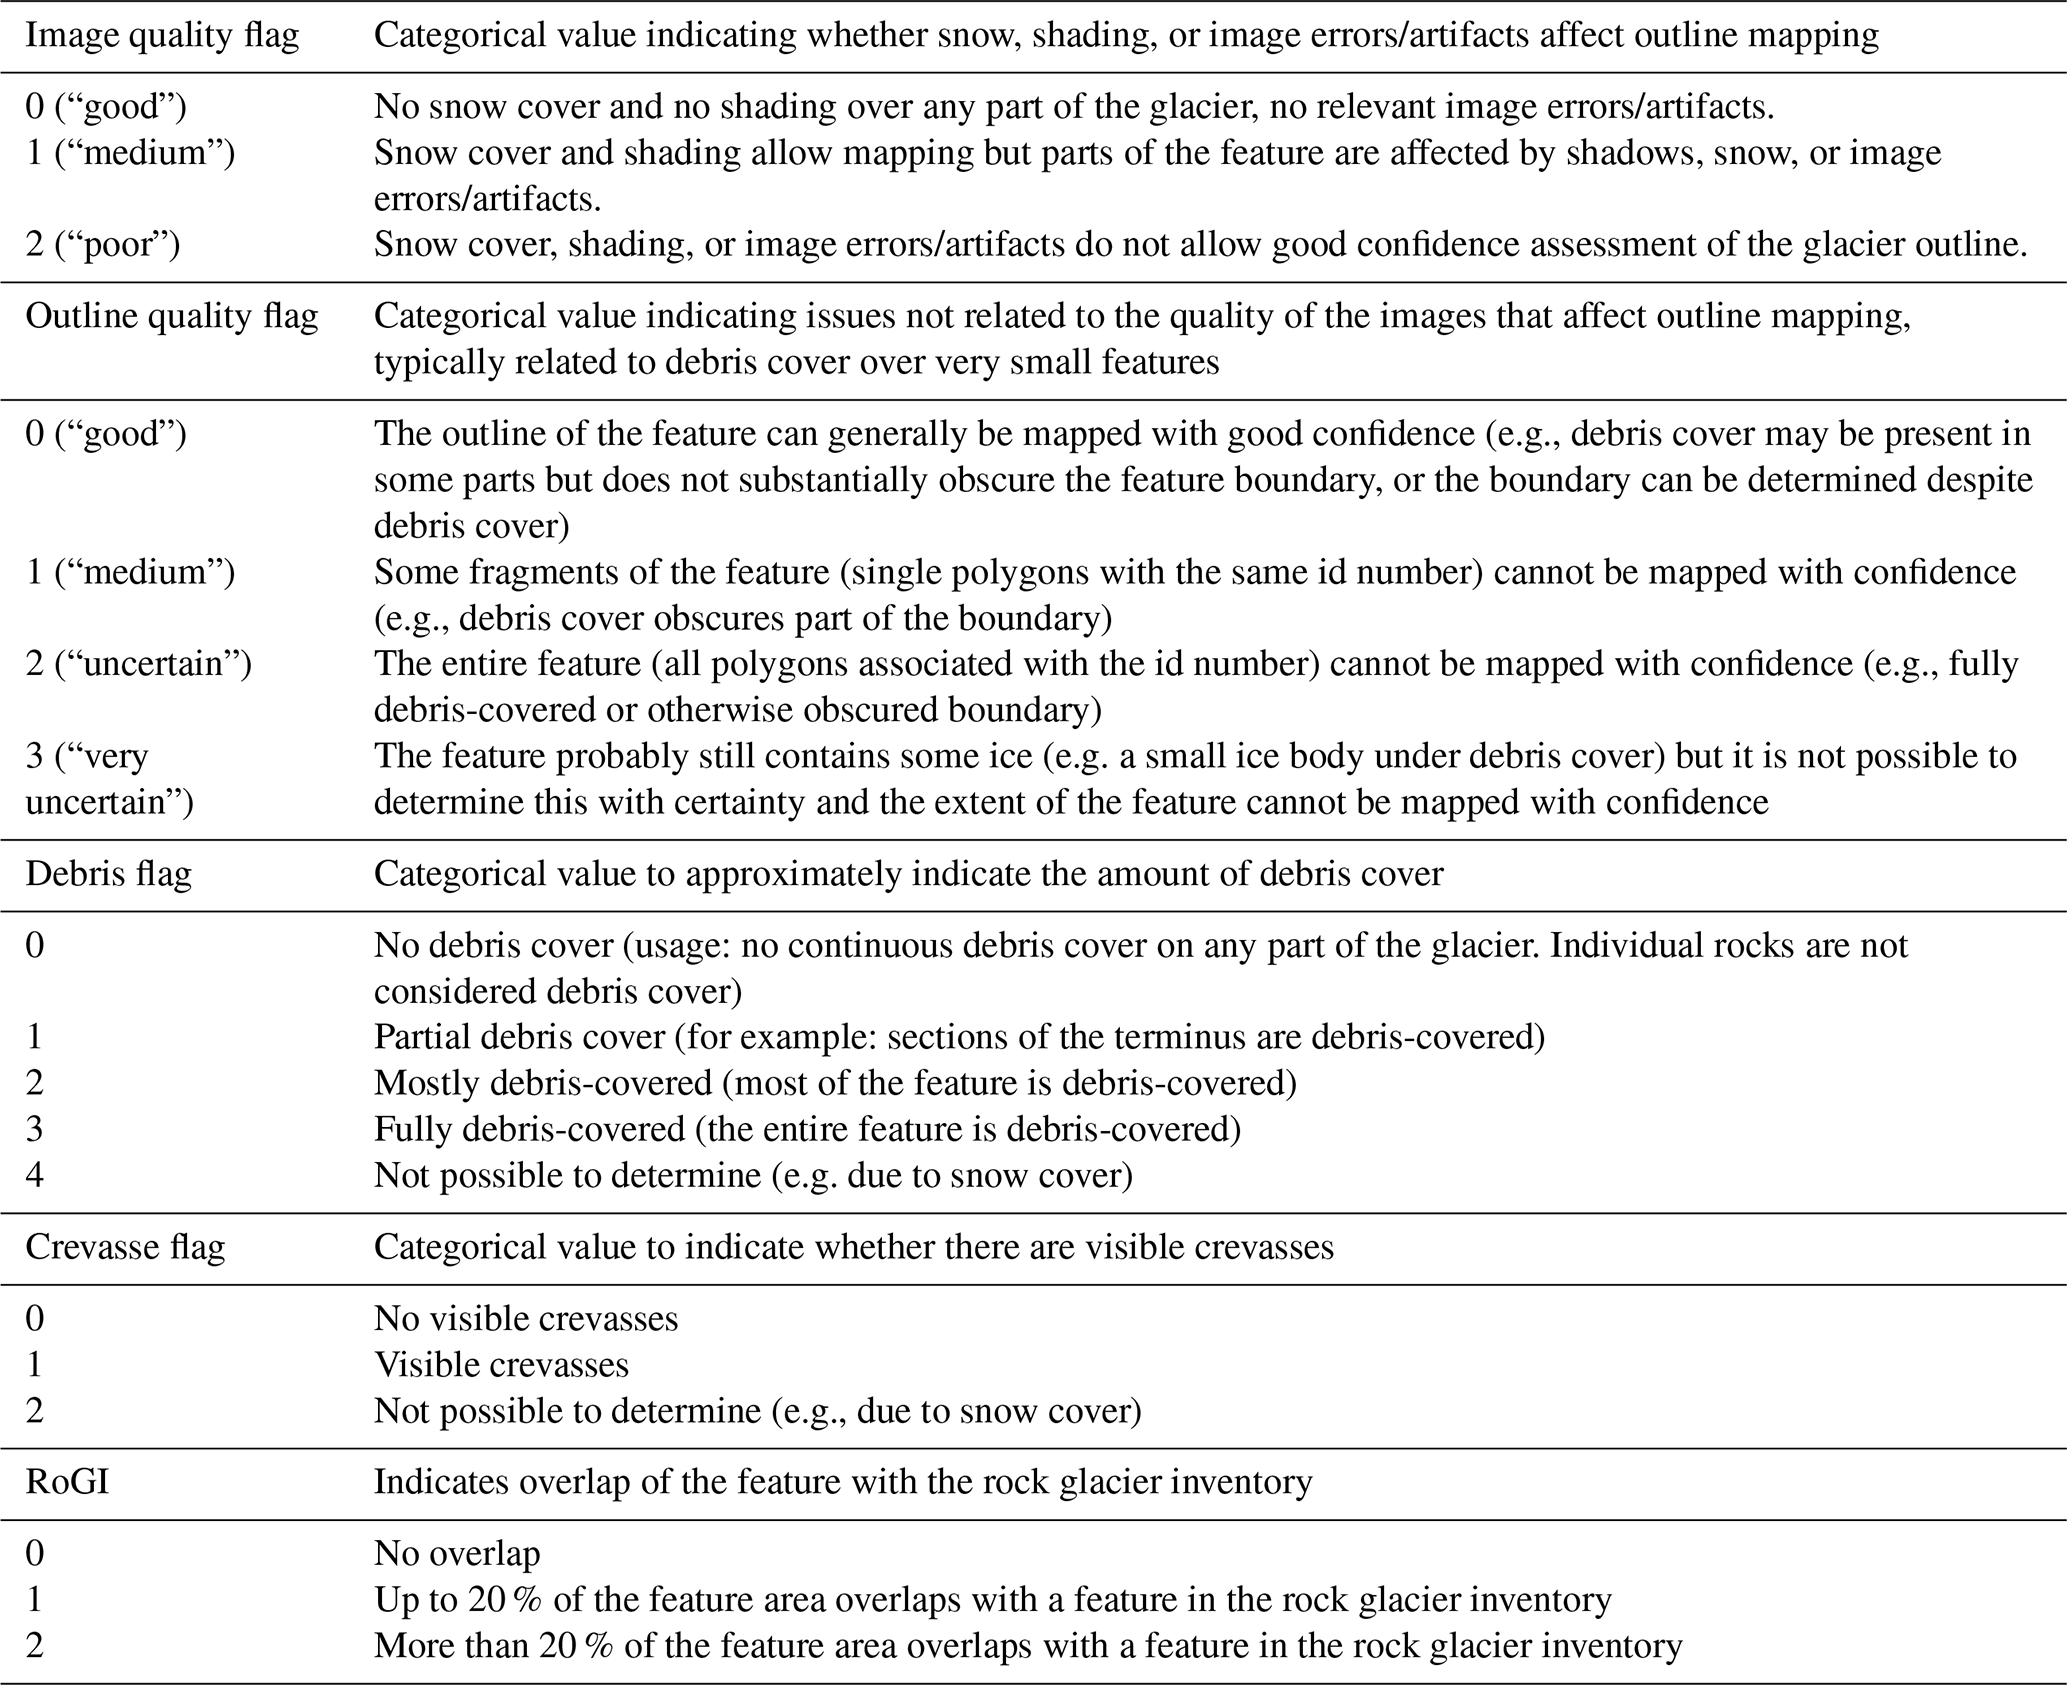
For each glacier ID and corresponding outline, the AGI5 attribute tables (Table 2) list information related to the source data (acquisition date, data type, image identifiers). Categorical flags indicate potentially detrimental image characteristics (e.g., snow cover or shadows), a qualitative level of uncertainty of the outline, and a debris cover score. In addition, the presence of visible crevasses was flagged. Crevasses have been used as an indicator of past or present flow (e.g., Leigh et al., 2019) and, hence, a criterion that allows distinguishing “glaciers” from “ice bodies” as defined by Cogley et al. (2011). AGI5 does not make such a distinction but including the crevasse flag allows users to filter the data accordingly, for example when comparing AGI5 with datasets that distinguish between these classes, or only include glaciers that show signs of flow (e.g., the SGI). The attribute table also includes a flag indicating overlap of AGI5 with the outlines of the most recent Austrian Rock Glacier Inventory (RoGI, Wagner et al., 2020a) to identify potential cases of misclassification or ambiguous landforms.
Table 2Categorical scores included in the data attributes of each AGI5 glacier outline, indicating potential image quality issues, estimated outline quality, debris cover, the presence of crevasses, and overlap with a nation-wide rock glacier inventory (Wagner et al., 2020b). A full list of attributes is provided in the Supplement (Table S3 and Fig. S2).
The AGI5 attribute table further contains the area of each glacier, the number of fragments per glacier, and elevation statistics. Minimum, maximum, and median elevation of all pixels within a given outline were extracted from a 10 m × 10 m resolution DEM provided by the Austrian Federal Office of Metrology and Surveying (BEV). This DEM is a resampled product from original high-resolution DEM data (0.5–1 m) derived from airborne laserscanning produced for the individual provinces of Austria. It includes data from different undisclosed epochs around 2015 and is available through the Austrian open government data platform (Geoland.at, 2015). Accordingly, the national DEM does not exactly match the outline years in AGI5. It was chosen as the most recent product available across all of Austria to derive consistent per-glacier elevation statistics.
2.1.3 Vanishing glaciers
In keeping with the previous AGI, no minimum size threshold for glaciers or fragments of glaciers was applied in AGI5. Analysts were asked to map the remaining glacial ice patches in their subregions to the best of their abilities regardless of feature size. Experience with recent regional inventories showed that very small, highly debris-covered features can be difficult to map even with very high-resolution imagery and auxiliary DEM-derived information (Fischer et al., 2021a; Conzelmann et al., 2026a). To account for this, analysts had the option to flag glaciers or glacier fragments that they considered impossible to map but assumed may still contain ice as “vanishing features”.
Two possibilities for further handling of such “vanishing features” were incorporated in the processing workflow:
-
Case 1: A single glacier ID was associated only with “vanishing features”. That is, there were no longer any “mappable” fragments of a given glacier but it was assumed that ice may still be present, for example under debris cover. In this case, the respective glacier was considered a “vanishing glacier” close to disappearance. As the outlines of these features are not mappable with the given source data, they were not included in the main inventory dataset. Centroid coordinates were recorded in a separate file.
-
Case 2: A glacier ID was associated with fragments that could still be mapped as well as with “vanishing fragments”, which may still contain ice but could not be outlined. In such cases, the outlines of the remaining “mappable” fragments were included in the inventory dataset and the possible existence of “vanishing fragments” was flagged in the dataset attribute table.
Analysts categorized glaciers as “vanished” if they found no evidence of remaining ice within the previous glacier outline. The centroid coordinates of the glaciers that were categorized as “vanishing” or “vanished” are provided as an extra file in the AGI5 dataset publication and the two categories can be distinguished in the data file based on the attributes. To improve the readability of this manuscript, we refer to both categories as “vanishing” in the following.
2.2 Special cases
2.2.1 Glacier ski resorts
The AGI5 region contains nine ski resorts located in glacierized terrain. The resorts apply white reflective coverings to locally reduce melt and preserve particular patches of ice and snow relevant to resort operations (for example, to maintain lift tracks or for snow storage). Such patches of covered ice and snow were included in the outline mapping if they were connected to a remaining uncovered feature. Covered patches not connected to uncovered ice were not included. Figure 3a and b show examples of coverings and snow management used to locally reduce ablation on Wurten Kees, Carinthia. Figure 3c and d highlight a narrow connection between a covered remnant of the tongue of Tiefenbach Ferner, Tyrol, and the main glacier.
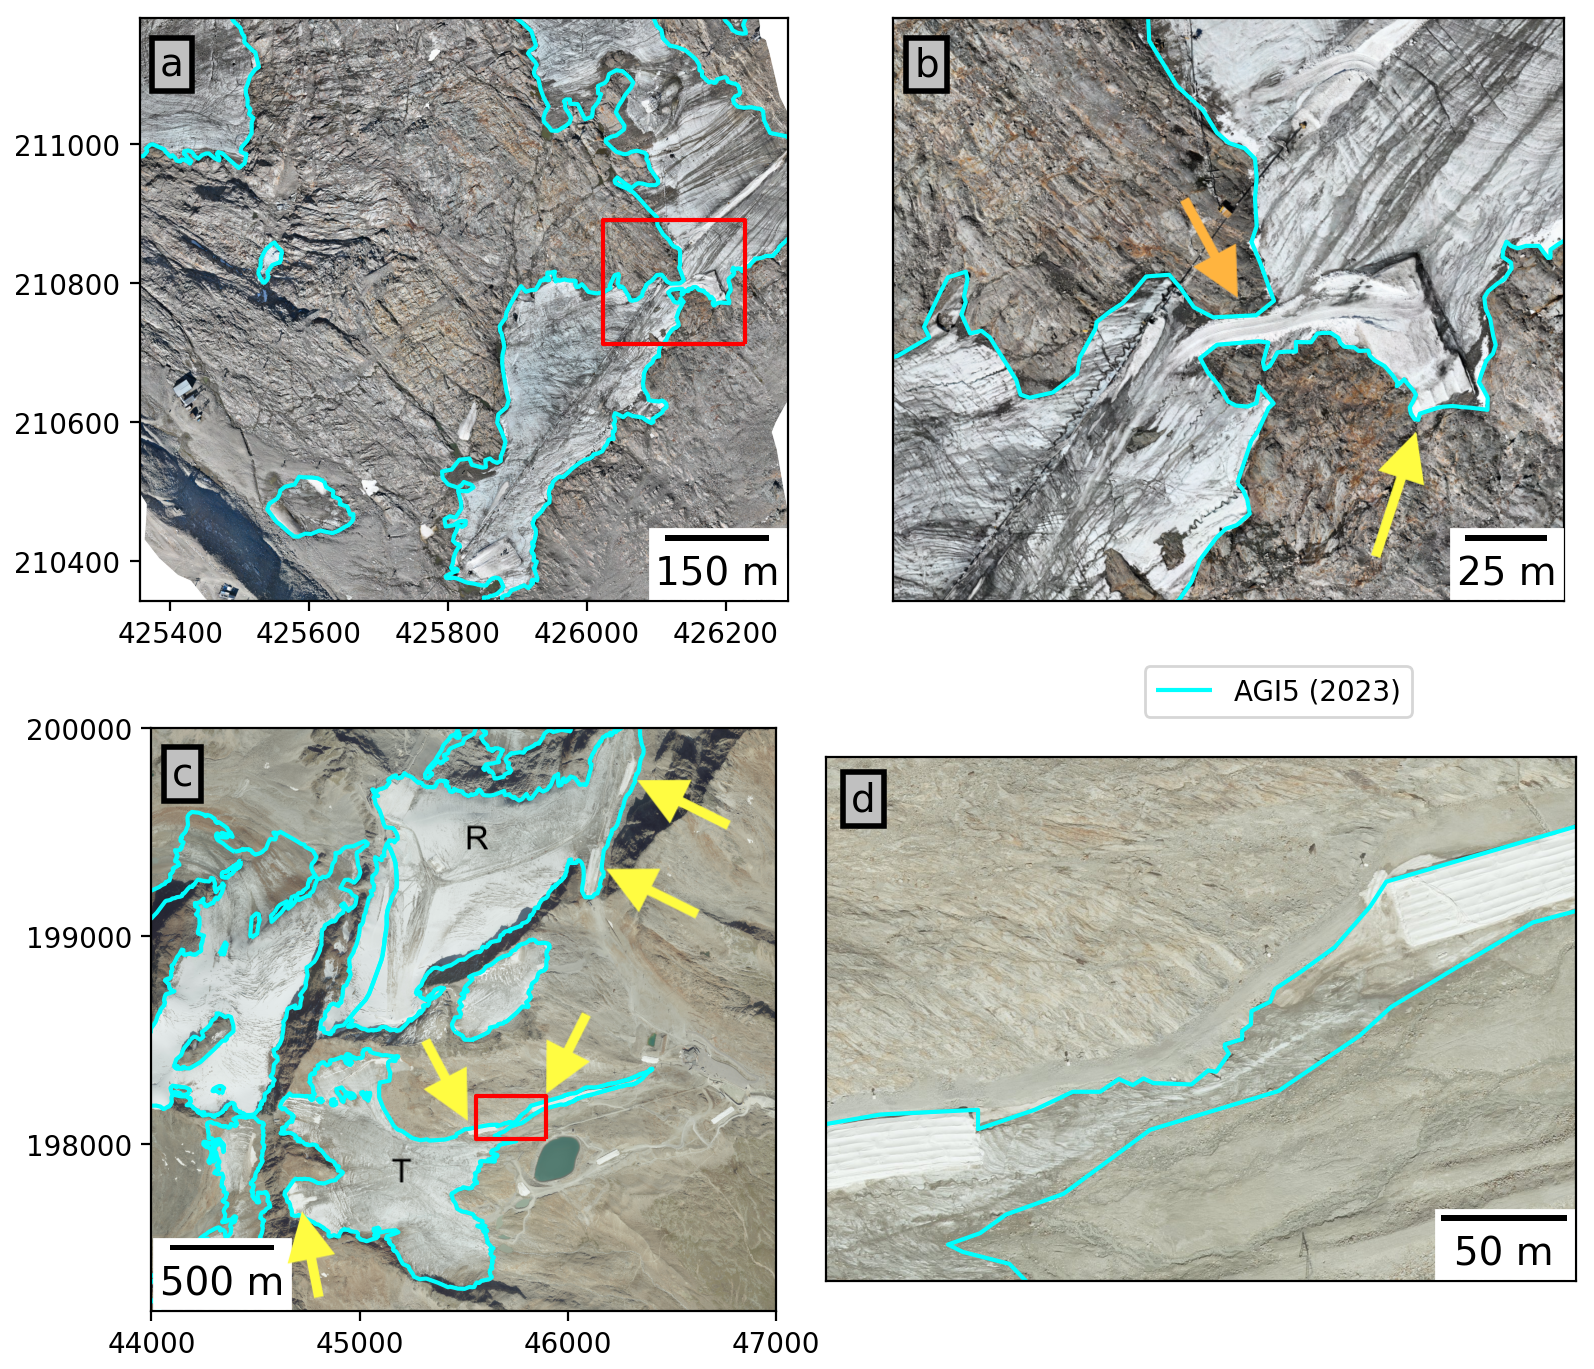
Figure 3(a) Wurten Kees in the Goldberg Group with the Mölltaler Gletscher ski resort (Carinthia). The red box marks the subset shown in (b). (b) Zoomed in view of Wurten Kees; reflective coverings (yellow arrow) are applied to reduce ice melt in this sector in the vicinity of resort infrastructure. The orange arrow indicates a narrow connection between two sections of the glacier which is maintained by the resort operator through snow management measures. (c) The ski resort of Sölden (Tyrol) operates infrastructure and ski runs on glacierized terrain in the central Ötztal Alps, mainly on Tiefenbach Ferner (T) and Rettenbach Ferner (R). Yellow arrows indicate coverings near the glacier margins. The red box marks the subset shown in (d). (d) Close-up view of reflective coverings on the terminus of Tiefenbach Ferner and a narrow band of connecting ice between the two coverings. Blue lines indicate AGI5 outlines in all panels. Background image (a, b) 2023 UAV orthophoto, courtesy of Geosphere Austria. (c, d) 2023 orthophoto mosaic, Province of Tyrol (CC BY 4.0 AT).
2.2.2 Ice divides and country borders
We maintained the AGI3 ice divides in AGI5 to enable consistent area change assessments and due to the challenges associated with accurately determining the current location of the divides. The ice divides were initially defined for AGI1 (Patzelt, 1980; Groß, 1987) and largely applied in the same way in AGI2 and AGI3. We note that the true location of the ice divides may have shifted since AGI1 due to ice losses.
Some Austrian glaciers border on neighboring glaciers in Italy. Country borders along the main chain of the Alps are generally defined based on drainage divides. That is, the country border mostly follows the ice divides in the glacierized regions of the Ötztal, Stubai, and Zillertal Alps. The main exceptions to this are Hochjoch Ferner and Niederjoch Ferner in the Ötztal Alps. Here, the country border locally deviates from the drainage divides and the glaciers extend across the border. For consistency with AGI3, we continue to include the Italian parts of the respective glaciers in AGI5.
2.3 Area uncertainty estimation
Mapping glacier outlines is subject to various sources of uncertainty, which result in uncertainties in the derived glacier area. Building on approaches by previous studies (Abermann et al., 2010; Fischer et al., 2015b; Conzelmann et al., 2026a), we applied different area uncertainty estimates to glaciers of different size classes and outline quality categories. Regional uncertainty values were calculated as the sum of the individual glacier uncertainties (that is, uncertainties always cumulate), in keeping with AGI3 (Fischer et al., 2015b).
The relative uncertainties based on glacier size categories correspond to uncertainties applied by Conzelmann et al. (2026a), who used uncertainties determined by Abermann et al. (2010) as a starting point for their assessment (±1.5 % for glaciers larger than 1 km2, ±5 % for smaller glaciers). The values of Abermann et al. (2010) were also applied in the uncertainty estimates of AGI3 (Fischer et al., 2015b). However, Conzelmann et al. (2026a) found higher uncertainties for very small, highly debris-covered features based on multi-analyst mapping comparisons (referred to as “Round Robin” experiments in the following), similar to the results of Paul et al. (2013). Accordingly, they adjusted the uncertainty estimates of Abermann et al. (2010), adding smaller size categories with higher relative uncertainties (±10 % and ±25 % for features smaller than 0.1 and 0.05 km2, respectively). We used the same approach for AGI5 and additionally accounted for cases flagged by the analysts as highly uncertain by incorporating the outline quality attribute.
For outline quality 0 or 1 (“good” and “medium”), relative area uncertainties were assigned solely based on size categories:
-
Glacier area ≥1 km2: ±1.5 %
-
0.1 km2≤ glacier area <1 km2: ±5 %
-
0.05 km2 ≤ glacier area <0.1 km2: ±10 %
-
Glacier area <0.05 km2: ±25 %
For outline quality 2 and 3 (“uncertain”, “very uncertain”) the following relative uncertainties were applied regardless of glacier size:
-
Outline quality 2: ±25 %
-
Outline quality 3: ±50 %
To assess differences in interpretation between analysts and enable comparisons of uncertainty estimates between AGI5 and similar studies, we carried out a Round Robin (RR) experiment. The outlines of six glaciers of different sizes and characteristics were digitized independently by 15 analysts using the AGI5 imagery and the AGI3 outlines as a starting point. The selection of glaciers for the RR reflects the abundance of small (<1 km2) and very small (<0.5 km2) glaciers in Austria and intentionally included cases that were considered challenging due to debris cover, vanishing status, and discrepancies between AGI3 and AGI5. Section 3 of the Supplement provides figures showing the glaciers considered in the RR experiment.
The outlines generated in the RR experiment enable an alternative approach to uncertainty estimation similar to the “buffer method” applied by, e.g., Granshaw and Fountain (2006); Bolch et al. (2010); Mölg et al. (2018); Paul et al. (2020), in which glacier area is computed with buffers of varying sizes applied to the outlines to obtain a likely area range. In large-scale inventories derived from 10 m to 30 m resolution satellite imagery, typical buffer sizes are in the range of 0.5 pixels for clean ice and 1 to 2 pixels for debris-covered ice (e.g., Mölg et al., 2018; Paul et al., 2020). We explored how well the AGI5 RR outlines are aligned by determining the fraction of outlines that fall within a set of buffers (±2, ±2–5, ±5–10, ±10–20, ±20–40, …) around the main AGI5 outline (Sect. S4). This yields a buffer distance for clean ice glacier margins with a derived range of likely glacier area, and a larger buffer and area range for debris-covered margins. We applied the smaller buffer (±2 m) to glaciers with low debris cover scores (0 or 1, Table 2) and the larger buffer (±20 m) to mostly or fully debris-covered glaciers (debris score 2 or higher, Table 2) to generate an alternative area uncertainty estimate.
In a separate experiment, we additionally compared two sets of outlines (A, B) for a subset of glaciers in the Ötztal Alps. Outline dataset A was mapped based on aerial imagery and extensive local terrain knowledge, whereas dataset B was mapped exclusively from aerial imagery by analysts without detailed field experience at these sites. Statistics computed from the comparison of these datasets serve as a first-order assessment of potential biases in identification of debris-covered ice without ground truth (e.g., Racoviteanu et al., 2009; Paul et al., 2013).
2.4 Change analysis
Area change since AGI3 was assessed for all glaciers included in both inventories. Average annual change rates were computed for each glacier based on the ID numbering system of the AGIs, and for the 20 subregions of the inventory. To account for the variability in inventory years in both AGI3 and AGI5, change rates were computed on a per-glacier basis and regional values are given as the median change rate of the sample. Vanishing glaciers were included in the change analysis with an area of zero in 2023 (AGI5). That is, a “vanishing year” of 2023 was assumed for the computation. The true vanishing years are generally not known. Uncertainties in area change were computed as the sum of the respective AGI3 and AGI5 uncertainties.
In subregions where regional inventories represent a consistent intermediate time step between AGI3 and AGI5, additional change rates for individual glaciers were computed. This refers to the province-level inventories of Vorarlberg and Salzburg and regional inventories for the Silvretta Group and the Ötztal and Stubai Alps (see references in Table 1).
Per-glacier change rates for AGI1 and AGI2 were computed to present a complete overview of the AGI time series. Regional glacier area change since 1850 was assessed for the subregions contained in all AGIs (some of the smaller regions were omitted in AGI LIA and AGI1).
3.1 Glacier distribution in the Austrian Alps
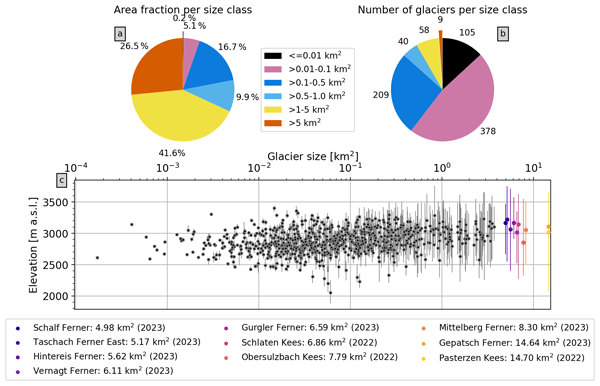
The updated inventory (AGI5) contains 799 glaciers covering a total area of 285 ± 12 km2. Five subregions contain 88 % of Austria’s glacier area, namely the Ötztal Alps (35 %), the Venediger Group (18 %), the Glockner Group (14 %), the Stubai Alps (11 %), and the Zillertal Alps (10 %, Table 3). Most glaciers in Austria (87 %) are smaller than 0.5 km2. These “very small” glaciers (Huss and Fischer, 2016) comprise 22 % of the total glacier area (Fig. 4a, b). The largest size class (>5 km2, 9 glaciers) accounts for more than a quarter of Austria's glacier covered area. Figure 4c additionally highlights the 10 largest glaciers in Austria. The smallest glacier of this group (Schalf Ferner 4.98 km2) falls outside of the >5 km2 category by only a slight margin and is larger than all other glaciers by more than 1 km2.
Table 3Glacier area mapped in AGI5 by region in km2 and as a percentage of total area. Percentage change refers to the difference in area between AGI5 and AGI3 relative to AGI3 total area. Loss rates were computed per glacier and the median value is reported for each region. The number of glaciers in AGI5 is exclusive of the vanished and vanishing features.
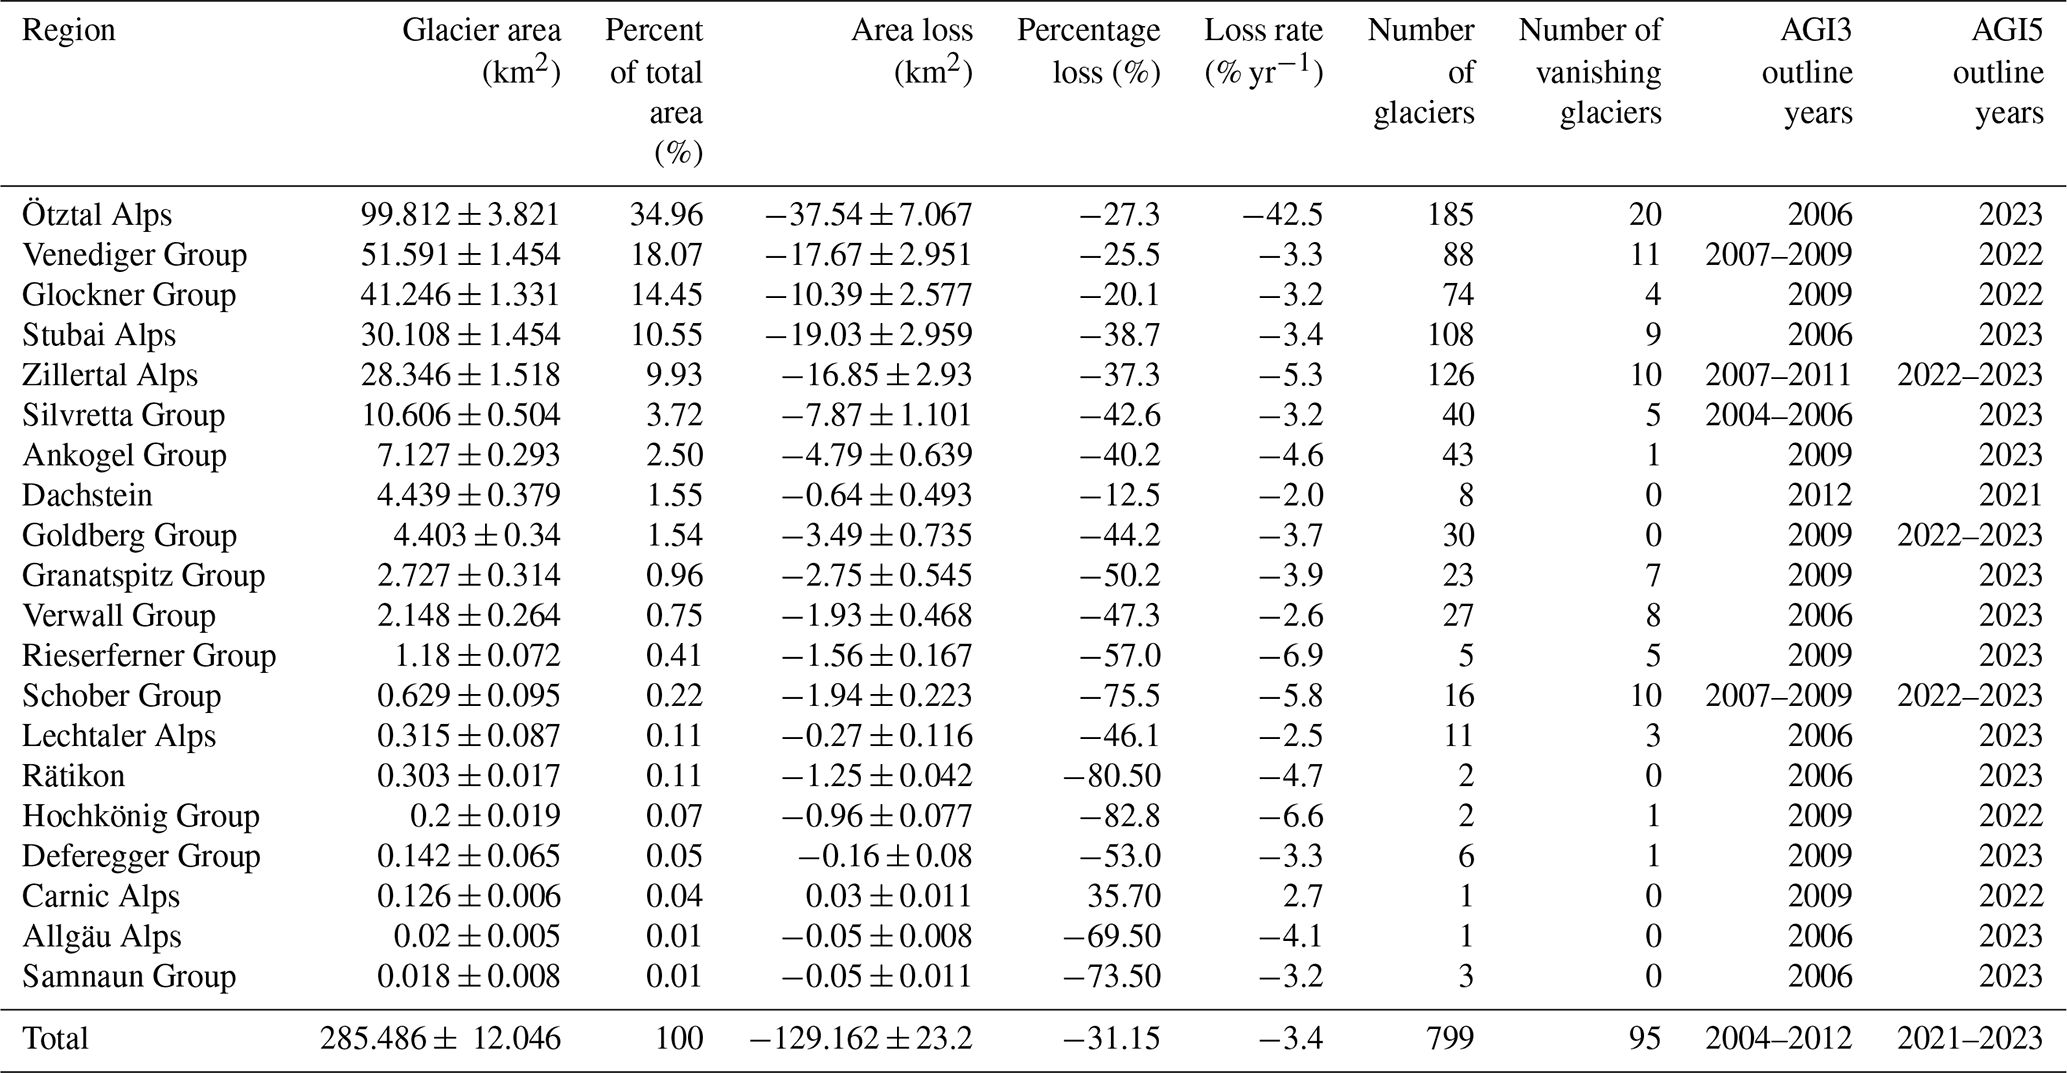
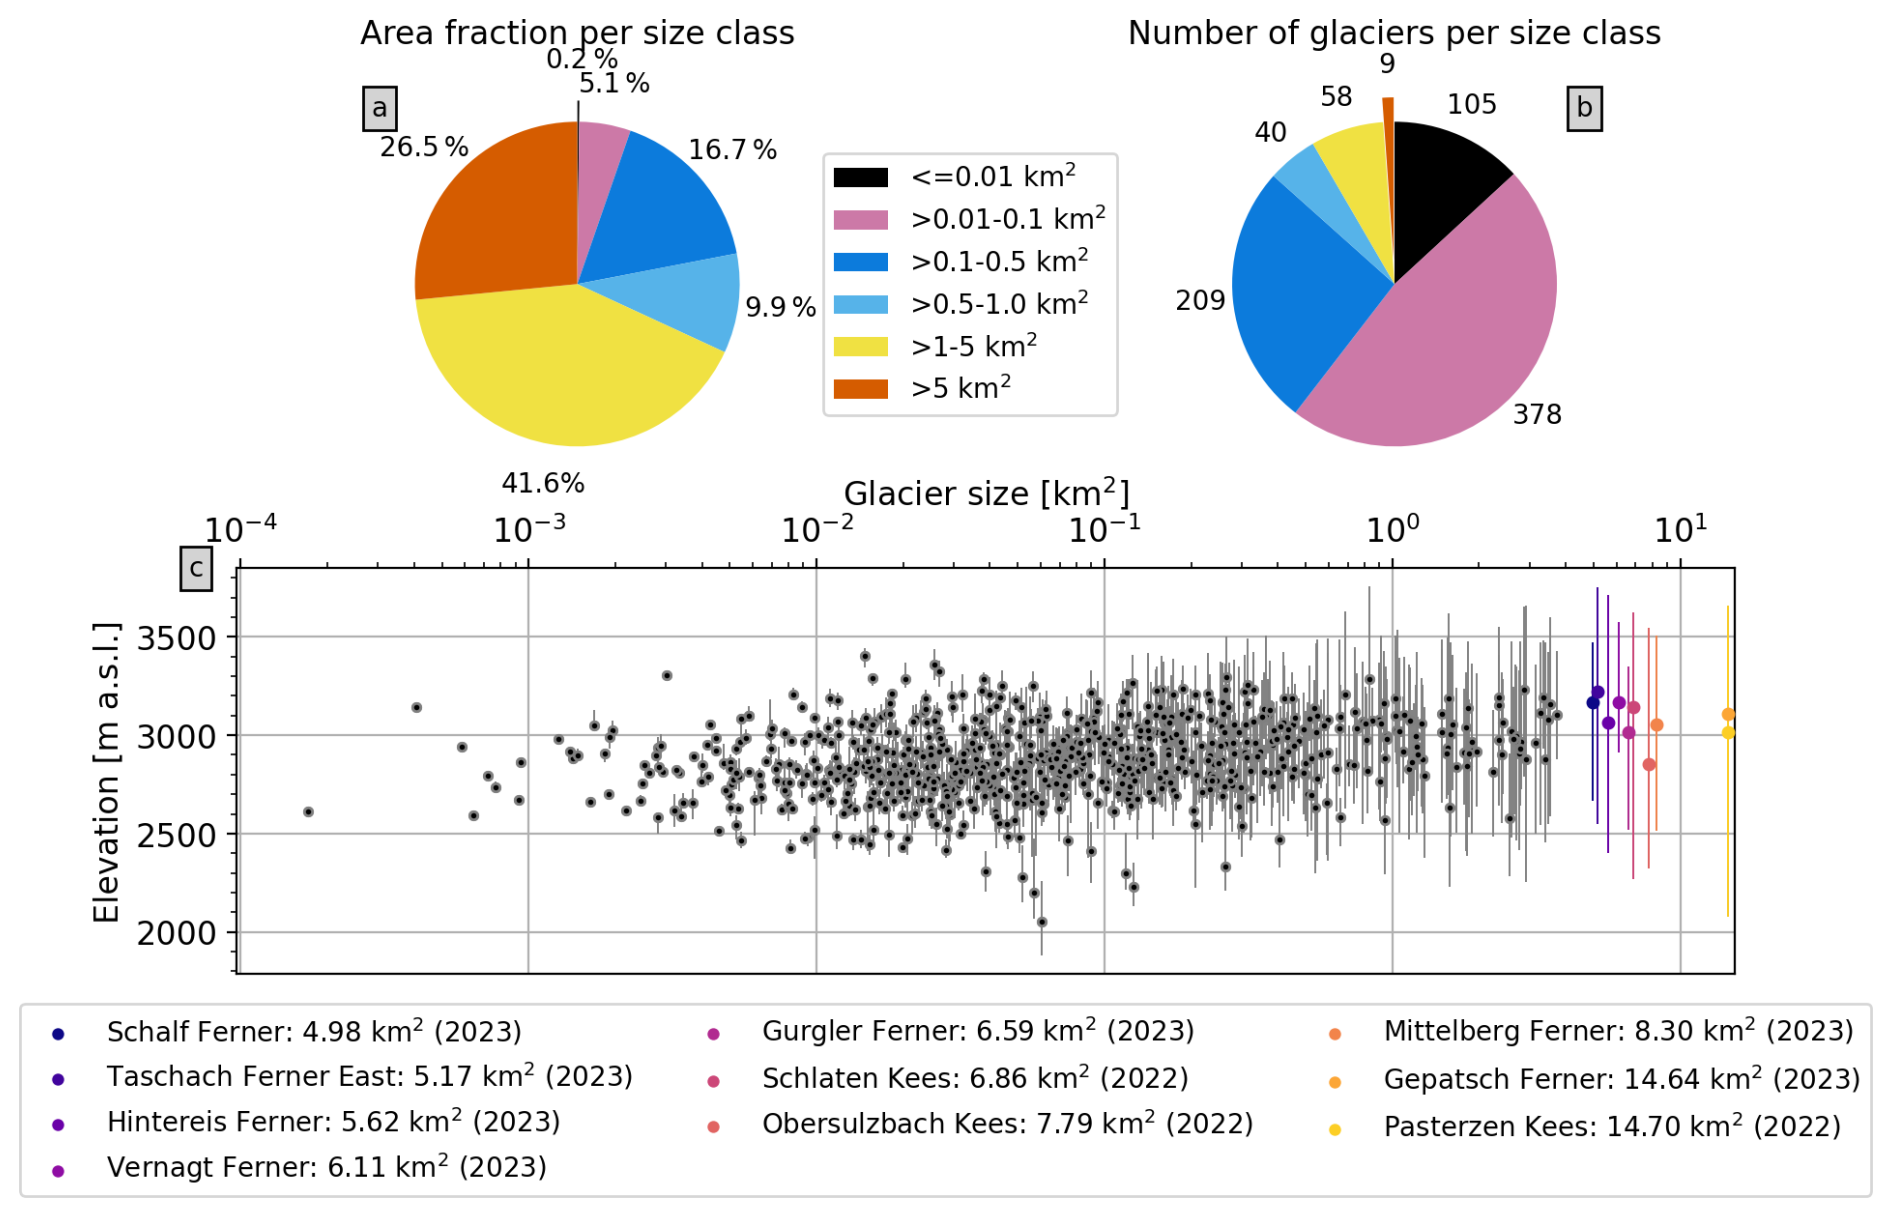
Figure 4(a) Area of all glaciers in the given size classes as percentage of the total glacier area in AGI5. (b) Number of glaciers per size class. (c) Glacier area (log scale), median elevation (circular markers) and elevation range (max. and min. elevation, vertical lines) for all 799 glaciers in Austria. The names and sizes (with outline years) of the 10 largest glaciers are indicated in the legend.
Most of Austria's glacier area is located between about 2800 and 3200 m a.s.l. (60 % of total area; Fig. 5a). The AGI5 glacier area extends from a minimum altitude of 1880 m.a.s.l. (Boggenei Kees, Glockner Group) to a maximum altitude of 3755 m (Rofenkar Ferner, Ötztal Alps). Figure S1 in the Supplement provides further visualizations of glacier distribution by area and aspect.
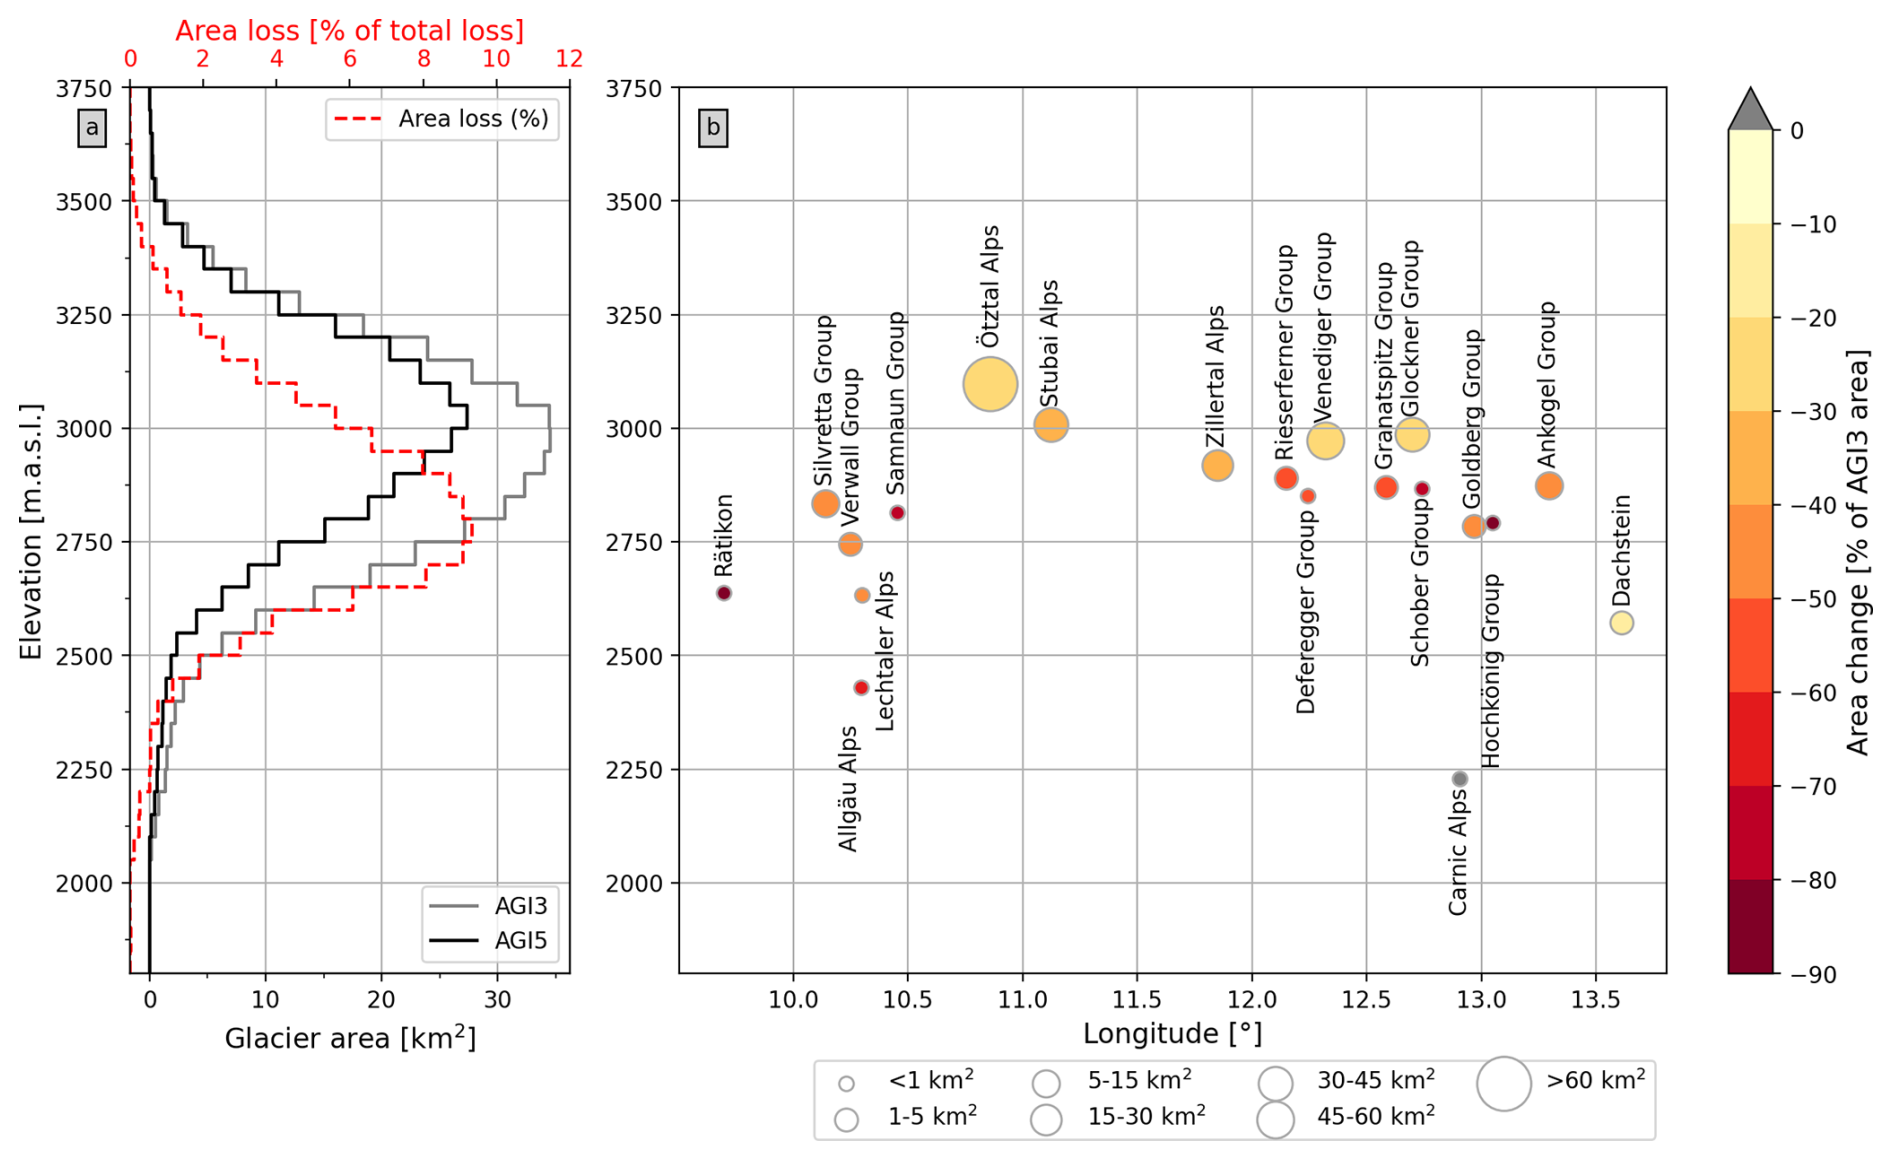
Figure 5(a) Glacier area per 50 m elevation bands in AGI3 and AGI5, and distribution of area loss per elevation band (contribution to total loss per elevation band, red line). (b) Median elevation of the 20 subregions (vertical axis) from west to east (horizontal axis) with regional area loss. Marker color indicates percentage of AGI3 area lost; positive change due to different interpretation of debris covers in the Carnic Alps is shown in grey. Marker size indicates regional glacier area in AGI5.
Analysts identified 82 completely debris-covered glaciers and an additional 158 “mostly” debris-covered glaciers. These glaciers comprise about 1 % and 4 % of the total glacier area, respectively. The fully and mostly debris-covered glaciers are substantially smaller on average (median area 0.02 and 0.04 km2, respectively) than the glaciers with no or only partial debris cover (median area 0.08 and 0.10 km2, respectively; Table S3 in the Supplement). Crevasses were visible on 404 glaciers. These glaciers are roughly an order of magnitude larger (median area 0.19 km2) than glaciers without visible crevasses (363 glaciers, median area 0.02 km2). We estimate that the area covered by visible reflective geotextiles in ski resorts amounts to <0.2 % of total glacier area in Austria (that is, in the imagery used to map AGI5 outlines – the distribution of the coverings changes as they are applied and removed depending on resort operations).
Image quality was mostly considered “good” or “medium”, indicating that snow and shadows caused only minor issues in the mapping process (see flag descriptions in Table 2; Fig. S2 in the Supplement). About a third of all glaciers (32 %) were classified as “uncertain” or “very uncertain”, mainly due to debris cover (outline quality 2 and 3, Table 2). These glaciers account for 5 % of the total glacier area (Table S3 in the Supplement).
3.2 Glacier area change since AGI3
AGI5 indicates a reduction of glacier area in the Austrian Alps by 129 ± 23 km2 compared to AGI3. This corresponds to an area loss of 31 % (relative to AGI3) within a period of about 15 years (area weighted inventory year for AGI3: 2007.5; AGI5: 2022.5), or roughly 2.1 % yr−1. The median per-glacier area loss rate is 3.4 % yr−1 (Table 3). 72 % of area loss occurred in an altitudinal range between 2500 and 3000 m. Altitudes above 3000 m contributed 22 % of area loss (Fig. 5a).
Regionally, the greatest absolute losses since AGI3 occurred in the Ötztal Alps with an area reduction of 37.5 ± 7.1 km2 followed by the Stubai Alps with 19.0 ± 3.0 km2. In relative terms, two regions (Hochkönig Group and Rätikon) lost over 80 % of their AGI3 area. This amounts to absolute losses of 0.96 ± 0.08 km2 and 1.25 ± 0.04 km2, respectively. An additional six regions lost more than 50 % of their AGI3 area (Schober Group, Samnaun Group, Allgäu Alps, Rieserferner Group, Deferegger Group, Granatspitz Group; Fig. 5b, Table 3). One region (Carnic Alps) showed a slight area increase (Fig. 5b). This region consists of a single glacier (Eiskar Ferner, 0.126 ± 0.006 km2 in AGI5, 0.093 ± 0.005 km2 in AGI3). The positive area change here is due to differences in interpretation of debris-covered areas in the AGI3 and AGI5 outlines and does not represent actual glacier growth.
The most negative median area change rates were found in the Rieserferner Group with −6.9 % yr−1 (Table 3). The Schober Group, Hochkönig Group, and Zillertal Alps also had median change rates exceeding −5 % yr−1. The least negative median change rates were found in the Dachstein Group with −2.0 % yr−1 (AGI5 inventory year: 2021).
Median glacier area decreased from 0.10 km2 in AGI3 to 0.06 km2 in AGI5, and median glacier elevation increased from 2849 to 2882 m a.s.l. (Fig. 6a, b). Grouping glaciers by size, the most negative median change rates occurred in the smallest category ( km2) with −5.9 % yr−1. Median change rates decreased with increasing glacier size, dropping to losses of less than 2 % yr−1 for glaciers larger than 1 km2 (Fig. 6c).

Figure 6(a) Violin plots for glacier area in AGI5, AGI3, and the AGI3 area of the vanishing glaciers. (b) Median glacier elevation in AGI5, AGI3, and the vanishing glaciers (AGI3 elevation). (c) Median area change rates for glaciers grouped by size categories (left axis) and number of vanishing glaciers per size category (right axis). Vanishing glaciers are grouped by size bins using their AGI3 area. These values are provided in tabular form in the supplement (Table S4). (d) Glacier elevation range (maximum – minimum elevation) plotted against glacier area (log-scale) for all AGI5 glaciers. Colors indicate area change rates. Black stars show AGI3 area and elevation of the vanishing glaciers. (e) Subset of (d) scale and marker transparency adjusted to highlight the vanishing glaciers.
3.3 Vanishing glaciers
AGI5 contains 799 individual glaciers compared to 894 in AGI3. The 95 “missing” glaciers were classified as vanishing between AGI3 and AGI5. That is, analysts found no remaining evidence of ice or considered it impossible to determine an outline for potential remnants of debris-covered ice. The vanishing glaciers had a median size of 0.028 km2 in AGI3, which is about 70 % smaller than the AGI3 median (Fig. 6a). Of 95 vanishing glaciers, 80 were between 0.01 and 0.1 km2 in AGI3 (Fig. 6c). The area loss from the vanishing glaciers amounts to 3.702 km2, equivalent to 2.9 % of total area loss between AGI3 and AGI5. Glaciers have vanished across most of the altitudinal range of glacierized terrain in Austria (median elevation in AGI3 between 2363 m and 3356 m). The median elevation of the vanishing glaciers was 44 m (77 m) lower than the AGI3 (AGI5) median (Fig. 6b) and their median vertical extent was considerably smaller (127 m) than the AGI5 median (206 m, Fig. 6d, e).
The disappearance of 95 glaciers between AGI3 and AGI5 represents a substantial increase in disappearances compared to AGI1 to AGI2 (5) and AGI2 to AGI3 (11). Figure 7a indicates the location of the vanishing glaciers for the three inventory time steps and their size class prior to being classified as vanishing.

Figure 7(a) Vanishing glaciers as identified in comparisons of AGI1 and AGI2 (yellow markers), AGI2 and AGI3 (orange), and AGI3 and AGI5 (red). Marker size is scaled to glacier size categories in the respective prior inventories. Labels indicate Austrian provinces (black border around label text) and neighbouring countries (grey border). Terrain map courtesy of basemap.at. Austrian borders courtesy of BEV (Bundesamt für Eich- und Vermessungswesen). Swiss borders courtesy of Swisstopo (Federal Office of Topography). (b–d) Histograms of relative area change for AGI1–AGI2 (b), AGI2–AGI3 (c), and AGI3–AGI5 (d). The legend indicates the number (n) of glaciers assessed in each time period.
3.4 Area change rates since AGI LIA
Comparing AGI LIA with AGI5 shows an area reduction of 68 % for the subregions that were included in all AGI (supplementary material Fig. S3). Median area change rates of Austrian glaciers have become increasingly negative since AGI1 (Table 4). Median change rates amounted to approximately −1 % yr−1 from 1969 (AGI1) to the late 1990s (AGI2), increased to −1.6 % yr−1 between the late 90s and mid-2000s (AGI3) and to −3.4 % yr−1 from AGI3 to AGI5. The intermediate regional inventories available for the time frame around 2017–2018 show even more negative median change rates of −4.8 % yr−1 for the most recent subperiod. The histograms of per-glacier change rates for AGI1–2, AGI2–3, and AGI3–5 in Fig. 7b–d indicate increasing variability and more frequent occurrences of strongly negative change rates in the most recent periods, in addition to the higher median losses. In absolute terms, losses increased from 3.1 (AGI1–AGI2) to 5.8 (AGI2–AGI3) and 8.8 km2 yr−1 since AGI3 (Table 4).
Table 4Change rates since AGI1 expressed as percentages per year and in km2 yr−1. The median and total values are computed from the glacier-wise change rates. That is, different inventory years at individual glaciers are taken into account.
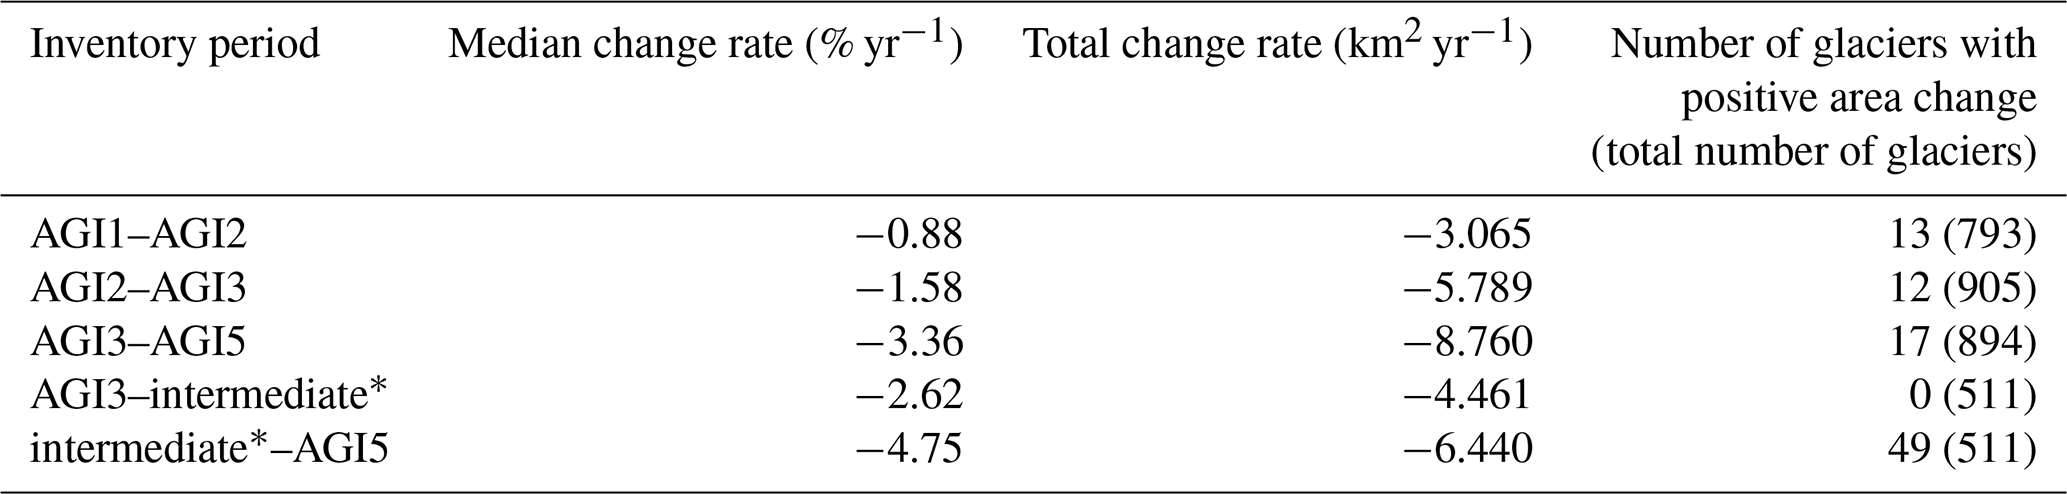
∗Intermediate inventories available for some of the subregions, see Table 1.
There are 13, 12, and 17 instances of positive change rates in the three timesteps, respectively. These are caused by differences in interpretation of outlines, imagery revealing ice that was previously not visible, or inclusion of knowledge gained from in situ surveys (Table 4, Sect. S5 in the Supplement). For the subregions with an intermediate inventory for 2017–2018, 49 of 511 glaciers show positive change rates, some of which are substantially larger than typical positive change rates associated with subjective differences in interpretation of images between analysts. These cases are primarily related to the inclusion of debris-covered areas based on local knowledge in AGI5 for glaciers in the Ötztal Alps (refer to Sect. S5 in the Supplement for more information on this subset of glaciers).
3.5 Round Robin experiment
Table 5 lists the glaciers used for the RR experiment with median glacier area and standard deviation (SD) of the outlines produced by the analysts. Overview maps of all test cases and summarized commentary by the analysts are provided in the supplementary material (Sect. S3). The SD of the RR outlines ranges from 0.006 to 0.269 km2, with generally larger SD with increasing glacier size (Table 5). The SD reaches up to 50 % of the median for the smallest test case not classified as vanishing by the majority of analysts and drops to less than 2 % of the median for the largest test case. In absolute terms, the difference between the smallest and largest area values derived from the analysts’ outlines (Fig. 8a–f) ranges from 0.15 km2 at Seekarles Ferner to more than 1 km2 for the largest test case (Pasterze), where analysts had different interpretations of the lake-terminating, partly debris-covered glacier tongue. At Arvental Kees, 9 of 15 analysts identified ice beyond the AGI3 outlines, leading to an increase in mapped area between AGI3 and AGI5.
Table 5Glaciers used in the Round Robin (RR) experiment, with regions, size in AGI3, standard deviation (SD), SD divided by median area, and notes on characteristics relevant to the mapping process. All listed glaciers were digitized by at least 14 analysts. Figures showing each glacier and the RR outlines are provided in the Supplement (Sect. S3).

∗ Nameless glacier, also known as Affental Kees.
Three of the six RR glaciers were classified as vanishing by at least one analyst. Madlein Ferner, the smallest of the RR glaciers in AGI3, was classified as vanishing by 14 of 15 analysts (Fig. 8a). The second-smallest glacier was classified as vanishing by two analysts, and the third-smallest by one analyst (Fig. 8b, c). That is, most analysts agree on the status of these glaciers but there are individual outlier opinions in both directions. The largest area estimates at all six test glaciers were produced by either analyst 4 or analyst 11 (Fig. 8), who included larger debris-covered areas. Analysts 7 and 13 produced the lowest estimates for the three larger RR glaciers (Fig. 8d–f).
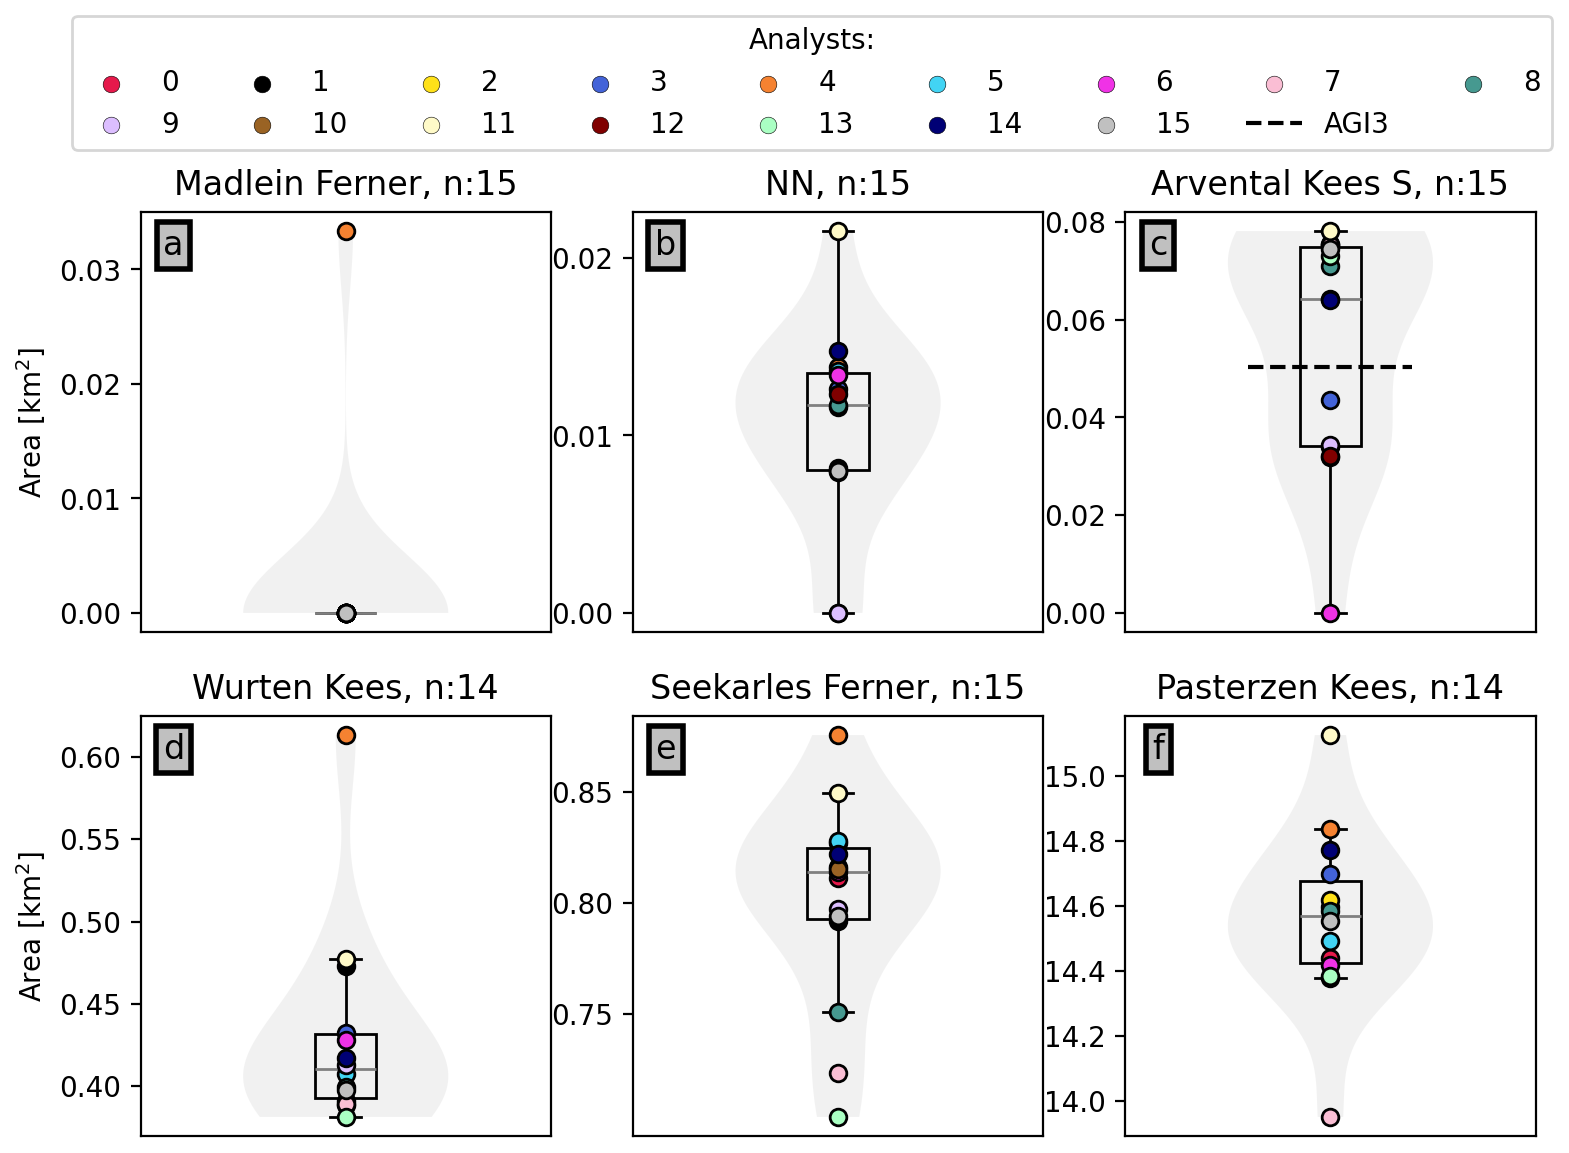
Figure 8Glacier area derived from the outlines digitized by the analysts (n=number of analysts) for the six test cases in the RR experiment. The boxplots indicate the first and third quartiles (black boxes) and the median (grey line); grey shading denotes the corresponding violin plots. In panel (c), the AGI3 area (dashed black line) is included for comparison because the AGI5 outlines were mapped beyond the extent of the AGI3 outlines in this case. The AGI3 area was larger than all RR results for the other examples shown.
In general, agreement between the analysts is high in sections of the outlines that can clearly be identified as debris-free. Figure 9 shows examples from Seekarles Ferner to illustrate the decrease in alignment of the identified ice margins in ambiguous or debris-covered sections. The glacier outline can clearly be delineated with little variation among the 15 analysts where it borders a bedrock outcrop, whereas there are substantial discrepancies in a neighbouring section where loose rocks obscure the margin (Fig. 9b). Similarly, there is good agreement between the analysts along the largely debris-free upper margin of the glacier despite shading and snow cover. Agreement decreases along the lower margin, which is partially debris-covered and shadowed (Fig. 9c).

Figure 9(a) The outlines of Seekarles Ferner produced for the RR experiment by 15 analysts. The star marks a “vanishing fragment” placed by one analyst on the debris-covered sector of the tongue (may contain ice, cannot be mapped with confidence). Two analysts excluded this sector entirely, whereas the remaining 12 analysts included it. The red boxes indicate the close-up views shown in panels (b) and (c). Panels (b) and (c) close up views of Seekarles Ferner outlines highlighting good alignment (blue arrows) for bare ice margins and reduced agreement (orange arrows) between analysts for debris-covered sections. The solid and dashed red lines respectively indicate a ±2 m and ±20 m buffer around the AGI5 outline.
Applying distance buffers to the outlines confirms good alignment of the RR outlines with each other and with the main AGI5 outline in clean ice sections of the glacier margins, and heterogeneous results in debris-covered sections (Fig. 9b, c; Sects. S3, S4 in the Supplement). At Seekarles Ferner and Wurten Kees, 57 % and 59 % of RR outlines are within ±2 m of each other (Table 5). At Pasterze, outlines deviate along the large, partly debris-covered and lake-terminating glacier tongue so that only 46 % of the RR outlines are aligned within ±2 m. At the small, nameless glacier (NN) this value drops to 20 %. A buffer size of ±40 m covers 90 % of the RR outlines at this glacier (Sect. S4 in the Supplement).
For all AGI5 glaciers (total area 285.5 km2), applying a ±2 m buffer yields an area range of 279.7–292.7 km2, or an approximate uncertainty of ±6.5 km2 ( ± 2.3 %). With a ±20 m buffer, the range increases to 231.2 km2–347.7 km2 (±58 km2, or ±20 %). A ±40 m buffer corresponds to a ±37 % area uncertainty. Accounting for differing amounts of debris cover by incorporating the debris attributes (Table 2) in the calculation results in a regional area uncertainty of ±13.9 km2 (±4.8 %) using a ±20 m buffer for mostly or fully debris-covered glaciers and ±2 m for the mostly or entirely clean ice cases. With a ±40 m buffer the uncertainty increases to ±20.5 km2 (±5.9 %).
4.1 Uncertainties and inherent limitations
4.1.1 Uncertainties in outline mapping
In general terms, we follow an epistemic approach to uncertainties. That is, “the best value is that which is most credible, from the current perspective of knowledge” (Bokulich and Parker, 2025). Uncertainty estimates can be interpreted as a measure of the extent that our knowledge of glacier area – at the glacier-level and regionally – remains inexact. Considering the RR experiment, we assume the most credible value for each glacier is the median of the sample. However, the RR approach is a measure of precision rather than accuracy in the sense that we do not know the “true” area value. Rather, we are assessing how closely the analysts’ interpretations of the source data are aligned (see Sect. 3.5).
The AGI5 uncertainties should be understood as fallible epistemic products that can and should be iteratively improved (Bokulich and Parker, 2025). Notably, improvement does not necessarily mean a decrease in uncertainty. The AGI5 uncertainties provide an estimate of potential errors introduced by differences in interpretation between analysts, but they do not account for potential systematic biases, for example related to debris cover identification, and are hence fallible for glaciers that may be affected by such biases. The AGI5 uncertainty estimates build upon prior work, adapting the approaches of Abermann et al. (2010) and Conzelmann et al. (2026a), and have been iteratively improved by incorporating feedback from analysts, who are arguably in the best position to estimate how inexact their outlines may be for a given glacier. The uncertainty estimates could be further improved in the future by explicitly including additional sources of uncertainty as related knowledge improves, for example regarding quantitative bias-estimates for debris cover identification.
The “outline quality” and debris attributes assigned by the analysts (Table 2), indicate that about a third (259) of all glaciers in the study area have high outline uncertainties due to debris cover or otherwise obscured ice margins. Although the attributes are also affected by subjective interpretations (e.g., partially vs. mostly debris-covered), this clearly reflects the most common challenges in manually mapping glacier outlines from orthoimagery and is aligned with expectations given the numerous very small glaciers in Austria. Findings by other studies similarly indicate that surface conditions, timing of image acquisition, quality and resolution strongly affect the visibility and delineation of glacier margins (e.g., Paul et al., 2016; Prinz et al., 2018; Leigh et al., 2019; Fischer et al., 2021a; Andreassen et al., 2022; Hinzmann et al., 2024; Conzelmann et al., 2026a).
Discrepancies in manual mapping between different analysts (or the same analyst mapping a glacier multiple times) are to be expected and it is assumed that they cannot be avoided completely. RR experiments are a standard approach to estimating the general magnitude of the uncertainties introduced by such discrepancies (e.g., Abermann et al., 2010; Paul et al., 2013; Fischer et al., 2015b; Paul et al., 2020; Linsbauer et al., 2021; Diaconu et al., 2025). Measures of variability in the area derived from RR outlines are typically used as uncertainty metrics. For example, the 2010 Swiss Glacier Inventory (SGI 2010, Fischer et al., 2014) found uncertainties of ±7.6 % for glaciers smaller than 1 km2 and uncertainties between ±3 % and ±5 % for larger glaciers. For SGI 2016, Linsbauer et al. (2021) reported a standard deviation of glacier area between multiple analysts of 23.8 % for a “very small glacier in a shadowed, snow-covered north face” and values between 0.3 % and 7.1 % in other cases. In their glacier inventory for Vorarlberg, Conzelmann et al. (2026a) found uncertainties of over ±50 % in very challenging (small, mostly debris-covered) cases, which is generally in line with studies assessing outlines of debris-covered or otherwise challenging glaciers mapped from satellite imagery (e.g., Paul et al., 2013; Mölg et al., 2018).
Once uncertainty estimates for individual glaciers are determined (often derived from RR comparisons), they are frequently used to estimate region-wide uncertainties in a second step. For example, Linsbauer et al. (2021) applied an area weighted average uncertainty derived from the RR experiment to obtain the total regional uncertainty of SGI 2010. For AGI3, Fischer et al. (2015b), applied relative area uncertainty estimates to individual glaciers (following Abermann et al., 2010, see Sect. 2.3) and summed uncertainties to produce a region-wide uncertainty value.
The regional uncertainties given for AGI3 (Fischer et al., 2015b) and SGI2016 (Linsbauer et al., 2021) are in the range of 2 %–3 % of glacier area in Austria and Switzerland, respectively (Austria: 415.11 ± 11.18 km2, Switzerland: 961 ± 22 km2, as per the above studies). Uncertainty estimates for AGI5 are slightly higher with ±4.2 % (285.5 ± 12.0 km2). This increase compared to AGI3 can be explained with the higher relative uncertainties applied to highly debris-covered or otherwise very uncertain glaciers. In AGI5, the glaciers with the highest assumed uncertainties account for about 5 % of total area.
The buffer approach derived from the RR outlines yields uncertainty estimates comparable to the uncertainties computed from the tiered system based on glacier size and outline quality scores (Sect. 2.3), with higher values depending on how debris cover is treated. Outlines of clean ice margins in our RR experiment are generally aligned within ±2 m of each other. Extrapolating this to the AGI5 region yields a regional area uncertainty of around ±2 % (i.e., similar values to AGI3 and SGI2016). In debris-covered sections of the glacier margins, relative uncertainties derived from the buffer approach reach up to around ±40 % (i.e., similar values as in Table 5 and as found by Linsbauer et al., 2021, and Conzelmann et al., 2026a, for challenging cases).
4.1.2 Takeaways from the AGI5 Round Robin experiment
The results of the AGI5 RR experiment (Fig. 8, Table 5) are broadly in line with the uncertainty magnitudes reported by the studies discussed above and confirm that uncertainties increase with debris cover and decreasing glacier size. Generalizing the comments provided by the analysts regarding the RR experiment (Sect. S3 in the Supplement), differing interpretations of debris cover are the main source of discrepancies. Most of the 15 analysts incorporated geomorphological process understanding in their mapping approach and relied on visible surface features (e.g., changes in surface structure, presence of snow or water) that they considered indicative of subsurface ice to delineate debris-covered ice margins. Other analysts focused more on ice that could be visually identified in the imagery and incorporated less detailed process thinking. The RR experiment showed a general tendency towards smaller glacier area for the latter approach but this is not universally true for all test cases and analysts.
In some cases, analysts provided somewhat contrasting process-based interpretations (e.g., Arvental Kees), or had generally similar interpretations of the geomorphology that nonetheless lead to different conclusions regarding the outline or glacier status (e.g., Madlein Ferner, Sect. S3 in the Supplement). In practice, most of the AGI5 glacier outlines were checked by multiple people and analysts discussed challenging cases among each other. Some of the low outlier cases in the RR (e.g., lowest area estimate for Pasterze, “vanishing” status for Arvental Kees) would likely have been identified as anomalous and revised in such quality control settings. The high outlier cases are all related to interpretations of debris cover and are difficult to refute or verify. Improved mapping consistency might be achieved with agreed upon, detailed guidelines regarding identification of debris-covered areas. However, improved consistency does not necessarily mean improved accuracy, for example if the majority opinion is subject to unknown or unquantifiable systematic biases.
In discussions prior to the main AGI5 mapping effort, it was agreed that all available information, including relevant process understanding, should be used, as opposed to only mapping visible ice. The latter would likely have produced more consistent results in the RR (and the overall AGI outlines), but would have underestimated the debris-covered area. Similarly, setting an initial zoom-scale of 1:3000 was a measure intended to improve consistency and reduce effort spent on very small-scale details. Most analysts reported deviating from this scale to check for evidence of subsurface ice in challenging cases and considered closer zoom levels to result in improved accuracy. Aside from inter-analyst discrepancies, there is also some amount of variability in outlines mapped by the same analyst on different days (sometimes referred to as “digitization uncertainty”). In our experience, this variability is substantially lower than the inter-analyst variability and we assume it to be covered by our general uncertainty estimates (see also Sect. S3 in the Supplement).
4.1.3 Likely underestimation of debris-covered area without ground truth
As evidenced above, accurately mapping debris-covered ice from remote sensing is challenging even with very high-resolution imagery, and independent ground truth is rarely available (e.g., Racoviteanu et al., 2009; Zandler et al., 2025). Including local terrain knowledge (where available) in the compilation of AGI5 caused area change discrepancies at individual glaciers due to the greater inclusion of debris-covered area compared to AGI3 (Sect. S5 in the Supplement). However, we consider the approach more accurate and, as above, found this more important than maintaining “consistency” with the previous data by omitting the field observations. The same principle (accuracy over consistency with prior outlines) was applied when AGI5 imagery showed evidence of ice beyond the extent of AGI3 (e.g., Eiskar Ferner in the Carnic Alps, Table 3; or Arvental Kees in the Venediger Group, Fig. 8).
For the subset of glaciers for which detailed local knowledge was available in AGI5 (Sect. S5 in the Supplement), the comparison with outlines mapped exclusively from aerial imagery suggests a systematic underestimation of debris-covered area, similar to previous work in the same region (Strudl, 2024). However, the magnitude of the bias is difficult to quantify at larger scales and it is unknown how often overestimations occur. The tendency towards underestimation of debris-covered area is in line with findings from neighboring South Tyrol (Alto Adige, Northern Italy), where Galos et al. (2025) reported an underestimation of glacier area by 2.3 % in their 2017 glacier inventory compared to a subsequent inventory for 2023. They suggest the underestimation is mainly related to debris cover and assume a similar underestimation is present in outlines produced with 2023 imagery. Given the comparable source data and mapping approaches, AGI5 underestimations of this type can be assumed to be of similar magnitudes. We note that the opposite scenario (overestimation of debris-covered area) may also occur but this is hard to verify and generally cannot be determined from optical imagery alone (e.g., Paul et al., 2013).
Incorporating DEM-derived products or other auxiliary information in glacier outline mapping can support the identification of debris-covered ice margins (e.g., Strudl, 2024; Diaconu et al., 2025; Zandler et al., 2025). Discussing specifically manual mapping with very high-resolution DEM-derived and optical information at the scale of individual mountain ranges (as applied in this study), Abermann et al. (2010) and Fischer et al. (2021a) highlighted that surface elevation change and geometric information improve confidence in outline detection under debris cover. Inventory studies from Switzerland have similarly noted that surface elevation change information reduces debris-related uncertainties (Fischer et al., 2014; Linsbauer et al., 2021).
However, even with very high-resolution data (sub-meter pixels), challenges remain. Snow cover during DEM acquisition, avalanches, or rock fall can create locally positive elevation change signals even if glacier ice was lost over the same time period, making such data difficult to interpret especially for very small glaciers close to disappearance (examples in Conzelmann et al., 2026a). In AGI5, analysts used surface elevation change data where available, usually in addition to optical imagery. Feedback on this was mixed – some found the additional information helpful, but others noted that data were inconclusive in their regions, for example because it was not possible to distinguish loss of ground ice from loss of glacier ice, or due to ambiguities in areas where ice cover was lost completely during the elevation change epoch (i.e., an elevation change signal is present but no ice remains at the end of the epoch). In practical terms, on-site inspections of glacier margins would often be beneficial for accurate mapping but are not feasible at larger scales. Lake-terminating glaciers such as Pasterze (Sect. S3, Fig. S10 in the Supplement) can pose an additional mapping challenge if ice extends below the water level (Kellerer-Pirklbauer et al., 2021).
In summary, it seems likely that debris-covered area is systematically underestimated in glacier inventories compiled from optical imagery, including AGI5, but this remains hard to quantify exactly. Contextual information (surface elevation change, other data types) has the potential to improve delineation of debris-covered glacier margins but needs to be assessed within the specific geomorphological setting. Geophysical investigations would be needed to clearly identify the ice margins beneath thick debris cover.
4.1.4 Classification challenges and conceptual uncertainties
In addition to differences in interpretation and approach between analysts, “classification errors” and “conceptual errors” are two main sources of uncertainties in remote sensing of glacier outlines (Racoviteanu et al., 2009). The former refers to “misidentified features” and the latter is used for a variety of challenges, e.g., “glacier definition issues such as ice divides, perennial snowfields, minimum size, and fragmentation” (Racoviteanu et al., 2009).
Applying these ideas to AGI5, the conceptual issues related to glacier definitions were addressed in the same way as in prior AGIs. That is, there is no explicit distinction between glaciers, ice patches or perennial snow patches; ice divides were maintained since AGI1; and glacier fragments retain their initial ID number.
The imagery and source data used for mapping of the AGI was largely acquired during favourable, mostly snow-free conditions. However, it cannot be ruled out that off-glacier seasonal snow was erroneously included in glacier outlines in some instances across the AGI time series. If these snow patches then disappear and are not included in the subsequent inventory, derived loss rates are overestimated. Due to the mostly good quality of imagery in AGI5 and based on the available information on source data of older AGI, we do not consider this to be a systematic issue in the dataset but acknowledge that the effect may be present in individual cases.
A further relevant classification error may be found in the distinction between glaciers, rock glaciers, and other periglacial landforms. Comparing the AGI5 outlines with the Austrian Rock Glacier inventory (Wagner et al., 2020a) shows 29 cases where AGI5 and the rock glacier inventory outlines overlap. About half of these have only minimal overlap indicative of different landform types existing in close spatial proximity (i.e., the outlines “touch”). The remaining cases have more than 20 % area overlap and may represent classification errors of rock glaciers misidentified as glaciers or vice versa. The distinction between debris-covered glaciers and rock glaciers can be challenging, especially for landform-sequences where both occur in close proximity (e.g., Kellerer-Pirklbauer and Kaufmann, 2018; Haeberli et al., 2024). Nonetheless, the low number of overlapping cases between AGI5 and the rock glacier inventory suggests that this is a relatively minor error source for both data sets.
Whether a glacier can and should be classified as “vanished” or “vanishing” might be considered a classification issue as well as a conceptual one. Classification requires consistent inventories or other forms of record keeping that allow a comparison over time to determine if a glacier that was previously present has disappeared. A conceptual definition of a “vanished glacier” requires a common understanding of the term “glacier” that is consistent at least across the inventories used for the comparisons (e.g., Raup et al., 2025; Linsbauer et al., 2025; Pope, 2025; Carlson et al., 2026; Paul, 2026).
In their recent compilation of vanished glaciers in Switzerland, Linsbauer et al. (2025) and GLAMOS (2025) consider glaciers that were larger than 0.01 km2 in the SGI of 1979 and were no longer included in the SGI2016, or the forthcoming SGI2023 (GLAMOS, 2025). That is, they classify glaciers as ”vanished” if they no longer meet the size requirements for inclusion in the SGIs. In AGI5, we allow a ”fuzzy” classification as ”vanishing” for cases that may still contain ice but cannot reasonably be mapped with the AGI methodology. This approach was based on feedback by analysts, who indicated that uncertainties in mapping the outlines of very small, debris-covered features can effectively be as large as the remaining area of said features. Of the 95 vanishing glaciers in AGI5, 85 were larger than 0.01 km2 in AGI3.
Our RR experiment showed that analysts mostly but not always agree whether a glacier has disappeared. Considering the example of Madlein Ferner (Table 5, Sect. S3 in the Supplement), we suggest that phrasing such as “14 of 15 analysts agree this glacier is vanishing” or “this glacier has disappeared with over 90 % confidence” can serve as an adequate expression of uncertainty (Bokulich and Parker, 2025) depending on the application. Such an approach would benefit from more extensive RR-type experiments designed specifically to assess vanishing glaciers and the limits of their detection.
In addition to the minimum size requirement, the recent SGIs (Linsbauer et al., 2025; GLAMOS, 2025) apply criteria related to “evidence of flow” such as crevasses and deformation features to exclude ice bodies that do not meet the definition of a glacier as per Cogley et al. (2011). Similar approaches are described in, e.g., Leigh et al. (2019) and Fountain et al. (2023), although not all types of crevasses necessarily indicate ice flow (Kellerer-Pirklbauer and Kulmer, 2019). In AGI5, filtering by size (>0.01 km2) and the “visible crevasses” attribute, 396 glaciers covering an area of 265 km2 remain. That is, almost half of the features included in AGI5 would not meet the criteria for inclusion in the SGI. Although the impact of the filter on glacier count is large, the impact on total area is limited with excluded features accounting for only 7 % of total AGI5 area. Despite the differing criteria, AGI3 and AGI5 and SGI2016 and SGI2023 (forthcoming, GLAMOS, 2025) both indicate the disappearance of about 11 % of the total glacier count in the respective inventories.
How to treat disappeared or vanishing glaciers in inventories, how to define when a glacier has disappeared, and what to call glacial remnants that may no longer meet common definitions of a “glacier” are matters of current discussion within the glaciological community (e.g., Pope, 2025; Paul, 2026). Following the approach of previous AGI, AGI5 includes all glacier ice identified in Austria, regardless of size or other criteria. Comparability with other approaches, such as that of the SGI, is achieved with the various data attributes that allow users to filter depending on their use-cases. We concur with Pope (2025), who points out that when a glacier has disappeared depends on “who is asking and why”, and hope that AGI5 can contribute to answering this question in Austria for different types of users and applications.
4.2 Comparison with other inventories and outlook
Comparing total glacier area in Austria in the AGI time series and other inventories, overall area loss trends are consistent although absolute area can vary substantially. For example, AGI2 and AGI3 indicate a larger total glacier area than the roughly contemporary RGI 7 (RGI Consortium, 2023 – Austrian RGI glacier outlines are mainly based on Paul et al., 2011) and the inventories of Sommer et al. (2020). This is likely due in large part to the comparatively coarse resolution of the Landsat source imagery. Paul et al. (2020) noted improved mapping of small features in their 2015–2016 Sentinel-2 inventory, which led to the inclusion of “new” glaciers compared to the RGI. This is reflected by a glacier count of over 1000 in Austria in Paul et al. (2020) versus 800 in the RGI and an improved alignment of the outlines in Paul et al. (2020) with AGI 2.
The number of individual glaciers counted in different inventories generally varies widely, highlighting the influence of different approaches to fragmentation and exclusion of glaciers based on size criteria. Excluding glaciers <0.01 km2 from the AGIs only marginally affects total glacier area but has noticeable impacts on glacier counts. This calls for pursuing a uniform and consistent inventory strategy, at least at the national level. Arguably, the number of glaciers in a given region is not essential for typical applications focusing on hydrology or regional glacier area change. However, such numbers are often included in public communication for general audiences, in particular regarding the number of glaciers that have disappeared in a given time period (e.g., Boyer and Howe, 2025). Depending on the use-case, care should be taken to contextualize glacier counts by explaining specifically what was counted and how “glaciers” are defined (e.g., Pope, 2025; Huss et al., 2025).
Glaciers in Austria are expected to largely disappear well before the end of the century under current warming trajectories, with the greatest losses expected in the coming two to three decades (Hartl et al., 2025b). This overall trend is apparent from all available observational data and from projected future glacier evolution in regional and global modeling studies (e.g., Hanzer et al., 2018; Zekollari et al., 2019; Rounce et al., 2023; Zekollari et al., 2024; Hartl et al., 2025a; Tricht et al., 2025). Since AGI2, updates to the AGIs were compiled in roughly decadal intervals. With recent median area change rates of near −5 % yr−1 and losses expected to accelerate as deglaciation progresses, more frequent updates are needed to provide adequate input for hydrological modeling at catchment scales, biotic succession studies, cartographic material, and other applications that rely on up to date information about local to regional glacier coverage. As has been noted in Alps-wide studies (Paul et al., 2020) and is evident from the effort to compile AGI5 and previous AGI, variable data availability means that inventories often span multiple years and it is rarely possible to obtain complete coverage of a larger region from one year. In Austria, new high-resolution orthoimagery and DEMs become available at irregular intervals, usually on a province-level rather than nationally. Targeted airborne campaigns that combine optical and laserscanning acquisitions during low-snow conditions and centralized data processing and digitization efforts would be very beneficial for systematic inventory updates, but require considerable financial resources.
Besides the availability of adequate source data, the work required for manual digitization of glacier outlines is a key challenge for increasing the update frequency of glacier inventories. Combining manual calibration and quality control with automatic approaches has the potential to substantially reduce the workload. Object based image analysis and deep learning approaches (Strudl, 2024; Diaconu et al., 2025; Maslov et al., 2025) can incorporate auxiliary information in addition to optical imagery, potentially improving the detection of debris-covered ice. Glacier outlines produced for 2015–2016 and 2023 in an automated, deep learning-based approach (Diaconu et al., 2025) indicate area loss rates in a similar range as for the AGI3 to AGI5 period in Austria. However, data coverage is limited and model reliability appears to decrease for very small, debris-covered features.
For further method development aimed at automation, independent reference inventories compiled from high-resolution data sources, such as the AGIs, can serve to quantify potential biases introduced by methodological differences and support model evaluation. Debris cover is likely to remain a central and difficult to quantify source of uncertainty in manual mapping as well as any automated approaches that might be operationalized in the future.
AGI5 provides an updated status report on Austria’s glaciers in 2021–2023, highlighting ongoing glacier recession in all regions. Since AGI3, over 30 % of glacier area has been lost and 95 glaciers have disappeared completely or are no longer mappable. Area change in the highest altitudinal zones above 3000 m is substantial and contributed 22 % of the total losses, indicating that many former accumulation zones have reached a stage of rapid recession and mass loss. The main source of uncertainty in delineating glacier area for AGI5 was the identification of debris-covered glacier ice. The resulting uncertainties for very small glaciers can be large (> ±50 %) but the glaciers with the greatest uncertainties contribute only marginally to total glacier area (approx. 5 %).
With accelerating disintegration processes and glacier disappearance, mapping challenges related to very small, debris-covered features will gain in relative importance for estimating how much glacial ice remains in individual catchments and at regional scales. Inventories compiled from high-resolution source data, ideally taking into account both optical imagery and elevation change information, can help track changes as well as constrain uncertainties.
Observational data documenting ongoing, progressing regional deglaciation are essential for model development and local and regional planning and adaptation processes. We recommend more frequent updates to Austrian glacier inventories than in the past to match the accelerating rates of change. Ideally, such inventories would extend beyond national borders. This poses challenges related to data availability, which might be mitigated by greater integration of high resolution satellite imagery. The compilation of AGI5 showed the potential of community initiatives to coordinate inventory updates. In the future, such efforts – at national or Alps-wide scales – would benefit from targeted data acquisition campaigns, improved automation in glacier detection, and systematic support from established monitoring structures.
The AGI5 outlines are available on the pangaea data repository (Hartig et al., 2026, https://doi.org/10.1594/PANGAEA.991106). The data are also available in GLIMS (GLIMS and NSIDC: Global Land Ice Measurements from Space glacier database at https://doi.org/10.7265/N5V98602, GLIMS Consortium et al., 2005). Code to produce the figures and analyses in this manuscript is available at https://github.com/LeaHartl/inventories (last access: 28 August 2026; https://doi.org/10.5281/zenodo.22145422, LeaHartl, 2026).
The supplement related to this article is available online at https://doi.org/10.5194/tc-20-5157-2026-supplement.
Conceptualization: JA, TB, SC, AHg, LH, KH, BH, AKP, JCO, RP, GS, BS, MSW, MS, HZ. Data curation: LH, AHg, MSW, BS. Formal analysis: AA, GB, TB, SC, AHg, LH, AHt, KH, BH, MK, AKP, AK, JK, MVL, CM, JCO, RP, SP, LR, LS, GS, BS, MSW, MS, MV, HZ. Investigation: LH, AHg. Methodology: LH, AHg, JCO. Validation: CD. Visualization: LH, IH, AHg, SC, MS. Writing (original draft preparation): LH. Writing (review and editing): All co-authors.
At least one of the (co-)authors is a member of the editorial board of The Cryosphere. The peer-review process was guided by an independent editor, and the authors also have no other competing interests to declare.
Publisher's note: Copernicus Publications remains neutral with regard to jurisdictional claims made in the text, published maps, institutional affiliations, or any other geographical representation in this paper. The authors bear the ultimate responsibility for providing appropriate place names. Views expressed in the text are those of the authors and do not necessarily reflect the views of the publisher.
We gratefully acknowledge the departments for geodata of the Federal Provinces of Vorarlberg, Tyrol, Salzburg, and Carinthia, and the BEV for providing essential source datasets and data support. We thank Nina Kirchner, Frank Paul, and an anonymous reviewer for their constructive comments during the review process, as well as Mauro Fischer and Andreas Linsbauer for interesting exchange on the SGI approach and the forthcoming SGI 2023, and Christian Sommer for information on their inventory dataset. R. Prinz and A.C. Kogel are grateful for funding from the University of Innsbruck. This work was partially funded by the Earth System Sciences program of the Austrian Academy of Sciences and the FFG FEMtech program. L. Hartl acknowledges that this research was funded in whole or in part by the Austrian Science Fund (FWF) [10.55776/PAT2089925].
This research has been supported by the Austrian Science Fund (grant no. 10.55776/PAT2089925).
This paper was edited by Christian Haas and reviewed by Nina Kirchner and one anonymous referee.
Abermann, J., Fischer, A., Lambrecht, A., and Geist, T.: On the potential of very high-resolution repeat DEMs in glacial and periglacial environments, The Cryosphere, 4, 53–65, https://doi.org/10.5194/tc-4-53-2010, 2010. a, b, c, d, e, f, g, h
Andreassen, L. M., Nagy, T., Kjøllmoen, B., and Leigh, J. R.: An inventory of Norway's glaciers and ice-marginal lakes from 2018–19 Sentinel-2 data, J. Glaciol., 68, https://doi.org/10.1017/jog.2022.20, 2022. a
Berthier, E., Vincent, C., and Six, D.: Exceptional thinning through the entire altitudinal range of Mont-Blanc glaciers during the 2021/22 mass balance year, J. Glaciol., 70, e30, https://doi.org/10.1017/jog.2023.100, 2024. a
Bertolotti, G., Wiesenegger, H., Seiser, B., and Fischer, A.: Area and volume change of glaciers in the Salzburg region, Austria: a new inventory (2008–2018), PANGAEA [data set], https://doi.org/10.1594/PANGAEA.984878, 2025. a
Bokulich, A. and Parker, W. S.: Understanding data uncertainty, Stud. Hist. Philos. Sci., 112, 90–101, https://doi.org/10.1016/j.shpsa.2025.06.003, 2025. a, b, c
Bolch, T., Menounos, B., and Wheate, R.: Landsat-based inventory of glaciers in western Canada, 1985–2005, Remote Sens. Environ., 114, 127–137, https://doi.org/10.1016/j.rse.2009.08.015, 2010. a
Boyer, D. and Howe, C.: Communication efforts to educate the public about vanishing glaciers, 1958–2025, Ann. Glaciol., 67, e2, https://doi.org/10.1017/aog.2025.10033, 2025. a
Buckel, J. and Otto, J.-C.: The Austrian Glacier Inventory GI 4 (2015) in ArcGis (shapefile) format, PANGAEA [data set], https://doi.org/10.1594/PANGAEA.887415, 2018. a
Buckel, J., Otto, J.-C., Prasicek, G., and Keuschnig, M.: Glacial lakes in Austria-Distribution and formation since the Little Ice Age, Glob. Planet. Change, 164, 39–51, https://doi.org/10.1016/j.gloplacha.2018.03.003, 2018. a, b
Carlson, A. E., Bakken-French, N., Thayne, M., Pappas, S., Molnar, D., and Rood, D.: Disappearing glaciers of the Oregon Cascades, USA, Ann. Glaciol., 67, e1, https://doi.org/10.1017/aog.2025.10037, 2026. a
Cogley, J. G., Hock, R., Rasmussen, L. A., Arendt, A. A., Bauder, A., Braithwaite, R. J., Jansson, P., Kaser, G., Möller, M., Nicholson, L., and Zemp, M.: Glossary of glacier mass balance and related terms, IHP-VII Technical Documents in Hydrology, Vol. 86, UNESCO/IHP, http://unesdoc.unesco.org/images/0019/001925/192525e.pdf (last access: 26 August 2026), 2011. a, b
Conzelmann, S., Seiser, B., Lauria, M. V., Bertolotti, G., Stocker-Waldhuber, M., Fischer, A., and Hartl, L.: Mapping vanishing glaciers in Vorarlberg, Austria, Ann. Glaciol., 67, e10, https://doi.org/10.1017/aog.2026.10044, 2026a. a, b, c, d, e, f, g, h, i, j, k, l
Conzelmann, S., Seiser, B., Fischer, A., Lauria, M. V., Stocker-Waldhuber, M., Bertolotti, G., and Hartl, L.: Vorarlberg (Austria) Glacier outlines, 2017–2020–2022–2023, PANGAEA [data set], https://doi.org/10.1594/PANGAEA.984116, 2026b. a
Diaconu, C.-A., Zekollari, H., and Bamber, J. L.: DL4GAM: A multi-modal deep learning-based framework for glacier area monitoring, trained and validated on the European Alps, Earth Space Sci., 12, e2025EA004197, https://doi.org/10.1029/2025EA004197, 2025. a, b, c, d
Eder, K., Würländer, R., and Rentsch, H.: Digital photogrammetry for the new glacier inventory of Austria, Int. Arch. Photogramm. Remote Sens. Spatial Inf. Sci., 33, 254–261, 2000. a
Fischer, A., Seiser, B., Stocker-Waldhuber, M., and Abermann, J.: The Austrian Glacier Inventory GI 3, 2006, in ArcGIS (shapefile) format, PANGAEA [data set], https://doi.org/10.1594/PANGAEA.844985, 2015a. a, b
Fischer, A., Seiser, B., Stocker Waldhuber, M., Mitterer, C., and Abermann, J.: Tracing glacier changes in Austria from the Little Ice Age to the present using a lidar-based high-resolution glacier inventory in Austria, The Cryosphere, 9, 753–766, https://doi.org/10.5194/tc-9-753-2015, 2015b. a, b, c, d, e, f, g, h, i, j
Fischer, A., Schwaizer, G., Seiser, B., Helfricht, K., and Stocker-Waldhuber, M.: High-resolution inventory to capture glacier disintegration in the Austrian Silvretta, The Cryosphere, 15, 4637–4654, https://doi.org/10.5194/tc-15-4637-2021, 2021a. a, b, c, d
Fischer, A., Stocker-Waldhuber, M., Seiser, B., Helfricht, K., and Schwaizer, G.: Glacier inventory Austrian Silvretta 2017/2018, PANGAEA [data set], https://doi.org/10.1594/PANGAEA.936109, 2021b. a
Fischer, M., Huss, M., Barboux, C., and Hoelzle, M.: The new Swiss Glacier Inventory SGI2010: relevance of using high-resolution source data in areas dominated by very small glaciers, Arct. Antarct. Alp. Res., 46, 933–945, https://doi.org/10.1657/1938-4246-46.4.933, 2014. a, b
Fountain, A. G., Glenn, B., and Mcneil, C.: Inventory of glaciers and perennial snowfields of the conterminous USA, Earth Syst. Sci. Data, 15, 4077–4104, https://doi.org/10.5194/essd-15-4077-2023, 2023. a
Galos, S., klug, C., and Dinale, R.: Short Communication: The 2023 Glacier Inventory for South Tyrol in Context of the Inventories 1997, 2005 and 2017, Geogr. Fis. Din. Quat., 47, 381–388, https://doi.org/10.4454/5agvnb15, 2025. a
Gärtner-Roer, I., Nussbaumer, S. U., Hüsler, F., and Zemp, M.: Worldwide assessment of national glacier monitoring and future perspectives, Mt. Res. Dev., 39, A1–A11, https://doi.org/10.1659/MRD-JOURNAL-D-19-00021.1, 2019. a
Geoland.at: Digitales Geländemodell (DGM) Österreich, https://www.data.gv.at/katalog/datasets/d88a1246-9684-480b- a480-ff63286b35b7 (last access: 26 August 2026), 2015. a
GLAMOS: Swiss Glacier Bulletin 2025, Glacier Monitoring Switzerland, Annual report #146 on glacier observation in Switzerland, Tech. rep., GLAMOS – Glacier Monitoring Switzerland, https://doi.org/10.18752/glbulletin_2025, 2025. a, b, c, d
GLIMS Consortium, Raup, B. H., Racoviteanu, A., Khalsa, S. S., Helm, C., Armstrong, R., and Arnaud, Y.: GLIMS Glacier Database, NSIDC-0272, Version 1, NASA National Snow and Ice Data Center Distributed Active Archive Center [data set], Boulder, Colorado, USA, https://doi.org/10.7265/N5V98602, 2005 (updated 2018). a
Granshaw, F. D. and Fountain, A. G.: Glacier change (1958–1998) in the north Cascades national park complex, Washington, USA, J. Glaciol., 52, 251–256, https://doi.org/10.3189/172756506781828782, 2006. a
Groß, G.: Der Flächenverlust der Gletscher in Österreich 1850–1920–1969, Z. Gletscherkd. Glazialgeol., 23, 131–141, 1987. a, b, c
Groß, G. and Patzelt, G.: The Austrian Glacier Inventory for the Little Ice Age Maximum (GI LIA) in ArcGIS (shapefile) format, PANGAEA [data set], https://doi.org/10.1594/PANGAEA.844987, 2015. a
Haeberli, W., Arenson, L. U., Wee, J., Hauck, C., and Mölg, N.: Discriminating viscous-creep features (rock glaciers) in mountain permafrost from debris-covered glaciers – a commented test at the Gruben and Yerba Loca sites, Swiss Alps and Chilean Andes, The Cryosphere, 18, 1669–1683, https://doi.org/10.5194/tc-18-1669-2024, 2024. a
Hanzer, F., Förster, K., Nemec, J., and Strasser, U.: Projected cryospheric and hydrological impacts of 21st century climate change in the Ötztal Alps (Austria) simulated using a physically based approach, Hydrol. Earth Syst. Sci., 22, 1593–1614, https://doi.org/10.5194/hess-22-1593-2018, 2018. a
Hartig, A., Akguen, A. M., Bertolotti, G., Bolch, T., Conzelmann, S., Hartl, L., Haut, A., Helfricht, K., Hynek, B., Kaucher, M. S., Kellerer-Pirklbauer, A., Kogel, A. C., Krippes, J., Lauria, M. V., Mayer, C., Otto, J.-C. Prinz, R., Proelß, S., Seiser, B., Stocker-Waldhuber, M., Strudl, M., Verhounik, M., Schönleber, L., and Zandler, H.: The Austrian Glacier Inventory GI 5, 2021-2023, as vector files, PANGAEA [data set], https://doi.org/10.1594/PANGAEA.991106, 2026. a
Hartl, L., Helfricht, K., Stocker-Waldhuber, M., Seiser, B., and Fischer, A.: Classifying disequilibrium of small mountain glaciers from patterns of surface elevation change distributions, J. Glaciol., 68, 253–268, https://doi.org/10.1017/jog.2021.90, 2022. a
Hartl, L., Covi, F., Stocker-Waldhuber, M., Baldo, A., Fugazza, D., Di Mauro, B., and Naegeli, K.: Loss of accumulation zone exposes dark ice and drives increased ablation at Weißseespitze, Austria, The Cryosphere, 19, 3329–3353, https://doi.org/10.5194/tc-19-3329-2025, 2025a. a, b
Hartl, L., Schmitt, P., Schuster, L., Helfricht, K., Abermann, J., and Maussion, F.: Recent observations and glacier modeling point towards near-complete glacier loss in western Austria (Ötztal and Stubai mountain range) if 1.5 °C is not met, The Cryosphere, 19, 1431–1452, https://doi.org/10.5194/tc-19-1431-2025, 2025b. a, b
Helfricht, K., Hartl, L., Stocker-Waldhuber, M., Seiser, B., and Fischer, A.: Glacier inventory Ötztal Alps 2017, PANGAEA [data set], https://doi.org/10.1594/PANGAEA.965798, 2024a. a
Helfricht, K., Hartl, L., Stocker-Waldhuber, M., Seiser, B., and Fischer, A.: Glacier inventory Stubai Alps 2017/2018, PANGAEA [dataset], https://doi.org/10.1594/PANGAEA.965791, 2024b. a
Hinzmann, A., Mölg, T., Braun, M., Cullen, N. J., Hardy, D. R., Kaser, G., and Prinz, R.: Tropical glacier loss in East Africa: recent areal extents on Kilimanjaro, Mount Kenya, and in the Rwenzori Range from high-resolution remote sensing data, Environ. Res.: Clim., 3, 011003, https://doi.org/10.1088/2752-5295/ad1fd7, 2024. a
Huss, M. and Fischer, M.: Sensitivity of very small glaciers in the Swiss Alps to future climate change, Front. Earth Sci., 4, 34, https://doi.org/10.3389/feart.2016.00034, 2016. a
Huss, M., Fischer, M., Linsbauer, A., and Bauder, A.: Continuous monitoring of a glacier’s extinction, Ann. Glaciol., 66, e27, https://doi.org/10.1017/aog.2025.10024, 2025. a
Intergovernmental Panel on Climate Change (IPCC): Climate Change 2021 – The Physical Science Basis: Working Group I Contribution to the Sixth Assessment Report of the Intergovernmental Panel on Climate Change, Cambridge University Press, https://doi.org/10.1017/9781009157896, 2023. a
Kellerer-Pirklbauer, A. and Kaufmann, V.: Deglaciation and its impact on permafrost and rock glacier evolution: New insight from two adjacent cirques in Austria, Sci. Tot. Environ., 621, 1397–1414, https://doi.org/10.1016/j.scitotenv.2017.10.087, 2018. a
Kellerer-Pirklbauer, A. and Kulmer, B.: The evolution of brittle and ductile structures at the surface of a partly debris-covered, rapidly thinning and slowly moving glacier in 1998–2012 (Pasterze Glacier, Austria), Earth Surf. Proc. Land., 44, 1034–1049, https://doi.org/10.1002/esp.4552, 2019. a, b
Kellerer-Pirklbauer, A., Avian, M., Benn, D. I., Bernsteiner, F., Krisch, P., and Ziesler, C.: Buoyant calving and ice-contact lake evolution at Pasterze Glacier (Austria) in the period 1998–2019, The Cryosphere, 15, 1237–1258, https://doi.org/10.5194/tc-15-1237-2021, 2021. a
Kuhn, M., Lambrecht, A., and Abermann, J.: The Austrian glacier inventory GI 2, 1998, in ArcGIS (shapefile) format, PANGAEA [data set], https://doi.org/10.1594/PANGAEA.844984, 2015. a
Lambrecht, A. and Kuhn, M.: Glacier changes in the Austrian Alps during the last three decades, derived from the new Austrian glacier inventory, Ann. Glaciol., 46, 177–184, https://doi.org/10.3189/172756407782871341, 2007. a, b
LeaHartl: LeaHartl/inventories: inventories, Version v01.1, Zenodo [computer software], https://doi.org/10.5281/zenodo.22145422, 2026. a
Leigh, J., Stokes, C., Carr, R., Evans, I., Andreassen, L., and Evans, D.: Identifying and mapping very small (<0.5 km2) mountain glaciers on coarse to high-resolution imagery, J. Glaciol., 65, 873–888, 2019. a, b, c
Linsbauer, A., Huss, M., Hodel, E., Bauder, A., Fischer, M., Weidmann, Y., Bärtschi, H., and Schmassmann, E.: The New Swiss Glacier Inventory SGI2016: from a topographical to a glaciological dataset, Front. Earth Sci., 9, 704189, https://doi.org/10.3389/feart.2021.704189, 2021. a, b, c, d, e, f, g, h
Linsbauer, A., Huss, M., Hodel, E., Bauder, A., and Barandun, M.: Vanished glaciers of the Swiss Alps: An inventory-based assessment from 1973 to 2016, Ann. Glaciol., p. 1–24, https://doi.org/10.1017/aog.2025.10031, 2025. a, b, c
Mani, P., Allen, S., Evans, S. G., Kargel, J. S., Mergili, M., Petrakov, D., and Stoffel, M.: Geomorphic Process Chains in High-Mountain Regions – A Review and Classification Approach for Natural Hazards Assessment, Rev. Geophys., 61, e2022RG000791, https://doi.org/10.1029/2022RG000791, 2023. a
Maslov, K. A., Persello, C., Schellenberger, T., and Stein, A.: Globally scalable glacier mapping by deep learning matches expert delineation accuracy, Nat. Commun., 16, 43, https://doi.org/10.1038/s41467-024-54956-x, 2025. a
Mölg, N., Bolch, T., Rastner, P., Strozzi, T., and Paul, F.: A consistent glacier inventory for Karakoram and Pamir derived from Landsat data: distribution of debris cover and mapping challenges, Earth Syst. Sci. Data, 10, 1807–1827, https://doi.org/10.5194/essd-10-1807-2018, 2018. a, b, c
Nussbaumer, S. U., Hoelzle, M., Hüsler, F., Huggel, C., Salzmann, N., and Zemp, M.: Glacier monitoring and capacity building: Important ingredients for sustainable mountain development, Mt. Res. Dev., 37, 141–152, https://doi.org/10.1659/MRD-JOURNAL-D-15-00038.1, 2017. a
Patzelt, G.: The Austrian glacier inventory: status and first results, in: Proceedings of the Riederalp Workshop, September 1978; Actes de l'Atelier de Riederalp, septembre 1978, IAHS Publication, 126, 181–183, https://epic.awi.de/id/eprint/32383/1/Patzelt_1980.pdf (last access: 28 August 2026), 1980. a, b, c
Patzelt, G.: The Austrian glacier inventory GI 1, 1969, in ArcGIS (shapefile) format, https://doi.org/10.1594/PANGAEA.844983, in supplement to: Fischer, Andrea; Seiser, Bernd; Stocker-Waldhuber, Martin; Mitterer, Christian; Abermann, Jakob (2015): Tracing glacier changes in Austria from the Little Ice Age to the present using a lidar-based high-resolution glacier inventory in Austria. The Cryosphere, 9, 753–766, https://doi.org/10.5194/tc-9-753-2015, 2015. a
Paul, F.: When has a glacier disappeared?, Ann. Glaciol., 67, e18, https://doi.org/10.1017/aog.2026.10048, 2026. a, b
Paul, F., Kääb, A., and Haeberli, W.: Recent glacier changes in the Alps observed by satellite: Consequences for future monitoring strategies, Glob. Planet. Change, 56, 111–122, https://doi.org/10.1016/j.gloplacha.2006.07.007, 2007. a
Paul, F., Frey, H., and Le Bris, R.: A new glacier inventory for the European Alps from Landsat TM scenes of 2003: challenges and results, Ann. Glaciol., 52, 144–152, https://doi.org/10.3189/172756411799096295, 2011. a, b
Paul, F., Barrand, N. E., Baumann, S., Berthier, E., Bolch, T., Casey, K., Frey, H., Joshi, S. P., Konovalov, V., Le Bris, R., Mölg, N., Nosenko, G., Nuth, C., Pope, A., Racoviteanu, A., Rastner, P., Raup, B., Scharrer, K., Steffen, S., and Winsvold, S.: On the accuracy of glacier outlines derived from remote-sensing data, Ann. Glaciol., 54, 171–182, 2013. a, b, c, d, e
Paul, F., Winsvold, S. H., Kääb, A., Nagler, T., and Schwaizer, G.: Glacier remote sensing using Sentinel-2. Part II: Mapping glacier extents and surface facies, and comparison to Landsat 8, Remote Sens., 8, 575, https://doi.org/10.3390/rs8070575, 2016. a
Paul, F., Rastner, P., Azzoni, R. S., Diolaiuti, G., Fugazza, D., Le Bris, R., Nemec, J., Rabatel, A., Ramusovic, M., Schwaizer, G., and Smiraglia, C.: Glacier shrinkage in the Alps continues unabated as revealed by a new glacier inventory from Sentinel-2, Earth Syst. Sci. Data, 12, 1805–1821, https://doi.org/10.5194/essd-12-1805-2020, 2020. a, b, c, d, e, f, g, h, i, j, k
Planet Labs PBC: Planet Application Program Interface: In Space for Life on Earth, https://api.planet.com (last access: 28 August 2026), 2022. a
Pfeffer, W. T., Arendt, A. A., Bliss, A., Bolch, T., Cogley, J. G., Gardner, A. S., Hagen, J.-O., Hock, R., Kaser, G., Kienholz, C., et al.: The Randolph Glacier Inventory: a globally complete inventory of glaciers, J. Glaciol., 60, 537–552, 2014. a
Pope, A.: Glacier or not? The importance of nuance in definitions of vanishing glaciers, Ann. Glaciol., 66, e32, https://doi.org/10.1017/aog.2025.10030, 2025. a, b, c, d
Prinz, R., Heller, A., Ladner, M., Nicholson, L. I., and Kaser, G.: Mapping the loss of Mt. Kenya’s glaciers: an example of the challenges of satellite monitoring of very small glaciers, Geosciences, 8, 174, https://doi.org/10.3390/geosciences8050174, 2018. a
Racoviteanu, A. E., Paul, F., Raup, B., Khalsa, S. J. S., and Armstrong, R.: Challenges and recommendations in mapping of glacier parameters from space: results of the 2008 Global Land Ice Measurements from Space (GLIMS) workshop, Boulder, Colorado, USA, Ann. Glaciol., 50, 53–69, 2009. a, b, c, d
Raup, B. H., Andreassen, L. M., Boyer, D., Howe, C., Pelto, M., and Rabatel, A.: Tracking extinct glaciers in GLIMS, Ann. Glaciol., 66, e35, https://doi.org/10.1017/aog.2025.10027, 2025. a
RGI Consortium: Randolph Glacier Inventory - A Dataset of Global Glacier Outlines, NSIDC-0770, Version 7, NASA National Snow and Ice Data Center Distributed Active Archive Center [data set], Boulder, Colorado USA, https://doi.org/10.5067/F6JMOVY5NAVZ, 2023. a, b
Rounce, D. R., Hock, R., Maussion, F., Hugonnet, R., Kochtitzky, W., Huss, M., Berthier, E., Brinkerhoff, D., Compagno, L., Copland, L., et al.: Global glacier change in the 21st century: Every increase in temperature matters, Science, 379, 78–83, https://doi.org/10.1126/science.abo1324, 2023. a
Sommer, C., Malz, P., Seehaus, T. C., Lippl, S., Zemp, M., and Braun, M. H.: Rapid glacier retreat and downwasting throughout the European Alps in the early 21st century, Nat. Commun., 11, 3209, https://doi.org/10.1038/s41467-020-16818-0, 2020. a, b, c, d, e
Strudl, M.: “Veränderung der Gletscher und deren Gesteinsbedeckung am Kaunergrat in 75 Jahren” Klassifizierung der Luftbilder von 1945 bis 2020 mittels OBIA, Master thesis, Paris Lodron-Universität Salzburg, https://unigis.at/files/Mastertheses/Full/106918.pdf (last access: 28 August 2026), 2024. a, b, c
The GlaMBIE Team: Community estimate of global glacier mass changes from 2000 to 2023, Nature, 639, 1–7, https://doi.org/10.1038/s41586-024-08545-z, 2025. a
Tricht, L. V., Zekollari, H., Huss, M., Rounce, D. R., Schuster, L., Aguayo, R., Schmitt, P., Maussion, F., Tober, B., and Farinotti, D.: Peak glacier extinction in the mid-twenty-first century, Nat. Clim. Change, 16, https://doi.org/10.1038/s41558-025-02513-9, 2025. a
Van Tiel, M., Van Loon, A. F., Seibert, J., and Stahl, K.: Hydrological response to warm and dry weather: do glaciers compensate?, Hydrol. Earth Syst. Sci., 25, 3245–3265, https://doi.org/10.5194/hess-25-3245-2021, 2021. a
Van Tiel, M., Huss, M., Zappa, M., Jonas, T., and Farinotti, D.: Swiss glacier mass loss during the 2022 drought: persistent streamflow contributions amid declining melt water volumes, Hydrol. Earth Syst. Sci., 30, 23–43, https://doi.org/10.5194/hess-30-23-2026, 2026. a
Voordendag, A., Prinz, R., Schuster, L., and Kaser, G.: Brief communication: The Glacier Loss Day as an indicator of a record-breaking negative glacier mass balance in 2022, The Cryosphere, 17, 3661–3665, https://doi.org/10.5194/tc-17-3661-2023, 2023. a
Wagner, T., Pleschberger, R., Kainz, S., Ribis, M., Kellerer-Pirklbauer, A., Krainer, K., Philippitsch, R., and Winkler, G.: The first consistent inventory of rock glaciers and their hydrological catchments of the Austrian Alps, Austrian J. Earth Sci., 113, https://doi.org/10.17738/ajes.2020.0001, 2020a. a, b
Wagner, T., Ribis, M., Kellerer-Pirklbauer, A., Krainer, K., and Winkler, G.: The Austrian rock glacier inventory RGI_1 and the related rock glacier catchment inventory RGCI_1 in ArcGis (shapefile) format, PANGAEA [data set], https://doi.org/10.1594/PANGAEA.921629, 2020b. a
WGMS: Fluctuations of Glaciers (FoG) Database, https://doi.org/10.5904/wgms-fog-2025-02, 2025. a
Zandler, H., Sulzer, W., and Kaufmann, V.: Delineation of debris-covered glaciers with multi-temporal UAV images (Gössnitzkees, Schober Group/Austria), Advances in Geodesy and Geoinformation, 74, e66, 1–17, https://doi.org/10.24425/agg.2025.154150, 2025. a, b
Zekollari, H., Huss, M., and Farinotti, D.: Modelling the future evolution of glaciers in the European Alps under the EURO-CORDEX RCM ensemble, The Cryosphere, 13, 1125–1146, https://doi.org/10.5194/tc-13-1125-2019, 2019. a
Zekollari, H., Huss, M., Schuster, L., Maussion, F., Rounce, D. R., Aguayo, R., Champollion, N., Compagno, L., Hugonnet, R., Marzeion, B., Mojtabavi, S., and Farinotti, D.: Twenty-first century global glacier evolution under CMIP6 scenarios and the role of glacier-specific observations, The Cryosphere, 18, 5045–5066, https://doi.org/10.5194/tc-18-5045-2024, 2024. a
Zemp, M., Armstrong, R., Gärtner-Roer, I., Haeberli, W., Hoelzle, M., Kääb, A., Kargel, J. S., Khalsa, S. J. S., Leonard, G. J., Paul, F., and Raup, B. H.: Introduction: Global Glacier Monitoring – a Long-Term Task Integrating in Situ Observations and Remote Sensing, Springer Berlin Heidelberg, Berlin, Heidelberg, 1–21, https://doi.org/10.1007/978-3-540-79818-7_1, 2014. a