
the Creative Commons Attribution 4.0 License.
the Creative Commons Attribution 4.0 License.
 | 09 Sep 2026
Mélange, landfast sea ice, ice velocities: What controls seasonal calving rates in North West Greenland?
Sofie Hedetoft
Olivia Bang Brinck

Andrea M. U. Gierisch
Steffen Malskær Olsen
Martin Olesen
Nicolaj Hansen
Anders Anker Bjørk
Erik Loebel
Anne Solgaard
Peter Thejll
Calving glaciers in Greenland frequently exhibit seasonal cycles of terminus advance and retreat and changes in ice velocity and calving rate associated with changing air temperatures, surface melt rates and local sea ice conditions. Landfast sea ice that forms each winter in Greenland and glacier mélange (sikussaq) are part of a continuum of ice forms in front of marine-terminating outlet glaciers, posited to offer a buttressing effect on marine calving glaciers equivalent to floating ice shelves and potentially thereby helping to reduce the risk of marine ice sheet instability feedbacks. However, the role of mélange in controlling calving rates and front position is controversial, with previous studies showing mixed results and limited effects on terminus ice velocities. Here, we use a comprehensive range of different types of data including a novel in situ dataset of high time resolution GNSS position information, combined with satellite datasets of ice velocity and calving front position for three representative glaciers in north west Greenland. Our study at the Tracy, Melville, and Farquhar glaciers took place during the period from late winter (March) to peak melt season (July) in 2022 and 2023. Seasonal variations in outlet glacier velocity, calving activity and terminus position vary in-step with the seasonal cycle of air temperature and landfast sea ice formation and break-up. Our observations are consistent with previous granular material theoretical frameworks where fast ice acts to delay the removal of mélange. We also observe large calving events at the peak of the fast ice season suggesting that neither landfast ice nor mélange fully suppress calving activity. We find no evidence of tidally driven movements within the mélange zone during the fast ice season. Our observations show that the unbonded mélange at these outlet glaciers has very little influence on glacier velocity or calving rates and it is only when the separate ice blocks in the mélange zone are frozen into a matrix of landfast sea ice, losing the granular material properties that are characteristic of mélange but more associated with rigid multiyear sea ice, that they appear to exert any kind of (limited) influence on the calving rates. Our observations form a comprehensive and useful dataset for evaluating models of mélange interactions and developing insights into the material properties of fast ice and mélange. We conclude that at these representative small and medium-sized Greenland outlet glaciers, factors including surface melt and glacier velocity as well as the presence of landfast sea ice bonding mélange modulate seasonal calving behaviour.
- Article
(13751 KB) - Full-text XML
- BibTeX
- EndNote


Calving outlet glaciers are found discharging icebergs all around the Greenland coast but processes that control the rate at which icebergs break off as well as the frontal position of the calving termini remain poorly parameterised in glacier and ice sheet models (Seroussi et al., 2020; Goelzer et al., 2020). Together with submarine melt, calving processes account for around half of the total ice mass loss from the Greenland ice sheet, with the remainder lost via melt and runoff of surface snow and ice (Otosaka et al., 2023; Shepherd et al., 2020). Inadequate representation of calving in ice sheet models therefore also results in an underestimation of future rates of sea level rise (Goelzer et al., 2020). Calving and the melt of calved icebergs are also important controls on Greenland fjord circulation (Moon et al., 2018) and likely on the upwelling processes that drive biological productivity (Meire et al., 2017). However, the calving process itself is complex with multiple proposed controlling and interacting factors such as glacier hydrology, basal meltwater plumes, ocean circulation, bed topography, and heat flux in both the atmosphere and the ocean as well as frontal ice mélange (Benn et al., 2007). Ice mélange, the mixture of icebergs, calf ice and sea water in front of marine terminating glaciers, has been described as the world's largest granular material (Amundson et al., 2020). It forms a thick, and often impenetrable to humans, mass of calved icebergs at all size scales in front of calving outlet glaciers and is particularly prominent in Greenland and parts of Antarctica. It is a characteristic of many fast moving calving termini in Greenland, where it is seasonally glued together by landfast sea ice during the winter. Sometimes known as sikussaq, from an underdetermined etymology (see e.g. discussion in Fraser, 2012), we here use the term mélange that has become more widely used in recent years in the glaciological literature. The disputed importance of mélange as a buttress to calving glacier termini has led to a great deal of recent interest in mélange processes and in the development of parameterisations of mélange buttressing in ocean and ice sheet models (e.g. Amundson et al., 2020; Wehrlé et al., 2023; Krug et al., 2015; Cassotto et al., 2021; Robel, 2017; Vaňková, 2021; Crawford et al., 2021). However, there is little in situ data across seasons with sufficient temporal resolution and spatial coverage to test these models and much of the literature is contradictory as to the importance of mélange on calving processes. In this paper we focus on the role of mélange and landfast sea ice as one of several processes modulating calving rates in Greenland with a particular focus on the late winter, spring and early summer period when the sea ice declines from its maximum extent and thickness in north west Greenland.
1.1 The Role of Ice Mélange in calving glaciers
The scientific community disagrees on the extent to which mélange directly impacts calving rates or vice versa (Robel, 2017; Krug et al., 2015; Crawford et al., 2021). Some studies have pointed towards the mélange as a mechanical inhibitor of the calving, where calving happens after a removal or substantial weakening of ice mélange, thus placing it as a controlling factor (Amundson et al., 2010; Cassotto et al., 2021; Krug et al., 2015). Multiple studies (Krug et al., 2015; Bevan et al., 2019; Cook et al., 2021) suggest mélange can prevent crevasse propagation and thereby hinder and limit calving. It has also been suggested that calving activity can influence the properties of the mélange through the generation of waves resulting in mélange dispersal and increased fracturing, thereby weakening the buttressing effect, potentially increasing further calving activities (Amundson et al., 2010). Joughin et al. (2020) suggest that ocean temperatures control the retreat and advance of marine-terminating outlet glaciers in Greenland, via changes in mélange rigidity that helps to modulate the velocity of the mélange as it moves down the fjord, pushed by the outlet glacier. However, other studies underline that the buttressing effect of the mélange depends on characteristics in the mélange such as presence of landfast sea ice (Moon et al., 2015; Robel, 2017). Studies in Antarctica for example, Ochwat et al. (2024); Fraser et al. (2021, 2023) suggest that mélange is less significant than thick multi-year sea ice in exerting a buttressing effect on outlet glaciers and can also explain seasonal calving dynamics (Greene et al., 2018). The importance of mélange may also vary from glacier to glacier depending on the cohesion and density of the mélange (Wehrlé et al., 2023). In this study we focus on the seasonal change in mélange velocities, driven by the formation and break up of landfast sea ice, which at many locations in Greenland acts as a seasonal glue, sticking together individual icebergs and smaller growlers and bergy bits within the mélange zone, and connecting the mélange to the wider fjord, ocean and sea ice system. Many studies of mélange in Greenland have focused on Jakobshavn Isbræ or Helheim glaciers. These are very large and constantly calving outlets of the ice sheet in long narrow fjords that may not be representative of other smaller and slower Greenland outlets where icebergs also calve to form a mélange zone that is seasonally frozen into landfast sea ice. Work by Nissanka et al. (2025) for example, also shows the importance of fjord geometry on mélange processes based on laboratory experiments. Similarly, analogies from Greenland may not be applicable at Antarctic ice fronts where, along with generally colder conditions that likely affect ice material properties, there is also a very broad range of geometries ranging from narrow fjords (Surawy-Stepney et al., 2024), to embayments (Christie et al., 2022) and large open ice shelf fronts (Greene et al., 2018). It is thus important to consider local factors in studying ice mélange interactions with glaciers and landfast sea ice in order to make generalisable conclusions.
In this study we combine high time resolution field observations and analysis of satellite data from Northwest Greenland to assess the combined influence of ice mélange and landfast sea ice on typical calving outlet glaciers. Based on field observations in the winter period we suggest defining an inner mélange zone with very dense iceberg particles that can jam against each other (as in e.g. Peters et al., 2015) and an outer mélange zone with a lower concentration of icebergs (see Fig. 2). The inner zone is difficult to access and our field study is mostly limited to the landfast sea ice and between the large icebergs of the outer zone. The distinction of zones is clear from satellite imagery from the summer open water period (see Fig. 1), but we note also that the mélange migrates considerably in the summer period after the break up of landfast sea ice and the distinction between inner and outer zones does not always hold (see also the Video Supplement).
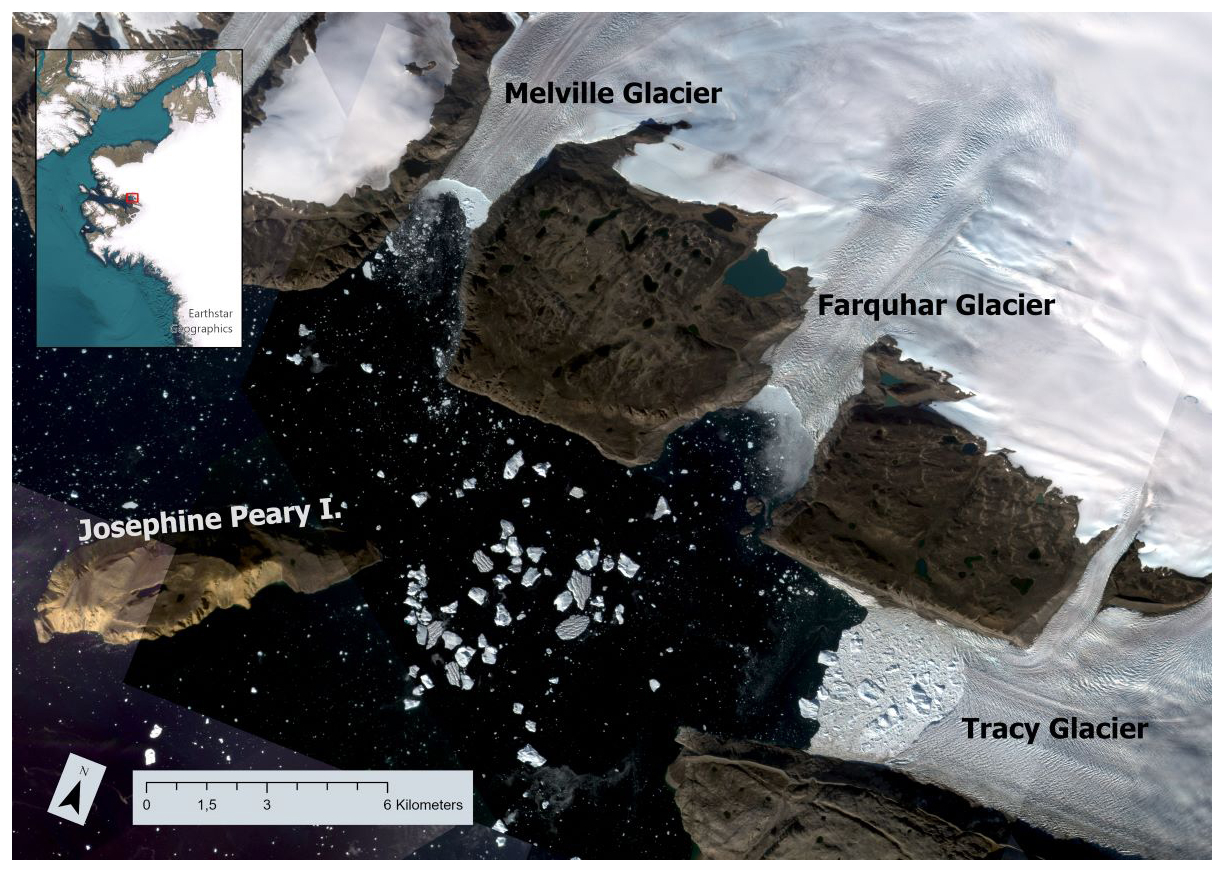
Figure 1Map of Inglefield Fjord with the three study glaciers Tracy, Farquhar, and Melville marked as well as Josephine Peary Island (Qeqertarssussarssuaq). The basemap is a mosaic of optical satellite images between 25 and 29 August 2022 obtained from Planet labs (https://planet.com/explorer, last access: 3 August 2026).
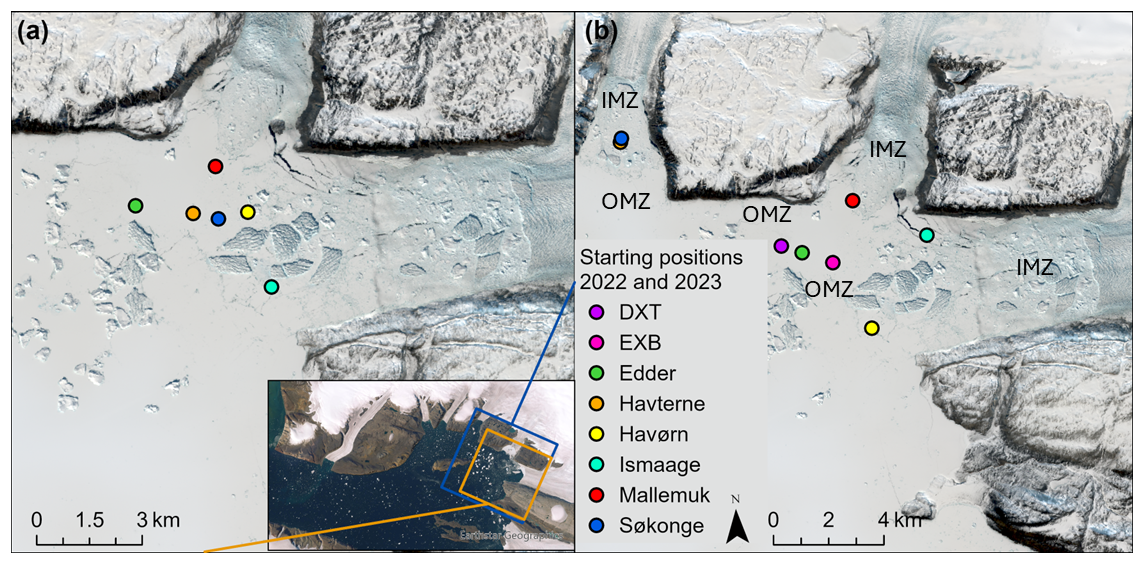
Figure 2Starting positions of the buoys in 2022 (a) and 2023 (b). The basemap is Sentinel-2 from 25 May 2024, processed on Sentinel Hub EO Browser using a natural colour optimisation (, ). Note the different spatial scales. We also label the inner (IMZ) and outer (OMZ) mélange zones as discussed above. While a subjective label, the inner zone reflects much rougher and likely thicker mélange with larger numbers of large icebergs that are very difficult to access. The OMZ is also difficult to access with many icebergs but also includes some areas of flatter sea ice that permits access on foot.
1.2 Glaciology of Inglefield Fjord
Inglefield Bredning (Kangerlussuaq) is a wide gulf in Northwest Greenland with many glaciers discharging into the fjord that feeds it. Melville, Farquhar, and Tracy glaciers (Qeqertaarsuusarsuup Sermia, Toornaarsulissuup Sermii, and Tuttulipalluup Sermia in Greenlandic (Bjørk et al., 2015)) are located next to each other at around 77.6° N and 66.4° W, with their marine-terminating glacier fronts feeding into a common area at the head of Inglefield Fjord. The study area is visualised in Fig. 1.
Glaciers in the region have been well studied, particularly Tracy and Heilprin glaciers due to their contrasting recent retreat behaviour and to a lesser extent Melville and Farquhar glaciers have also been included in studies by for example, Sakakibara and Sugiyama (2020) and Willis et al. (2018). According to Sakakibara and Sugiyama (2018), Tracy glacier has recorded a consistent retreat since the 1980s and from 1980s–2014 it had the most rapid retreat of all glaciers in the area, with an average rate of 200 ± 1 m yr−1, twice as fast as Farquhar (94 ± 3 m yr−1). The onset of Farquhar's retreat took place after the separation of Farquhar and Tracy's shared glacier terminus in a floating ice tongue in the summer of 2002 (Sakakibara and Sugiyama, 2018). The geometry of the glacier fronts changed completely after the separation, as two separate tidewater glaciers were created, resulting in a notable change in the force balance of both Farquhar and Tracy. The new force balance combined with increasing meltwater enhancing basal sliding resulted in an ice velocity acceleration (Sakakibara and Sugiyama, 2018). Today, the ice mélanges of Farquhar and Tracy are also blended together in the winter season until the break-up of sea ice at the head of Inglefield Fjord in July. Melville is the glacier with the lowest retreat rate of the three. It is located west of Farquhar and experienced a general retreat of 48 ± 1 m yr−1 from 1980s–2014 (Sakakibara and Sugiyama, 2018). As with virtually all glaciers in Western Greenland, the glaciers of Inglefield Bredning are characterised by vertical thinning and retreat over the last decades. According to Wang et al. (2021), Tracy and Farquhar have the highest rates of elevation change in the fjord system at −3.91 ± 0.13 and −2.91 ± 0.18 m yr−1 from 2001–2018, respectively. The elevation change of Melville during the same period was −1.73 ± 0.38 m yr−1, similar to the mean rate of outlet glaciers in Inglefield Bredning but larger than the average thinning at glaciers across Baffin Bay. Ocean observations by Willis et al. (2018) suggest that the rapid retreat of Tracy glacier is in part related to ocean warming and plume dynamics at the glacier front. In contrast, they suggest the lack of retreat and acceleration at neighbouring Heilprin glacier is most likely due to an outlet glacier front grounded in shallower water, though we note bathymetric data at all outlet glaciers is not well constrained. The three study glaciers differ in size; Tracy is the largest glacier with an area of 222.93 km2, while Melville and Farquhar have areas of 118.52 and 53.74 km2, respectively (Wang et al., 2021). In our study period, the measured width of the calving fronts in 2023 from satellite imagery was approximately 1.5 km for Melville, 2 km for Farquhar and 4 km for Tracy. All three glaciers are found in their own narrow fjords that widen out into the head of the larger Inglefield Fjord. Farquhar and Melville have shorter internal fjords of about 2 km and 3 km each compared to Tracy Glacier's inner fjord length of 4.5 km (in 2022). Observations by Willis et al. (2018) confirm measurements reported in this study and in Rasmussen et al. (2021) of a warmer Atlantic layer situated below 200 m depth throughout the fjord system, consistent with other fjords in Western Greenland, indicating that turbulent mixing caused by subglacial plumes likely play a key role in submarine melt at these glacier termini (Cowton et al., 2023; Slater et al., 2022). Unfortunately, the ocean depths in front of all three retreating glaciers in the study region are poorly known and mostly inferred from model inversions and limited radar observations (Willis et al., 2018; Morlighem et al., 2017). Bathymetric mapping of Inglefield Bredning using single beam echo sounding has been carried out as part of the Ocean Melting Greenland project (Willis et al., 2018) but survey lines do not reach the mélange zone or current frontal position of the Tracy glacier. The study glaciers represent a range of shallower and deeper grounded glaciers, all of which can be seen to transiently float, leading to the occasional calving of tabular icebergs, observed in satellite imagery (see Fig. 1). These different types of outlet glaciers are representative for Greenland calving termini (Solgaard et al., 2022) and the calving styles on display also match those classified by Bézu and Bartholomaus (2024). Ice mélange is typically present throughout the year in this region and it's relative accessibility from the nearby town of Qaanaaq provides an ideal process study site.
In this study we focus on the seasonal to annual cycle of calving, mélange and landfast sea ice. We focus in particular on the winter to early summer period when seasonal changes in fast ice provide a natural experiment to determine the role of mélange and landfast sea ice in buttressing glacier termini that is relevant to other calving glacier systems in Greenland. The winter landfast ice forms first at the head of the fjord likely aided by cold, fresh meltwater from outlet glaciers, advances from November through April towards the mouth of the fjord with maximum thickness and extent in April and May. From June through to July and in some years early August, the break-up of fast ice is observed gradually in different regions of the fjord. In this study we used manual inspection of satellite remote sensing imagery to identify the expansion and loss of land fast sea ice into the mélange zone as well as to classify calving activity at glacier termini. Our aim however, is also to collect observational data that can be used for the development of ice sheet – ocean models that include mélange and sea ice processes. The area is readily accessible by dog sled in collaboration with local hunters and fishers enabling the installation and retrieval of field equipment over the course of multiple field visits.
2.1 In situ observations
2.1.1 Mélange velocity from tracking buoys using GNSS
In order to monitor the movement of the mélange with higher time-frequency than would be possible by satellite as in other studies (e.g. Wehrlé et al., 2023; Bevan et al., 2019), we deployed buoys in the mélange zone that recorded their position using GNSS at least every 30 min and transmitted this information using the Iridium communication network. We used two different buoy systems, TRUSTED and OMB in this study. TRUSTED buoys use a proprietary tracker system supplied by Danish company Trusted A/S (https://trustedglobal.com, last access: 3 August 2026), who designed and built the mounting of the GPS-tracker to a float specifically for our use case. These devices are very robust but position recording settings are limited to few possibilities. OMB buoys, on the contrary, are open source instruments (Rabault et al., 2022) with details available at https://github.com/jerabaul29/OpenMetBuoy-v2021a (last access: 10 July 2024). Hence these instruments are fully customisable and our OMB buoys were set to record their positions every 10 or 15 min. Pictures and more details about the two buoys systems, including position uncertainty estimates are given in Table 1.
Table 1Specifications and pictures of the two buoy systems used in this study. The picture of the OMB is taken in the mélange in front of Melville glacier, with large tabular icebergs visible in the background.
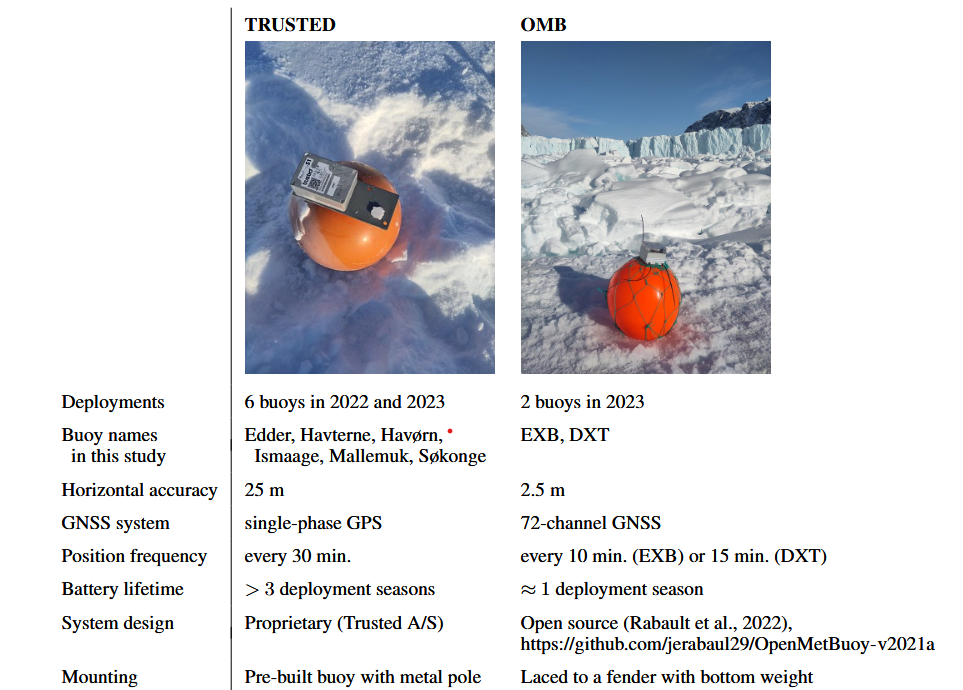
The TRUSTED buoys are a proprietary system that also record and transmit data including unit temperatures and battery life. Absolute coordinates are given in decimal degrees to 4 significant figures, which limits the position precision, but the buoys are robust and have a long battery life that allows them to be retrieved and redeployed over successive field seasons. The instrument is sealed in a metal box and attached to a float on a long metal rod that allows it to be deployed in a hole drilled into sea ice and to float when the ice breaks up. Sea ice thickness and snow depth on top of the sea ice was also measured during deployment. The two OMBs were attached to inflated boat fenders and held upright by chains drilled through the ice. The plastic boxes containing the instruments were sealed with silicone prior to deployment. The buoys were deployed in the mélange zone at the end of March or in early April, when conditions allowed for travelling with dog sledges. When the landfast ice broke up in July, the floating buoys were recovered by boat by partners in the local community of Qaanaaq and could hence be re-deployed the year after. In March 2022, 6 buoys of type TRUSTED were deployed in the mélange of Tracy and Farquhar glaciers only. In March 2023, 8 buoys (6 TRUSTED and 2 OMB) were deployed in the mélange of all three glaciers Tracy, Farquhar, and Melville. The deployment locations are shown in Fig. 2a for March 2022 and Fig. 2b for March 2023, respectively. The end of the study period is defined by the melt/break-up of the mélange. These dates could easily be identified from the buoy position datasets as the buoy drift pattern changes noticeably when the buoys start to float in water, and was confirmed by inspection of satellite imagery from the period. Hence, the buoy dataset covers the period of end of March to mid July. Velocity estimates of the mélange are derived from the recorded buoy positions. Due to uncertainty in the position data, especially of the TRUSTED buoys with limited accuracy (see Table 1), daily averaged positions of all buoys were used to calculate the daily mean velocity, which is the distance that buoys moved between two days (applying Geoprocessing tools in ArcGIS Pro). By investigating the buoy tracks on those days with especially high velocities, we additionally obtained the exact timing and total distance of several distinct abrupt buoy movement events and used these to identify specific drivers.
As an initial analysis suggested a possible diurnal cycle visible in OMB positions, and given the results of Cassotto et al. (2021), we carried out a spectral analysis of the velocity data to check if diurnal or tidal cycles were present. For this, instantaneous OMB-buoy velocities were deduced from the non-averaged position data available every 10 or 15 min. The resulting east–west and north–south components of the velocity were analysed for their dispersion. Additionally, power-spectra of the drift speed were calculated. As the velocity data are unevenly spaced and have gaps we used a Lomb-Scargle method (VanderPlas, 2018) to determine the power-spectra. A Hanning window was applied to taper the data to avoid spectral leakage and enable more accurate separation of signals.
2.1.2 Ocean observations
Ocean temperature and salinity profiles in the melange region of each glacier were measured during the deployment of the OMB and Trusted systems both in 2022 and 2023. We made use of newly calibrated Seabird SBE19plusV2 CTD (conductivity, temperature and density) instrument with auxiliary sensors, deployed through a 0.3 m hole in the fast ice. Near full depth profiles were obtained and, together with analysis of a 14 year dataset assembled in the region, are currently in preparation for publication in a separate article.
2.2 Remote sensing data
We supplemented data on mélange deformation from in situ data with remote sensing observations. These included both pre-processed ice velocity and calving front data, as well as novel datasets produced in this study. The purpose of the data comparison was to observe calving events, to estimate the location of the calving fronts and the size of the icebergs, as well as to identify transient clearing of ice mélange and the seasonal break-up of sea ice. The occurrence of melt water plumes at the surface and the movements and characteristics of large icebergs within the mélange zones (see Table A1 in the Appendix) were also recorded but not further examined in this study. We also used Solgaard et al. (2022)'s seasonal ice velocity product derived from feature tracking Sentinel-1 data to assess how representative the GNSS buoy velocities measured in situ are across the mélange zone of the study glaciers.
2.2.1 Calving Dynamics from Earth Observations
We identified the calving events on the three glaciers by analysing the changing position of their calving fronts. For this, we used a dataset that was generated by a deep learning application on the multispectral Landsat satellite imagery (Loebel et al., 2024). The dataset defined 112 different calving front locations for Farquhar and Tracy and 81 for Melville in 2022 and 109 for all three glaciers in 2023.
In order to check the accuracy of the dataset and thus the analysis, we compared the deep learning-extracted calving fronts with a manually delineated dataset consisting of 92 fronts on Tracy Glacier in 2022. Pre- and post-processing of the data with the Feature Manipulation Engine (FME) were, along with the ArcGIS toolbox Glacier Terminus Tracking Tool (GTT) (Urbanski, 2018), used to obtain an overview of days with large movements between two consecutive days indicating calving. The fronts were manually delineated with the GEEDiT tool developed in Lea (2018) and the deviation between the two calving front types were measured with a workbench created with FME (workbenches are archived for reproducibility see the “Methods and data” section). The median deviation across the front is 28 m. This deviation aligns with the one originally calculated by Loebel et al. (2024). However, in the context of day to day calving activity this imprecision is high. We also detected multiple days where the deep learning-extracted calving fronts did not follow the correct calving front, but followed the position of the mélange instead of the ice. We therefore supplemented our identification of calving dynamics calculated based on the automated calving fronts with human assessed satellite observation to more precisely identify the daily changes. Despite the limitation of the optical satellite on cloudy days without data coverage, close inspection of the satellite did allow us to identify the approximate time of many large calving events in 2022 and 2023 for all three glaciers. The areal size indicated by the lost area of these events were calculated in ArcGIS Pro based on the automated calving fronts and daily Sentinel-2 imagery.
This key part of our analysis furthermore allowed us to connect satellite observed calving events and sea ice break-up timing with in situ buoy observations to understand the magnitude and timing of calving and mélange processes in the wider climate context of melt onset and the sea ice conditions.
2.2.2 Glacier and mélange velocity detected from satellite remote sensing
To assess the connection between outlet glacier velocity and mélange velocities, including the point measurements of in situ data, we used an ice velocity data product derived from the Sentinel-1 SAR data processed and published by PROMICE (Solgaard et al., 2021). The 20 m resolution data product is continuously updated to give ice velocity with a 12 d gap across the Greenland Ice Sheet. The dataset is not masked to the ice sheet only, and thus includes areas of mélange at our study site. This enables us to compare satellite velocities with the in situ observed velocities. We selected two flowline points at higher and lower elevation on the three study glaciers as well as coordinates corresponding to the mélange in front of the glaciers, to compare time series of velocities derived by satellite with the in situ buoy measurements.
2.3 Regional climate and surface mass budget modelling
Previous work (Surawy-Stepney et al., 2024; Christie et al., 2022; Cassotto et al., 2015) link break-up and calving dynamics with seasonal atmospheric drivers, in particular thinning of sea ice and glacier surface melt and run-off driven by warming summer temperatures and wind forcing of mélange movements. We use two climate datasets to evaluate the importance of the surface boundary layer on mélange movements. The Copernicus Arctic Regional Reanalysis (CARRA) is a very high resolution (2.5 km) climate reanalysis that is updated in near real-time and has been shown to be particularly effective at capturing near-surface winds and sea ice (Køltzow et al., 2022). In this study we use the 6 hourly output wind field to assess if mélange velocities can be explained by persistent wind forcing. As CARRA does not include complex glacier surface processes, we also use surface melt and SMB driven by output from the HIRHAM5 regional climate model (RCM) (Langen et al., 2017). In this study, HIRHAM5 is forced with the ERA-5 (Hersbach et al., 2020) climate reanalysis data to identify the onset of melt and to quantify the amount of melt produced at the study glaciers. HIRHAM5 is run at a horizontal resolution of 0.05 × 0.05 ° (5.5 km) on a rotated polar grid and has been shown to resolve the local climate well in this region (Lucas‐Picher et al., 2012). The RCM outputs are further used to drive a detailed offline SMB model with 32 vertical levels (Langen et al., 2015, 2017), which, as analysis with in situ observations shows, reproduces observed firn processes like temperature and density well (Hansen et al., 2021; Vandecrux et al., 2024). Assessing uncertainties in climate, SMB and melt data is difficult in this region as we lack observations from low elevations, however a recent analysis of the simulation by Puggaard et al. (2025) shows that HIRHAM performs well in both timing of melt onset as well as total number of melt days at higher elevations when compared with ASCAT satellite data. In this study we use the modelled outputs largely to assess timing of the onset of melt and runoff and the relative magnitude of melt events.
3.1 Mélange Dynamics
The GNSS position observations show a consistent pattern of movement spatially and temporally in both 2022 and 2023 in Figs. 3 and 4, with mélange moving slowly but continuously away from the glacier fronts, with occasional abrupt jumps in position recorded. The mélange velocities when bounded by landfast sea ice have a uniform and steady flow, but are slightly faster, particularly during abrupt movements, closer to the glacier fronts, and slower further away, with the direction of movement suggesting that the larger Tracy glacier has a greater influence on ice mélange velocity than the other two termini. This would also indicate that Tracy is less sensitive to any buttressing effects from mélange and fast ice. The large abrupt extensional movements that intersperse the steady ice mélange drift are shown in Figs. 3 and 4. The buoys in the mélange have slightly different median velocities in the range of 7.6–11.3 m d −1 in 2022 and 1.4–9.7 m d−1 in 2023. Note though that between the two field seasons the buoys were placed in different relative positions across the fjord, due to access differences between the seasons. Our results indicate however that proximity to the glacier front as well as location relative to centre line of fast-flowing ice can explain differences in velocity, but a longer term and more spatially dispersed dataset is necessary to fully determine this. Future deployments will allow us to increase the area observed in both time and space. The large number of large icebergs close to Josephine Peary Island shown in both Figs. 1 and 3 are likely grounded, and form a stabilising location for the mélange where extensional movements gradually fall off. The location coincides with the former location of the ice tongue that broke up in 2002 and is probably a submarine moraine ridge. The abrupt movement events that we have identified in the record happen within the same 10–30 min time intervals of all the GNSS buoys. It is therefore unfortunately not possible given the precision of the instruments to assess how quickly the signal travels between the buoys. We observe though, that in addition to happening concurrently, the measured speeds decrease with distance from the glacier. Our data indicates that the largest of the measured abrupt movements represented up to 804 m of horizontal movement near Tracy Glacier during the half hour measurement period. These large abrupt movements correlate with large calving events at the glacier front (see Table A1). The observations in Figs. 3 and 4 also do not show much change in average velocity of the mélange through the season until the landfast sea ice break up approaches in mid July.
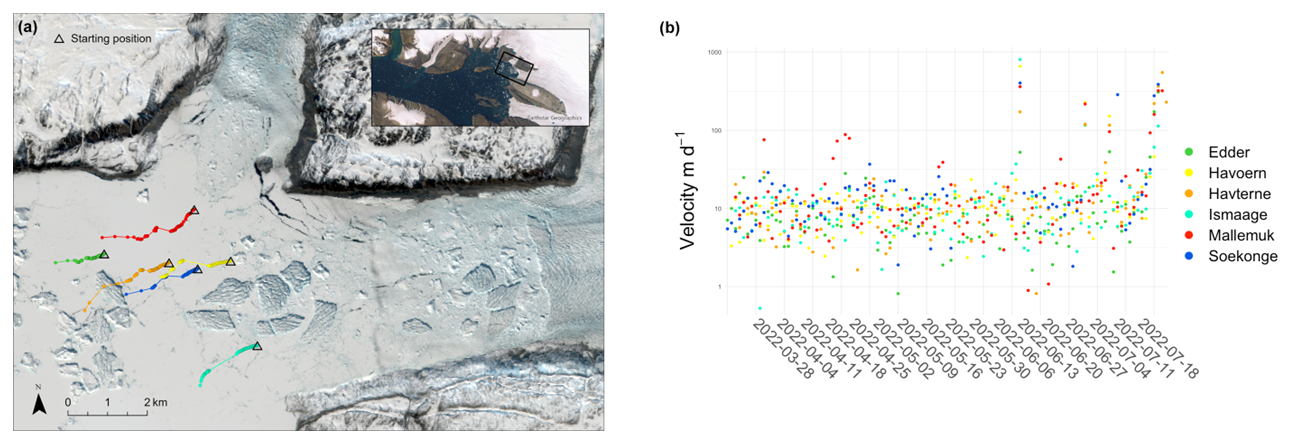
Figure 3Movement of the TRUSTED buoys in the mélange of Tracy and Farquhar glaciers averaged over the day from the end of March until mid-July 2022. The basemap in (a) is an image from the Sentinel-2 satellite from 25 May 2024. The triangle indicates the starting position.
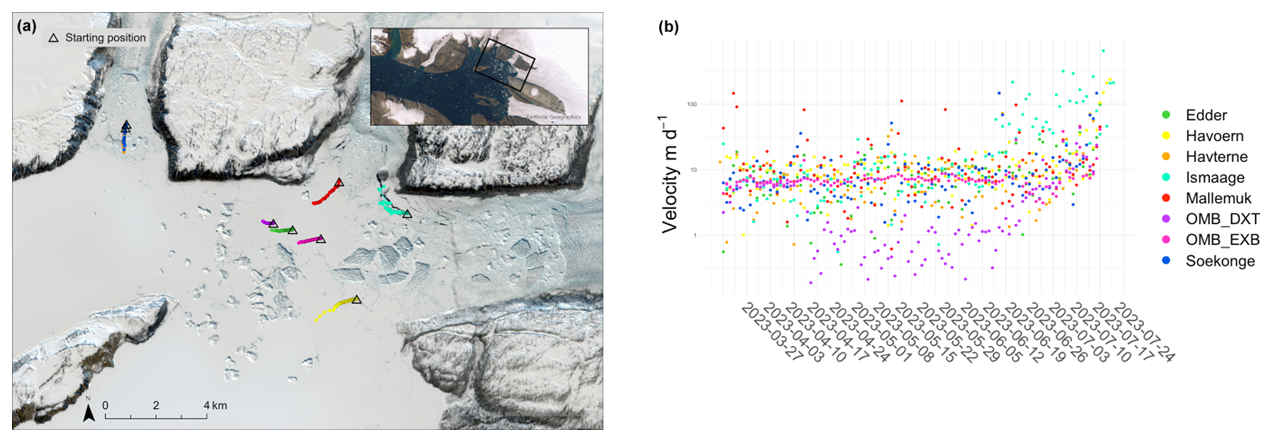
Figure 4The movement of the 8 buoys (Edder, Havterne, Havørn, Ismaage, Mallemuk and Soekonge, DXT and EXB) placed in front of Tracy, Farquhar, and Melville daily averaged from the end of March until mid-July 2023. The basemap in (a) is Sentinel-2 from 25 May 2024 as in Fig. 2. The triangle indicates the starting position.
We summarise the observed calving events and distances moved by the specific buoys as a result in Table A1. It is difficult to give full uncertainty estimates on the position data as we do not have a differential GNSS system in operation at this site. We reduce noise introduced into the system by individual measurements by averaging all calculated velocities, derived from position information over each day. This smooths out noise introduced by GNSS signal variability. We note also that the abrupt jumps as well as the steady state drift of all buoys is consistent across all positions, suggesting that the stated position accuracy and precision of the buoys themselves is likely underestimated in Table 1. We have opted to omit the uncertainty bars on the figures in this paper for clarity, but full error estimates are available in the raw datafiles (see “Code availability” and “Data availability” sections). Buoys in front of Farquhar follow vectors that show an influence from Tracy as in Figs. 3 and 4 but are also being partly steered by the closer glacier. The buoys in front of Melville in 2023, show no influence from Tracy, only their local Melville glacier, but given the local topography and their position inside the local Melville glacier fjord arm, this is not surprising. We attribute the erratic back and forth movements of Ismaage (Fig. 4) in 2023 to its location on very thin sea ice over a bedrock sill in relatively shallow (150 m depth, measured in the field) water, where tidal mixing in the fjord below the ice causes regular melt and fracture of the ice on the corner of the fjord between Farquhar and Tracy glaciers (see satellite timelapse video in the Video Supplement). The in situ observed velocities are helpful to compare with and evaluate remote sensing derived glacier and mélange velocities (Fig. 5). The Sentinel-1 data has a 12 d repeat orbit, which means it cannot be used to directly assess the abrupt events identified in the GNSS buoy data, though the table in the Appendix (Table A1) and calving events visualised in Fig. 10 do allow some relationships to be defined. Our analysis in Fig. 5 shows the GNSS velocities are similar to and centred around the satellite derived velocities of the lower part of Tracy glacier and the mélange in front of Tracy, with a tendency towards generally higher velocities in the GNSS observations of mélange. While the GNSS data have very similar average velocities to the satellite derived velocities, they have much higher daily variability, which it is not possible to capture given the image repeat time. Interestingly, our results confirm that the sea ice in the mélange zone and the outer fast ice zone is moving away from the glacier fronts slightly faster than the outlet glaciers are advancing, even when the landfast ice is at its seasonal maximum thickness. This extensional flow has also been observed by Meng et al. (2025) and Peters et al. (2015) in remote sensing observations. We interpret this to indicate that the buttressing effect of mélange is limited in winter though it may still exert some resistive force on the glacier termini that suppresses, though does not entirely eliminate calving activity (see also Figs. B1 and B2).

Figure 5Mélange and glacier velocities for Farquhar, Melville and Tracy from the PROMICE Sentinel-1 ice velocity dataset (Solgaard et al., 2021) and in situ buoy movements. (a) shows a comparison of the velocity of the mélange represented by in situ buoys (dots) and the PROMICE mélange product (dotted line), (b) shows the velocity from PROMICE from the three positions shown on (c) for the mélange, the upper and the lower point on each of the glaciers. Buoy marker colours in (a) correspond to same colours as in Figs. 3 and 4 but are translucent to allow easier comparison with satellite derived velocities.
3.2 Calving front changes and outlet glacier dynamics
Glacier dynamics and calving activity at each of our three glaciers is similar to, but slightly varying from the characteristic seasonal pattern found by other studies for example, Black and Joughin (2023); Solgaard et al. (2022) at around 80 % of Greenlandic glaciers. Bézu and Bartholomaus (2024) identify 3 typical calving styles at Greenland outlet glaciers and using manual inspection of optical satellite imagery summarised in Table A1 we observe all styles occurring at all three glaciers. We also identify predominant styles at each glacier. Tabular rifting is a characteristic of both Melville and Tracy glacier, serac collapse is a common characteristic of calving at all glaciers but especially at Farquhar and slab capsize appears to be more common at Tracy glacier than the other termini. We see contrasting behaviour in the glacier front position at Tracy, Melville and Farquhar glaciers and these differences probably reflect the balance between long and short-term variability as well as contrasting calving styles. At Tracy (Fig. 6) and Melville glaciers (Fig. 8), there is a typical small winter re-advance of the terminus, though often also associated with calving activity, with a larger early summer advance followed by late summer and autumn retreat, often by a few large individual calving events. The full length of the terminus is shown in (Fig. 6) and the pattern of slow readvance and retreat is summarised in Fig. 9. Farquhar glacier shows a similar but slightly less clear pattern in Fig. 7 with an obvious faster retreat on the western side of the calving front than on the east. This may be related to a series of small islands that can be seen appearing on the eastern side of the calving front and suggests the glacier is grounded in shallower water on that side of the front, which will influence the calving style (Benn et al., 2007). The crevasse patterns in Fig. 7 also suggest slower moving ice in this part of the glacier. Interestingly, the analysis of the automated calving front in Fig. 9b shows a general but rather fuzzier retreat pattern, possibly suggesting the deep learning algorithm found it harder to map the calving front at Farquhar glacier.
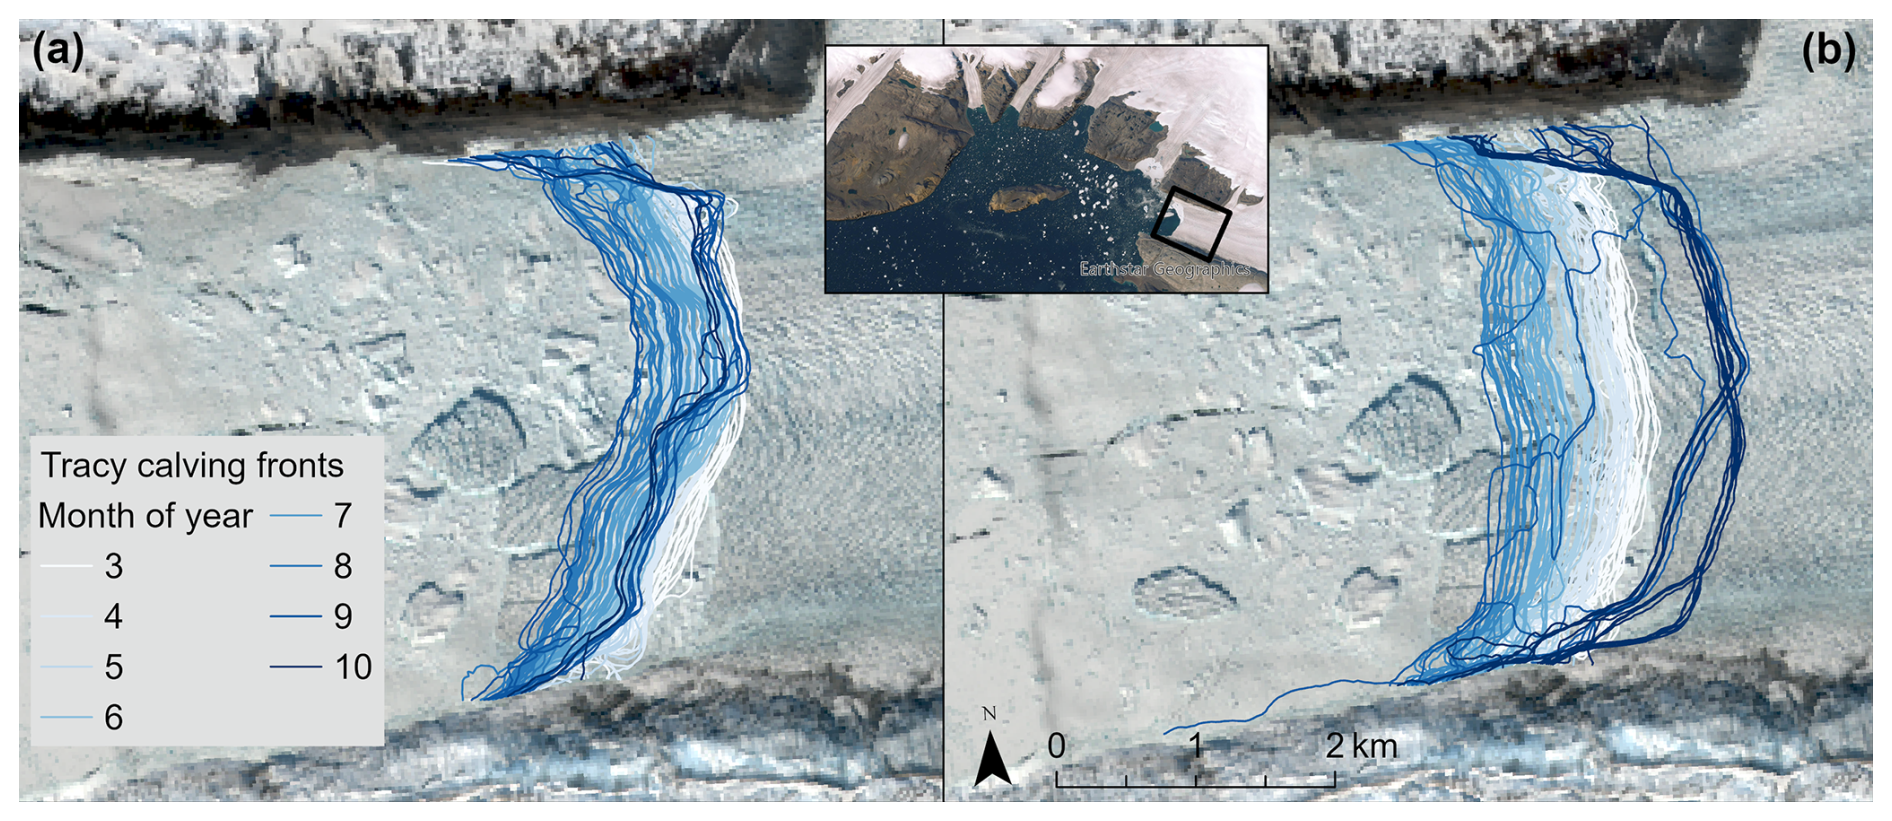
Figure 6Calving front positions for Tracy Glacier in 2022 (a) and 2023 (b) generated with deep learning (Loebel et al., 2023). The basemap is Sentinel-2 from 25 May 2024, processed on Sentinel Hub EO Browser using a natural colour optimisation (, ) to highlight the annual cycle from winter months (white) through to summer (blue) and autumn (dark blue).
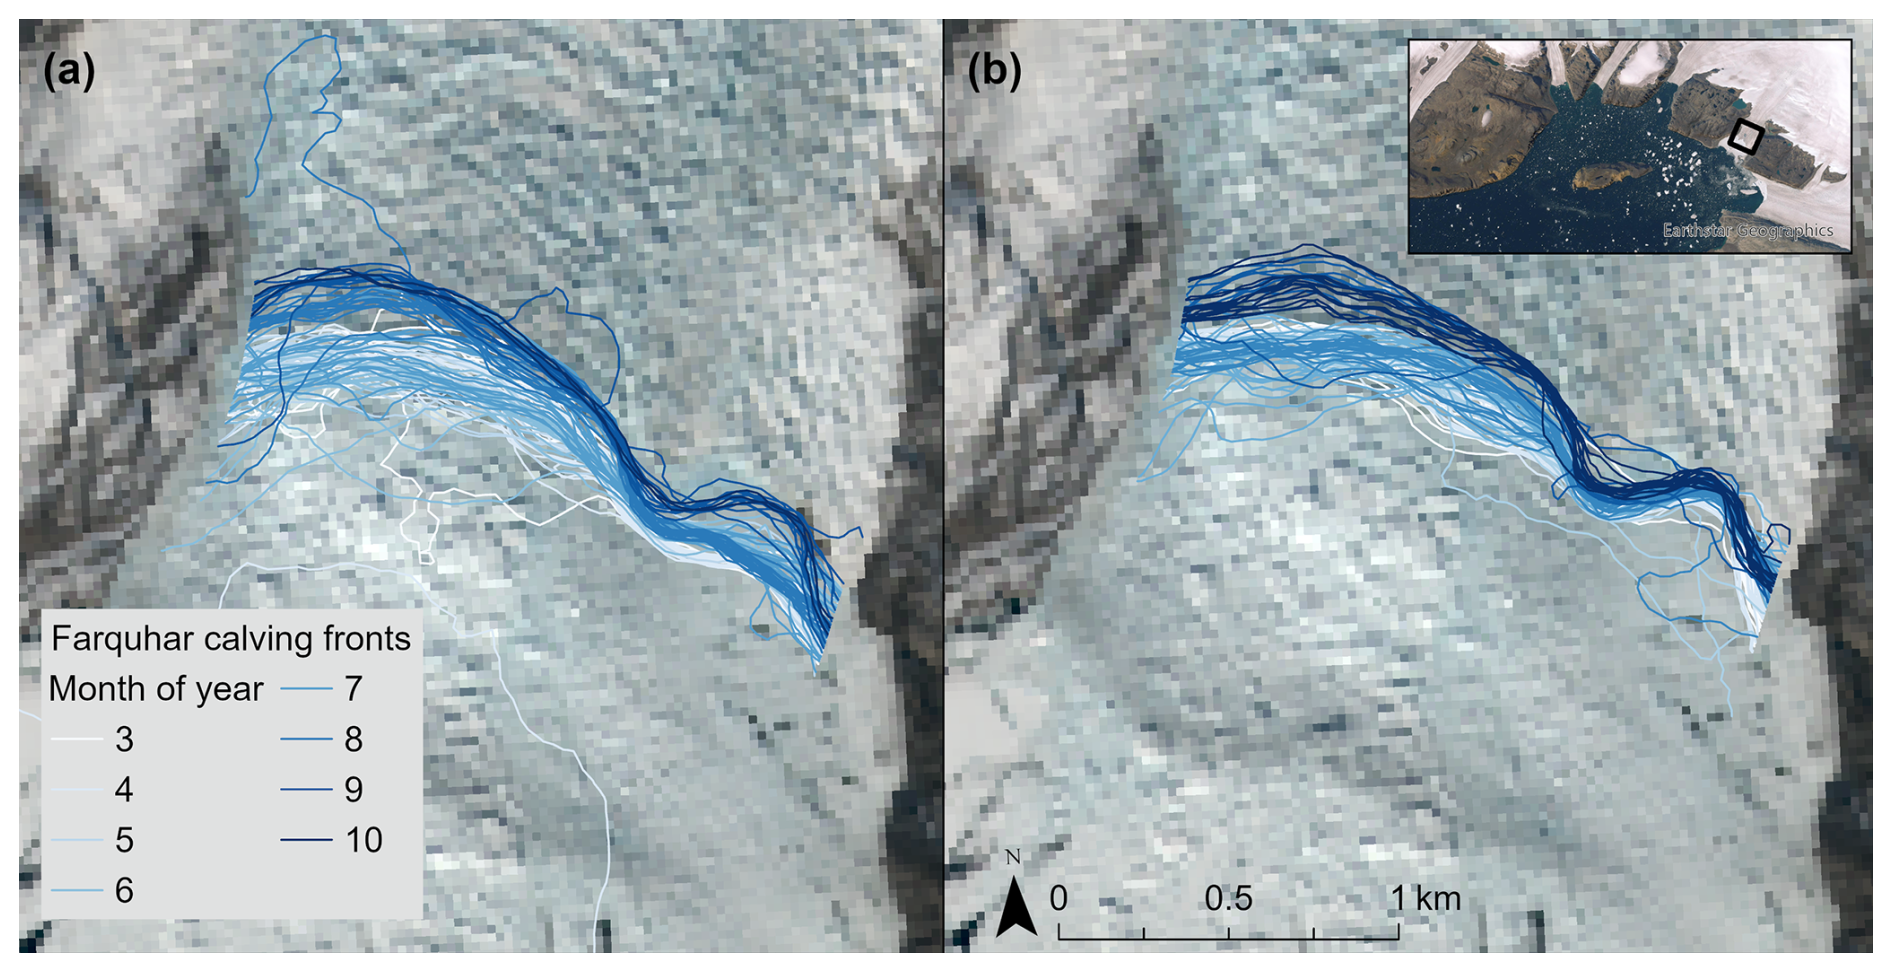
Figure 7Calving front positions for Farquhar Glacier in 2022 (a) and 2023 (b) generated with deep learning (Loebel et al., 2023). The basemap is Sentinel-2 from 25 May 2024, processed on Sentinel Hub EO Browser using a natural colour optimisation (, ) to highlight the annual cycle from winter months (white) through to summer (blue) and autumn (dark blue). Note the different spatial scale compared to Fig. 6. Note also that some of the lines representing calving fronts are likely to be errors generated by the deep learning algorithm which we retain here to highlight the importance of manual checking.
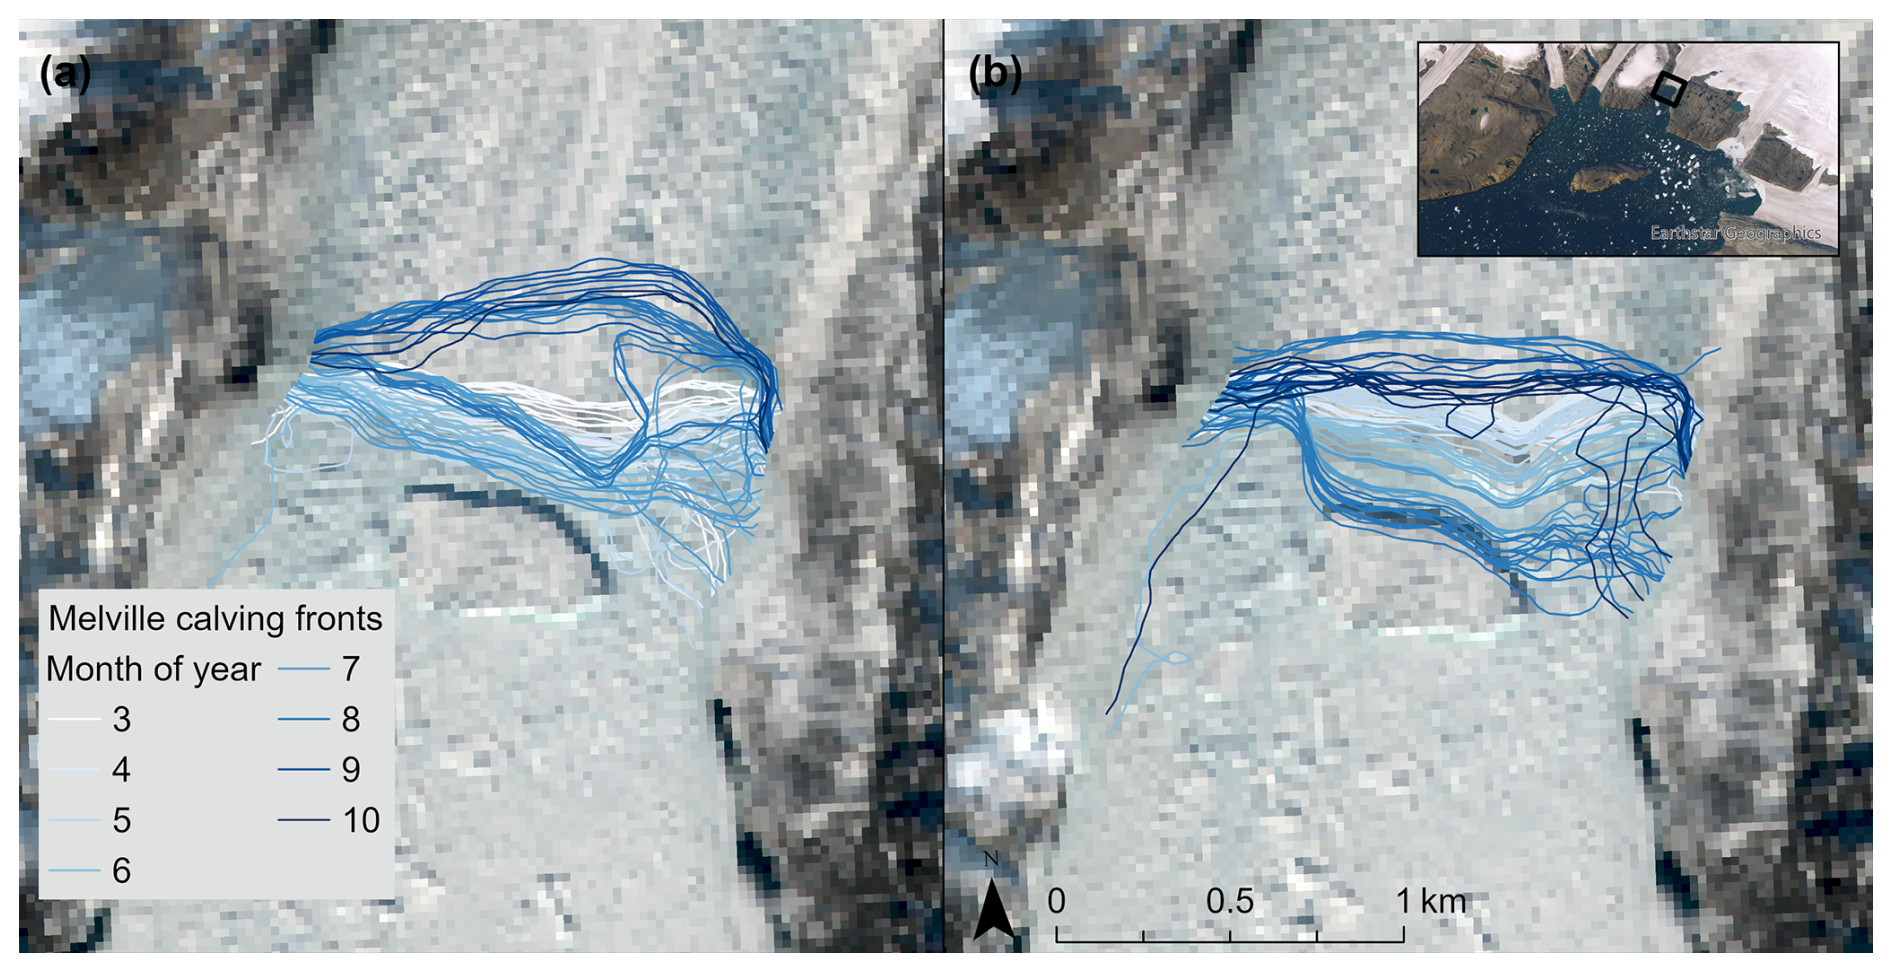
Figure 8Calving front positions for Melville Glacier in 2022 (a) and 2023 (b) generated with deep learning (Loebel et al., 2024). The basemap is Sentinel-2 from 25 May 2024, processed on Sentinel Hub EO Browser using a natural colour optimisation (, ) to highlight the annual cycle from winter months (white) through to summer (blue) and autumn (dark blue). Note the different spatial scale compared to Fig. 6. Note also that some lines denote errors generated by the deep learning algorithm which we retain here to highlight the importance of manual checking.
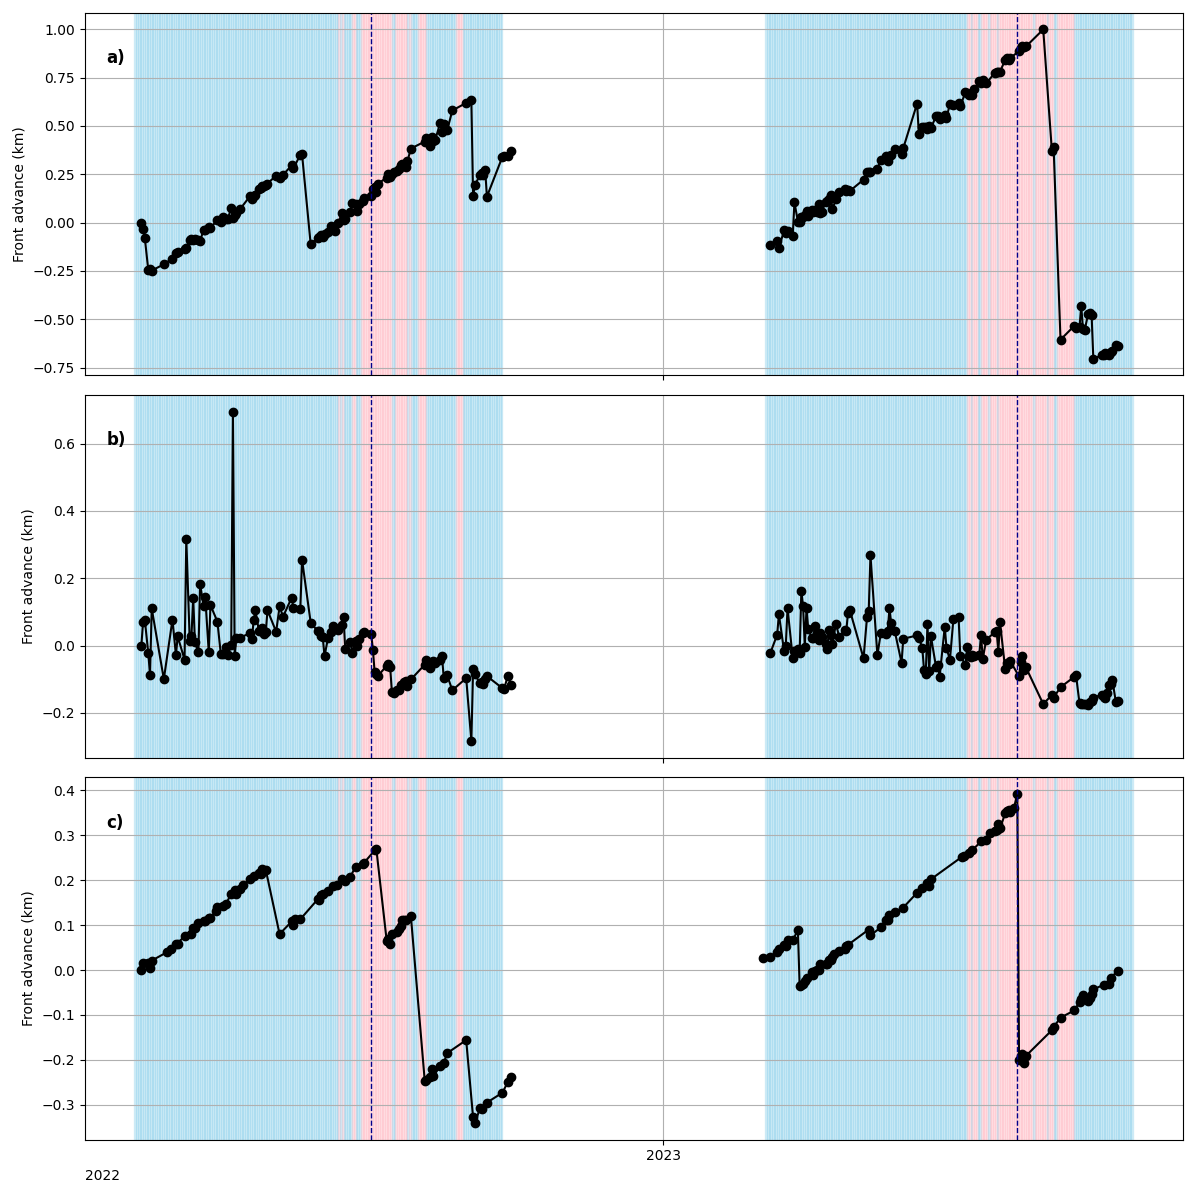
Figure 9Calving front time series at the central flow line at (a) Tracy glacier, (b) Farquhar glacier and (c) Melville glacier for 2022 and 2023. Calving front positions are marked with black dots, and solid gray lines connect entries for each year. Red and blue backgrounds symbolise positive and negative temperatures, respectively, based on 2 m air temperature data from CARRA at 12:00 UTC and the dashed vertical lines represent sea ice break-up dates for the two years in question, 16 July 2022 and 25 July 2023, identified from changes in buoy movements and examination of optical satellite imagery. (Loebel et al., 2023).
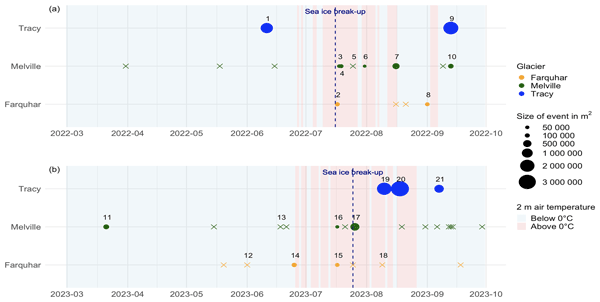
With the combination of the automated-extracted calving fronts (Loebel et al., 2024), buoy data showing abrupt velocity changes, and Sentinel-2 satellite imagery, we manually identified different calving events happening in total on 40 d from March–September in 2022 and 2023. Some events may have occurred over multiple days but are noted as one event happening on the same date due to the available temporal and spatial resolution of satellite imagery. These calving events and changes in velocity are summarised in Fig. 10. We analysed correlating factors for 21 of the 40 identified events and these are summarised in Table A1 in the Appendix. The measured sizes of the icebergs produced in these calving events are also indicated. This effort allows us to closely connect changes in mélange and landfast ice with calving events.
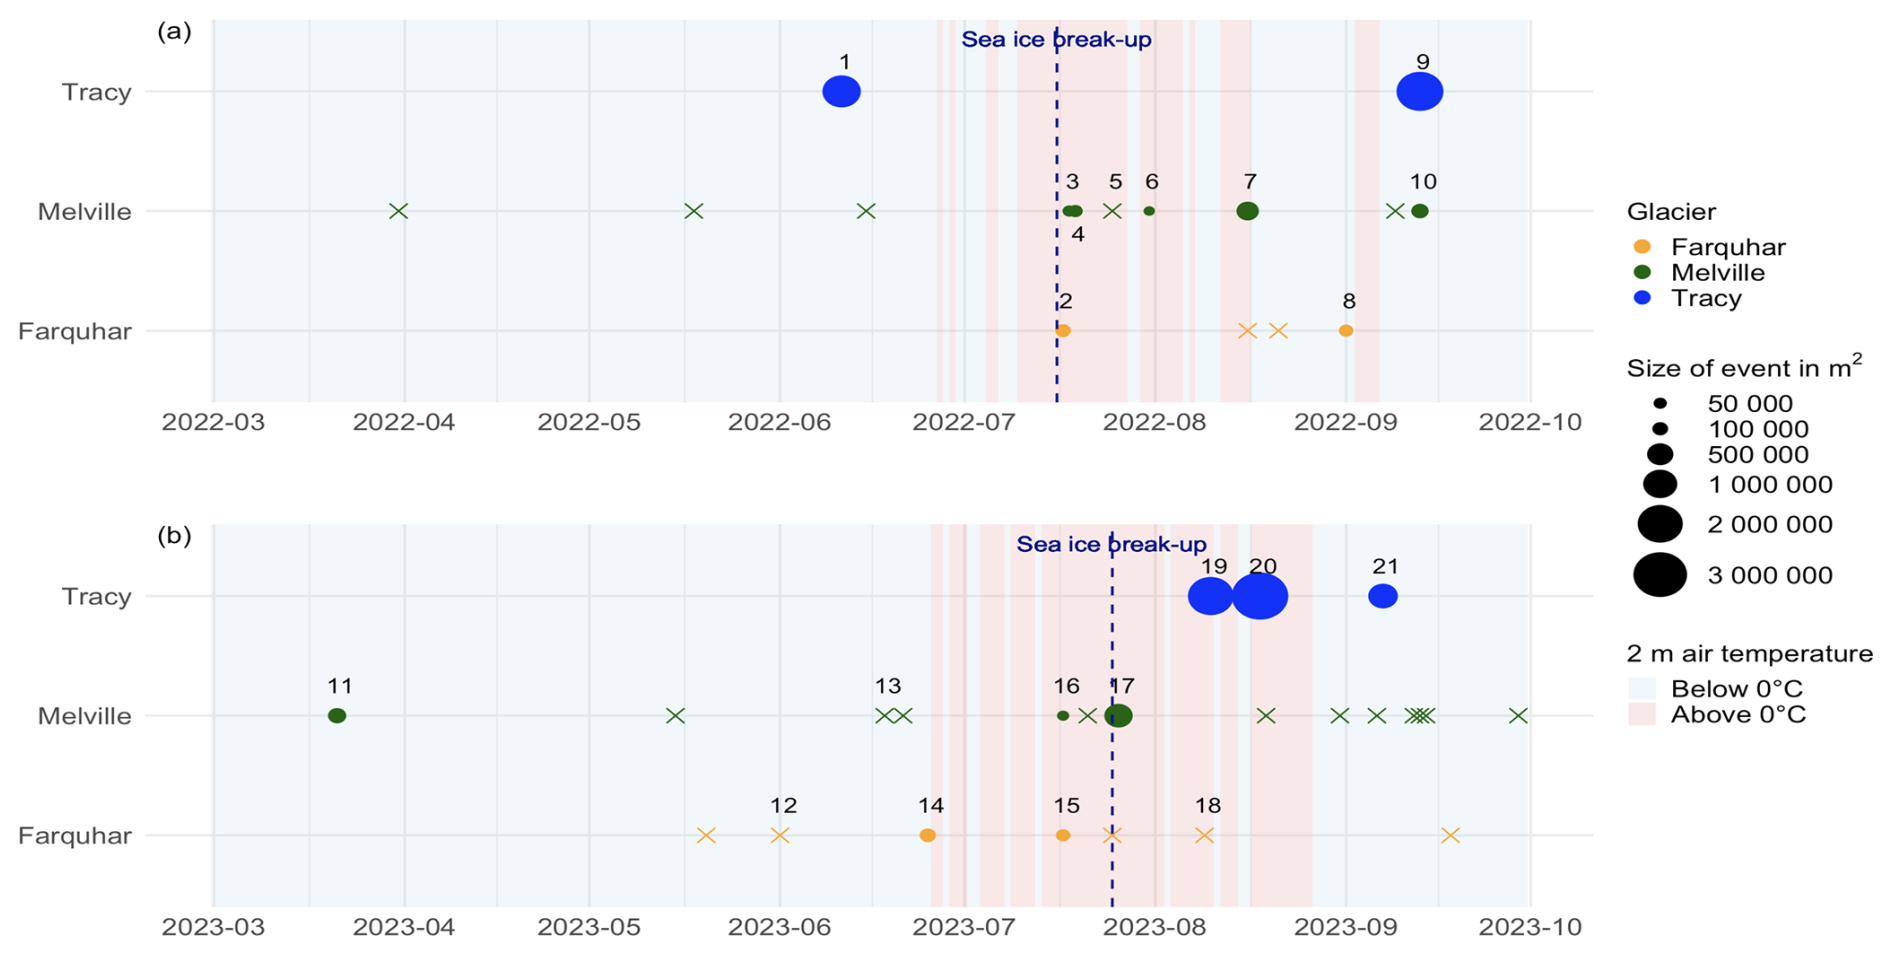
Figure 10All identified calving events on Melville, Farquhar and Tracy Glacier in 2022 (a) and 2023 (b). An event is plotted on the first detectable day (in satellite imagery) after the event has happened on the x-axis and distributed to its glacier location on the y-axis. Further, the colours orange, green and blue represent Farquhar, Melville, and Tracy. The approximate spatial size of each calving event in m2 (if measured) are indicated by the size of the points. If it is not possible to determine the size of the calving event, it is marked as a cross. Red and blue backgrounds symbolise positive and negative daytime air temperatures, respectively, based on 2 m air temperature data from CARRA at 12:00 PM UTC. The numbers (1–21) added to some points are reference numbers for events given in Table A1 and the dashed vertical lines represent sea ice break-up dates: 16 July 2022 and 25 July 2023, identified from changes in buoy movements and satellite imagery.
There are five large calving events on Tracy in 2022 and 2023. The events detected on Tracy happen from June to September and are larger than the events detected at Melville and Farquhar. Events at Melville Glacier were detected from March to the end of September. Melville is the glacier with most events both in 2022 and 2023 (10 in 2022 and 14 in 2023). Farquhar produces the smallest calving events on average, and we detected four in 2022 and seven in 2023. The majority of the events happen in the summer when there are positive daily air temperatures, but all three glaciers show calving events well outside of the melt season, including during the period with thickest sea ice and mélange. This conclusion is supported by both the satellite imagery and in situ buoy data. Tracy's front for example retreated almost a kilometre on the northern side during the winter of 2022–2023 indicating winter calving (Fig. 6). A similar 1 km retreat is detectable at Melville glacier between 2022 and 2023 (Fig. 8). 11 out of 15 events detected in 2022 happen after sea ice break-up, while the calving is more equally distributed in 2023, with 14 events after sea ice break-up and 10 before, of which 3 occurred around the identified break-up date. We note that smaller calving events, which in fact likely make up the majority of all calving events, are undetectable by the manual methods chosen here but are integrated into the calving front changes.
3.3 Atmosphere and Ocean Processes
Glacier mélange properties are likely influenced by ocean and atmospheric processes. We therefore include observations of ocean processes and state as well as information from atmospheric reanalysis in our study.
3.3.1 Ocean and Sea Ice Conditions
In Fig. 11 we show two CTD profiles from similar locations in the centre of the mélange area between the Tracy and Farquhar glaciers from 2022 and 2023. Overall we note little difference between profiles from 2022 and 2023, though there is a larger difference with observations from the mouth of the fjord around 100 km to the west, near the edge of the sea ice. The glacier profiles reveal a cold winter upper mixed layer reaching only 10–15 m above warmer layers reflecting upwelling and modification of warm deep water of Atlantic origin. In the profiles off Tracy glacier, the temperature reaches a maximum 0.2 to 0.3 °C at bottom levels. Below the mixed layer salinity gradually increases leaving the water column well stratified. Atlantic water core that exceed 1 °C at depths of around 300–350 m are found at the mouth of the fjord, consistent with previous observations (Jackson et al., 2021; Willis et al., 2018). In contrast to the shallow mixed layer in the melange region off Tracy, signatures of a +100 m deep winter mixed layer is seen in the profiles at the mouth of the fjord. Ocean observations in this region are unfortunately sparse in both time and space and we do not have observations from this part of the fjord taken outside of the dates of deployment of the GNSS buoys. Future work will focus on defining the typical range of iceberg sizes and thickness in the mélange, based on field observations, however in the field in this study we estimated large tabular icebergs near the GNSS buoys to be in the 10 to 20 m height above water line range, to a maximum of 30 m. Most of the icebergs in the mélange zone are considerably smaller than the few exceptionally large tabular icebergs, and the landfast sea ice in between was consistently measured to be around 1 ± 0.2 m thick.
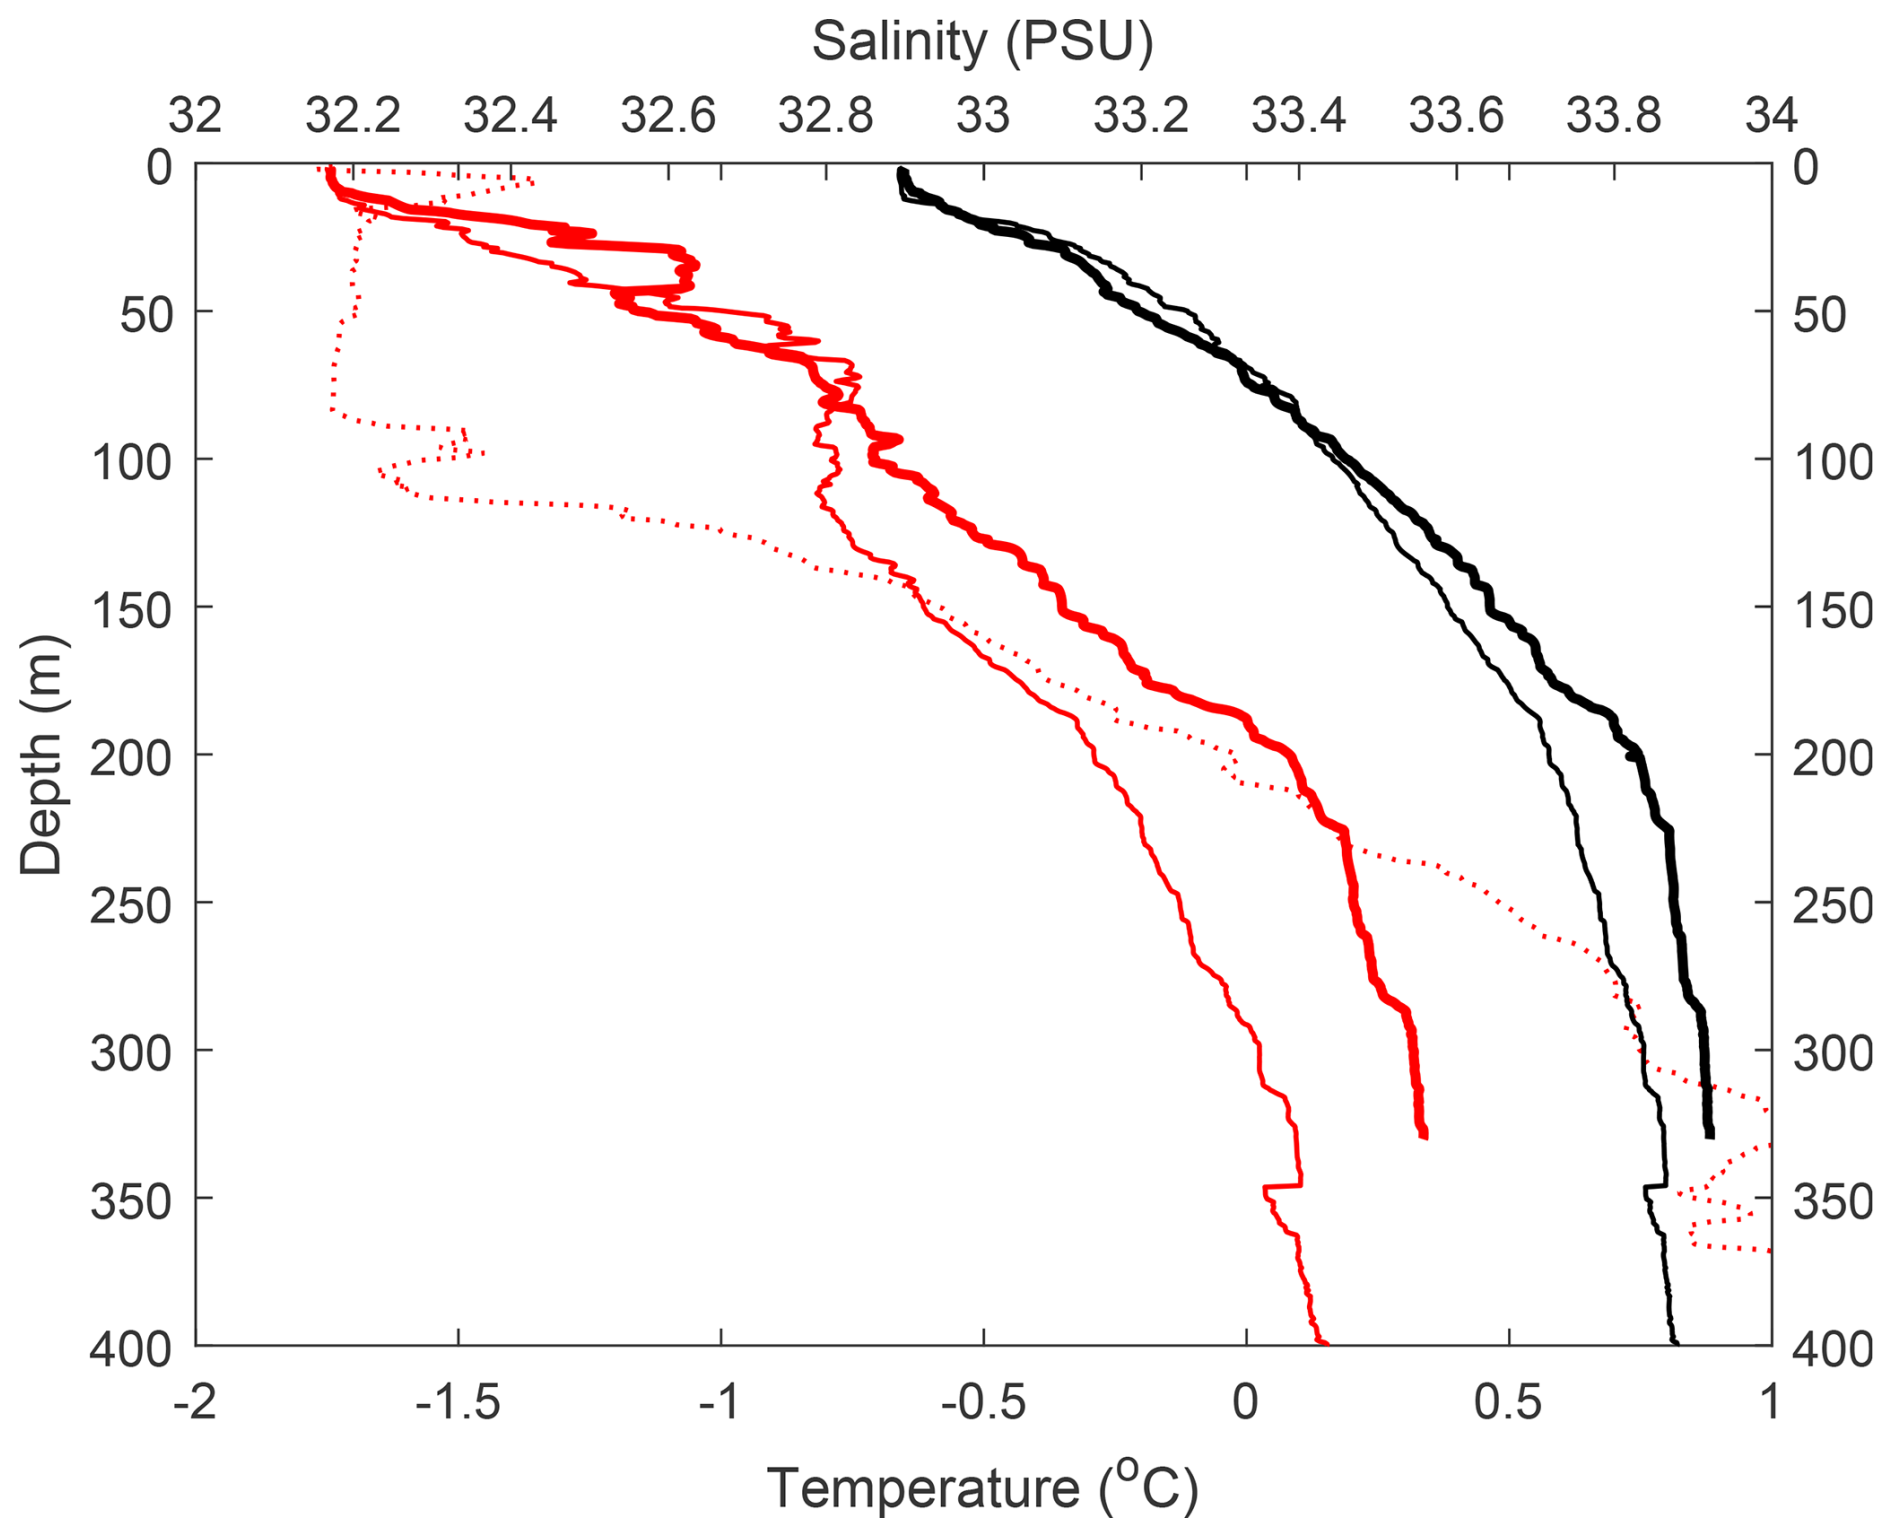
Figure 11Vertical profiles down to 400 m depth of temperature (red) and salinity (black) in front of Tracy glacier in March 2022 (thick lines) and March 2023 (thin lines) Also shown is a March 2022 temperature profile at the mouth of the fjord at the edge of the landfast sea-ice (dotted).
3.3.2 Ocean Tides
Initial analysis of the first EXB OMB data in 2023 showed a potentially quasi-diurnal cycle, though no cycle was visible in the DXT data, in spite of its nearby location. As other studies (Cassotto et al., 2021) have suggested that there may be a tidal forcing on some mélange zones and associated calving, we carried out further analysis to try to distinguish if there are diurnal and/or tidal processes visible in the mélange movements. Spectral analysis of the high time resolution OMB data does not show a tidal signal, Figs. 12 and 13 show the velocity dispersion for each buoy and the power-spectra, respectively. We see that for the buoy EXB the north-south velocities are clearly larger than the east-west velocities, suggesting more cross-fjord motion than along-fjord. DXT does not appear to behave like this, showing rather equal velocity dispersions cross- and along-fjord.
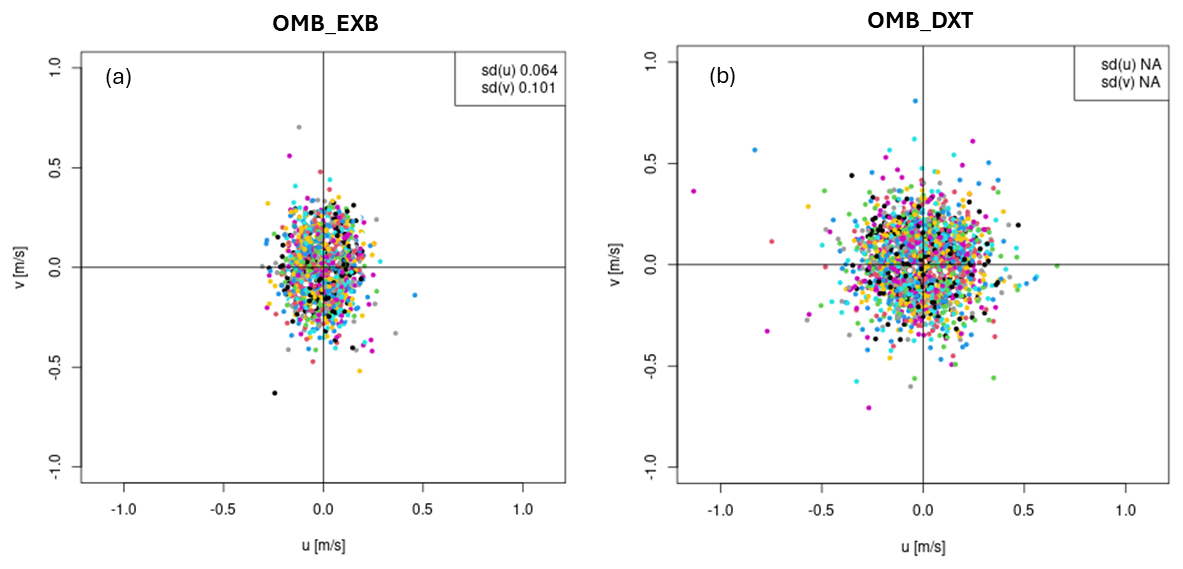
Figure 12East–west (u) and north–south (v) velocity components for the high resolution OMB buoys EXB (a) and DXT (b) buoys, based on GPS positions and time-stamps. Colours correspond to the different timestamps of the data with one colour for each hour. There is no clear pattern in colour distribution, indicating no systematic time of day trend for velocities in either direction. Note how the EXB buoy has larger cross-fjord (north–south) velocity dispersion than does the DXT buoy, compared to the along-fjord dispersions, as also indicated by the standard deviation (SD) in the inset of each subplot. As the GPS units are single-channel devices care should be taken in interpreting the different dispersions, and the spectral analysis results in Fig. 13 should be considered at the same time.

Figure 13Power spectra of OMB buoy velocity data decomposed to assess if there is any evidence of tidal forcing in the mélange movements at this location. Panel (a) shows the OMBDXT buoy (top) and (b) shows data from the OMBEXB (bottom). The observed velocities from the two buoys were split into two intervals covering the first and second halves of the observation period in 2023. The spectra for the time varying velocities for each interval are shown (red is first half, blue last half). The vertical dashed lines indicate the period of the tidal M2 constituent (12 h 25 min.) and the 24 h period which would be expected if the velocities were responding to a tidal forcing. The green dashed line is the significance level at p=0.01. Lomb-Scargle periodogram methods (VanderPlas, 2018) were used because the data are gapped and not evenly spaced.
Several signals at a level considered statistically significant are present in the power spectra in Fig. 13, such as a 24 h signal and several shorter periodicities. Notably absent are any periods that could be related to tides such as the principal lunar semidiurnal periodicity, M2 (12 h 25 min) which is entirely lacking. The 24 h signal is present in both the first and last half of the data records for both buoys, although not of equal strength over time. The presence of apparent diurnal effects in GNSS has been well documented (Weiss, 1989) and a similar decomposition of data from the GNSS sensor in Copenhagen showed similar features. We therefore conclude that unlike effects reported by Walter et al. (2012) and Cassotto et al. (2021), tidal effects are not significant at these glaciers in affecting mélange velocity at least when the GNSS buoys were deployed during the land fast sea ice season. Our results here are similarly a cautionary tale for groups attempting to replicate this work at other glacier termini.
3.3.3 Winds
As wind stress can also influence the transport of icebergs and mélange, we analysed the dominant wind directions to assess if buoy positions were likely to be responding to surface winds and in particular if the across fjord movements of EXB could be a result of the diurnal cycle. No clear signal was found that could account for this, however. The wind rose plots in Fig. 14 indicate similar persistent directions between 2022 and 2023 across all three termini, mostly aligned with the local topography, suggesting katabatic flow. Tracy and Farquhar glaciers have a more consistently easterly direction, whereas Melville glacier has a more northerly flow. The wind direction is not different between the two OMB positions however so it is also unlikely to explain any real diurnal cycle.

Figure 14Wind Rose plots from CARRA data for Melville, Farquhar, and Tracy Glacier in 2022 and 2023.
3.3.4 Surface mass budget processes
The surface mass budget (SMB) over the glaciers in the region show a classic seasonal cycle in Fig. 15 with winter accumulation followed by ablation driven negative SMB in the summer months. There is no clear diurnal cycle in melt or runoff that could also explain the slight cross fjord pattern of movement in EXB compared to DXT. Figure 15 indicates higher melt and runoff and lower SMB over Tracy glacier compared to the other two, likely reflecting a lower average elevation within the model topography (note that the Fig. 15 shows results only for a single grid point so is comparable in timing for each glacier but overall magnitude differs). The onset of surface runoff coincides with the positive air temperatures in Fig. 10 and the increase in abrupt movements shown in Figs. 3 and 4. We do not see a significant increase in average glacier or mélange velocity in this period but it does coincide with the thinning and eventual break up of sea ice in summer.
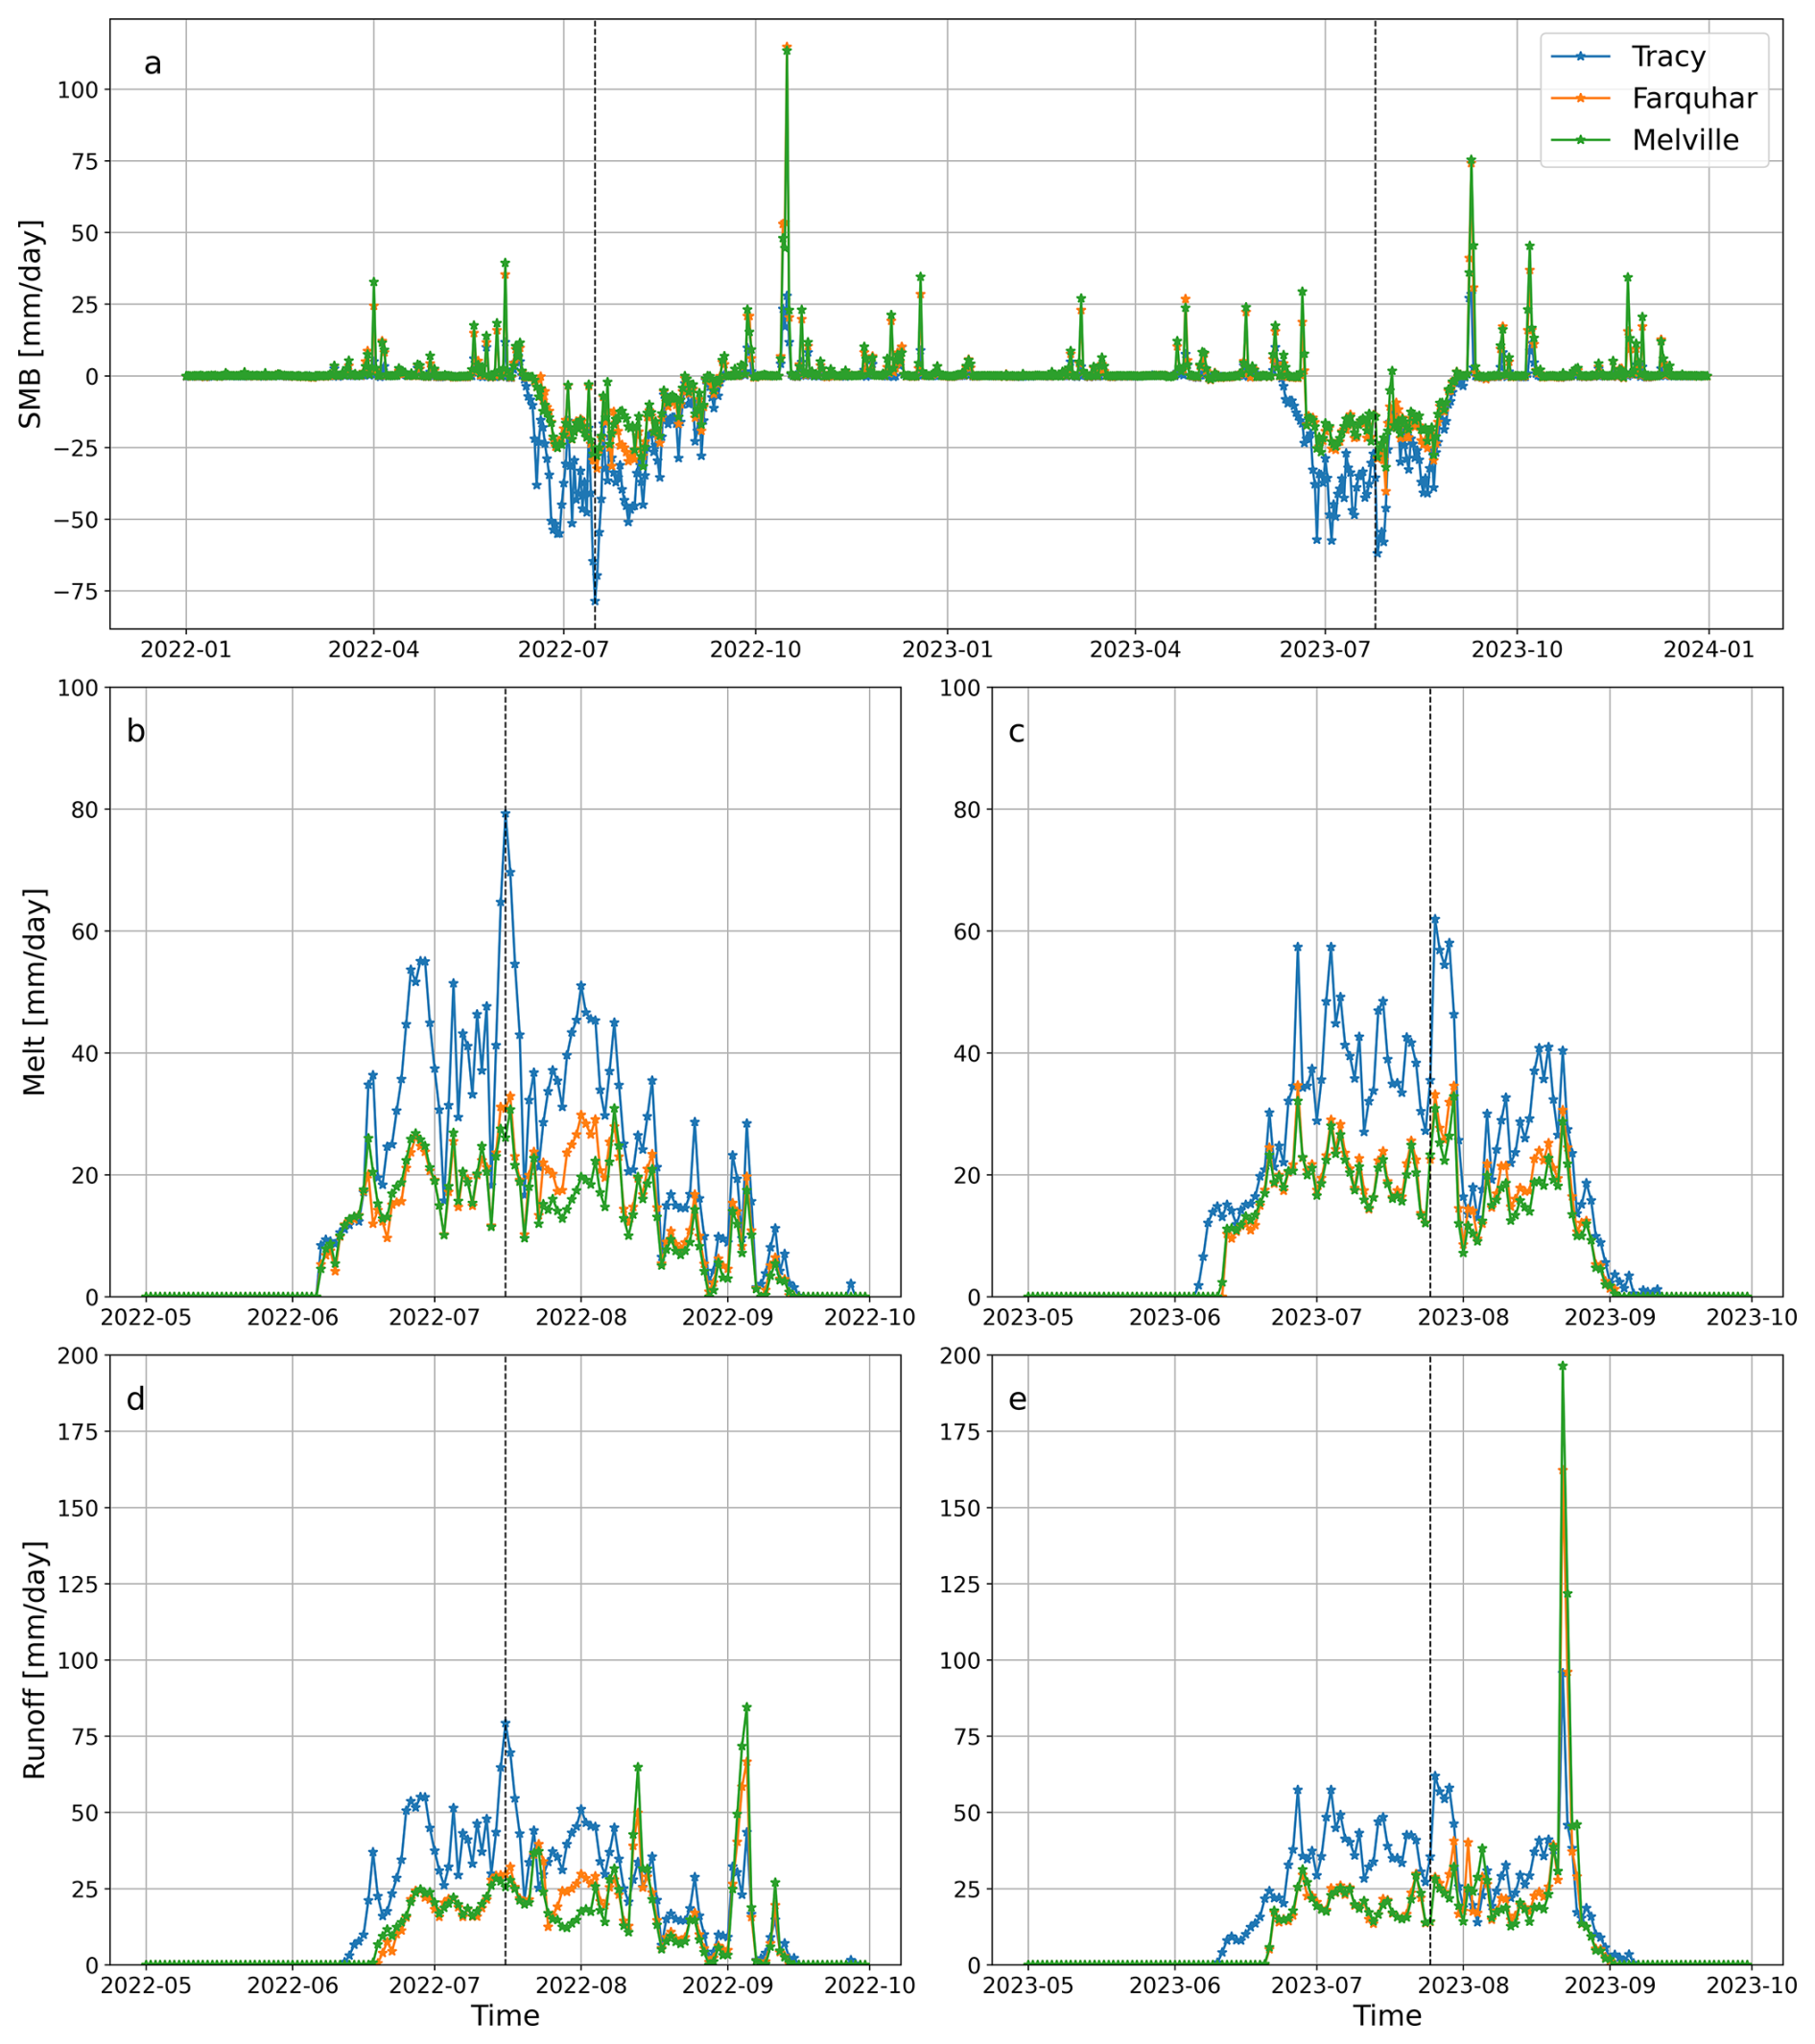
Figure 15Daily SMB (a), surface melt 2022 (b) and 2023 (c), and surface runoff 2022 (d) and 2023 (e) for the three glaciers. All values are given in mm per day, from the model grid cell nearest the glaciers. The vertical black dashed lines show the date of the sea ice break-up in 2022 and 2023.
Through a comprehensive set of in situ and remote sensing observations, as well as output from regional climate and SMB modelling, we have characterised the mélange zone of three Greenland outlet glaciers through the winter, spring and summer periods. Our results suggest that mélange is one of multiple factors that influence seasonal calving activity at these study glaciers. The position of the calving front has a seasonal cycle at all fronts, likely related to a complex combination of changes in ice velocity, runoff and air temperature and the presence or absence of land fast sea ice as well as to the general stability of the position of the calving front and the dominant calving styles of the glacier, which is also related to bed topography and fjord geometry as well as mass budget and hydrology (Benn et al., 2007). Calving activity occurs through the year including in the middle of winter when mélange is at it's most rigid and landfast sea ice at maximum thickness. Following the analysis of Bézu and Bartholomaus (2024), we show that the three glaciers demonstrate calving styles representative of many Greenland calving outlets, though with the caveat that our study period only covers 2 winters and 3 glaciers. Our methods have generated good insights into the development of and deployment of new instruments and techniques in glaciology, as well as highlighting some potential pitfalls and areas for improvement.
4.1 Application of new techniques to study mélange processes
The wide availability and near real-time updating of remote sensing data (Solgaard et al., 2021) provided us with an excellent opportunity to monitor outlet glaciers and derive insights into important cryosphere processes and to evaluate earth observation data products. Machine learning offers an automated means to analyse this data and the application of deep learning to track calving front position is one obvious benefit. We note a few limitations of both manually determined and deep learning extracted calving fronts. While useful for tracking calving fronts on seasonal to annual timescales, the automated calving fronts did not have a precision high enough to identify calving front dynamics on a daily time scale. This is likely due to the fact that the three glaciers analysed are not part of the training data used for the deep learning model, which reduces the accuracy and consistency of the delineation. In addition, the strong ice mélange and calving activity make these glacier fronts difficult to delineate, even manually. We note however, that the technique shows great promise in reducing labour intensive tasks associated with manually digitising calving fronts and improvement and application of the technique will certainly be beneficial in the future for monitoring and research efforts. Our study also demonstrates the great promise in the deployment of cheap, robust sensors in collaboration with local communities in Greenland. Our analysis though also highlighted the importance of careful calibration of such sensors to avoid over-interpreting what turned out to be artefacts in the GNSS data from these sensors.
4.2 Interpretation of in-situ observations
The conceptual framework and analysis of Robel (2017) is relevant to our interpretation of the results. Field observations confirm the existence of fractures consistent with ploughing through the mélange with a crumple zone of ice rubble and cracks spreading out more widely from the mélange area itself as shown in the photo in Fig. 16 and in the animations of satellite images in the Video Supplement.

Figure 16The mélange zone in front of Melville glacier with large icebergs visible on the left of the image, in the background the eastern part of the fjord wall is visible. The ridge of ice in the centre is a push ridge indicating the glacier pushing into the landfast ice. Cracks and pools of sea water open under the pressure but quickly freeze shut. The deep snow that covers the sea ice is absent making them easy to pick out.
Robel (2017) suggests that thinning sea ice triggers the onset of the calving activity at the end of the season. Our results do not completely confirm this framework, as we detect calving activity all through the winter, even when sea ice is at its maximum extent and thickness (see e.g. Fig. 10 and the Video Supplement too). Our analysis of velocities shown in Figs. 3 and 4 does not show a steady increase or decrease in the measured velocities with time. Instead, we observe two distinct regimes, one where the mélange velocity is largely stable and there are a few abrupt movements, indicating sparse but definite calving events, noted in Fig. 10 in the winter period, and a second summer regime where the abrupt shifts in position become more common and of a higher magnitude, correlating also with more frequent calving events. There is a break point where the mélange shifts between these two regimes in mid-June in both years, suggesting that the onset of enhanced calving is related to the break up of landfast sea ice in the mélange zone, rather than the properties of the mélange itself. This shift coincides with the start of the melt and runoff seasons at the study glaciers, suggesting potentially an atmospheric influence on both sea ice thickness and glacier velocity that has a dynamic effect, as well as the possibility of submarine melt influences. The ocean measurements shown in Fig. 11 show a thick cold upper layer. A 30 m high (above sea surface) iceberg (likely more than the maximum observed in the field) may reach depths of about 300 m below the surface and therefore could potentially reach into the warm Atlantic water layer observed by CTD measurements. This warmer layer could potentially accelerate melt, but the vast majority of the mélange is sitting in the cold and fresh upper layers of the fjord where there is little potential for mixing until the sea ice cap has broken up sufficiently. We therefore interpret the temperature and salinity in the deep water as being unimportant for the seasonal changes in mélange, certainly in the outer zone and especially for the sea ice which had an observed thickness of around a metre during deployment of the GNSS buoys. Thinning and melt of the winter ice in summer, and well as formation and growth in the late autumn and winter is likely largely driven by atmospheric processes in this local context. We suggest on the basis of our observations however that the presence of the landfast ice is more important than the presence of glacier mélange in the winter time in modulating activity, though largely in preventing the removal of calved icebergs. While the landfast sea ice and mélange may exert some back pressure on the calving front, the extensional flow of the mélange away from the glacier fronts, interrupted by abrupt jumps associated with calving, even during the winter period, suggests that at least in these fjords, the effect of mélange is minimal in controlling ice dynamics to any meaningful extent. This conclusion is supported by analysis of the velocity field in the mélange zone and the principal strain rates across glacier front and mélange zone derived from satellite data and shown in Fig. B2. The average velocity of the mélange zone is close to the velocity of the outlet glaciers, particularly Tracy Glacier, through much of the winter period, as measured by the PROMICE velocity data. This suggests a tightly coupled system between glaciers and landfast sea ice. Satellite data confirms the extensional flow in the mélange zone but cannot measure the abrupt movements measured by the GNSS buoys and our analysis shows the importance of very high time resolution and the application of in situ data to accurately measure these events. Results from our GNSS buoys show an almost instantaneous response to the same forcing, in spite of their wide (km scale) spacing. The abrupt movements, corresponding to the release of stress related to fracture of the mélange, occur within the same half hour period. While it is difficult to be absolutely certain if the abrupt movements reflect stress relief in the mélange that then leads to calving, or if the iceberg calving leads to the abrupt jump in the position of the mélange, the abrupt jumps do correlate with calving activity at the glacier fronts. Even with a higher time resolution, the OMBs do not resolve sufficiently the propagation of sudden fracture events through the mélange, but both OMBs register the same shift as the lower resolution TRUSTED buoys, which gives us additional confidence in the interpretation of the movements. The magnitude of the total distance moved decreases very steadily with distance from the glacier fronts as Table A1 in the Appendix also makes clear. This observed pattern of movement, suggests that it is calving that is driving the abrupt shifts in mélange position, and not vice versa. The rigidity and coherence of the mélange due to the presence of fast ice is thus likely a more important factor to consider for glacier calving dynamics than the buttressing properties of unfrozen mélange, as also for example suggested by Robel (2017). After the sea ice break up dates, the movement of the mélange buoys is very clearly different and once afloat, they typically left the fjord within a few days and were collected by partners in the local community of Qaanaaq. With the Sentinel-2 satellite imagery (see Video Supplement) after the landfast ice breaks up, we observe both extensional, compressional and uniform flows of mélange, sometimes simultaneously but usually spatially distributed across the fjord. The difference in the flow regimes before and after sea ice break-up have also been proposed by Burton et al. (2018) and our observations support this analysis.
4.3 Controls on Calving Front Position
The calving front positions of all glaciers, but especially Melville and Tracy show a similar seasonal timing in both 2022 and 2023 (Figs. 7 and 8), with a net advance from mid-September/start October to mid/late July and a net retreat from mid/late July to mid-September/start October. We note that the pattern in frontal position shown in Fig. 9 is similar to the terminus change time series shown in Fig. 1 of Bézu and Bartholomaus (2024) for the three different styles of calving they identify as prevalent in Greenland. Our analysis also therefore supports theirs that although local factors are important for each individual terminus, controls on calving processes can be inferred from general first principles. As all glaciers have similar atmospheric and ocean properties, these appear to be the dominant control on seasonal variability in the front position. The seasonal cycle confirms earlier studies on other glaciers (e.g. Black and Joughin, 2023; Moon et al., 2015; Brough et al., 2023), although Melville, Farquhar, and especially Tracy show a later onset of retreat than other termini in Greenland, possibly related to their relatively northerly position. For example, Black and Joughin (2023) showed that the onset of summer retreat patterns occurs later as you move north on the west side of Greenland. Moon et al. (2015) also concluded that the onset of retreat generally corresponds with break-up of sea ice and onset of higher surface melt, which makes it difficult to distinguish the underlying importance of both factors (Cook et al., 2021; Fried et al., 2018) (see also Fig. 10). Other studies have suggested an increase in glacier velocity could lead to enhanced calving (Amundson et al., 2022; Sakakibara and Sugiyama, 2020) and given the importance of melt and glacier sliding on the velocities in this region it is likely that these processes are also moderating the calving activity, particularly at Tracy and Melville Glaciers. We examined the relation between sea ice break-up, onset of melt and other possible driving factors in the overview of calving events displayed in Table A1 and visualised in Figs. 10 and 15. These clearly show that the drivers of calving front position and calving activity are likely multi-factorial. As another example, our manual inspection of satellite images clearly showed that glacier front instability through changes to the geometry was an important factor in driving subsequent calving events after a single large event causes the glacier front geometry to be in an unstable configuration, eventually leading to another calving event. An individual calving event may have multiple causal factors, many of which are coincident in time and space. These factors include ice velocity, terminus topography, bathymetry and basal hydrology as well as local climate and have been identified in other studies (see for example, Amundson et al., 2020; Cowton et al., 2023; Cook et al., 2021; Kneib-Walter et al., 2021; Fried et al., 2018; Benn et al., 2007). We found no diurnal or tidal influence on mélange velocities or calving events during the fast ice season and cannot find a strong diurnal velocity signal in the PROMICE velocities due to the multi day smoothing. However, we do detect a small increase in the glacier velocity in 4 out 10 events detected in 2022. We note also the results of Wheel et al. (2024), whose three dimensional full stokes model of Sermeq Kujalleq (Jakobshavn Isbræ) showed the relative unimportance of mélange in controlling calving dynamics and terminus position compared to local geometry.
4.4 The role of mélange in buttressing and backstress
Although our results focus on a single large fjord with multiple glaciers in Northwest Greenland, the geographic situation is much more typical of most Greenland outlet glaciers than the very large outlets typically studied (Bjørk et al., 2015). We therefore use this analysis to draw conclusions about outlet glaciers in Greenland more widely and, with some reservations to outlet glaciers in Antarctica. Firstly, our results confirm the importance of sea ice in seasonally limiting to some extent, calving from active glaciers. The recent acceleration of Crane glacier on the Antarctic peninsula as well as the seasonal cycle in peninsula glaciers (Surawy-Stepney et al., 2024) have all alternatively been attributed to the loss of rigid multi-year sea ice. Surawy-Stepney et al. (2024) propose, however, that the direct buttressing effect of landfast sea ice on glaciers in the Larsen B embayment (Antarctica) is minor and that the observed acceleration of glaciers after the disintegration of landfast sea ice is due to secondary processes like increased swell activity in open water, which in turn destabilizes the ice shelves. Alternatively, Surawy-Stepney et al. (2024) postulate that landfast sea ice has a stabilizing effect on the ice mélange in front of the glaciers (for example, by inhibiting export of icebergs) and that stable ice mélange in turn slows down the glaciers. In Greenland, several studies at other glaciers suggest an important role for mélange in modulating calving activity but these have been overwhelmingly carried out at very large and dynamic outlet glaciers such as Sermeq Kujalleq (Jakobshavn Isbræ) and Helheim Glacier (Joughin et al., 2020; Cassotto et al., 2021; Amundson et al., 2010; Everett et al., 2021) and Kangerlussuaq glacier in Eastern Greenland (Lippert et al., 2025). These glaciers have very large particle sizes in their mélange zones, which may promote particle jamming (Peters et al., 2015) more than in the mélange zones of our study glaciers. The effect of inhibiting if not completely preventing calving might be a factor also in the ice mélange zone we observed in front of Tracy, Farquhar and Melville glaciers, though, perhaps because the seasonal landfast sea ice is thinner than mulæti year ice in Antarctica, we see little evidence of mélange slowing ice velocity. This aligns with Robel (2017) who also assess little back stress from landfast ice thinner than 2 m. While the mélange at our study glaciers includes many icebergs and some very large ones, the landfast ice was consistently measured to be around a metre thick at all GNSS buoy deployment sites. Similarly, our results do not support the idea that glacier mélange can act as a significant buttress to outlet glaciers in the absence of landfast sea ice during marine ice sheet retreat and/or following the loss of ice shelves as for example proposed by Crawford et al. (2021), though models of mélange buttressing typically postulate very thick layers of mélange with a high packing density (Meng et al., 2025). We note the importance of the topographic configuration of our study area. The three glaciers are relatively fast moving, but found in short but narrow and straight fjords with a single outlet to the ocean. They are all in relatively deep water (as measured in the field), where the terminus likely reaches the observed core of warmer Atlantic water at around 200–300 m depth. Larger termini in more open embayments may respond differently to the presence of mélange (Meng et al., 2025), and for example the Totten Glacier in Antarctica (Greene et al., 2022) with a large ocean facing ice shelf does display a sensitivity to the presence of landfast sea ice in seasonal velocity patterns. The period of this study is too short to show any trends related to climate or otherwise in the fjord system, however, anecdotal evidence from interviews with local hunters suggests that the fast sea ice season in this fjord system has changed over the last 50 years. Observed sea ice thickness was around 1 m throughout the fjord system in both years. The sea ice is therefore typically much thinner compared to photographs showing almost 2 m thick ice in the 1960s. The fast ice has also formed later and later over the last decade when observations in the fjord monitoring programme run by DMI have been made in this region. In addition, winter storms that have broken up early season thin sea ice have been noted in the last ten years, while being unknown in the period since settlement in Qaanaaq in the 1950s. These anecdotal results suggest that thinning sea ice over a shorter season may affect the retreat of the outlet glaciers as it allows the mélange to be evacuated from the fjords more quickly.
4.5 Future Work
While several models incorporating iceberg mélange exist (Krug et al., 2015; Brough et al., 2023; Everett et al., 2021; Schlemm et al., 2022; Meng et al., 2025), few of them have been tested against a range of in situ observations. Of the studies of Greenland mélange that exist, there is a strong summer bias in field studies of glacier mélange for obvious reasons of accessibility as well as a bias towards the very large outlet glaciers. Where other more typical Greenlandic or Alaskan tidewater glaciers have been studied, and particularly in the winter to spring period, their results are more consistent with our findings (Kneib-Walter et al., 2021; Amundson et al., 2020; Black and Joughin, 2023). This is important for the development of models that can make projections of ice sheet evolution under climate change. Such models are currently reliant on quantities such as mélange thickness, which is hard to define in practice given the heterogeneity of the granular material. Future work will address the definition of mélange thickness in more detail with photogrammetry based on UAV mapping that was carried out concurrently with the buoy deployments, from which we can derive a size distribution of particles that can be applied in a modelling framework. Satellite data has proved immensely useful for testing these models (Meng et al., 2025) but our results also show that for detailed process understanding, the time resolution of Earth Observation data is insufficient for resolving the rapid movements of the mélange, though Meng et al. (2025) demonstrate how useful it can be for generalising across termini. In situ observations of ice mélange are rare and difficult and expensive to obtain and we are therefore committed to open data access to datasets such as this one. We also urge the mélange community to use such in situ observations where available to develop and test numerical models.
In this paper we examine the effect of landfast sea ice and iceberg mélange on three representative outlet glaciers in north west Greenland using a range of in situ and remote sensing observations. Our study suggests that while mélange may provide a short-term and seasonally varying control on outlet glacier fronts, this is largely limited to periods when there is landfast sea ice that hinders the evacuation of calved icebergs. We note a steady drift of mélange away from the glaciers even during winter, with a series of abrupt shifts in position measured by in situ GNSS buoys that likely indicate calving events. As the sea ice starts to thin and break-up in the summer period, the abrupt movements associated with calving events become more frequent. While this may indicate the importance of the landfast ice in enhancing the rigidity and potential backstress effect of mélange on the glacier fronts, it is also notable that the summer regime is concurrent with enhanced meltwater and enhanced outlet glacier velocities (Solgaard et al., 2022) and disentangling cause and effect is thus not straightforward. The multiplicity of factors hinders the development of broader parameterisations of the effect of mélange and sea ice on glaciers and ice sheets in ice sheet models, but will be important to capture in order to reproduce glacier fluctuations on seasonal to annual timescales. As climate change promotes earlier onset of melt and sea ice break-up, it will likely enhance rates of calving and ice loss in Greenland. Our study shows that remote sensing data is very valuable for understanding calving and mélange processes, but notice should be taken of the temporal and spatial resolution of the data. Supplementing with in situ observations is therefore crucial to fully capture all processes at an outlet glacier system. Our datasets will be further used to evaluate and improve the parameterisation of calving and ice mélange in ice sheet models.
Table A1 shows the 21 analysed calving events and the conditions present around the time of the calving. The table combines relevant results from calving front analysis, satellite and timelapse analysis, detected buoy movements, atmospheric and oceanic conditions from CARRA, and tidal data from Pituffik DMI. Sea ice breakup happened on 16 July 2022 and 25 July 2023. Arrows indicate a gradient in mélange conditions starting at the glacier front. The event number corresponds to Fig. 10. Times are in UTC.
Table A1Overview of the 21 analysed calving events and the conditions present around the time of the calving.
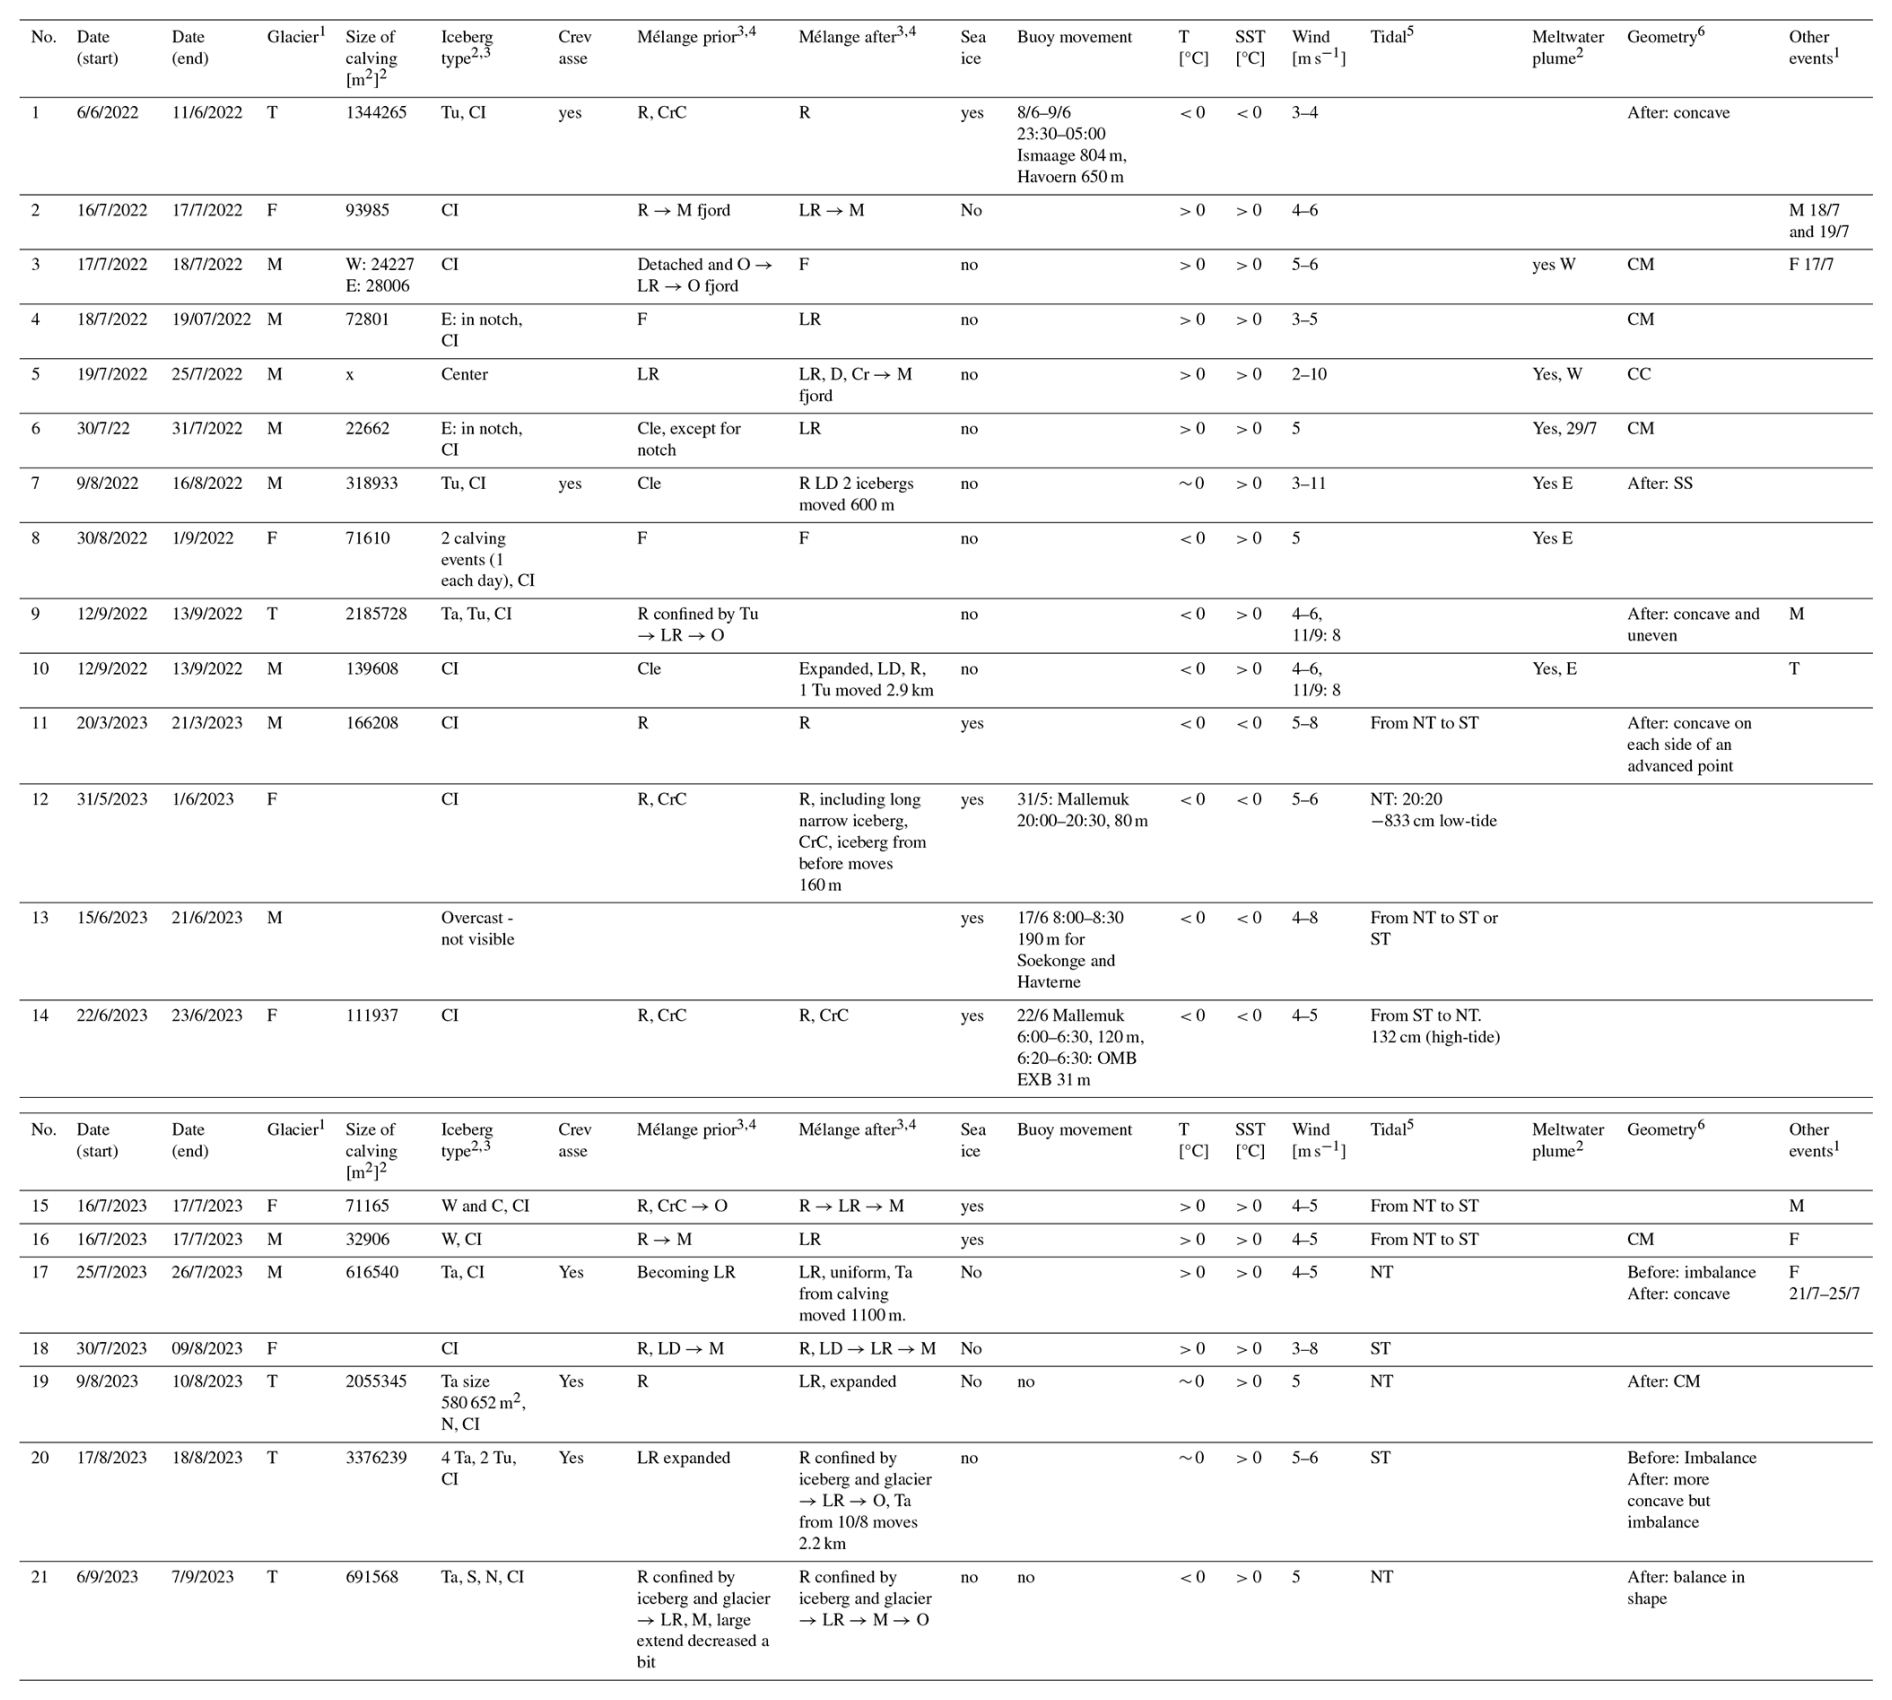
(1) Glacier: F – Farquhar, M – Melville, T – Tracy. (2) Locations: N – North, S – South, E – East, W – West. (3) Iceberg characteristics: Tu – Turned, Ta – Tabular, CI – Capsized and Integrated in ice mélange. (4) Ice mélange characteristics: R – Rigid, LR – Less Rigid, M – Mixed, O – Open, F – Foggy, Cle – Cleared, D – Dense, LD – Less Dense, CrC – Crack at Corner between Farquhar and Tracy, Cr – Cracks. (5) Tidal cycle: NT – Neap-Tide, ST – Spring-Tide. (6) Glacier geometry: CM – Calving at Margin resulting in geometric instability, CC Calving at Centre as response to geometric instability, SS – more Stable terminus Shape (straight, concave).

Figure B1Ice velocity vectors for the study glaciers for three snapshots in winter 2025 to 2026, derived from Sentinel-1 feature tracking as described in Solgaard et al. (2021). Arrows show the velocity vectors, colours indicate absolute velocities. Close to the front of all glaciers and in the mélange zone, the increased surface variability makes feature tracking challenging and it is only occasionally possible to extend as far shown here, hence why we show figures from a different time to the period when GNSS buoys were deployed.

Figure B2Principal strain rates for three snapshots in winter 2025 to 2026. Strain rates are derived from the ice velocity vectors shown in Fig. B1. Ice velocity vectors for the study glaciers, derived from Sentinel-1 feature tracking as described in Solgaard et al. (2021). Arrows show the velocity vectors, colours indicate absolute velocities. Close to the front of all glaciers, the increased surface roughness makes feature tracking challenging and it is only occasionally possible to extend into the mélange zone.
The ARCGIS workbenches used to process satellite and in situ observations, together with the associated datasets are archived on zenodo: https://doi.org/10.5281/zenodo.15195630 (Bang Brinck et al., 2025). The source code and ready-to-use implementation of the deep learning based glacier fronts delineation system is available at https://github.com/eloebel/glacier-front-extraction (last access: 15 June 2026) and https://doi.org/10.5281/zenodo.15295659 (Loebel, 2025).
The full raw dataset of in situ GNSS observations including subsequent years of observations is currently in preparation for publication in a data paper but is available on request from the authors for research purposes. PROMICE satellite derived velocity data is available on the GEUS dataverse: https://dataverse.geus.dk/dataverse/Ice_velocity (last access: 3 August 2026). Greenland calving front data is available here: https://doi.org/10.25532/OPARA-208. CARRA data can be retrieved from the Copernicus climate data store: https://cds.climate.copernicus.eu/datasets/reanalysis-carra-single-levels (last access: 3 August 2026). SMB data from HIRHAM5 is available at: https://download.dmi.dk/Research_Projects/PROTECT/HIRHAM5_ERA5_GRL/Daily2D_merged/ (last access: 3 August 2026).
A full annual calving cycle visualised using Sentinel-2 data is animated in two video supplements archived on Zenodo: https://doi.org/10.5281/zenodo.15195630 (Bang Brinck et al., 2025).
This study was conceived and planned and fieldwork was executed by RM, AG and SMO. Analysis of in situ and satellite data was carried out by SH, OBB and RM. SMO provided and analysed ocean data. PT assisted with interpretation of the GNSS and CARRA data. SMB and CARRA data was provided and analysed by MO and NH, the automated calving dataset was provided and analysed by EL and interpretation of ice sheet satellite velocities was provided by AS. The paper was planned by RM, SH and OBB. All authors participated in the writing of the paper.
At least one of the (co-)authors is a member of the editorial board of The Cryosphere. The peer-review process was guided by an independent editor, and the authors also have no other competing interests to declare.
Publisher's note: Copernicus Publications remains neutral with regard to jurisdictional claims made in the text, published maps, institutional affiliations, or any other geographical representation in this paper. The authors bear the ultimate responsibility for providing appropriate place names. Views expressed in the text are those of the authors and do not necessarily reflect the views of the publisher.
This article is part of the special issue “Improving the contribution of land cryosphere to sea level rise projections (TC/GMD/NHESS/OS inter-journal SI)”. It is not associated with a conference.
We pay tribute to the local community for all their help and hospitality, particularly the hunters and fishers of Qaanaaq, especially Peter Danielsen, Qillaq Danielsen and Gustav Simigaq who assisted in transporting us to the field locations and in retrieving the buoys during the summer. Invaluable logistical support in the field was also provided by our DMI colleague Aksel Ascanius. We thank Jean Rabault for answering all our questions regarding the OMB buoys and for his kind help with programming them tailored to our needs.
This study received funding and support from the Danish government through the National Centre for Climate Research (NCKF). NH was supported by the Novo Nordisk Foundation Challenge project PRECISE (grant no. NNF23OC0081251). MO received funding from the EU Horizon 2020 research and innovation programme PROTECT project under grant agreement no. 869304. RM acknowledges the support of the PolarRES project funded by the EU Horizon 2020 research and innovation programme call H2020-LC-CLA-2018-2019-2020 under grant agreement no. 101003590. Further support was received from the European Space Agency through the Ice Sheets CCI (grant no. 4000126523/18/I-NB) in the development and application of the remote sensing datasets.
This paper was edited by Gong Cheng and reviewed by two anonymous referees.
Amundson, J. M., Fahnestock, M., Truffer, M., Brown, J., Lüthi, M. P., and Motyka, R. J.: Ice mélange dynamics and implications for terminus stability, Jakobshavn Isbræ, Greenland, J. Geophys. Res. Earth Surf., 115, https://doi.org/10.1029/2009JF001405, 2010. a, b, c
Amundson, J. M., Kienholz, C., Hager, A. O., Jackson, R. H., Motyka, R. J., Nash, J. D., and Sutherland, D. A.: Formation, flow and break-up of ephemeral ice mélange at LeConte Glacier and Bay, Alaska, J. Glaciol., 66, 577–590, https://doi.org/10.1017/jog.2020.29, 2020. a, b, c, d
Amundson, J. M., Truffer, M., and Zwinger, T.: Tidewater glacier response to individual calving events, J. Glaciol., 68, 1117–1126, https://doi.org/10.1017/jog.2022.26, 2022. a
Bang Brinck, O., Hedetoft, S., and Mottram, R.: Mélange or landfast ice: What controls seasonal calving at Greenland outlet glaciers? Workbenches for Earth Observation and in-situ data processing, Zenodo [data set] https://doi.org/10.5281/zenodo.15195630, 2025. a, b
Benn, D. I., Warren, C. R., and Mottram, R. H.: Calving processes and the dynamics of calving glaciers, Earth Sci. Rev., 82, 143–179, https://doi.org/10.1016/j.earscirev.2007.02.002, wOS:000247798300001, 2007. a, b, c, d
Bevan, S. L., Luckman, A. J., Benn, D. I., Cowton, T., and Todd, J.: Impact of warming shelf waters on ice mélange and terminus retreat at a large SE Greenland glacier, The Cryosphere, 13, 2303–2315, https://doi.org/10.5194/tc-13-2303-2019, 2019. a, b
Bézu, C. and Bartholomaus, T. C.: Greenland Ice Sheet's Distinct Calving Styles Are Identified in Terminus Change Timeseries, Geophys. Res. Lett., 51, e2024GL110224, https://doi.org/10.1029/2024GL110224, 2024. a, b, c, d
Bjørk, A. A., Kruse, L. M., and Michaelsen, P. B.: Brief communication: Getting Greenland's glaciers right – a new data set of all official Greenlandic glacier names, The Cryosphere, 9, 2215–2218, https://doi.org/10.5194/tc-9-2215-2015, 2015. a, b
Black, T. E. and Joughin, I.: Weekly to monthly terminus variability of Greenland's marine-terminating outlet glaciers, The Cryosphere, 17, 1–13, https://doi.org/10.5194/tc-17-1-2023, 2023. a, b, c, d
Brough, S., Carr, J., Ross, N., and Lea, J.: Ocean-Forcing and Glacier-Specific Factors Drive Differing Glacier Response Across the 69° N Boundary, East Greenland, J. Geophys. Res. Earth Surf., 128, https://doi.org/10.1029/2022JF006857, 2023. a, b
Burton, J. C., Amundson, J. M., Cassotto, R., Kuo, C.-C., and Dennin, M.: Quantifying flow and stress in ice mélange, the world’s largest granular material, Proc. Natl. Aca. Sci. USA, 115, 5105–5110, https://doi.org/10.1073/pnas.1715136115, 2018. a
Cassotto, R., Fahnestock, M., Amundson, J. M., Truffer, M., and Joughin, I.: Seasonal and interannual variations in ice melange and its impact on terminus stability, Jakobshavn Isbræ, Greenland, J. Glaciol., 61, 76–88, https://doi.org/10.3189/2015JoG13J235, 2015. a
Cassotto, R. K., Burton, J. C., Amundson, J. M., Fahnestock, M. A., and Truffer, M.: Granular decoherence precedes ice mélange failure and glacier calving at Jakobshavn Isbræ, Nat. Geosci., 14, 417–422, https://doi.org/10.1038/s41561-021-00754-9, 2021. a, b, c, d, e, f
Christie, F. D. W., Benham, T. J., Batchelor, C. L., Rack, W., Montelli, A., and Dowdeswell, J. A.: Antarctic ice-shelf advance driven by anomalous atmospheric and sea-ice circulation, Nat. Geosci., 15, 356–362, https://doi.org/10.1038/s41561-022-00938-x, 2022. a, b
Cook, S. J., Christoffersen, P., Truffer, M., Chudley, T. R., and Abellán, A.: Calving of a Large Greenlandic Tidewater Glacier has Complex Links to Meltwater Plumes and Mélange, J. Geophys. Res. Earth Surf., 126, e2020JF006051, https://doi.org/10.1029/2020JF006051, 2021. a, b, c
Cowton, T. R., Slater, D. A., and Inall, M. E.: Subglacial‐Discharge Plumes Drive Widespread Subsurface Warming in Northwest Greenland's Fjords, Geophys. Res. Lett., 50, e2023GL103801, https://doi.org/10.1029/2023GL103801, 2023. a, b
Crawford, A. J., Benn, D. I., Todd, J., Åström, J. A., Bassis, J. N., and Zwinger, T.: Marine ice-cliff instability modeling shows mixed-mode ice-cliff failure and yields calving rate parameterization, Nat. Commun., 12, 2701, https://doi.org/10.1038/s41467-021-23070-7, 2021. a, b, c
Everett, A., Murray, T., Selmes, N., Holland, D., and Reeve, D. E.: The Impacts of a Subglacial Discharge Plume on Calving, Submarine Melting, and Mélange Mass Loss at Helheim Glacier, South East Greenland, J. Geophys. Res. Earth Surf., 126, https://doi.org/10.1029/2020JF005910, 2021. a, b
Fraser, A. D., Massom, R. A., Handcock, M. S., Reid, P., Ohshima, K. I., Raphael, M. N., Cartwright, J., Klekociuk, A. R., Wang, Z., and Porter-Smith, R.: Eighteen-year record of circum-Antarctic landfast-sea-ice distribution allows detailed baseline characterisation and reveals trends and variability, The Cryosphere, 15, 5061–5077, https://doi.org/10.5194/tc-15-5061-2021, 2021. a
Fraser, A. D., Wongpan, P., Langhorne, P. J., Klekociuk, A. R., Kusahara, K., Lannuzel, D., Massom, R. A., Meiners, K. M., Swadling, K. M., Atwater, D. P., Brett, G. M., Corkill, M., Dalman, L. A., Fiddes, S., Granata, A., Guglielmo, L., Heil, P., Leonard, G. H., Mahoney, A. R., McMinn, A., Van Der Merwe, P., Weldrick, C. K., and Wienecke, B.: Antarctic Landfast Sea Ice: A Review of Its Physics, Biogeochemistry and Ecology, Rev. Geophys., 61, e2022RG000770, https://doi.org/10.1029/2022RG000770, 2023. a
Fraser, C.: Characterising sikussaq and other forms of Ice melange in Greenland fjords, MPhil Thesis, University of Cambridge, Cambridge, UK, https://api.repository.cam.ac.uk/server/api/core/bitstreams/605510e7-1004-4289-9a7a-c307668c0f84/content (last access: 3 August 2026), 2012. a
Fried, M. J., Catania, G. A., Stearns, L. A., Sutherland, D. A., Bartholomaus, T. C., Shroyer, E., and Nash, J.: Reconciling Drivers of Seasonal Terminus Advance and Retreat at 13 Central West Greenland Tidewater Glaciers, J. Geophys. Res. Earth Surf., 123, 1590–1607, https://doi.org/10.1029/2018JF004628, 2018. a, b
Goelzer, H., Nowicki, S., Payne, A., Larour, E., Seroussi, H., Lipscomb, W. H., Gregory, J., Abe-Ouchi, A., Shepherd, A., Simon, E., Agosta, C., Alexander, P., Aschwanden, A., Barthel, A., Calov, R., Chambers, C., Choi, Y., Cuzzone, J., Dumas, C., Edwards, T., Felikson, D., Fettweis, X., Golledge, N. R., Greve, R., Humbert, A., Huybrechts, P., Le clec'h, S., Lee, V., Leguy, G., Little, C., Lowry, D. P., Morlighem, M., Nias, I., Quiquet, A., Rückamp, M., Schlegel, N.-J., Slater, D. A., Smith, R. S., Straneo, F., Tarasov, L., van de Wal, R., and van den Broeke, M.: The future sea-level contribution of the Greenland ice sheet: a multi-model ensemble study of ISMIP6, The Cryosphere, 14, 3071–3096, https://doi.org/10.5194/tc-14-3071-2020, 2020. a, b
Greene, C. A., Young, D. A., Gwyther, D. E., Galton-Fenzi, B. K., and Blankenship, D. D.: Seasonal dynamics of Totten Ice Shelf controlled by sea ice buttressing, The Cryosphere, 12, 2869–2882, https://doi.org/10.5194/tc-12-2869-2018, 2018. a, b
Greene, C. A., Gardner, A. S., Schlegel, N.-J., and Fraser, A. D.: Antarctic calving loss rivals ice-shelf thinning, Nature, 609, 948–953, https://doi.org/10.1038/s41586-022-05037-w, 2022. a
Hansen, N., Langen, P. L., Boberg, F., Forsberg, R., Simonsen, S. B., Thejll, P., Vandecrux, B., and Mottram, R.: Downscaled surface mass balance in Antarctica: impacts of subsurface processes and large-scale atmospheric circulation, The Cryosphere, 15, 4315–4333, https://doi.org/10.5194/tc-15-4315-2021, 2021. a
Hersbach, H., Bell, B., Berrisford, P., Hirahara, S., Horányi, A., Muñoz‐Sabater, J., Nicolas, J., Peubey, C., Radu, R., Schepers, D., Simmons, A., Soci, C., Abdalla, S., Abellan, X., Balsamo, G., Bechtold, P., Biavati, G., Bidlot, J., Bonavita, M., De Chiara, G., Dahlgren, P., Dee, D., Diamantakis, M., Dragani, R., Flemming, J., Forbes, R., Fuentes, M., Geer, A., Haimberger, L., Healy, S., Hogan, R. J., Hólm, E., Janisková, M., Keeley, S., Laloyaux, P., Lopez, P., Lupu, C., Radnoti, G., De Rosnay, P., Rozum, I., Vamborg, F., Villaume, S., and Thépaut, J.: The ERA5 global reanalysis, Q. J. R. Meteorol. Soc., 146, 1999–2049, https://doi.org/10.1002/qj.3803, 2020. a
Jackson, R., Kvorning, A. B., Limoges, A., Georgiadis, E., Olsen, S. M., Tallberg, P., Andersen, T. J., Mikkelsen, N., Giraudeau, J., Massé, G., Wacker, L., and Ribeiro, S.: Holocene polynya dynamics and their interaction with oceanic heat transport in northernmost Baffin Bay, Sci. Rep., 11, 10095, https://doi.org/10.1038/s41598-021-88517-9, 2021. a
Joughin, I., Shean, D. E., Smith, B. E., and Floricioiu, D.: A decade of variability on Jakobshavn Isbræ: ocean temperatures pace speed through influence on mélange rigidity , The Cryosphere, 14, 211–227, https://doi.org/10.5194/tc-14-211-2020, 2020. a, b
Kneib-Walter, A., Lüthi, M. P., Moreau, L., and Vieli, A.: Drivers of Recurring Seasonal Cycle of Glacier Calving Styles and Patterns, Front. Earth Sci., 9, https://doi.org/10.3389/feart.2021.667717, 2021. a, b
Køltzow, M., Schyberg, H., Støylen, E., and Yang, X.: Value of the Copernicus Arctic Regional Reanalysis (CARRA) in representing near-surface temperature and wind speed in the north-east European Arctic, Polar Res., 41, https://doi.org/10.33265/polar.v41.8002, 2022. a
Krug, J., Durand, G., Gagliardini, O., and Weiss, J.: Modelling the impact of submarine frontal melting and ice mélange on glacier dynamics, The Cryosphere, 9, 989–1003, https://doi.org/10.5194/tc-9-989-2015, 2015. a, b, c, d, e
Langen, P. L., Mottram, R. H., Christensen, J. H., Boberg, F., Rodehacke, C. B., Stendel, M., Van As, D., Ahlstrøm, A. P., Mortensen, J., Rysgaard, S., Petersen, D., Svendsen, K. H., Aðalgeirsdóttir, G., and Cappelen, J.: Quantifying Energy and Mass Fluxes Controlling Godthåbsfjord Freshwater Input in a 5 km Simulation (1991–2012), J. Clim., 28, 3694–3713, https://doi.org/10.1175/JCLI-D-14-00271.1, 2015. a
Langen, P. L., Fausto, R. S., Vandecrux, B., Mottram, R. H., and Box, J. E.: Liquid Water Flow and Retention on the Greenland Ice Sheet in the Regional Climate Model HIRHAM5: Local and Large-Scale Impacts, Front. Earth Sci., 4, https://doi.org/10.3389/feart.2016.00110, 2017. a, b
Lea, J.: The Google Earth Engine Digitisation Tool (GEEDiT) and the Margin change Quantification Tool (MaQiT) – Simple tools for the rapid mapping and quantification of changing Earth surface margins, Earth Surf. Dyn., 6, 551–561, https://doi.org/10.5194/esurf-6-551-2018, 2018. a
Lippert, E. Y. H., Morlighem, M., Cheng, G., Berg, D. L., Hassan, J., and Khan, S. A.: Ice Front and Mélange Dynamics at Kangerlussuaq Glacier, Eastern Greenland, Since 1981, and Future Stability, Geophys. Res. Lett., 52, e2024GL113982, https://doi.org/10.1029/2024GL113982, 2025. a
Loebel, E.: eloebel/glacier-front-extraction: Release v2.0.0, Zenodo [code], https://doi.org/10.5281/zenodo.15295659, 2025. a
Loebel, E., Scheinert, M., Horwath, M., Humbert, A., Sohn, J., Heidler, K., Liebezeit, C., and Zhu, X. X.: Data product of Greenland glacier calving front locations delineated by deep learning, 2013 to 2021, OPARA [data set], https://doi.org/10.25532/OPARA-208, 2023. a, b, c
Loebel, E., Scheinert, M., Horwath, M., Humbert, A., Sohn, J., Heidler, K., Liebezeit, C., and Zhu, X. X.: Calving front monitoring at a subseasonal resolution: a deep learning application for Greenland glaciers, The Cryosphere, 18, 3315–3332, https://doi.org/10.5194/tc-18-3315-2024, 2024. a, b, c, d
Lucas‐Picher, P., Wulff‐Nielsen, M., Christensen, J. H., Aðalgeirsdóttir, G., Mottram, R., and Simonsen, S. B.: Very high resolution regional climate model simulations over Greenland: Identifying added value, J. Geophys Res. Atmos., 117, 2011JD016267, https://doi.org/10.1029/2011JD016267, 2012. a
Meire, L., Mortensen, J., Meire, P., Juul‐Pedersen, T., Sejr, M. K., Rysgaard, S., Nygaard, R., Huybrechts, P., and Meysman, F. J. R.: Marine‐terminating glaciers sustain high productivity in Greenland fjords, Glob. Change Biol., 23, 5344–5357, https://doi.org/10.1111/gcb.13801, 2017. a
Meng, Y., Lai, C.-Y., Culberg, R., Shahin, M. G., Stearns, L. A., Burton, J. C., and Nissanka, K.: Seasonal changes of mélange thickness coincide with Greenland calving dynamics, Nat. Commun., 16, 573, https://doi.org/10.1038/s41467-024-55241-7, 2025. a, b, c, d, e, f
Moon, T., Joughin, I., and Smith, B.: Seasonal to multiyear variability of glacier surface velocity, terminus position, and sea ice/ice mélange in northwest Greenland, J. Geophys. Res. Earth Surf., 120, 818–833, https://doi.org/10.1002/2015JF003494, 2015. a, b, c
Moon, T., Sutherland, D. A., Carroll, D., Felikson, D., Kehrl, L., and Straneo, F.: Subsurface iceberg melt key to Greenland fjord freshwater budget, Nat. Geosci., 11, 49–54, https://doi.org/10.1038/s41561-017-0018-z, 2018. a
Morlighem, M., Williams, C. N., Rignot, E., An, L., Arndt, J. E., Bamber, J. L., Catania, G., Chauché, N., Dowdeswell, J. A., Dorschel, B., Fenty, I., Hogan, K., Howat, I., Hubbard, A., Jakobsson, M., Jordan, T. M., Kjeldsen, K. K., Millan, R., Mayer, L., Mouginot, J., Noël, B. P. Y., O'Cofaigh, C., Palmer, S., Rysgaard, S., Seroussi, H., Siegert, M. J., Slabon, P., Straneo, F., van den Broeke, M. R., Weinrebe, W., Wood, M., and Zinglersen, K. B.: BedMachine v3: Complete Bed Topography and Ocean Bathymetry Mapping of Greenland From Multibeam Echo Sounding Combined With Mass Conservation, Geophys. Res. Lett., 44, 11,051–11,061, https://doi.org/10.1002/2017GL074954, 2017. a
Nissanka, K., Vora, N., Méndez Harper, J., Burton, J. C., Amundson, J. M., Robel, A. A., Meng, Y., and Lai, C.: Laboratory Experiments Reveal Transient Fluctuations in Ice Mélange Velocity and Stress During Periods of Quasistatic Flow, J. Geophys. Res.: Earth Surface, 130, e2024JF008071, https://doi.org/10.1029/2024JF008071, 2025. a
Ochwat, N. E., Scambos, T. A., Banwell, A. F., Anderson, R. S., Maclennan, M. L., Picard, G., Shates, J. A., Marinsek, S., Margonari, L., Truffer, M., and Pettit, E. C.: Triggers of the 2022 Larsen B multi-year landfast sea ice breakout and initial glacier response, The Cryosphere, 18, 1709–1731, https://doi.org/10.5194/tc-18-1709-2024, 2024. a
Otosaka, I. N., Shepherd, A., Ivins, E. R., Schlegel, N.-J., Amory, C., van den Broeke, M. R., Horwath, M., Joughin, I., King, M. D., Krinner, G., Nowicki, S., Payne, A. J., Rignot, E., Scambos, T., Simon, K. M., Smith, B. E., Sørensen, L. S., Velicogna, I., Whitehouse, P. L., A, G., Agosta, C., Ahlstrøm, A. P., Blazquez, A., Colgan, W., Engdahl, M. E., Fettweis, X., Forsberg, R., Gallée, H., Gardner, A., Gilbert, L., Gourmelen, N., Groh, A., Gunter, B. C., Harig, C., Helm, V., Khan, S. A., Kittel, C., Konrad, H., Langen, P. L., Lecavalier, B. S., Liang, C.-C., Loomis, B. D., McMillan, M., Melini, D., Mernild, S. H., Mottram, R., Mouginot, J., Nilsson, J., Noël, B., Pattle, M. E., Peltier, W. R., Pie, N., Roca, M., Sasgen, I., Save, H. V., Seo, K.-W., Scheuchl, B., Schrama, E. J. O., Schröder, L., Simonsen, S. B., Slater, T., Spada, G., Sutterley, T. C., Vishwakarma, B. D., van Wessem, J. M., Wiese, D., van der Wal, W., and Wouters, B.: Mass balance of the Greenland and Antarctic ice sheets from 1992 to 2020, Earth Syst. Sci. Data, 15, 1597–1616, https://doi.org/10.5194/essd-15-1597-2023, 2023. a
Peters, I. R., Amundson, J. M., Cassotto, R., Fahnestock, M., Darnell, K. N., Truffer, M., and Zhang, W. W.: Dynamic jamming of iceberg‐choked fjords, Geophys. Res. Lett., 42, 1122–1129, https://doi.org/10.1002/2014GL062715, 2015. a, b, c
Puggaard, A., Hansen, N., Mottram, R., Nagler, T., Scheiblauer, S., Simonsen, S. B., Sørensen, L. S., Wuite, J., and Solgaard, A. M.: Bias in modeled Greenland Ice Sheet melt revealed by ASCAT, The Cryosphere, 19, 2963–2981, https://doi.org/10.5194/tc-19-2963-2025, 2025. a
Rabault, J., Nose, T., Hope, G., Müller, M., Breivik, O., Voermans, J., Hole, L. R., Bohlinger, P., Waseda, T., Kodaira, T., Katsuno, T., Johnson, M., Sutherland, G., Johansson, M., Christensen, K. H., Garbo, A., Jensen, A., Gundersen, O., Marchenko, A., and Babanin, A.: OpenMetBuoy-v2021: An Easy-to-Build, Affordable, Customizable, Open-Source Instrument for Oceanographic Measurements of Drift and Waves in Sea Ice and the Open Ocean, Geosciences, 12, 110, https://doi.org/10.3390/geosciences12030110, 2022. a
Rasmussen, T., Ribegaard, M., Ringgaard, I., Olsen, S., Gierisch, A., and Korabel, V.: DMI Report 21-21 Arctic ocean and sea ice – from a Greenlandic fjord to large scale Arctic sea ice changes, DMI Report DMI 21-21, Danish Meteorological Institute, Copenhagen, Denmark, https://www.dmi.dk/publikationer/ (last access: 3 August 2026), 2021. a
Robel, A. A.: Thinning sea ice weakens buttressing force of iceberg mélange and promotes calving, Nat. Commun., 8, 14596, https://doi.org/10.1038/ncomms14596, 2017. a, b, c, d, e, f, g
Sakakibara, D. and Sugiyama, S.: Ice front and flow speed variations of marine-terminating outlet glaciers along the coast of Prudhoe Land, northwestern Greenland, J. Glaciol., 64, 300–310, https://doi.org/10.1017/jog.2018.20, 2018. a, b, c, d
Sakakibara, D. and Sugiyama, S.: Seasonal ice-speed variations in 10 marine-terminating outlet glaciers along the coast of Prudhoe Land, northwestern Greenland, J. Glaciol., 66, 25–34, https://doi.org/10.1017/jog.2019.81, 2020. a, b
Schlemm, T., Feldmann, J., Winkelmann, R., and Levermann, A.: Stabilizing effect of mélange buttressing on the marine ice-cliff instability of the West Antarctic Ice Sheet, The Cryosphere, 16, 1979–1996, https://doi.org/10.5194/tc-16-1979-2022, 2022. a
Seroussi, H., Nowicki, S., Payne, A. J., Goelzer, H., Lipscomb, W. H., Abe-Ouchi, A., Agosta, C., Albrecht, T., Asay-Davis, X., Barthel, A., Calov, R., Cullather, R., Dumas, C., Galton-Fenzi, B. K., Gladstone, R., Golledge, N. R., Gregory, J. M., Greve, R., Hattermann, T., Hoffman, M. J., Humbert, A., Huybrechts, P., Jourdain, N. C., Kleiner, T., Larour, E., Leguy, G. R., Lowry, D. P., Little, C. M., Morlighem, M., Pattyn, F., Pelle, T., Price, S. F., Quiquet, A., Reese, R., Schlegel, N.-J., Shepherd, A., Simon, E., Smith, R. S., Straneo, F., Sun, S., Trusel, L. D., Van Breedam, J., van de Wal, R. S. W., Winkelmann, R., Zhao, C., Zhang, T., and Zwinger, T.: ISMIP6 Antarctica: a multi-model ensemble of the Antarctic ice sheet evolution over the 21st century, The Cryosphere, 14, 3033–3070, https://doi.org/10.5194/tc-14-3033-2020, 2020. a
Shepherd, A., Ivins, E., Rignot, E., Smith, B., van den Broeke, M., Velicogna, I., Whitehouse, P., Briggs, K., Joughin, I., Krinner, G., Nowicki, S., Payne, T., Scambos, T., Schlegel, N., A, G., Agosta, C., Ahlstrøm, A., Babonis, G., Barletta, V. R., Bjørk, A. A., Blazquez, A., Bonin, J., Colgan, W., Csatho, B., Cullather, R., Engdahl, M. E., Felikson, D., Fettweis, X., Forsberg, R., Hogg, A. E., Gallee, H., Gardner, A., Gilbert, L., Gourmelen, N., Groh, A., Gunter, B., Hanna, E., Harig, C., Helm, V., Horvath, A., Horwath, M., Khan, S., Kjeldsen, K. K., Konrad, H., Langen, P. L., Lecavalier, B., Loomis, B., Luthcke, S., McMillan, M., Melini, D., Mernild, S., Mohajerani, Y., Moore, P., Mottram, R., Mouginot, J., Moyano, G., Muir, A., Nagler, T., Nield, G., Nilsson, J., Noël, B., Otosaka, I., Pattle, M. E., Peltier, W. R., Pie, N., Rietbroek, R., Rott, H., Sandberg Sørensen, L., Sasgen, I., Save, H., Scheuchl, B., Schrama, E., Schröder, L., Seo, K.-W., Simonsen, S. B., Slater, T., Spada, G., Sutterley, T., Talpe, M., Tarasov, L., van de Berg, W. J., van der Wal, W., van Wessem, M., Vishwakarma, B. D., Wiese, D., Wilton, D., Wagner, T., Wouters, B., Wuite, J., and The IMBIE Team: Mass balance of the Greenland Ice Sheet from 1992 to 2018, Nature, 579, 233–239, https://doi.org/10.1038/s41586-019-1855-2, 2020. a
Sinergise, S.-H. b.: Highlight Optimized Natural Color Script, Sentinel Hub [code], https://custom-scripts.sentinel-hub.com/custom-scripts/sentinel-2/highlight_optimized_natural_color/ (last access: 3 August 2026), 2025. a, b, c, d
Slater, D. A., Carroll, D., Oliver, H., Hopwood, M. J., Straneo, F., Wood, M., Willis, J. K., and Morlighem, M.: Characteristic Depths, Fluxes, and Timescales for Greenland's Tidewater Glacier Fjords From Subglacial Discharge‐Driven Upwelling During Summer, Geophys. Res. Lett., 49, e2021GL097081, https://doi.org/10.1029/2021GL097081, 2022. a
Solgaard, A., Kusk, A., Merryman Boncori, J. P., Dall, J., Mankoff, K. D., Ahlstrøm, A. P., Andersen, S. B., Citterio, M., Karlsson, N. B., Kjeldsen, K. K., Korsgaard, N. J., Larsen, S. H., and Fausto, R. S.: Greenland ice velocity maps from the PROMICE project, Earth Syst. Sci. Data, 13, 3491–3512, https://doi.org/10.5194/essd-13-3491-2021, 2021. a, b, c, d, e
Solgaard, A. M., Rapp, D., Noël, B. P. Y., and Hvidberg, C. S.: Seasonal Patterns of Greenland Ice Velocity From Sentinel‐1 SAR Data Linked to Runoff, Geophys. Res. Lett., 49, e2022GL100343, https://doi.org/10.1029/2022GL100343, 2022. a, b, c, d
Surawy-Stepney, T., Hogg, A. E., Cornford, S. L., Wallis, B. J., Davison, B. J., Selley, H. L., Slater, R. A. W., Lie, E. K., Jakob, L., Ridout, A., Gourmelen, N., Freer, B. I. D., Wilson, S. F., and Shepherd, A.: The effect of landfast sea ice buttressing on ice dynamic speedup in the Larsen B embayment, Antarctica, The Cryosphere, 18, 977–993, https://doi.org/10.5194/tc-18-977-2024, 2024. a, b, c, d, e
Urbanski, J. A.: A GIS tool for two-dimensional glacier-terminus change tracking, Comput. Geosci., 111, 97–104, https://doi.org/10.1016/j.cageo.2017.11.004, 2018. a
Vandecrux, B., Fausto, R. S., Box, J. E., Covi, F., Hock, R., Rennermalm, Å. K., Heilig, A., Abermann, J., van As, D., Bjerre, E., Fettweis, X., Smeets, P. C. J. P., Kuipers Munneke, P., van den Broeke, M. R., Brils, M., Langen, P. L., Mottram, R., and Ahlstrøm, A. P.: Recent warming trends of the Greenland ice sheet documented by historical firn and ice temperature observations and machine learning, The Cryosphere, 18, 609–631, https://doi.org/10.5194/tc-18-609-2024, 2024. a
VanderPlas, J. T.: Understanding the Lomb–Scargle Periodogram, ApJS, 236, 16, https://doi.org/10.3847/1538-4365/aab766, 2018. a, b
Vaňková, I.: Calving prediction from ice mélange motion, Nat. Geosci., 14, 357–358, https://doi.org/10.1038/s41561-021-00752-x, 2021. a
Walter, J. I., Box, J. E., Tulaczyk, S., Brodsky, E. E., Howat, I. M., Ahn, Y., and Brown, A.: Oceanic mechanical forcing of a marine-terminating Greenland glacier, Ann. Glaciol., 53, 181–192, https://doi.org/10.3189/2012AoG60A083, 2012. a
Wang, Y., Sugiyama, S., and Bjørk, A. A.: Surface Elevation Change of Glaciers Along the Coast of Prudhoe Land, Northwestern Greenland From 1985 to 2018, J. Geophys. Res.: Earth Surface, 126, e2020JF006 038, https://doi.org/10.1029/2020JF006038, 2021. a, b
Wehrlé, A., Lüthi, M. P., and Vieli, A.: The control of short-term ice mélange weakening episodes on calving activity at major Greenland outlet glaciers, The Cryosphere, 17, 309–326, https://doi.org/10.5194/tc-17-309-2023, 2023. a, b, c
Weiss, M.: Apparent diurnal effects in the global positioning system, IEEE Trans. Instrum. Meas., 38, 991–997, https://doi.org/10.1109/19.39042, 1989. a
Wheel, I., Crawford, A. J., and Benn, D. I.: Calving dynamics at Jakobshavn Isbræ (Sermeq Kujalleq) controlled by local geometry: insights from a 3D Stokes calving model, J. Glaciol., 70, e7, https://doi.org/10.1017/jog.2024.77, 2024. a
Willis, J. K., Carroll, D., Fenty, I., Kohli, G., Khazendar, A., Rutherford, M., Trenholm, N., and Morlighem, M.: Ocean-Ice Interactions in Inglefield Gulf: Early Results from NASA’s Oceans Melting Greenland Mission, Oceanography, 31, 100–108, https://www.jstor.org/stable/26542656 (last access: 3 August 2026), 2018. a, b, c, d, e, f
- Abstract
- Introduction
- Methods and data
- Results
- Discussion
- Conclusions
- Appendix A: Calving Event Analysis
- Appendix B: Satellite observed velocity and strain rate fields
- Code availability
- Data availability
- Video supplement
- Author contributions
- Competing interests
- Disclaimer
- Special issue statement
- Acknowledgements
- Financial support
- Review statement
- References
- Abstract
- Introduction
- Methods and data
- Results
- Discussion
- Conclusions
- Appendix A: Calving Event Analysis
- Appendix B: Satellite observed velocity and strain rate fields
- Code availability
- Data availability
- Video supplement
- Author contributions
- Competing interests
- Disclaimer
- Special issue statement
- Acknowledgements
- Financial support
- Review statement
- References