
the Creative Commons Attribution 4.0 License.
the Creative Commons Attribution 4.0 License.
 | 21 Aug 2026
On the reliability of seasonal snow forecasts
Yvan Orsolini
Patricia de Rosnay
Jonathan Day
Retish Senan
Damien Decremer
Frederic Vitart
Reliable information on seasonal snow conditions is important for long-range weather forecasting and climate modeling. The reliability of winter-mean hindcasts of snow water equivalent (SWE) produced by the ECMWF for the period 1993–2022 within the CopERnIcus climate change Service Evolution (CERISE) project is evaluated in this study. In probabilistic forecasting, reliability is defined as the consistency between forecast probabilities and observed frequencies for a binary event. Here, reliability is assessed using two independent SWE datasets (ERA5-Land and ESA Snow-CCI v4) across eight land regions in the Northern Hemisphere non-mountainous regions. The reliability assessment is performed for two tercile-based binary events representing low- and high snow accumulation winters. Reliability is quantified using a weighted linear regression applied to reliability diagrams and is grouped into five categories from perfect to dangerous. The results show that the ECMWF seasonal snow hindcasts consistently yield marginally useful to perfect reliability categories for both low- and high-snow conditions independently to the chosen benchmark. The assessment shows sensitivity to the choice of verification dataset, with ERA5-Land yielding higher reliability categories than ESA Snow-CCI, typically 1 to 2 categories higher. It is found that differences in hindcasts reliability between regions and between verification datasets may be linked to snow variability, model representation, and observational uncertainty.
- Article
(6339 KB) - Full-text XML
- BibTeX
- EndNote


Snow plays a crucial role for the surface energy budget of the hydrological and climate systems, making it an important component in climate simulations and long-range weather forecasts. The amount of water stored in a snowpack, known as snow water equivalent (SWE), is a key parameter for flood risk assessment, water resource management, and, more broadly, land-atmosphere coupling and climate modeling. In the warming world, snow conditions are undergoing substantial changes. The global snow cover extent has been shown to decline over the last decades in both models and observations (Bormann et al., 2018; Mudryk et al., 2020; Fox-Kemper et al., 2021) and the length of the snow season has been shown to diminish in mountain regions (Notarnicola, 2020). Snow droughts, either driven by deficits in snowy precipitation or by premature snowmelts, have been linked to hydrological extremes (Zhang et al., 2025). On local scales, a reduction of the fraction of solid to liquid precipitation in mountain regions has also been linked to rainfall extremes and associated hazards (Ombadi et al., 2023).
Given the changes in snow accumulation, melt, and associated hydrological hazards, reliable seasonal predictions of snow conditions are becoming increasingly important. Seasonal snow forecasts are routinely provided by operational meteorological prediction centres, using state-of-the-art ensemble dynamical prediction systems, based on coupled atmosphere-ocean models. In such forecasts, snow variables are initialized as realistically as possible through data assimilation (DA) methods of varying complexity, which ingest in-situ and space-borne observations. There are currently considerable efforts to improve the fidelity and reliability of such seasonal forecasts, as well as the initialization of land variables, including snow.
Realistic initial snow conditions can improve forecast skill not only for snow itself but also for other surface and atmospheric variables through its high albedo and low thermal conductivity, as well as its delayed influence on soil moisture (Orsolini et al., 2013; Jeong et al., 2013; Li et al., 2019). Improved forecasts of snow variables may also enhance the representation of large-scale atmospheric circulation in regions with strong snow–atmosphere coupling, such as East Asia (Komatsu et al., 2023). However, seasonal forecasting models have limitations, such as various parametrizations or their relatively coarse horizontal resolution which does not allow resolving snow heterogeneities. Similarly, data ingested through DA have limitations, such as the sparsity and non-representativeness of in-situ station data, or the observational constraints and errors of remotely sensed data. In addition, DA approaches used in prediction centres have also limitations e.g., assimilation might not be performed in mountain regions.
While seasonal forecast systems are often evaluated in terms of skill (e.g. Orsolini et al., 2013; Li et al., 2019; Li and Song, 2024) and their ability to capture large-scale modes of variability (e.g. Wegmann et al., 2021), an equally important aspect of forecast quality is their statistical reliability, i.e. the consistency between forecast probabilities and observed frequencies. Reliability diagrams, used to illustrate this consistency, are among the diagnostic measures incorporated in the World Meteorological Organization Standardized Verification System for Long-Range Forecasts (World Meteorological Organization, 1992). Reliability of seasonal-mean near-surface temperature and precipitation forecasted by the European Centre for Medium-Range Weather Forecasts (ECMWF) Integrated Forecasting System (IFS) 4 was examined in Weisheimer and Palmer (2014). Building on the same methodology, Manzanas et al. (2022) quantified changes in near-surface temperature and precipitation in the current operational ECMWF seasonal forecasting system, SEAS5, over System 4. Reliability assessment has also been used as a validation approach for model bias correction and downscaling methods (Manzanas et al., 2018). However, such assessment has never been performed for probabilistic snow forecasts.
The aim of this study is to fill this gap and to address the following question: How reliable are seasonal forecasts of snow? To that end, the reliability assessment is applied to seasonal snow hindcasts produced by the ECMWF in the framework of the CopERnIcus climate change Service Evolution (CERISE) project (see acknowledgments and https://cerise-project.eu/, last access: 19 August 2026), which is aimed at enhancing the quality of the Copernicus Climate Change Service (C3S) reanalysis and seasonal forecast products by means of improved land-atmosphere data assimilation and land surface initialization. The estimated reliability of probabilistic snow forecasts will, naturally, depend on the snow product they are assessed against. Numerous snow products are now available to meet the growing demand for historical snow datasets in climate, hydrology and cryosphere research. Recent study by Mudryk et al. (2025) compared twenty three historical gridded snow products against a combination of in-situ snow course and airborne gamma-ray based measurements. Based on the overall assessment, the best performing product was shown to be the ERA5-Land reanalysis (Muñoz Sabater et al., 2021) albeit it is an off-line surface model run which does not assimilate snow measurements. However, for non-mountainous Eurasia, the European Space Agency (ESA) Climate Change Initiative (CCI) Snow project (hereafter ESA Snow-CCI) product, combining space-born observations of passive microwave brightness temperatures and in-situ measurements of snow depth, scored second-best. Therefore, in this study the winter-mean ECMWF hindcasts of snow water equivalent are evaluated against two products, namely, the ERA5-Land reanalysis and ESA Snow-CCI version 4. The reliability assessment is performed over the years 1993–2022 in eight land regions in the Northern Hemisphere excluding mountainous regions.
The paper is organized as following. An introduction into the basics of the reliability assessment is given in Sect. 2.1. All datasets used for the analysis are described in Sect. 2.2–2.4. The results are presented in Sect. 3 and discussed in Sect. 4. The conclusions are drawn in Sect. 5.
2.1 What is a reliable forecast?
The Brier score is a simple measure of error in probabilistic forecasting (Brier, 1950). It is often used in binary situations when an event of interest either occurs or not, for example snow amount exceeds 1 cm of SWE in a particular geographical location. It calculates the mean squared error between the forecast probabilities and observed outcomes and is expressed as
where n is the number of forecasts, fi is the forecast probability of the considered binary event for the ith forecast, and oi is the associated outcome (1 if event occurs in verification data and 0 if it does not). One can decompose the Brier score into the uncertainty (UNC), reliability (REL) and resolution (RES) components as
where is the climatological probability of the event, m is the number of probability bins into which the forecasts are grouped, fk is the average forecast probability in bin k, and is the relative frequency of occurrence in bin k. From Eq. (2), it is clear that only REL and RES terms reflect the forecast performance. For a detailed interpretation of the individual terms in Eq. (2), see Hsu and Murphy (1986).
The level of the Brier score improvement compared to that of a reference forecast is represented via the Brier skill score
here, positive BSS values indicate that the forecast performs better than the reference forecast. It is a common practice to use the forecast climatology () as the baseline reference. In such case, Eq. (3) simplifies to (e.g., Mason, 2004), and positive BSS values, therefore, correspond to RES>REL.
Reliability diagrams, also known as Attributes Diagrams (Hsu and Murphy, 1986), are commonly used to illustrate the last two components of the Brier Score. A step-by-step procedure to construct a reliability diagram is as follows. First define binary event based on a climatological threshold (e.g., value is below the median or above the upper tercile). Second, compute the corresponding climatological thresholds separately for the forecast and verification data at each grid point. Third, define discrete forecast probability bins (for example, 0–0.2, 0.2–0.4, and so on) into which forecast probabilities will be grouped. Fourth, for each year and each grid point within a region (see land regions in Sect. 2.4), compute the forecast probability of the binary event as a fraction of ensemble members for which the binary event occurs, assign this probability to the appropriate bin and record whether the same binary event occurred in the verification data. Finally, within each probability bin, count the number of forecasts that fall into it and the number of times the event occurred in verification data. The observed frequency in probability bin k, , is then calculated as the ratio of the number of occurrences in verification data to the number of forecasts in the bin. Plotting these observed frequencies on vertical axis against the corresponding forecast probabilities on horizontal axis, with the size of each point reflecting the number of forecasts within the corresponding bin, illustrates how well the forecast probabilities match the observed outcomes (Fig. 1). In such a diagram, the distance between the coordinates and the diagonal represents reliability, while the distance to the horizontal climatological probability line represents resolution.
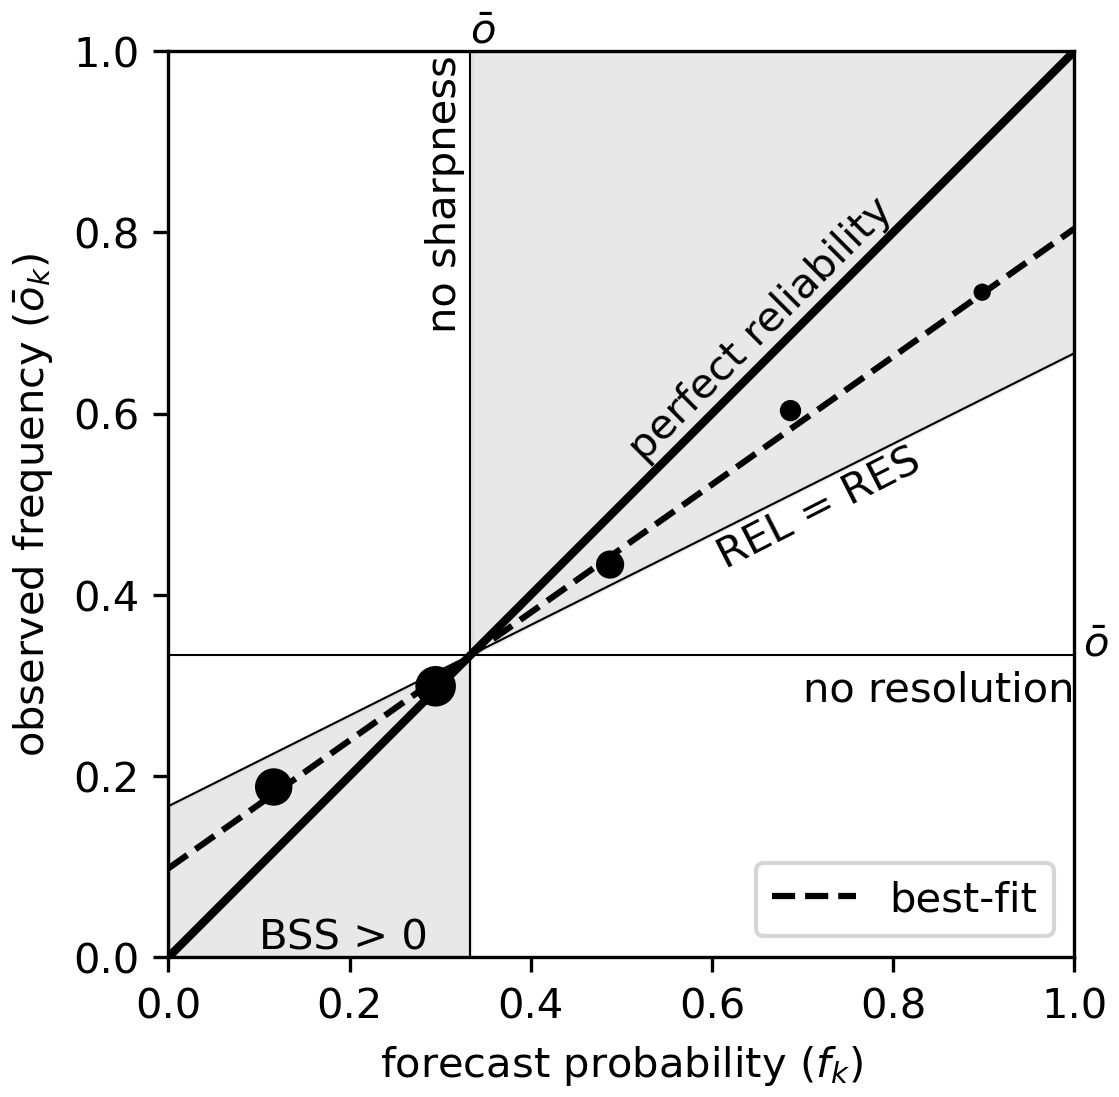
Figure 1An example of a reliability diagram for an upper tercile event (climatological probability ) shown for five forecast probability bins (k=1..m, where m=5). The area with the positive Brier Skill Score (BSS) is shaded gray. The results are based on the ECMWF hindcasts verified against ESA Snow-CCI data over WNAS (Western North Asia) land region (see Sect. 2.4).
Grey area in Fig. 1 corresponds to situations where the Brier Skill Score (BSS), i.e. the Brier Score's improvement over no-skill climatology, is positive (see e.g., Hsu and Murphy, 1986; Mason, 2004). Another feature seen in Fig. 1 is sharpness which reflects the ability of probabilistic forecasts to predict non-climatological probabilities, that is to issue predictions with probabilities close to 0 and 1. Ideally, a probabilistic forecasting system should provide reliable forecasts spanning a wide range of probability intervals, with as many predictions as possible falling within the lowest (around 0) and highest (around 1) probability bins.
Following Weisheimer and Palmer (2014), we fit a weighted linear regression to the data points in the diagram (hereafter best-fit reliability line, shown as dashed line in Fig. 1) to estimate an overall reliability. The weights correspond to the number of forecasts within each probability bin, and the slope of the resulting regression line serves as an indicator of reliability. A perfectly reliable forecast would lie along the diagonal line (with the slope of 1), while deviations from this line indicate over-confidence (slope is less than 1) or under-confidence (slope is more than 1). To assess the uncertainty around the best-fit reliability line, we generate 1000 bootstrap resamples with replacement from the forecast–observation pairs along the time dimension, compute slopes of the best-fit reliability lines, and derive the 90 percent confidence interval from the resampling slope distribution. While the results shown in Sect. 3 are based on the i.i.d. (Independent, Identical Distributed Data) bootstrap, their robustness was verified using a block bootstrap approach with the blocks of three years.
In order to quantify the reliability, we apply categorization based on the slope of the best-fit reliability line and its uncertainty following Weisheimer and Palmer (2014). Five reliability categories can be summarized as following. Category 5 (perfect) – the uncertainty range of the reliability slope lies within the positive BSS area and includes the diagonal, Category 4 (useful) – the uncertainty range of the reliability slope lies within the positive BSS area but does not include the diagonal, Category 3 (marginally useful) – the uncertainty range of the reliability slope is positive but may fall out of the positive BSS area, Category 2 (not useful) – the uncertainty range of the reliability slope includes negative values, Category 1 (dangerous) – the slope of the best-fit reliability line is negative. In addition to these five categories, we further introduce a subdivision for Category 3 based on whether the best-fit reliability slope indicates some degree of skill, similarly to Manzanas et al. (2018). Category 3* is hereafter used when the best-fit slope falls within the positive BSS area, and is referred to as marginally useful improved. Examples of reliability diagrams for different categories are shown in Sect. 3.
2.2 Seasonal snow hindcasts
The seasonal hindcasts used in this study are based on an updated configuration of the ECMWF Seasonal forecasting System (SEAS5, Johnson et al., 2019). The major differences to SEAS5 include an updated cycle of the ECMWF Integrated Forecasting System (IFS) with a new multi-layer snow scheme (Arduini et al., 2019). The atmospheric component of the system is the IFS Cycle 48r1 with a spectral resolution of TCO319 (horizontal resolution of ∼ 36 km) and 137 vertical levels extending up to 0.01 hPa. The oceanic component is based on the NEMO (Nucleus for European Modelling of the Ocean) model, version 3.4.
Within the CERISE project framework (https://www.cerise-project.eu, last access: 19 August 2026), four-month-long hindcasts were initialized four times per year (1 February, 1 May, 1 August, 1 November) every year between 1993 and 2022, producing a 30-year dataset. Each hindcast ensemble consists of 51 members. The hindcasts use fifth generation ECMWF reanalysis (ERA5) initial conditions for both the atmosphere and land surface. ERA5 assimilates in-situ measurements of snow depth from the international synoptic network (SYNOP) and space-borne snow cover data from the Interactive Multisensor Snow and Ice Mapping System (IMS) from 2004. IMS snow cover fraction is converted to snow depth using an empirical conversion rule (de Rosnay et al., 2015). Note also that snow DA is restricted to elevations below 1500 m in ERA5 (de Rosnay et al., 2022). The procedure used to initialize multi-layer snow fields in the forecast model from the single-layer ERA5 snow analysis is described in Sect. 4.1 and Appendix B of Arduini et al. (2019). The ocean and sea-ice initial conditions are based on the ECMWF ORAS5 reanalysis (Zuo et al., 2019).
In this study, we focus on the winter season (December–January–February, DJF) and analyze a set of SWE hindcasts initialized on 1 November 1993–2022.
2.3 Verification datasets
In this study, the reliability assessment of snow hindcasts is performed against two SWE products, namely, ERA5-Land reanalysis (Muñoz Sabater et al., 2021) and ESA Snow-CCI version 4 (Luojus et al., 2025).
ERA5-Land is a high-resolution global land-surface reanalysis produced by ECMWF, forced by near-surface atmospheric fields from ERA5. It produces a total of 50 land-surface variables including snow (for the full list of variables, see Muñoz Sabater et al., 2021). The fine resolution of 0.1∘ makes it particularly valuable for hydrological and climate studies over land. ERA5-Land slightly benefits indirectly from the snow depth and snow temperature DA performed in ERA5 via the atmospheric forcing. The SWE product is provided globally at 1 h temporal resolution from 1950 to present (Muñoz Sabater, 2019). While hourly data are available, ERA5-Land SWE is extracted at 00:00 UTC to ensure time consistency with the output from the hindcasts.
The ESA Snow-CCI SWE product is based on a retrieval methodology that combines space-borne observations of passive microwave brightness temperatures and in-situ measurements of snow depth at synoptic weather stations (Pulliainen, 2006; Takala et al., 2011). In the ESA Snow-CCI version 2, used in the SWE benchmarking study by Mudryk et al. (2025), SWE product is post-corrected by accounting for the snow density variability in time and space (Venäläinen et al., 2021). Starting from version 3.1, variability of snow density fields is implemented into the SWE retrieval following Venäläinen et al. (2023). Here, we use the latest ESA Snow-CCI version 4 product. Daily SWE retrievals are provided in the Northern Hemisphere winter period only (between mid-October and mid-May) and are available in years 1979–2023. The SWE product is provided at 0.1° resolution in the Northern Hemisphere excluding mountainous regions, glaciers and Greenland. The mountain mask is applied to grid cells with high sub-grid elevation variability derived from a high-resolution digital elevation model, where retrievals have known limitations (Luojus et al., 2021; Barella et al., 2024).
2.4 Reliability assessment configuration
Seasonal forecasting primarily targets deviations from the climatological mean. Expressing SWE as anomalies automatically removes systematic model biases relative to verification data. The winter-mean SWE anomalies in both ERA5-Land and ESA Snow-CCI products are calculated with respect to the whole 1993–2022 period. The hindcast anomalies for each ensemble member are calculated with respect to the model mean over the same period. We consider two binary events based on terciles of the long-term distribution: (i) winter-mean SWE anomaly lies below the lower tercile and (ii) winter-mean SWE anomaly lies above the upper tercile at a particular geographical location. In regard to the snow forecasts, these events can be also considered as (i) low – and (ii) high snow accumulation winters.
Reliability assessment of seasonal forecasts, unlike many other skill metrics, requires aggregation of many grid points to obtain large samples due to the limited number of predictions available at a single grid point (equal to the number of years in this study). Based on the spatial distribution of climatological winter-mean SWE in the verification data (Fig. 2a, c) and hindcasts (Fig. 2e), eight large land regions spread over the snow covered areas were selected (Table 1). The span and names of these land regions are based on those used in Giorgi and Francisco (2000) but are adjusted to the needs of our winter snow analysis. First, we do not consider Greenland due to the presence of permanent snow which is often masked with high constant values in general circulation models, but limit our analysis to the continental part. Second, North Asia region was divided into three smaller sub-regions (WNAS, CNAS and ENAS) to balance the distribution and size of land regions over Eurasia. The sample size of each region expressed as a fraction of the number of grid points in the largest region (CNAS) is shown in Table 1. From the climatological winter-mean SWE (Fig. 2a, c, e) and associated standard deviation (Fig. 2b, d, f), it is evident that WNA, NEU and TIB regions partially cover areas with low winter-mean SWE (<3 cm) and high year-to-year SWE variability in hindcasts and verification datasets. Together, these characteristics increase the challenge for prediction. Nevertheless, these regions are included in the reliability assessment to provide a more comprehensive view of ECMWF seasonal prediction performance. Also, note that the region named TIB is much wider than the Tibetan Plateau and encompasses areas of high and low topography.
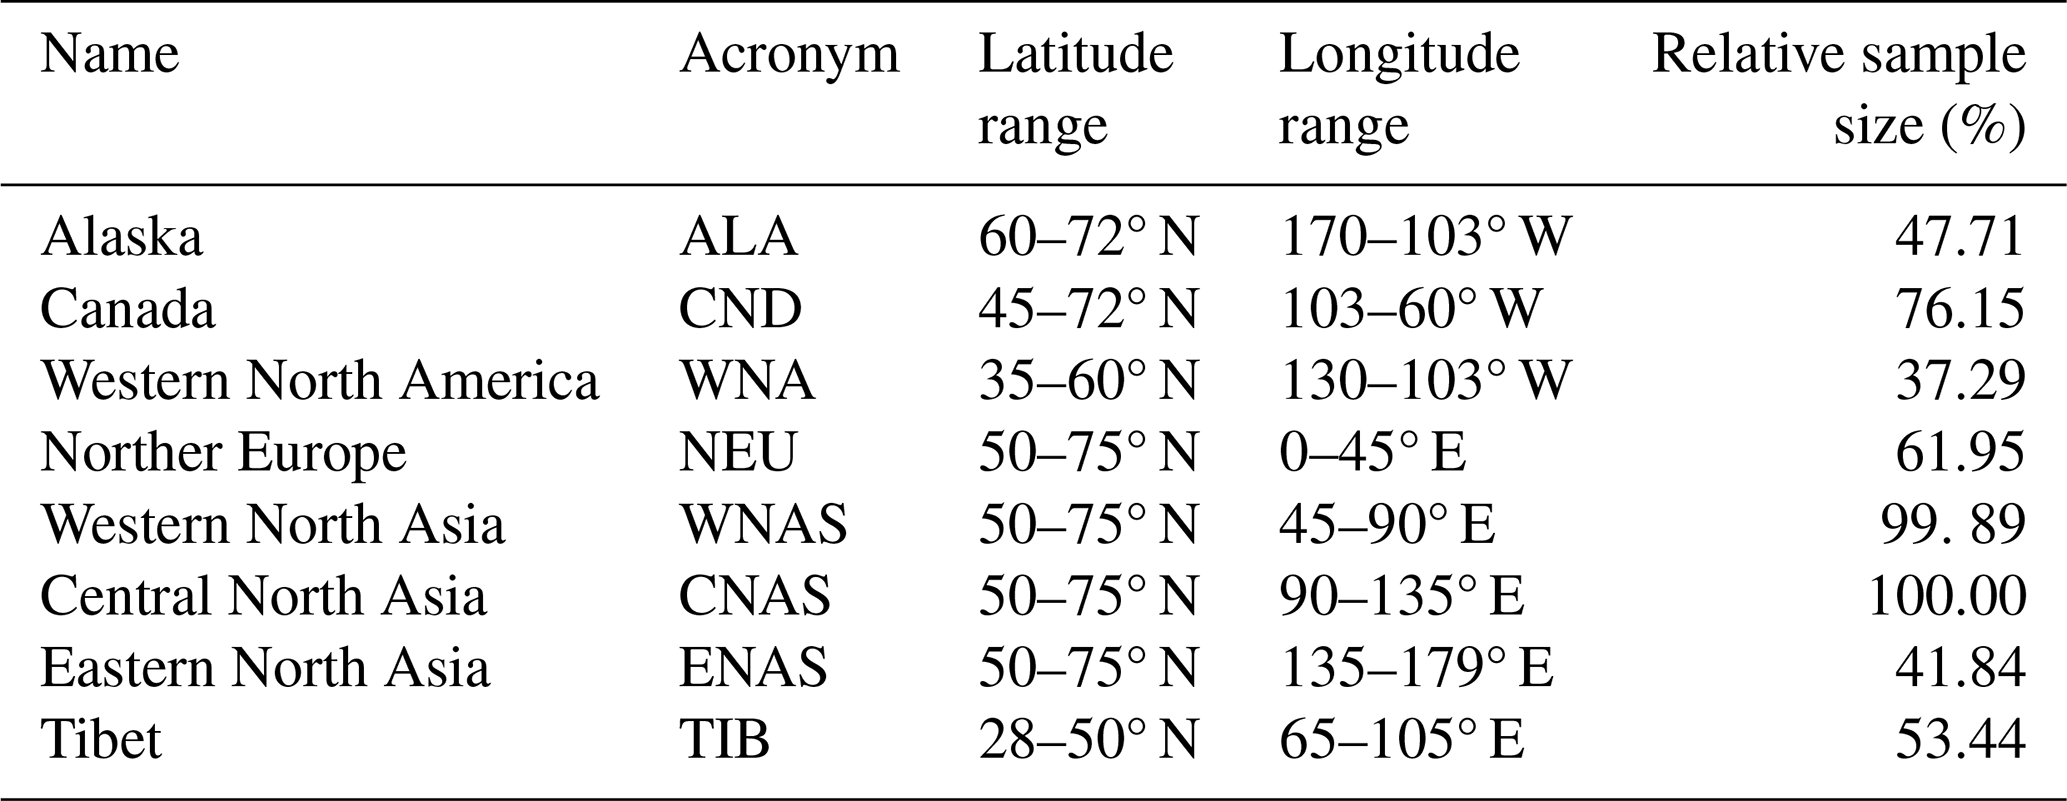
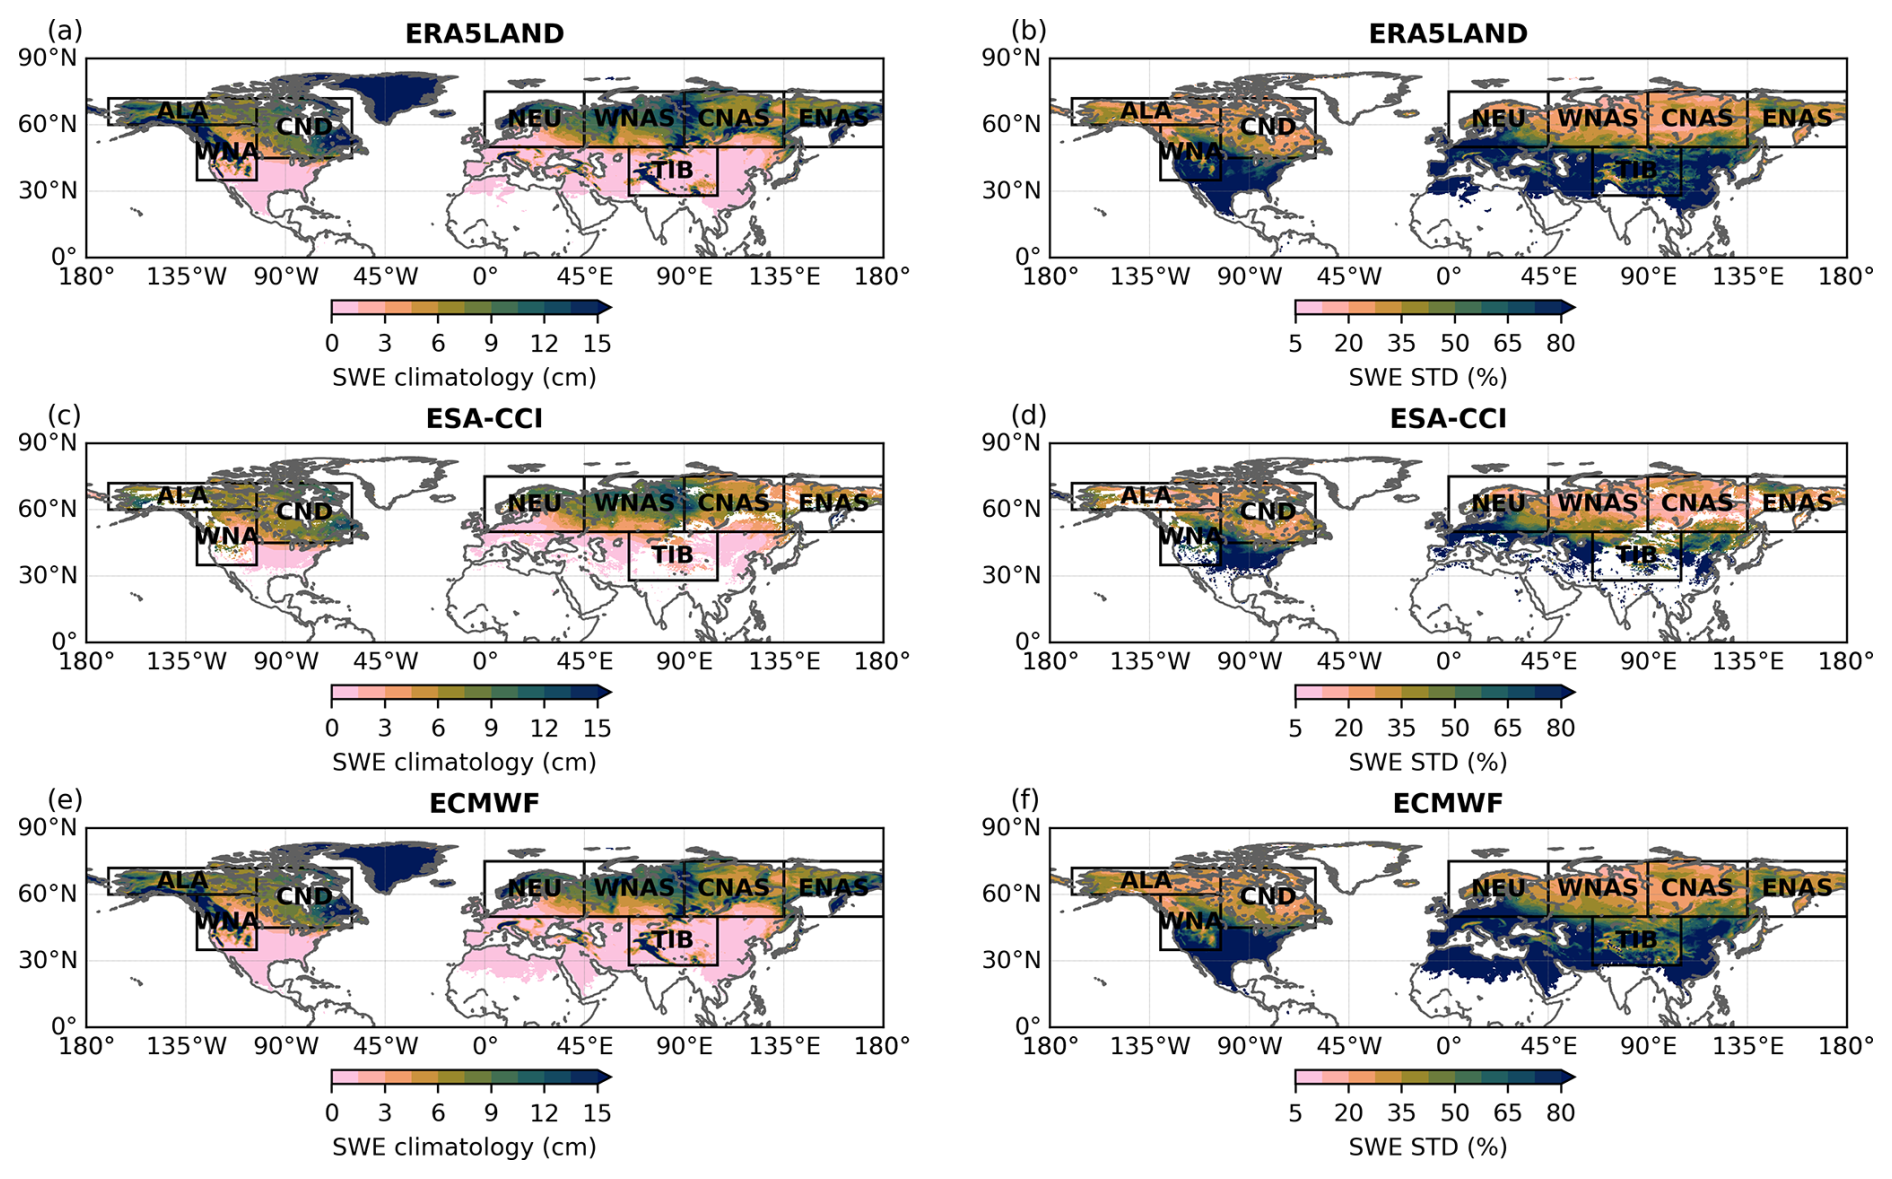
Figure 2Climatological mean SWE and standard deviation (in percent relative to the climatological mean) in DJF 1993–2022 in (a–b) ERA5-Land reanalysis, (c–d) ESA Snow-CCI, (e–f) ECMWF hindcasts. Eight land regions in which reliability assessment is performed (namely, ALA, CND, WNA, NEU, WNAS, CNAS, ENAS, TIB) are shown as black boxes.
To ensure consistency in the reliability assessment, both verification datasets were interpolated onto a uniform latitude–longitude grid with a resolution of 0.25° using bilinear interpolation. As mentioned in Sect. 2.3, ESA Snow-CCI SWE product does not cover mountainous regions. To enable a consistent comparison, the ESA Snow-CCI mountain mask, seen as white areas in Fig. 2c–d, is applied to ERA5-Land dataset. The reliability assessment is, therefore, performed over the non-mountainous terrain in both cases. In addition, data points with snow amount exceeding 1 m of SWE (resulting from the interpolation of permanent snow masked as 10 m of SWE in ERA5-Land and hindcasts) are discarded. This affects regions CND, WNAS and ENAS that include small islands with permanent snow, with the following percentage of data points removed 0.28 %, 0.34 % and 0.22 %, respectively. Note that ESA Snow-CCI has a limit of 0.5 m for SWE product (Luojus et al., 2025).
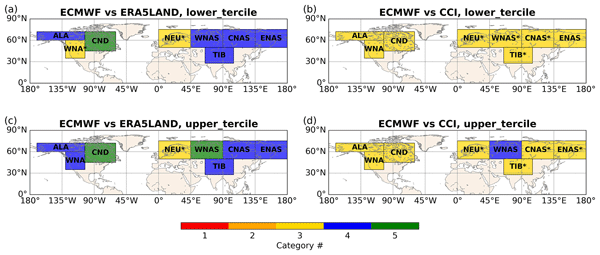
This section summarizes the reliability of ECMWF snow hindcasts in DJF 1993–2022 for low- and high snow accumulation winters as shown in Fig. 3. Figure 3a shows that assessment against ERA5-Land for low snow accumulation winters yields one region with perfect, five regions with useful, and two regions with marginally useful improved reliability categories. The results are substantially different when verified against ESA Snow-CCI (Fig. 3b). In this case, snow hindcasts are assigned marginally useful and marginally useful improved categories in all eight land regions. When verified against ERA5-Land in high snow accumulation winters, snow hindcasts are assigned perfect reliability category in two land regions, useful category in five land regions, and marginally useful improved category in one region (Fig. 3c). Verification against ESA Snow-CCI yields a different picture – only one region is assigned useful reliability category while other seven regions are assigned either marginally useful or marginally useful improved category, see Fig. 3d. While some regional variability in reliability categories is present, the overall hindcast performance is considered good, as only marginally useful to perfect categories (Categories 3–5) are obtained for both verification datasets and tercile events. This is not the case for seasonal forecasts of near surface temperature and precipitation as shown in previous studies (Weisheimer and Palmer, 2014; Manzanas et al., 2018, 2022).
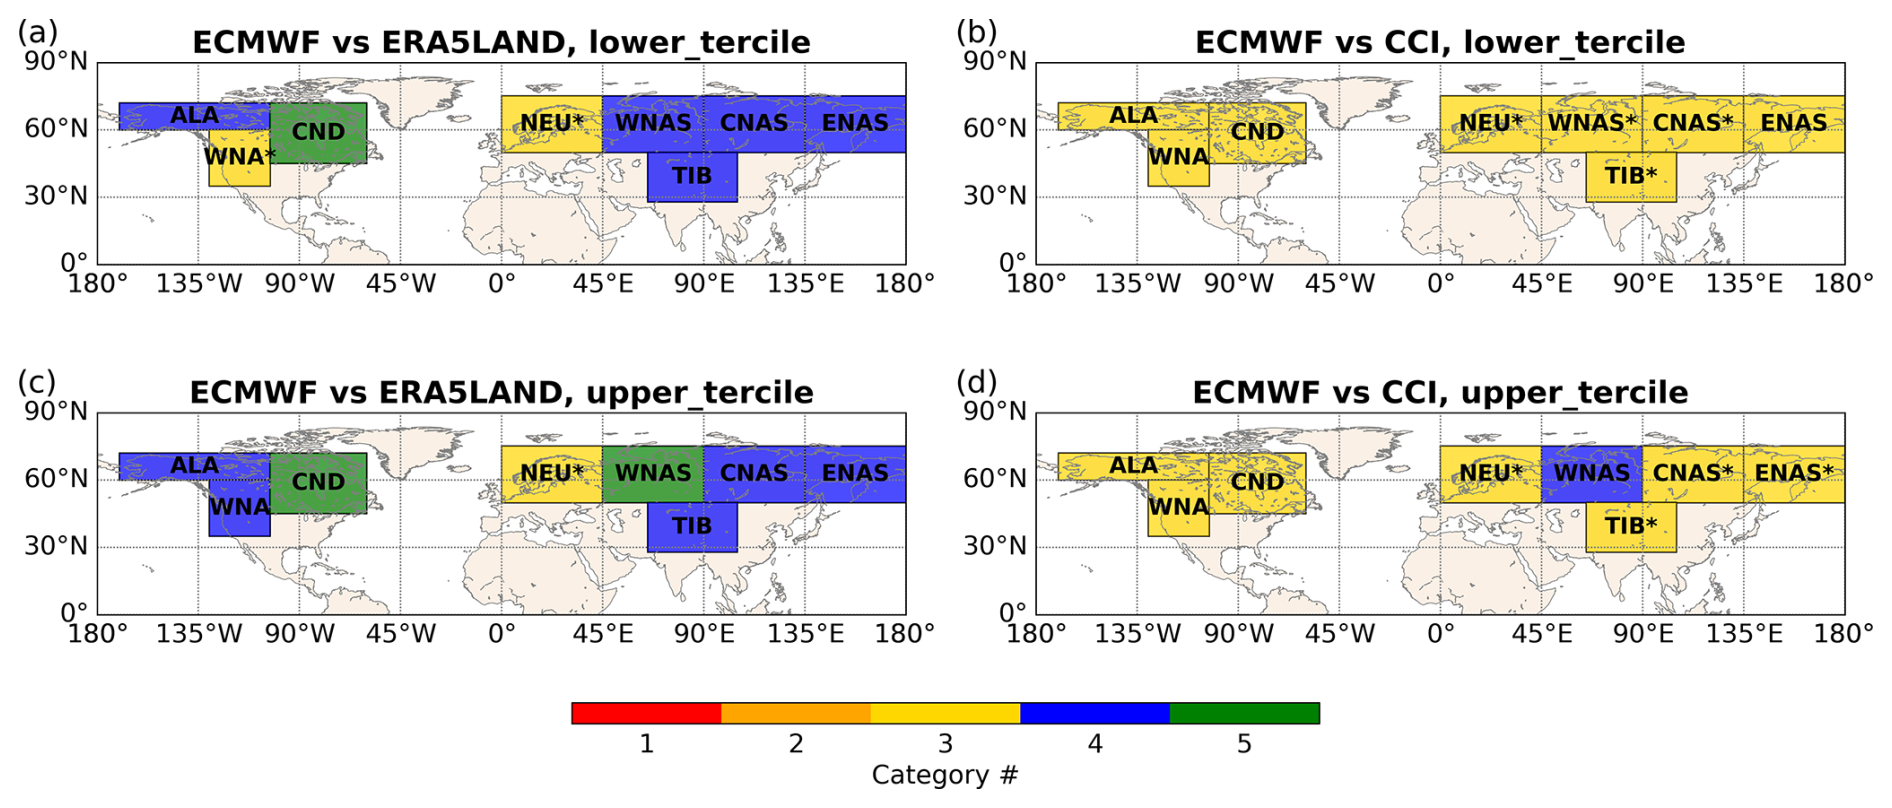
Figure 3Reliability of the ECMWF snow hindcasts in DJF 1993–2022 for low snow accumulation (lower tercile) winters assessed against (a) ERA5-Land, (b) ESA Snow-CCI, and for high snow accumulation (upper tercile) winters assessed against (c) ERA5-Land, (d) ESA Snow-CCI. Reliability categories are color coded. Note that a star sign next to the region name indicates Category 3* (i.e. when the best-fit slope falls within the BSS > 0 area) as described in Sect. 2.4.
Individual reliability diagrams behind the color-coded categories in Fig. 3 are shown in Figs. 4 and 5 for low- and high snow accumulation winters correspondingly. An important aspect of the forecast system seen in these figures is sharpness (see Sect. 2.1). While the ECMWF hindcasts cover a wide range of probabilities, their sharpness is rather limited. ALA, CNAS and ENAS regions are characterized by a strong concentration of forecasts in the lower probability bin (around 38 %–47 % of all predictions in a region), while the occurrence of high-probability forecasts remains modest (around 5 %–13 %). A more balanced distribution between low (29 %–34 %) and near-climatological (34 %–38 %) probabilities is typical for CND and WNAS regions, suggesting weaker forecast confidence and a tendency toward less decisive probability assignments. Finally, three regions are dominated by forecasts close to the climatological mean, indicating limited sharpness. Those are WNA, NEU, and TIB, where the majority of predictions (44 %–58 %) cluster around the climatological mean. The above described patterns show that while the forecast system is capable of issuing a range of probabilities, it frequently favors low or near-climatological probabilities, with comparatively few predictions with high probabilities.
Another important feature seen in Figs. 4 and 5 is the tendency of the ECMWF hindcasts to be over-confident i.e., to issue probabilities that are too extreme (too low for low probability bins and too high for high probability bins). This is reflected by reliability lines with slopes flatter than 45°, although the exact slope depends on the region and verification dataset. Nevertheless, the reliability categories obtained are always marginally useful to prefect, independent of the verification dataset. While reliability categories are generally one category lower when assessed against ESA Snow-CCI, two regions stand out. In CND region, the hindcasts show excellent performance when assessed against ERA5-Land while only marginally useful when compared with ESA Snow-CCI. In NEU region, reliability assessment always yields marginally useful improved category independent of the verification data and binary event.
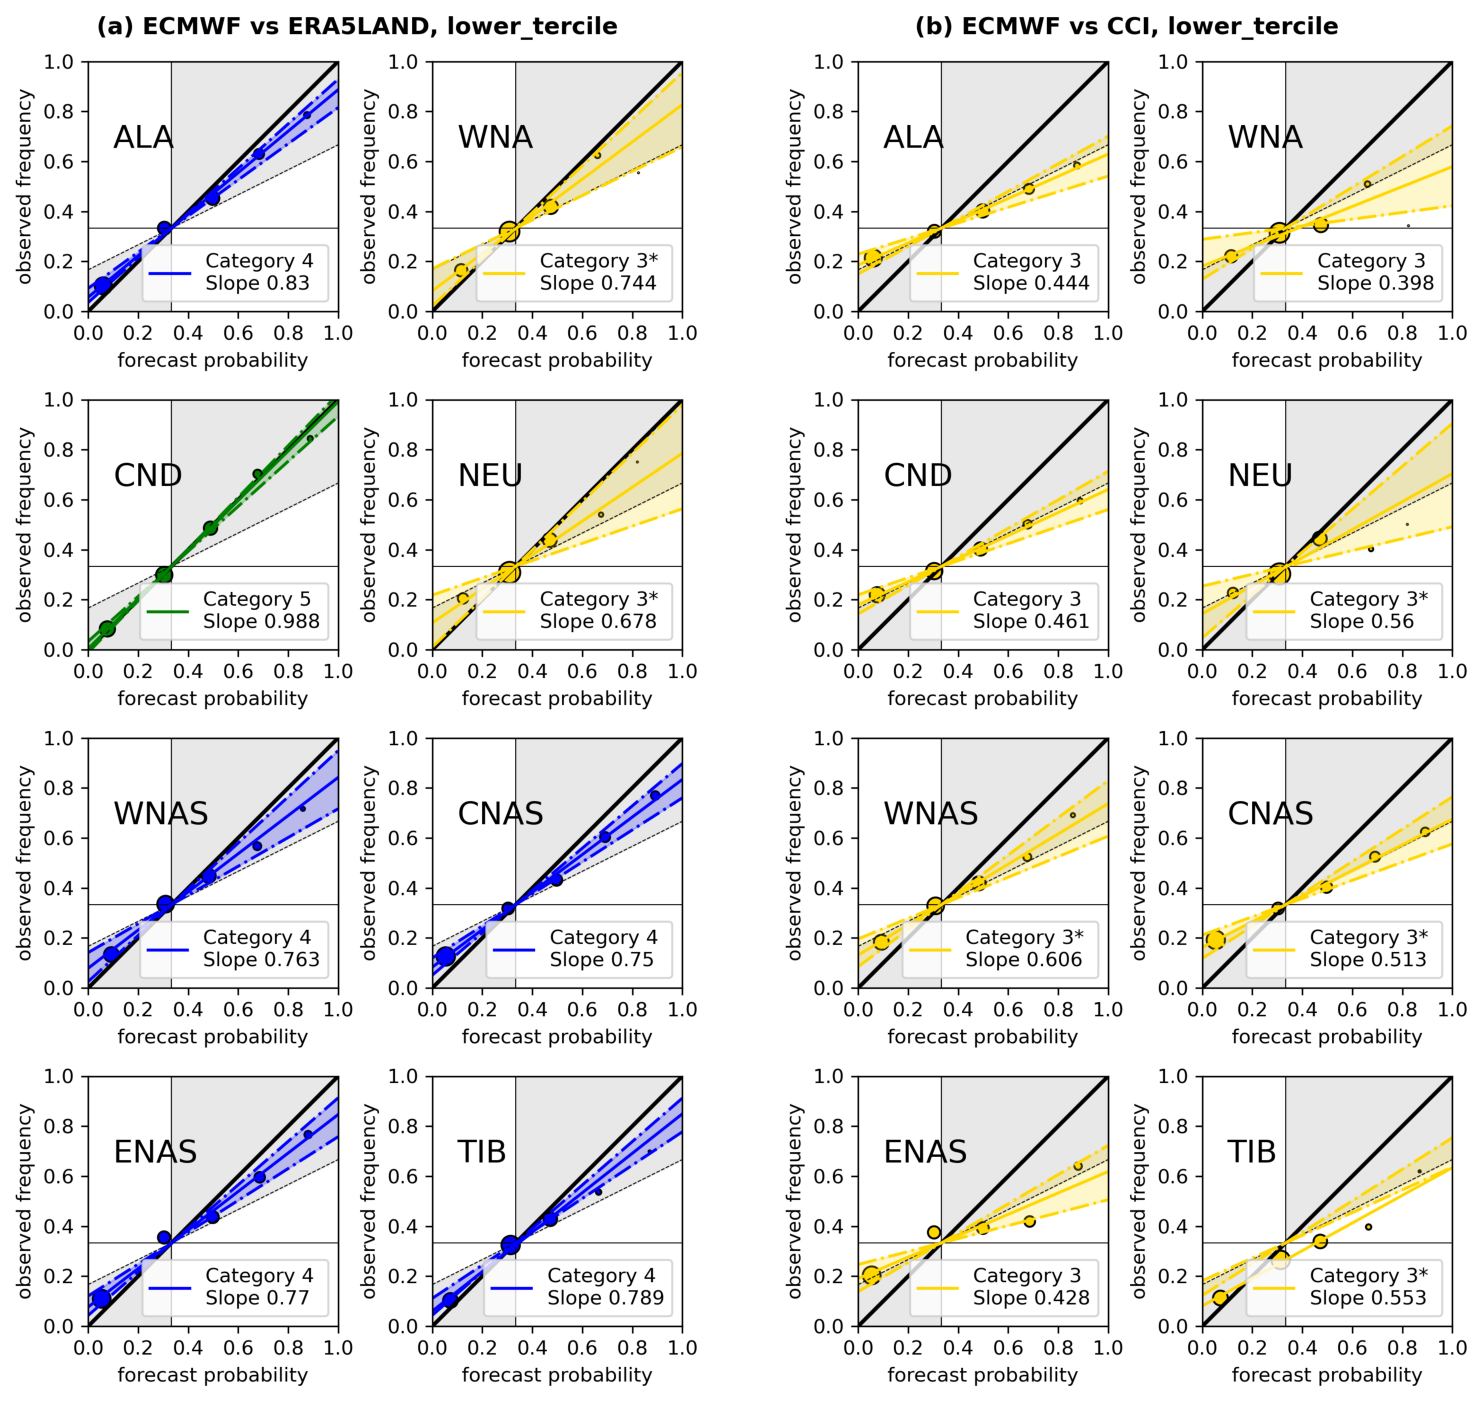
Figure 4Reliability diagrams for the ECMWF SWE hindcasts assessed against (a) ERA5-Land and (b) ESA Snow-CCI in low snow accumulation winters over eight land regions: ALA, WNA, CND, NEU, WNAS, CNAS, ENAS, TIB (see Table 1).
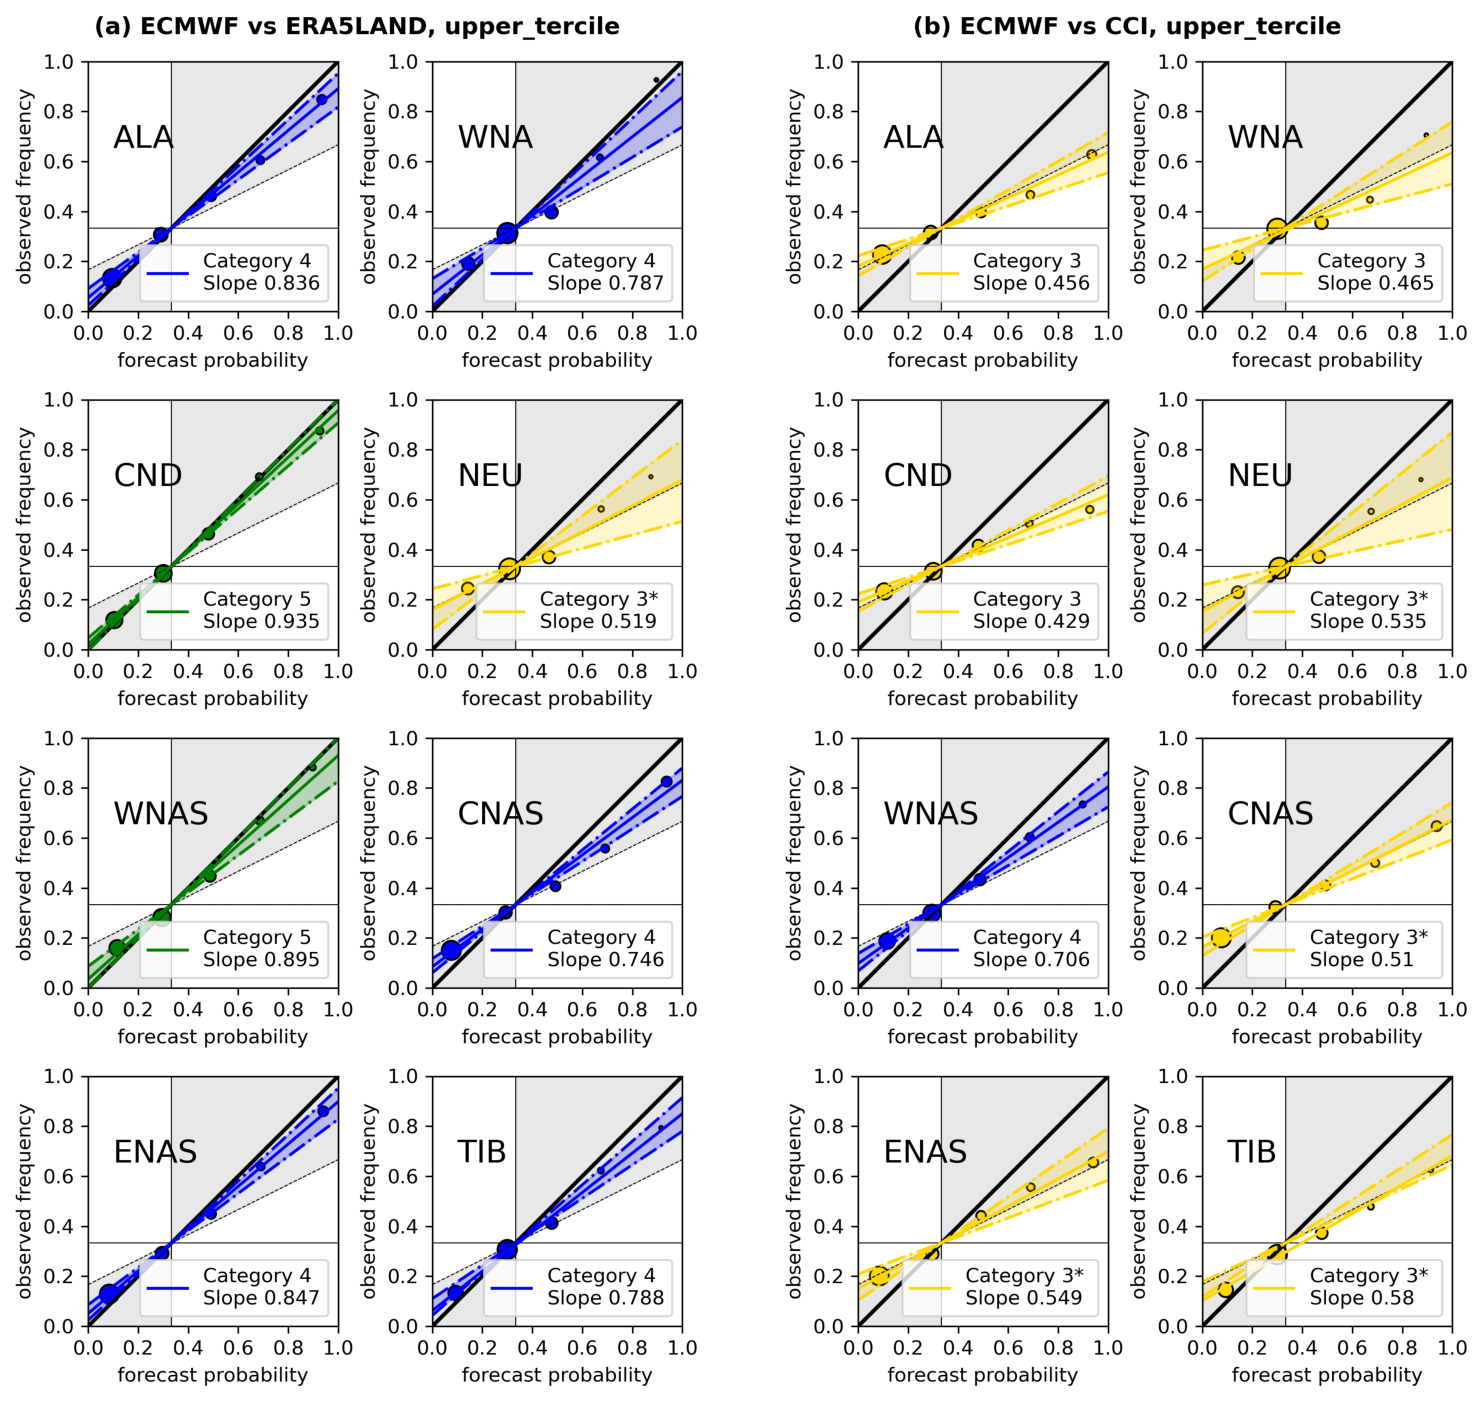
Figure 5Reliability diagrams for the ECMWF SWE hindcasts assessed against (a) ERA5-Land and (b) ESA Snow-CCI in high snow accumulation winters over eight land regions: ALA, WNA, CND, NEU, WNAS, CNAS, ENAS, TIB (see Table 1).
In this study, the binary event definition is based on tercile thresholds that corrects biases and implies that the best-fit reliability line always passes through the climatological intersection (, ). However, a clear off-set of the best-fit reliability line is present in TIB and WNA regions when compared with ESA Snow-CCI (Figs. 4b and 5b), and in TIB region when compared with ERA5-Land (Figs. 4a and 5a), indicating a tendency toward over-forecasting. This behavior is driven by grid points where SWE in the verification data remains zero throughout the 30-year period (snow-free land), while the hindcasts predict a variable amount of snow. As a result, these points contribute only to “no-event” outcomes across multiple forecast probability bins, leading to the observed offset in the reliability line. While this offset is evident in both TIB and WNA regions, it is considerably more pronounced in TIB due to a larger number of grid points with snow free conditions in the observations but not in the hindcasts (see Fig. 6). On that figure, a snow-free area south-west of the Himalayan arc can be seen in both ERA5-Land and ESA Snow-CCI. Incidentally, it is also present in regional snow re-analyses, such as the High Mountain Asia Snow Reanalysis (Liu et al., 2021). However, the snow-free conditions appear farther south in the hindcasts, indicating a bias in the snow transition line in the ECMWF model. The biases between ERA5, ERA5-Land, in-situ and satellite observations over the Tibetan Plateau (encompassed by the region labeled TIB here) are documented by Orsolini et al. (2019).
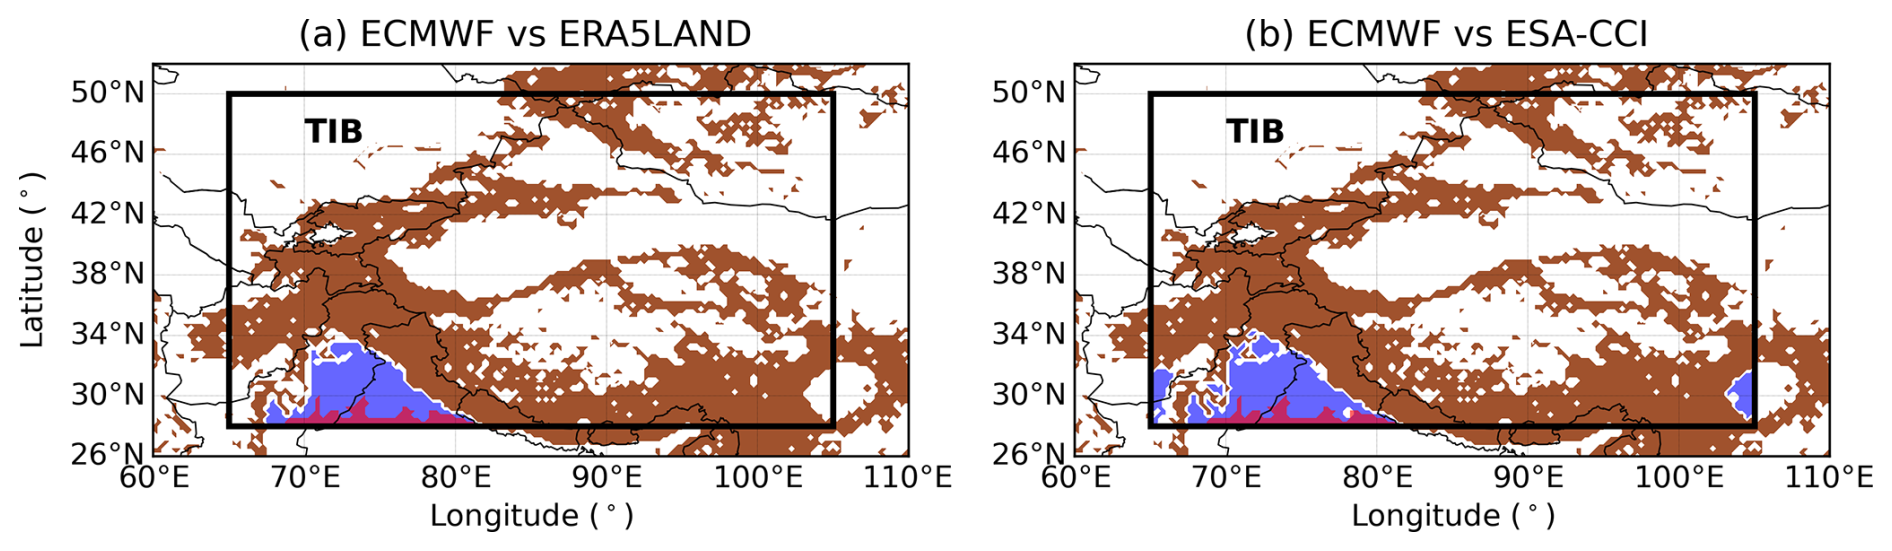
Figure 6Map of the Tibet region showing grid points where snow water equivalent (SWE) remains zero throughout 1993–2022. Verification datasets are shown in blue: (a) ERA5-Land and (b) ESA Snow-CCI. Hindcasts are shown in red. The mountain mask from ESA Snow-CCI dataset is shown in brown. The black rectangle corresponds to TIB region defined in Table 1. Note that blue and red shading is applied only within the TIB region.
It is important to note that the results shown in panels (a) and (b) of Figs. 4 and 5 are based on the same set of hindcasts. The differences between the reliability categories therefore reflect differences between the verification datasets. To better understand these differences, Fig. 7a shows probability density distributions of SWE anomalies in the ECMWF hindcasts, ERA5-Land and ESA Snow-CCI for different land regions. Despite similarities in the probability density distributions, ERA5-Land SWE anomalies are closer to those in the hindcasts than ESA Snow-CCI anomalies. One can also see that anomalies in all datasets and regions are right-skewed. The skewness is similar among datasets in WNA, NEU, WNAS and TIB regions, while differences are more pronounced in other regions. Differences in the skewness of the verification datasets imply that the lower and upper terciles represent different parts of the respective distributions. Time series of snow anomalies in Fig. 7b also show discrepancies in the temporal evolution of SWE anomalies and in the distribution of years with strong positive and negative anomalies. The latter is important for the definition of probabilistic tercile thresholds used in the reliability assessment, as explained in Sect. 2.1. As a result, the same forecast probabilities may correspond to different extreme events and therefore different observed frequencies in the verification data, leading to systematic differences in the assessed reliability.
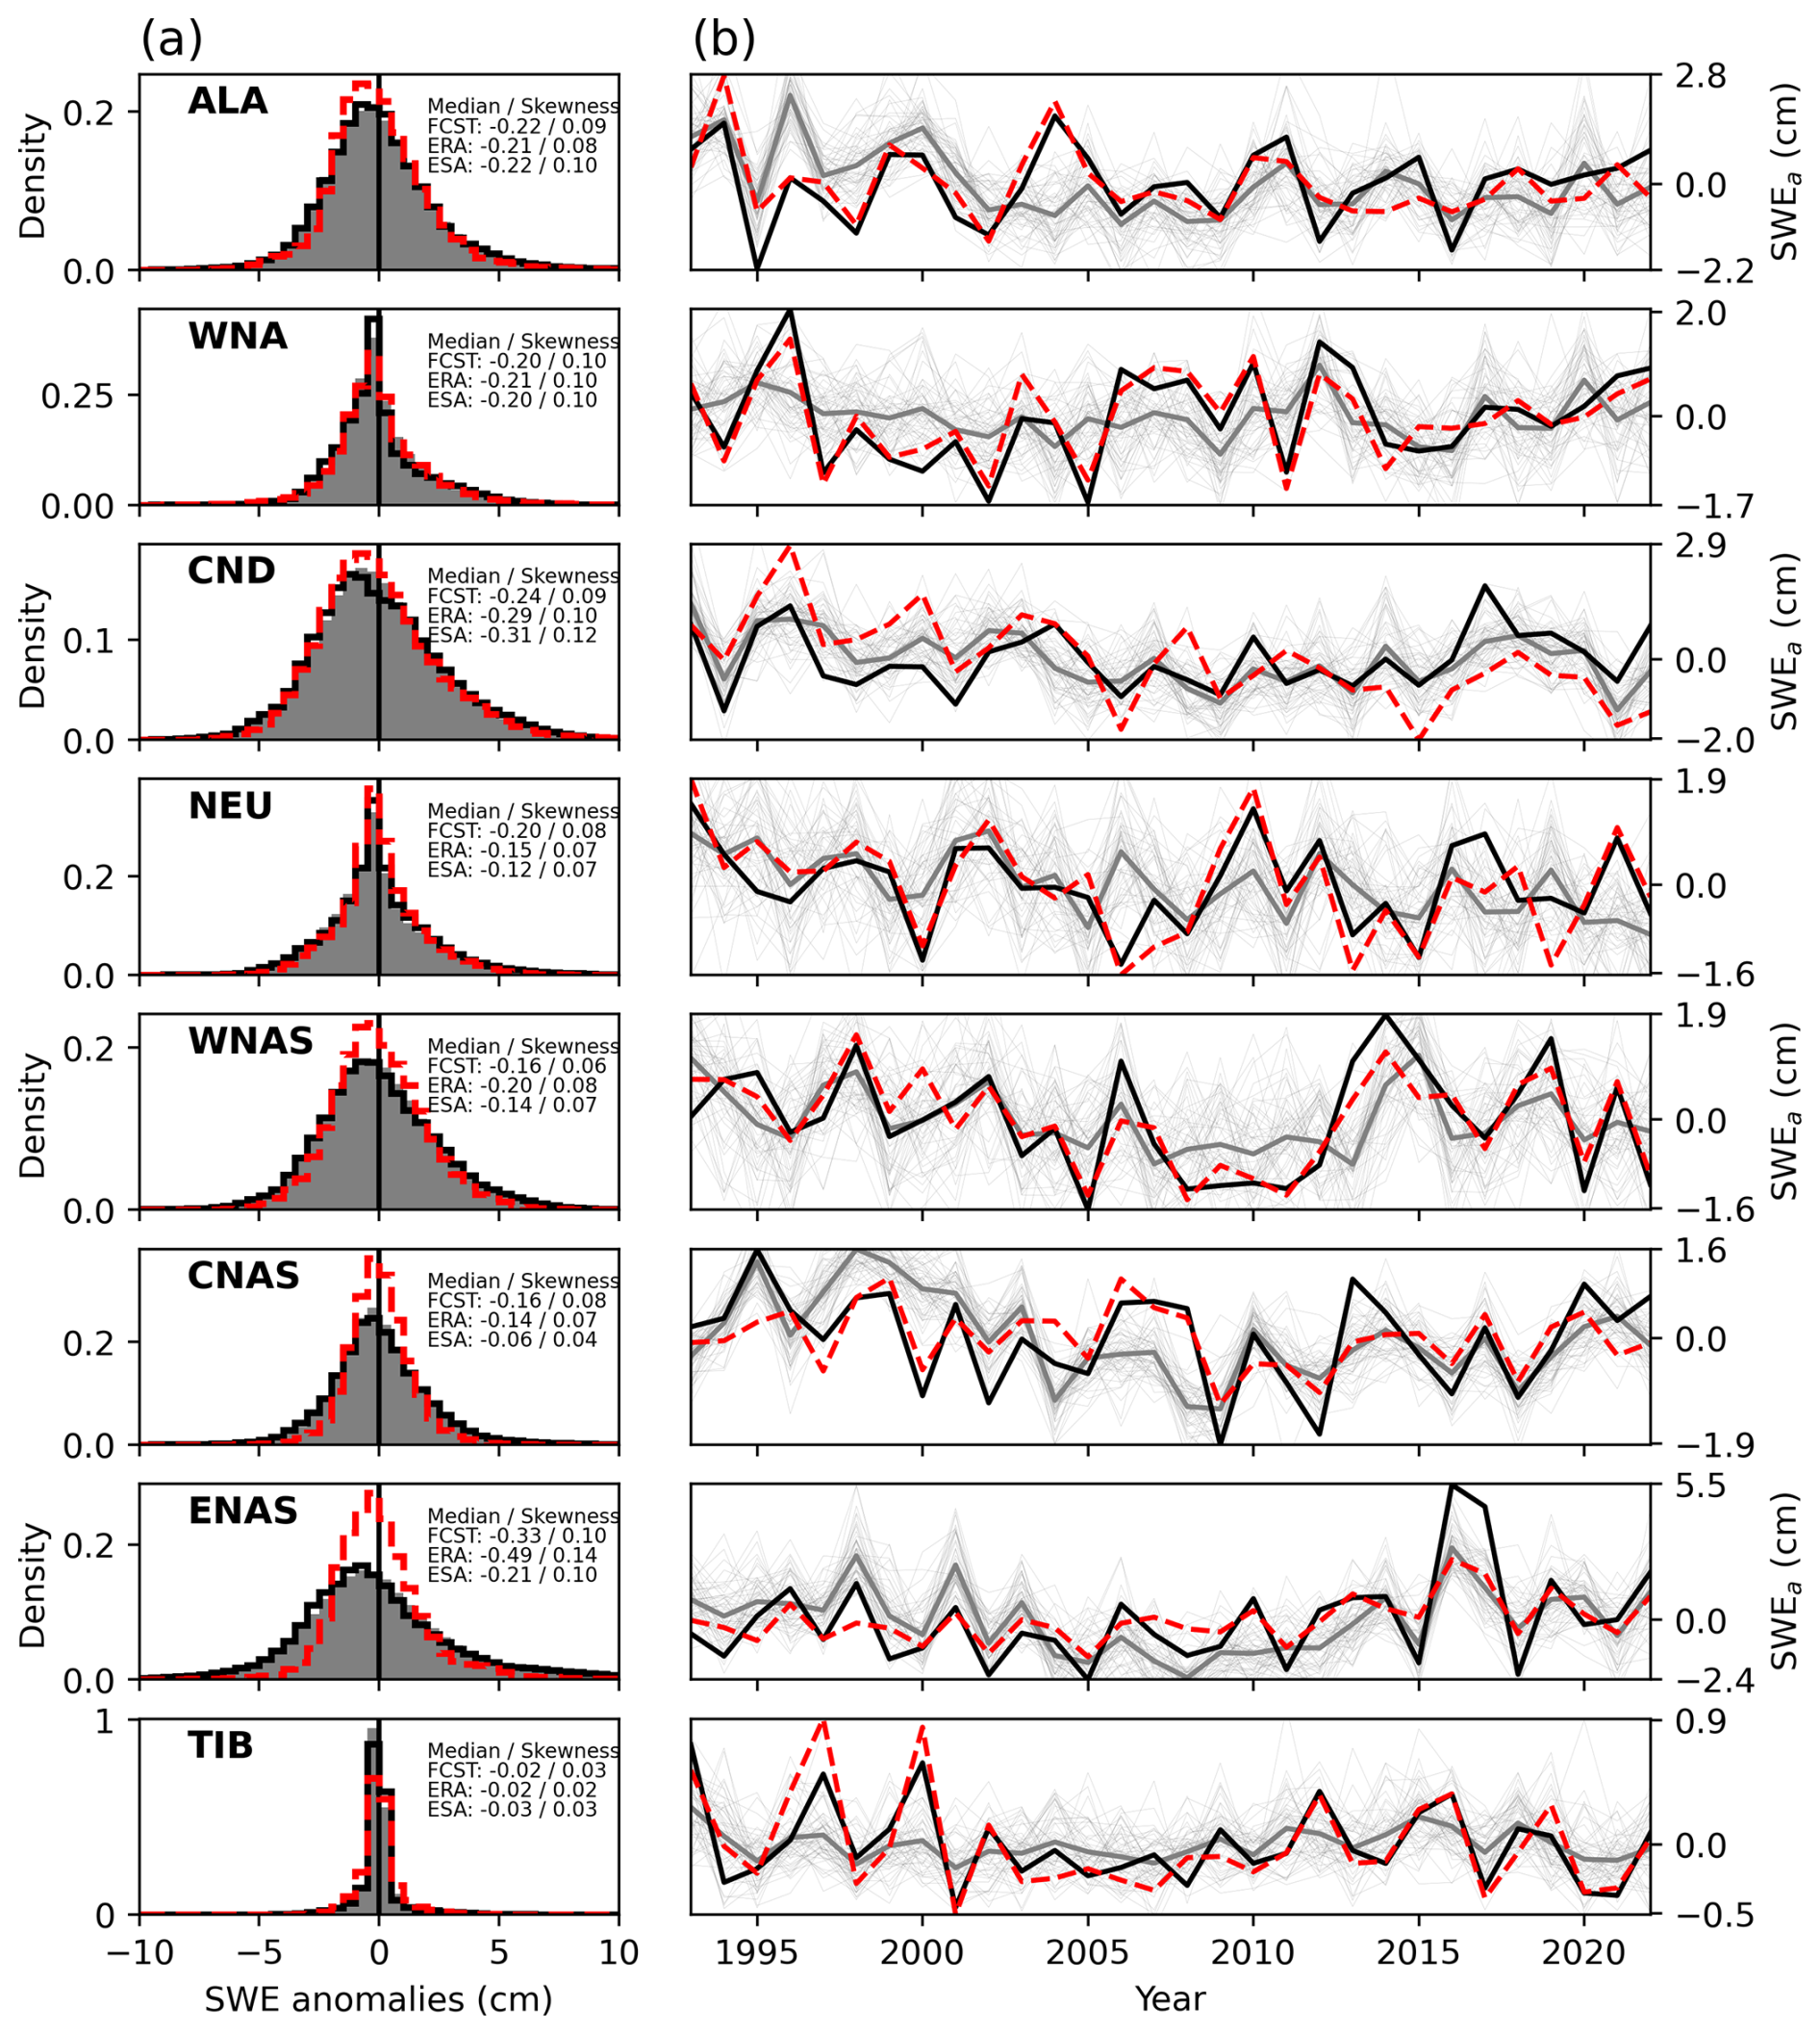
Figure 7(a) Probability density distributions of SWE anomalies in ERA5-Land (black solid), ESA Snow-CCI (red dashed), ECMWF hindcasts (gray) and (b) time series of their area averages in eight land regions: ALA, WNA, CND, NEU, WNAS, CNAS, ENAS, TIB (see Table 1). Note that scales in panels are different. Histograms are shown with a bin width of 0.5 cm, and the vertical line indicates zero. The inset shows the median (in cm SWE) and the nonparametric skewness , where μ, υ and σ denote the mean, median and standard deviation, respectively.
To support this interpretation, we compute a Continuous Ranked Probability Score (CRPS) which is a continuous probabilistic verification metric often used for the evaluation of forecast systems (Hersbach, 2000). It represents the accumulated Brier score (see Sect. 2.1) across all possible threshold values, with values closer to zero indicating better forecast performance. The CRPS is computed for the ECMWF hindcasts with respect to the ERA5-Land and ESA Snow-CCI verification datasets. In addition, we compute Spearman's rank correlation coefficient and the agreement in binary event classification between the two verification datasets. The former is calculated at each grid point and measures the consistency in the ranking of years with SWE anomalies between the two verification datasets. The latter is defined as the percentage of data points for which the tercile-based binary event is classified consistently in both verification datasets at the same grid point and time. Since the binary event classification is based on tercile thresholds derived from the SWE anomaly distributions, differences in the ordering of years between the verification datasets can lead to different binary event classifications for the same location and time. Therefore, regions with higher Spearman's rank correlation are expected to show higher agreement in the binary event classification, reflecting a greater consistency between the verification datasets.
Figure 8 shows values of the CRPS and Spearman's rank correlation coefficient averaged within the eight regions from Table 1 together with the agreement metric computed by pooling all grid points and years within each region. Although the reliability categories shown in Fig. 3 differ for the two verification datasets, their CRPS values are similar (Fig. 8a). This can be explained by the fact that CRPS integrates over the full predictive distribution and is relatively robust to moderate differences between verification datasets. At the same time, relatively low rank correlation and only 70 %–80 % agreement in the tercile-based binary event classification (Fig. 8b) indicate that the two verification datasets do not classify the same years consistently as low and high snow accumulation winters. Since reliability in this study is evaluated for tercile-based binary events, the forecast system is verified against different realizations of the binary event depending on the observational reference. Consequently, forecast probabilities may appear more reliable with respect to one verification dataset than the other. The highest values of the Spearman's correlation and the agreement metric are found in regions WNA, NEU and WNAS, where differences in reliability categories are smallest. The lowest values are found in CND region which is also associated with the largest difference in CRPS values (Fig. 8a) and reliability categories (Fig. 3). We therefore conclude that the differences in reliability categories shown in Figs. 3–5 are primarily due to differences in binary event classification between the verification datasets used in this study.
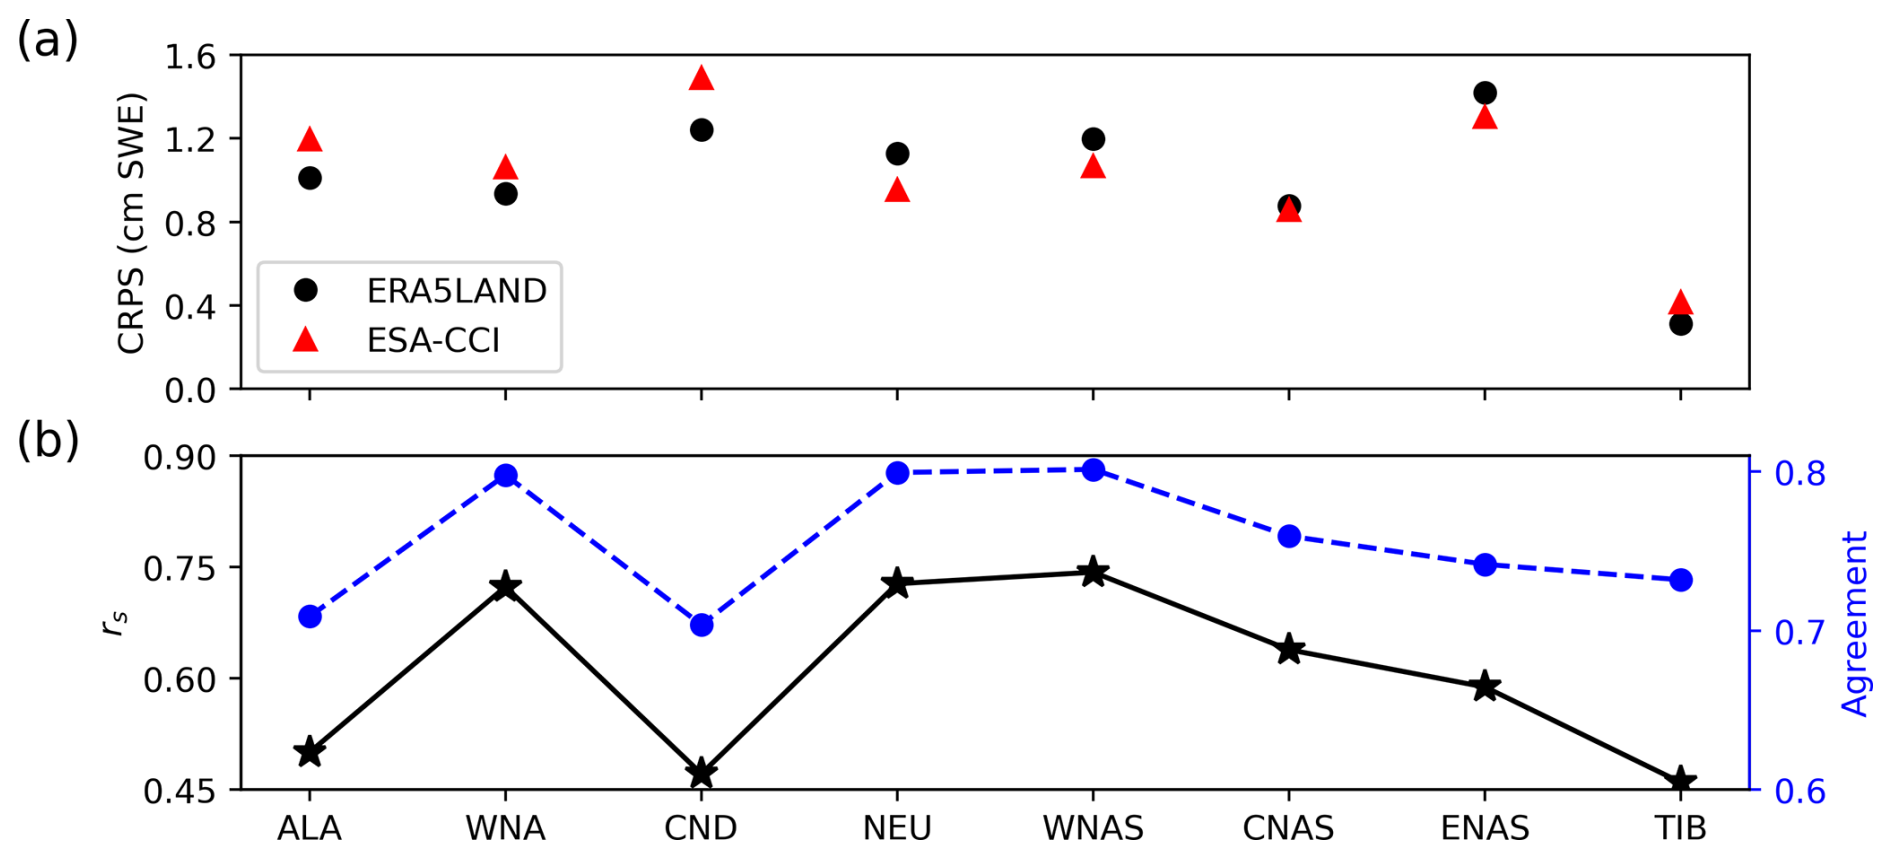
Figure 8(a) Continuous Ranked Probability Score (CRPS) computed for the ECMWF hindcasts with respect to the ERA5-Land (black circles) and ESA Snow-CCI (red triangles) datasets and averaged in eight land regions: ALA, WNA, CND, NEU, WNAS, CNAS, ENAS, TIB (see Table 1). (b) Spearman's rank correlation coefficient (rs, black stars) and the agreement metric (blue circles) computed between the two verification datasets.
No detrending was applied to SWE anomalies prior to the reliability assessment, as this study aims to evaluate the forecast system in a real-world context, including any long-term systematic changes present in both the hindcasts and the verification datasets. However, to ensure the robustness of the results obtained, a sensitivity test was performed in which SWE anomalies were detrended at each grid point prior to the reliability assessment. For the reliability assessment against ERA5-Land, only TIB region changed category from useful to marginally useful. However, this region has already been identified as particularly challenging. All other regions retained the same categories as in Fig. 3a and c. For ESA Snow-CCI, detrending led to some regional changes in reliability categories. However, the categories remain within marginally useful to marginally useful improved, except for WNAS region during high-snow-accumulation winters same as in Fig. 3b and d. This indicates that the reported reliability of the ECMWF seasonal snow hindcasts is robust with respect to the presence or absence of long-term trends in the data.
Figure 3 demonstrates that reliability assessment and categorization are somewhat dependent on the choice of verification dataset. However, such behavior is not limited to snow variables only. A similar discrepancy can be seen in the reliability assessment of near surface temperature and precipitation in works by Weisheimer and Palmer (2014) and Manzanas et al. (2022), where ERA-Interim reanalysis (Dee et al., 2011) for temperature and GPCP analysis (Adler et al., 2003) for precipitation in the former versus EWEMBI dataset (Lange, 2019) for both variables in the latter were used.
Although it may seem intuitive to place greater trust in Earth observation products, these datasets have notable limitations. It is known that ESA Snow-CCI has a systematic bias in estimates of large SWE values (>15 cm) due to the reduced sensitivity of passive-microwave retrievals to deep snow and liquid water in the snowpack (Luojus et al., 2021; Venäläinen et al., 2025). In addition, the mismatch between point-scale in-situ measurements being assimilated and the SWE grid-scale estimates adds uncertainty into the final product, with retrieval performance declining farther from assimilated snow depth observations (Luojus et al., 2021). A recent study by Venäläinen et al. (2025) suggests bias correction for ESA Snow-CCI SWE retrievals that could be used in the future assessments. At the same time, ERA5-Land, while generally robust (Mudryk et al., 2025), is known to overestimate SWE, especially in mountainous areas, based on global and regional studies (Orsolini et al., 2019; Muñoz Sabater et al., 2021; Kouki et al., 2023; Monteiro and Morin, 2023; Mudryk et al., 2025).
Regional variations in reliability are also evident and could be linked to, for example, regional differences in snow distribution as well as technical limitations in both the forecast model (e.g., dependence on the empirical snow cover-to-snow depth conversion rule) and the verification datasets (e.g., the aforementioned ESA Snow-CCI bias for large SWE values). Reliability categories obtained when verified against ESA Snow-CCI are slightly higher over Eurasia than over North America. This may reflect the well-documented better performance of this product in Eurasia compared to North America (Luojus et al., 2021; Mortimer et al., 2022), likely linked to the wider network of observation stations used for SWE retrievals.
As noted in Sect. 1, numerous gridded snow products are currently available, e.g., outputs from coupled reanalysis systems, standalone land model simulations driven by meteorological forcings, satellite-derived snow estimates or actual snow observations. However, those products often show substantial discrepancies in both magnitude and spatial–temporal variability of snow, as well as in long-term snow trends (see e.g., Mudryk et al., 2025). When reanalysis is used for verification, an issue might be that it has the same origin as the one used to initialize the forecast which may lead to higher reliability categories. On the other hand, the use of satellite-derived snow products for verification may lead to an underestimation of reliability categories due to higher uncertainty in observations and retrieval methods. The inconsistencies between existing snow datasets therefore emphasize the need for continued efforts to develop a high-quality, internally consistent snow dataset specifically suited for the forecast verification purposes. Such dataset should, ideally, (i) be independent of the model and data assimilation system used to initialize the hindcasts, (ii) provide consistent observations over a long period, (iii) have good spatial and temporal coverage, and (iv) have known errors, biases and limitations.
Data assimilation plays an important role in constraining the forecast initial snow to observations. The type of assimilated data and the assimilation method are, therefore, of a key importance. In the hindcasts used here, both land and atmosphere initial conditions are derived from ERA5 reanalysis. Since the off-line ERA5-Land reanalysis uses ERA5 as atmospheric forcing, higher reliability categories obtained when verified against ERA5-Land may partly reflect the shared dependence on ERA5. Consistent with this interpretation, similarly high categories were found when the hindcasts were verified against ERA5 itself (not shown). The results should, therefore, be interpreted as conditional on this shared ERA5 forcing dependence, rather than as a standalone measure of forecast reliability.
Avenues for future work include, but are not limited to, a more detailed assessment of seasonal SWE forecast reliability as a function of lead time, for example, through monthly assessments throughout the winter season. In addition, exploring prediction of extreme snow events, like the snow droughts mentioned in Sect. 1, would be of a great interest as they have been linked to hydrological extremes. It is also important to investigate the reliability of SWE forecasts in mountainous areas in spring, when snowmelt occurs with potential implications for hydropower management and flood-risk assessment. Finally, a multi-model comparison of seasonal SWE forecasts produced by operational meteorological prediction centers would provide additional insight into model performance and reliability.
In this study, we assess reliability of winter-mean snow hindcasts in 1993–2022 produced by the ECMWF within the CERISE project. In probabilistic forecasting, reliability for a binary event is defined as the consistency between forecast probabilities and observed frequencies. The assessment is performed against two SWE datasets: ERA5-Land reanalysis and ESA Snow-CCI (version 4) in eight land regions in the Northern Hemisphere excluding mountainous areas. To evaluate the forecast performance in low and high snow accumulation winters, we consider two binary events based on terciles of the long-term distribution: (i) winter-mean SWE anomaly lies below the lower tercile, and (ii) winter-mean SWE anomaly lies above the upper tercile.
A simple categorization is used to quantify the reliability based on the weighted linear regression to the data in reliability diagrams. Unlike seasonal forecasts of near surface temperature and precipitation evaluated in previous studies (Weisheimer and Palmer, 2014; Manzanas et al., 2022) which occasionally found low reliability categories, SWE hindcasts yield only marginally useful to perfect reliability categories. Although the reliability assessment performed is sensitive to the choice of verification dataset and yields slightly different reliability categories when verified against ERA5-Land and ESA Snow-CCI. This sensitivity highlights the need for continued efforts to develop a high-quality, internally consistent snow dataset suited for the forecast verification purposes.
Hourly ERA5 data on single levels from 1940 to present are available from the Climate Data Store website (Hersbach et al., 2023) via https://doi.org/10.24381/cds.adbb2d47. ESA-CCI SWE v4 data are available from the CEDA website (Luojus et al., 2025) via https://doi.org/10.5285/edf8abd23f4a40aabd4d52e48dec06ea. ECMWF hindcasts are available via the Meteorological Archival and Retrieval System (MARS) under “CERISE project” dataset.
Ekaterina Vorobeva and Yvan Orsolini initiated the study and wrote the manuscript with contributions from Patricia de Rosnay, Jonathan Day, Retish Senan, Frederic Vitart, and Damien Decremer. Ekaterina Vorobeva performed calculations and made figures.
The contact author has declared that none of the authors has any competing interests.
Views and opinions expressed are however those of the author(s) only and do not necessarily reflect those of the European Union or the Commission. Neither the European Union nor the granting authority can be held responsible for them.
Publisher's note: Copernicus Publications remains neutral with regard to jurisdictional claims made in the text, published maps, institutional affiliations, or any other geographical representation in this paper. The authors bear the ultimate responsibility for providing appropriate place names. Views expressed in the text are those of the authors and do not necessarily reflect the views of the publisher.
This work is funded by the Copernicus Climate Change Service Evolution (CERISE) project (grant agreement no. 101082139), funded by the European Union. The authors thank two anonymous reviewers for their valuable comments that have improved the article.
This work is funded by the Copernicus Climate Change Service Evolution (CERISE) project (grant agreement no. 101082139), funded by the European Union.
This paper was edited by Francesco Avanzi and reviewed by two anonymous referees.
Adler, R. F., Huffman, G. J., Chang, A., Ferraro, R., Xie, P.-P., Janowiak, J., Rudolf, B., Schneider, U., Curtis, S., Bolvin, D., Gruber, A., Susskind, J., Arkin, P., and Nelkin, E.: The version-2 global precipitation climatology project (GPCP) monthly precipitation analysis (1979–present), J. Hydrometeorol., 4, 1147–1167, 2003. a
Arduini, G., Balsamo, G., Dutra, E., Day, J. J., Sandu, I., Boussetta, S., and Haiden, T.: Impact of a Multi-Layer Snow Scheme on Near-Surface Weather Forecasts, J. Adv. Model. Earth Sy., 11, 4687–4710, https://doi.org/10.1029/2019MS001725, 2019. a, b
Barella, R., Mortimer, C., Marin, C., Schwaizer, G., Mölg, N., Nagler, T., Wunderle, S., Xiao, X., Luojus, K., Venäläinen, P., Takala, M., Pulliainen, J., Lemmetyinen, J., Moisander, M., and Solberg, R.: ESA CCI+ Snow ECV: Product User Guide, version 4.0, European Space Agency, https://climate.esa.int/media/documents/Snow_cci_D4.3_PUG_v4.0.pdf (last access: 19 August 2026), 2024. a
Bormann, K. J., Brown, R. D., Derksen, C., and Painter, T. H.: Estimating snow-cover trends from space, Nat. Clim. Change, 8, 924–928, https://doi.org/10.1038/s41558-018-0318-3, 2018. a
Brier, G. W.: Verification of forecasts expressed in terms of probability, Mon. Weather Rev., 78, 1–3, 1950. a
Dee, D. P., Uppala, S. M., Simmons, A. J., Berrisford, P., Poli, P., Kobayashi, S., Andrae, U., Balmaseda, M. A., Balsamo, G., Bauer, P., Bechtold, P., Beljaars, A. C. M., van de Berg, L., Bidlot, J., Bormann, N., Delsol, C., Dragani, R., Fuentes, M., Geer, A. J., Haimberger, L., Healy, S. B., Hersbach, H., Hólm, E. V., Isaksen, L., Kållberg, P., Köhler, M., Matricardi, M., McNally, A. P., Monge-Sanz, B. M., Morcrette, J.-J., Park, B.-K., Peubey, C., de Rosnay, P., Tavolato, C., Thépaut, J.-N., and Vitart, F.: The ERA-Interim reanalysis: Configuration and performance of the data assimilation system, Q. J. Roy. Meteor. Soc., 137, 553–597, https://doi.org/10.1002/qj.828, 2011. a
de Rosnay, P., Isaksen, L., and Dahoui, M.: Snow data assimilation at ECMWF, ECMWF, https://doi.org/10.21957/lkpxq6x5, 2015. a
de Rosnay, P., Browne, P., de Boisséson, E., Fairbairn, D., Hirahara, Y., Ochi, K., Schepers, D., Weston, P., Zuo, H., Alonso-Balmaseda, M., Balsamo, G., Bonavita, M., Borman, N., Brown, A., Chrust, M., Dahoui, M., Chiara, G., English, S., Geer, A., Healy, S., Hersbach, H., Laloyaux, P., Magnusson, L., Massart, S., McNally, A., Pappenberger, F., and Rabier, F.: Coupled data assimilation at ECMWF: current status, challenges and future developments, Q. J. Roy. Meteor. Soc., 148, 2672–2702, https://doi.org/10.1002/qj.4330, 2022. a
Fox-Kemper, B., Hewitt, H. T., Xiao, C., Aðalgeirsdóttir, G., Drijfhout, S. S., Edwards, T. L., Golledge, N. R., Hemer, M., Kopp, R. E., Krinner, G., Mix, A., Notz, D., Nowicki, S., Nurhati, I. S., Ruiz, L., Sallée, J.-B., Slangen, A. B. A., and Yu, Y.: Ocean, cryosphere and sea level change. Climate change 2021: the physical science basis. Contribution of Working Group I to the Sixth Assessment Report of the Intergovernmental Panel on Climate Change, Climate Change, 1211–1362, https://doi.org/10.1017/9781009157896.011, 2021. a
Giorgi, F. and Francisco, R.: Uncertainties in regional climate change prediction: a regional analysis of ensemble simulations with the HADCM2 coupled AOGCM, Clim. Dynam., 16, 169–182, https://doi.org/10.1007/PL00013733, 2000. a
Hersbach, H.: Decomposition of the continuous ranked probability score for ensemble prediction systems, Weather Forecast., 15, 559–570, https://doi.org/10.1175/1520-0434(2000)015<0559:DOTCRP>2.0.CO;2, 2000. a
Hersbach, H., Bell, B., Berrisford, P., Biavati, G., Horányi, A., Muñoz Sabater, J., Nicolas, J., Peubey, C., Radu, R., Rozum, I., Schepers, D., Simmons, A., Soci, C., Dee, D., and Thépaut, J.-N.: ERA5 hourly data on single levels from 1940 to present, Copernicus Climate Change Service (C3S) Climate Data Store (CDS) [data set], https://doi.org/10.24381/cds.adbb2d47, 2023. a
Hsu, W.-r. and Murphy, A. H.: The attributes diagram a geometrical framework for assessing the quality of probability forecasts, Int. J. Forecasting, 2, 285–293, https://doi.org/10.1016/0169-2070(86)90048-8, 1986. a, b, c
Jeong, J.-H., Linderholm, H. W., Woo, S.-H., Folland, C., Kim, B.-M., Kim, S.-J., and Chen, D.: Impacts of snow initialization on subseasonal forecasts of surface air temperature for the cold season, J. Climate, 26, 1956–1972, https://doi.org/10.1175/JCLI-D-12-00159.1, 2013. a
Johnson, S. J., Stockdale, T. N., Ferranti, L., Balmaseda, M. A., Molteni, F., Magnusson, L., Tietsche, S., Decremer, D., Weisheimer, A., Balsamo, G., Keeley, S. P. E., Mogensen, K., Zuo, H., and Monge-Sanz, B. M.: SEAS5: the new ECMWF seasonal forecast system, Geosci. Model Dev., 12, 1087–1117, https://doi.org/10.5194/gmd-12-1087-2019, 2019. a
Komatsu, K. K., Takaya, Y., Toyoda, T., and Hasumi, H.: A submonthly scale causal relation between snow cover and surface air temperature over the autumnal Eurasian continent, J. Climate, 36, 4863–4877, https://doi.org/10.1175/JCLI-D-22-0827.1, 2023. a
Kouki, K., Luojus, K., and Riihelä, A.: Evaluation of snow cover properties in ERA5 and ERA5-Land with several satellite-based datasets in the Northern Hemisphere in spring 1982–2018, The Cryosphere, 17, 5007–5026, https://doi.org/10.5194/tc-17-5007-2023, 2023. a
Lange, S.: EartH2Observe, WFDEI and ERA-Interim data Merged and Bias-corrected for ISIMIP (EWEMBI), V.1.1., GFZ Data Services [data set], https://doi.org/10.5880/pik.2019.004, 2019. a
Li, F., Orsolini, Y., Keenlyside, N., Shen, M.-L., Counillon, F., and Wang, Y.: Impact of snow initialization in subseasonal-to-seasonal winter forecasts with the Norwegian Climate Prediction Model, J. Geophys. Res.-Atmos., 124, 10033–10048, https://doi.org/10.1029/2019JD030903, 2019. a, b
Li, W. and Song, J.: Evaluation of subseasonal forecast skill for Northern Hemisphere winter snow cover, J. Hydrometeorol., 25, 1371–1388, https://doi.org/10.1175/JHM-D-23-0190.1, 2024. a
Liu, Y., Fang, Y., and Margulis, S. A.: Spatiotemporal distribution of seasonal snow water equivalent in High Mountain Asia from an 18-year Landsat–MODIS era snow reanalysis dataset, The Cryosphere, 15, 5261–5280, https://doi.org/10.5194/tc-15-5261-2021, 2021. a
Luojus, K., Pulliainen, J., Takala, M., Lemmetyinen, J., Mortimer, C., Derksen, C., Mudryk, L., Moisander, M., Hiltunen, M., Smolander, T., Ikonen, J., Cohen, J., Salminen, M., Norberg, J., Veijola, K., and Venäläinen, P.: GlobSnow v3. 0 Northern Hemisphere snow water equivalent dataset, Scientific Data, 8, 163, https://doi.org/10.1038/s41597-021-00939-2, 2021. a, b, c, d
Luojus, K., Venäläinen, P., Moisander, M., Pulliainen, J., Takala, M., Lemmetyinen, J., Mortimer, C., Mudryk, L., Schwaizer, G., and Nagler, T.: ESA Snow Climate Change Initiative (Snow_cci): Snow Water Equivalent (SWE) level 3C daily global climate research data package (CRDP) (1979–2023), version 4.0, CEDA archive [data set], https://doi.org/10.5285/edf8abd23f4a40aabd4d52e48dec06ea, 2025. a, b, c
Manzanas, R., Lucero, A., Weisheimer, A., and Gutiérrez, J. M.: Can bias correction and statistical downscaling methods improve the skill of seasonal precipitation forecasts?, Clim. Dynam., 50, 1161–1176, https://doi.org/10.1007/s00382-017-3668-z, 2018. a, b, c
Manzanas, R., Torralba, V., Lledó, L., and Bretonnière, P. A.: On the Reliability of Global Seasonal Forecasts: Sensitivity to Ensemble Size, Hindcast Length and Region Definition, Geophys. Res. Lett., 49, e2021GL094662, https://doi.org/10.1029/2021GL094662, 2022. a, b, c, d
Mason, S. J.: On using “climatology” as a reference strategy in the Brier and ranked probability skill scores, Mon. Weather Rev., 132, 1891–1895, https://doi.org/10.1175/1520-0493(2004)132<1891:OUCAAR>2.0.CO;2, 2004. a, b
Monteiro, D. and Morin, S.: Multi-decadal analysis of past winter temperature, precipitation and snow cover data in the European Alps from reanalyses, climate models and observational datasets, The Cryosphere, 17, 3617–3660, https://doi.org/10.5194/tc-17-3617-2023, 2023. a
Mortimer, C., Mudryk, L., Derksen, C., Brady, M., Luojus, K., Venäläinen, P., Moisander, M., Lemmetyinen, J., Takala, M., Tanis, C., and Pulliainen, J.: Benchmarking algorithm changes to the Snow CCI+ snow water equivalent product, Remote Sens. Environ., 274, 112988, https://doi.org/10.1016/j.rse.2022.112988, 2022. a
Muñoz-Sabater, J., Dutra, E., Agustí-Panareda, A., Albergel, C., Arduini, G., Balsamo, G., Boussetta, S., Choulga, M., Harrigan, S., Hersbach, H., Martens, B., Miralles, D. G., Piles, M., Rodríguez-Fernández, N. J., Zsoter, E., Buontempo, C., and Thépaut, J.-N.: ERA5-Land: a state-of-the-art global reanalysis dataset for land applications, Earth Syst. Sci. Data, 13, 4349–4383, https://doi.org/10.5194/essd-13-4349-2021, 2021. a, b, c, d
Mudryk, L., Santolaria-Otín, M., Krinner, G., Ménégoz, M., Derksen, C., Brutel-Vuilmet, C., Brady, M., and Essery, R.: Historical Northern Hemisphere snow cover trends and projected changes in the CMIP6 multi-model ensemble, The Cryosphere, 14, 2495–2514, https://doi.org/10.5194/tc-14-2495-2020, 2020. a
Mudryk, L., Mortimer, C., Derksen, C., Elias Chereque, A., and Kushner, P.: Benchmarking of snow water equivalent (SWE) products based on outcomes of the SnowPEx+ Intercomparison Project, The Cryosphere, 19, 201–218, https://doi.org/10.5194/tc-19-201-2025, 2025. a, b, c, d, e
Muñoz Sabater, J.: ERA5-Land hourly data from 1950 to present, Copernicus Climate Change Service (C3S) Climate Data Store (CDS) [data set], https://doi.org/10.24381/cds.e2161bac, 2019. a
Notarnicola, C.: Hotspots of snow cover changes in global mountain regions over 2000–2018, Remote Sens. Environ., 243, 111781, https://doi.org/10.1016/j.rse.2020.111781, 2020. a
Ombadi, M., Risser, M. D., Rhoades, A. M., and Varadharajan, C.: A warming-induced reduction in snow fraction amplifies rainfall extremes, Nature, 619, 305–310, https://doi.org/10.1038/s41586-023-06092-7, 2023. a
Orsolini, Y., Senan, R., Balsamo, G., Doblas-Reyes, F., Vitart, F., Weisheimer, A., Carrasco, A., and Benestad, R.: Impact of snow initialization on sub-seasonal forecasts, Clim. Dynam., 41, 1969–1982, https://doi.org/10.1007/s00382-013-1782-0, 2013. a, b
Orsolini, Y., Wegmann, M., Dutra, E., Liu, B., Balsamo, G., Yang, K., de Rosnay, P., Zhu, C., Wang, W., Senan, R., and Arduini, G.: Evaluation of snow depth and snow cover over the Tibetan Plateau in global reanalyses using in situ and satellite remote sensing observations, The Cryosphere, 13, 2221–2239, https://doi.org/10.5194/tc-13-2221-2019, 2019. a, b
Pulliainen, J.: Mapping of snow water equivalent and snow depth in boreal and sub-arctic zones by assimilating space-borne microwave radiometer data and ground-based observations, Remote Sens. Environ., 101, 257–269, https://doi.org/10.1016/j.rse.2006.01.002, 2006. a
Takala, M., Luojus, K., Pulliainen, J., Derksen, C., Lemmetyinen, J., Kärnä, J.-P., Koskinen, J., and Bojkov, B.: Estimating northern hemisphere snow water equivalent for climate research through assimilation of space-borne radiometer data and ground-based measurements, Remote Sens. Environ., 115, 3517–3529, https://doi.org/10.1016/j.rse.2011.08.014, 2011. a
Venäläinen, P., Luojus, K., Lemmetyinen, J., Pulliainen, J., Moisander, M., and Takala, M.: Impact of dynamic snow density on GlobSnow snow water equivalent retrieval accuracy, The Cryosphere, 15, 2969–2981, https://doi.org/10.5194/tc-15-2969-2021, 2021. a
Venäläinen, P., Luojus, K., Mortimer, C., Lemmetyinen, J., Pulliainen, J., Takala, M., Moisander, M., and Zschenderlein, L.: Implementing spatially and temporally varying snow densities into the GlobSnow snow water equivalent retrieval, The Cryosphere, 17, 719–736, https://doi.org/10.5194/tc-17-719-2023, 2023. a
Venäläinen, P., Mortimer, C., Luojus, K., Mudryk, L., Takala, M., and Pulliainen, J.: Updated monthly and new daily bias correction for assimilation-based passive microwave SWE retrieval, The Cryosphere, 19, 6301–6318, https://doi.org/10.5194/tc-19-6301-2025, 2025. a, b
Wegmann, M., Orsolini, Y., Weisheimer, A., van den Hurk, B., and Lohmann, G.: Impact of Eurasian autumn snow on the winter North Atlantic Oscillation in seasonal forecasts of the 20th century, Weather Clim. Dynam., 2, 1245–1261, https://doi.org/10.5194/wcd-2-1245-2021, 2021. a
Weisheimer, A. and Palmer, T. N.: On the reliability of seasonal climate forecasts, J. R. Soc. Interface, 11, 20131162, https://doi.org/10.1098/rsif.2013.1162, 2014. a, b, c, d, e, f
World Meteorological Organization: Standardized Verification System (SVS) for Long-Range Forecasts (LRF), Tech. rep., World Meteorological Organization, Geneva, Switzerland, in: Manual on the Global Data-Processing and Forecasting Systems, https://www.metoffice.gov.uk/binaries/content/assets/metofficegovuk/pdf/research/climate-science/climate-observations-projections-and-impacts/svslrf.pdf (last access: 19 August 2026), 1992. a
Zhang, W., Liu, L., Wu, H., Zhang, T., Chen, Y., and Wang, L.: Snow droughts amplify compound climate extremes over the Tibetan Plateau, Communications Earth & Environment, 6, 571, https://doi.org/10.1038/s43247-025-02551-3, 2025. a
Zuo, H., Balmaseda, M. A., Tietsche, S., Mogensen, K., and Mayer, M.: The ECMWF operational ensemble reanalysis–analysis system for ocean and sea ice: a description of the system and assessment, Ocean Sci., 15, 779–808, https://doi.org/10.5194/os-15-779-2019, 2019. a