
the Creative Commons Attribution 4.0 License.
the Creative Commons Attribution 4.0 License.
 | 12 Aug 2026
Mapping snow on northern winter roads: a dual-frequency polarimetric radar approach for snow characterization over land, lake and sea ice
Julienne Stroeve
Rosemary Willatt
Madeleine Downie
Monojit Saha
Carmen Nab
Alicia Fallows
Clement Soriot
Robbie Mallett
Anton Komarov
Vishnu Nandan
Thomas Newman
Jennifer Lukovich
John Yackel
Winter roads are lifelines for remote northern communities. Built over land, lakes, rivers, and sea ice, these travel routes are increasingly vulnerable to warming temperatures and variable precipitation. To ensure safety and adapt to these changes, operators require high-resolution monitoring of snow depth across these diverse surfaces, as natural snow accumulation dictates ice growth rates, route viability and road stability. This study extends our polarimetric radar method, previously demonstrated on pack ice, to landfast sea ice, tundra, and frozen lakes and assesses how well we can retrieve snow depth over these surfaces. Results indicate consistency with earlier sea ice analyses, maintaining a mean snow depth retrieval bias and error within 3 cm over the landfast ice. Promising performance is also found over frozen ground using Ku-band (mean biases less than 6 cm). To address the specific challenge of lake ice, which includes strong returns from the ice/water interface, we present a new interface-detection technique that simultaneously retrieves snow depth and ice thickness. While current validation focuses on undisturbed snow, this approach could provide a path forward for characterizing the cryospheric environment in a way that can directly support the optimization of winter roads.
- Article
(28241 KB) - Full-text XML
- BibTeX
- EndNote


Northern winter roads built over landfast sea ice, lake ice, and muskeg (e.g. peatland or bog) are key in providing transportation and connectivity to remote and often isolated regions in the Canadian Arctic and sub-Arctic (e.g. Dong et al., 2025). This is because in most northern communities, traditional transportation infrastructure such as highways or railroads is either nonexistent or impractical due to the region's challenging geography and permafrost thaw (e.g. Fatolahzadeh Gheysari and Maghoul, 2024). As a result, roads built over frozen bodies of water or over muskeg often offer the only reliable travel routes during winter. The seasonal viability of these routes will depend on the bearing capacity of the underlying ice and the structural integrity of the snow-fill used to level the driving surface.
Mapping winter road conditions presents a range of challenges, driven by dynamic and variable snow accumulation, compaction and melting, as well as the remote and often difficult terrain where these roads are located. Snow depth is a critical variable in the engineering and integrity of winter roads. Since snowfall acts as a thermal insulator that reduces ice growth (e.g. Sturm et al., 1997), in the construction phase, snow must be precisely managed through compaction to increase density and thermal conductivity, ensuring ice thickens sufficiently to support heavy vehicle loads. Heavy snow accumulation on the other hand acts as a static load that can alter the composition and thickness of the ice cover (Brown and Duguay, 2010). If the weight of the snow is sufficient to submerge the ice surface below the hydrostatic water level, lake or sea water infiltrates the snowpack, creating a layer of flooded snow/slush that hinders transport across the ice surface. Once refrozen, this slush forms snow-ice, which is structurally weaker: refrozen snow-ice possesses about 50 % of the load-bearing capacity of the original underlying black ice (Gold, 1971; Michel, 1978). Furthermore, aeolian redistribution can create uneven surface roughness and drifting, which obscures hazardous ice features and complicates maintenance efforts.
Remote sensing provides a path forward, offering the capability to map essential variables such as snow depth and ice thickness, at various scales. For example, Zakharova et al. (2021) demonstrated the use of Ku-band backscatter data from Jason-2 and Jason-3 to map river ice thickness needed for the prediction of ice road operations, while Mangilli et al. (2024) used radar altimetry to map lake ice thickness. Over sea ice, approaches have been developed to utilize dual-frequency radar altimeters to retrieve both snow depth and sea ice thickness (e.g., Guerreiro et al., 2016; Lawrence et al., 2018). The approach combines co-polarized Ku-band (e.g. CryoSat-2) and Ka-band (e.g. AltiKa) frequencies, with the assumption that the Ku-band signal primarily scatters from the snow/ice interface (e.g. Kwok et al., 2020; Laxon et al., 2003; Ricker et al., 2014), while at Ka-band, the snow surface becomes the dominant scattering surface. However, these assumptions about the dominant scattering surfaces at both frequencies have been challenged even for cold, dry Arctic winter snowpack conditions (e.g., Willatt et al., 2011, 2023). Additionally, airborne data collected in summer over Antarctic sea ice in the Weddell Sea revealed the primary scattering surface at both Ku- and Ka-bands primarily corresponds to the air/snow interface or somewhere within the snowpack (Fredensborg Hansen et al., 2025). This airborne study is consistent with an earlier study over East Antarctic sea ice during austral spring using a surface-based Ku-band radar (Willatt et al., 2010). Nevertheless, a dual-frequency differencing approach remains the basis for development of sea ice snow depth and ice thickness products from the upcoming European Space Agency (ESA) CRISTAL mission (Kern et al., 2020; Landy et al., 2026).
To investigate these assumptions across a broad range of snowpack conditions, a dual-frequency (Ku- and Ka-band), fully polarimetric in situ radar system was built (see Stroeve et al., 2020). The first deployment of the instrument was during the year-long Multidisciplinary drifting Observatory for the Study of Arctic Climate (MOSAiC) expedition. The data collected suggested that dual-polarization approaches may not be adequate for resolving both snow depth and sea ice thickness. Instead, snow depth over sea ice could be more reliably retrieved using a combination of cross-polarized and co-polarized data at either frequency (Willatt et al., 2023). The same broad conclusion was also found for thick, non-saline snowpacks observed in the Weddell Sea (Willatt et al., 2025), though the performance was less robust than during MOSAiC. It remains unclear, however, if this approach is effective for saline snowpacks on landfast sea ice (e.g. Geldsetzer et al., 2009), or if it can be extended to freshwater ice and frozen land surfaces. To date, snow depth retrieval over lakes and rivers remains unexplored using radar altimetry. Similarly, little work has been performed to retrieve snow depth or snow water equivalent (SWE) over land surfaces using radar altimetry, though promising results were found using ground-based 6–18 GHz Frequency Modulated Continuous Wave (FMCW) radar observations during the NASA SnowEx 2020 Grand Mesa Campaign (Marshall et al., 2023).
Alongside the ESA-funded Polarimetric Synthetic Aperture Radar Altimeter (PoSARA) study investigating the development of the polarimetric snow depth retrieval concept into a New Earth Observation Mission Idea (NEOMI), more polarimetric data were collected using our in situ KuKa instrument over different surface types. Using these data, we expand on the initial investigations by Willatt et al. (2023, 2025) to include landfast sea ice with saline snowpacks, lake ice, and terrestrial areas in the sub-Arctic and the Arctic, and evaluate how well a polarimetric approach can retrieve snow depth over these surfaces.
2.1 Study Areas and Weather Conditions
In this study, we focus on results from two field campaigns conducted over landfast sea ice, lake ice and tundra during which the KuKa radar was towed via skidoo along transects (see Sect. 2.2 for radar description). The first field campaign occurred in December 2021 and took place in the Canadian sub-Arctic, just outside of Churchill, MB (Fig. 1a). In this part of Hudson Bay the sea ice consists of a mixture of landfast and floating ice (Kuzyk et al., 2008; Kirillov et al., 2020), yet our data collection was limited to landfast ice about 1 km from the shore, which had an average thickness of 50 cm. This is the same sea ice site as described by Mallett et al. (2024).
Lake ice sampling was performed on Malcolm Ramsay Lake, located about 7 km from the coast. During the field campaign, only one lake ice thickness measurement was obtained on 9 December from a different lake, with a thickness of 71.5 cm. This value is within the expected range reported by Murfitt et al. (2022), who found the average Malcolm Ramsay Lake ice thickness during December ranges from 0.4 to 0.8 m. Tundra near the Churchill Northern Studies Center (CNSC) was also sampled, though not extensively. The tundra around CNSC is dominated by shrubs (10 to 160 cm tall), mosses, sedges, and lichens (Dodonov and Harper, 2022). Here, we report on results from transects collected over Malcolm Ramsay Lake on 4 December, tundra on the 6th and landfast ice on 11 December.
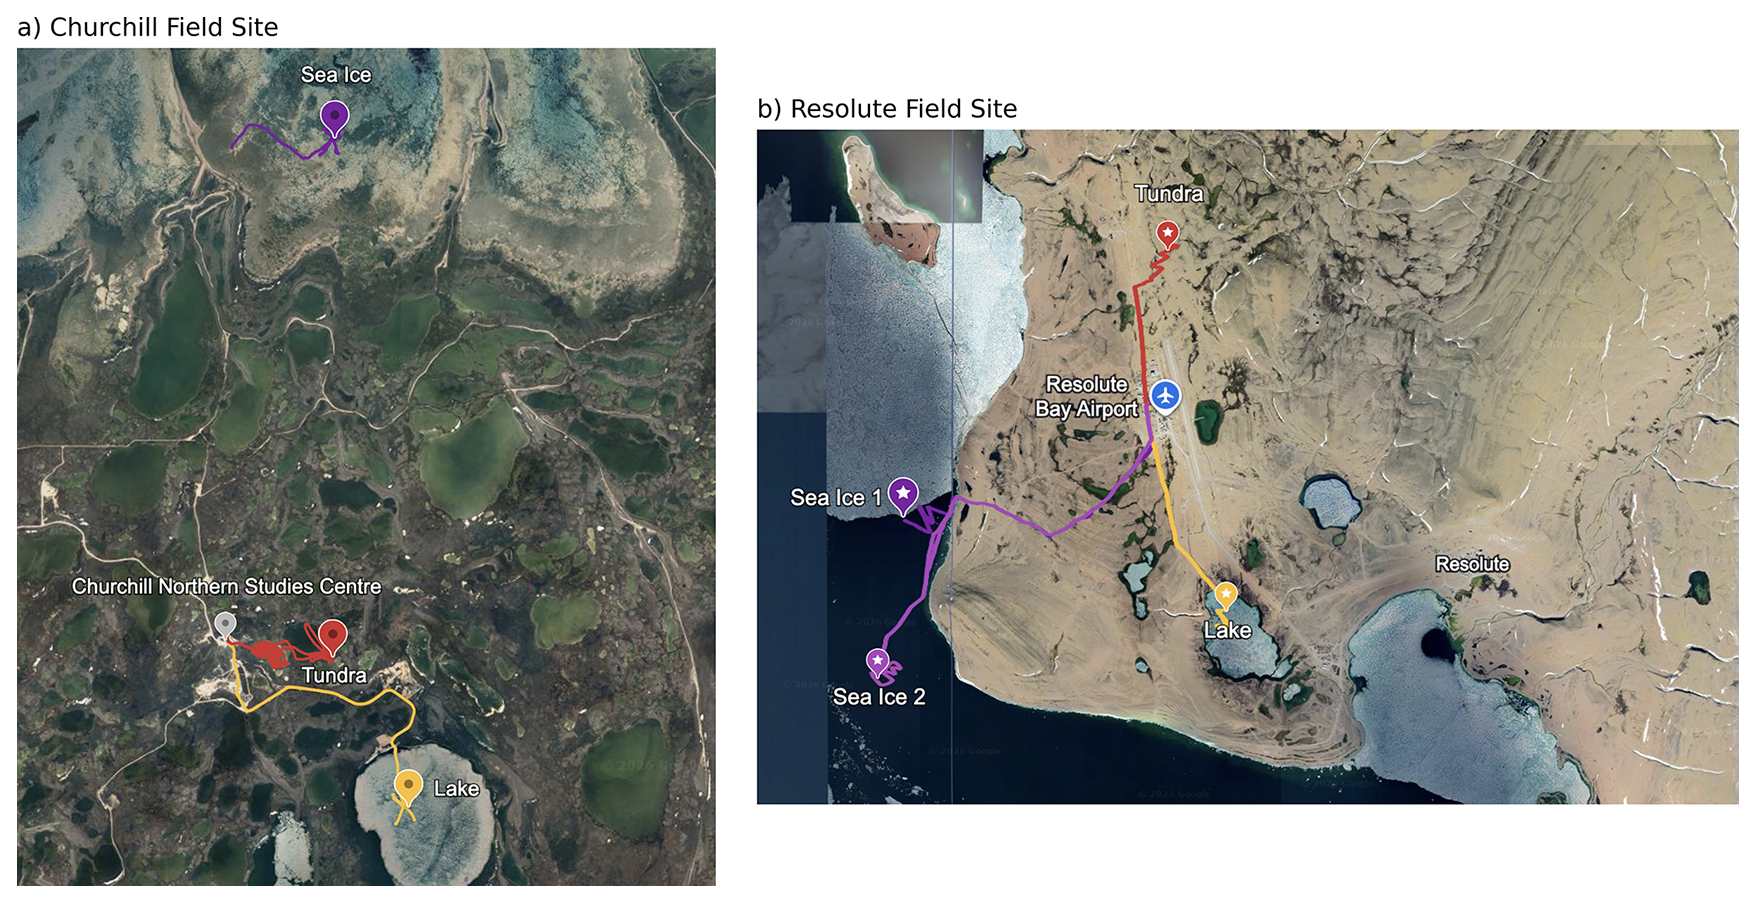
Figure 1Locations of Churchill (a) and Resolute Bay (b) field campaign sites, with KuKa tracks shown. Images © Google obtained from Google Earth. Churchill image is of 29 May 2023, using data from Airbus, Data SIO, NOAA, U.S. Navy, NGA, GEBCO across 14 December 2015. Resolute image is of 17 July 2023 using data from Airbus, Maxar Technologies, CNES/Airbus across 11 August 2011.
The second study area took place in Resolute Bay on Cornwallis Island in Nunavut, Canada (Fig. 1b), representing high-Arctic conditions. The field campaign occurred during April 2025 and involved data collected at two different landfast ice locations (2 and 6 April) as well as Lake Resolute (5 April) and a tundra region (4 April). The tundra in this region is sparsely covered by vegetation (1 %–8 %), consisting mostly of lichens and sedges (Cruickshank, 1971). Where the tundra sampling took place, a pebble base was found at the bottom of the snowpacks (see Fig. A1). The fast ice thickness was on average 1.2 m, whereas the lake ice thickness near the shore was 2.8 m. Figures A2 to A5 in the Appendix detail the lengths and locations of the snow pits along the transects for in Resolute Bay. For Churchill the snow pit latitude and longitudes were not recorded and thus we only show the MagnaProbe and KuKa transects (Figs. A6 to A8).
To characterize weather conditions during the study period, meteorological records were obtained from Environment and Climate Change Canada (ECCC) stations at the Churchill and Resolute Bay airports (https://climate.weather.gc.ca/, last access: 1 January 2026). During the Churchill field campaign, which lasted from 2 to 13 December, air temperatures were initially below −20 °C (with a minimum of −31 °C), followed by a notable temperature increase to −15 °C on 9 December, and to −10 °C on the 13th (Fig. 2). Wind speeds were variable, ranging from 4 to 40 km h−1. There was no precipitation until 7 December, when 3 cm was added to the snowpack, after which no further precipitation occurred.
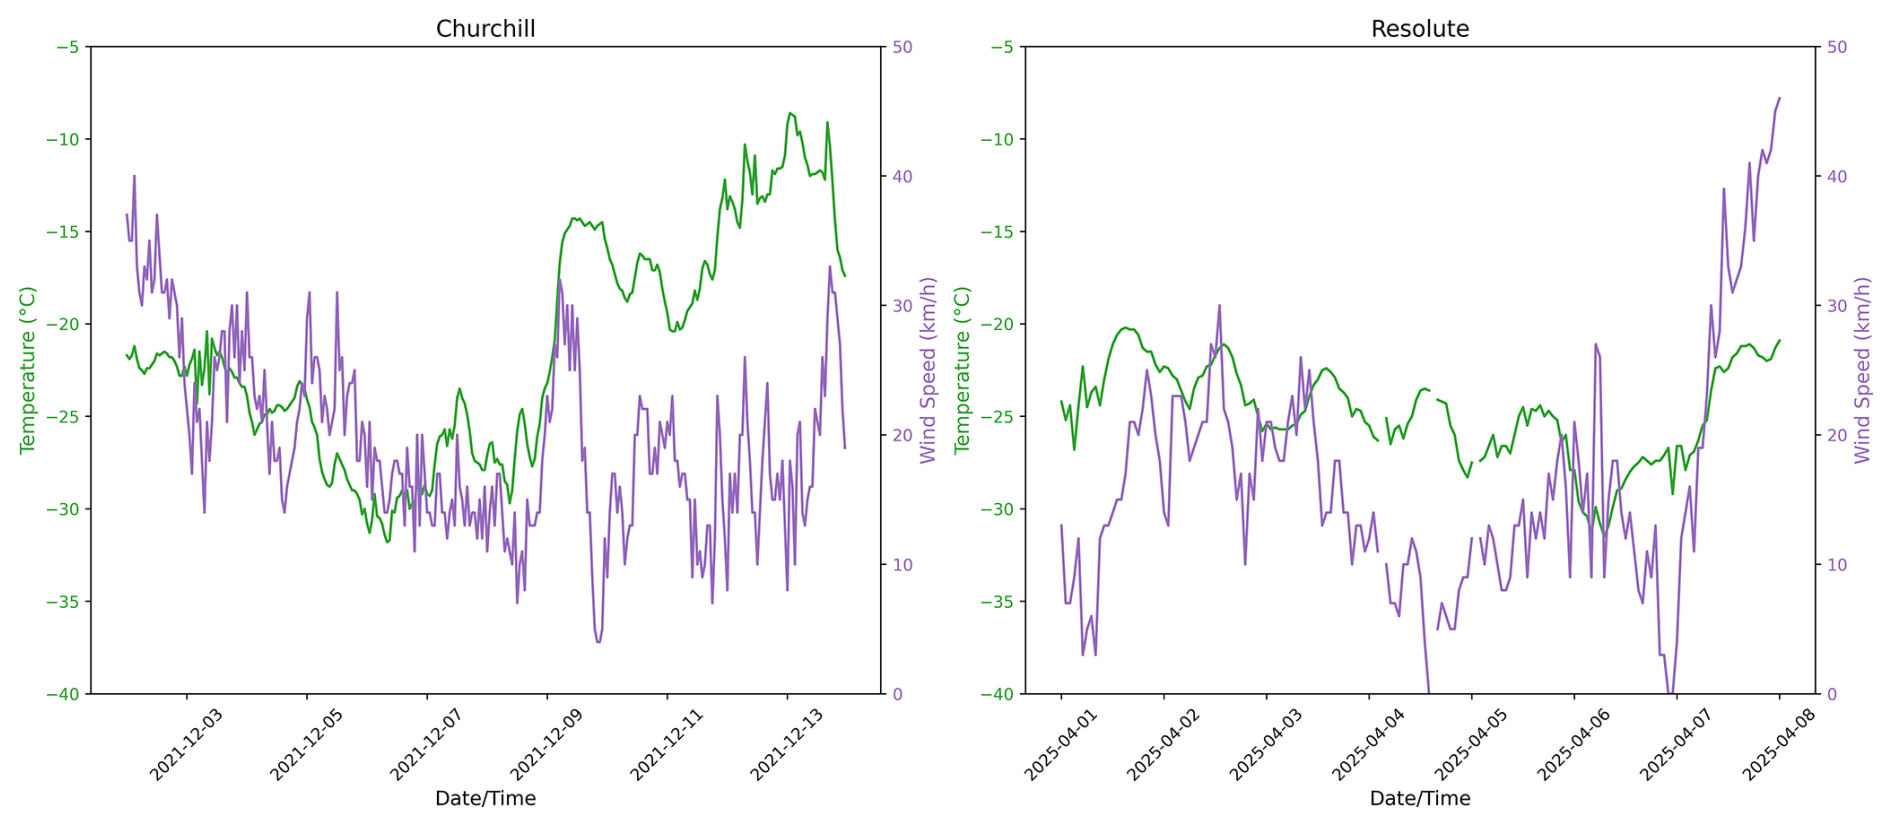
Figure 2Air temperature and wind conditions during the field campaigns in Churchill (left) and Resolute Bay (right).
In Resolute Bay, data collection occurred between 2 to 6 April, and during this period, air temperatures remained cold and stable, ranging between −21 (2 April) to −31 °C (6 April), with an average of −25 °C. Wind speeds were overall lighter than during the Churchill campaign (average of 14 km h−1), though wind speeds up to 30 km h−1 occurred on the 2 and 6 April. No new snow precipitation occurred during the measurement period.
2.1.1 Snow Conditions
Snow depths along the KuKa transects were collected using a SnowHydro MagnaProbe (Sturm and Holmgren, 2018). Over level surfaces, the accuracy is estimated to be ±3 cm (Webster et al., 2014; Sturm and Holmgren, 2018). However, over soft tundra it is possible to push the probe into the mat by several centimeters. Correcting for this is a challenge, however we note that the air temperature was below −20 °C when tundra measurements were taken in both Churchill and Resolute Bay. Temperatures remained below −20 °C even to the base of the snowpack in Resolute Bay, and we assume this was likely also the case in Churchill. We therefore assume that the mat was frozen in both cases and overprobing was negligible. However, given there was a pebble base in Resolute, we cannot rule out that the MagnaProbe may at times have been inserted between the pebbles.
To ensure the strongest possible correlation with the radar data, every effort was made to collect the MagnaProbe snow depths within 5 m of the KuKa radar footprint and within 30 min of the KuKa transect. The sampling interval in Churchill was approximately every 3 m, while the interval in Resolute Bay was 1–2 m. The only exception to the timing protocol occurred during the first sea ice area sampled in Resolute Bay on 2 April, where equipment failure required collecting the snow depths the following day. As summarized in Fig. 3, the tundra areas sampled in both locations exhibited the deepest snowpacks, with similar mean/median values and positively skewed distributions. The smallest snow depths were found over the landfast ice along with the tightest clustering. In Churchill, the mean snow depth over the lake and landfast ice ranged from 5 (lake) to 7.6 cm (landfast ice). Resolute Bay generally featured deeper snowpacks across ice surfaces, with the deepest found on Lake Resolute (mean of 22 cm) and moderately shallow snowpacks on the sea ice areas (means of 11.8 and 9.0 cm for the first and second areas, respectively). While most of the snow distributions showed a positive skew, Lake Resolute was a notable exception, which exhibited a more normal distribution.
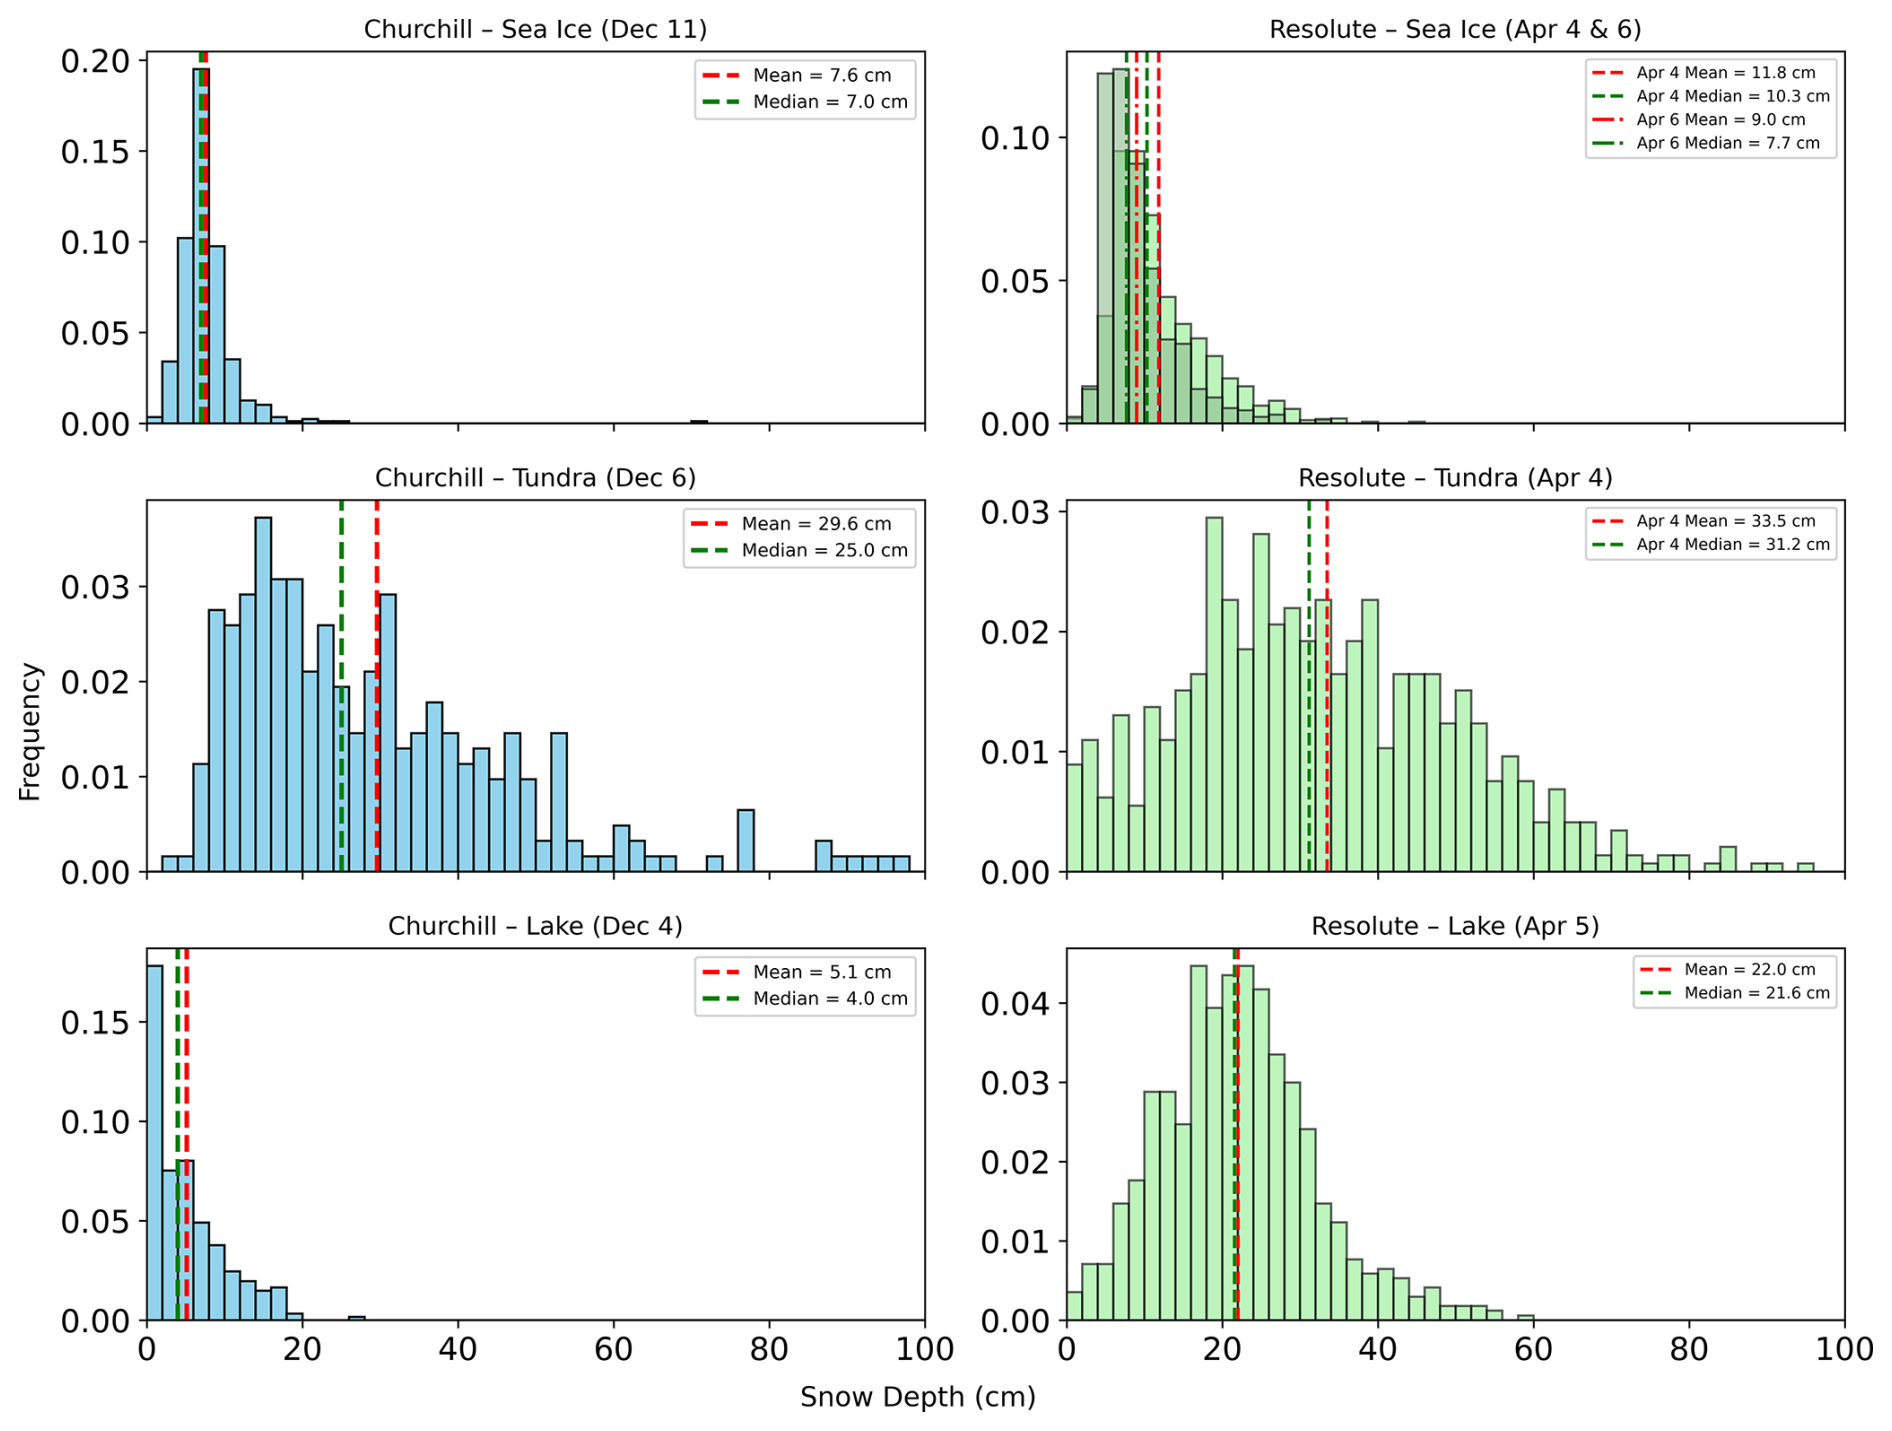
Figure 3Probability Distribution Functions (PDFs) of snow depth collected over the sea ice, tundra and lake ice in Churchill (left) and Resolute Bay (right). A bin size of 2 cm was used.
In addition to depth measurements, snow geophysical properties were characterized from individual snow pits established at selected sites (see Figs. A2 to A5 for snow pit locations in Resolute). Snow pit profiles in Churchill were limited to lake and sea ice surfaces, while the Resolute Bay campaign also included the tundra. Each profile incorporated measurements of snow density, salinity, and temperature. Snow density was determined at 3 cm vertical intervals using a 100 cm3 density cutter in Resolute Bay and at 2 cm intervals in Churchill using a 66 cm3 density cutter. Snow temperature at each density cutter interface was recorded using a Digi-Sense RTD thermometer probe (0.1 °C resolution, ±0.2 °C accuracy). Snow salinity was measured after melting the snow samples using a Cole-Parmer C100 Conductivity Meter (Churchill; accuracy of ±1 %) or a Hanna HI-98319 Salinometer (Resolute Bay; ±1 ppt accuracy). Furthermore, during the Resolute Bay field campaign, SnowMicroPen (SMP) profiles were collected to provide detailed snow stratigraphy data; however, full profiling was sometimes prevented by the presence of hard snow layers (see Fig. 5).
Figure 4 summarizes the snowpack properties over the different surface types in Churchill (upper panel), with results from Resolute Bay shown in the lower panel. A key observation is that all snowpacks sampled over landfast sea ice contained measurable salinity near the ice surface, with the highest concentrations observed in Resolute Bay. These results are consistent with observations previously reported by Nandan et al. (2016, 2017). In all cases, salinity declined sharply with height, reaching near-zero values approximately 4–6 cm above the ice surface.
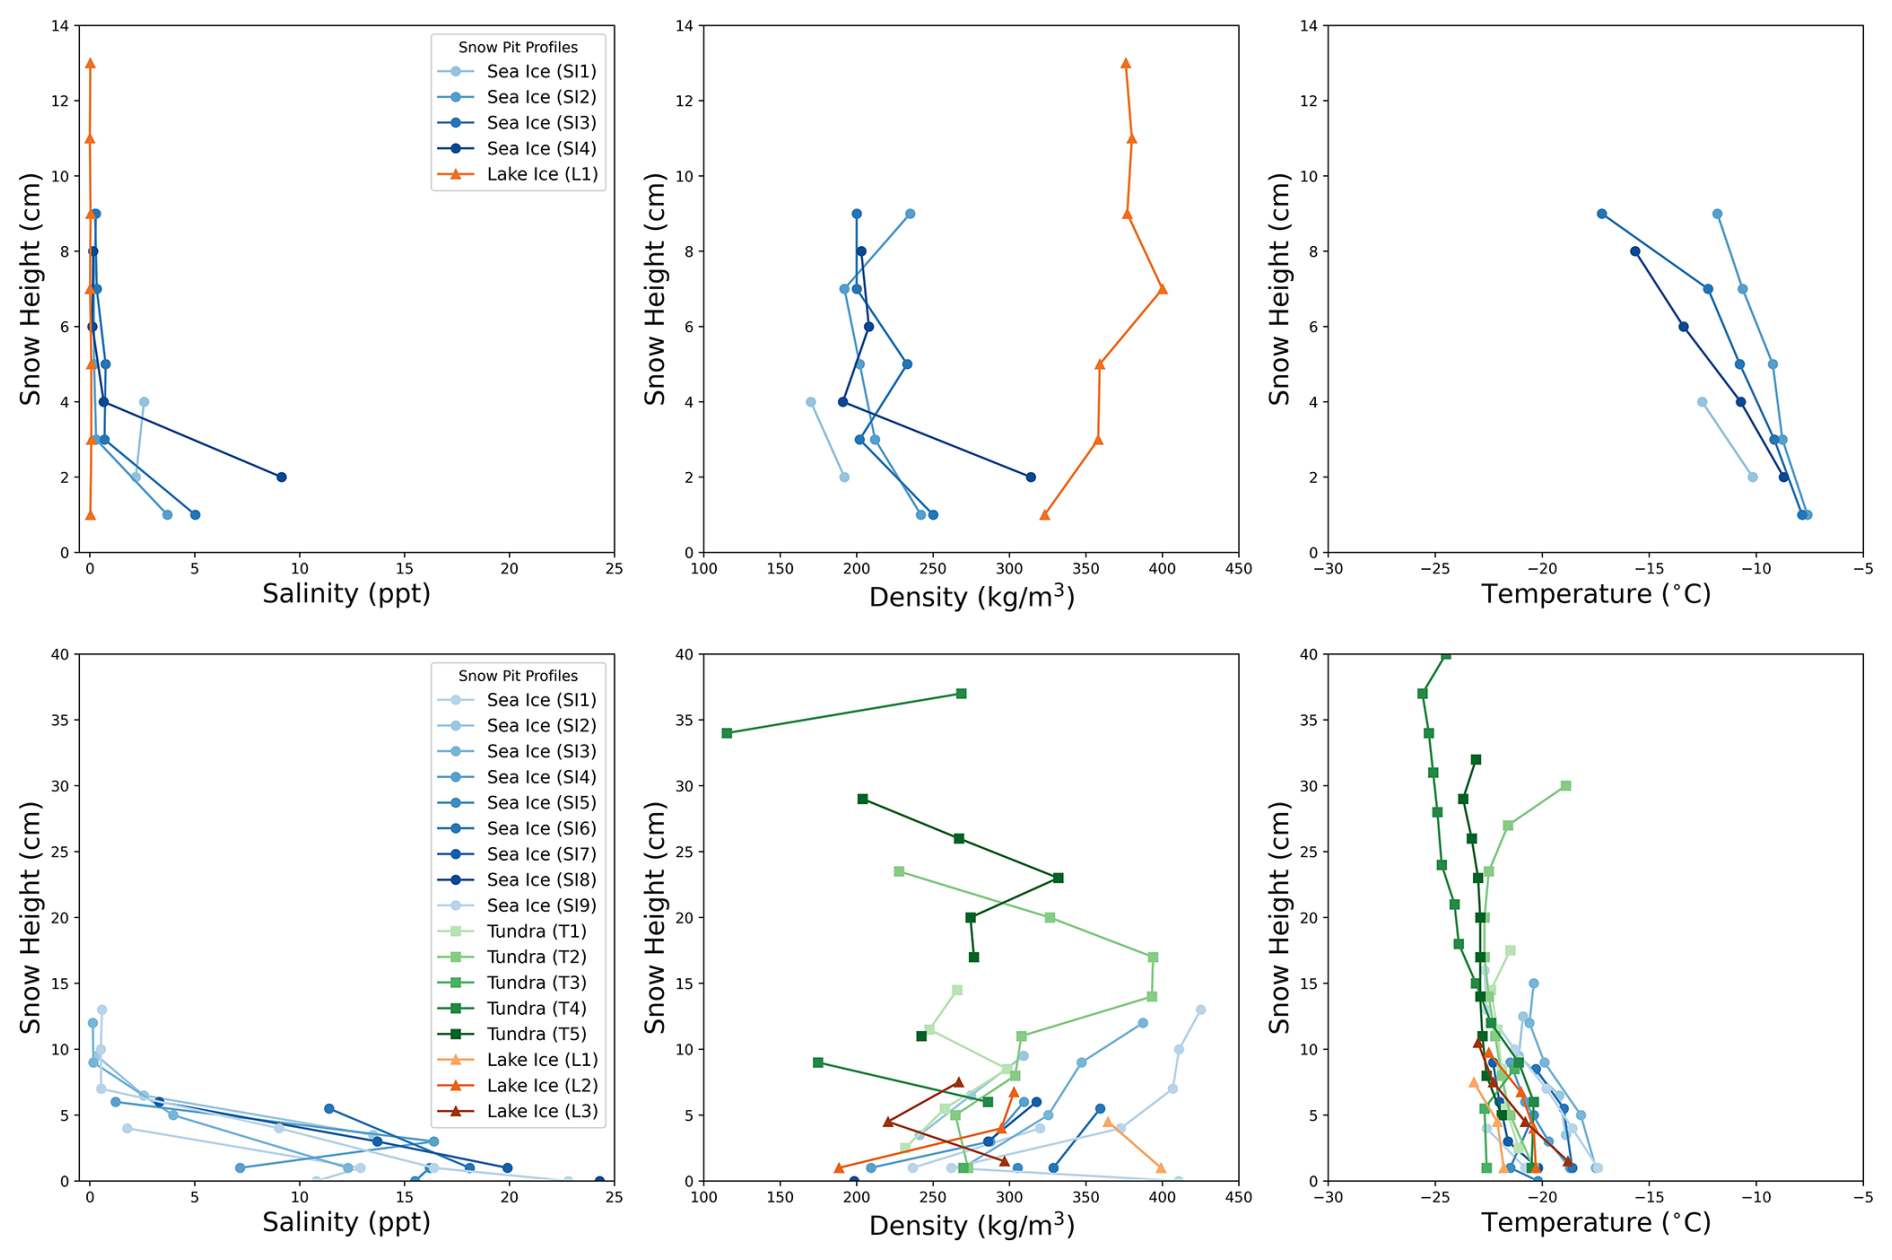
Figure 4Profiles of salinity (left), density (middle) and temperature (right). Churchill data are shown in the upper panel and those in the lower panel are from Resolute Bay. y-axis labels correspond to the middle of each layer sampled. Salinity of the ice surface is included when measured.
The density profiles over Resolute Bay landfast sea ice were indicative of hard, fine-grained wind slabs with higher densities near the surface, and coarse-grained layers composed of large faceted and depth hoar crystals with lower densities near the ice interface. This contrasts with the profiles collected near Churchill, which showed higher densities closer to the ice surface. Large faceted grains were also observed at the base of snowpacks sampled on Lake Resolute and the tundra, as well as near the surface in a few of the tundra snow pits. Overall, the average bulk snow densities for sea ice and lake ice in Resolute were broadly similar, with values of 300 and 324 kg m−3 for the two different sea ice locations, and 302 kg m−3 over Lake Resolute. These values generally represent those for wind-packed snow. The tundra densities were lower, with an average bulk density of 264 kg m−3, consistent with the significant amount of depth hoar encountered. By comparison, the bulk densities were considerably lower over landfast ice in Churchill (average of 209 kg m−3) while the bulk density over the single snow pit from Malcolm Ramsay Lake was 368 kg m−3. Caution is warranted, however, when interpreting the snow density measurements, especially for the tundra snow sampled in Resolute, as the large faceted grains were poorly bonded, making accurate density sampling challenging. Compared to SMP-derived density estimates (Fig. 5), the density cutter measurements from the tundra snow pits were often lower.
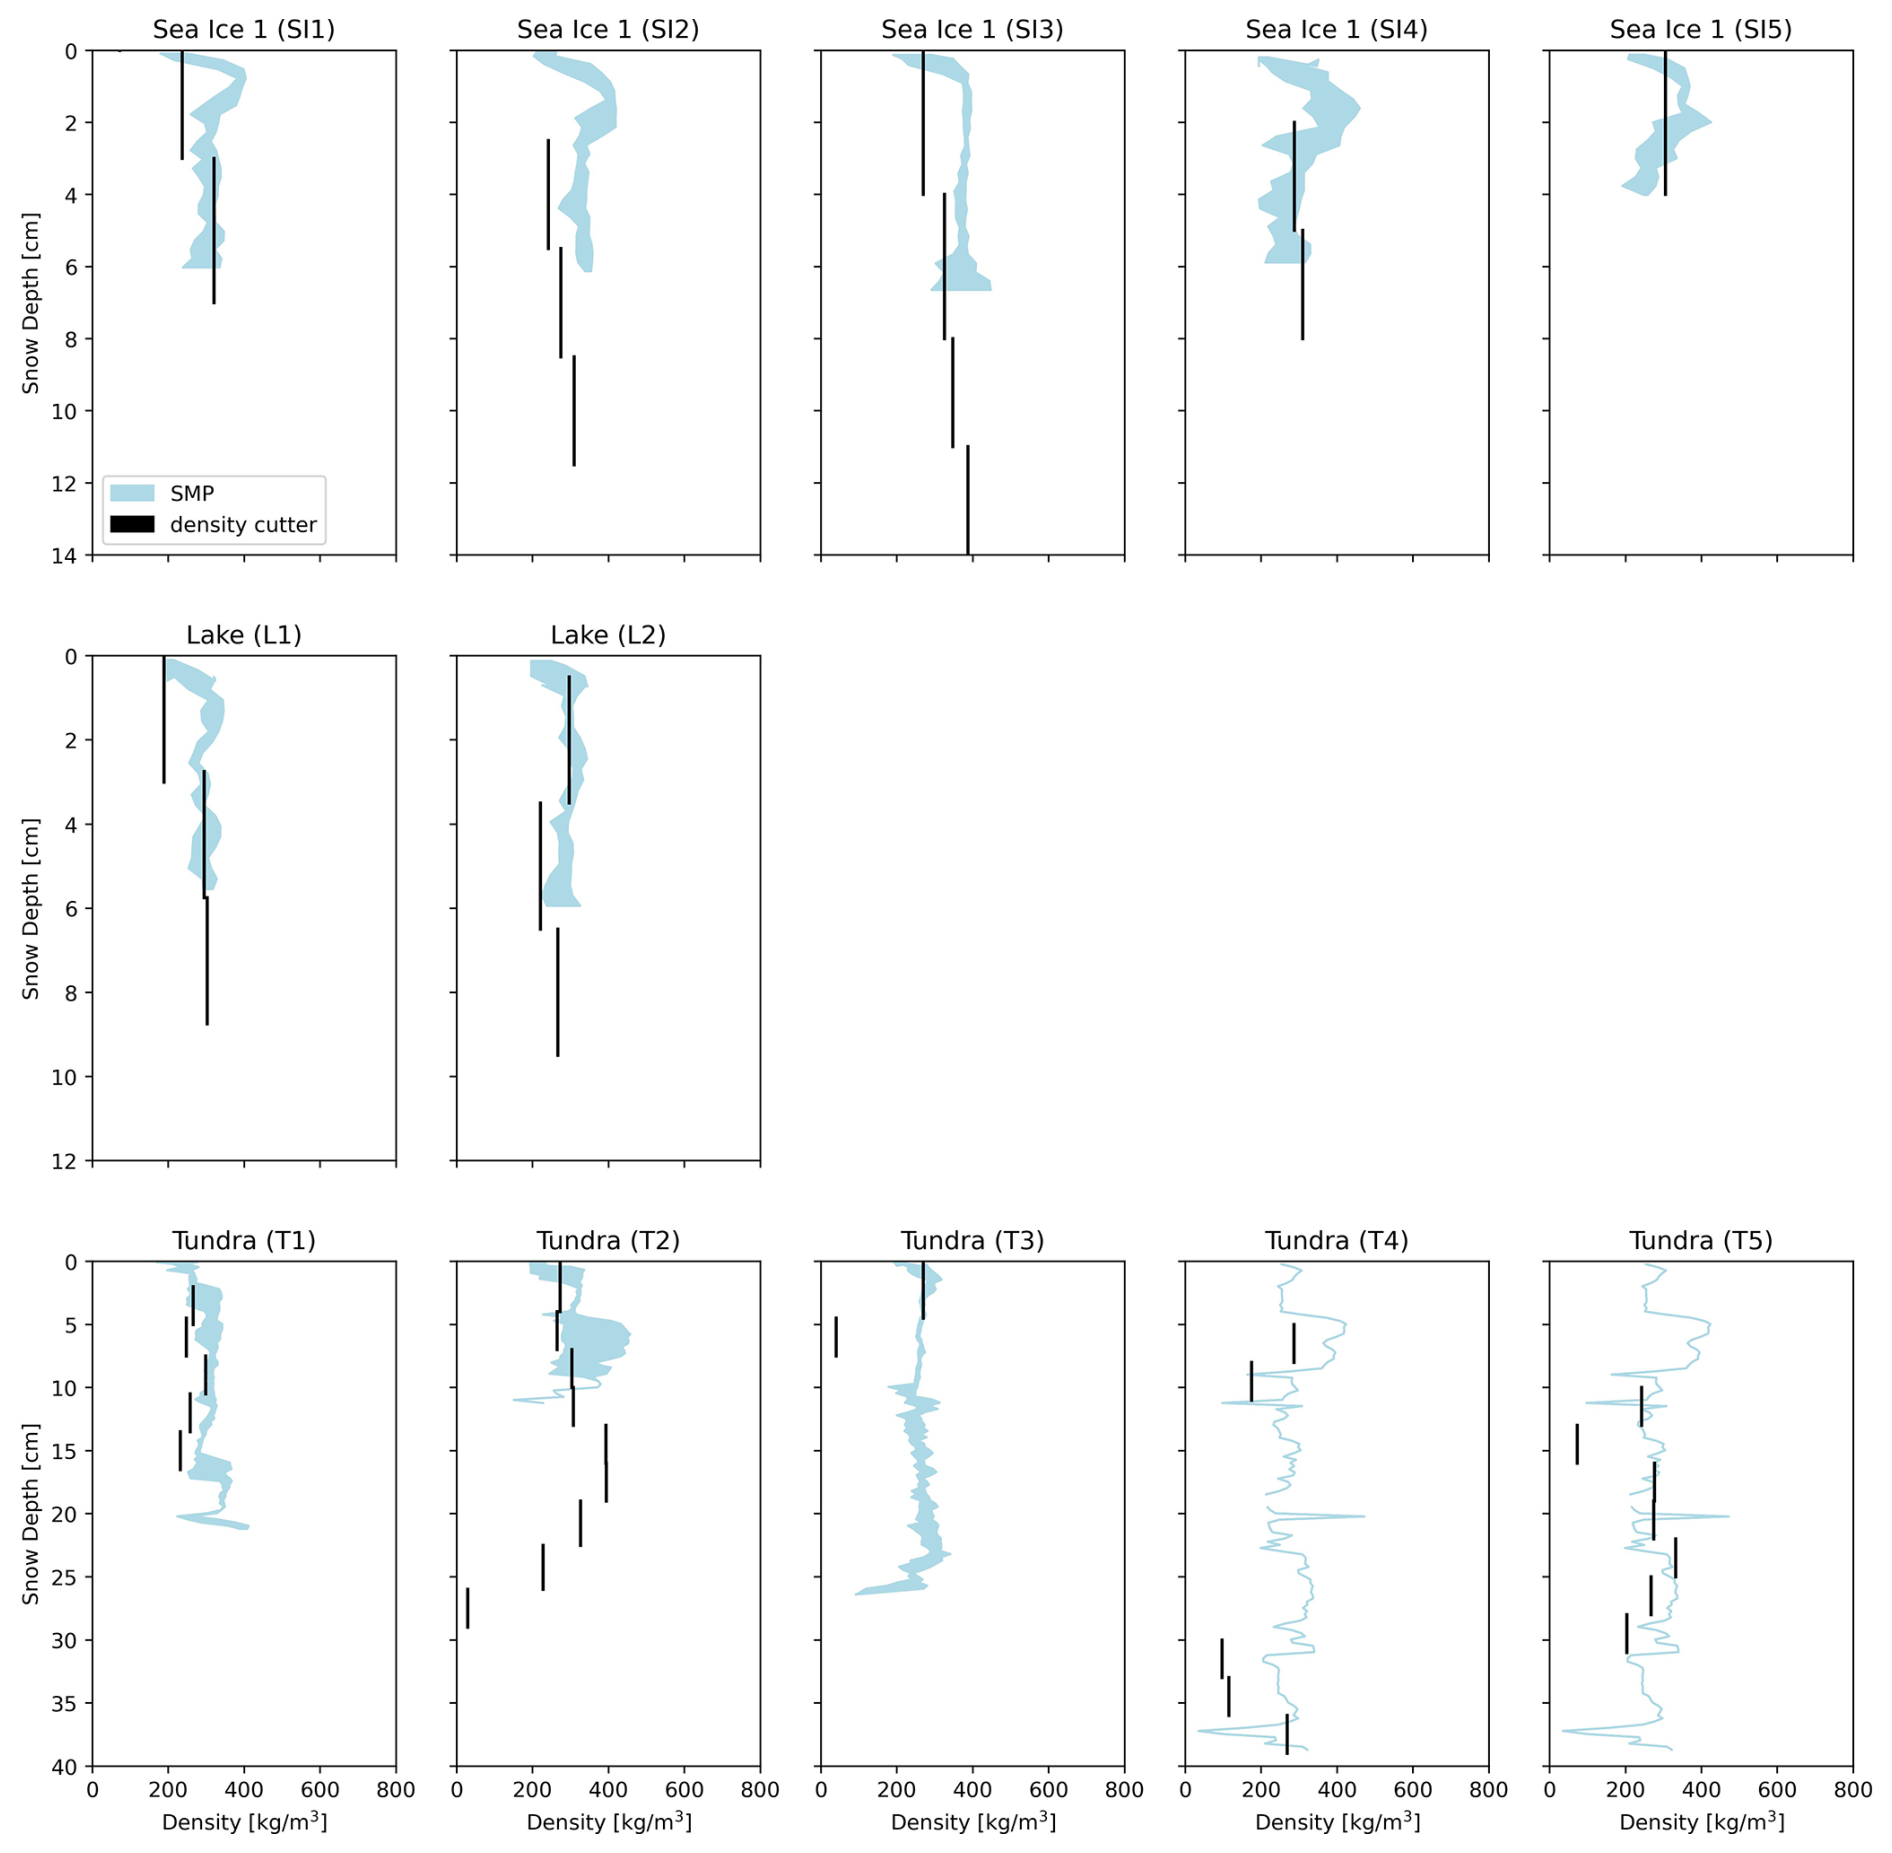
Figure 5Comparison of SMP-derived density profiles (following King et al., 2020) and those derived using a density cutter. Note the vertical axis is reversed compared to Fig. 4 as the total snow height measured by the SMP was sometimes not achieved due to incomplete penetration of the SMP. All data shown here were collected during the Resolute field campaign.
Finally, the temperature profiles showed the expected increase in temperature toward the underlying ice or land surfaces. Some exceptions occurred at tundra sites in Resolute, where slightly colder temperatures were observed just below the snow–air interface relative to the snow surface. This may reflect the presence of large faceted grains near the snow surface at those sites; large, poorly bonded grains have lower thermal conductivity, which slows the downward propagation of cooling and also delays the upward return of heat when air temperatures increase (e.g. Dutch et al., 2022).
2.2 The KuKa Radar and Pre-Processing
The KuKa radar operates at frequencies comparable to those of the Ka-band (30–40 GHz) AltiKa satellite and the Ku-band (12–18 GHz) CryoSat-2 satellite. Both the Ka- and Ku-band systems are FMCW radars employing linear frequency modulation. Being fully-polarimetric, KuKa provides the capability to record radar returns at both co-polarization (HH, VV) and cross-polarization (HV, VH), offering deeper understanding into snow and ice scattering properties.
The central radar chirp frequencies are 35 and 13.575 GHz. Since the radars have high bandwidths, this allows for fine range resolutions of 1.5 (Ka-band) and 2.5 cm (Ku-band). The radar uses separate transmit and receive antennas for each frequency band. The Ku-band antenna has a beamwidth of 16.9° while the Ka-band antenna has a narrower 11.9° beamwidth. Radar pulses are transmitted every 0.33 for Ka-band and every 0.5 s for Ku-band. Although the two antennas do not illuminate the exact same surface footprint, movement of the instrument along the transect ensures that both frequency bands sample overlapping surface areas. Detailed description on the radar system design, characteristics and operation are provided in Stroeve et al. (2020).
To perform the transects, KuKa was mounted on a sledge in a nadir viewing configuration, giving a distance from the antennas to the ground of approximately 1.7 m. KuKa was pulled at a steady speed <3 m s−1 and transects of various lengths were conducted. As shown in Figs. A2 to A5, the transects in Resolute Bay ranged in length from 1.08 (tundra) to 2.10 km (first landfast ice location). In Churchill the transects ranged from 0.12 (tundra) to 1.47 km (landfast ice) (Figs. A6 to A8). In processing of the data, only data points where the horizontal displacement between successive measurements exceeded a 0.05 m cutoff were retained, ensuring we used independent samples (i.e. the sled was moving). To mitigate errors caused by sensor orientation, KuKa measurements with cross-track and along-track tilt angles exceeding 10° were further excluded from analysis.
Because radar waves travel more slowly in snow than in free space due to the higher relative permittivity (ϵr), the physical snow depths retrieved by KuKa must be adjusted before comparing to the Magnaprobe snow depths. We do this by scaling the KuKa-derived snow depths by the reduced radar wave speed (c′), derived following Hallikainen et al. (1986):
where c is the speed of light in a vacuum and (ρ) is the bulk snow density (given in g cm−3) estimated from the snow pits. This equation was derived for frequencies between 4 and 18 GHz and is valid for dry snowpacks with ρ<500 kg m−3. Since the real part of the dielectric constant of dry snow is generally considered to be independent of frequency this equation provides a good approximation also at 35 GHz for our sites. While Eq. (1) provides a wave speed correction based on snow density for dry snow, the presence of salinity at the base of the snowpack (Fig. 4) introduces brine that increases the complex permittivity. Specifically, the real part (ϵ′) further reduces the wave speed, while the high ionic conductivity of the brine increases the imaginary part (ϵ′′), leading to significant dielectric loss (e.g., Hallikainen et al., 1986, Geldsetzer et al., 2009). Based on analysis of our snow pit dielectrics (see Discussion section), the difference in using this assumption is on the order of 0.09 ns or less for the landfast ice snowpacks. Given that we do not have the dielectrics along the entire KuKa transects, we have chosen to apply the dry snow scaling as a first-order correction consistently across all data collected. Based on the bulk densities measured, reduced wave speed scaling factors ranged from 0.77 (368 g cm−3) to 0.85 (209 g cm−3).
2.3 KuKa scattering and snow depth estimation
To locate the air/snow interface we search range windows beginning at 1 m from the antennas. This search was conducted iteratively over ranges defined as four times the specific frequency's range resolution. The highest amplitude peak in the window starting where the HH radar power exceeds −25 (Ku-band) or −30 dB (Ka-band) is taken to represent the air/snow interface. Next, the range bins corresponding to the highest amplitude peaks are identified for both the co- and cross-polarizations in the Ku- and Ka-bands.
As per Willatt et al. (2023), the polarimetric snow depth estimations are calculated as the difference between the ranges in the HH and VH waveforms in the same frequency band, using the peaks or centroids of the waveforms. Pol-peak is the difference between the range of the highest amplitude peaks in the HH and VH waveforms (between 1–3 m range), which assumes that the snow depth is less than ≈1.5 m. Pol-Centroid is the difference between the HH and VH waveform centroids (also calculated over 1–3 m range). While the peak (maximum amplitude) identifies a single point of strongest return (assumed to be air/snow at HH and snow/ice at VH), the centroid is the weighted average of the entire return pulse, which integrates the entire scattering distribution. This will naturally shift the calculated height downward into the snowpack, and may additionally incorporate ranges beyond the snow/ice interface. However, the centroid may provide a more consistent estimate of the air/snow interface when the peak exhibits high spatial variability or fluctuates inconsistently due to surface roughness (see Willatt et al., 2023, Fig. 3 and Supporting Information Fig. 6 for examples of waveforms with overlaid peaks and centroids). Finally, we additionally compute the frequency-derived snow depth as the difference between the Ka- and Ku-band HH peak amplitude (or centroid) locations. Retrieved snow depths less than 2.5 cm are excluded from further analysis, since this is the minimum resolvable range of the Ku-band system.
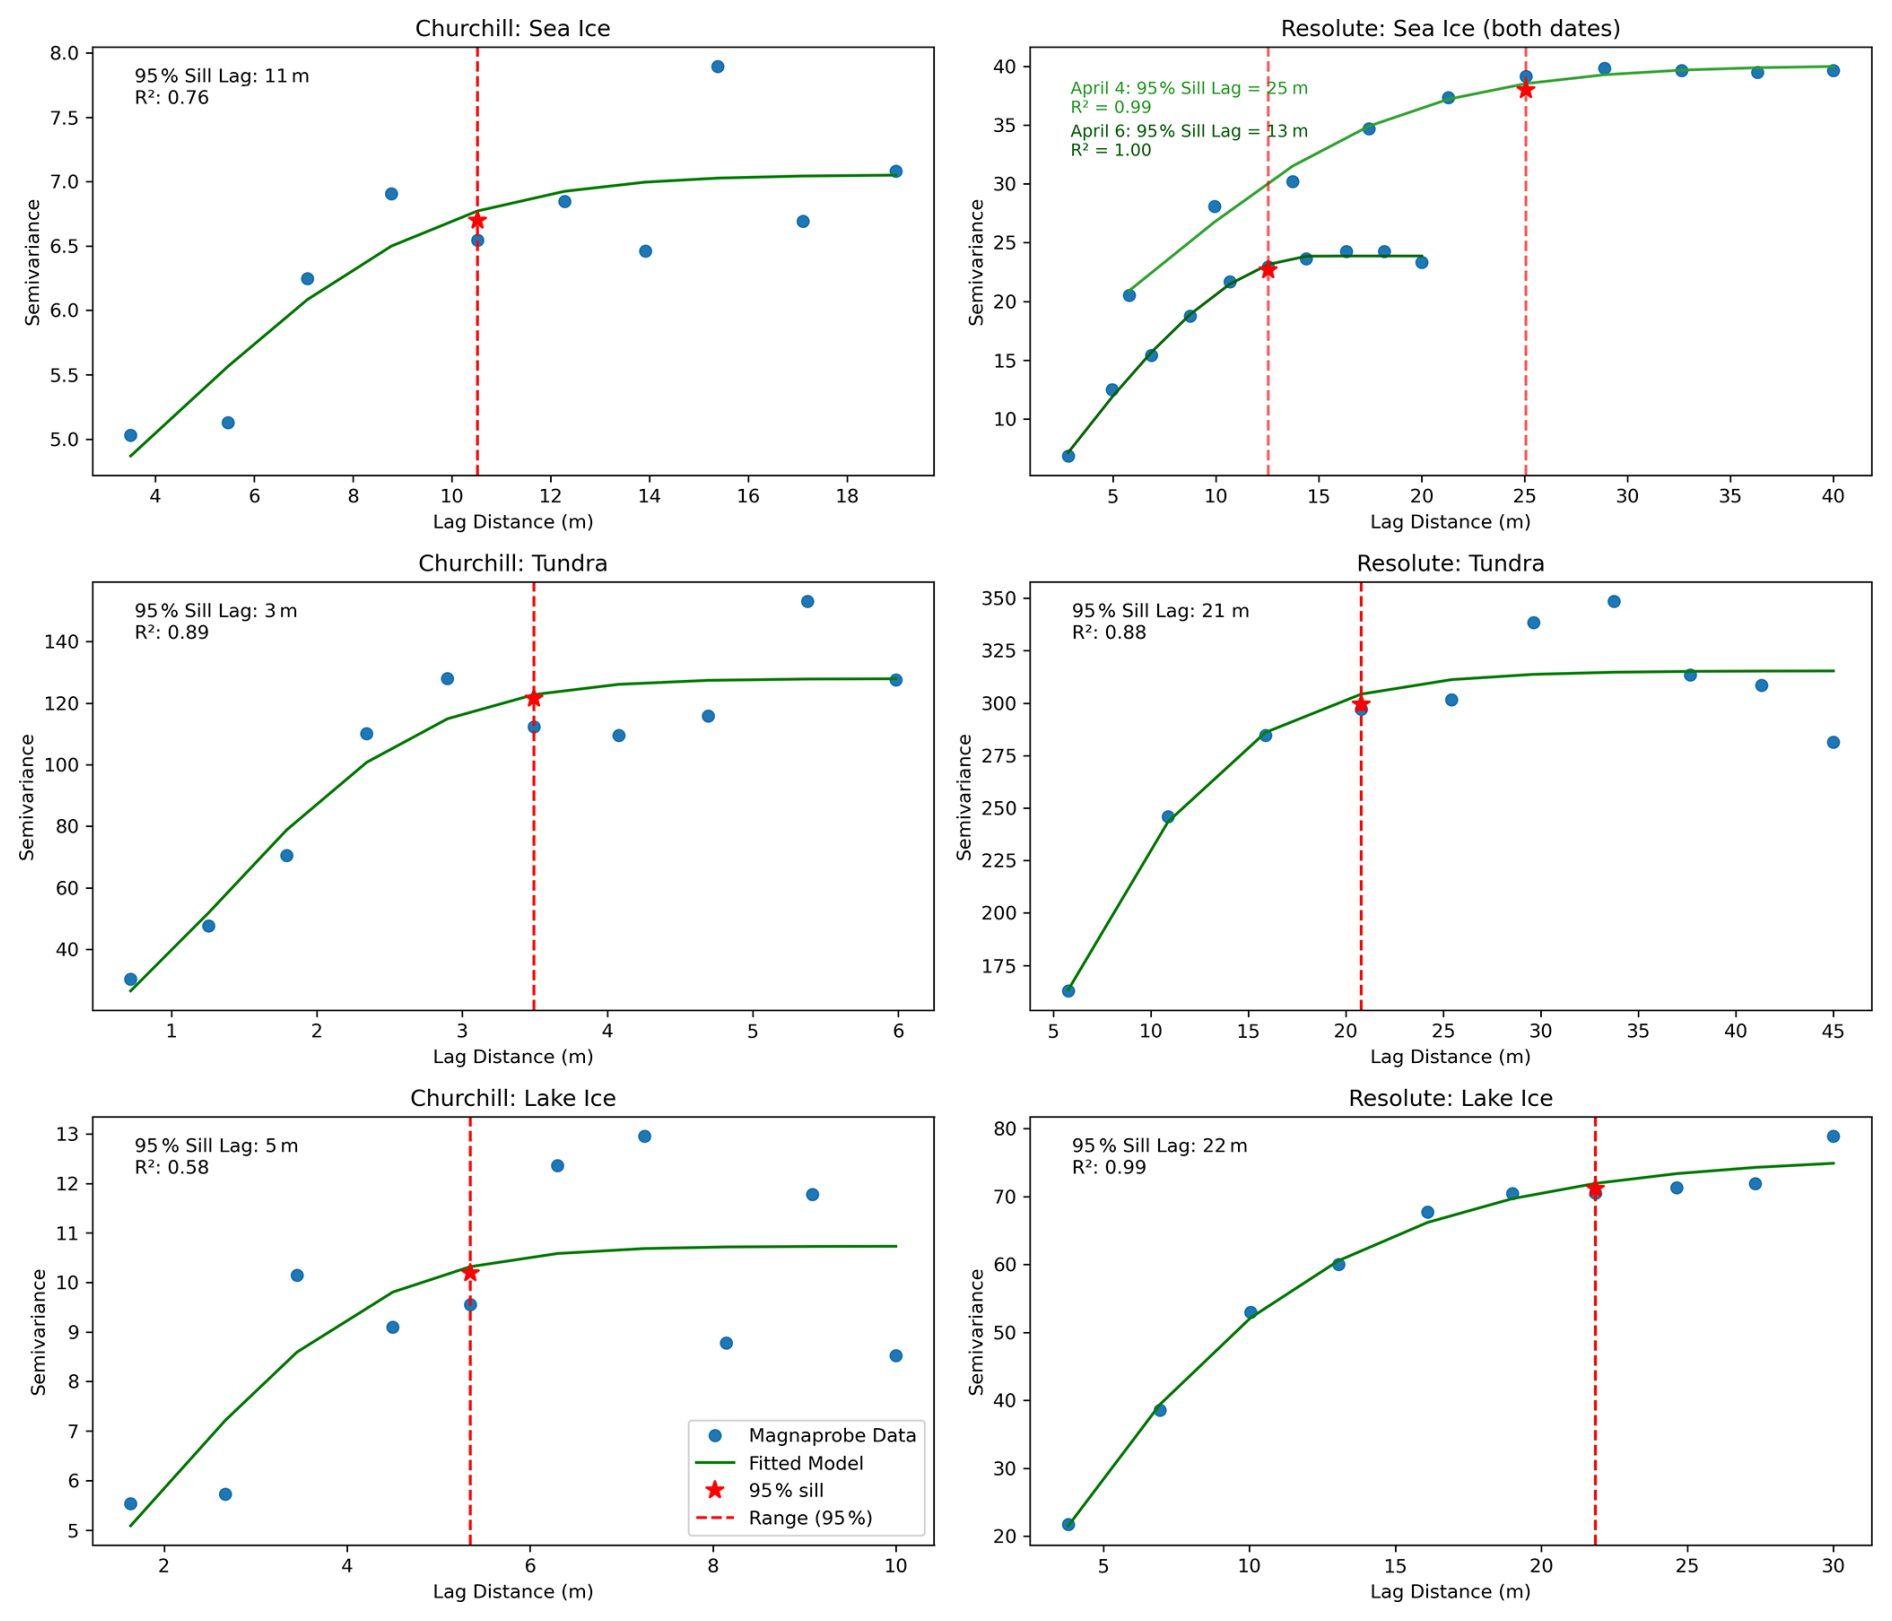
Figure 6Semi-variograms of MagnaProbe snow depth measurements for each surface types surveyed near Churchill (left) and Resolute Bay (right). Semi-variance is plotted as a function of lag distance, with bins computed based on each site's data density and setting the max lag based on the expected range of spatial correction computed for each site. R2 values represent the skill of the model fit.
Table 1 summarizes the percentage of waveforms in which the peak amplitude corresponds to the air/snow interface (i.e., the first detected peak). The results show that, over lake ice, the peak amplitude rarely aligns with the air/snow interface. Consequently, a second approach specifically tailored for lake ice was developed. This alternative method also begins by identifying the air/snow interface, determined as the point where the waveform first exceeds a polarization- and band-specific power threshold (see Table 2). As before, the air/snow interface is first found by iteratively searching over range windows equal to four times each frequency's range resolution for ranges greater than 1 m. The ice/water interface is then located by scanning upwards from depths of 3 m in Churchill and depths of 6 m in Resolute, until the waveform again exceeds a specified threshold (see Table 2). Because the ice/water signal can be intermittent, the picker occasionally identifies spurious shallower features (often the air/snow interface). To exclude these, only detections deeper than 2.1 (Churchill) and 3.7 m range (Resolute) are retained as valid ice/water interfaces.
Table 1Percentage of waveforms where the highest amplitude peak returns correspond to the air/snow interface for Ku- and Ka-band across surface types and polarizations.
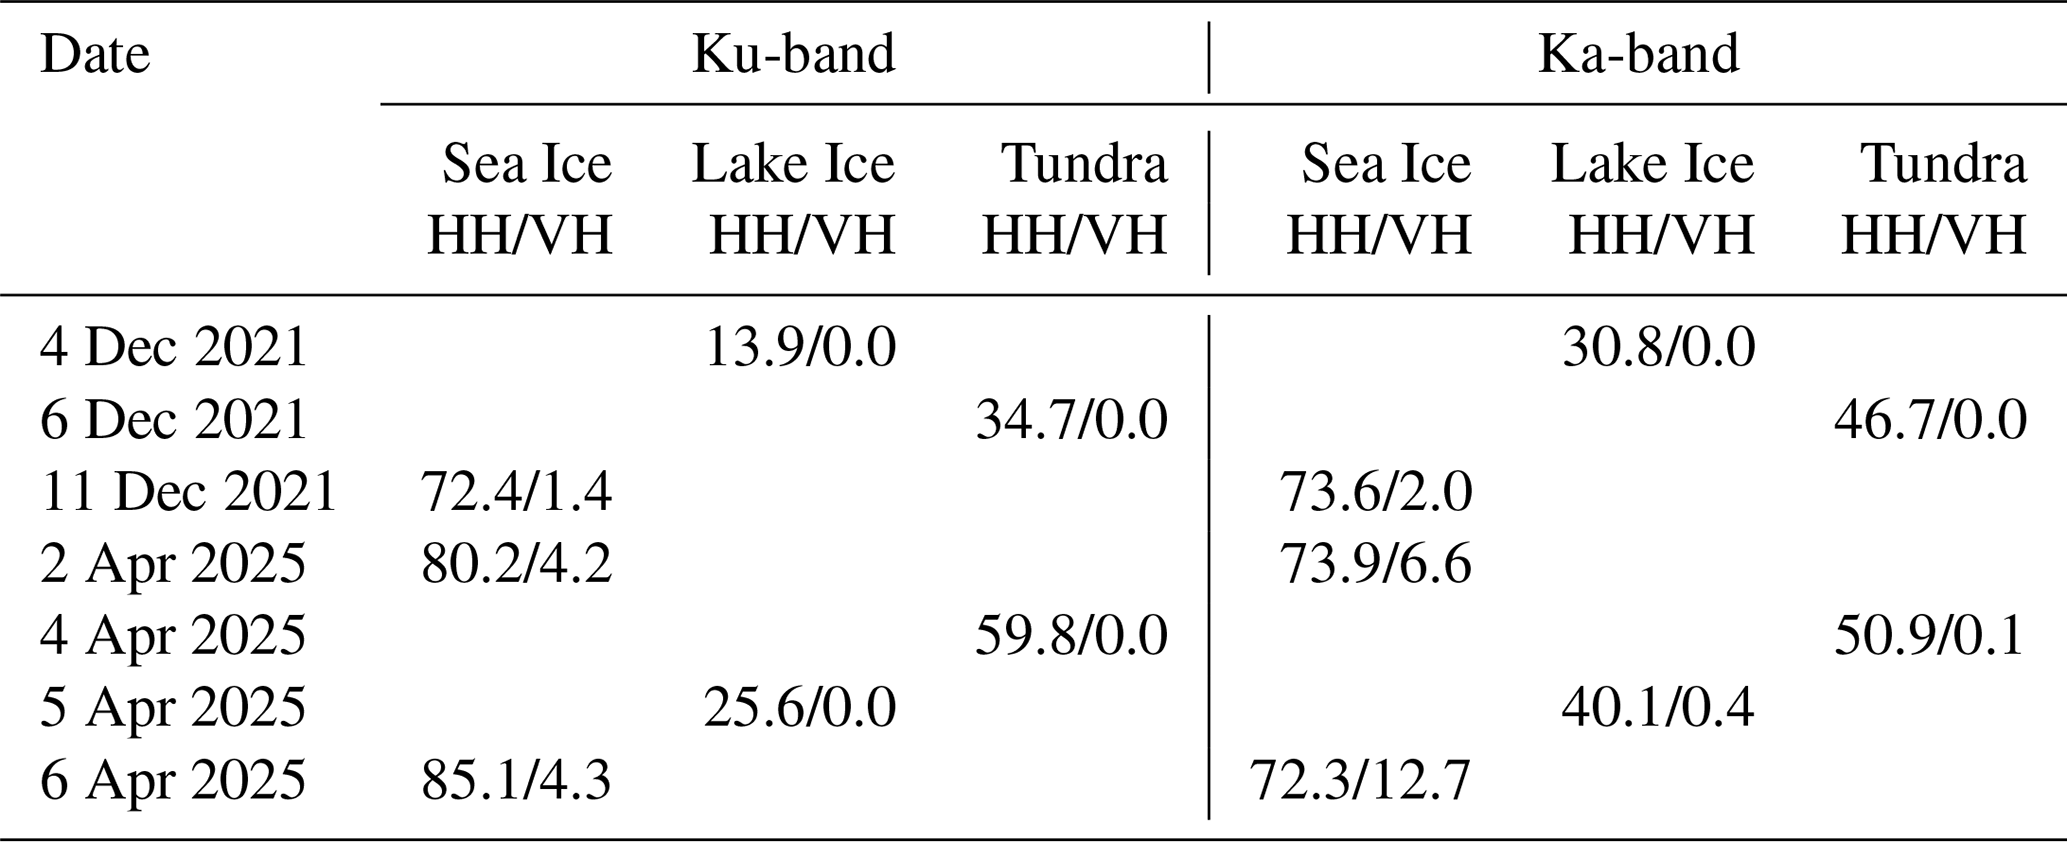
Table 2Summary of thresholds and search directions by band and frequency used in additional snow depth algorithm for lake ice in Churchill and Resolute.
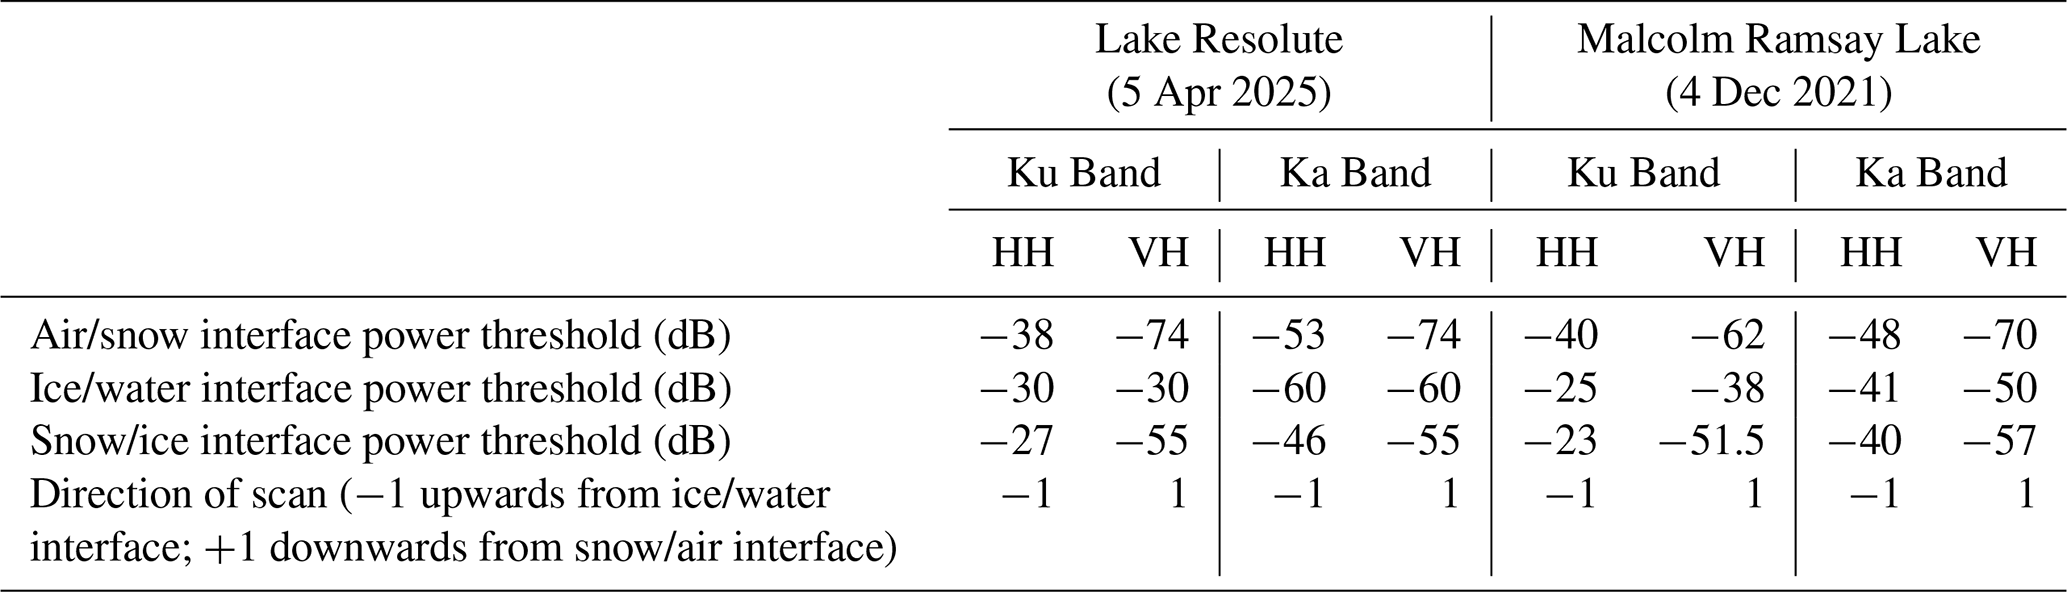
The air/snow interface and the minimum depth of the ice/water interface define the vertical search bounds for locating the snow/ice interface, which is identified by stepping through the intermediate range bins until the power again crosses a predefined threshold. Thresholds and search directions vary by band and polarization, determined through manual inspection to ensure best agreement with observed surfaces in the echograms. These settings are summarized in Table 2. Note that this alternative interface detection method is not based on differencing the HH and VH returns, but rather finds the snow depth for each polarization and frequency independently.
2.4 Comparison to MagnaProbe data
Following Willatt et al. (2023), we use two-dimensional spatial binning to aggregate the KuKa-derived snow depths for comparison with the MagnaProbe snow depths, where the bin size ranges from 1 (for highest spatial resolution analysis) up to 145 m (for large-scale mean comparison). Within each grid cell, the mean of all coincident KuKa dual-polarimetric peak and centroid snow depths greater than 2.5 cm, as well as the mean of all coincident MagnaProbe snow depths were calculated. This process yields spatially averaged snow depth grids for both instruments, providing a robust basis for statistical comparison between the radar-derived and ground-based snow depth observations.
After binning, we need to determine the optimal spatial averaging window to use for comparing the KuKa-derived and MagnaProbe-measured snow depths. This is achieved by computing semi-variograms from the MagnaProbe snow depth data.
Instead of forcing a particular model to fit the data, we iteratively chose the best model (spherical/exponential/Gaussian) based on the highest model fit (given by the R2). In interpreting the semi-variograms, the sill represents the total observed variability and the nugget (the y-intercept at zero lag) accounts for measurement error and sub-meter variability. The effective range represents the distance at which two observations become spatially independent, and serves as the metric for determining the optimal spatial scale when intercomparing the two datasets.
The resulting semi-variograms are summarized in Fig. 6. The results show that the required averaging window varies significantly by environment: spatial correlation scales for snow depth are smallest on Churchill tundra (range: 3 m) and Malcolm Ramsay Lake (range: 5 m), requiring only a small comparative window. Conversely, structures are much larger during the Resolute Bay field campaign, necessitating a minimum averaging window of 13 to 25 m to ensure that each comparative sample is spatially complete and independent. Consequently, the snow depth data must be averaged over a distance at least equal to the autocorrelation range determined for each specific site to capture the full local variability. However, the transect lengths at the Churchill sites were considerably shorter (e.g. 119 m on the Churchill tundra vs. 1,075 m at Resolute) and thus the optimal averaging window for Churchill is likely larger than these models suggest. Thus, for Churchill, we opted for a bin size of 20 m for the lake and tundra surfaces, and 15 m for the sea ice.
3.1 Echograms
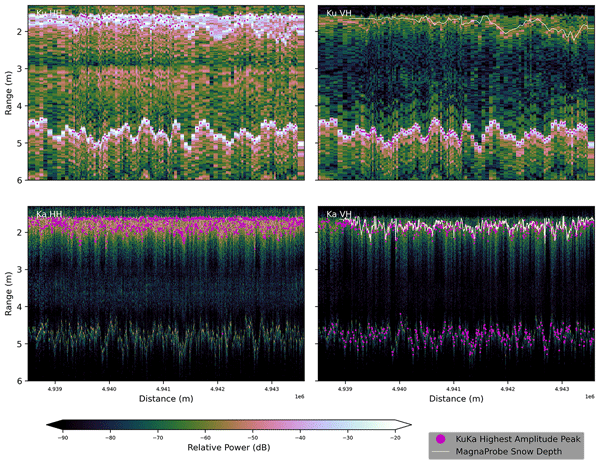
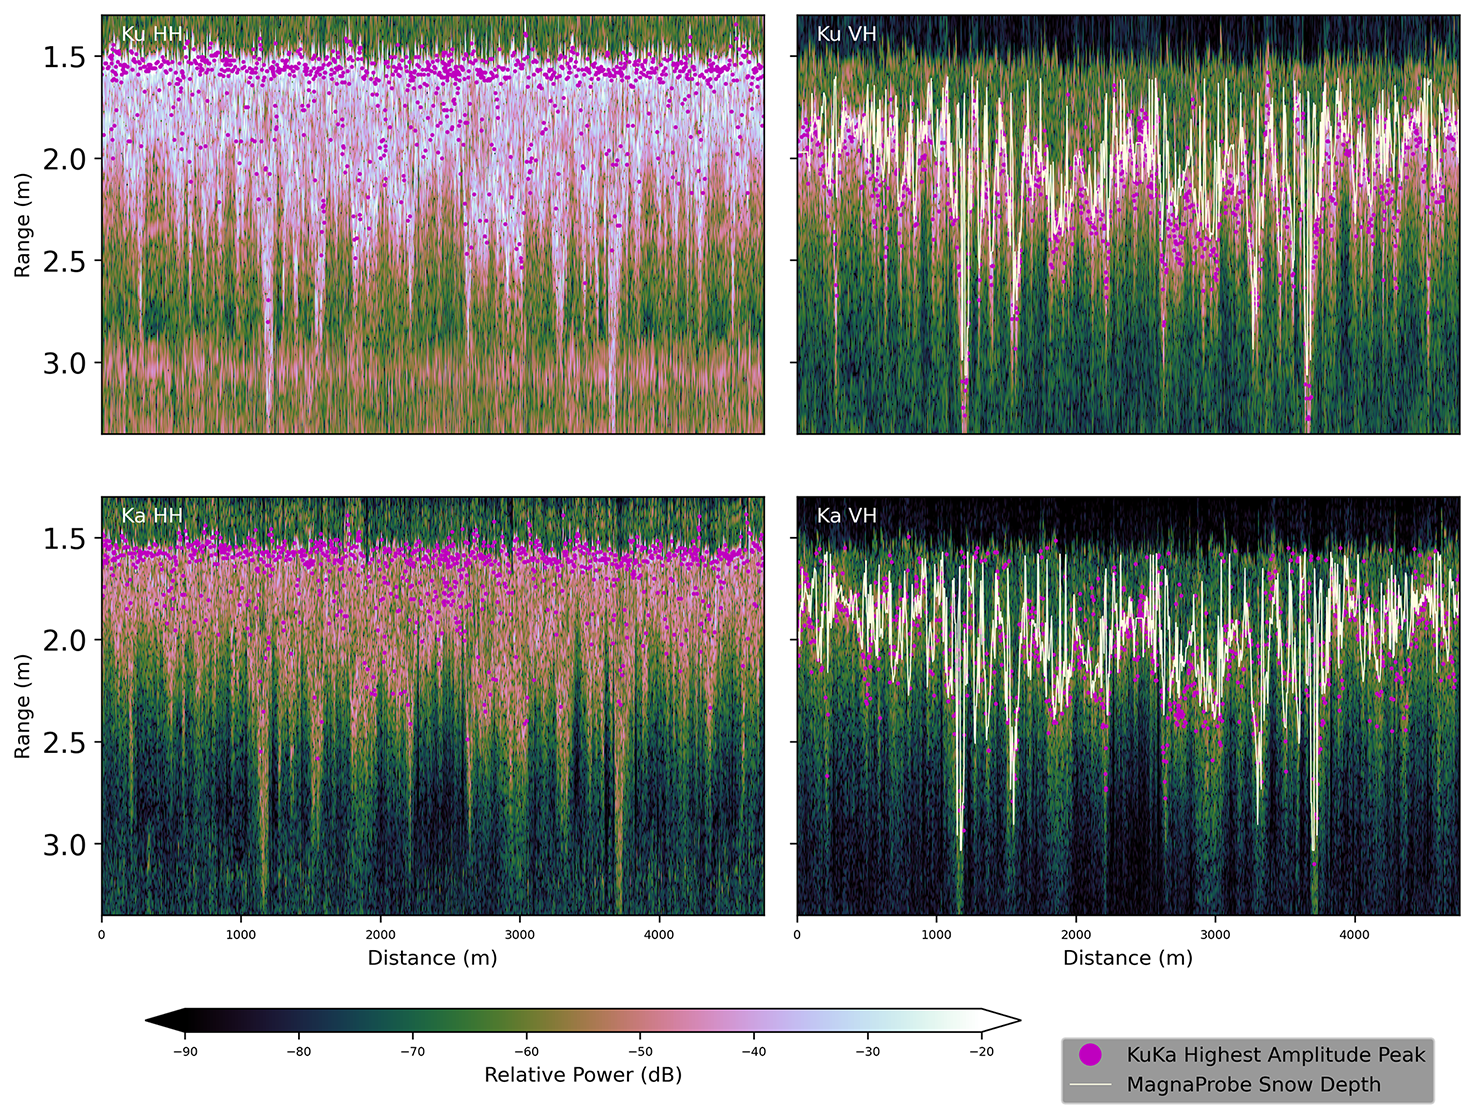
We begin with an evaluation of the individual echograms collected for the different surface types, with the corresponding MagnaProbe snow depths overlaid in light yellow. Data are shown as a function of distance traveled on the x-axis and distance from the antenna phase center to the scattering target. The height of the snow surface to the antennas was typically between 1.55 and 1.6 m. For brevity, Figs. 7–9 present examples from Resolute representing landfast ice (2 April), lake ice (5 April) and tundra (4 April). Examples from the Churchill campaign and the second Resolute Bay landfast ice site are included in Appendix A.
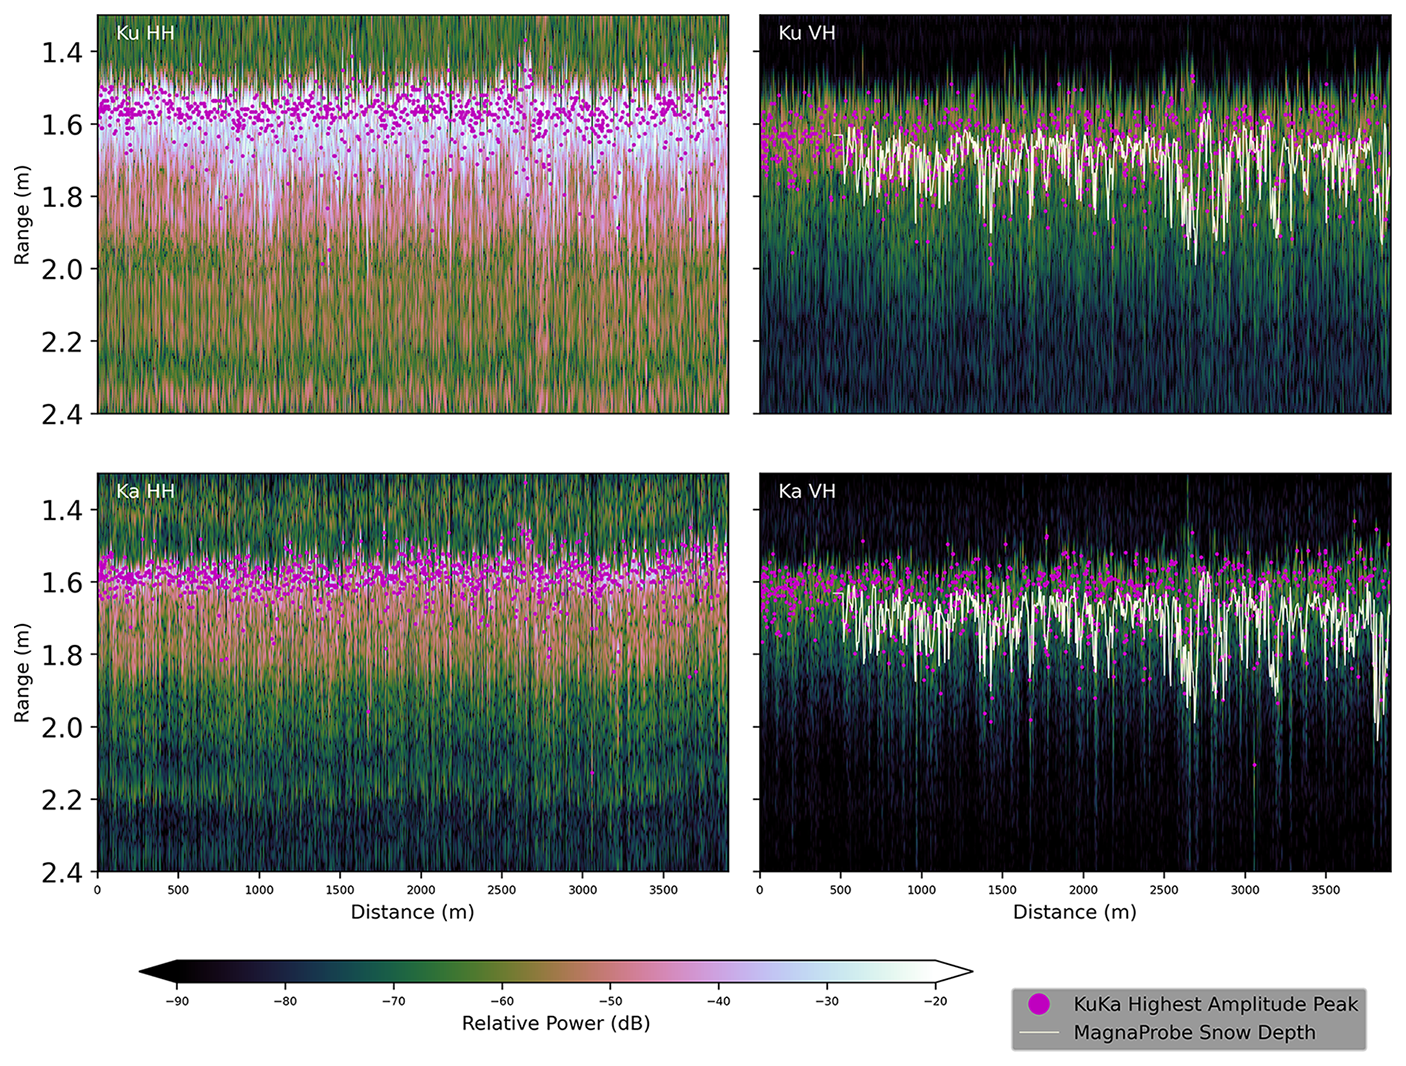
Figure 7KuKa data echograms from 2 April 2025 over landfast sea ice in Resolute Bay. The vertical axis represents the radar range, defined as the distance from the antenna phase center to the scattering target. Shown are the Ku- and Ka-band (top and bottom panels) full bandwidth, HH- and VH-polarized (left and right panels) waveforms. Magenta markers indicate where the highest amplitude peak occurs in each radar waveform. Light yellow lines indicate MagnaProbe snow depths overlaid on the VH data; MagnaProbe depths were divided by c′ to scale them to account for the reduced speed of radar wave propagation in the snow pack and referenced from a constant height of 1.56 cm (estimated distance from snow to radar).
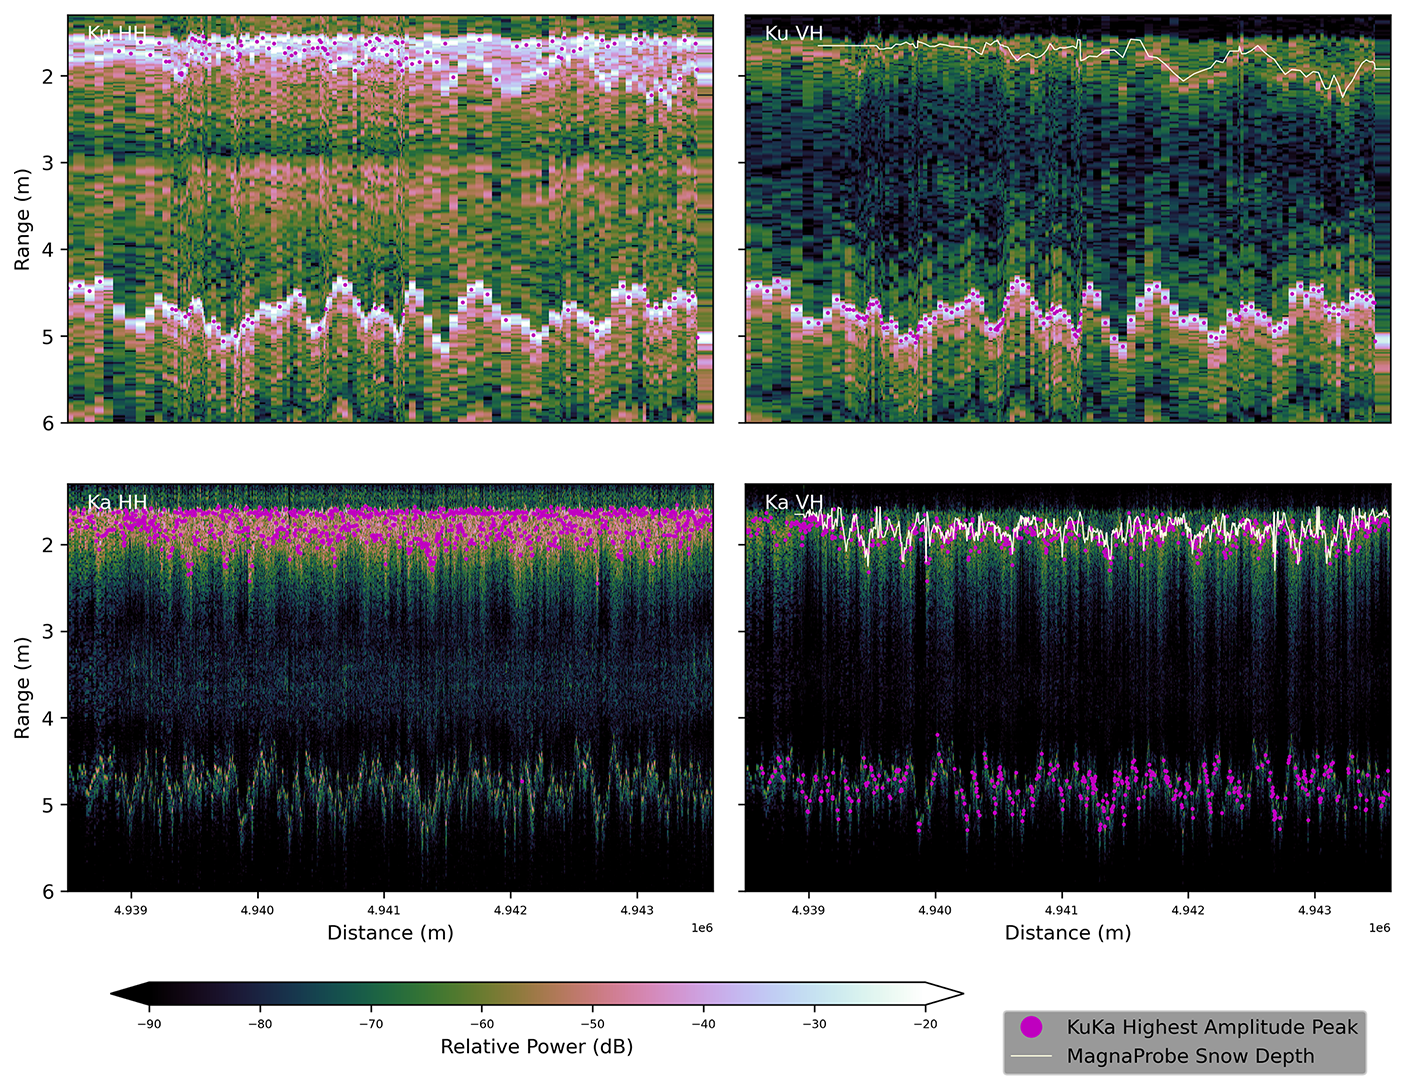
Figure 8As in Fig. 7, but for Lake Resolute data on 5 April 2025. Note that the distance is not identical for Ku- and Ka-band as a result of Ku-band recording stopping during part of the transect. Note also the deeper ranges plotted compared to Fig. 7.
The landfast sea ice echograms (Figs. 7 and A9–A10) exhibit features consistent with previous studies (e.g., Stroeve et al., 2020, 2022; Willatt et al., 2023, 2025), characterized by stronger co-polarized returns and deeper scattering ranges at Ku-band compared to Ka-band. At co-polarization, the dominant scattering surface (highest relative power) aligns with the air/snow interface at both frequencies and across all landfast sea ice sites. In Resolute, peak returns (in magenta) coincide with the air/snow interface in 80 %–85 % of Ku-band and 72 %–74 % of Ka-band waveforms (Table 1). Results from Churchill are broadly similar, with 72 % (Ku) and 74 % (Ka) of peaks located at the snow surface.
At cross-polarization, the dominant scattering surface rarely corresponds to the air/snow interface. In Resolute Bay, only 4 %–13 % of waveforms have their peak at the surface, while in Churchill, this occurs in less than 2 % of waveforms. Instead, VH peaks generally align with the snow/ice interface (32 %–38 % (Ku) and 19 %–22 % (Ka)) or internal snow layers. However, we do find the alignment between the VH peak and the snow/ice interface is weaker in Resolute Bay compared to Churchill and prior findings (e.g., Willatt et al., 2023). We hypothesize that small amounts of liquid brine in the Resolute Bay snowpacks may be sufficient to shift the dominant VH scattering center upwards, a mechanism we discuss further in the Discussion section. Finally, we note that some returns within the sea ice are visible in these echograms. Apparent returns from within the ice are more likely to arise from system artifacts or off-nadir returns than from true penetration to those depths, consistent with the discussion in Newman et al. (2024) of sidelobes, radar multiples, and off-nadir footprint effects in KuKa FMCW radar data.
Waveforms collected over lake ice (Figs. 8 and A12) differ markedly from those over landfast sea ice, characterized by strong returns from deeper ranges and the detection of a distinct third boundary (the ice/water interface) at 4–5.5 m range (Lake Resolute), and 2–3 m range (Malcolm Ramsay Lake). For both lakes, the air/snow interface is rarely the dominant scattering surface at HH. Peak amplitudes align with the surface in only 26 % (Ku) and 40 % (Ka) of the waveforms collected over Lake Resolute, with even lower detection rates of 14 % (Ku) and 31 % (Ka) at Malcolm Ramsay Lake (Table 1). Instead, the snow/ice and ice/water interfaces play dominant roles. For example, the Ku-band HH peak coincides with the ice/water interface for 32 % of the waveforms. In comparison, less than 1 % of the Ka HH waveforms have peak returns at the ice/water interface, and instead the snow/ice interface is the more dominant scattering surface.
The dominant scattering surface at cross-pol for Ku-band is always located at the ice/water interface over Lake Resolute, while at Ka-band, it aligns with the ice/water interface in 38 % of the waveforms, with the remainder predominantly scattered from the snow/ice interface. Results are similar for Malcolm Ramsay Lake, with the majority of the Ku-band VH peaks returns corresponding to the ice/water interface, while at Ka-band the results are more mixed. Overall, the clear detection of three distinct scattering horizons, and the strong sensitivity of Ku-band VH to the ice/water interface, indicates that our standard peak- or centroid-differencing algorithms will likely fail to retrieve accurate snow depths over lake ice if the full range profile is processed.
Results for the tundra are broadly similar to those for the landfast ice, but the correspondence of HH peak amplitudes to the air/snow interface is weaker (Figs. 9, A11 and Table 1). The tundra snowpacks sampled in Resolute Bay indicate the HH-peak amplitude is located at the air/snow interface for 60 % (Ku-band) and 51 % (Ka-band) of the waveforms (Table 1). Other peak amplitude returns appear to align with the snow/ground interface or occasionally within the snowpack. At cross-polarization, the snow/ground interface largely appears to be the dominant scattering surface at Ku-band, whereas at Ka-band, density variations, which introduce internal scattering layers, are more easily resolved by the shorter wavelength, resulting in significant backscatter originating from within the snowpack rather than the ground. The limited data collected in Churchill show similar results though overall less alignment with the snow/ground interface at cross-polarizations. It could be that the more complex mat of shrubs, mosses, and lichens at the Churchill location acts as a volume scattering source, creating multiple scattering paths that can “smear” the VH return, making the precise snow/ground interface harder to locate.
In summary, echogram analysis reveals the landfast sea ice displays consistent results as our previous sea ice studies. However, the echogram evaluation suggests that simply differencing HH and VH peaks or centroids may not be a reliable method for retrieving snow depth over lake ice, and may yield mixed performance over land surfaces (e.g. performing better for Ku-band than at Ka-band).
3.2 Polarimetric snow depth retrievals
Building on the echogram analysis, we evaluate the KuKa-derived snow depth distributions against MagnaProbe data for all surfaces and campaigns (Figs. 10 and 11). To assess the potential for operational retrievals constrained by physical snow limits (i.e., depths <2 m), we restricted the processing window to a 1–4 m range. While this window successfully excludes the deep ice/water interface at Lake Resolute, it does capture the interface for the thinner ice at Malcolm Ramsay Lake. Despite this limitation, we present results for both the polarization-peak (e.g., VH-HH Peak) and polarization-centroid (e.g., VH-HH Centroid) algorithms to illustrate the method's performance under fixed constraints. For the lake ice histograms, we additionally overlay the snow depth distributions retrieved using the alternative interface-detection algorithm.
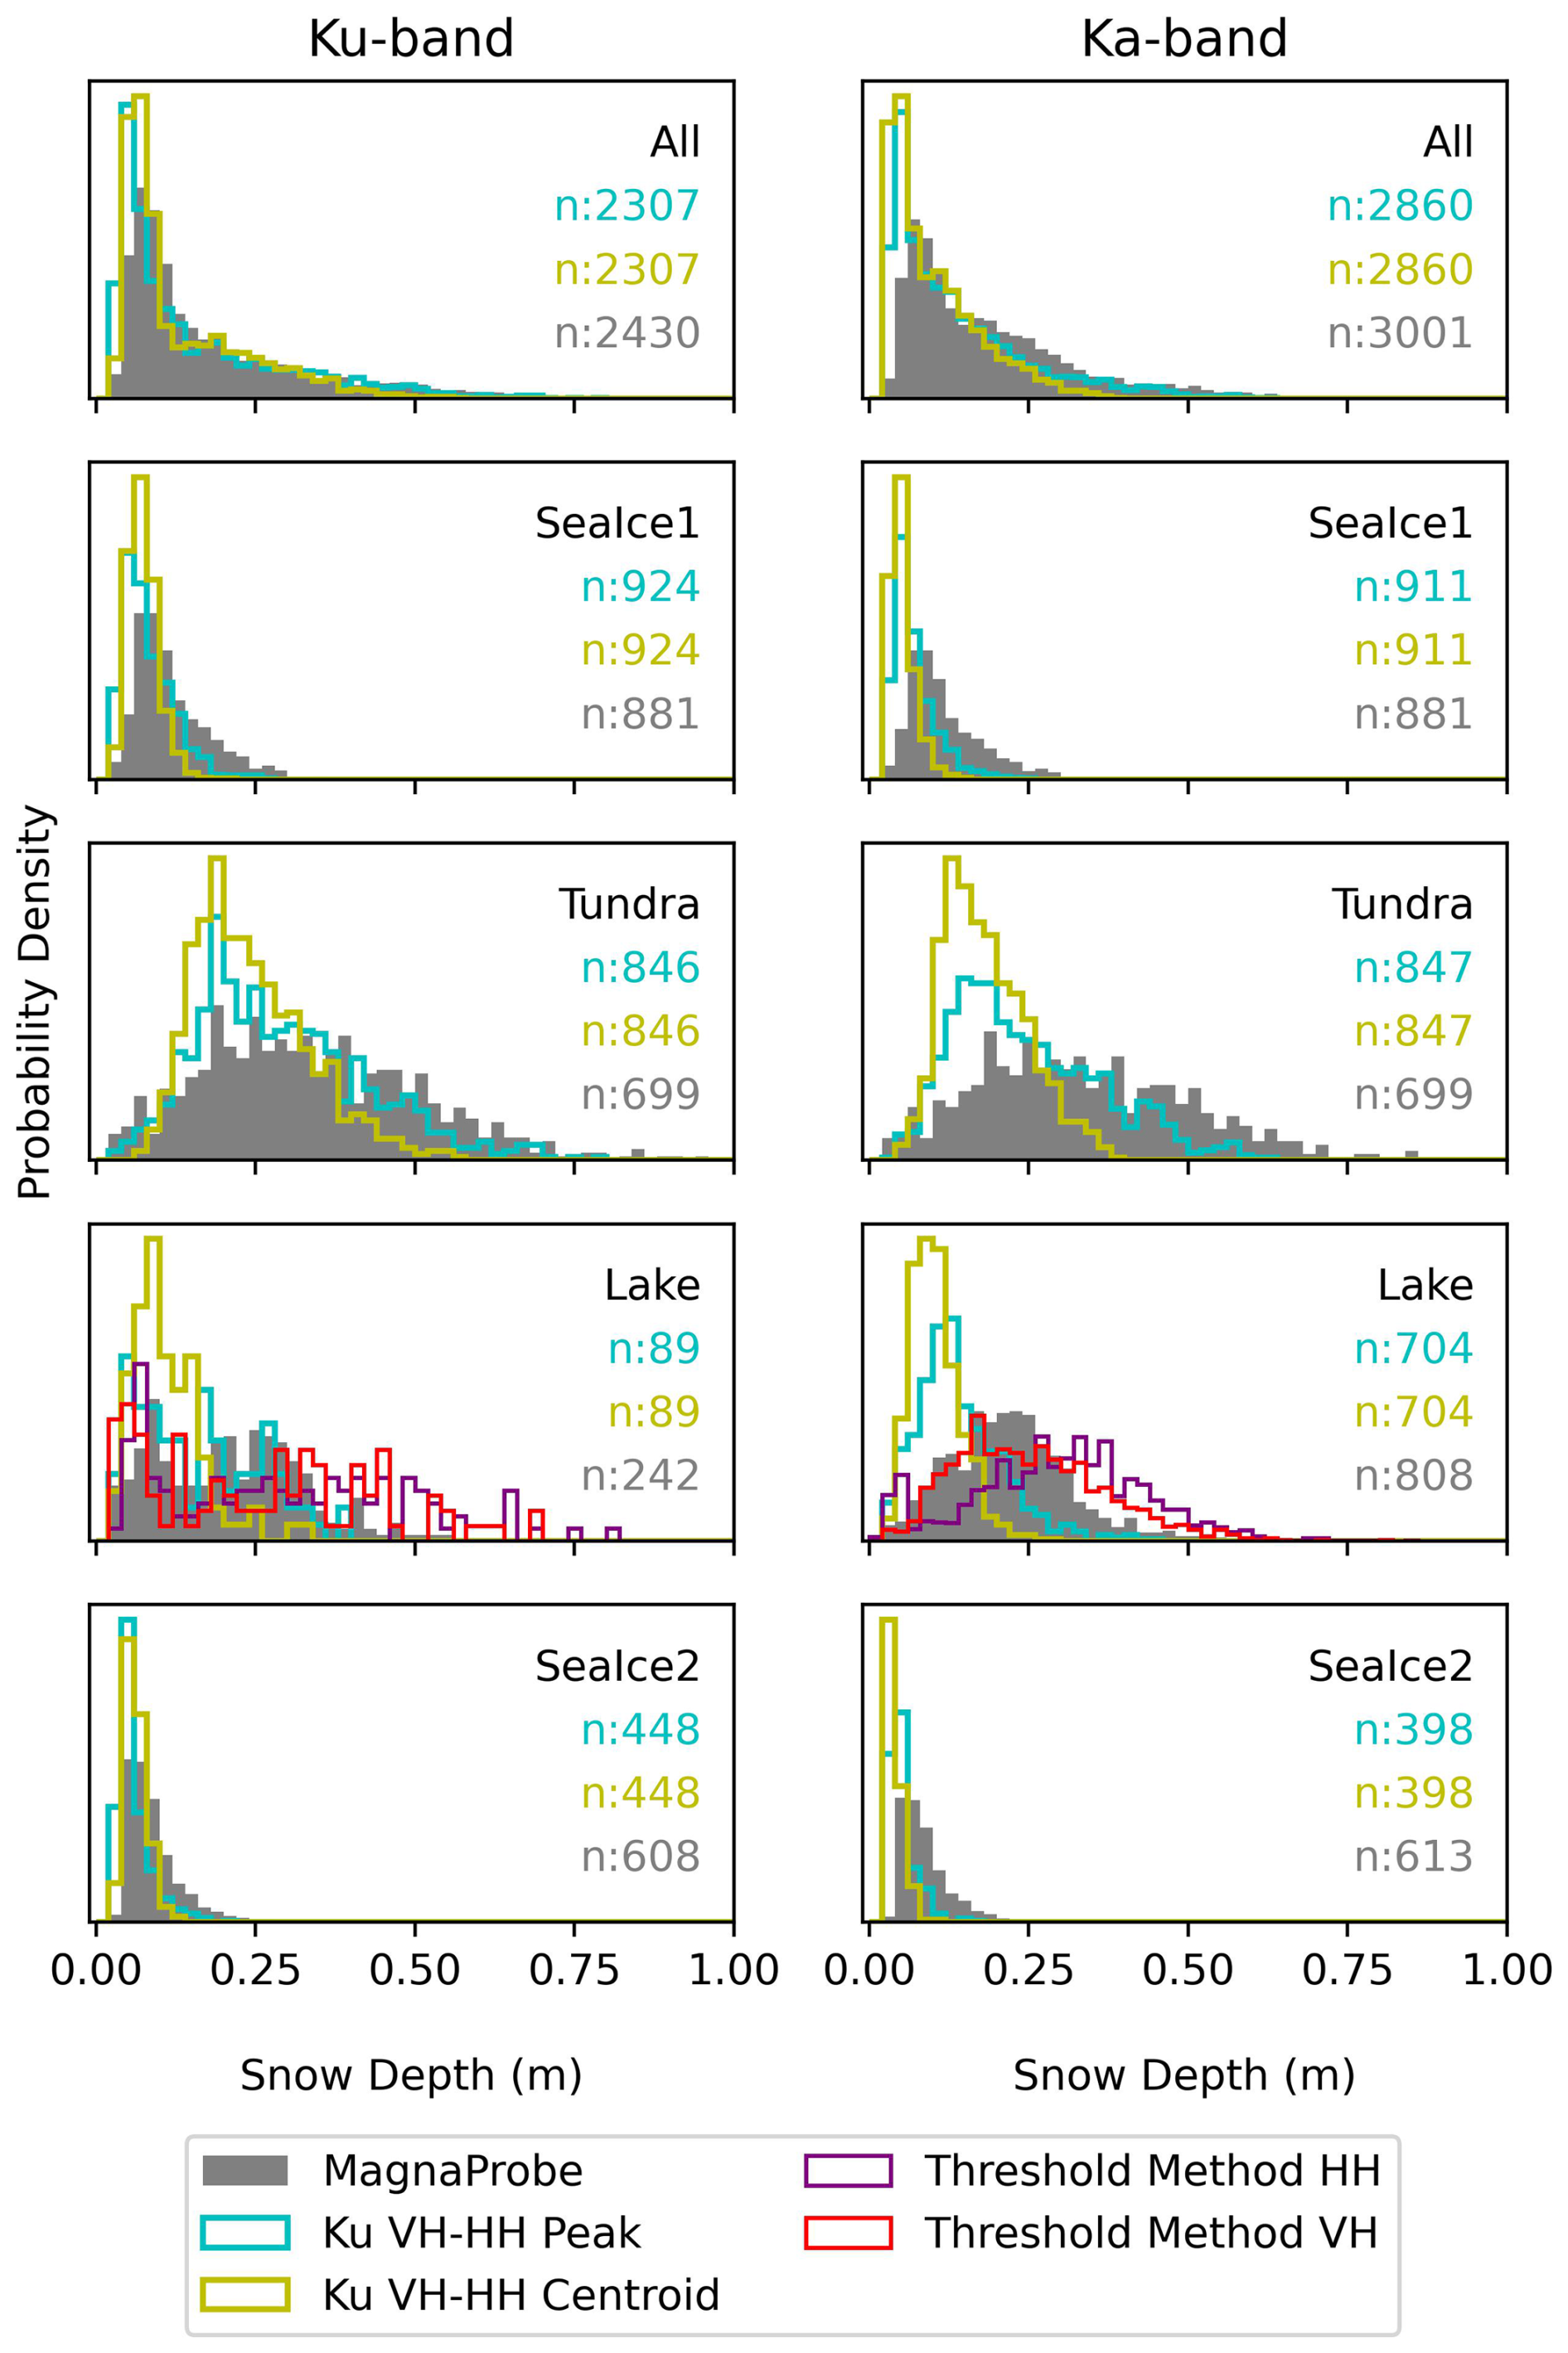
Figure 10Histograms of snow depths from Magnaprobe (gray), peak differences (blue) and centroid method (yellow) for each surface type collected in April 2025 near Resolute Bay. Top panel shows results for all surfaces combined. Note there are slightly different number of data points between Ku- and Ka-band because of data outages and slight differences in the sampling between the frequencies.
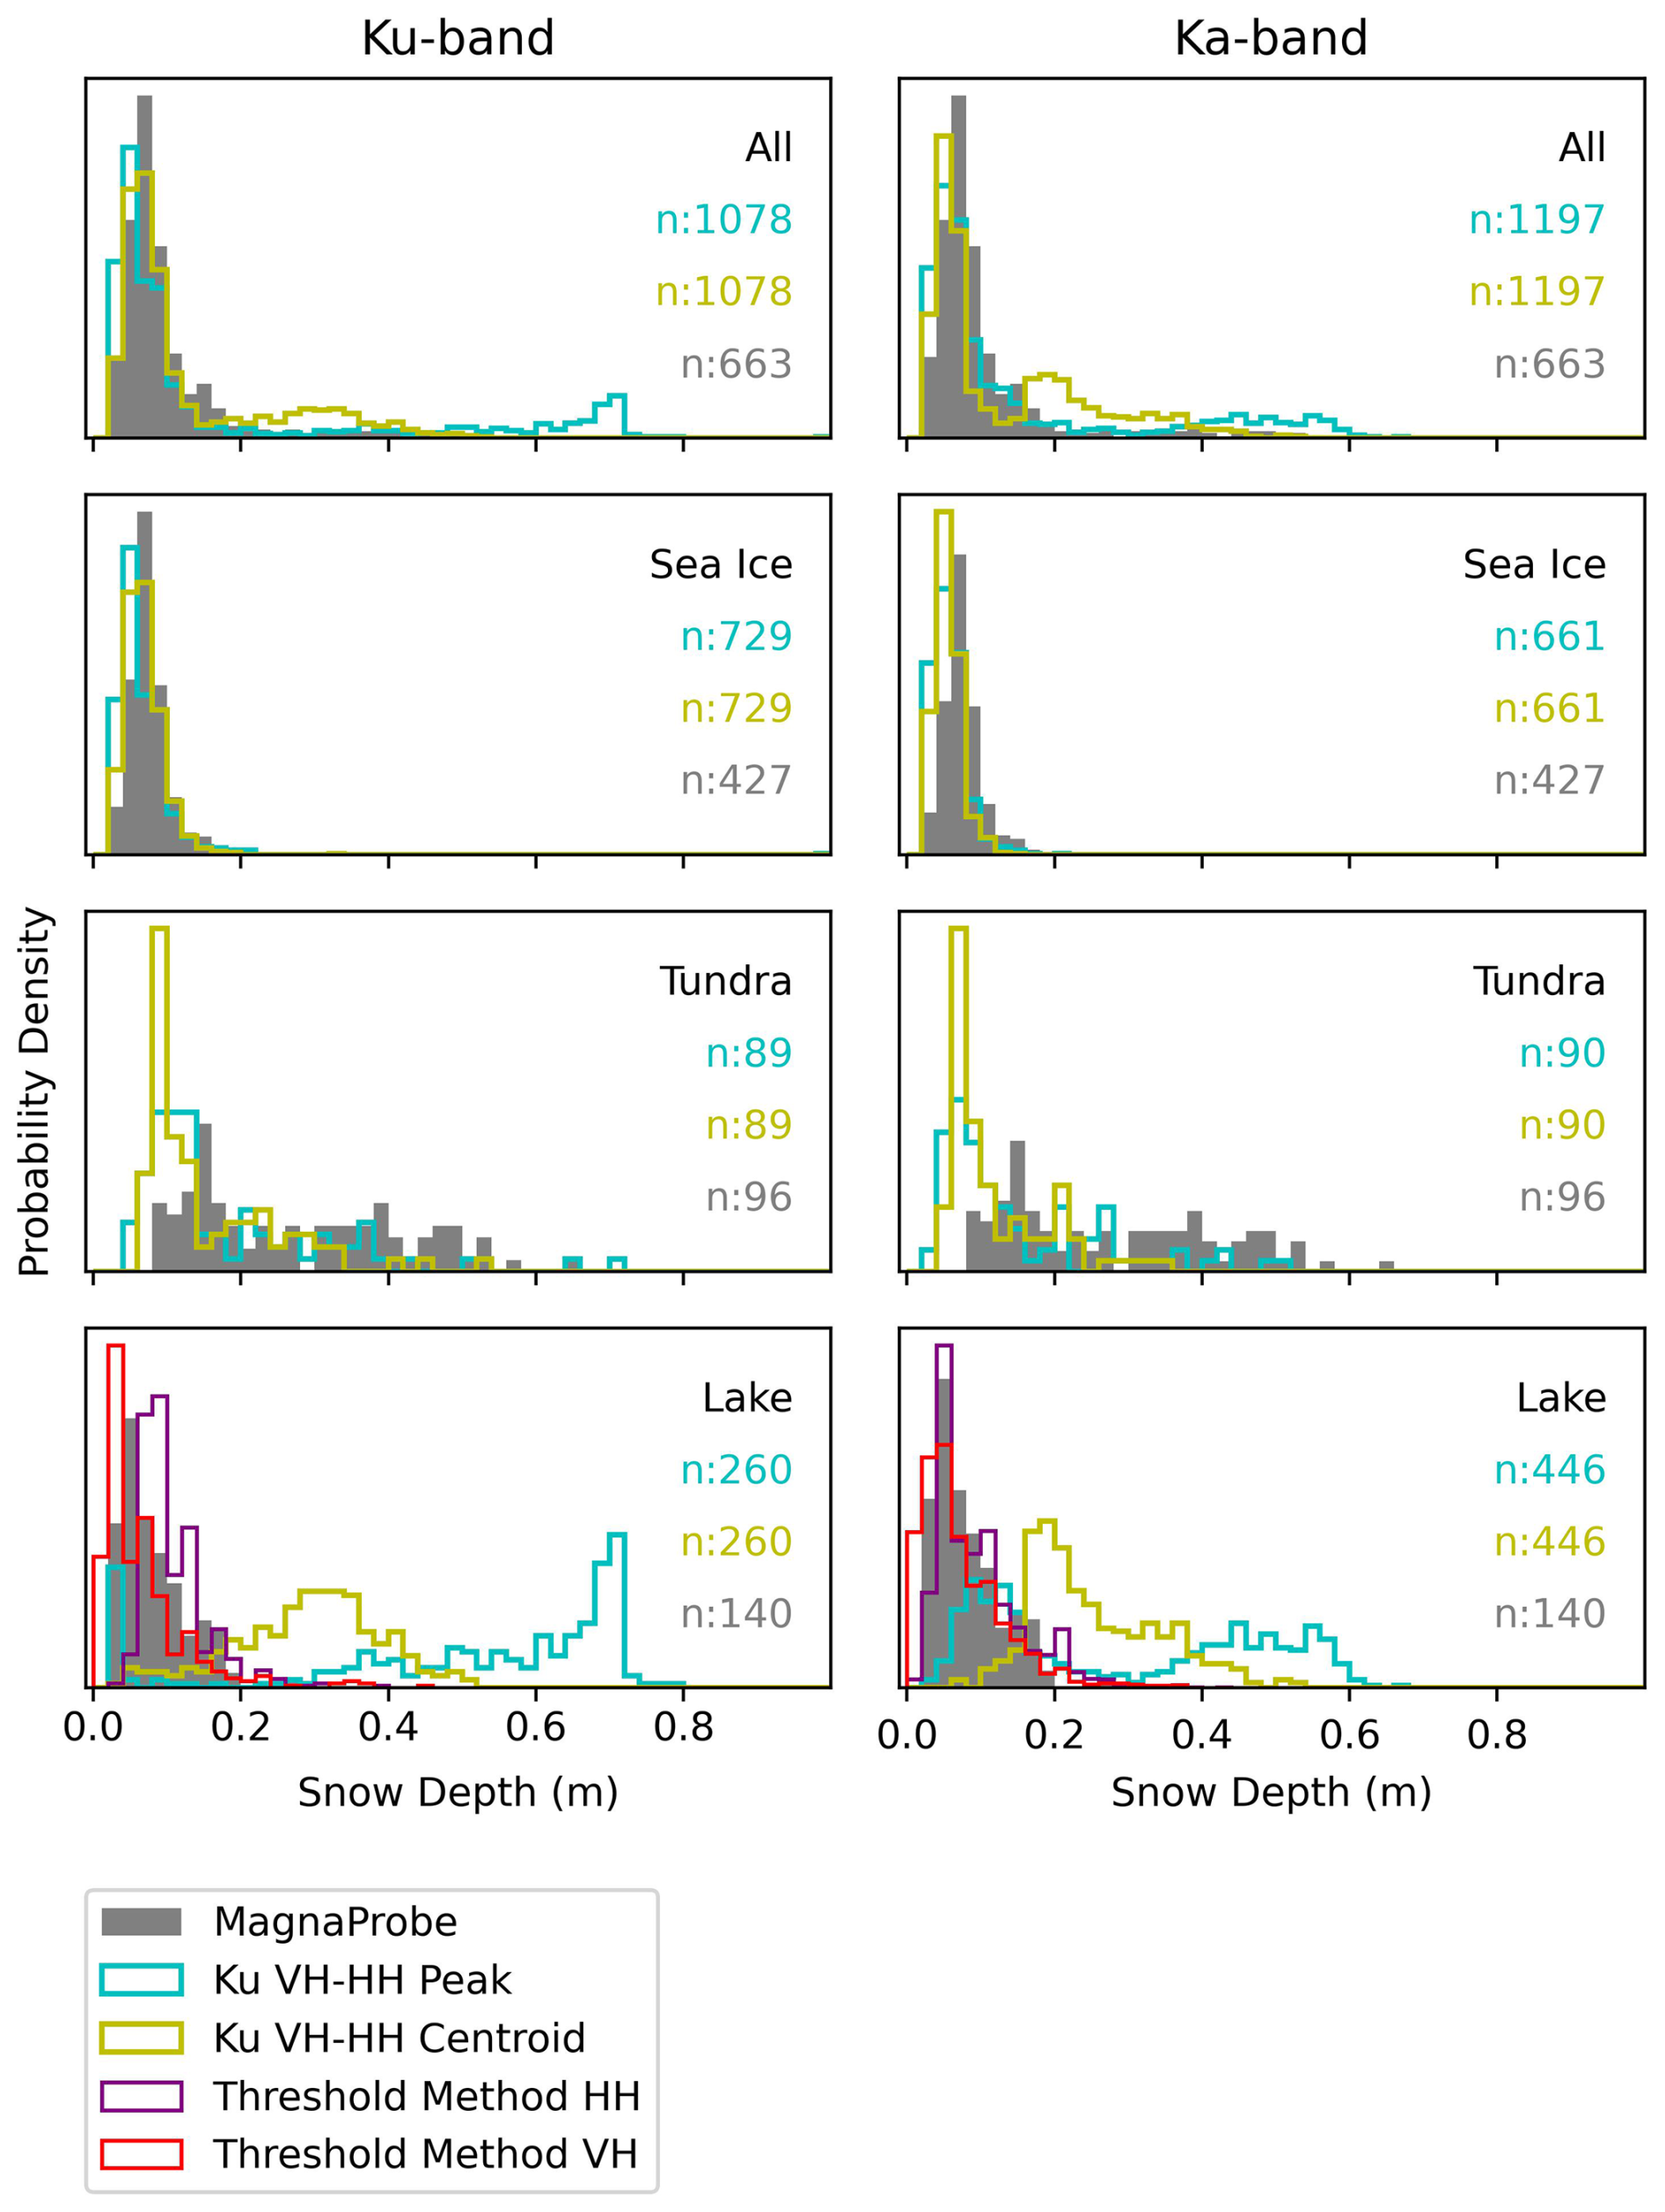
The polarization-based retrievals reproduce the snow depth distributions well, with the notable exception of lake ice, a discrepancy expected due to the presence of a competing third scattering surface. On landfast sea ice, agreement is generally stronger at Ku-band; Ka-band retrievals tend to underestimate depth, shifting the distribution toward shallower values. Over the Resolute tundra, the peak-differencing methods best align with the observed snow depth distribution, and the agreement is better at Ku-band than at Ka-band. Agreement is less robust for the Churchill tundra transects, with similar performance between the peak or centroid methods. However, the limited sample size from the Churchill tundra dataset precludes firm conclusions for that specific site.
The performance of the polarization technique degrades significantly over lake ice, particularly at Malcolm Ramsay Lake. This limitation stems from two factors identified in the echogram analysis: first, the dominant HH scattering surface at both Ku- and Ka-bands rarely aligns with the snow–air interface; and second, the 1–4 m processing window captures the strong returns from the ice–water interface due to the thinner ice cover. Conversely, retrievals are improved at Lake Resolute, where the ice–water interface is effectively removed from the processing range. As a result, application of the alternative peak-picking method (shown in purple and red) significantly improves correspondence with Magnaprobe measurements over Malcolm Ramsay Lake, while improvement over Lake Resolute is mixed.
While visual inspection of the histograms suggests a general agreement for the landfast ice and tundra surfaces, quantitative distribution metrics reveal some key differences. This fit was assessed by computing the overlap coefficient (Inman and Bradley, 1989) and the non-parametric Kolmogorov-Smirnov test (Massey, 1951). Specifically, overlap coefficient values between 0.80 and 0.85 are seen in most Ku-band sites except for the lake ice, along with low KS values, indicating that the Ku-band retrieved snow depths well match the MagnaProbe distribution. Lower overlap values at Ka-band Centroid, and lake sites signify mismatches, while high KS statistics for Ka-band also reveal that there is a shift in the distribution towards the left.
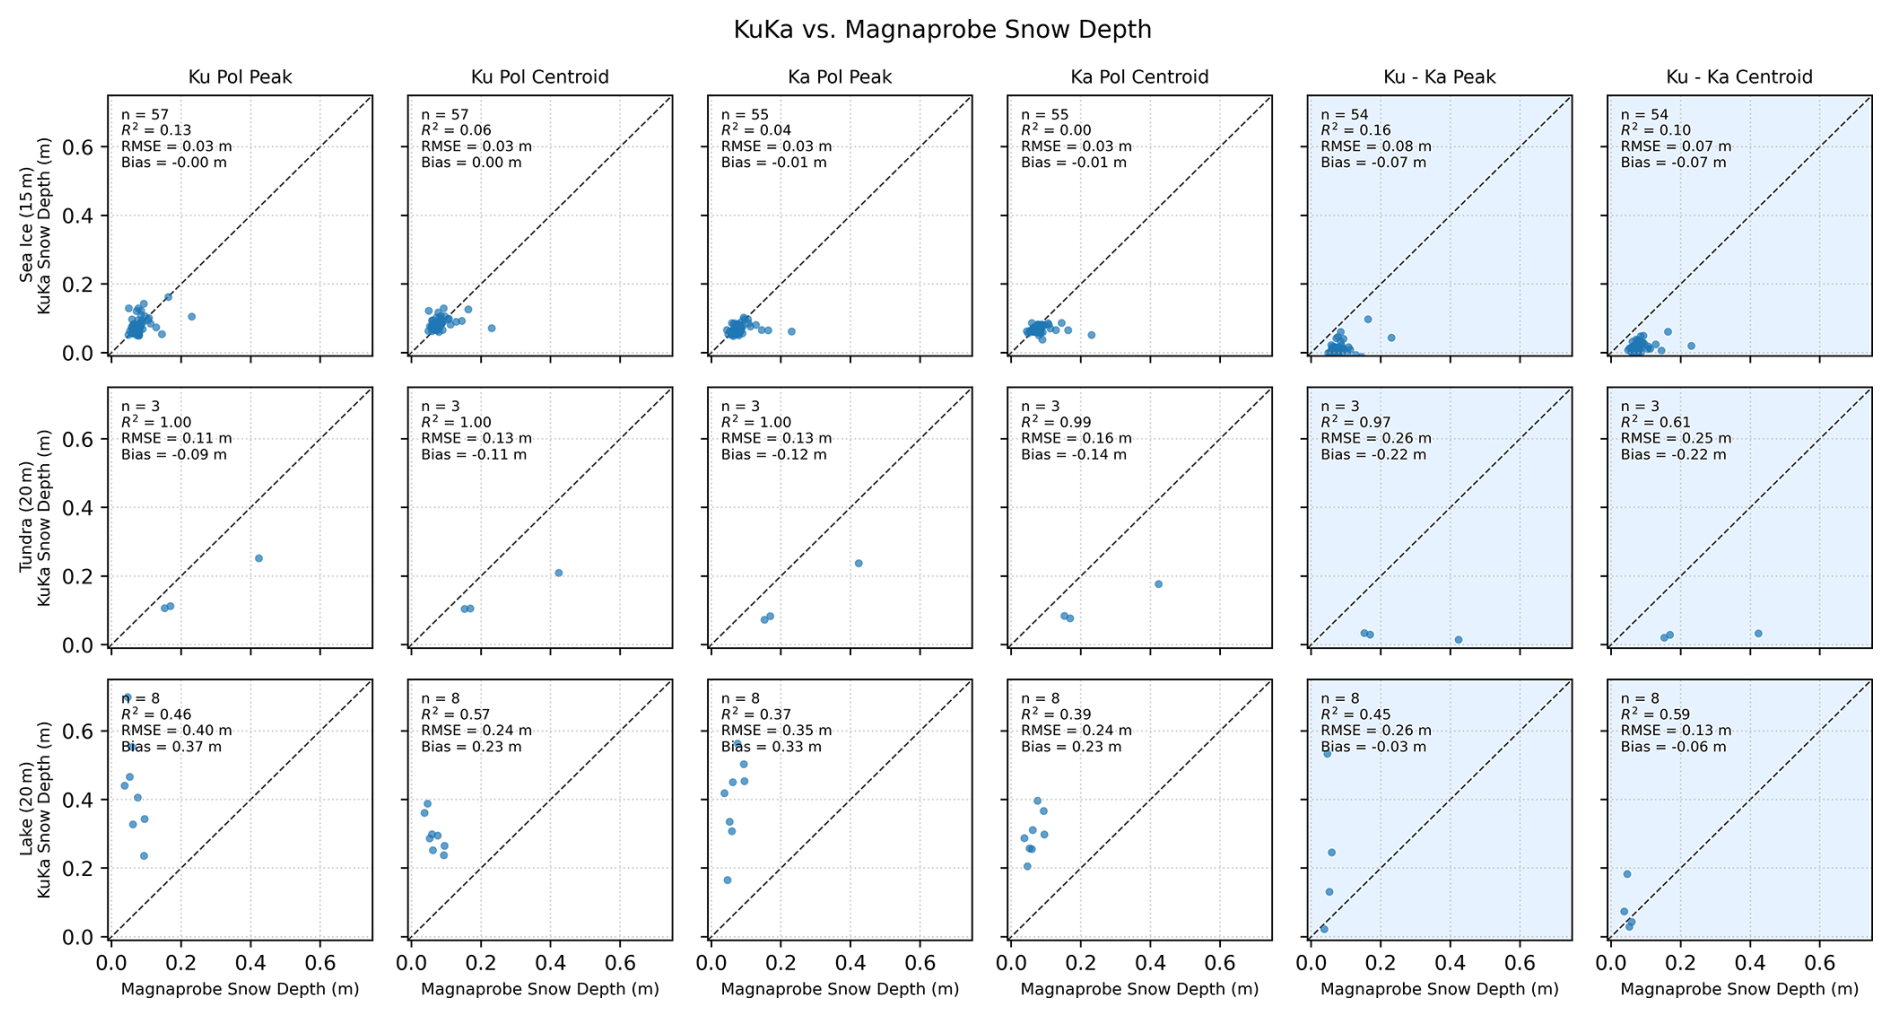
Given that the semi-variograms from the MagnaProbe observations provide quantitative estimates of the spatial scales over which snow depths are correlated on different surface types, we applied the 95 % sill lags as an indication of effective range and compared the KuKa-derived and Magnaprobe snow depths across these spatial scales, with results for Resolute Bay found in Fig. 12 and those for Churchill found in Fig. 13. In this analysis we additionally include snow depths that would be retrieved using a frequency approach (i.e. by differencing Ku- and Ka-band peak amplitudes or their centroids, shaded in blue).
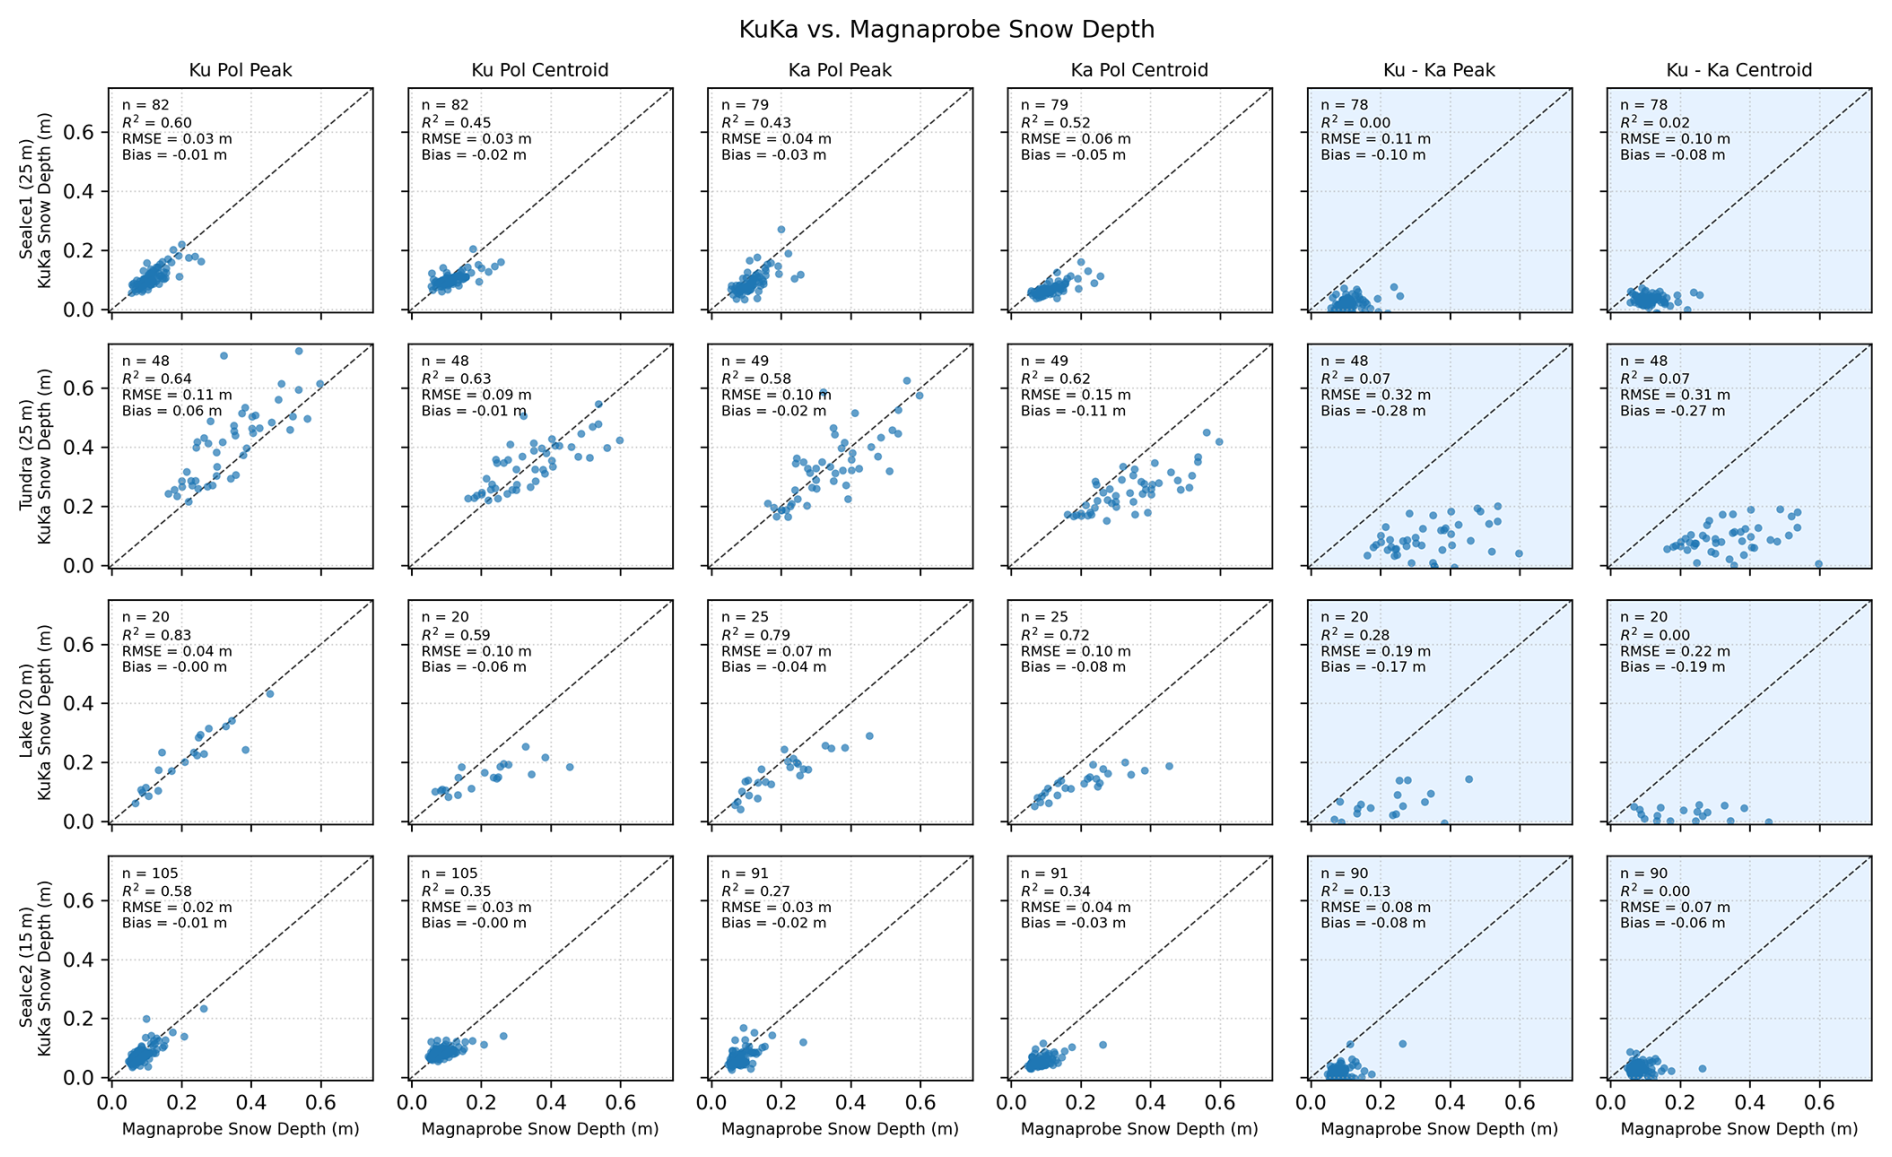
Figure 12Scatter plots of KuKa-derived and MagnaProbe measured snow depths for each surface type during April 2025 near Resolute Bay. Variable binning is used in making the scatter plots based on the variogram analysis for each surface type, leading to a different number of data included in each scatterplot. Results are shown for polarization and frequency (shaded in blue) methods using peak differences or centroids for deriving the snow depths. Note the frequency method can result in negative snow depth values, but only values above 0 are shown.
We find that the correlation coefficients over the landfast ice surfaces were lower than those reported by Willatt et al. (2023). This difference is likely attributable to our smaller sample size and the reduced range of snow depths encountered during our campaign compared to the extensive winter data collected during the MOSAiC expedition (more than 7000 observations). Specifically, the second landfast sea ice site in Resolute Bay exhibits the poorest correlation, which is associated with the smallest range of measured snow depths. Despite the lower correlation coefficients, the overall accuracy remains high: the Root Mean Square Error (RMSE) and mean bias for the polarization-based methods are within 3 cm for all landfast ice areas. Importantly, the Ku-band polarization peak method (Ku pol-peak) outperforms all other techniques for the landfast ice sampled and significantly outperforms differencing either the Ku-/Ka-band peaks and differencing their centroids (i.e. the frequency method).
Over the Resolute Bay tundra site the correlation coefficients range from R2 values of 0.58 to 0.64, but the mean bias and RMSE are larger (bias ranges from 0.01 to 0.11 m; RMSE ranges from 9 to 15 cm), with the largest negative bias (−0.11 m) observed using the Ka-band centroid. Degrading performance using the centroid is not surprising given the fact that the peak amplitude identifies the dominant scattering interface (i.e., the air/snow boundary), while the centroid represents the center of gravity of the entire received echo. Consequently, the centroid can be sensitive to pulse broadening caused by volume scattering from the coarse-grained snow encountered. As snow depth increases, delayed returns from within the snowpack elongate the waveform's trailing edge, pulling the centroid deeper relative to the surface peak and thus shifting the effective scattering center. As a result, the centroid method reduces the retrieved snow depth, especially for deeper snowpacks. While we see that to be true for all surfaces, this results in the largest biases at Ka-band because its shorter wavelength is more efficiently scattered by depth hoar snow grains.
Over Lake Resolute, we find overall good agreement with MagnaProbe snow depths (best for Ku-band pol-peak; bias of 0 cm and RMSE of 4 cm), which reflects the exclusion of the ice/water interface in the processed range. On the other hand, for Malcolm Ramsay Lake where the ice/water face is included, we find the pol-peak and centroid approaches completely break down, with biases ranging from 21 to 33 cm. Using the alternative peak picking algorithm significantly improves the agreement, reducing both the biases and RMSE over both lakes (Fig. 14).
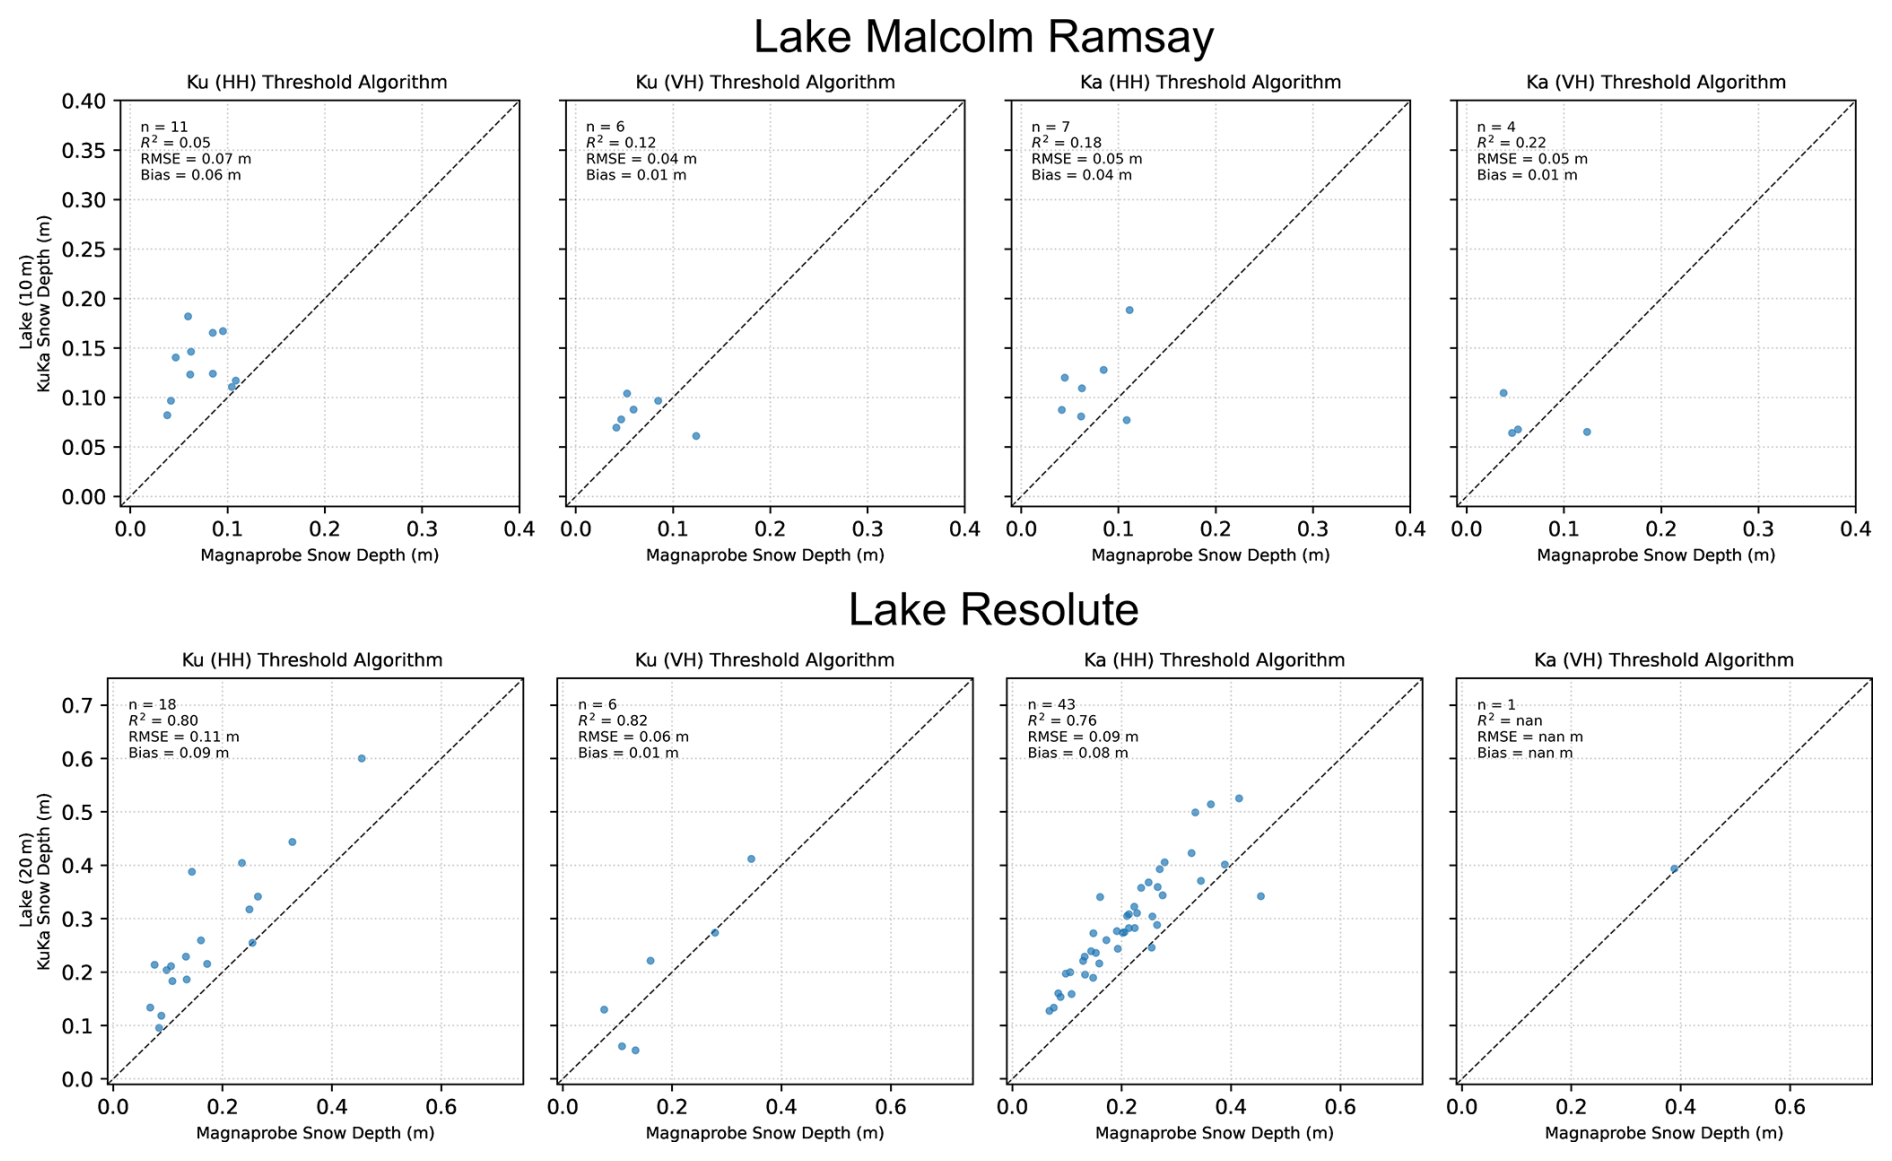
Figure 14Intercomparison of MagnaProbe and KuKa-derived snow depths over lake ice using the alternative interface detection algorithm. Results are shown for both Ku- and Ka-band frequencies and using either the co-pol (HH) or cross-pol (VH) returns. Because the algorithm did not always detect the two surfaces (e.g. air/snow and ice/snow), the number of data points differs between the co-pol and cross-pol results.
The frequency differencing approach consistently underestimates the observed snow depths. This highlights that the core assumptions of dual-frequency snow depth retrieval often fail, i.e. that Ka-band reflects off the snow surface while Ku-band reflects off the ice/land interface. In reality, the echograms reveal that the air/snow interface is the predominant scattering surface at both frequencies, and when it is not, both frequencies often penetrate to similar depths in dry snow, or both get scattered by the same internal layers (like wind crusts or depth hoar). If the “difference” between where they reflect is near zero, the retrieved snow depth will be near zero or purely noise.
4.1 Air/snow interface and peak amplitude
The interaction of radar waves with snow and ice is governed by the material's complex dielectric permittivity which influences signal penetration, attenuation, and backscatter. In satellite radar altimetry, waveform retrackers are employed to identify a specific point on the return echo, such as the leading-edge midpoint or the peak, to define the effective scattering surface. However, the range to this retracked point is a complex function of snow density, microstructure, and frequency-dependent penetration. Consequently, the vertical migration of this effective scattering center within the snowpack, driven by changing snow properties, challenges the fundamental assumptions of altimetric retrievals and complicates the accurate estimation of both snow depth and sea ice freeboard. In dual-frequency altimetry, the Ka-band signal is generally expected to scatter predominantly from the air/snow interface due to its shorter wavelength and the permittivity contrast (ϵair≈1 vs. ), while Ku-band is often assumed to penetrate deeper toward the snow/ice or snow/land interface. The analysis of our co-polarized Ku- and Ka-band returns over the landfast ice reaffirms that the air/snow interface is usually the dominant scattering surface, a key result also in Willatt et al. (2023, 2025). However, we also observe instances when the co-polarized peak amplitude shifts below the air/snow interface. This aligns with Willatt et al. (2010), who found that morphological features, such as depth hoar or brine-wetted snow alter scattering depth, and often prevented the snow/ice interface from acting as the dominant scattering surface at Ku-band.
For first-year sea ice, the basal snow at the snow–ice interface is often saline because of brine wicking from the underlying ice, and this brine-rich layer can cause strong attenuation of radar waves; laboratory experiments have demonstrated that higher ice salinity is correlated with higher basal snow salinity (Huang et al., 2025). To further evaluate the electromagnetic drivers of observed shifts in scattering surfaces over landfast ice, we first computed the brine volume fraction () using the snow salinity (S), temperature (T) and density (ρ) profiles and based on the non-linear phase equilibrium equations of Frankenstein and Garner (1967). The complex effective relative permittivity () of the snowpack layers was then calculated using the Complex Refractive Index Model (CRIM), a well-established volume fraction mixing formula (e.g., Tiuri et al., 1984; Mätzler, 1996). The effective permittivity is the weighted sum of the permittivity of its three constituents: ice, air, and liquid brine. The complex permittivity of the liquid brine phase () is dependent on temperature and frequency, and was computed using the Debye relaxation equation, incorporating the pure water parameters of Klein and Swift (1977) and the ionic conductivity component following Stogryn and Desargant (1985).
Table 3 summarizes the dielectrics properties for the Resolute landfast ice snow pits using the mixture models described in Geldsetzer et al. (2009). Overall, because temperatures were quite cold, the brine volume content remained small. The largest brine volume was found in the snow layer above the ice surface in pit 6, with a brine volume fraction reaching 2.02 %. While this is a small fraction, brine is highly conductive and its presence leads to an increase in the absorption characteristics of the snow (e.g. Ku-band ) and hence reduces penetration to the snow/ice interface. Calculated penetration depths (e.g. the depth at which the power of the radar signal has been attenuated to (about 37 %) of its original value at the surface) for this brine layer are significantly restricted, reaching ∼1.5 at Ku-band and ∼1.0 cm at Ka-band, effectively masking the underlying surface. Overall for Pit 6, the radar signal reaches the critical loss threshold within the first 3.5 cm. Evaluation of the waveforms shows a dominant peak at both Ku- and Ka-band HH waveforms at the air/snow interface, and a weaker secondary peak just above the ice surface at Ku-band that appears to align with the high salinity layer (Fig. 15). Analysis of snow pit 4 reveals a distinct layer of elevated brine volume (1.53 %) between 2 and 5 cm above the ice surface. This increase in brine volume drove a simultaneous increase in the complex permittivity, raising the real part (ϵ′) from 1.62 to 1.99, enhancing refractive contrast, while the imaginary part (ϵ′′) jumped from 0.09 to 0.25, creating a highly lossy barrier with a penetration depth of only 2.0 cm at Ku-band. Plotting the corresponding waveforms, we find a downward shift of the Ku-band co-polarized peak aligning with the top of this saline layer (Fig. 16). At Ka-band, the dominant scattering surface remains the air/snow interface, but a second peak is also observed within this layer. Finally, the VH returns at Ka-band suggests a slight upward shift away from the snow/ice interface in Pit 4. At the Ka-band wavelength (λ≈8.6 mm), the combination of large basal ice grains and brine-wetted inclusions (r≈13 mm) results in a transition toward the Mie scattering regime. In this regime, the scattering cross-section increases significantly as the scatterer size becomes comparable to the wavelength, and the scattering phase function becomes more complex than the Rayleigh approximation. While depolarization is inherent to volume scattering in dry snow, the high dielectric contrast and elevated loss factor () in the saline basal layer of Pit 4 enhance the probability of multiple scattering events. This leads to depolarization over a shorter travel distance (i.e. higher volumetric depolarization), which, combined with increased signal absorption, shifts the effective VH scattering center upwards from the physical snow/ice interface. This may also explain the shift in VH waveforms away from the snow/ice interface in snow pit 6.
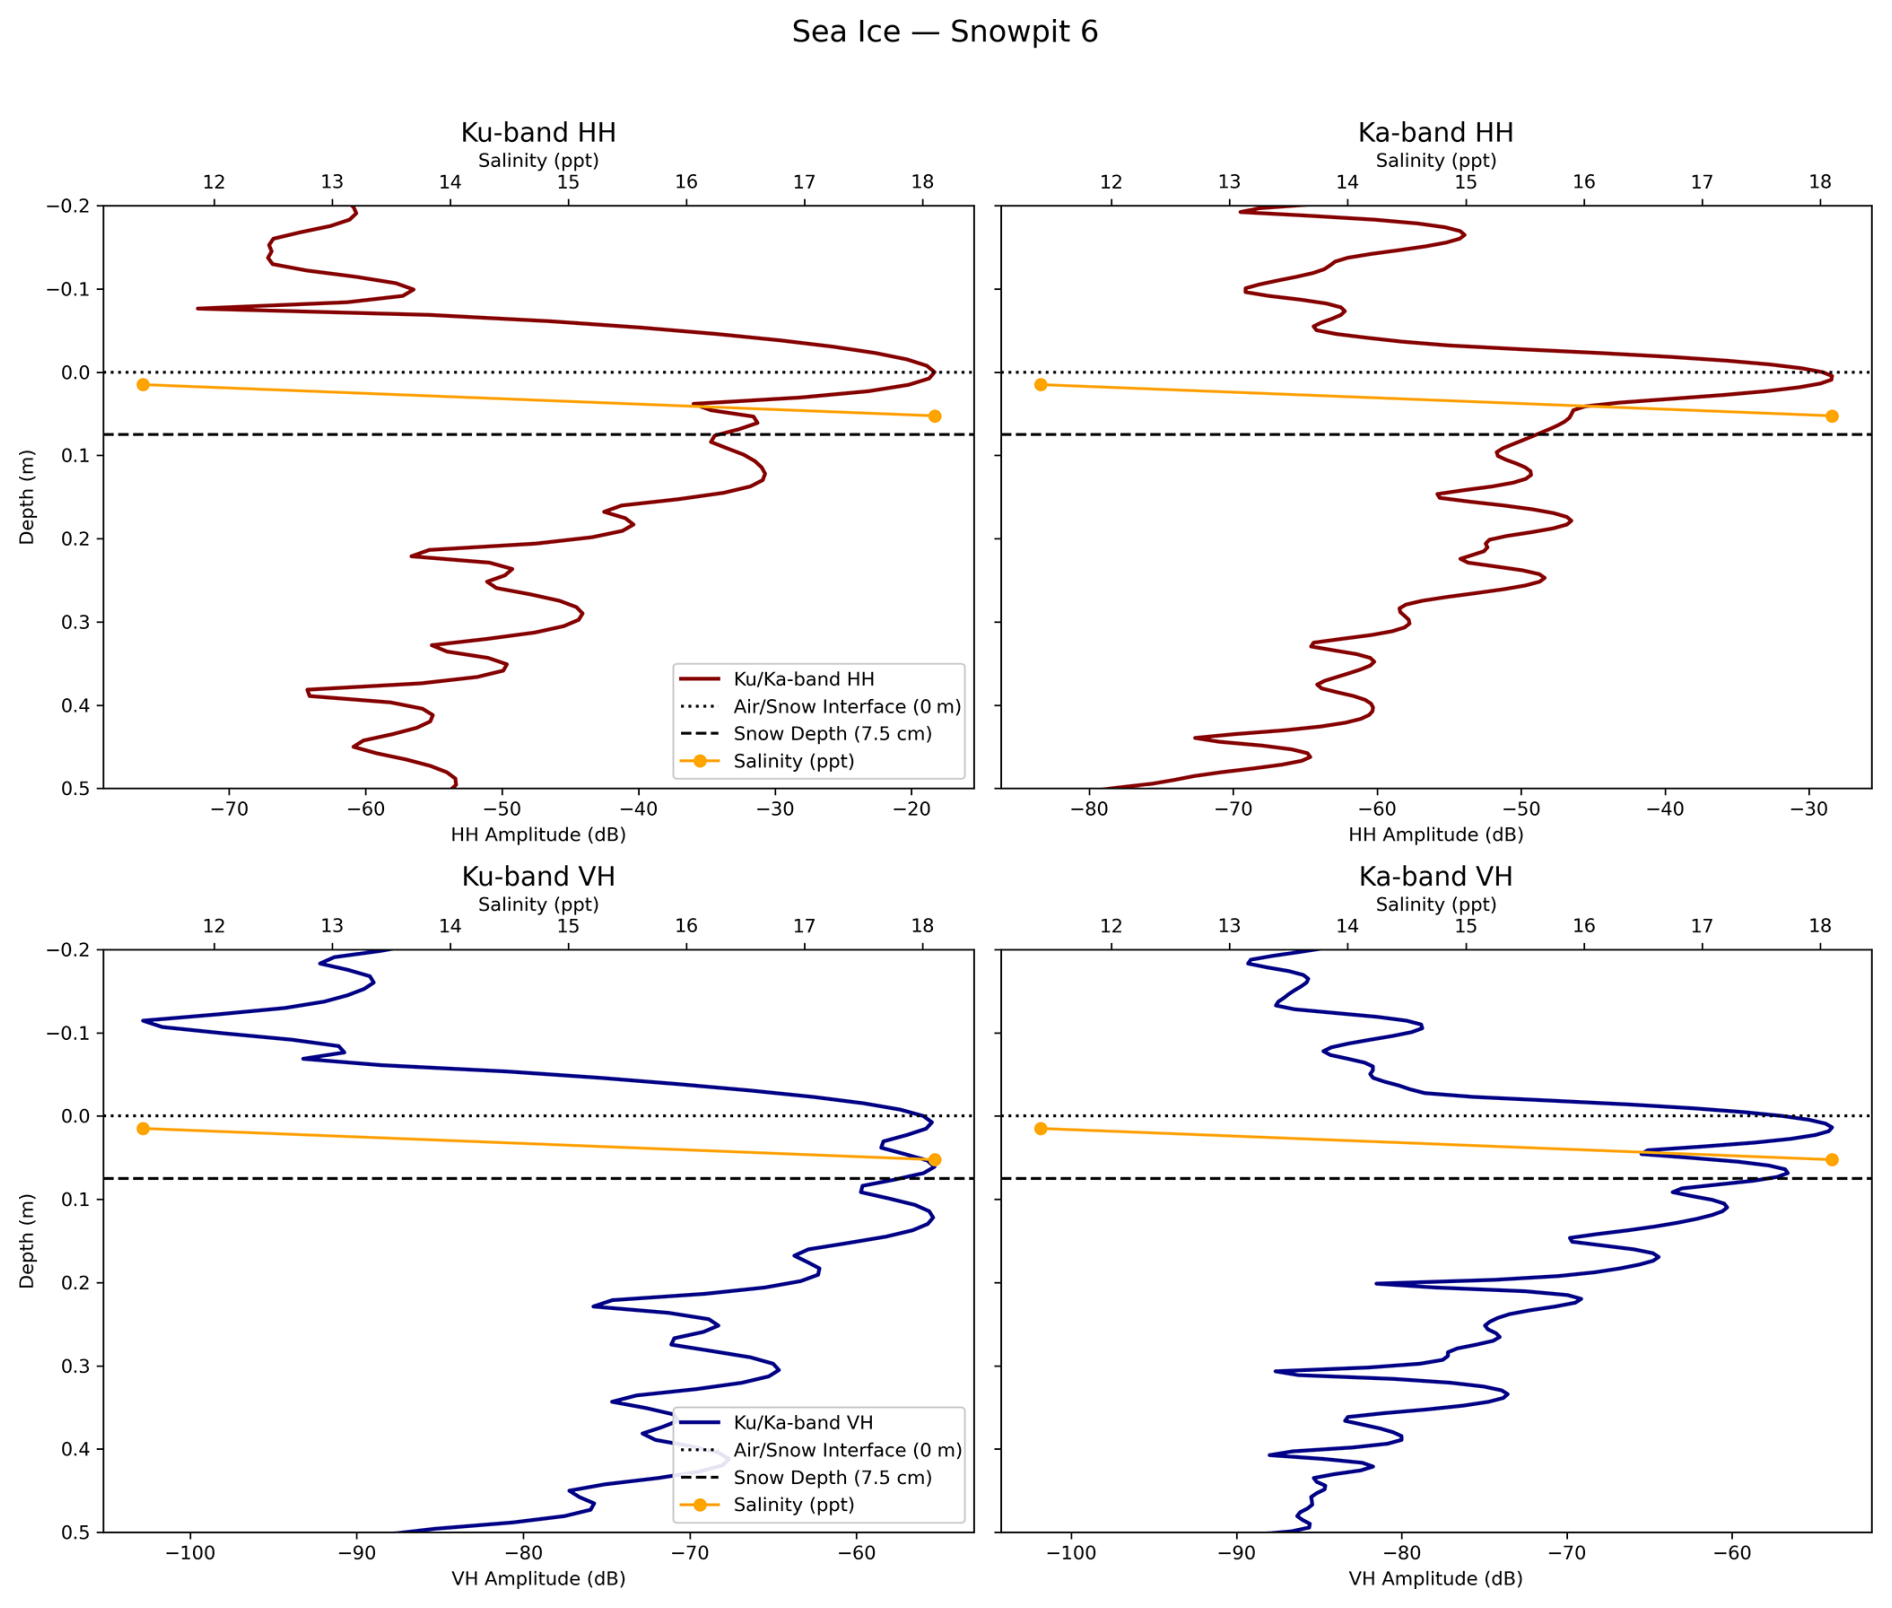
Figure 15Waveforms from the 6th snow pit collected on 2 April 2025 where a higher salinity layer is observed just above the ice surface. Plotted with the Ku-band (red) and Ka-band (blue) HH and VH waveforms in dB is the salinity profile measured at 3 cm intervals. Results are shown as the average for the 5 closest waveforms to the snow pit location.
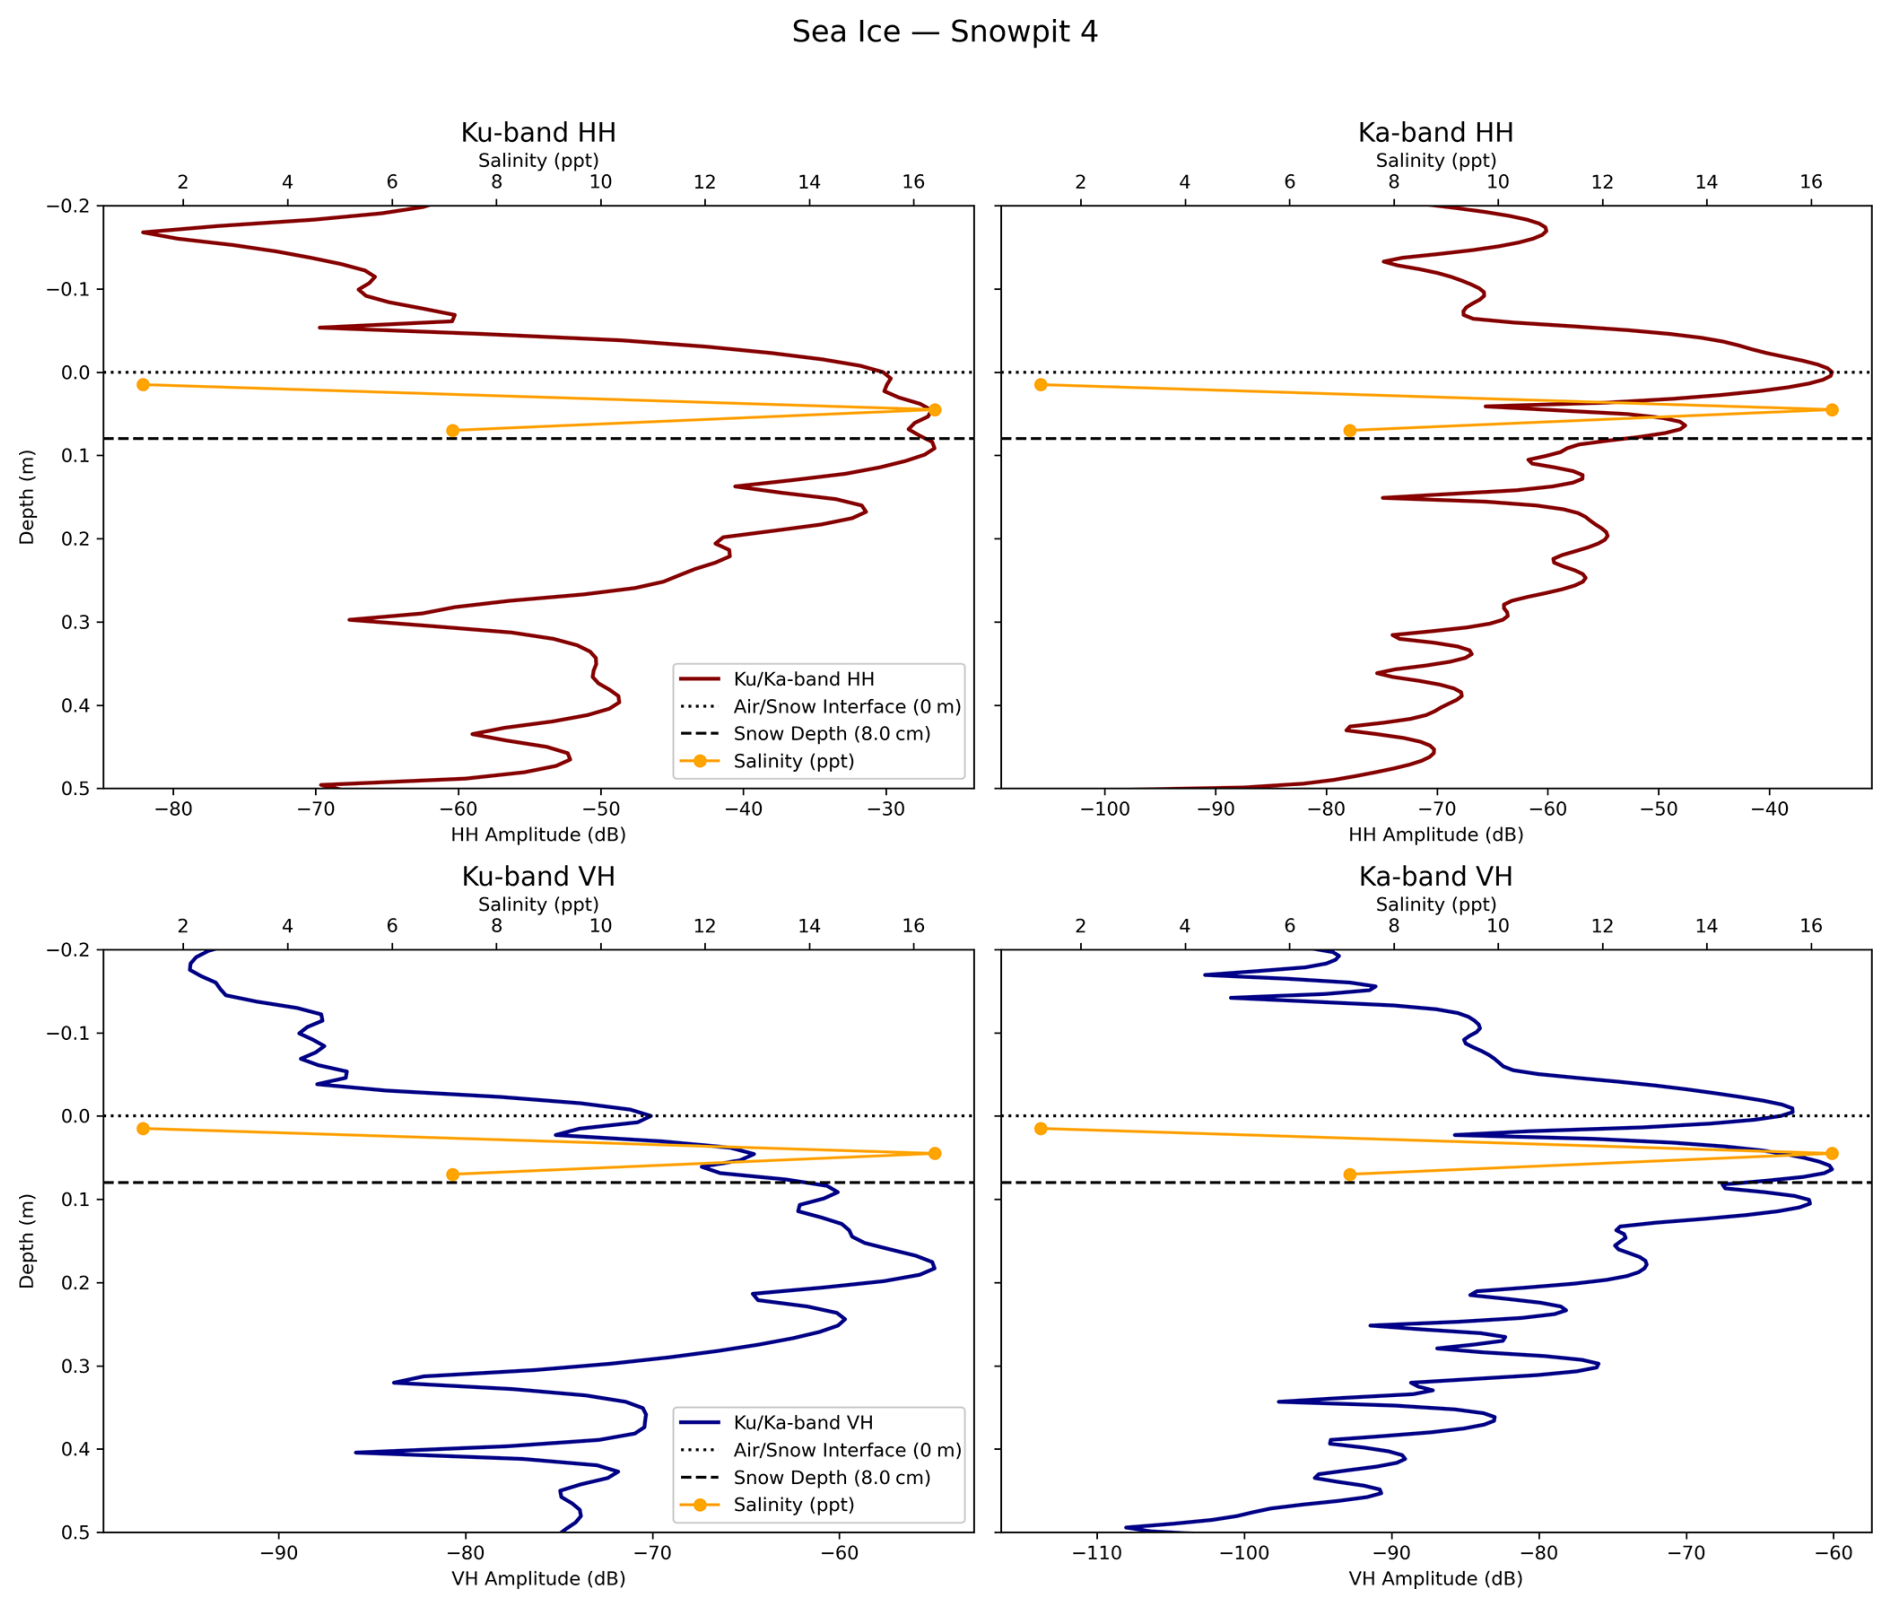
Figure 16Same is in Fig. 15 but from the 4th snow pit collected on 2 April 2025 where a higher salinity layer is observed at intermediate depth in the snowpack.
Table 3Snow Pit Measurements and Effective Permittivity. First layer represents the top of the snowpack. Brine Volume fraction values obtained using Drinkwater and Crocker (1988), permittivity values obtained using Geldsetzer et al. (2009).
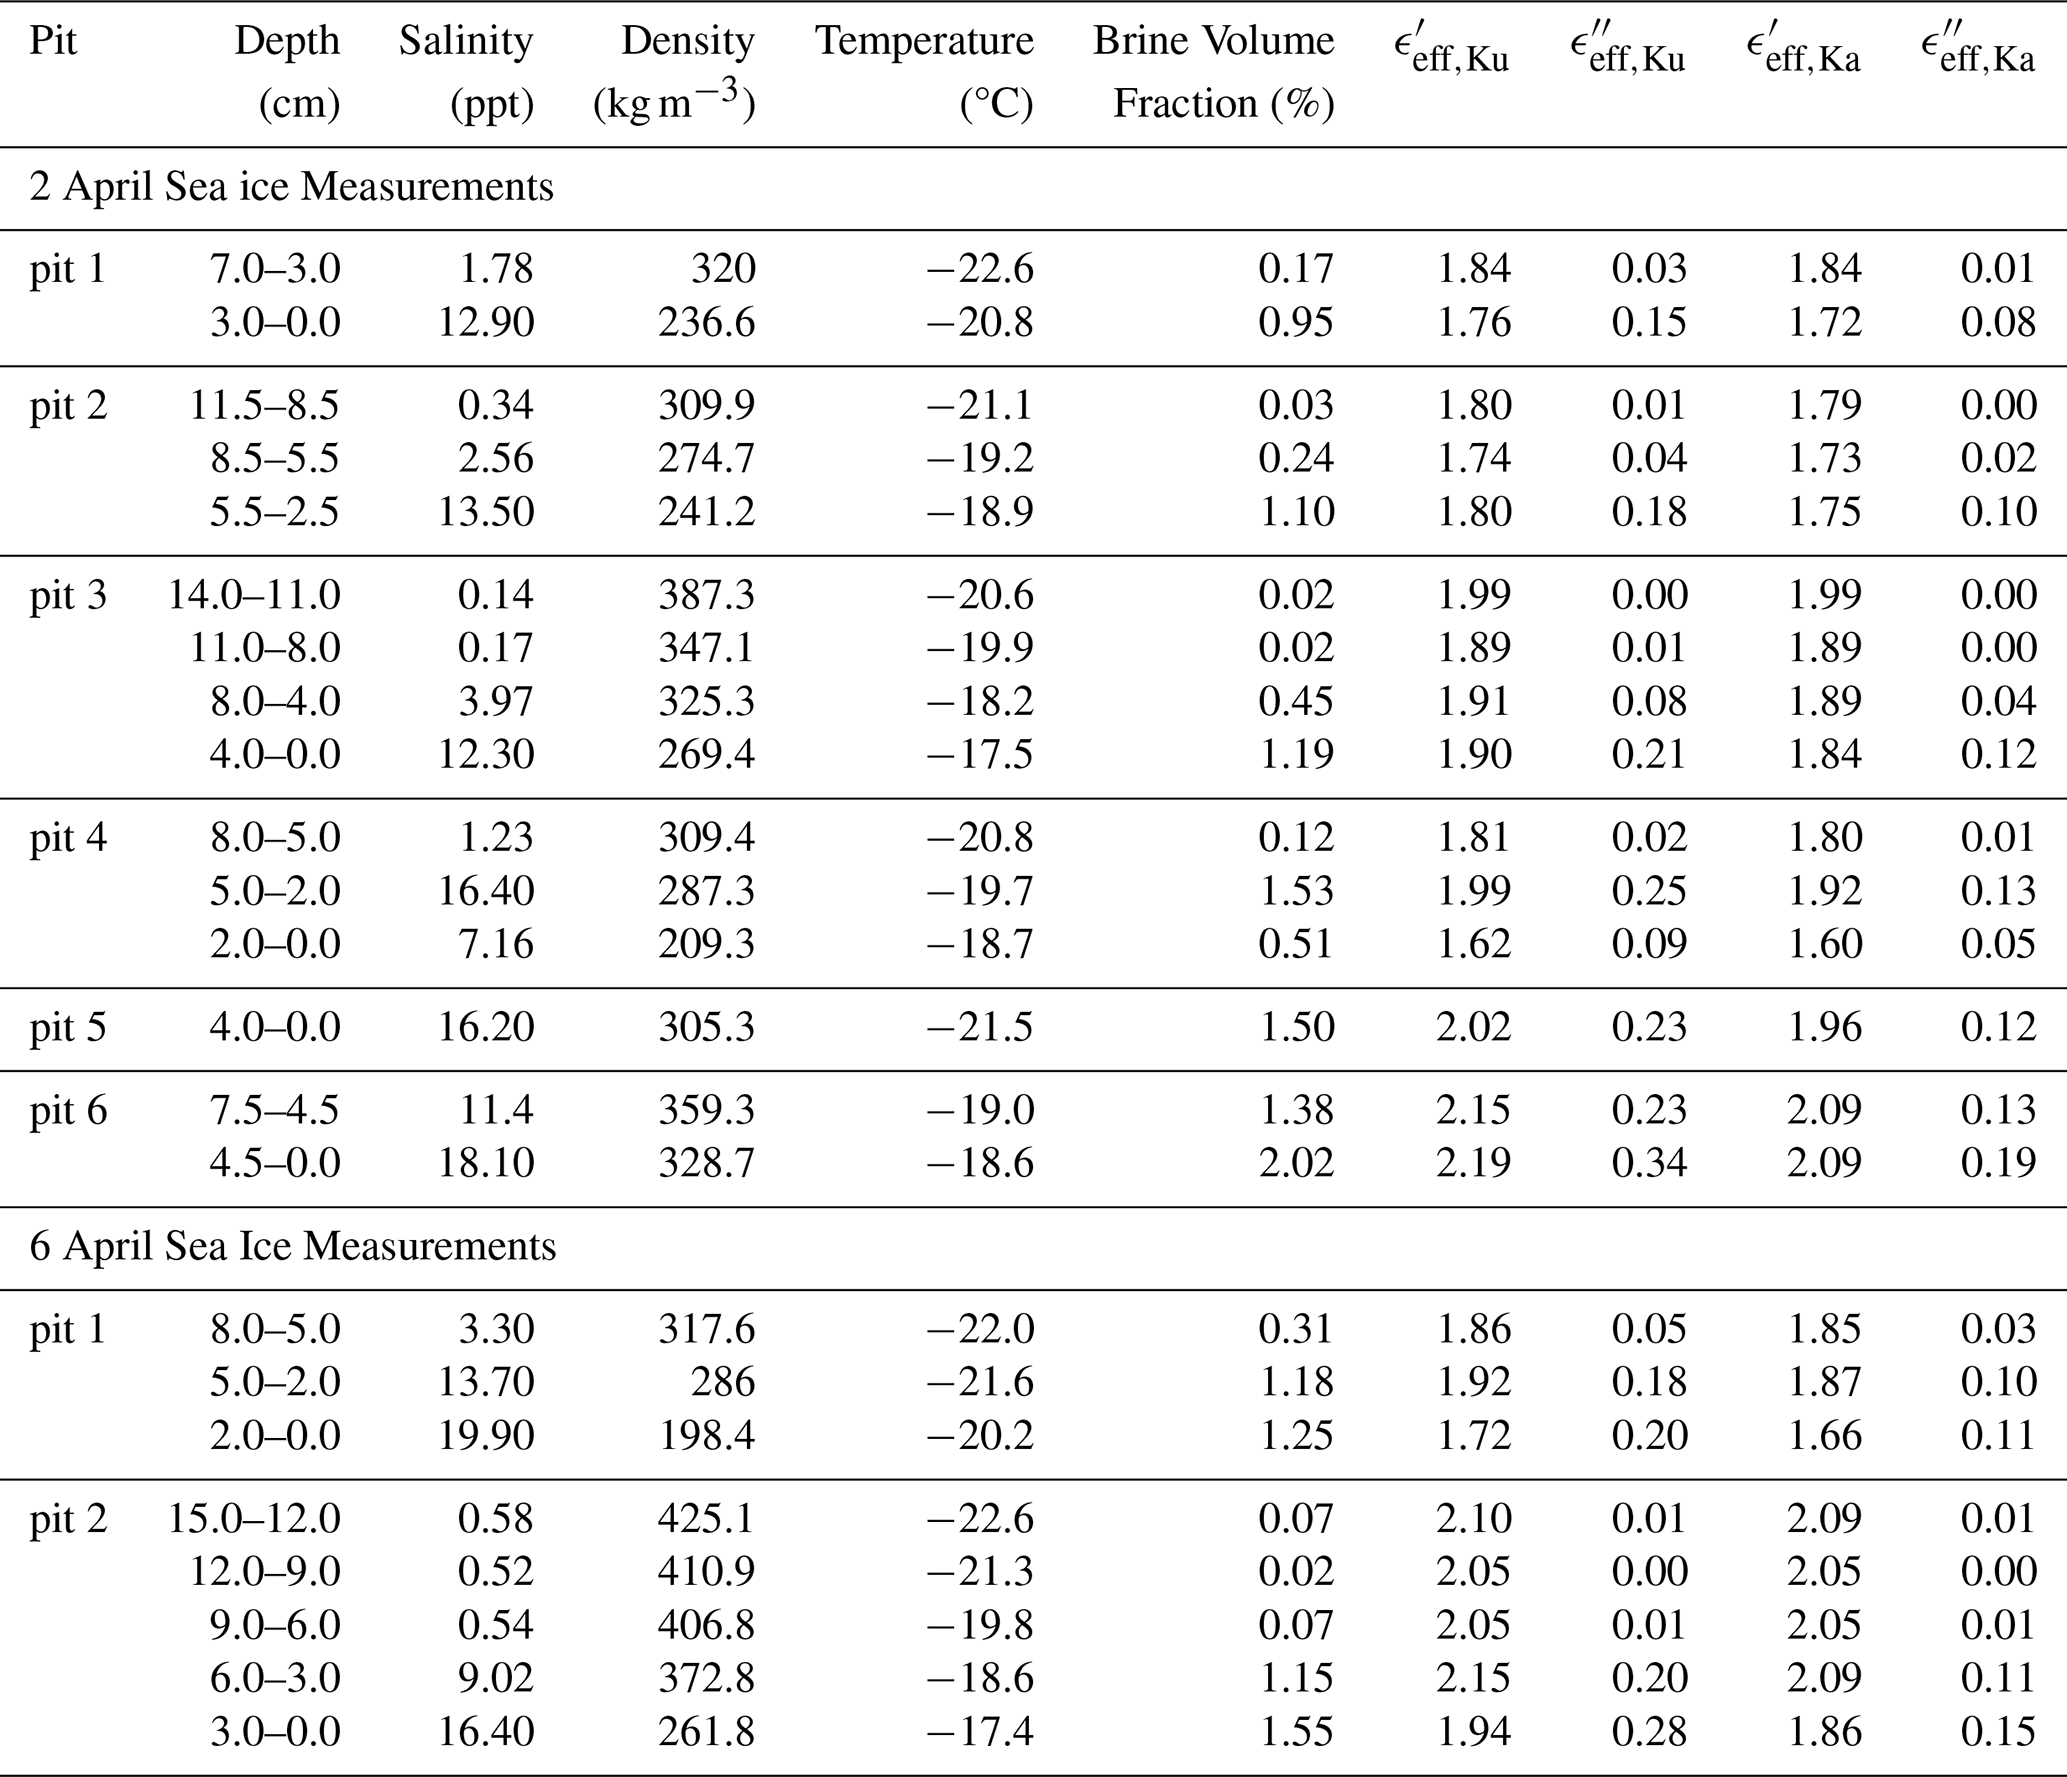
While brine volume is the primary driver of dielectric permittivity and loss, snow density also influences the real part of permittivity (ϵ′), which dictates the strength of the refractive contrast at layer boundaries. Thus, we can also see that density variations play a role in establishing these dominant scattering surfaces; for example, in Pit 2 (6 April, not shown), the high density of the upper layers (≈425 kg m−3) maintains a high ϵ′ (≈2.10) even in the absence of salinity, ensuring a strong initial reflection at the air/snow interface despite the lack of brine-driven loss. In Pit 4, while the observed downward shift of the Ku-band co-polarized peak aligns with the top of the saline layer (Fig. 16), the combined effect of a density-driven ϵ′ and brine-driven ϵ′′ effectively combine to create a strong scattering surface within the snowpack.
Finally, while our validation focused on undisturbed snow, the mechanical compaction inherent to winter roads would alter the snowpack's dielectric properties. Mechanical compaction increases snow density to 500–600 kg m−3 (Abele, 1990). Higher density and sintering lead to increased volume scattering at Ku-band frequencies, which may obscure the snow-ice interface. However, our preliminary results suggest the VH-proxy remains stable in moderately compacted Arctic snow.
4.2 Lake Ice Thickness
In contrast to sea ice, non-saline lake ice exhibits the dielectric properties of pure ice, with a loss factor (ϵ′′) on the order of 10−2 to 10−3. This significantly lower dielectric loss compared to sea ice ensures that the snow/ice interface remains a prominent scattering surface, while the ice volume itself remains largely transparent. Furthermore, the dielectric constant of freshwater ice is remarkably stable across frequencies and ambient temperatures (Ulaby and Long, 2014). Consequently, both Ku- and Ka-band signals can fully penetrate the lake ice column, allowing for significant backscatter from the ice-water interface, a stark contrast to the higher attenuation observed in saline sea ice. This results in the lake surfaces having three distinct surfaces visible in the echograms. Using this information, we can simultaneously provide estimates of both the snow depth and lake ice thickness. Figure 17 illustrates both the echograms and the resulting snow and ice thicknesses along the lake transects. Over Malcolm Ramsay Lake (upper panels) we find considerably more variability in the shallow ice thickness, ranging from around 0.6 to 1.2 m. In contrast, the data for Lake Resolute (lower panels) result in fairly constant snow depths and ice thicknesses, with ice thickness ranging from roughly 1.5 to over 2.0 m.
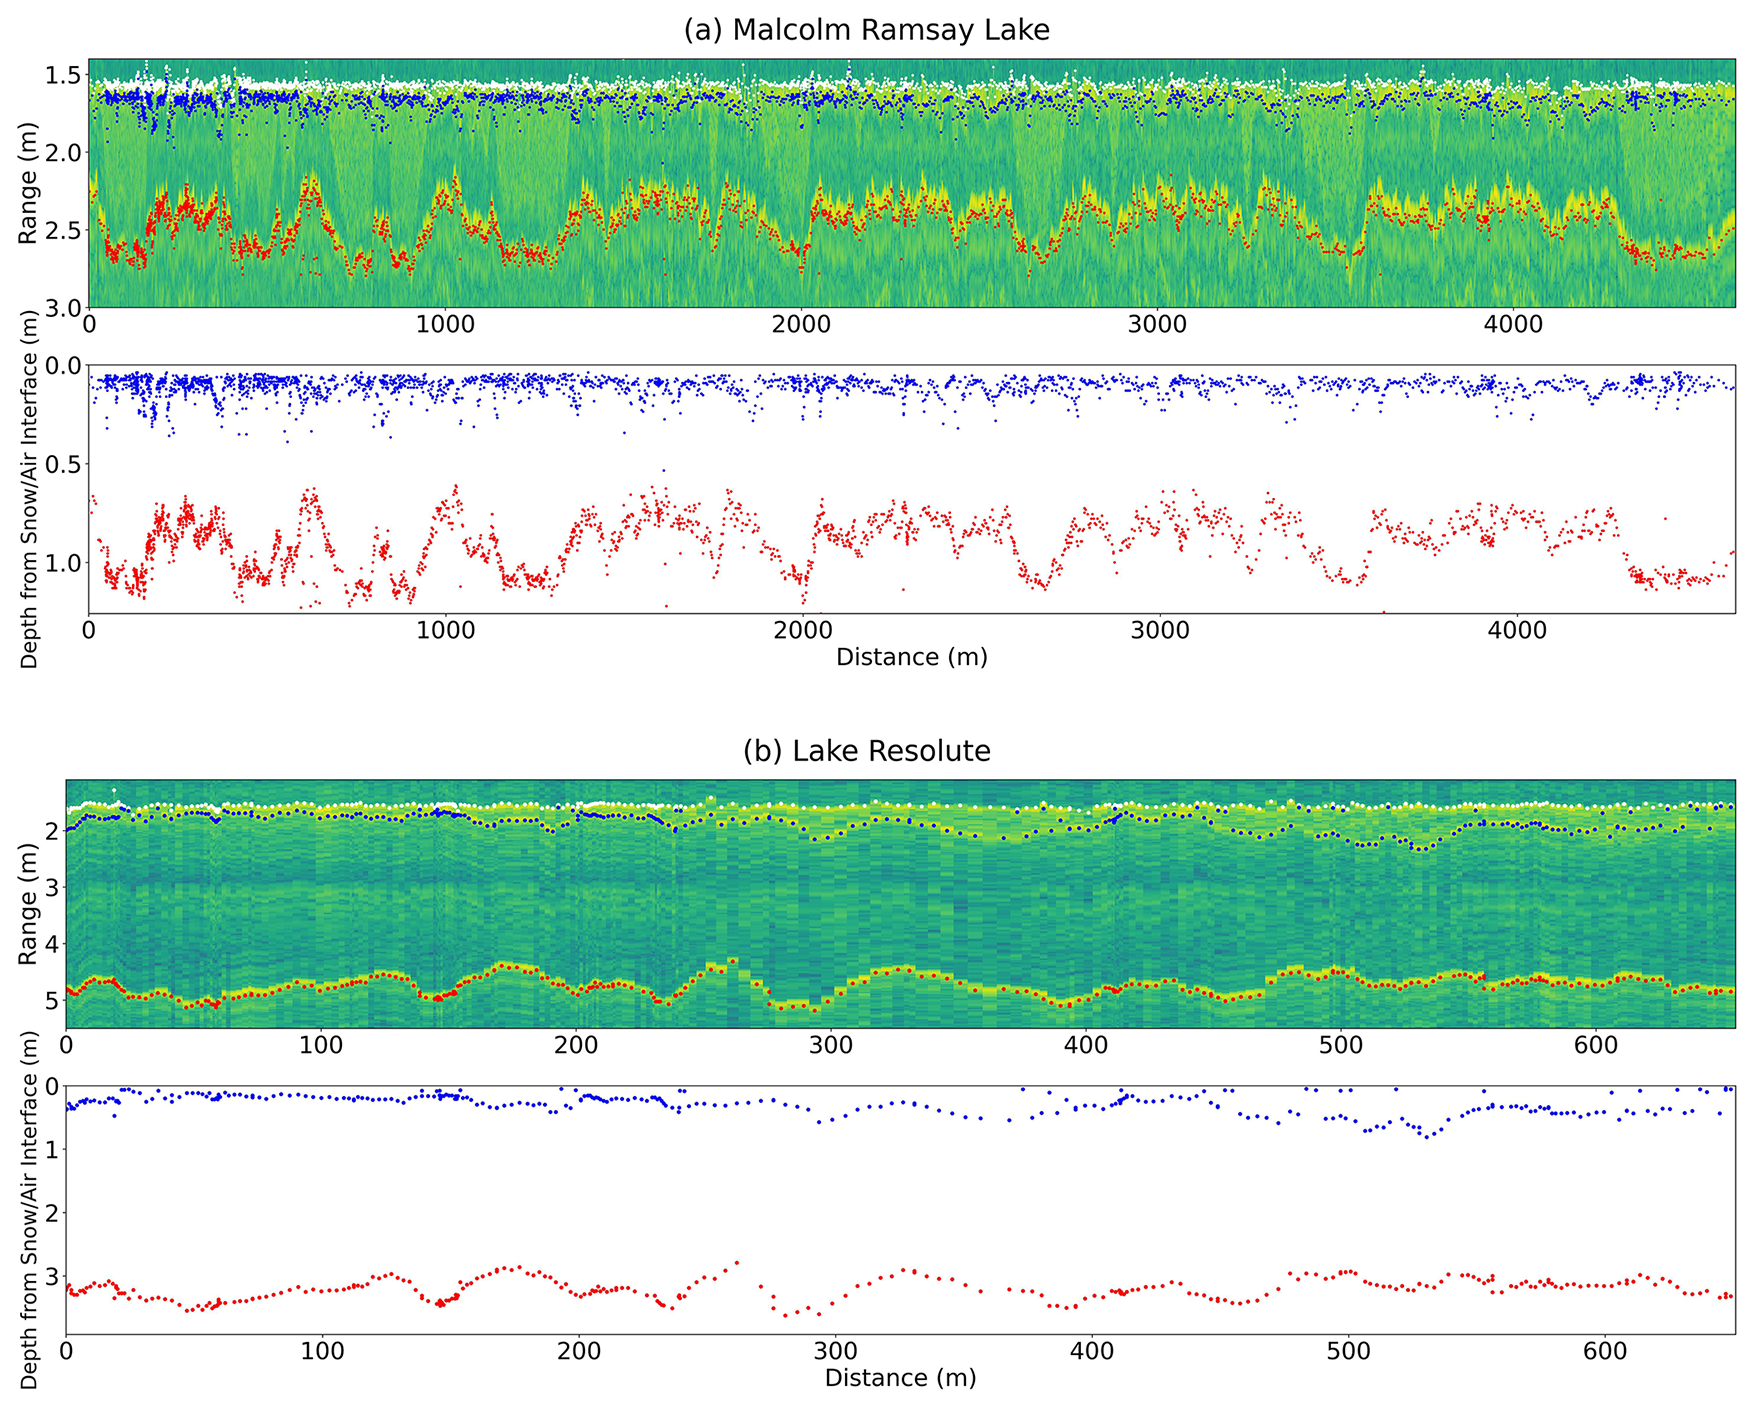
Figure 17Echograms and corresponding derived lake ice thickness (red) and snow depth (blue) from Malcolm Ramsay Lake (a) and Lake Resolute (b).
While these results are encouraging, the peak-picking algorithm was aided by a priori search windows defined through visual inspection of the echograms. Since manually constrained ranges were required to distinguish between the three interfaces, scaling this methodology to larger datasets will require developing an automated range-gate selection. Implementing tracking algorithms, such as the deep learning-based echo-detection models used by Varshney et al. (2021) for Greenland snow radar data, would allow for objective interface identification across diverse surface types without a priori windowing.
4.3 Links to PoSARA and other future satellite missions
The success of the polarimetric approach (HH-VH peak or centroid difference) for snow depth retrieval across different sea ice types and the tundra surfaces could be a path forward for future satellite altimetry. In particular, the VH signal is relatively stable and closely aligned with the snow/ice or snow/land interface, making it a more consistent proxy for the interface than the Ku-HH peak. This results in the performance of the Ku-band polarimetric peak method for landfast ice significantly outperforming the frequency difference method, and provides a path forward for future polarimetric satellite missions.
While the polarimetric approach has been found to work across several sea ice types, over tundra the magnitude of the errors (RMSE and mean bias) are considerably larger. This suggests that terrestrial snow presents unique scattering challenges that polarimetric altimetry must account for. The increased errors observed over tundra could in part stem from the structural complexity of the snow-land interface. Unlike the relatively discrete dielectric jump at the snow/ice boundary, tundra surfaces are characterized by a porous, frozen mat of mosses and shrubs and a basal layer dominated by large faceted depth hoar grains. These large grains act as significant volume scatterers at Ku-band frequencies, which can decorrelate the polarimetric signal and shift the effective VH scattering center away from the true soil surface. This finding is particularly relevant for the Terrestrial Snow Mass Mission (TSMM; Derksen et al., 2021), as it highlights the need for advanced scattering models that can distinguish between the volume scattering of coarse-grained basal snow and the complex surface scattering from sub-nivean vegetation.
The PoSARA concept was developed via funding from the first ESA New Earth Observation Mission Ideas (NEOMI) call, developing the polarimetric altimetry concept for snow depth estimation from scientific readiness level 1 to 3. We acknowledge that further modeling work is required to understand the cross-polarized contributions and whether the concept could work at satellite scales. Additionally, our results are not directly translatable to current satellite systems since KuKa is a surface-based, FMCW beam-limited system, which operates differently from satellite altimeters. In pulse-limited systems, such as AltiKa, the size of the measured surface area is determined by the spread of the radar pulse over time, rather than the physical size of the antenna beam. While modern SAR (Delay-Doppler) altimeters like CryoSat-2 and the upcoming CRISTAL mission employ coherent processing to sharpen the along-track footprint (reducing it to a few 100 m), they remain pulse-limited in the across-track direction. Because of the larger footprint, satellite altimeter's waveforms are therefore sensitive to large-scale surface roughness (Landy et al., 2020) in a way that KuKa's waveforms are not. The KuKa radar has a much smaller footprint. As a result, KuKa is sensitive to local-scale properties, including roughness at the air–snow and snow–ice interfaces, as well as snowpack salinity through its effects on dielectric contrast and attenuation. Combined with the ability to collect coincident geophysical data, KuKa allows for detailed investigation of the effects of snow and ice characteristics on waveforms. Its superior vertical resolution (1.5–2.5 cm) vs satellite altimeters such as CryoSat-2 (47 cm) enables resolution of much smaller features and identification e.g. of layers within the snow pack (see e.g. Nandan et al., 2023). KuKa data therefore permits investigation into how snow geophysical properties affect scattering. With respect to the CRISTAL mission, our KuKa data show that since both Ku and Ka co-polarised waveforms mostly show scattering at the air/snow interface, differencing retrieved Ku- and Ka-band peak or centroid ranges does not represent snow depth. For the reasons given above this cannot be assumed to be the case at the satellite scale that CRISTAL will operate on, but could provide insights into where the CRISTAL concept is more likely to provide accurate snow depths. Given its wide antenna beamwidth relative to a nadir-looking pulse-limited satellite altimeter, KuKa's geometry is more analogous to a near-nadir swath altimeter. Specifically, it shares surface-interaction characteristics with the Surface Water and Ocean Topography (SWOT) mission, though SWOT's KarIn instrument is a Ka-band interferometric SAR (InSAR) system rather than an altimeter. Designed for wide-swath elevation mapping rather than nadir profiling, the fundamental physics of its beam-limited interaction with the snow volume remains largely unexplored. Our results provide an experimental baseline for Ka-band penetration and scattering across snow-covered ice and tundra at the near-nadir incidence angles utilized by the SWOT mission.
4.4 Bridging snow depth retrievals with winter roads
Winter roads provide essential connectivity across a heterogeneous landscape in the north. These transport corridors are increasingly vulnerable to warming temperatures and shifting precipitation patterns. Because natural snow accumulation is the primary governing factor for ice growth rates, route viability and road stability, improved methods for mapping snow across these landscapes is an operational necessity. The development of the KuKa dual-frequency polarimetric radar has highlighted how including cross-polarized radar returns offers improved snow depth accuracy compared to dual-frequency co-polarized returns. Our results further highlight that compaction increases the real part of the permittivity (ϵ′) which would strongly impact the co-polarized returns, so that the HH-VH differencing is operationally superior as the VH signal remains more consistently aligned with the true snow/ice interface. Finally, aeolian redistribution determines the spatial distribution of snow loading and the formation of impassable drifts along transport routes. While not explored in detail here, being able to identify these high permittivity wind slabs via radar could serve as a proxy for monitoring wind-driven accumulation that causes uneven loading on ice surfaces. Polarimetric satellite altimetry missions like the PoSARA concept could provide the foundation for regional snow mapping and operational planning.
While we did not specifically address the role of permafrost thaw, an evaluation of snow cover impacts on permafrost stability near a highway embankment in the Northwest Territories demonstrated enhanced permafrost thaw with snow accumulation, and recommended mechanical snow removal and/or snow compaction as mechanisms to encourage permafrost stability (O'Neill and Burn, 2017). Snow depth mapping using radar altimetry would help identify regions of snow accumulation and priority zones for snow removal/compaction to ensure stable northern infrastructure over permafrost.
As shorter winter road seasons demand alternative, permanent (all-season) transportation and connectivity infrastructure options, accurately characterizing snow depth and ice thickness to inform the engineering and design of remote transportation corridors constructed over a variety of land and icescapes will be increasingly important. Surface-based radar altimetry expanded to aerial and satellite coverage used to map snow depth can inform near real time interventions that will mitigate snow load impact on infrastructure stability and meet the needs of communities that rely on these connections for safety, security and equitable access to services.
Following on from the studies of Willatt et al. (2023, 2025) we have shown that polarimetric altimetry has the potential to provide more accurate snow depth retrievals than dual-frequency Ku- and Ka-band techniques over sea ice, lake ice and tundra. While the dual-frequency approach did not produce accurate snow depth estimates across all terrains, the polarimetric technique, specifically utilizing the VH cross-polarization and HH co-polarisation, successfully replicated snow depth probability density functions observed in field measurements. For freshwater lake ice, we further demonstrated the ability to simultaneously retrieve snow and ice thickness regardless of frequency or polarization, though an objective interface detection model, such as deep learning-based tracking, is a necessary next step for scaling this methodology to larger regional datasets. This improved accuracy is critical for management of winter road infrastructure since snow depth dictates both the rate of ice thickening and likelihood of slush formation. As such, this approach could provide more reliable assessments of ice bearing capacity and seasonal opening windows. Further work is needed to establish how a polarimetric-based snow depth retrieval would perform over compressed snow, as our study took place over undisturbed snow and ice.
Our results provide an experimental baseline and highlight the potential for future polarimetric satellite missions, such as those explored for the PoSARA satellite concept. However, translating these surface-based observations to satellite platforms requires addressing the differences in sensor geometry and footprint scales. Given that winter roads often traverse complex terrain with varying micro-topography, future investigations via modeling and polarimetric instruments mounted on drone or airborne platforms will be essential to explore upscaling. If future missions incorporate polarimetric capability, the VH peak range could serve as a consistent replacement for identifying snow/ice or snow/land boundaries. Such advancements would provide the high-temporal resolution monitoring required to ensure the safety and viability of remote Arctic transport corridors in a changing climate.
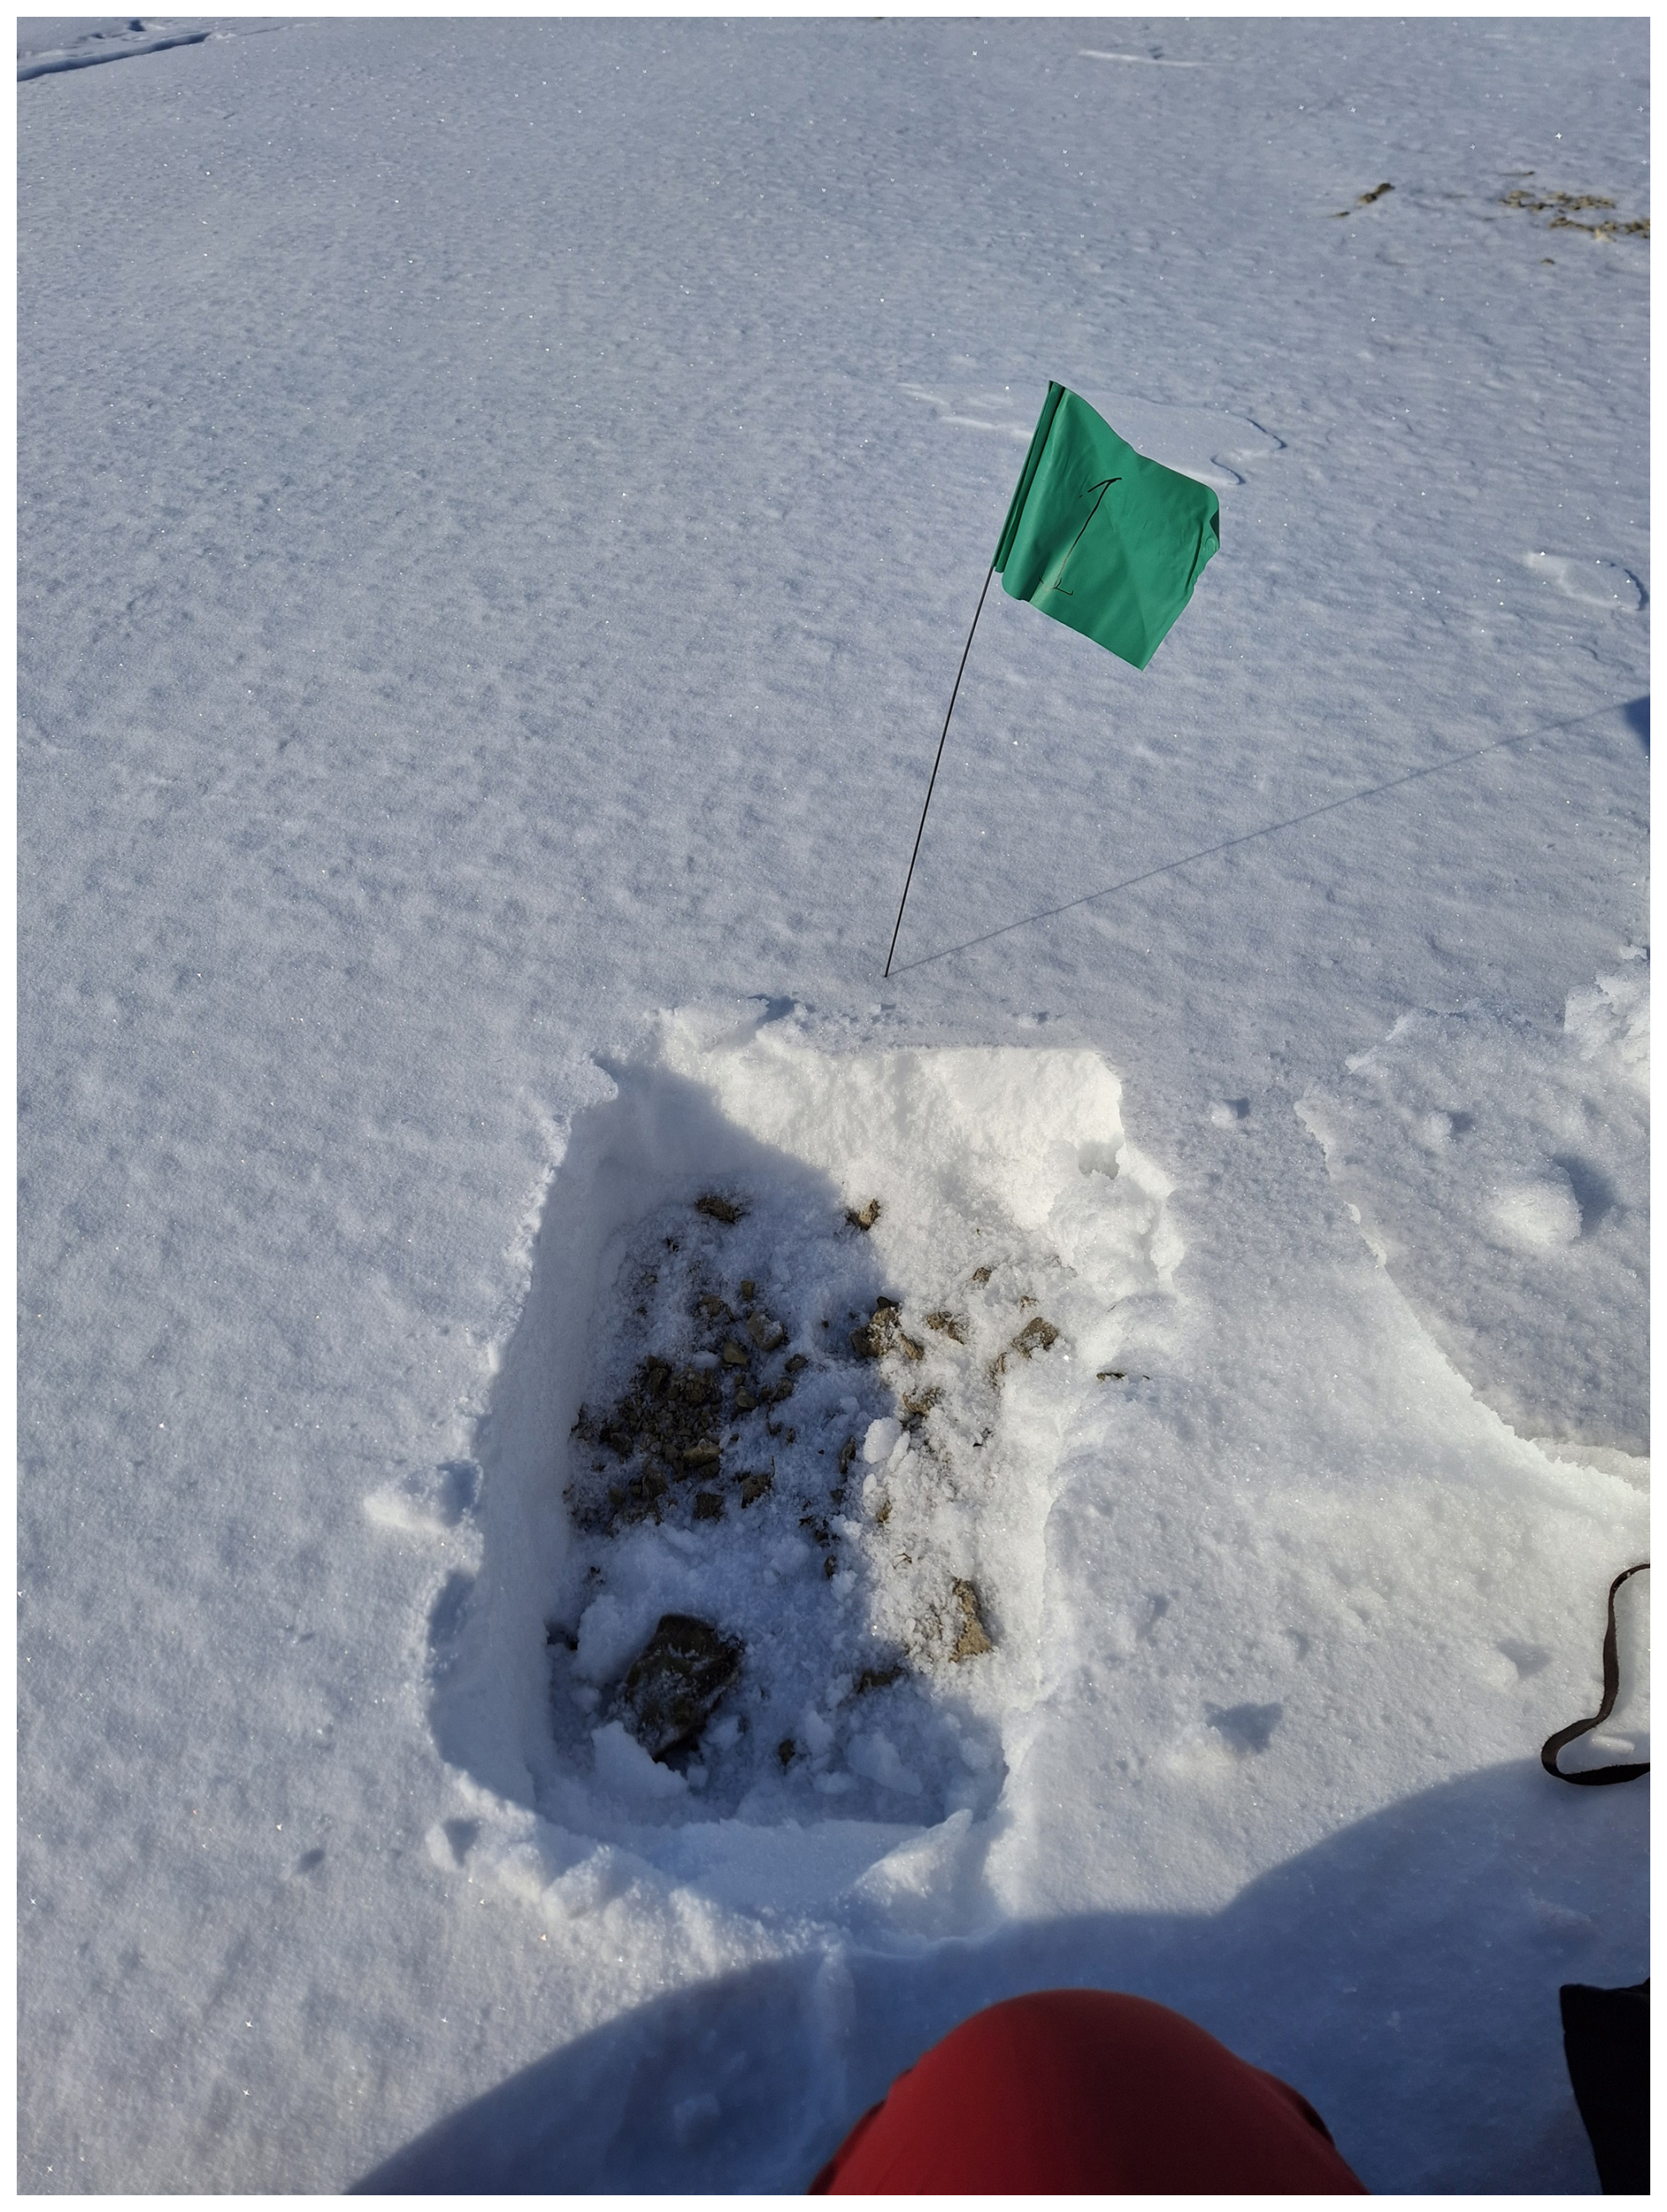
Figure A1Photo of snow pit over land highlighting the presence of a pebble base. Photo taken in Resolute on 4 April 2025.
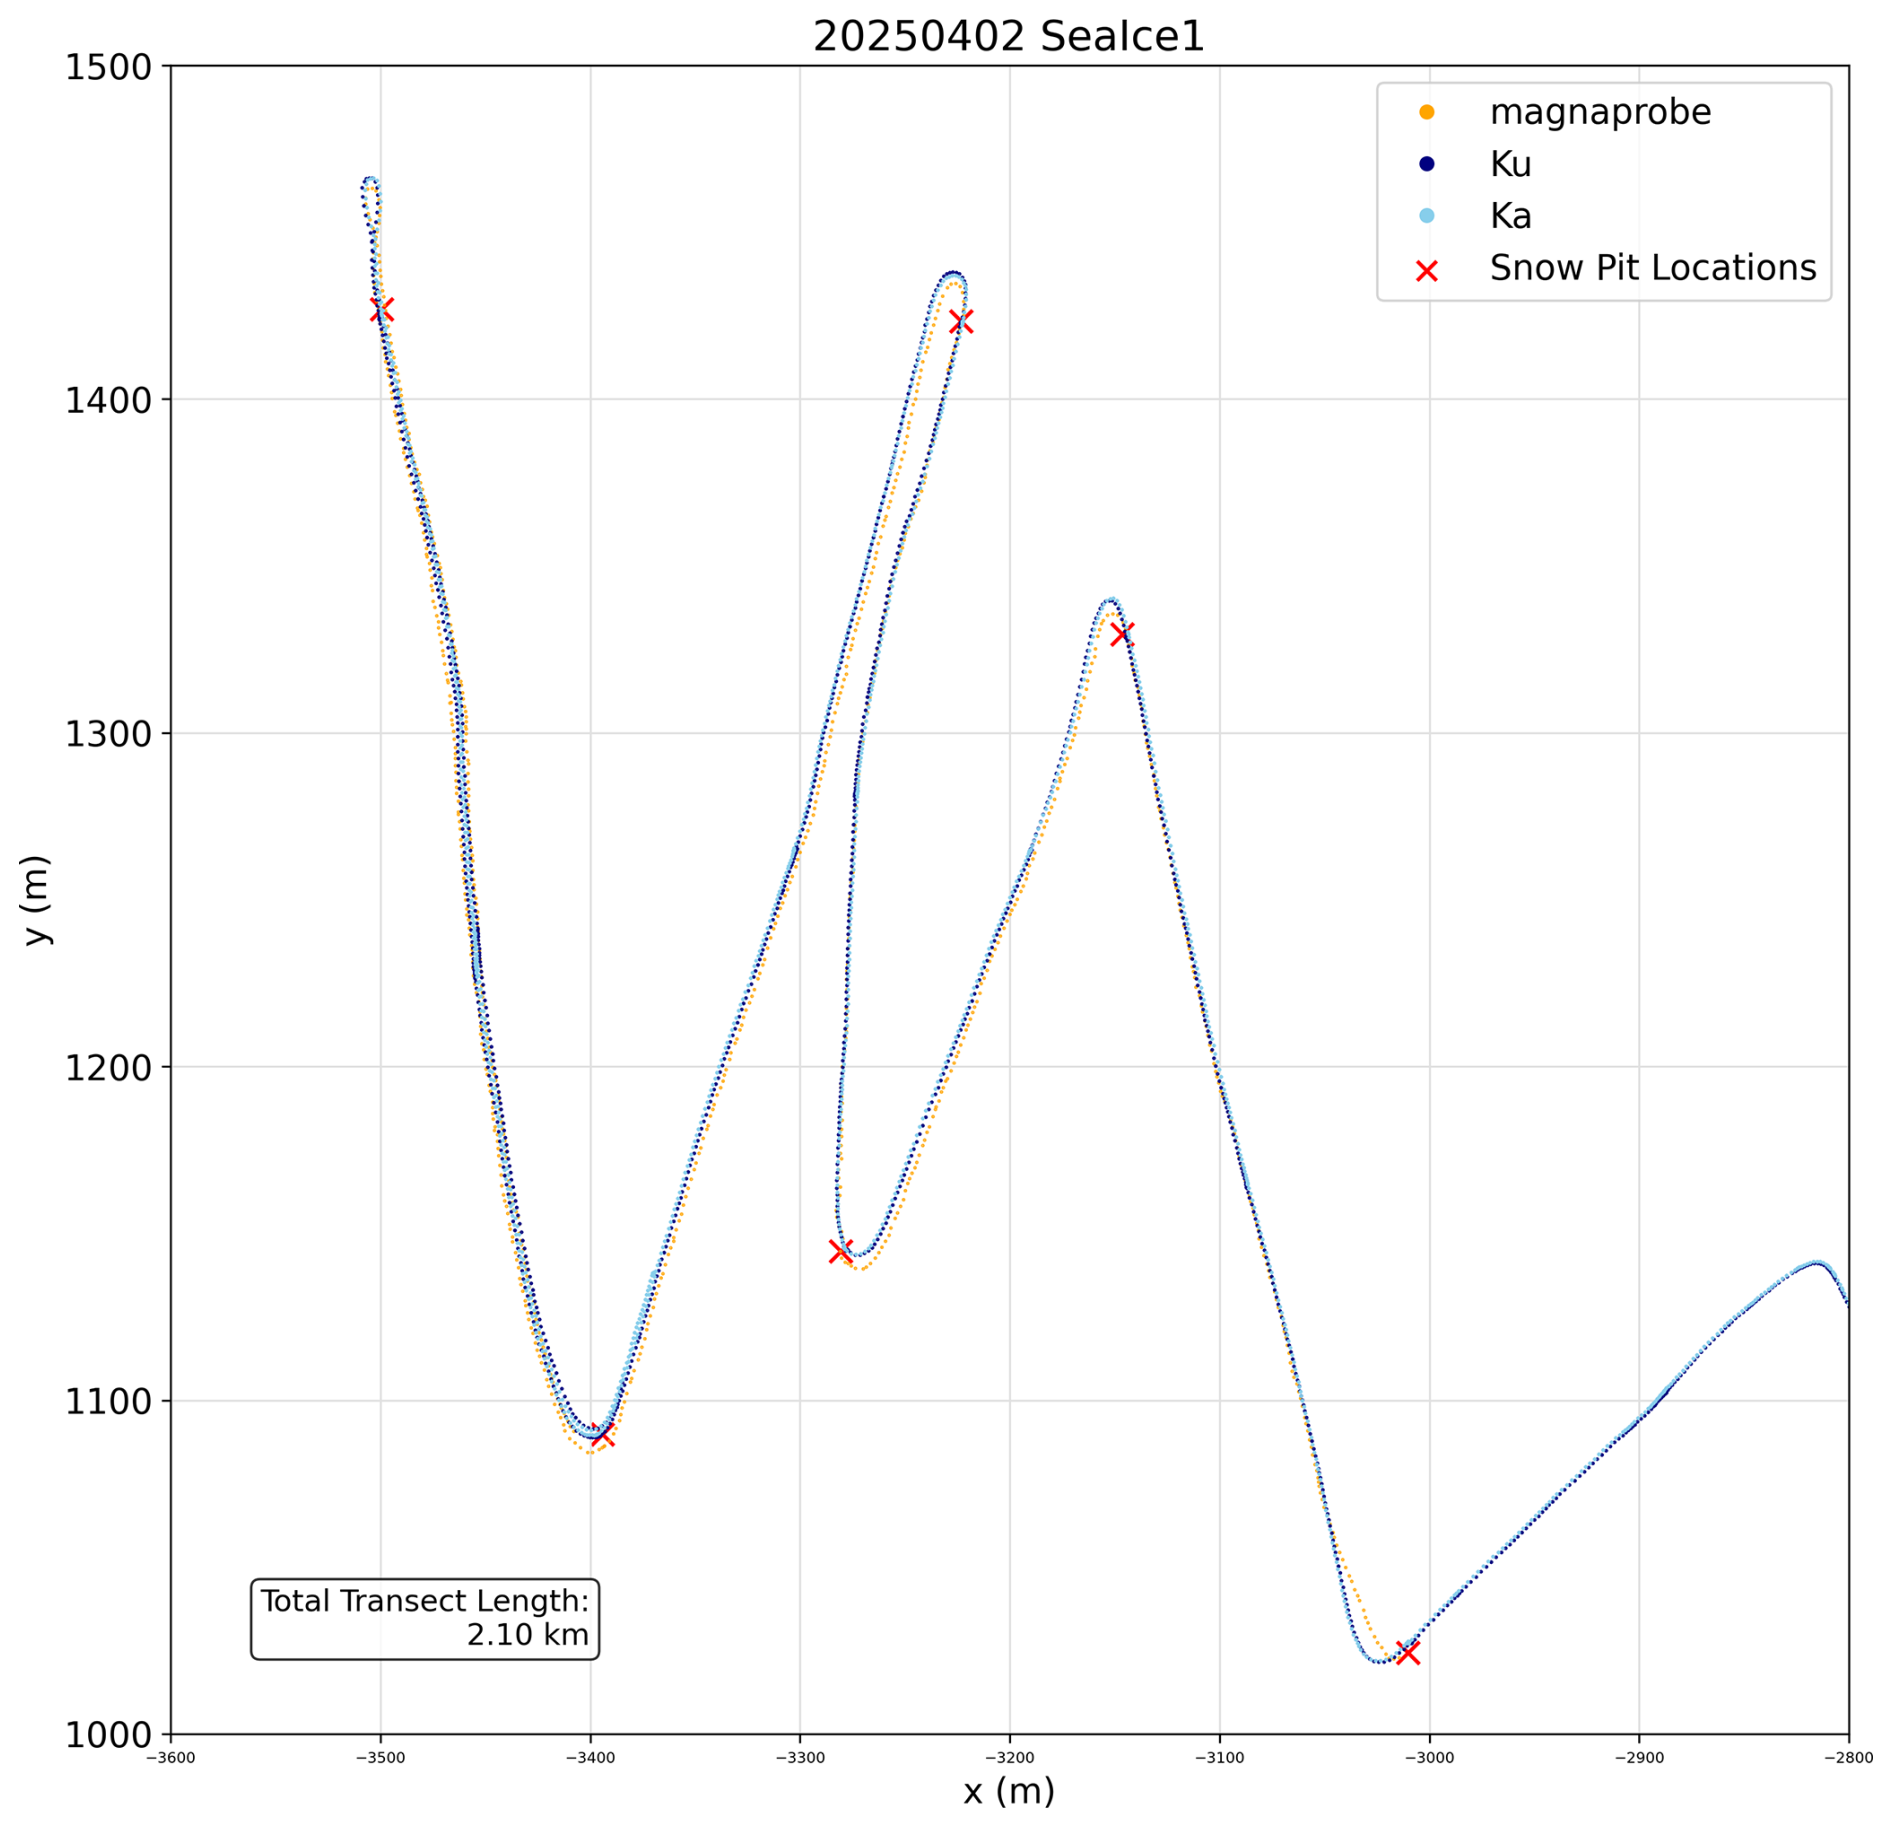
Figure A2Overview of KuKa transects for each radar wavelength, MagnaProbe snow depths and locations where snow pits were dug for the first sea ice location in Resolute. The total transect length is also provided.
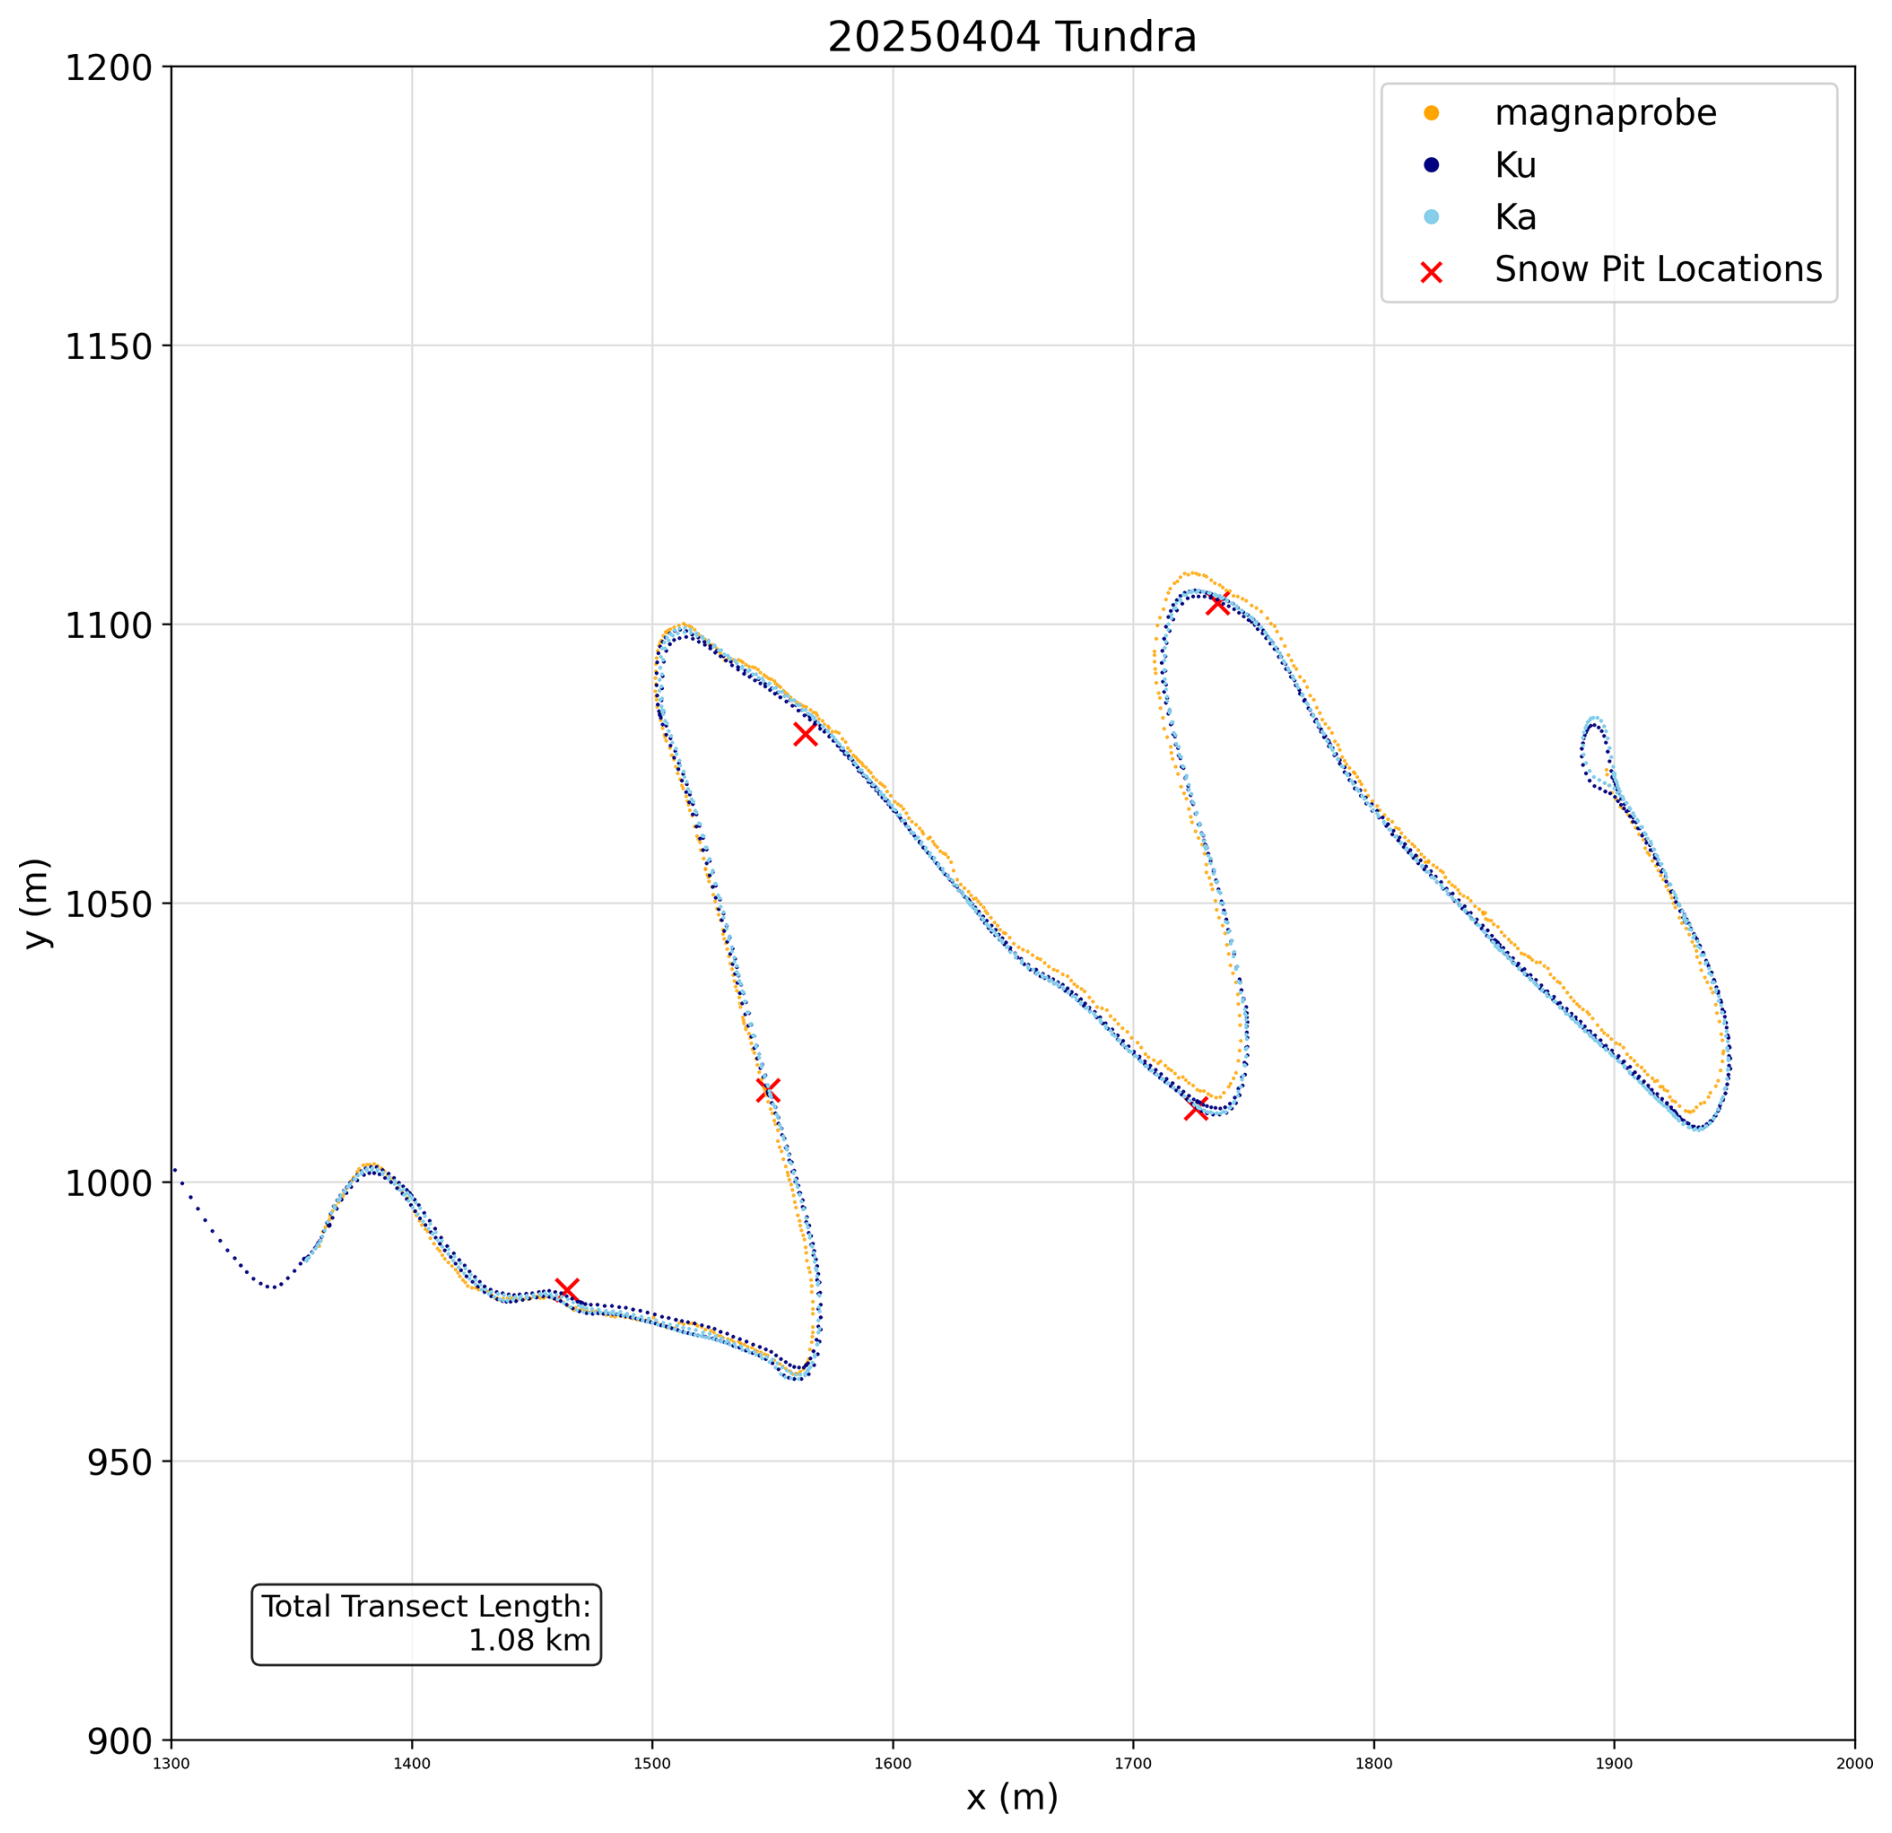
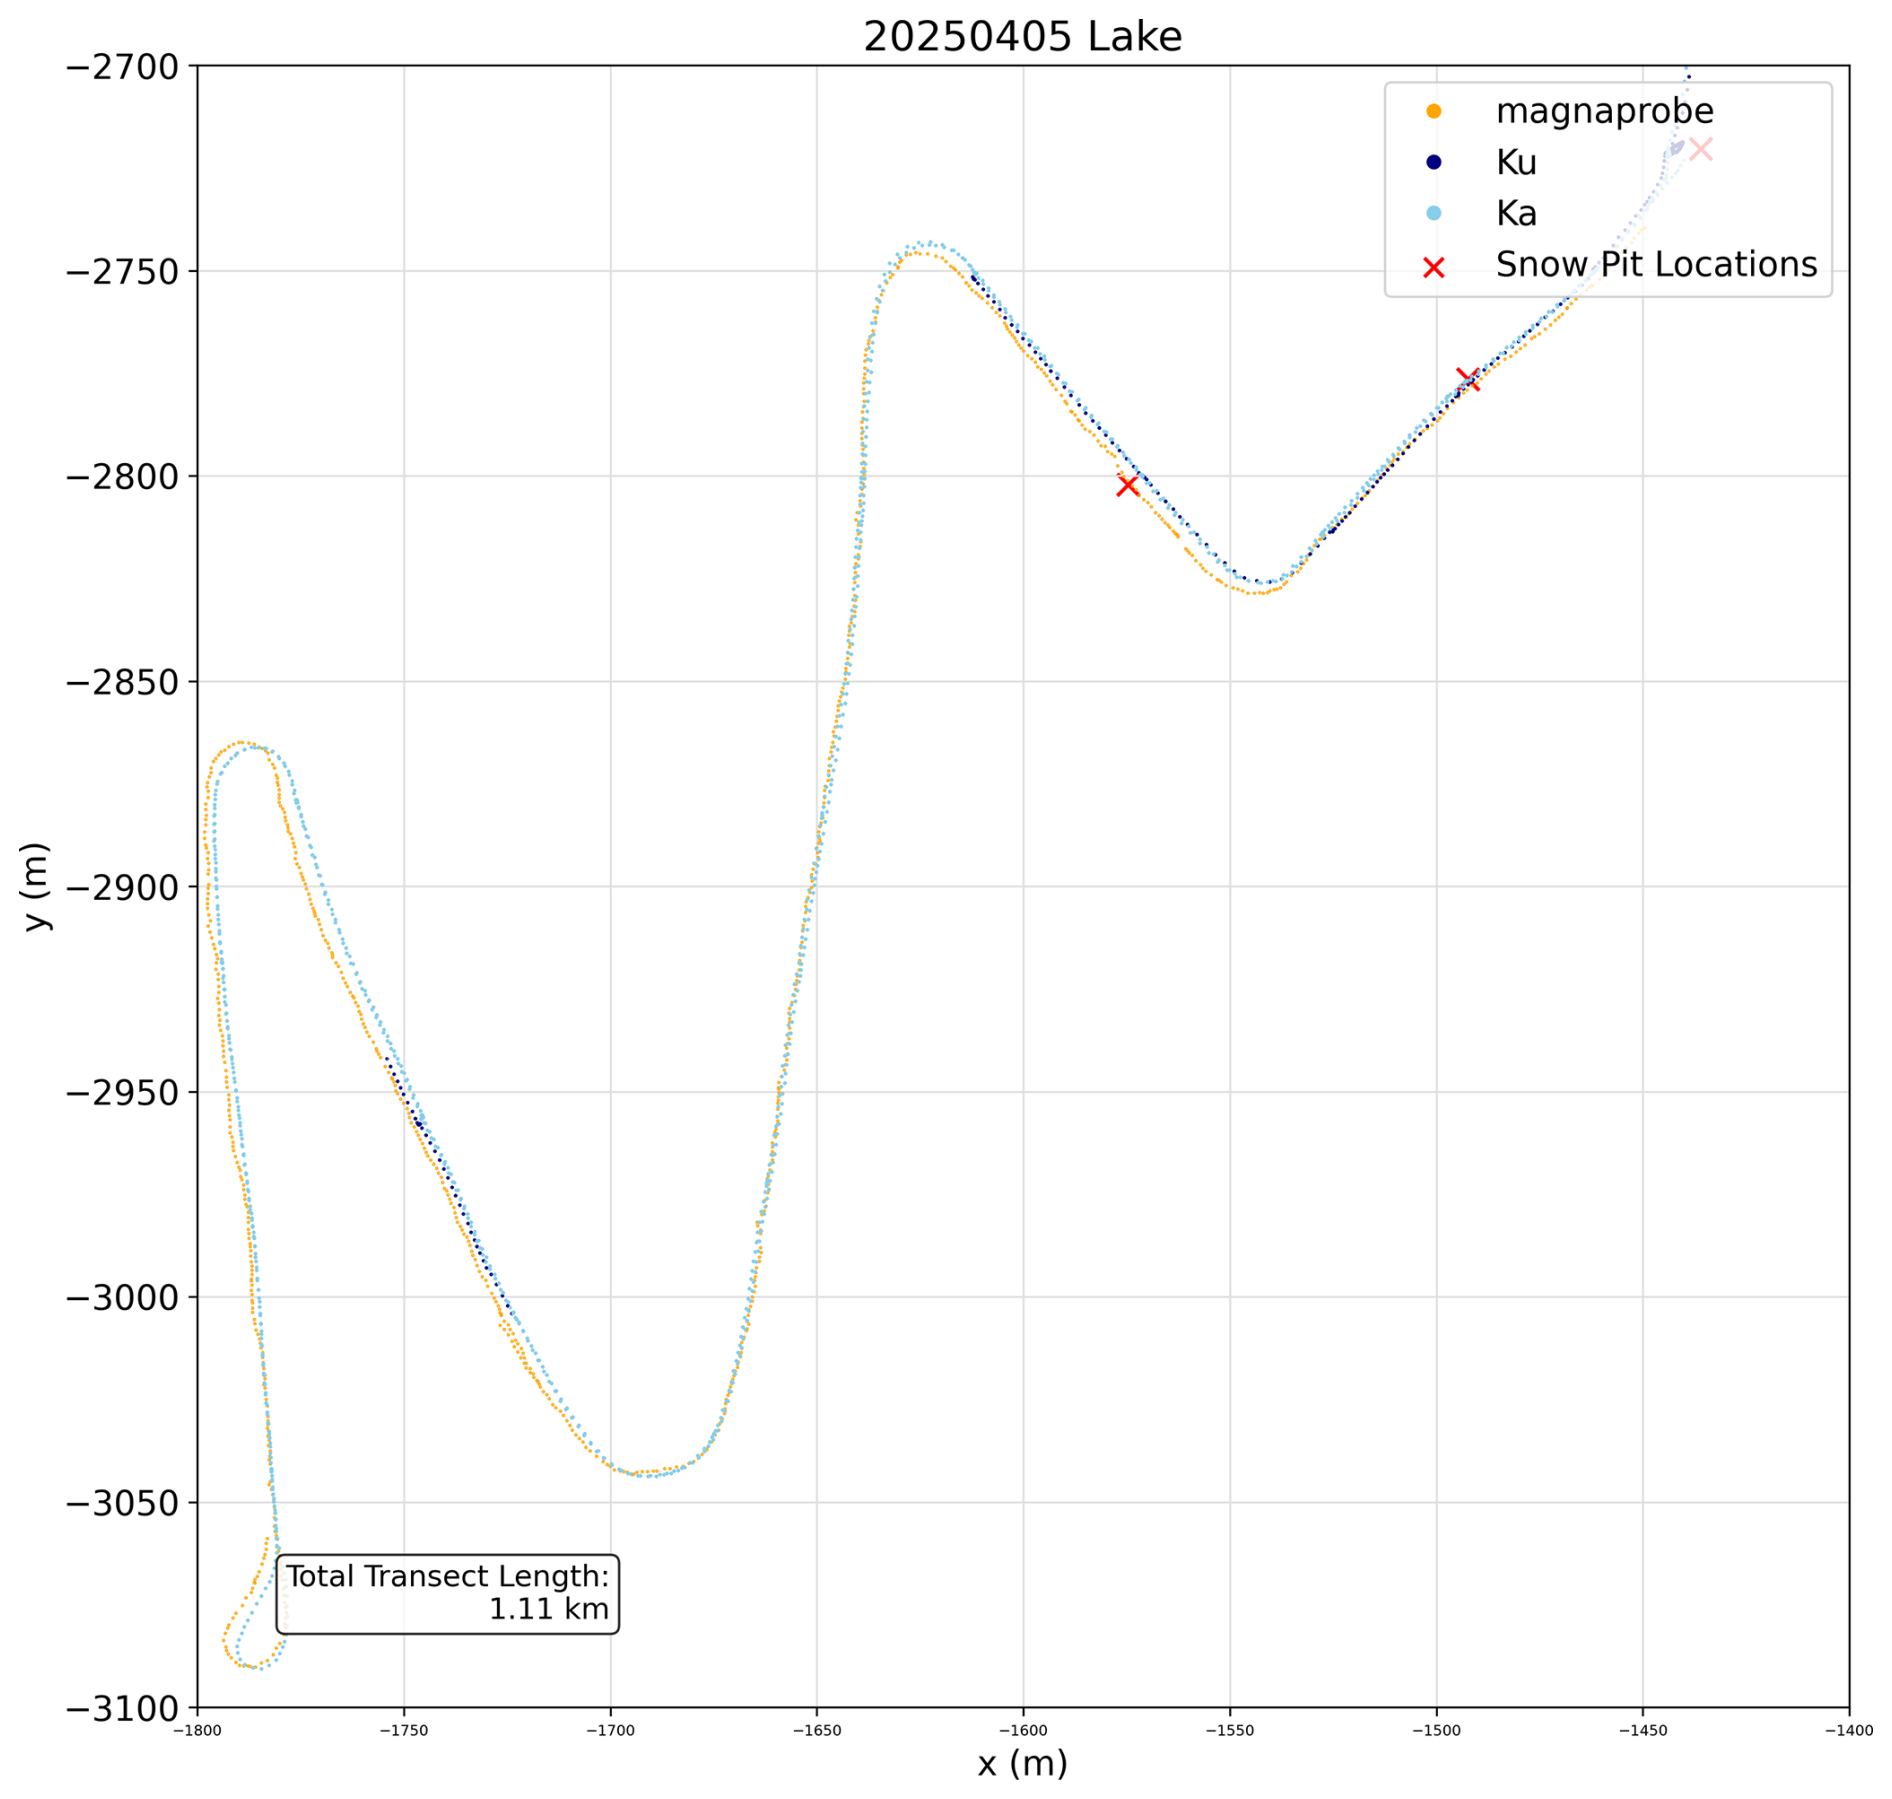
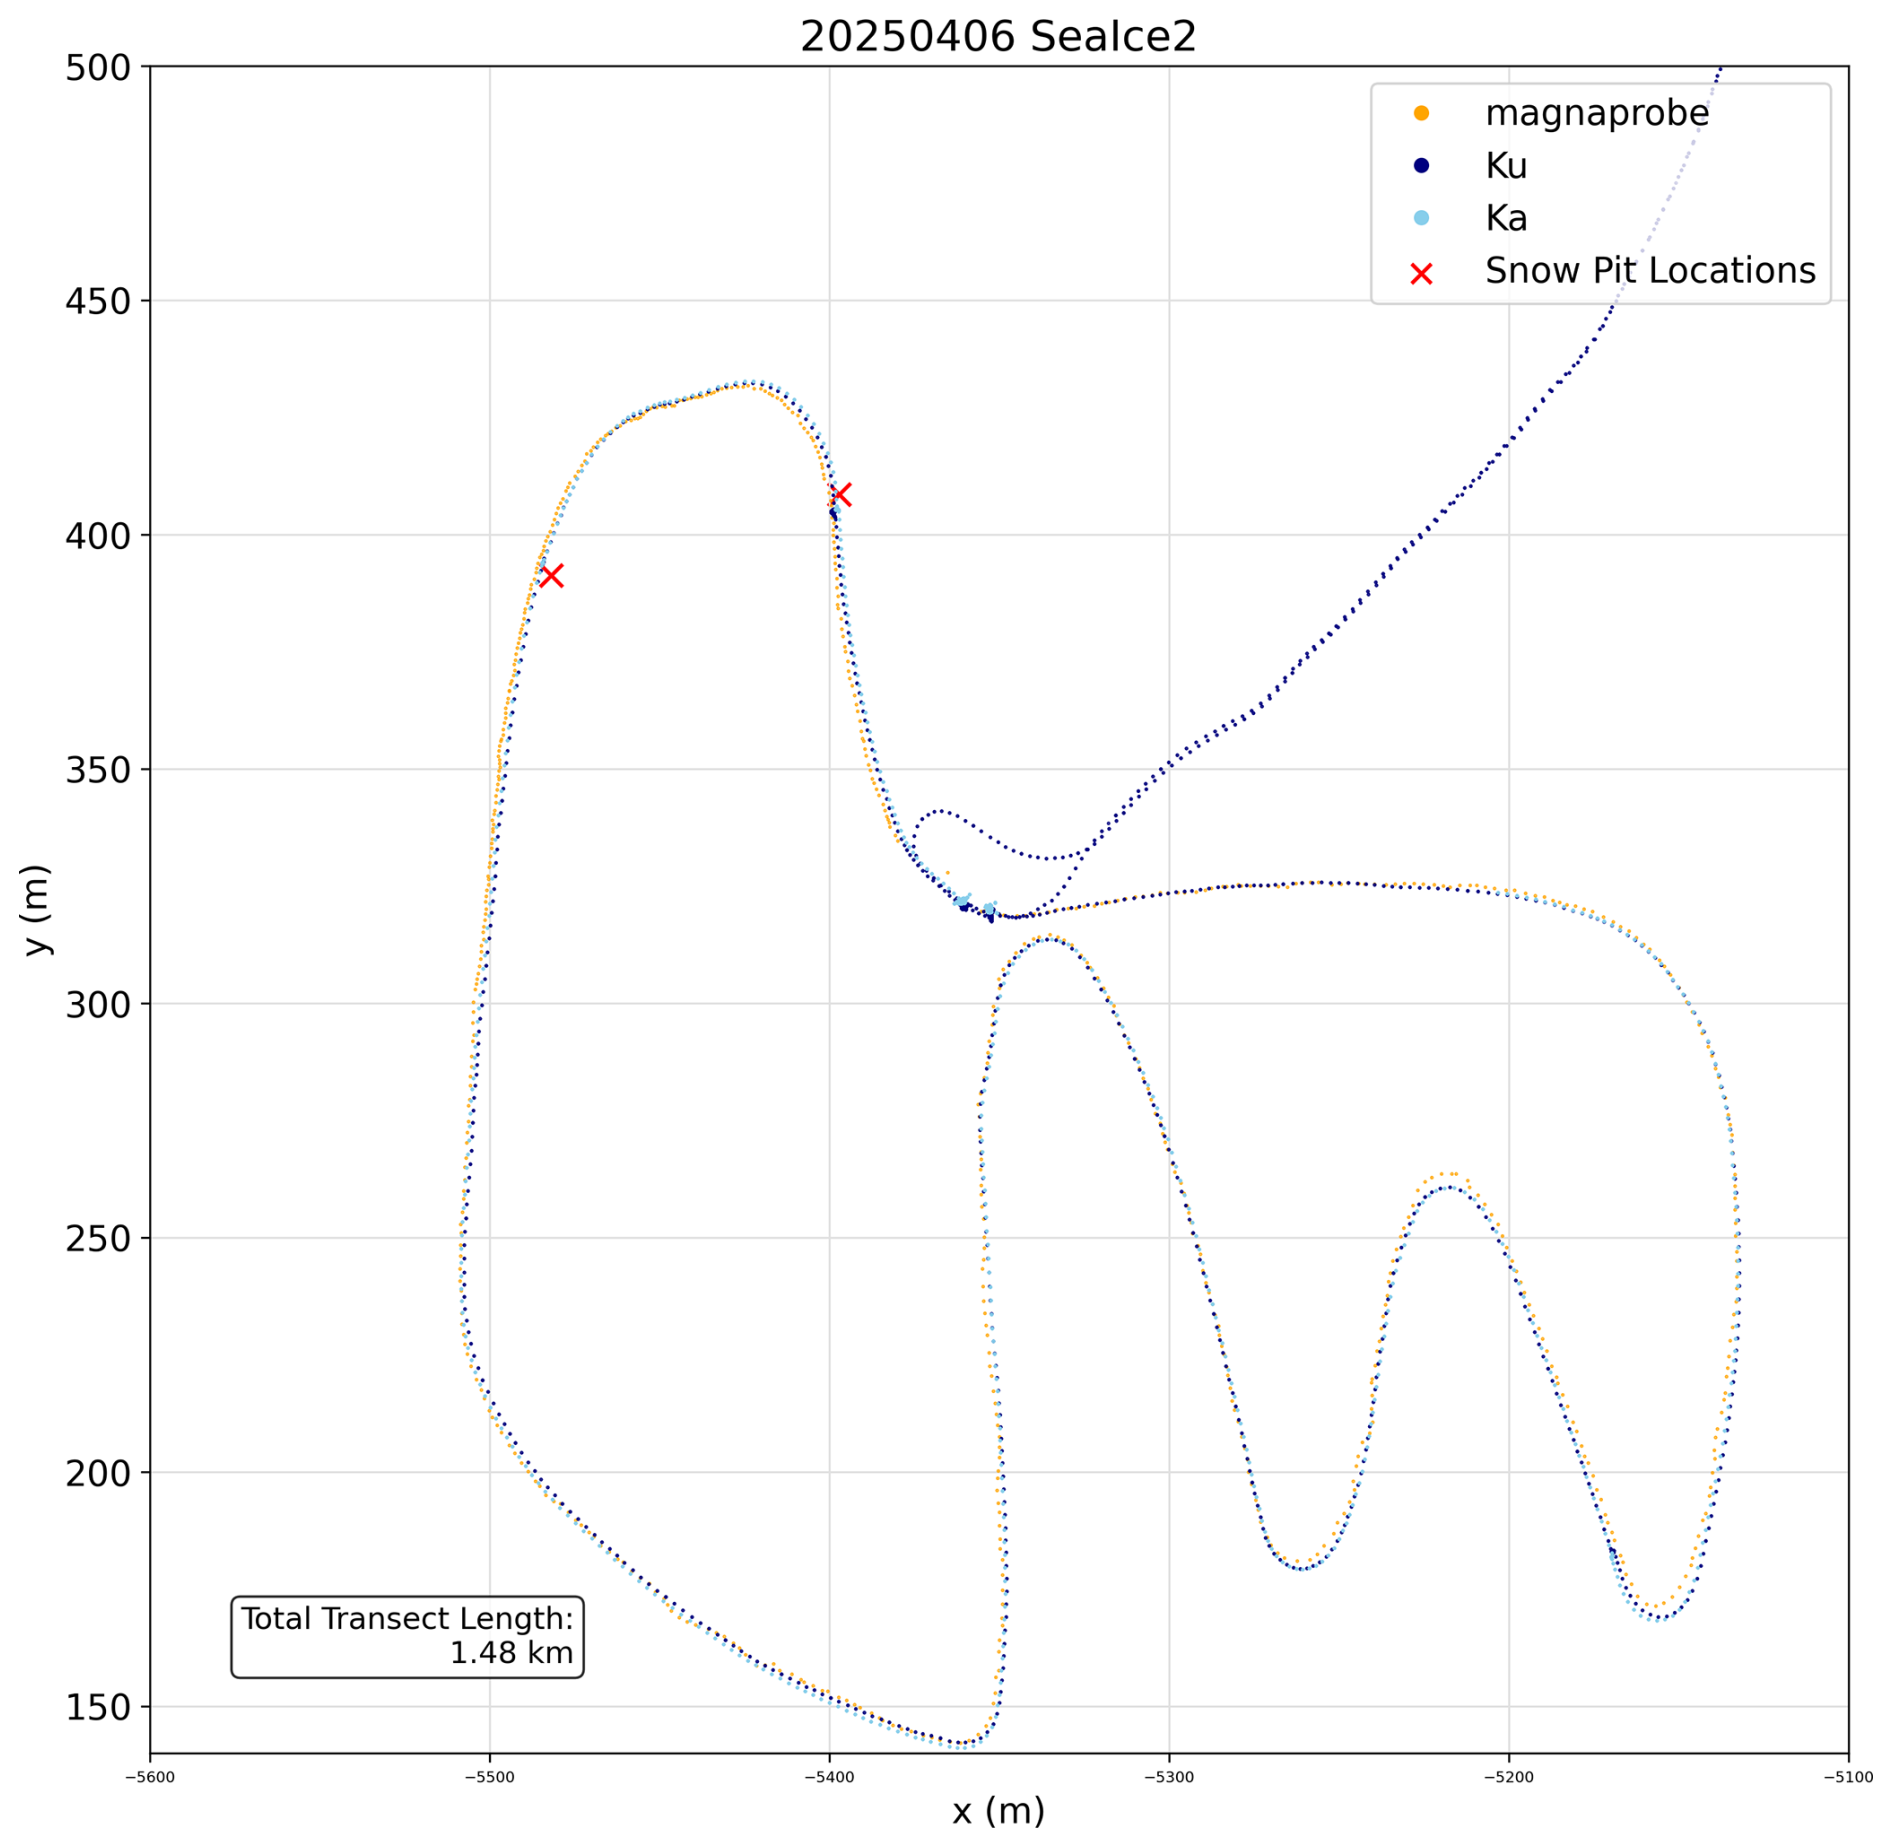
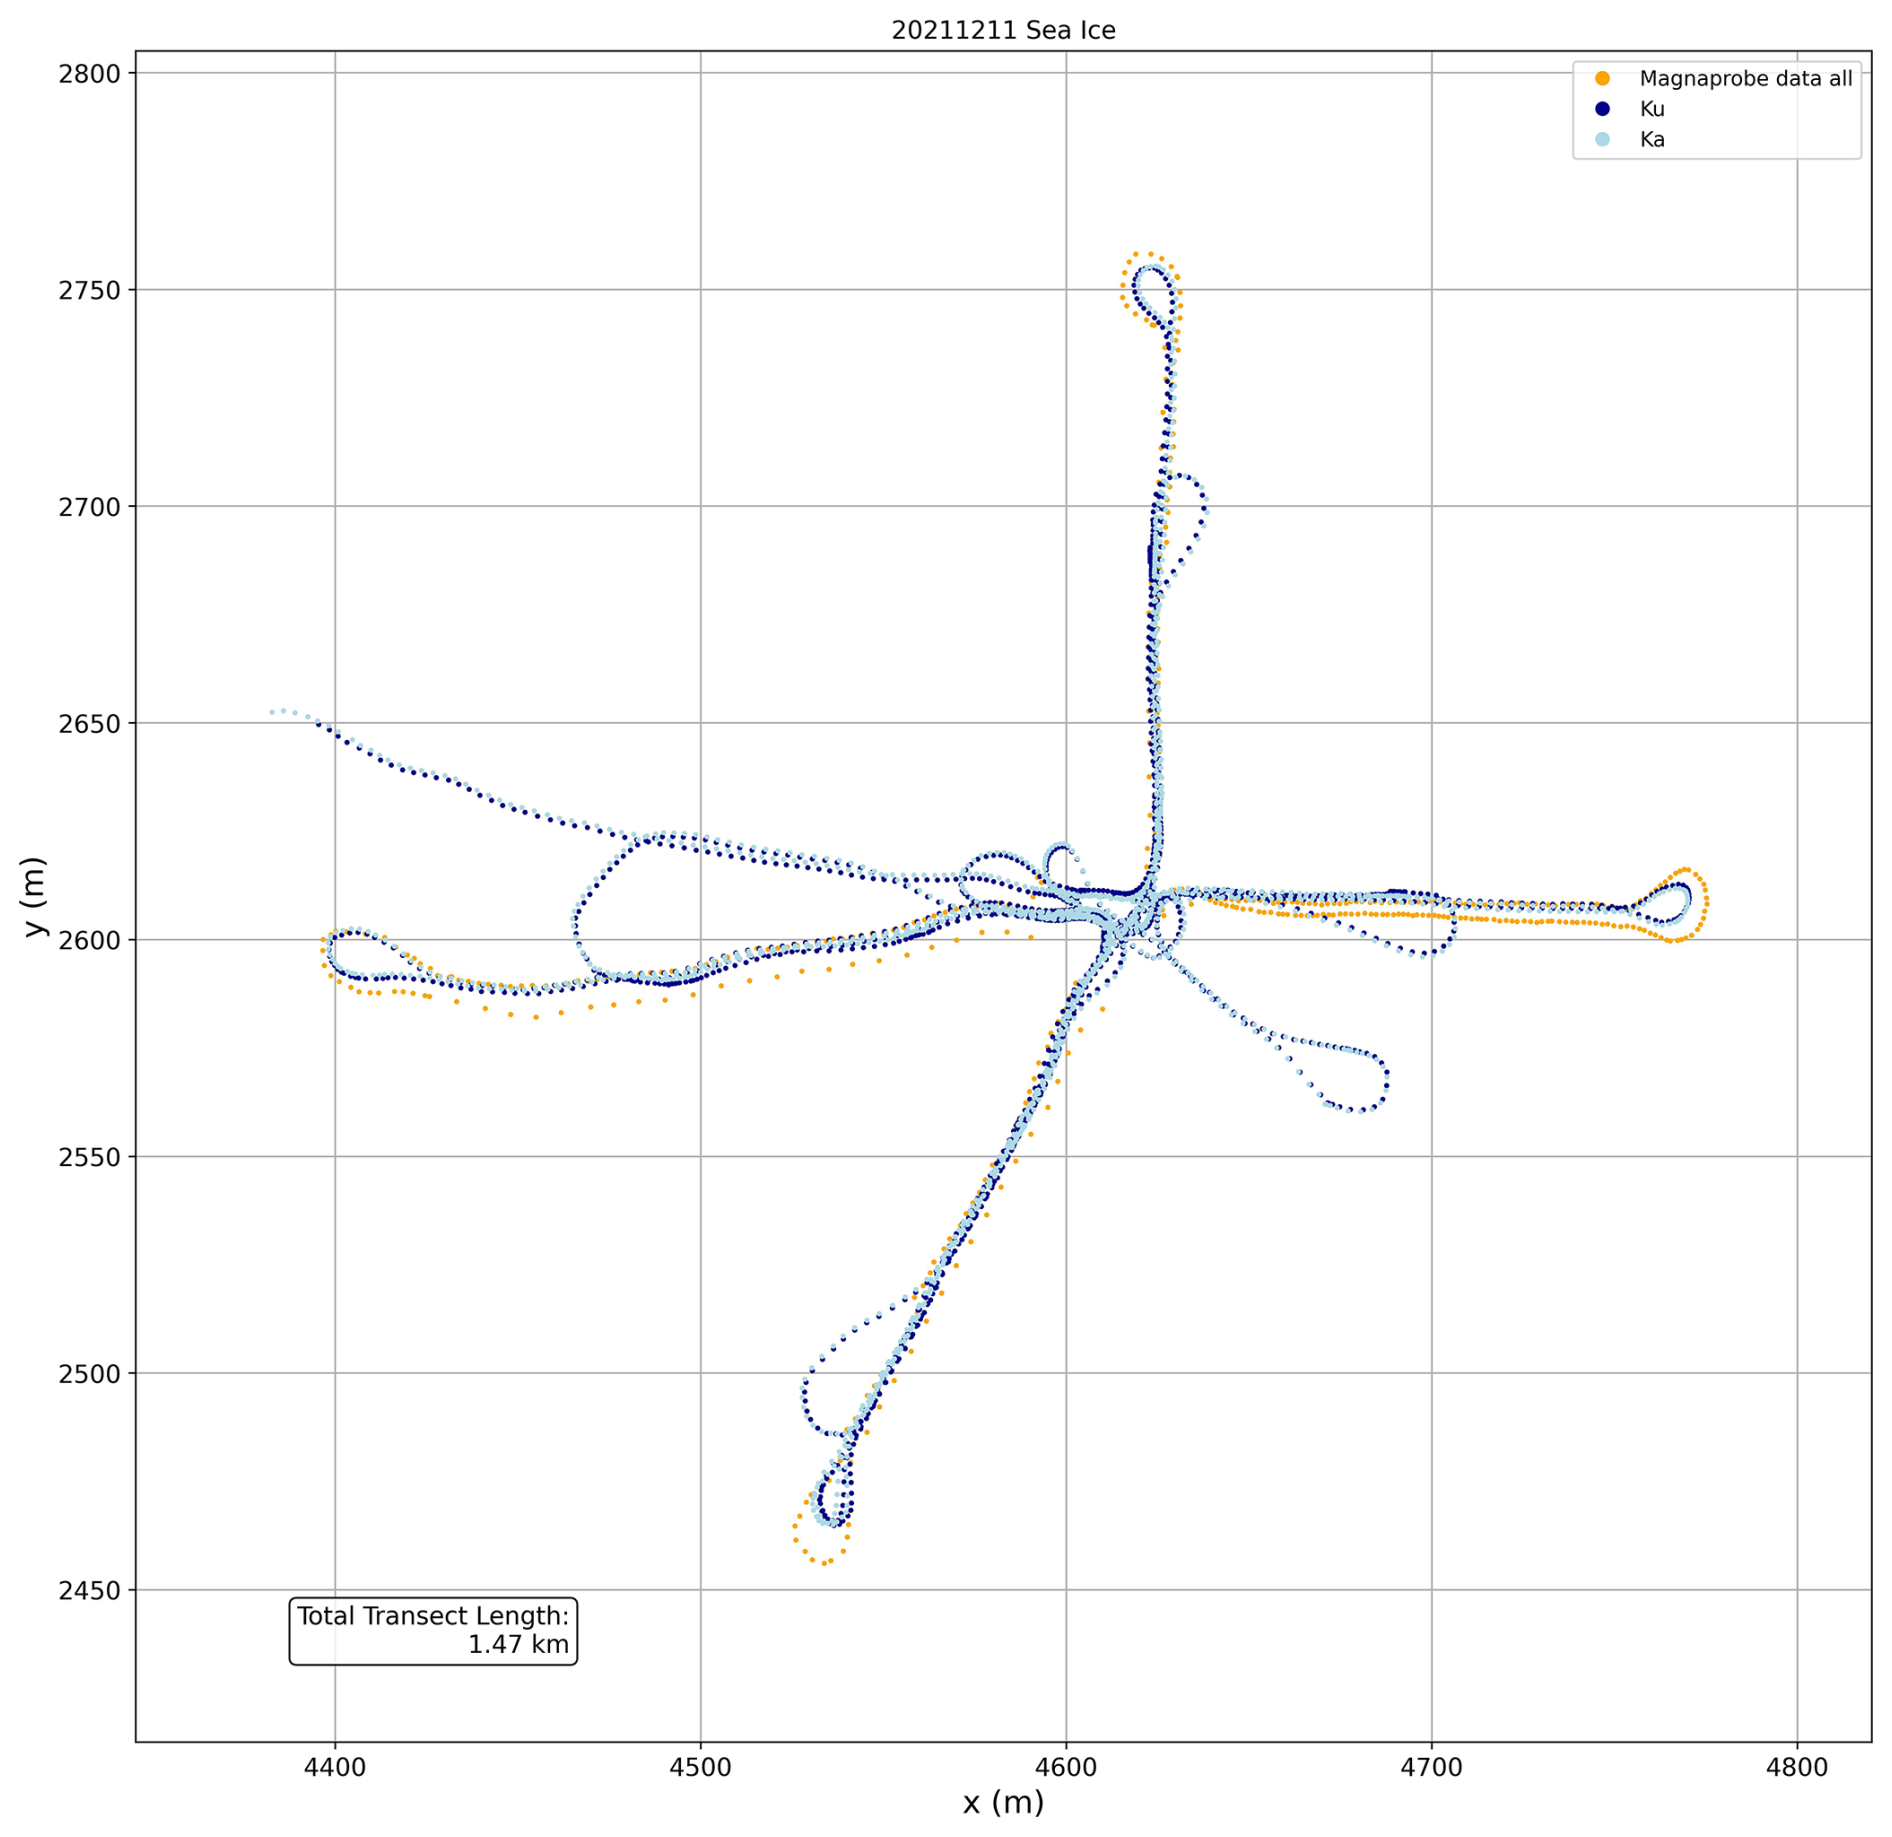
Figure A6Overview of KuKa transects for each radar wavelength along with MagnaProbe snow depths the landfast ice location in Churchill. The total transect length is also provided.
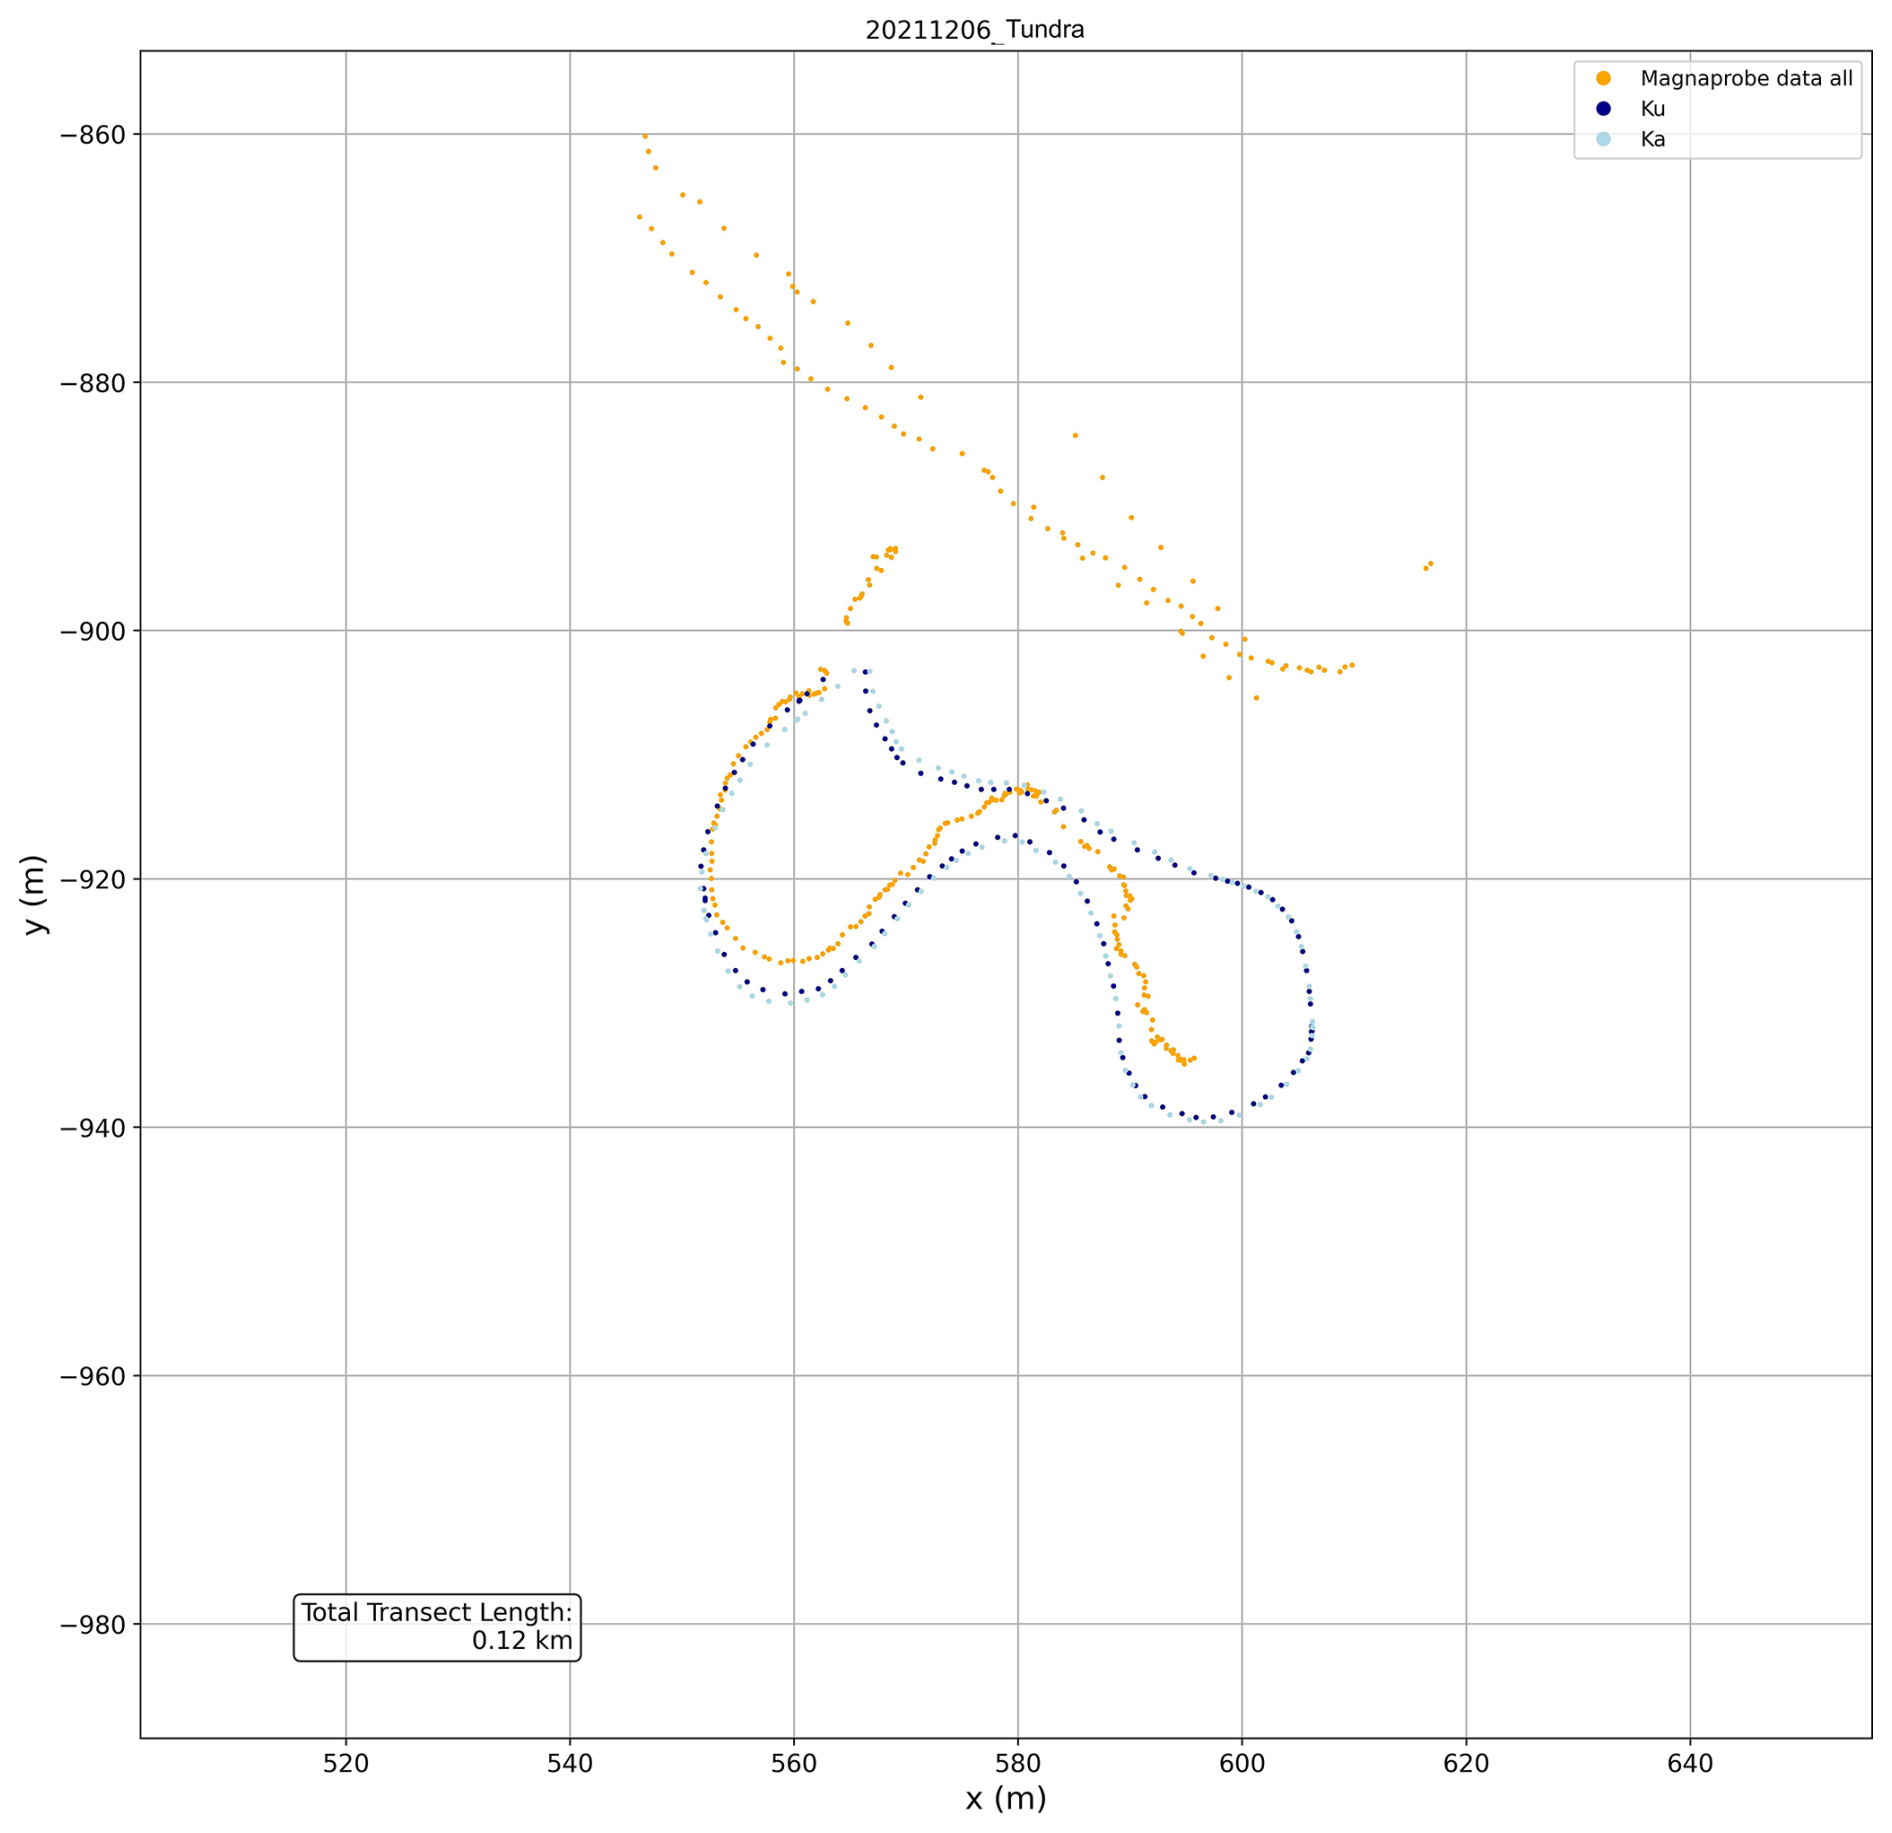
Figure A7Same as in Fig. A6 but for the tundra region in Churchill. The total transect length is also provided.
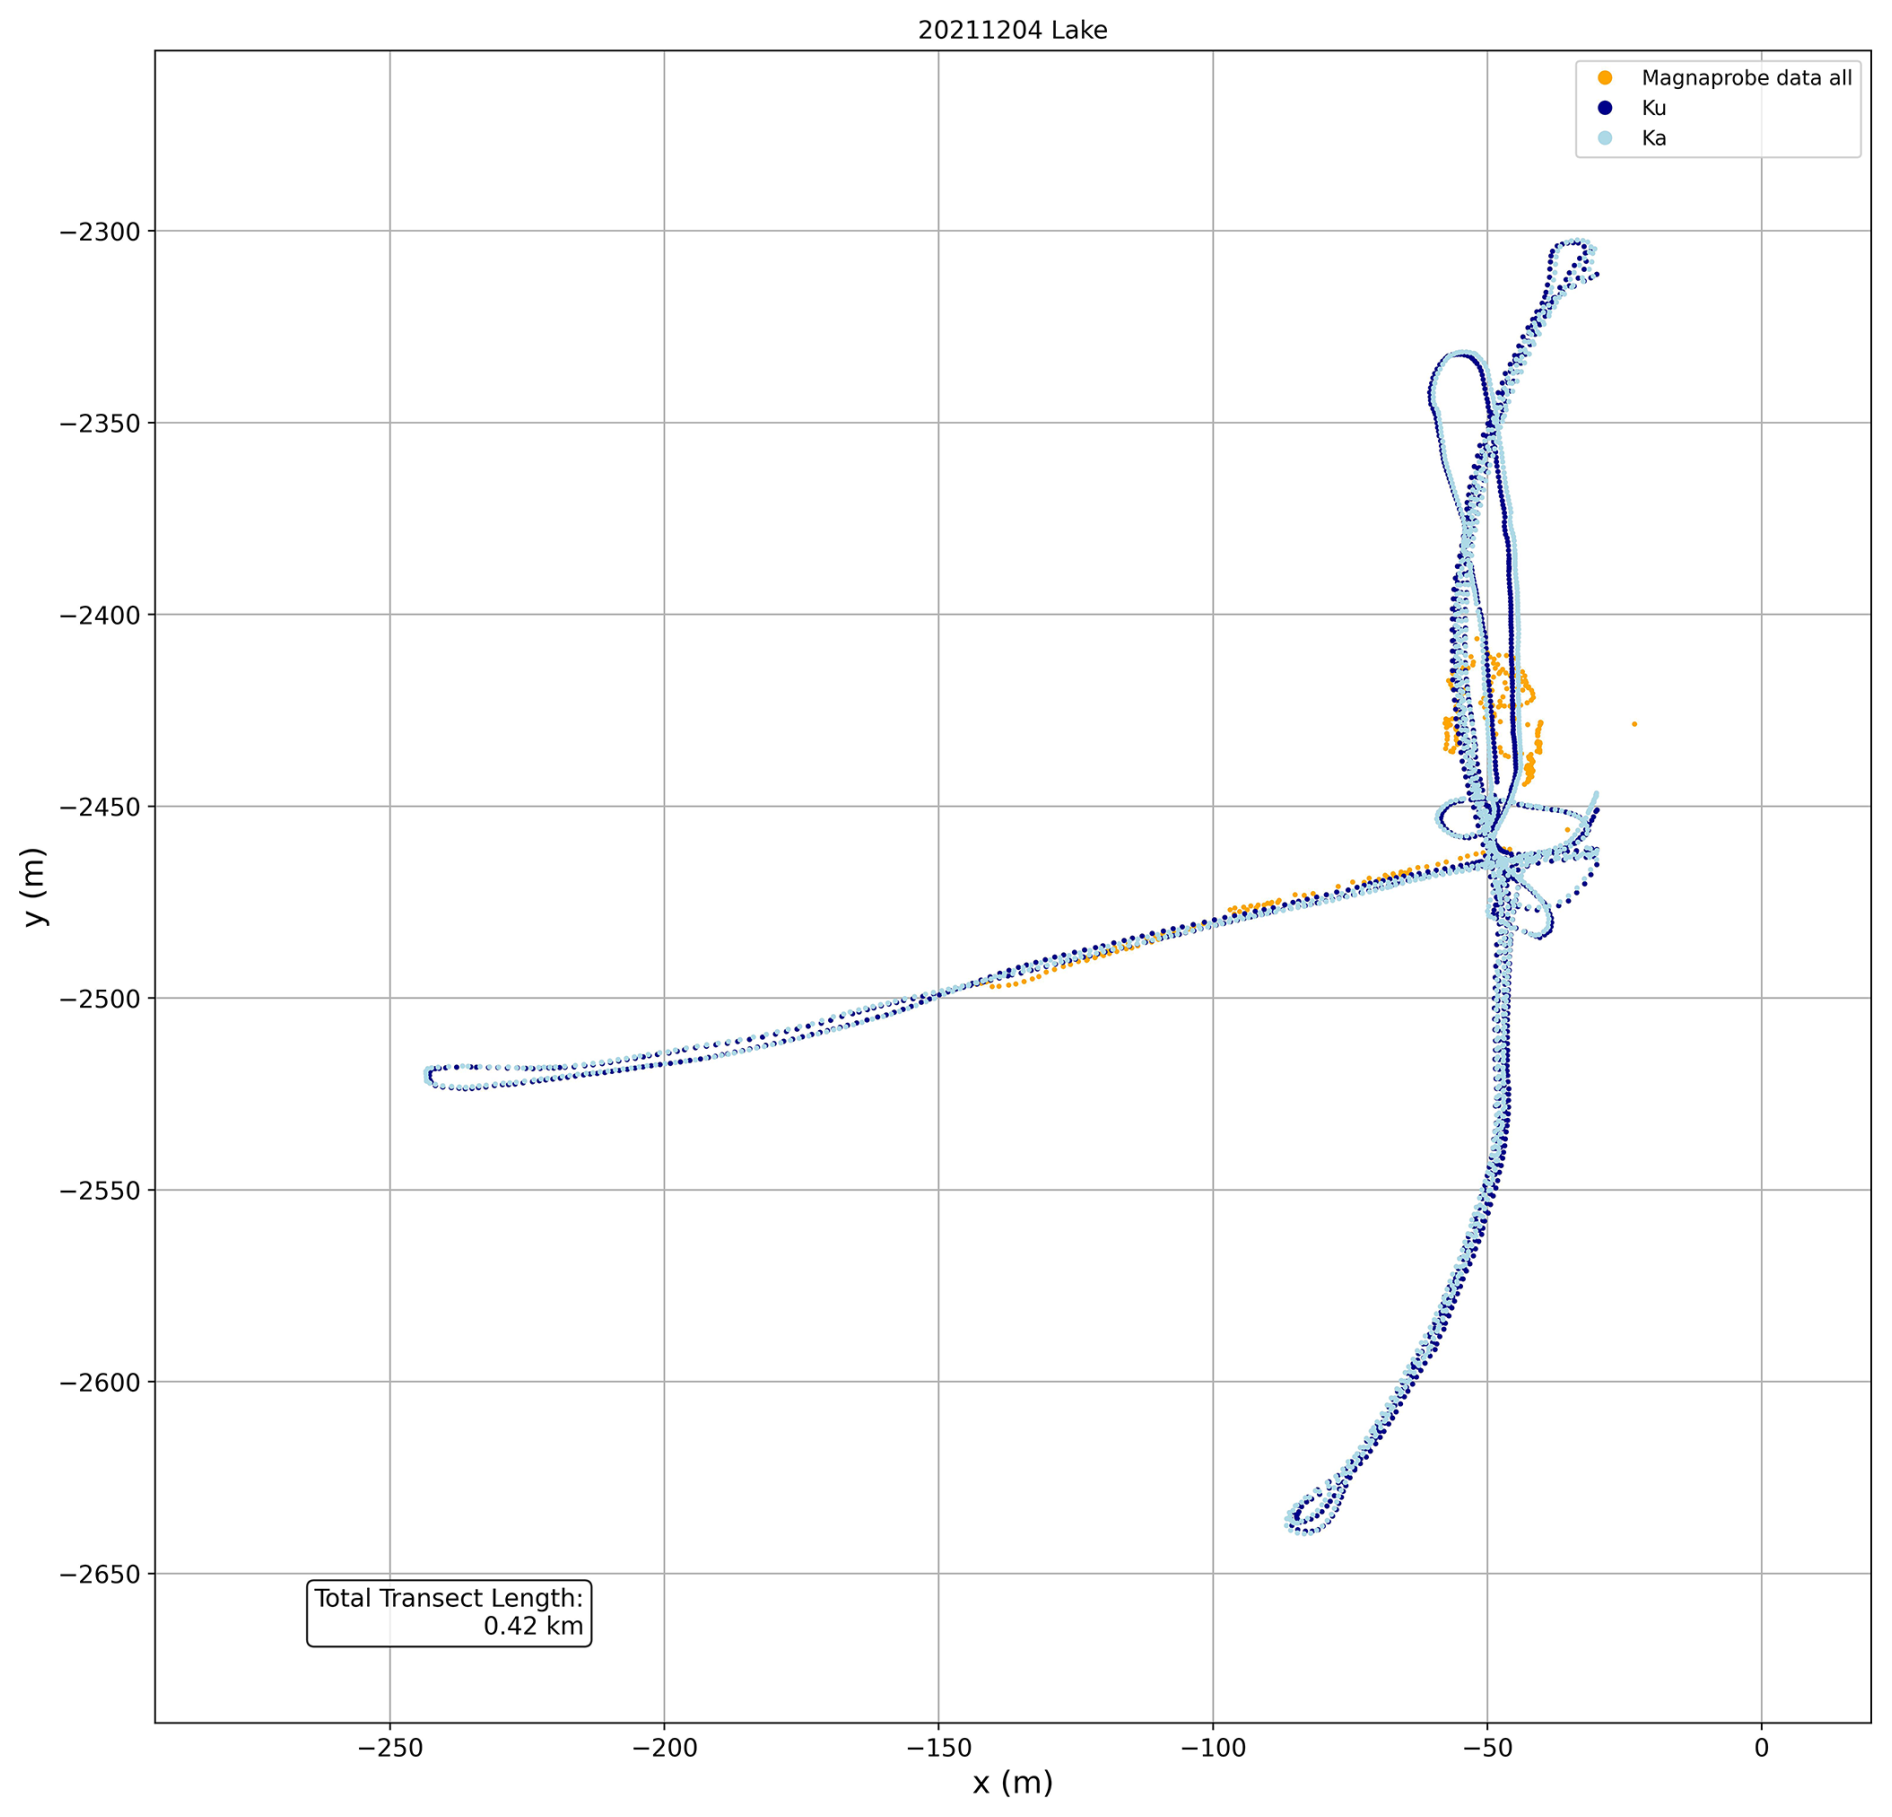
Figure A8Same as in Fig. A6 but for the tundra region in Churchill. The total transect length is also provided.
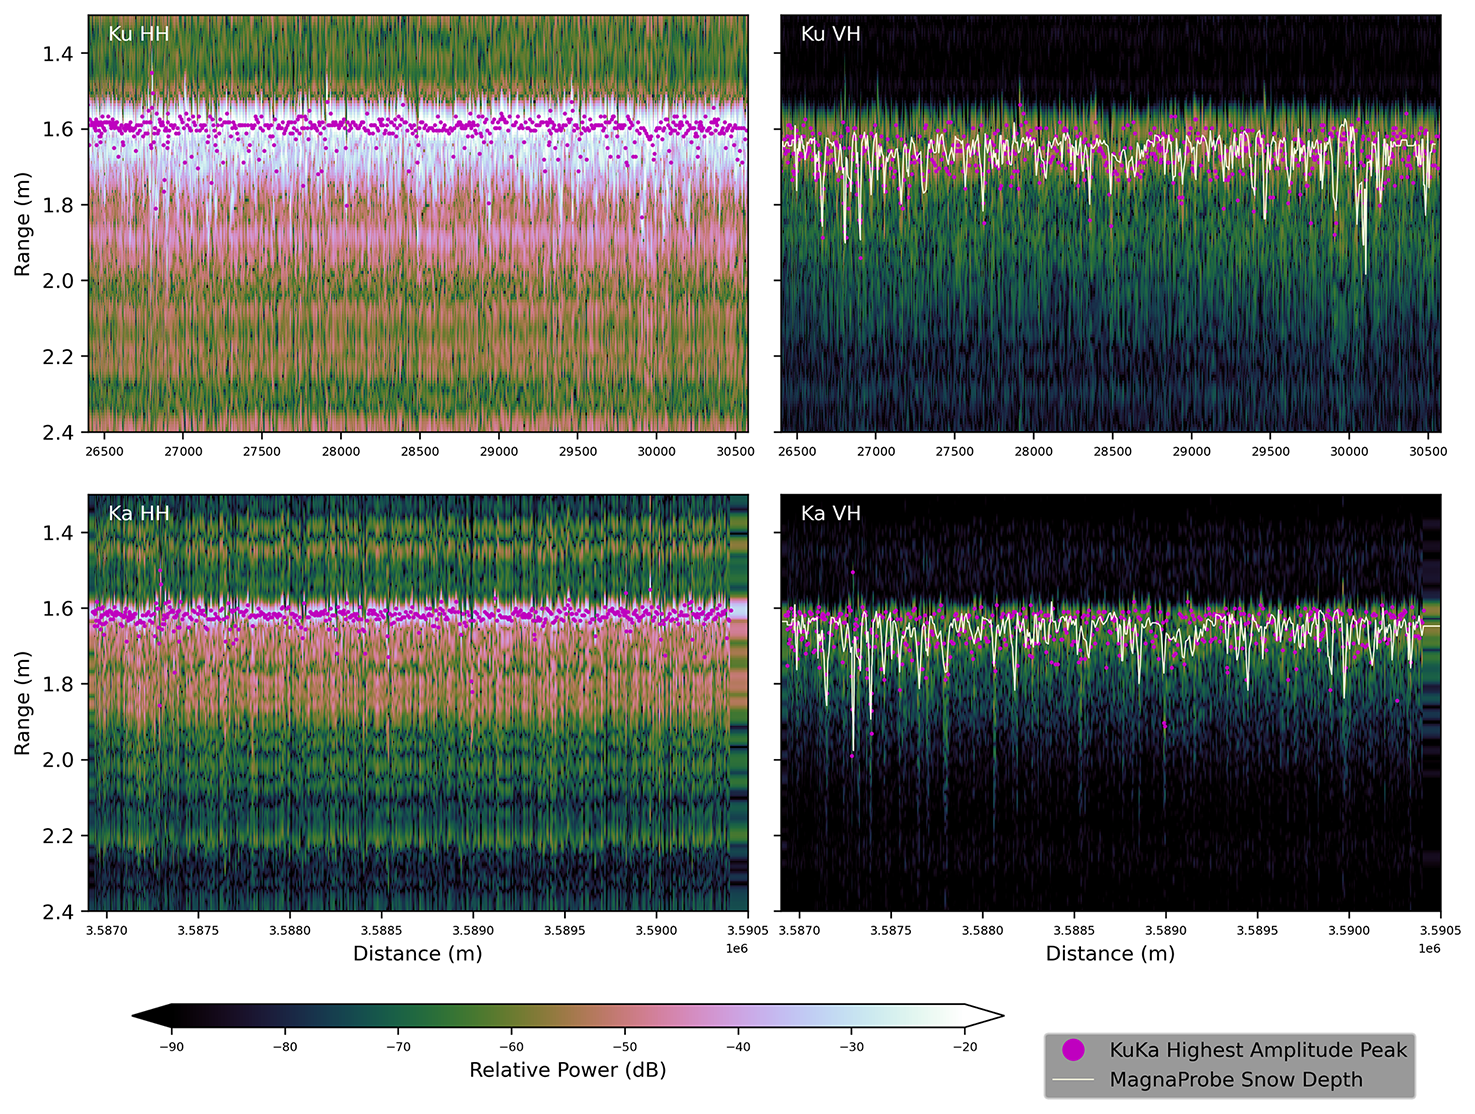
Figure A9Echograms at Ku- (left) and Ka-band (right) from 6 April 2025 over the second Resolute landfast sea ice location. Shown are the full bandwidth data for HH and VH-polarizations. Magenta markers indicate where the highest amplitude peak occurs in each radar waveform. Yellow lines indicate MagnaProbe snow depths overlaid on the VH data; MagnaProbe depths were divided by c′ to scale them to account for the reduced speed of radar wave propagation in the snow pack.
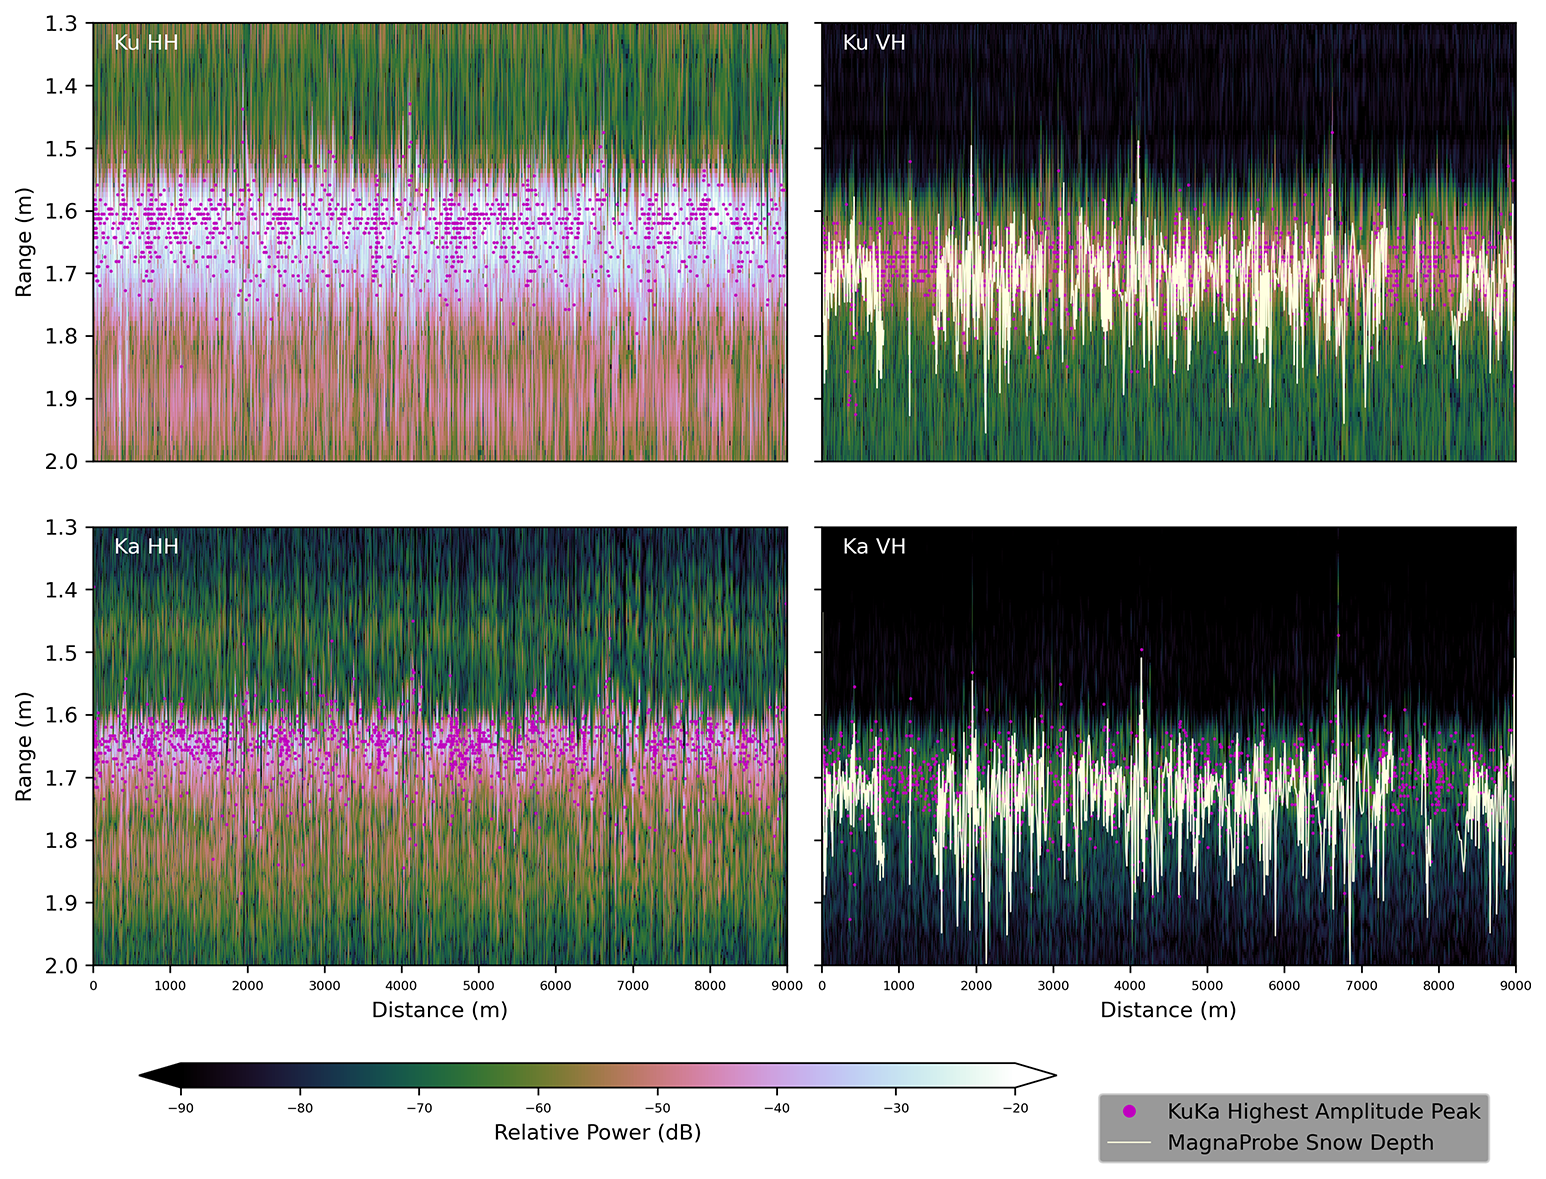
Figure A10KuKa data echograms from 11 December 2021 over landfast sea ice. Shown are the Ku- and Ka-band (top and bottom panels) full bandwidth, HH- and VH-polarized (left and right panels) waveforms. Magenta markers indicate where the highest amplitude peak occurs in each radar waveform. Light yellow lines indicate MagnaProbe snow depths overlaid on the VH data; MagnaProbe depths were divided by c′ to scale them to account for the reduced speed of radar wave propagation in the snow pack.
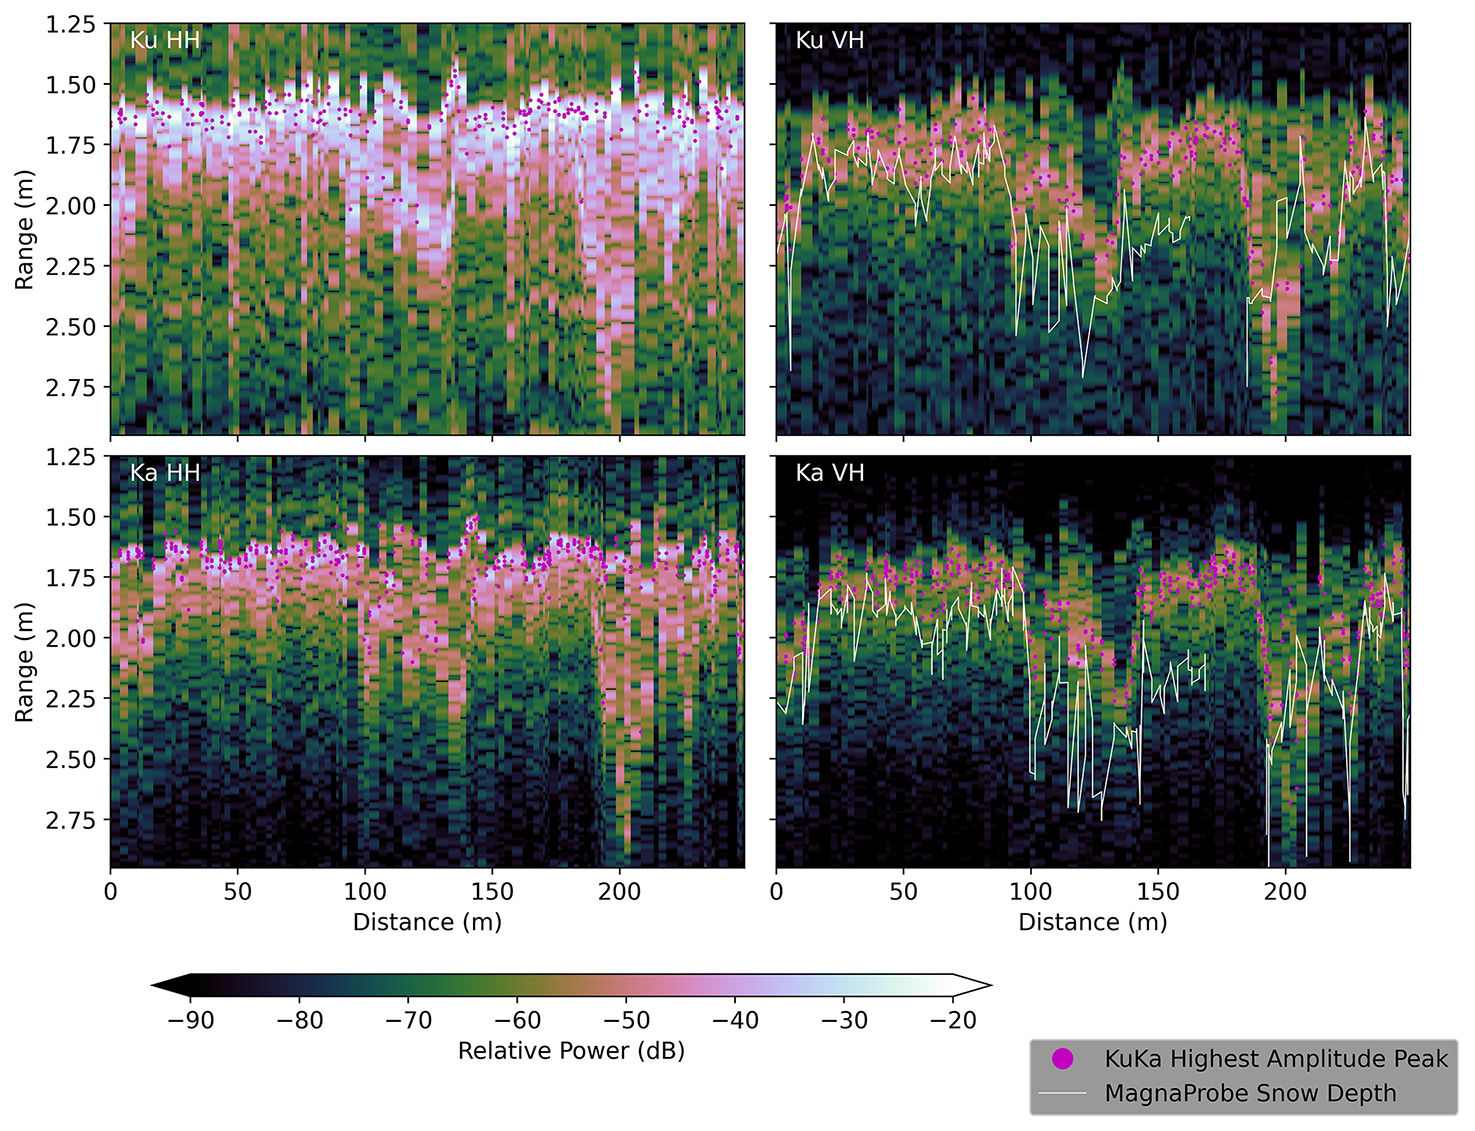
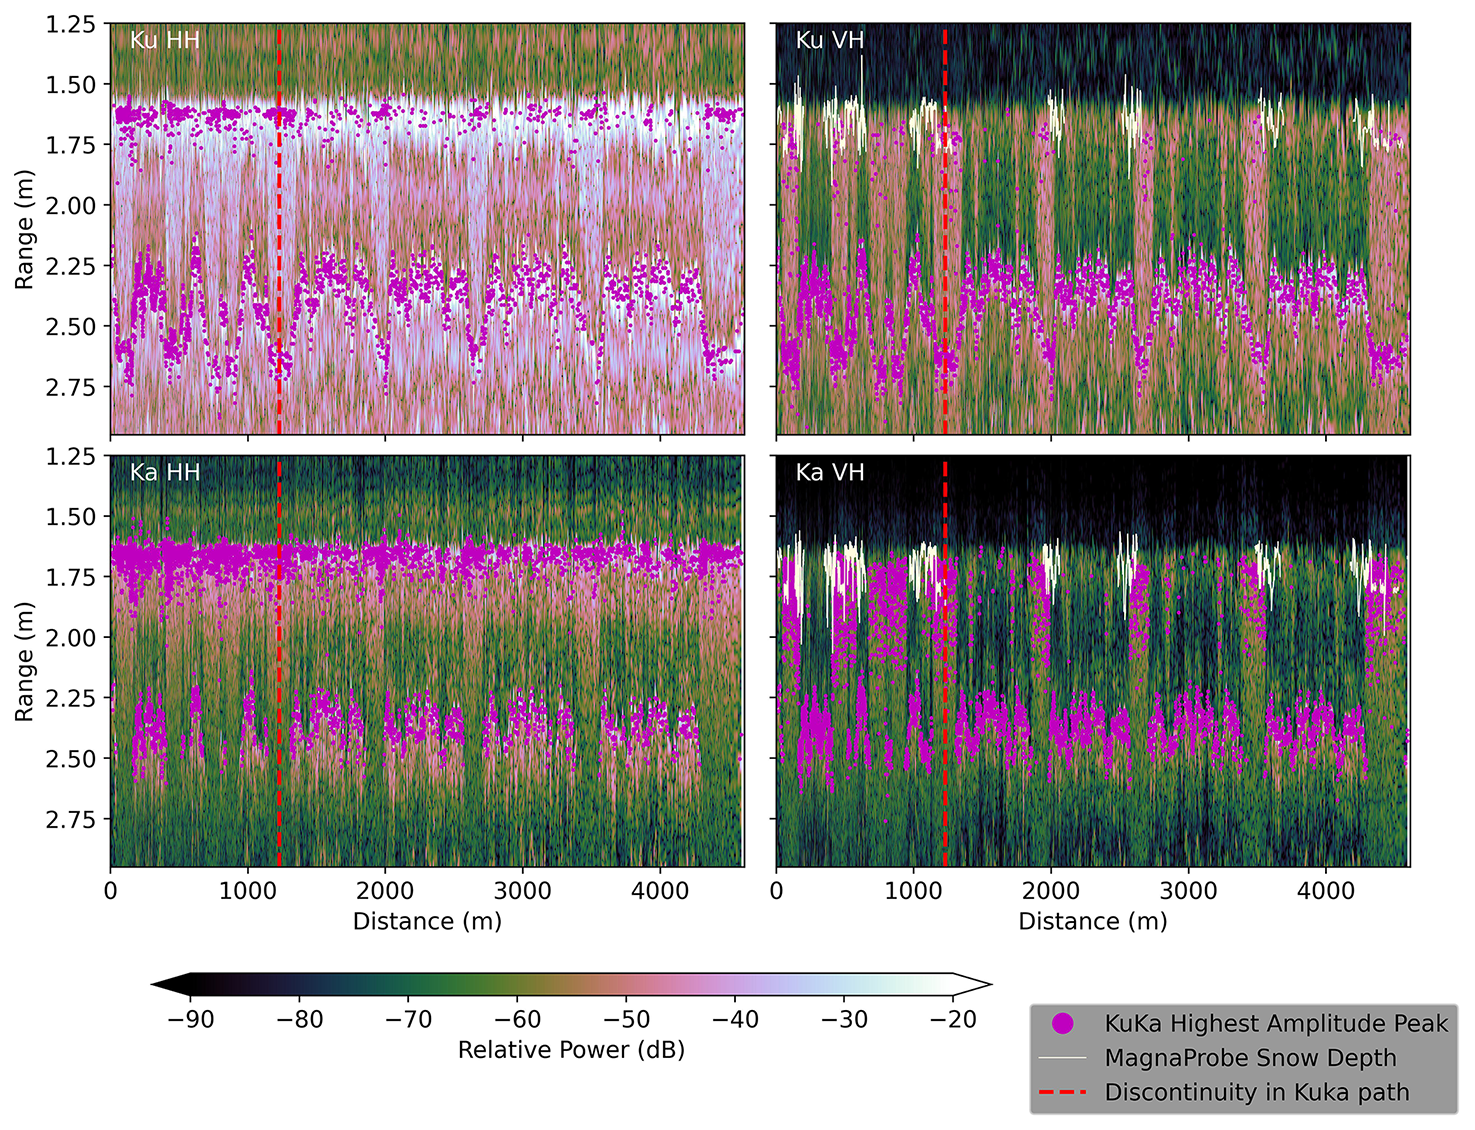
Figure A12Same as Fig. A10 but for Lake ice on 4 December 2021. For this case, the HH polarization maximum is not consistently found at the air-snow interface, therefore the air-snow threshold value as defined in Table 2 was used for the plotting of this echogram.
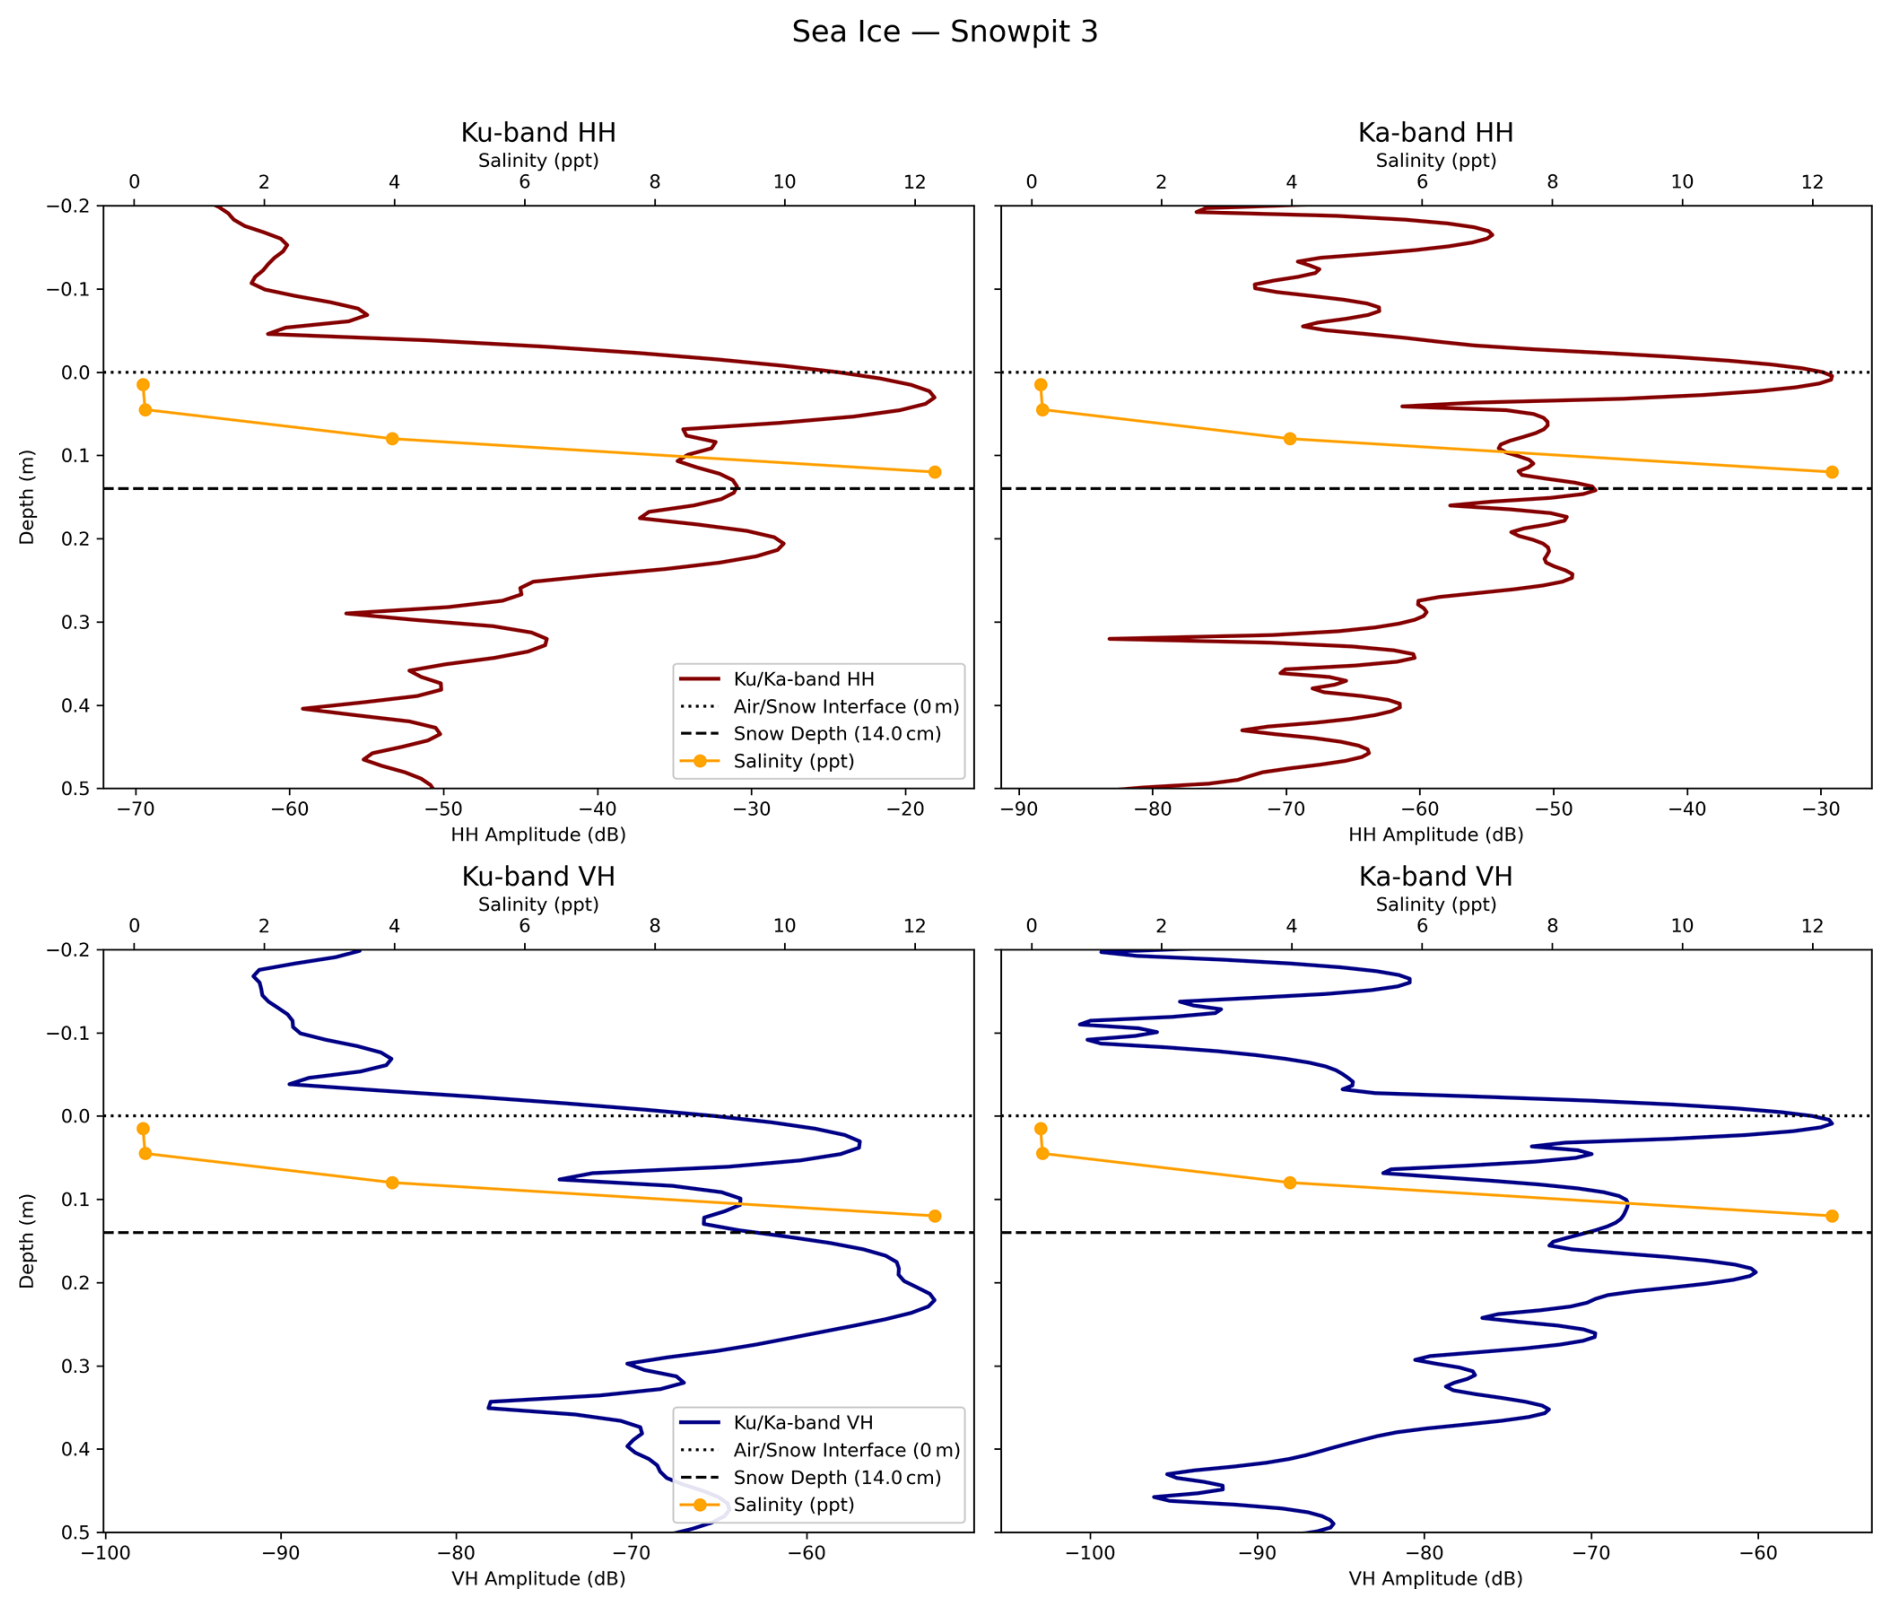
Figure A13Waveforms from the 3rd snow pit collected on 2 April 2025 highlighting there is a slight shift away from the air/snow interface at both frequencies and polarizations and the VH signal appears aligned with the high salinity at the base. Plotted with the Ku-band (red) and Ka-band (blue) HH and VH waveforms in dB is the salinity profile measured at 3 cm intervals. Results are shown as the average for the 5 closest waveforms to the snow pit location.
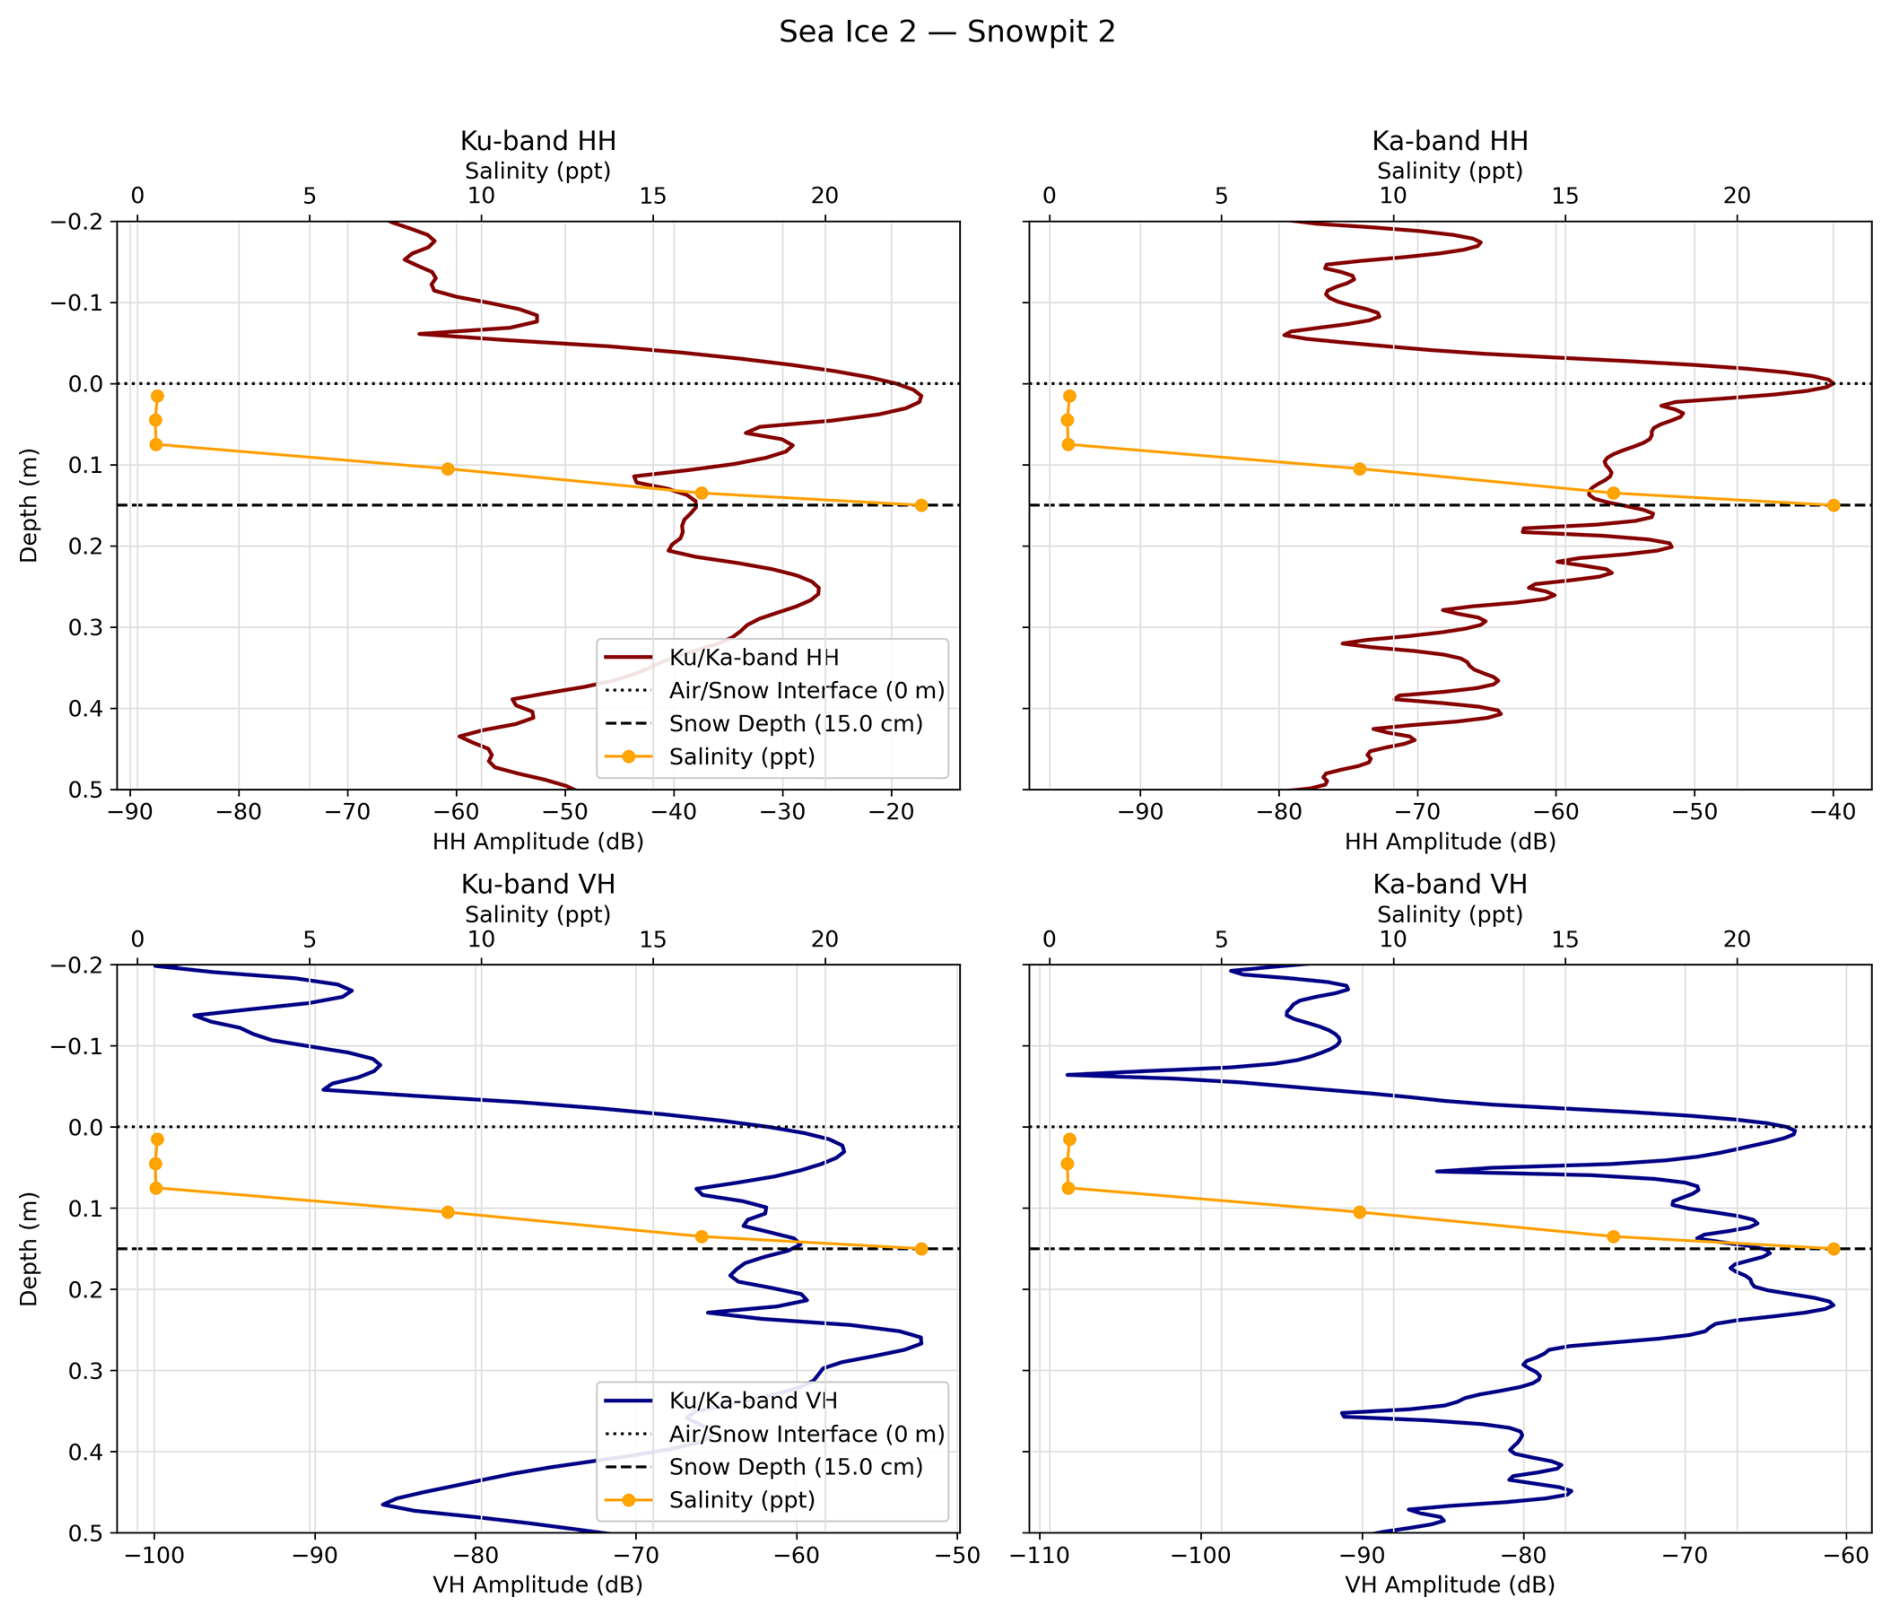
Figure A14Waveforms from the 2nd snow pit collected on 6 April 2025 showing at Ka-band the first peak remains at the snow/air interface at HH and VH but at Ku-band it is slightly shifted downwards. As in Fig. A13, Ku-band is plotted in red and Ka-band in blue for both HH and VH waveforms in dB; salinity profile measured at 3 cm intervals. Again results are shown as the average for the 5 closest waveforms to the snow pit location.
All KuKa, magnaprobe and snowpit data are available through the University of Manitoba CanWin data portal: https://canwin-datahub.ad.umanitoba.ca/ (last access: 29 July 2026) with the Churchill campaign here: https://doi.org/10.34992/11tj-wr82 (Stroeve et al., 2023) and the Resolute campaign here: https://doi.org/10.34992/ep9a-xt58 (Stroeve, 2025). Python scripts can be found here: https://github.com/madeleine-downie/Kuka-Arctic-Snow-Depths(last access: 29 July 2026).
J.S. funded the project, participated in both field campaigns, processed the data, interpreted results and wrote the manuscript. R.W. participated in both field campaigns, produced the original polarimetric snow depth retrieval algorithm and supervised M.D. to develop the alternative peak picker. M.D. developed new techniques for snow and ice depth retrieval over lake ice. M.S., C.N., A.F., R.M., V.N., T.N. and J.Y. participated in field campaigns and data collection and reviewed the manuscript. M.S. further processed data as part of his master's thesis. C.N. processed the SMP data. C.S. processed the dielectrics and contributed to feedback on the manuscript along with R.M. and J.Y. A.K. provided insights into tundra snowpacks, whereas J.L. provided the initial framework of winter roads.
At least one of the (co-)authors is a member of the editorial board of The Cryosphere. The peer-review process was guided by an independent editor, and the authors also have no other competing interests to declare.
Publisher's note: Copernicus Publications remains neutral with regard to jurisdictional claims made in the text, published maps, institutional affiliations, or any other geographical representation in this paper. The authors bear the ultimate responsibility for providing appropriate place names. Views expressed in the text are those of the authors and do not necessarily reflect the views of the publisher.
This work was funded under the Canada 150 Research Chairs program (grant no. 50296), the European Space Agency NEOMI (grant no. 4000139243/22/NL/SD) and CRISTAL LEVel-2 processor prototype Sea Ice and Iceberg (CLEV2ER) project (grant no. AO/1-11448/22/I-AG). JS, CN and RW acknowledge support from the Horizon 2020 CRiceS grant (grant no. 101003826). JS and RW acknowledge support from the NERC DEFIANT grant (grant no. NE/W004712/1). AF was supported by the Natural Environment Research Council (grant no. NE/S007229/1). AF and MD were additionally supported by the NERC DEFIANT Grant (grant no. NE/W004712/1) through JS and RW. During the Churchill campaign RM was supported by the London NERC Doctoral Training Partnership (grant no. NE/L002485/1).
The article processing charges for this open-access publication were covered by the University of Bremen.
This paper was edited by Qinghua Yang and reviewed by three anonymous referees.
Abele, G.: Snow Roads and Runways, Cold Regions Research and Engineering Laboratory (CRREL), Monograph 90-3 (ADA231490), 1990.
Brown, L. C. and Duguay, C. R.: The response and role of ice cover in lake-climate interactions, Prog. Phys. Geog., 34, 671–704, https://doi.org/10.1177/0309133310375653, 2010.
Cruickshank, J. G.: Soils and Terrain Units Around Resolute, Cornwallis Island, Arctic, 24, 195–209, 1971.
Derksen, C., King, J., Belair, S., Garnaud, C., Vionnet, V., Fortin, V., Lemmetyinen, J., Crevier, Y., Plourde, P., Lawrence, B., and van Mierlo, H.: Development of the terrestrial snow mass mission, Int. Geosci. Remote Se., 614–617, 2021.
Dodonov, P. and Harper, K. A.: Spatial patterns of structural diversity across the boreal forest-tundra ecotone in Churchill, Canada, Acta Oecol., 117, 103862, https://doi.org/10.1016/j.actao.2022.103862, 2022.
Dong, Y., Xiao, P., Zhang, X., Ge, D., Yu, J., Chen, Y., Wu, Q., Ma, Y., Liu, R., Luan, W., Liu, H., and Bai, J.: Increased vulnerability of Arctic potential ice roads under climate change, Commun. Earth Environ., 6, 37, https://doi.org/10.1038/s43247-025-02011-y, 2025.
Drinkwater M. R. and Crocker, G. B.: Modelling Changes in Scattering Properties of the Dielectric and Young Snow-Covered Sea Ice at GHz Frequencies, J. Glaciolo., 34, 274–282, https://doi.org/10.3189/S0022143000007012, 1988.
Dutch, V. R., Rutter, N., Wake, L., Sandells, M., Derksen, C., Walker, B., Hould Gosselin, G., Sonnentag, O., Essery, R., Kelly, R., Marsh, P., King, J., and Boike, J.: Impact of measured and simulated tundra snowpack properties on heat transfer, The Cryosphere, 16, 4201–4222, https://doi.org/10.5194/tc-16-4201-2022, 2022.
Fatolahzadeh Gheysari, A., and Maghoul, P. A.: Framework to assess permafrost thaw threat for land transportation infrastructure in northern Canada, Commun. Earth. Environ., 5, 167, https://doi.org/10.1038/s43247-024-01317-7, 2024.
Frankenstein, G. and Garner, R.: Equations for Determining the Brine Volume of Sea Ice from −0.5 ° to −22.9 °C, J. Glaciolo., 6, 943–944, https://doi.org/10.3189/S0022143000020244, 1967.
Fredensborg Hansen, R. M., Skourup, H., Rinne, E., Jutila, A., Lawrence, I. R., Shepherd, A., Høyland, K. V., Li, J., Rodriguez-Morales, F., Simonsen, S. B., Wilkinson, J., Veyssiere, G., Yi, D., Forsberg, R., and Casal, T. G. D.: Multi-frequency altimetry snow depth estimates over heterogeneous snow-covered Antarctic summer sea ice – Part 1: C∕S-, Ku-, and Ka-band airborne observations, The Cryosphere, 19, 4167–4192, https://doi.org/10.5194/tc-19-4167-2025, 2025.
Geldsetzer, T., Langlois, A., and Yackel, J. J.: Dielectric properties of brine-wetted snow on first-year sea ice, Cold Reg. Sci. Technol., 58, 47–56, https://doi.org/10.1016/j.coldregions.2009.03.009, 2009.
Gold, L. W.: Use of ice covers for transportation, Can. Geotech. J., 8, 170–181, https://doi.org/10.1139/t71-018, 1971.
Guerreiro, K., Fleury, S., Zakharova, E., Rémy, F., and Kouraev, A.: Potential for estimation of snow depth on Arctic sea ice from CryoSat-2 and SARAL/AltiKa missions, Rem. Sens. Environ., 186, 339–349, 2016.
Hallikainen, M., Ulaby, F., and Abdelrazik, M.: Dielectric properties of snow in the 3 to 37 GHz range, IEEE T. Antenn. Propag., 34, 1329–1340, https://doi.org/10.1109/TAP.1986.1143757, 1986.
Huang, S., Willatt, R., Fallows, A., Murphy, M., Lyu, M., Mallett, R., Nandan, V., Mitchell, T., and Stroeve, J.: Salt transport in artificial snow on sea ice: laboratory experiments, Environmental Research Communications, 7, 125022, https://doi.org/10.1088/2515-7620/ae25c3, 2025.
Inman, H. F. and Bradley, E. L.: The overlapping coefficient as a measure of agreement between probability distributions and point estimation of the overlap of two normal densities, Commun. Stat.-Theor., 18, 3851–3874, https://doi.org/10.1080/03610928908830127, 1989.
Kern, M., Cullen, R., Berruti, B., Bouffard, J., Casal, T., Drinkwater, M. R., Gabriele, A., Lecuyot, A., Ludwig, M., Midthassel, R., Navas Traver, I., Parrinello, T., Ressler, G., Andersson, E., Martin-Puig, C., Andersen, O., Bartsch, A., Farrell, S., Fleury, S., Gascoin, S., Guillot, A., Humbert, A., Rinne, E., Shepherd, A., van den Broeke, M. R., and Yackel, J.: The Copernicus Polar Ice and Snow Topography Altimeter (CRISTAL) high-priority candidate mission, The Cryosphere, 14, 2235–2251, https://doi.org/10.5194/tc-14-2235-2020, 2020.
King, J., Howell, S., Brady, M., Toose, P., Derksen, C., Haas, C., and Beckers, J.: Local-scale variability of snow density on Arctic sea ice, The Cryosphere, 14, 4323–4339, https://doi.org/10.5194/tc-14-4323-2020, 2020.
Kirillov, S., Babb, D., Dmitrenko, I., Landy, J., Lukovich, J., Ehn, J., Sydor, K., Barber, D., and Stroeve, J.: Atmospheric Forcing Drives the Winter Sea Ice Thickness Asymmetry of Hudson Bay, J. Geophys. Res.-Oceans, 125, e2019JC015756, https://doi.org/10.1029/2019JC015756, 2020.
Klein, L. and Swift, C.: An improved model for the dielectric constant of sea water at microwave frequencies, IEEE T. Antenn. Propag., 25, 104–111, https://https://doi.org/10.1109/TAP.1977.1141539, 1977.
Kuzyk, Z. A., Macdonald, R. W., Granskog, M. A., Scharien, R. K., Galley, R. J., Michel, C., Barber, D., and Stern, G.: Sea ice, hydrological, and biological processes in the Churchill River estuary region, Hudson Bay, Estuar. Coast. Shelf S., 77, 369–384, https://doi.org/10.1016/j.ecss.2007.09.030, 2008.
Kwok, R., Kacimi, S., Webster, M. A., Kurtz, N. T., and Petty, A. A.: Arctic snow depth and sea ice thickness from ICESat-2 and CryoSat-2 freeboards: A first examination, J. Geophys. Res.-Oceans, 125, e2019JC016008, https://doi.org/10.1029/2019JC016008, 2020.
Landy, J. C., Petty, A. A., Tsamados, M., and Stroeve, J. C.: Sea ice roughness overlooked as a key source of uncertainty in CryoSat-2 ice freeboard retrievals, J. Geophys. Res.-Oceans, 125, e2019JC015820, https://doi.org/10.1029/2019JC015820, 2020.
Landy, J. C., de Rijke-Thomas, C., Nab, C., Lawrence, I., Glissenaar, I. A., Mallett, R. D. C., Fredensborg Hansen, R. M., Petty, A., Tsamados, M., Macfarlane, A. R., and Braakmann-Folgmann, A.: Anticipating CRISTAL: an exploration of multi-frequency satellite altimeter snow depth estimates over Arctic sea ice, 2018–2023, The Cryosphere, 20, 183–208, https://doi.org/10.5194/tc-20-183-2026, 2026.
Lawrence, I. R., Tsamados, M. C., Stroeve, J. C., Armitage, T. W. K., and Ridout, A. L.: Estimating snow depth over Arctic sea ice from calibrated dual-frequency radar freeboards, The Cryosphere, 12, 3551–3564, https://doi.org/10.5194/tc-12-3551-2018, 2018.
Laxon, S., Peacock, N., and Smith, D.: High interannual variability of sea ice thickness in the Arctic region, Nature, 425, 947–950, 2003.
Mallett, R., Nandan, V., Stroeve, J., Willatt, R., Saha, M., Yackel, J., Veysière, G., and Wilkinson, J.: Dye tracing of upward brine migration in snow, Ann. Glaciol., 65, e26, https://doi.org/10.1017/aog.2024.27, 2024.
Mangilli, A., Duguay, C. R., Murfitt, J., Moreau, T., Amraoui, S., Mugunthan, J. S., Thibaut, P., and Donlon, C.: Improving the Estimation of Lake Ice Thickness with High-Resolution Radar Altimetry Data, Remote Sens., 16, 2510, https://doi.org/10.3390/rs16142510, 2024.
Marshall, H. P., Storms, S., Deeb, E., Forster, R., Vuyovich, C., Elder, K., Durand, M., and Hiemstra, C.: Using Phase-Delay Approaches to Estimate Snow Properties: A Comparison of Airborne L-Band InSAR and Ground-Based 6-18 GHz FMCW Radar Observations During the NASA SnowEx 2020 Grand Mesa Campaign, IGARSS 2023–2023 IEEE Int. Geosc. Remote Se., Pasadena, CA, USA, 2023, 848–851, https://doi.org/10.1109/IGARSS52108.2023.10281420, 2023.
Massey Jr., F. J.: The Kolmogorov-Smirnov test for goodness of fit, J. Am. Stat. Assoc., 46, 68–78, https://doi.org/10.2307/2280095, 1951.
Mätzler, C: Microwave permittivity of dry snow, IEEE T. Geosci. Remote, 34, 573–581, https://doi.org/10.1109/36.485133, 1996.
Michel, B.: Ice Mechanics, Les Presses de l'Université Laval, Quebec, 449 pp., ISBN 10: 0774668768, ISBN 13: 9780774668767, 1978.
Murfitt, J., Duguay, C., Picard, G., and Gunn, G.: Investigating the Effect of Lake Ice Properties on Multifrequency Backscatter Using the Snow Microwave Radiative Transfer Model, IEEE T. Geosci. Remote, 60, 1–23, https://doi.org/10.1109/TGRS.2022.3197109, 2022.
Nandan, V., Geldsetzer, T., Islam, T., Yackel, J. J., Gill, J. P., Fuller, M. C., Gunn, G., and Duguay, C.: Ku-, X-and C-band measured and modeled microwave backscatter from a highly saline snow cover on first-year sea ice, Rem. Sens. Environ., 187, 62–75, 2016.
Nandan, V., Geldsetzer, T., Yackel, J., Mahmud, M., Scharien, R., Howell, S., King, J., Ricker, R., and Else, B.: Effect of Snow Salinity on CryoSat-2 Arctic First-Year Sea Ice Freeboard Measurements, Geophys. Res. Lett., 44, 10419–10426, https://doi.org/10.1002/2017GL074506, 2017.
Nandan, V., Willatt, R., Mallett, R., Stroeve, J., Geldsetzer, T., Scharien, R., Tonboe, R., Yackel, J., Landy, J., Clemens-Sewall, D., Jutila, A., Wagner, D. N., Krampe, D., Huntemann, M., Mahmud, M., Jensen, D., Newman, T., Hendricks, S., Spreen, G., Macfarlane, A., Schneebeli, M., Mead, J., Ricker, R., Gallagher, M., Duguay, C., Raphael, I., Polashenski, C., Tsamados, M., Matero, I., and Hoppmann, M.: Wind redistribution of snow impacts the Ka- and Ku-band radar signatures of Arctic sea ice, The Cryosphere, 17, 2211–2229, https://doi.org/10.5194/tc-17-2211-2023, 2023.
Newman, T., Stroeve, J., Nandan, V., Willatt, R., Mead, J., Mallett, R., Tsamados, M., Huntemann, M., Hendricks, S., Spreen, G., and Tonboe, R.: A Practical Approach to FMCW Radar Deconvolution in the Sea Ice Domain, IEEE Access, https://doi.org/10.1109/ACCESS.2024.3502502, 2024.
O'Neill, B. H. and Burn, C. R.: Impacts of variations in snow cover on permafrost stability, including simulated snow management, Dempster Highway, Peel Plateau, Northwest Territories, Arctic Science, 3, 150–178, https://doi.org/10.1139/as-2016-0036, 2017.
Ricker, R., Hendricks, S., Helm, V., Skourup, H., and Davidson, M.: Sensitivity of CryoSat-2 Arctic sea-ice freeboard and thickness on radar-waveform interpretation, The Cryosphere, 8, 1607–1622, https://doi.org/10.5194/tc-8-1607-2014, 2014.
Stogryn, A., and Desargant, G.: The dielectric properties of brine in sea ice at microwave frequencies, IEEE T. Antenn. Propag., 33, 523–532, https://doi.org/10.1109/TAP.1985.1143610, 1985.
Stroeve, J.: KuKa Resolute Data – April 2025, CanWIN [data set], https://doi.org/10.34992/ep9a-xt58, 2025.
Stroeve, J., Nandan, V., Willatt, R., Tonboe, R., Hendricks, S., Ricker, R., Mead, J., Mallett, R., Huntemann, M., Itkin, P., Schneebeli, M., Krampe, D., Spreen, G., Wilkinson, J., Matero, I., Hoppmann, M., and Tsamados, M.: Surface-based Ku- and Ka-band polarimetric radar for sea ice studies , The Cryosphere, 14, 4405–4426, https://doi.org/10.5194/tc-14-4405-2020, 2020.
Stroeve, J., Nandan, V., Willatt, R., Dadic, R., Rostosky, P., Gallagher, M., Mallett, R., Barrett, A., Hendricks, S., Tonboe, R., McCrystall, M., Serreze, M., Thielke, L., Spreen, G., Newman, T., Yackel, J., Ricker, R., Tsamados, M., Macfarlane, A., Hannula, H.-R., and Schneebeli, M.: Rain on snow (ROS) understudied in sea ice remote sensing: a multi-sensor analysis of ROS during MOSAiC (Multidisciplinary drifting Observatory for the Study of Arctic Climate), The Cryosphere, 16, 4223–4250, https://doi.org/10.5194/tc-16-4223-2022, 2022.
Stroeve, J., Saha, M., Nandan, V., et al.: Churchill KuKa Data 2021, CanWIN [data set], https://doi.org/10.34992/11tj-wr82, 2023.
Sturm, M. and Holmgren, J.: An Automatic Snow Depth Probe for Field Validation Campaigns, Water Resour. Res., 54, 9695–9701, https://doi.org/10.1029/2018WR023559, 2018.
Sturm, M., Holmgren, J., König, M., and Morris, K.: The thermal conductivity of seasonal snow, J. Glaciol., 43, 26–41, 1997.
Tiuri, T., Sihvola, A., Nyfors, E., and Hallikainen, M.: The complex dielectric constant of snow at microwave frequencies, IEEE J. Oceanic Eng., 9, 377–382, https://doi.org/10.1109/JOE.1984.1145645, 1984.
Ulaby, F. and Long, D.: Microwave Radar and Radiometric Remote Sensing, The University of Michigan Press, ISBN 978-0-472-11935-6, 2014.
Varshney, D., Rahnemoonfar, M., Yari, M., Paden, J., Ibikunle, O., and Li, J.: Deep Learning on Airborne Radar Echograms for Tracing Snow Accumulation Layers of the Greenland Ice Sheet, Remote Sens., 13, 2707, https://doi.org/10.3390/rs13142707, 2021.
Webster, M. A., Rigor, I. G., Nghiem, S. V., Kurtz, N. T., Farrell, S. L., Perovich, D. K., and Sturm, M.: Interdecadal changes in snow depth on Arctic sea ice, J. Geophys. Res.-Oceans, 119, 5395–5406, https://doi.org/10.1002/2014JC009985, 2014.
Willatt, R., Giles, K. A., Laxon, S. W., Stone-Drake, L., and Worby, A. P.: Field investigations of Ku-band radar penetration into snow cover on Antarctic sea ice, IEEE T. Geosci. Remote, 48, 365–372, https://doi.org/10.1109/TGRS.2009.2028237, 2010.
Willatt, R., Laxon, S., Giles, K., Cullen, R., Haas, C., and Helm, V.: Ku-band radar penetration into snow cover on Arctic sea ice using airborne data, Ann. Glaciol., 52, 197–205, 2011.
Willatt, R., Stroeve, J. C., Nandan, V., Newman, T., Mallett, R., Hendricks, S., Ricker, R., Mead, J., Itkin, P., Tonboe, R., Wagner, D. N., Spreen, G., Liston, G., Schneebeli, M., Krampe, D., Tsamados, M., Demir, O., Wilkinson, J., Jaggi, M., and Oggier, M.: Retrieval of Snow Depth on Arctic Sea Ice from Surface-Based, Polarimetric, Dual-Frequency Radar Altimetry, Geophys. Res. Lett., 50, e2023GL104461, https://doi.org/10.1029/2023GL104461, 2023.
Willatt, R., Mallett, R., Stroeve, J., Wilkinson, J., Nandan, V., and Newman, T. : Ku- and Ka-band polarimetric radar waveforms and snow depth estimation over multi-year Antarctic sea ice in the Weddell Sea, Geophys. Res. Lett., 52, e2024GL112870, https://doi.org/10.1029/2024GL112870, 2025.
Zakharova, E., Agafonova, S., Duguay, C., Frolova, N., and Kouraev, A.: River ice phenology and thickness from satellite altimetry: potential for ice bridge road operation and climate studies, The Cryosphere, 15, 5387–5407, https://doi.org/10.5194/tc-15-5387-2021, 2021.