
the Creative Commons Attribution 4.0 License.
the Creative Commons Attribution 4.0 License.
 | 23 Jul 2026
Brief communication: Two-year MRR observations at Great Wall Station, Antarctic Peninsula region
Jiayi Sun
Junmei Lv
Wenqian Zhang
Biao Tian
We report a two-year record (March 2024–February 2026) of Micro Rain Radar (MRR) observations at Great Wall Station in the Antarctic Peninsula region. After quality control, near-surface precipitation and snowfall were identified during 32 % and 21 % of the observation time, respectively. Median snowfall radar reflectivity is approximately 9 dBZ and exhibits minimal variation with height, likely due to frequent shallow snowfall. Strong winds are associated with reduced low-level median radar reflectivity below approximately 1 km. We further developed a localized Ze (equivalent radar reflectivity) – S (snowfall rate) parameterization and identified systematic underestimation of cumulative snowfall profiles in ERA5 products.
- Article
(5892 KB) - Full-text XML
- BibTeX
- EndNote


The Antarctic Ice Sheet contains a substantial fraction of Earth's land ice; consequently, perturbations in its mass budget have the potential to exert a measurable influence on global mean sea level (DeConto and Pollard, 2016). A key metric for characterizing this mass budget is the surface mass balance (SMB). Across most of Antarctica, the gain term of SMB is dominated by solid precipitation, predominantly snowfall (van Wessem et al., 2018). Hence, reliable precipitation observations are essential for diagnosing present-day Antarctic SMB and constraining its future evolution. Yet, such observations remain severely limited owing to the harsh Antarctic environment and the logistical challenges of maintaining long-term measurements in this region (Ding et al., 2022b; Grazioli et al., 2023). Satellite products and numerical models currently underpin much of the research on Antarctic precipitation. Spaceborne radars have made continent-scale precipitation detection feasible; however, their utility for diagnosing precipitation evolution through the atmospheric column – and, in particular, near-surface depletion processes such as sublimation – is substantially curtailed by coarse temporal sampling, restricted spatial coverage, and a pronounced low-level observational gap associated with the radar blind zone (Alexander et al., 2023; Grazioli et al., 2017a). Compounding these limitations, the paucity of ground-based precipitation observations across Antarctica limits rigorous, process-oriented validation of model and reanalysis products; moreover, many model parameterizations – having been developed primarily for mid-latitude regimes – are not tailored to the Antarctic environment, which contributes to systematic deviations from available local observations (Agosta et al., 2015).
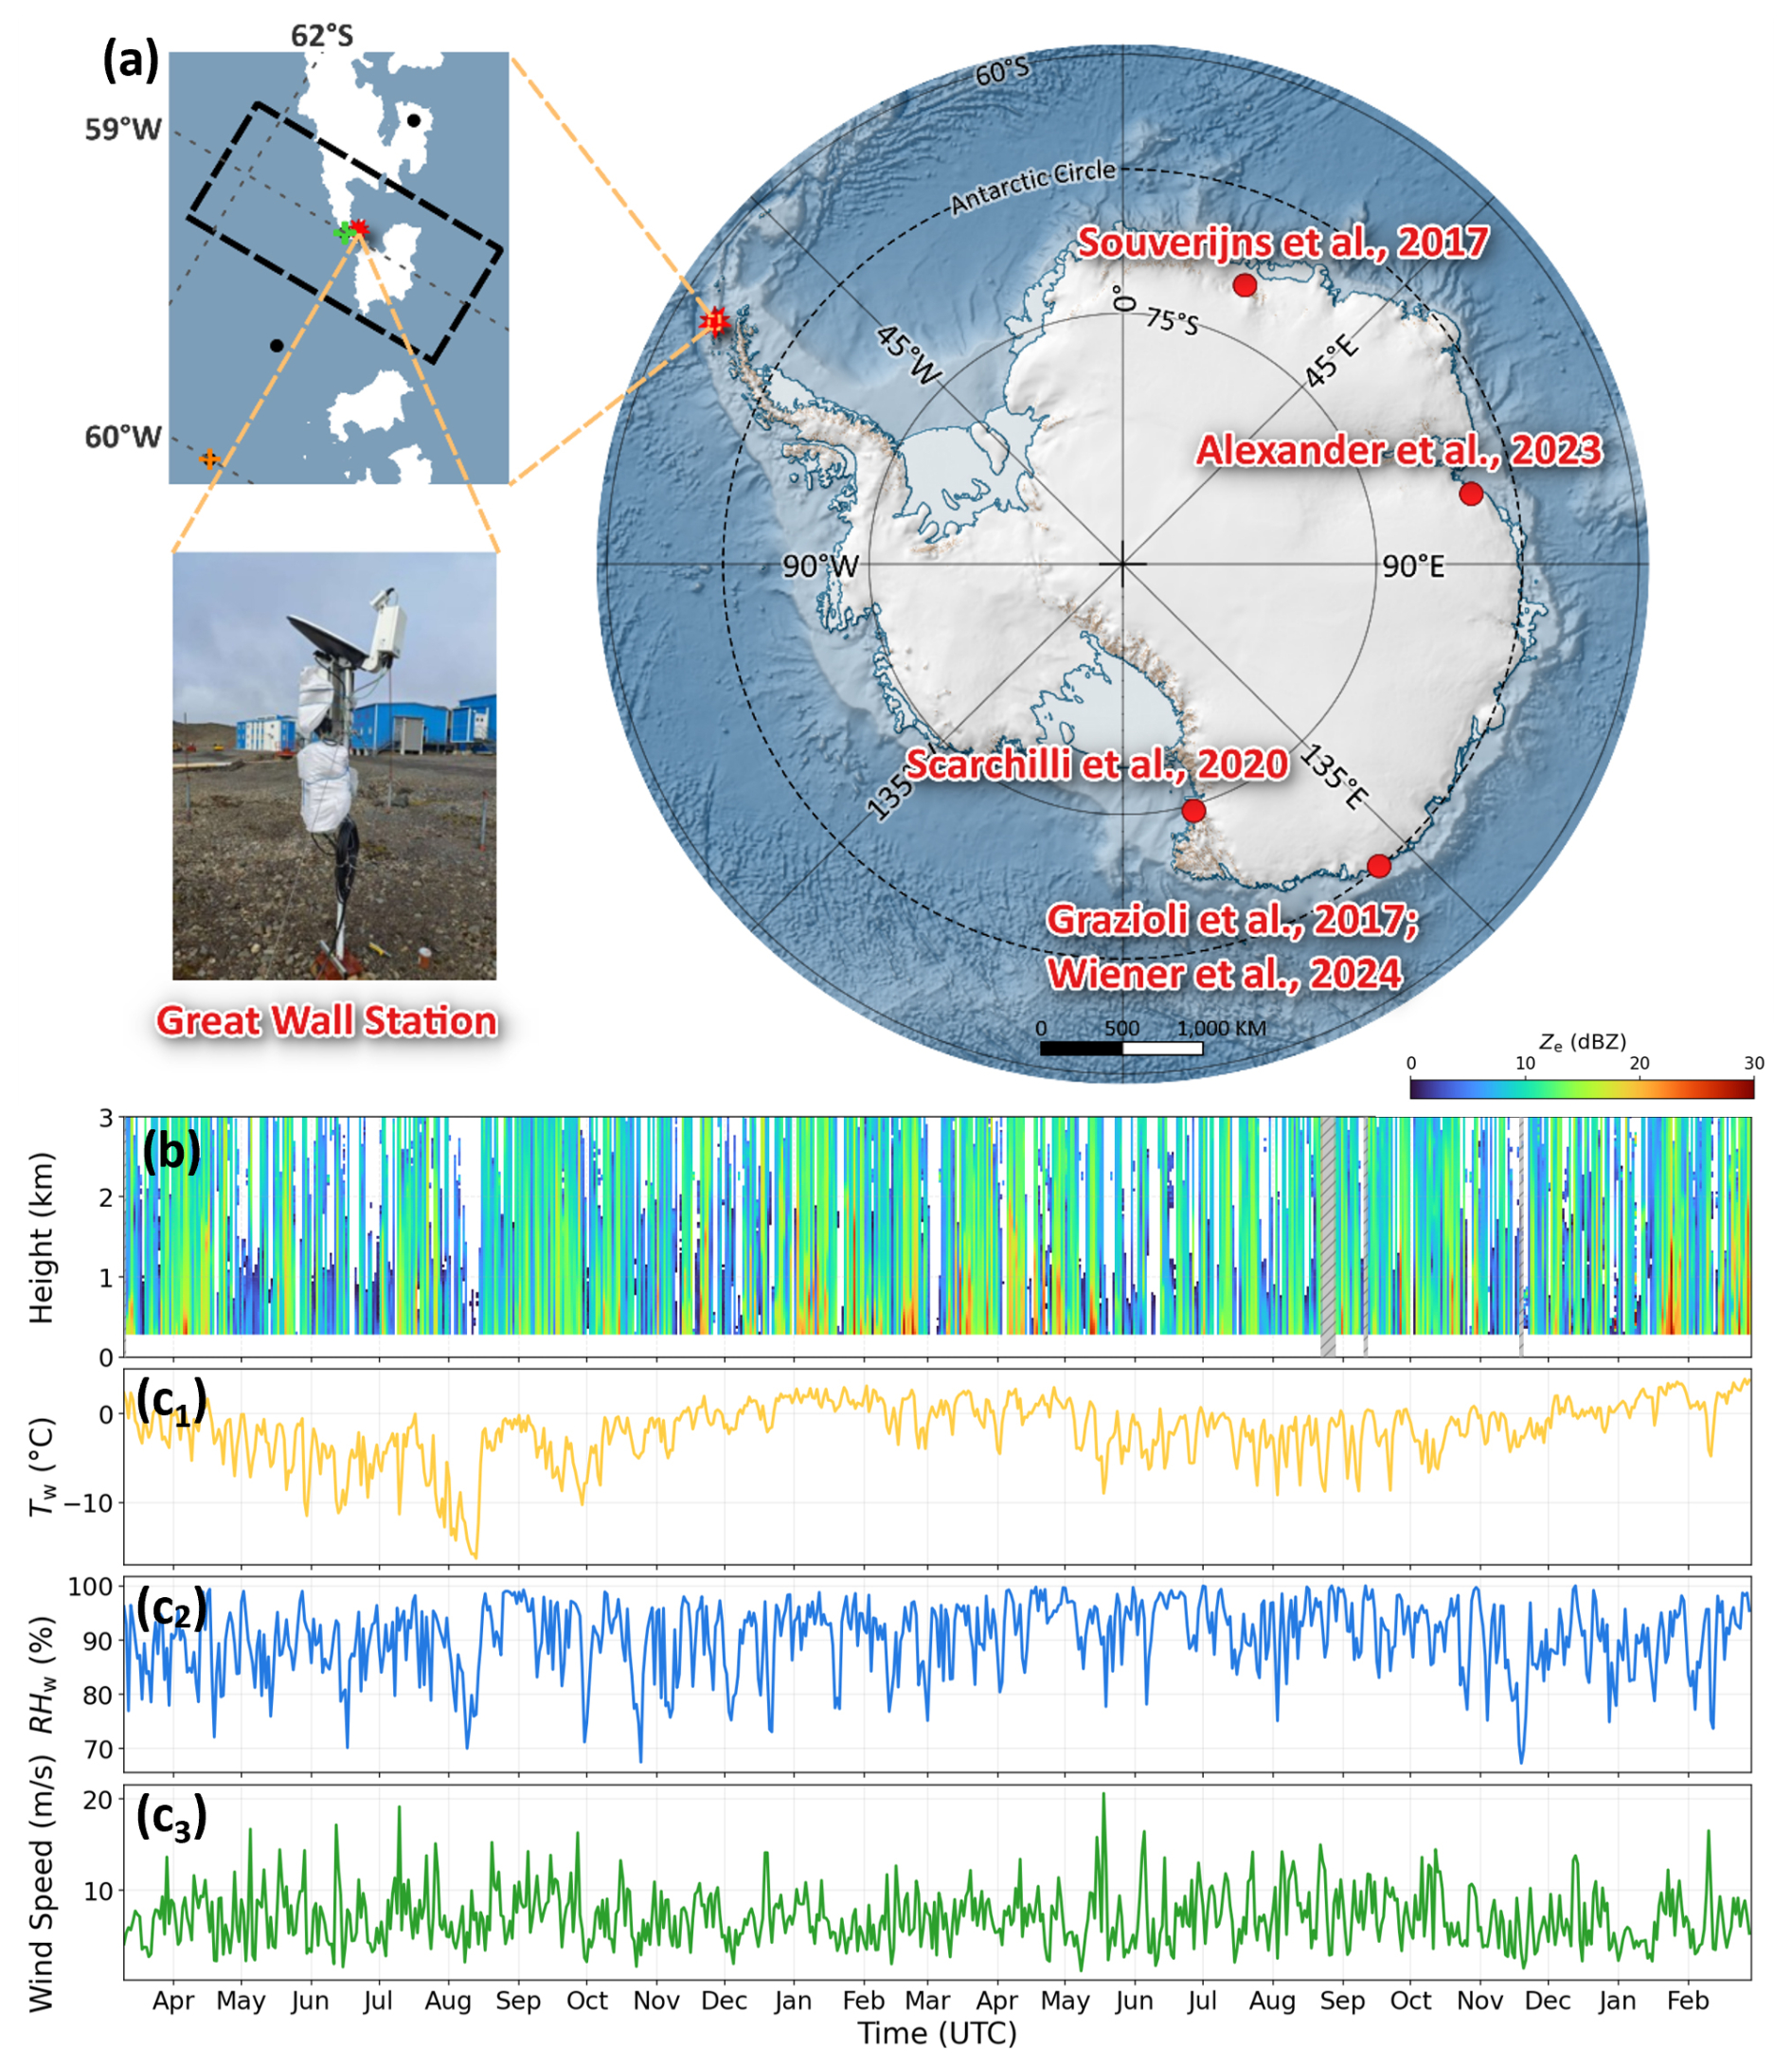
Figure 1(a) Location of Great Wall Station and the deployed Micro Rain Radar (MRR), together with the automatic weather station (AWS). In the upper-left inset, black dots denote the ERA5 grid points; the green cross marks the ERA5 grid point nearest to Great Wall Station; the orange cross indicates the nearest oceanic ERA5 grid point; and the black dashed box outlines the corresponding ERA5 grid box. (b) Daily-mean equivalent radar reflectivity (Ze) at Great Wall Station from March 2024 to February 2026. Grey hatched areas indicate periods of missing data. (c1) Daily-mean wet-bulb temperature Tw (yellow solid line). (c2) Daily-mean relative humidity with respect to liquid water RHw (blue solid line). (c3) Daily-mean wind speed (green solid line). In panel (a), established MRR sites are marked with red dots, and scholars who used MRR data from the corresponding sites are annotated.
Ground-based remote sensing can provide high-temporal-resolution profile measurements, making it possible to observe precipitation through the atmospheric column – from formation aloft to the near-surface layers – and, at the same time, to benchmark numerical model performance against independent observations. In particular, vertical profiles from Micro Rain Radars (MRRs) have been used to develop site-specific reflectivity–snowfall-rate (Ze=aSb) relationships over East Antarctica (some of the red circles in Fig. 1a). Souverijns et al. (2017) derived such a relation by combining observations from the first Antarctic MRR with measurements from a precipitation imaging instrument (PIP) deployed at Princess Elisabeth Station. Scarchilli et al. (2020) similarly estimated an MZS Ze–S relation using an MRR installed at the Italian Mario Zucchelli Station together with co-located snow-gauge observations. At Dumont d'Urville (DDU), Grazioli et al. (2017b) presented the first results from precipitation monitoring that integrated an MRR with gauge measurements, and Grazioli et al. (2017a) further showed – through comparison with model outputs – that katabatic winds can strongly enhance low-level snowfall sublimation. During the YOPP-SH special observing campaign at DDU, Roussel et al. (2023) combined gauge and MRR observations to assess the ability of several atmospheric models and meteorological reanalysis products to simulate snowfall occurrence. More recently, Wiener et al. (2024) compiled and analyzed a seven-year MRR profiling record at DDU and used it to evaluate model performance. An MRR has also been deployed at Davis; although no site-specific Ze–S relationship has been reported to date, Alexander et al. (2023) used a K-band MRR and a W-band cloud radar to characterize the vertical structure and microphysics of coastal Antarctic snowfall, and showed that Föhn-driven boundary-layer sublimation can remove about 50 % of snowfall mass within CloudSat's near-surface blind zone.
Rising temperatures associated with ongoing climate change place austral-summer conditions in the coastal Antarctic Peninsula frequently near the 0 °C threshold, making the precipitation phase (rain versus snow) particularly sensitive to thermodynamic fluctuations and circulation perturbations (Ding et al., 2020). However, continuous observations of precipitation processes in this region have yet to be reported, leaving a gap in the evaluation of model simulations of precipitation over the area. In this study, we address this gap using a two-year record of MRR observations collected at Great Wall Station.
2.1 Great Wall Station
Figure 1a shows the location of the observation site used in this study, China's Great Wall Station (62°13′ S, 58°58′ W; 10 m a.s.l.). The station is situated on the coastal margin of the Fildes Peninsula on the western part of King George Island, in the South Shetland Islands, northwest of the Antarctic Peninsula. The construction and operation of the station's surface meteorological instrumentation and observing procedures follow the standards of the World Meteorological Organization (WMO) and the China Meteorological Administration (CMA) (Ding et al., 2020). Great Wall Station was established in 1985, and continuous 24 h automatic observations have been conducted since 2002. Atmospheric pressure is measured by a PTB220 barometric pressure sensor installed inside the cabinet of the automatic weather station data acquisition unit. Air temperature and relative humidity are measured by an HMP45D temperature and humidity sensor placed in a Stevenson screen at a height of 2 m above the ground, with relative humidity defined with respect to liquid water. Wind speed and wind direction are measured by an XFY3-1 wind speed and direction sensor installed at a height of 10 m above the ground. Precipitation is measured manually using a standard weighing rain gauge (TQ-SDM6, HY Sounding Inc., Beijing, China), which is installed at a height of 1.5 m above the ground. The 12 h accumulated precipitation is defined as the total precipitation recorded over the preceding 12 h at 00:00 and 12:00 UTC each day. The gauge is not equipped with a dedicated wind shield. Therefore, wind-induced undercatch may occur under windy Antarctic conditions and is acknowledged as a potential source of uncertainty. Visibility is also identified manually by observers in the meteorological room of the scientific building. The meteorological observation field is located northwest of the meteorological room. Since the precipitation observations do not distinguish between solid and liquid precipitation, all cases were carefully screened in the subsequent fitting analysis of Ze–S in Sect. 3.3. Figure 1c1–c3 present, respectively, the daily-mean wet-bulb temperature, daily-mean relative humidity with respect to liquid water (RHw), and daily-mean wind speed recorded by the automatic weather station from 10 March 2024 to 28 February 2026; the wet-bulb temperature was calculated from the measured air temperature in combination with surface pressure and relative humidity.
2.2 Micro Rain Radar
Deployed at China's Great Wall Station in early 2024, the Micro Rain Radar (MRR; K-band, 24 GHz) is a vertically pointing frequency-modulated continuous-wave (FM-CW) Doppler system (see the lower-left panel of Fig. 1a). During the observation period, the MRR was operated with a native temporal resolution of 10 s, 128 range gates, and a range-gate spacing of 35 m, with a maximum observational height of approximately 4.45 km above ground level. For each time step and range gate, the raw Doppler spectrum was recorded with 64 spectral bins. The maximum unambiguous Doppler velocity was approximately 11.89 m s−1, corresponding to a Doppler velocity bin spacing of about 0.19 m s−1. Because of near-field effects and possible ground contamination, the lowest usable range gate for snowfall statistics was approximately 300 m above ground level.
Figure 1b presents the daily-mean MRR equivalent radar reflectivity (Ze) profiles over the full observation period, providing an overview of precipitation events observed by the radar at Great Wall Station. Together with the daily-mean meteorological variables recorded by the automatic weather station, including wet-bulb temperature, relative humidity, and wind speed (Fig. 1c1–c3), Fig. 1 provides a general view of both precipitation occurrence and the local atmospheric conditions during the observation period. With the exception of two short data gaps caused by an SD-card malfunction (23–27 August and 10 September 2025), indicated by grey hatched areas in Fig. 1b, the MRR record is essentially continuous, yielding 715 d of effective measurements.
All MRR spectra were processed using a Doppler-spectra-based processing framework following Maahn and Kollias (2012), which is designed to enhance performance under low signal-to-noise conditions typical of snowfall. We also identified and removed stationary noise signals by temporally averaging spectral observations as used by Ding et al. (2022a). The procedure applies robust noise suppression and a dynamic dealiasing strategy, thereby improving the retrieval of weak spectral signatures (including subtle vertical-motion signals) and increasing the detectability of light precipitation. For the snowfall statistics, time steps with no valid return at the lowest usable range gate (∼ 300 m above ground level) were treated as snow-free. In addition, profiles exhibiting a bright band associated with the 0 °C melting layer aloft (Li et al., 2020; Li and Moisseev, 2020) were excluded from the snowfall classification and were not counted as snowfall.
2.3 ERA5 products
The ERA5 atmospheric reanalysis produced by the European Centre for Medium-Range Weather Forecasts is used in this study. ERA5 is generated with the IFS global forecasting system (CY41R2) coupled with a four-dimensional data assimilation framework, providing a wide range of atmosphere–land–ocean variables on an approximately 30 km horizontal grid and a 137-level vertical discretization; although ERA5 records extend to years earlier than 1979, 1979 is commonly regarded as the earliest reliable year for Southern Hemisphere analyses, and ERA5 is therefore widely used as the successor to ERA-Interim. Hourly ERA5 data from March 2024 to February 2026 is analysed. To ensure consistency with radar-derived vertical precipitation profiles, archived surface precipitation is not used directly. Instead, following the approach described in the Supplement (Sect. S3) of Roussel et al. (2023), model-level solid precipitation flux diagnostics defined at the midpoints of the IFS vertical layers are employed to reconstruct height-resolved snowfall amounts, thereby producing snowfall profile products that are directly comparable to the observed vertical structure.
Through the comparative analysis of ERA5 grid points, we found that the grid point nearest to Great Wall Station is the optimal choice for representing the snowfall characteristics at the station, irrespective of its surface type. The detailed topographic map around Great Wall Station (Fig. A1) also shows that there is no obvious elevated terrain or ridge between the station and the nearest ERA5 grid point. Accordingly, in Sect. 3.3, the detailed comparison between the model or reanalysis results and the observations is carried out for this nearest grid point.
3.1 Precipitation occurrence
In this study, the observed reflectivity (Ze) is used to quantify the height-dependent occurrence frequency of precipitation at Great Wall Station (Fig. 2a). Here, the occurrence frequency is defined as the fraction of all observational time steps at each height for which a given precipitation category is detected by the radar. The vertical binning follows the native range resolution of the MRR (35 m). Figure 2a clearly shows a monotonic decrease in precipitation occurrence with height, with total precipitation occurrence ranging from 6.7 % to 32.0 % across the sampled column. At 0.3 km a.g.l., snowfall occurs 21.3 % of the time, whereas wet snow and rain account for 10.7 %; at 3.0 km a.g.l., the corresponding frequencies decrease to 3.4 % for snowfall and 3.2 % for wet snow and rain. It should be noted that these occurrence frequencies can be affected by the range-dependent sensitivity of the radar. Since the MRR is vertically pointing, increasing range corresponds to increasing height above the instrument. With increasing range, weak echoes are more likely to fall below the detection threshold, and precipitation occurrence at higher range gates may therefore be underestimated. Consequently, the decrease in occurrence at higher altitudes should not be interpreted solely as a physical reduction in precipitation frequency. To reduce the influence of noisy range gates and potential range-dependent underdetection, the occurrence analysis was restricted to the reliable height range of the MRR, excluding the lowest range gates affected by near-field effects and possible ground contamination, as well as the noisiest upper range gates. Within this retained height range, the lower layers are dominated by snowfall. With increasing height, precipitation occurrence decreases, and the reduction is more pronounced for snowfall – the dominant phase near the surface – so that the difference between snowfall and wet snow/rain progressively narrows. This implies that snowfall is more frequent than rainfall near the surface, whereas at higher levels snowfall and rainfall occur with comparable frequency.
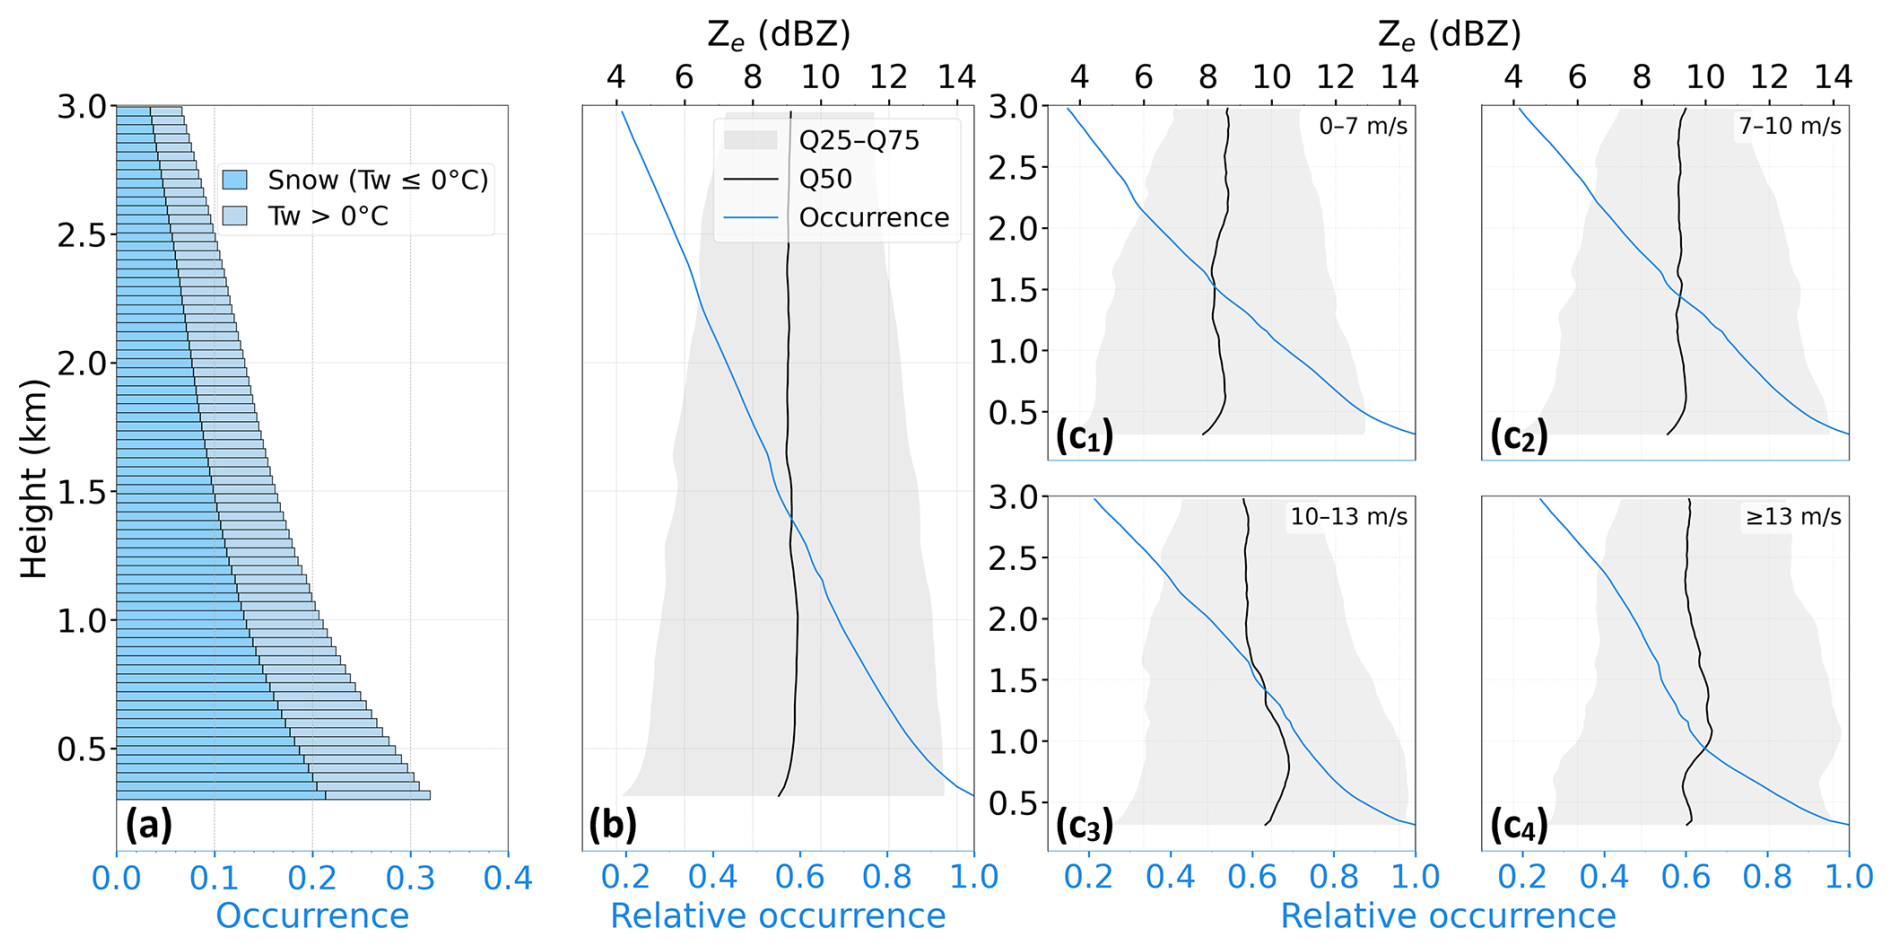
Figure 2(a) Precipitation occurrence probability at Great Wall Station as a function of height (light blue: snowfall; dark blue: wet snow and rain). (b) Vertical profiles of equivalent radar reflectivity (Ze) for snowfall. (c1–c4) Snowfall Ze statistics stratified by wind-speed regimes: 0–7 m s−1 (c1), 7–10 m s−1 (c2), 10–13 m s−1 (c3), and ≥ 13 m s−1 (c4). For each regime, the median Ze is shown by the black solid line, the interquartile range (25th, 75th percentiles) by the light-grey shading, and the blue solid line shows the height-dependent relative occurrence of snowfall, normalized by the total number of snowfall cases identified at the lowest usable MRR range gate.
To further characterize the snowfall regime, snowfall-only Ze profiles are examined (Fig. 2b). The median reflectivity during snowfall exhibits only weak vertical variability, remaining close to ∼ 9 dBZ throughout most of the profile. A modest enhancement around ∼ 1.25 km is consistent with microphysical growth processes, including aggregation and riming, as well as vapor-deposition growth and sublimation effects (Planat et al., 2021). Below ∼ 0.7 km, a slight decrease is observed; however, unlike the MRR-based statistics reported at DDU (Wiener et al., 2024), the reduction in Ze beneath 0.7 km is not pronounced at Great Wall Station. Because strong low-level reflectivity decreases at DDU have been linked to katabatic-flow-driven sublimation of falling snow (Grazioli et al., 2017a) , the comparatively weak near-surface decrease at Great Wall Station suggests a limited katabatic influence in the Antarctic Peninsula coastal setting. This interpretation is physically consistent with the katabatic-wind mechanism – dry, downslope flow originating from the interior plateau – given that Great Wall Station is not located within a prominent katabatic outflow corridor. Finally, a comparison of the 25th and 75th percentile envelopes with those reported for DDU indicates that Great Wall Station frequently experiences low-topped, long-lasting, and weak snowfall events. The prevalence of these low-intensity cases increases the contribution of weak low-level returns, leading to a downward tendency in the 25th-percentile Ze profile toward the surface, while leaving the median profile relatively invariant with height.
3.2 Wind-speed effects on snowfall reflectivity profiles
Near-surface wind speed may influence low-level snowfall reflectivity profiles through turbulence, enhanced sublimation, changes in the particle size distribution of falling snow, and possible blowing-snow processes. Previous studies have noted that blowing-snow effects become non-negligible for wind speeds exceeding 7 m s−1 when deriving Ze–S relationships (Scarchilli et al., 2020; Wiener et al., 2024). Accordingly, wind speed was binned into four regimes: 0–7 m s−1 (Fig. 2c1), 7–10 m s−1 (Fig. 2c2), 10–13 m s−1 (Fig. 2c3), and ≥ 13 m s−1 (Fig. 2c4), in order to examine the variations in snowfall Ze profiles under different near-surface wind-speed conditions. Under the two lower-wind regimes (Fig. 2c1–c2), the snowfall Ze profiles closely resemble the aggregate snowfall statistics, and no pronounced change is observed with increasing wind speed. By contrast, for wind speeds of 10–13 m s−1 (Fig. 2c3), a marked enhancement of low-level reflectivity emerges. When wind speed exceeds 13 m s−1 (Fig. 2c4), a pronounced reduction in Ze occurs below 1 km, accompanied by an abrupt decrease in the relative frequency of snowfall occurrence at 1 km – from about 70 % in Fig. 2c3 to roughly 60 % – and, toward lower altitudes, a noticeably steeper vertical gradient in the occurrence profile. We also added Appendix B to provide additional analyses, including reflectivity statistics stratified by season and wind-speed regime. The seasonal statistics of reflectivity under different wind-speed conditions show similar features (Fig. B1), especially in summer. Furthermore, the two-dimensional distribution of wind speed and visibility for all snowfall cases (Fig. B2) shows that wind speeds ≥ 13 m s−1 are generally associated with reduced visibility. Together with the wind-speed dependence of the reflectivity profiles, these results provide a possible explanation for the decrease in low-level Ze under wind speeds ≥ 13 m s−1, this feature may be related to blowing-snow conditions under strong winds. Stronger winds may enhance low-level sublimation and turbulent mixing, thereby reducing the abundance of larger falling snow particles. In addition, smaller snow particles that have previously been deposited may be resuspended by strong winds, increasing the contribution of low-reflectivity echoes in the lower layers and shifting the distribution of radar returns toward weaker Ze. However, this interpretation remains subject to uncertainty, as MRR measurements below 300 m were excluded from the statistics due to their limited reliability, while seasonal differences in surface snow conditions and the availability of mobilizable snow particles may also affect the wind-speed range over which blowing snow occurs. Therefore, the decrease in low-level Ze under wind speeds ≥ 13 m s−1 is interpreted here as a feature possibly related to strong-wind and blowing-snow-related processes.
3.3 Cumulative snowfall profiles and model evaluation
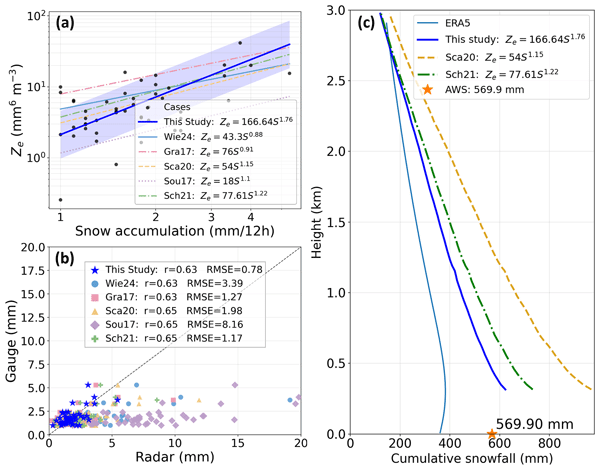
In Fig. 3a, a site-specific Ze=aSb relationship for the Great Wall Station MRR is derived by pairing radar equivalent reflectivity Ze (mm6 m−3) with 12 h snowfall accumulation S (mm per 12 h) obtained from manual observations using a standard precipitation gauge, and by estimating the parameters a and b using a differential-evolution (DE) optimization algorithm. This approach is widely adopted for retrieving snowfall rate from radar reflectivity and has been applied in numerous Antarctic studies (Grazioli et al., 2017b; Scarchilli et al., 2020; Schoger et al., 2021; Souverijns et al., 2017; Wiener et al., 2024). For the fit, Ze at the lowest usable radar range gate (approximately 300 m a.g.l.) is used and converted to linear units (mm6 m−3). However, not all observations are suitable for constructing a robust Ze–S relation. Snowfall case selection was based on routine gauge precipitation observations, in which precipitation was recorded twice daily at 00:00 and 12:00 UTC, representing the accumulated precipitation over the preceding 12 h, without distinguishing between rainfall and snowfall. To identify cases containing snowfall only, the following screening was applied. For each 12 h time window (00:00–12:00 and 12:00–24:00 UTC), a case was retained only when the corresponding radar file was available, the 12 h gauge accumulation was valid and no less than 1.0 mm, and the radar temporal coverage within the 12 h window was at least 80 %. In addition, to minimize contamination by liquid precipitation, the 12 h accumulation window is required to contain no time steps with wet-bulb temperature Tw>0 °C. Cases containing any valid radar sample with Tw>0 °C were excluded. Only radar samples satisfying both valid reflectivity and Tw≤0 °C were used in the subsequent analysis. In particular, strong horizontal winds can resuspend previously deposited snow, leading to biased gauge accumulations and, consequently, biased regression. Previous studies have noted that blowing-snow effects become non-negligible for wind speeds exceeding 7 m s−1 when deriving Ze–S relationships (Scarchilli et al., 2020; Wiener et al., 2024). Therefore, the cases used in Fig. 3a (black circles) are restricted to snowfall periods with wind speeds of 0–7 m s−1. Applying these filters yields the subset shown by the black points in Fig. 3a. The resulting best-fit parameters are a=166.64 and b=1.76, i.e., Ze=166.64S1.76, plotted as the solid blue line. Following Wiener et al. (2024), we estimated the uncertainty associated with the fitted Ze–S relationship using the regression RMSE in log space. Specifically, the residuals between the observed ln (Ze) values and the fitted ln (Ze) values were used to calculate the regression RMSE. The blue shaded region in Fig. 3a represents the range , converted back to linear Ze units. This uncertainty envelope illustrates the substantial scatter in the Ze–S fitting and provides a visual estimate of the uncertainty of the locally derived relationship. For reference, several published Ze–S relations are also overlaid in Fig. 3a using distinct colors. To assess fitting performance and potential bias, Fig. 3b compares 12 h snowfall accumulations estimated from MRR reflectivity using each Ze–S relation against the corresponding 12 h accumulations recorded by standard precipitation gauge; the color coding matches that in Fig. 3a. Although the locally fitted relation yields a correlation coefficient R=0.63, it achieves the smallest root-mean-square error (RMSE = 0.78) and the lowest bias among the tested relations. Among the published relations, those of Scarchilli et al. (2020), Ze=54S1.15 (yellow), and Schoger et al. (2021) Ze=77.61S1.22 (green), perform comparatively well, both producing R=0.65 with RMSE values of 1.98 and 1.17, respectively.
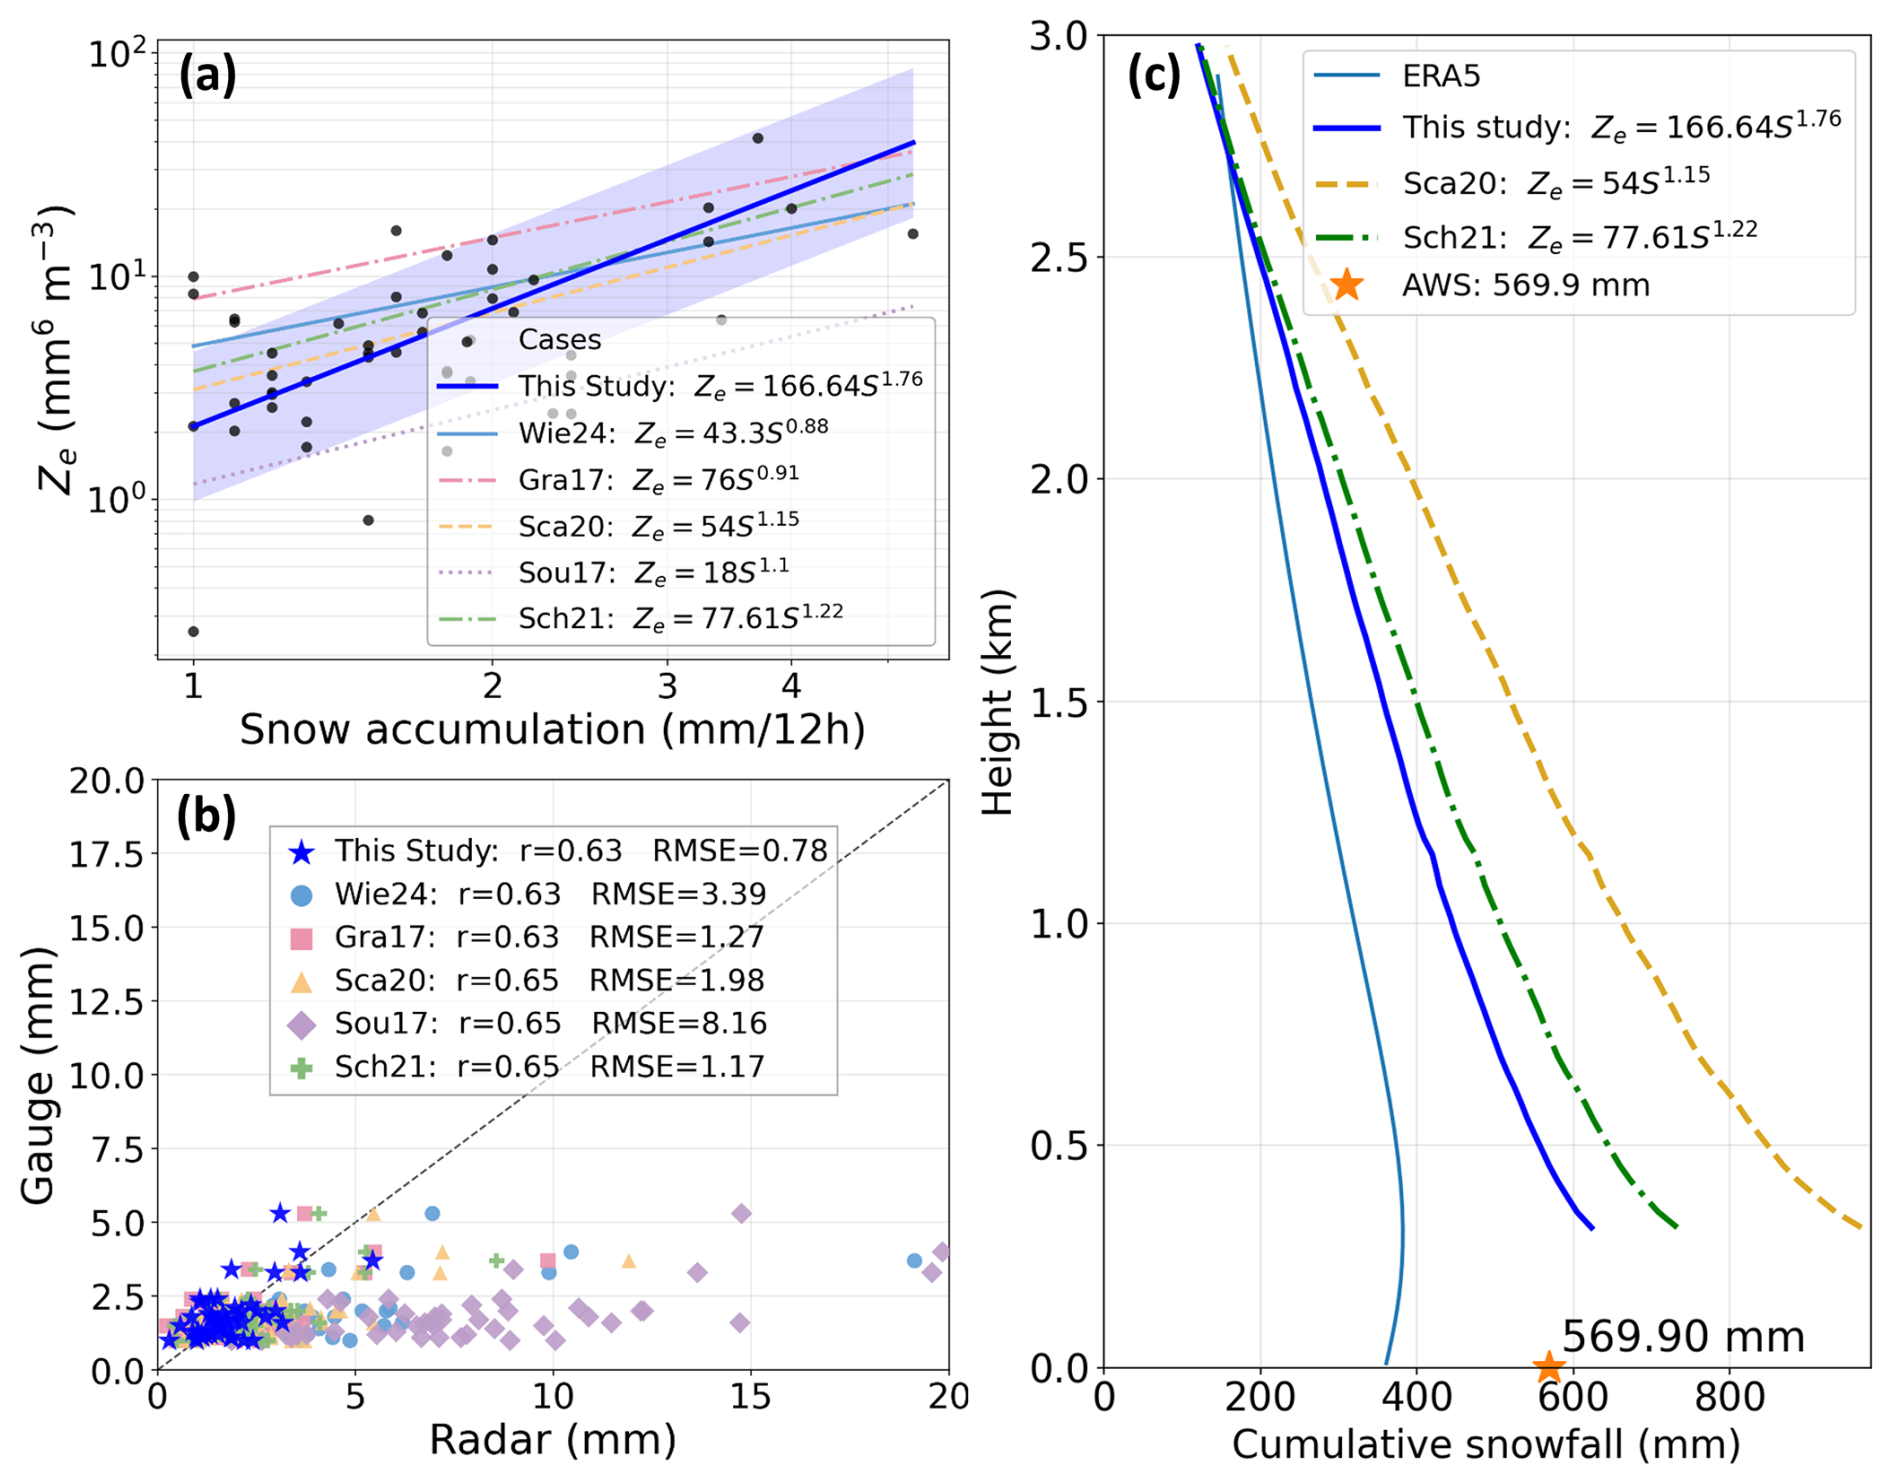
Figure 3(a) Scatterplot of MRR equivalent reflectivity (linear units) versus 12 h snowfall accumulation from a standard weighing rain gauge (black dots), together with the Ze–S relationship derived using DE regression (solid blue line). The blue shaded region represents the regression RMSE estimated in ln (Ze) space. Also shown are published Ze–S relations from Wiener et al. (2024) (light-blue solid), Grazioli et al. (2017b) (red dashed), Scarchilli et al. (2020) (yellow dashed), Souverijns et al. (2017) (purple dashed) and Schoger et al. (2021) (green dashed). (b) Comparison between 12 h snowfall accumulation estimated from MRR reflectivity using the same Ze–S relations as in panel (a) and the time-scheduled precipitation amounts recorded by the automatic weather station (scatterplot). (c) Cumulative snowfall profiles from ERA5 and from the MRR-based retrieval using the locally fitted relation (solid blue), together with profiles computed using the relations of Scarchilli et al. (2020) (yellow dashed) and Schoger et al. (2021) (green dashed).
Building on the fitted relationship Ze=166.64S1.76, together with the power-law relations proposed by Scarchilli et al. (2020), and Schoger et al. (2021), cumulative snowfall profiles at Great Wall Station were computed for 10 March 2024 to 28 February 2026 (Fig. 3c) and compared with the cumulative snowfall profile derived from ERA5 (Fig. 3c). Figure 3c indicates that ERA5 substantially underestimates cumulative snowfall relative to the MRR-based estimates: the ERA5 maximum occurs near 300 m a.g.l. and reaches only ∼ 380 mm, which is not only smaller than the MRR-derived accumulation at the same height but also lower than the surface accumulation recorded by the automatic weather station (∼ 570 mm). In contrast, the MRR-derived accumulation at the lowest usable gate (∼ 300 m a.g.l.) exceeds the gauge total for all tested Ze–S relations; using the locally fitted relation yields an accumulation of ∼ 620 mm at 300 m. This result highlights the value of profiling radar observations for snowfall quantification, as the vertically resolved radar retrieval provides a more robust estimate of snowfall accumulation than surface gauge records that are susceptible to wind-related biases. ERA5 reproduces the general increase in cumulative snowfall from the top of the profile down to approximately 300 m, consistent with the MRR-derived profiles, but the increase is weaker, i.e., the vertical gradient is insufficiently steep. Moreover, ERA5 exhibits a decrease in cumulative snowfall below ∼ 300 m, consistent with strong near-surface depletion associated with sublimation, whereas the MRR-based profiles do not show a comparable near-surface reduction, suggesting a limited imprint of katabatic-flow-driven sublimation at Great Wall Station. This contrasts with previous work at Dumont d'Urville (DDU), where ERA5 cumulative snowfall profiles typically peak at ∼ 0.8–1.0 km before decreasing toward the surface (Grazioli et al., 2017a; Roussel et al., 2023; Wiener et al., 2024). At Great Wall Station, by comparison, the ERA5 maximum is attained much lower – near ∼ 300 m – before any decrease is simulated. Taken together with the snowfall reflectivity statistics discussed in Sect. 2.3.1, these results support the conclusion that katabatic influence on near-surface snowfall at Great Wall Station is comparatively weak.
This study analyzes the first Micro Rain Radar (MRR) precipitation profiling dataset collected at Great Wall Station in the Antarctic Peninsula sector during March 2024–February 2026. The resulting observations provide a useful case study demonstrating the practical value of ground-based precipitation monitoring at Great Wall Station and offering an observational basis for characterizing precipitation features in the surrounding Antarctic Peninsula region.
Based on a statistical analysis of the MRR precipitation profiles and an ERA5 evaluation enabled by a locally fitted Ze–S relationship derived for Great Wall Station, the main findings of this report are as follows:
-
In terms of precipitation occurrence, precipitation is detected in the lower levels at Great Wall Station about 32.0 % of the time, with pure snowfall accounting for 21.3 %, indicating an overall snowfall-dominated regime. Total precipitation occurrence decreases with height: snowfall dominates at low levels, whereas at higher altitudes the occurrence frequencies of snowfall and wet snow/rain become comparable.
-
Statistics of equivalent reflectivity during snowfall further show that the median snowfall reflectivity exhibits no pronounced vertical variation and remains close to ∼ 9 dBZ. Compared with Dumont d'Urville (DDU), the near-surface imprint of katabatic-flow-driven effects is not as strong, and Great Wall Station features a larger fraction of low-topped, persistent, and weak snowfall events.
-
The MRR reflectivity observations appear to be only weakly affected for wind speeds below 10 m s−1, whereas low-level reflectivity increases markedly when wind speed reaches 10–13 m s−1. Under wind speeds ≥ 13 m s−1, reflectivity below 1 km decreases substantially, accompanied by a decrease in the relative frequency of snowfall occurrence near 1 km and a steeper occurrence gradient toward lower altitudes. These features suggest that the low-level snowfall reflectivity structure varies systematically under strong-wind conditions and may be associated with enhanced sublimation, turbulent mixing, and possible blowing-snow-related processes.
-
Snowfall accumulation retrievals from the MRR are based on a locally fitted reflectivity–snowfall-rate relation, Ze=166.64S1.76, enabling estimation of cumulative snowfall profiles for March 2024 to February 2026.
-
Relative to the MRR-based estimates, ERA5 shows a pronounced underestimation of cumulative snowfall; although the overall profile structure is broadly consistent with the MRR, ERA5 appears to overestimate low-level depletion associated with katabatic-flow-induced sublimation.
-
Consistent with the MRR-derived cumulative snowfall profiles, no pronounced katabatic influence is evident at Great Wall Station during the study period.
The observations presented for Great Wall Station indicate that the precipitation characteristics in this sector differ from those reported at several Antarctic sites where ground-based profiling has previously been conducted. As the first deployment of an MRR at Great Wall Station, this dataset expands current knowledge of regional contrasts in Antarctic precipitation and provides a valuable opportunity to evaluate climate-model and reanalysis products under polar environmental conditions. Nevertheless, quantifying precipitation over coastal Antarctica remains challenging and subject to substantial uncertainty. Given that the present analysis is limited to a two-year record, future work should extend the time series and pursue coordinated analyses that integrate longer-term MRR observations with remote sensing products and numerical model outputs to further constrain precipitation characteristics in the Great Wall Station region.
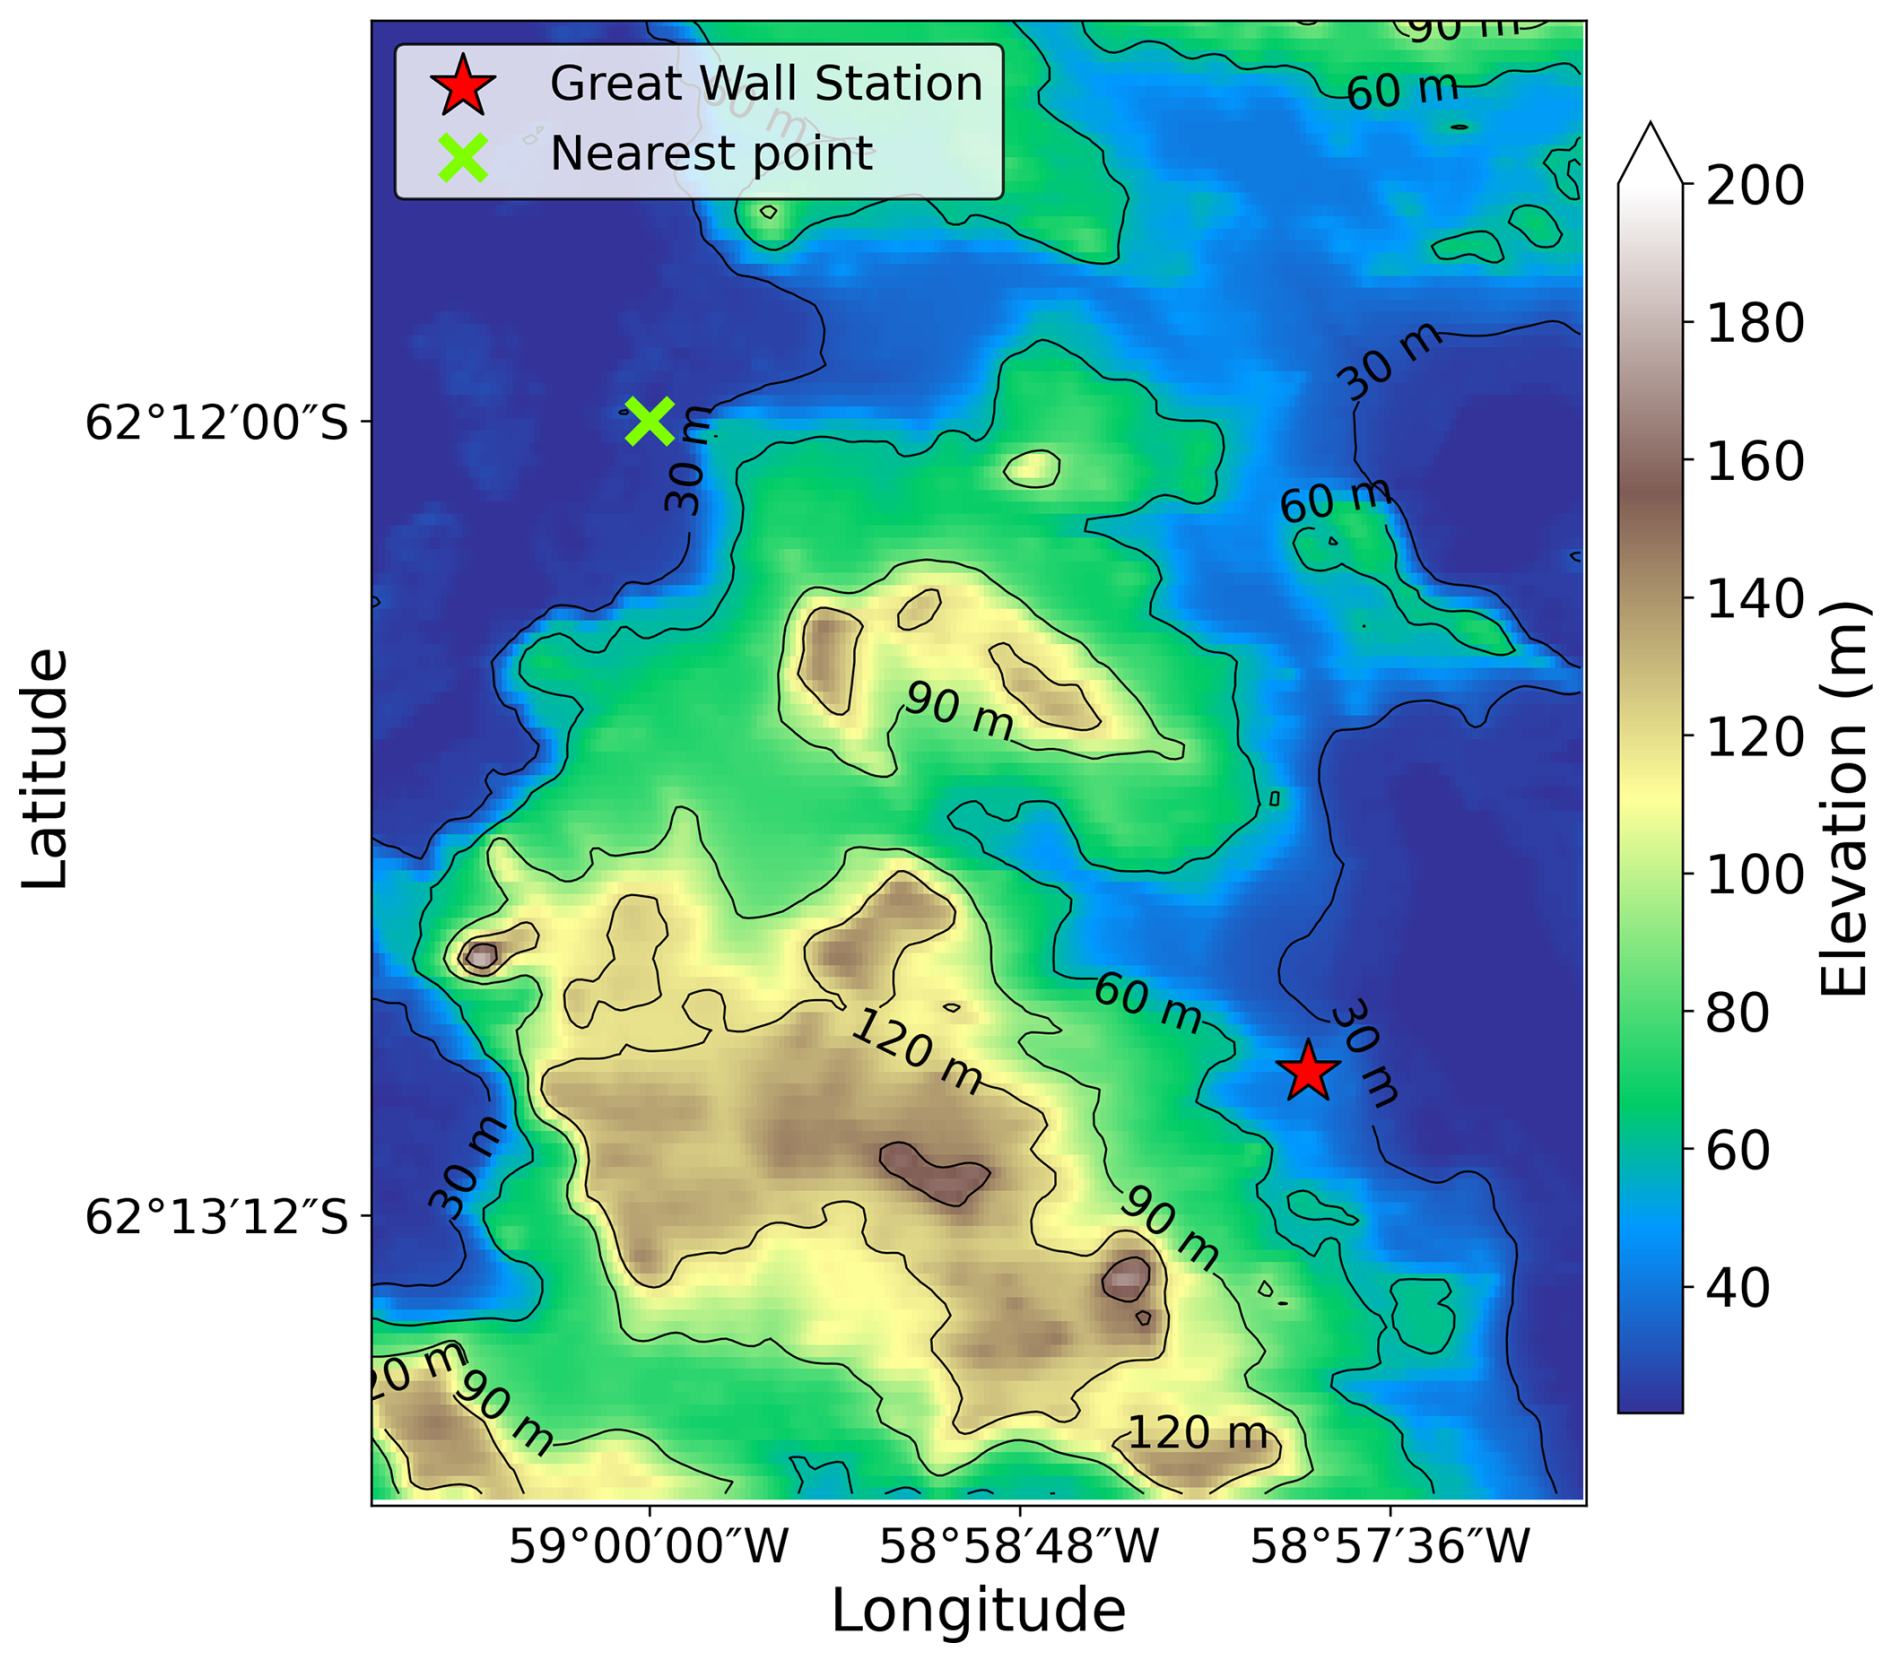
Figure A1Detailed local topographic map in the vicinity of Great Wall Station. Great Wall Station is marked by a red star, the nearest ERA5 grid point is marked by a green cross, and the black lines represent elevation contours.
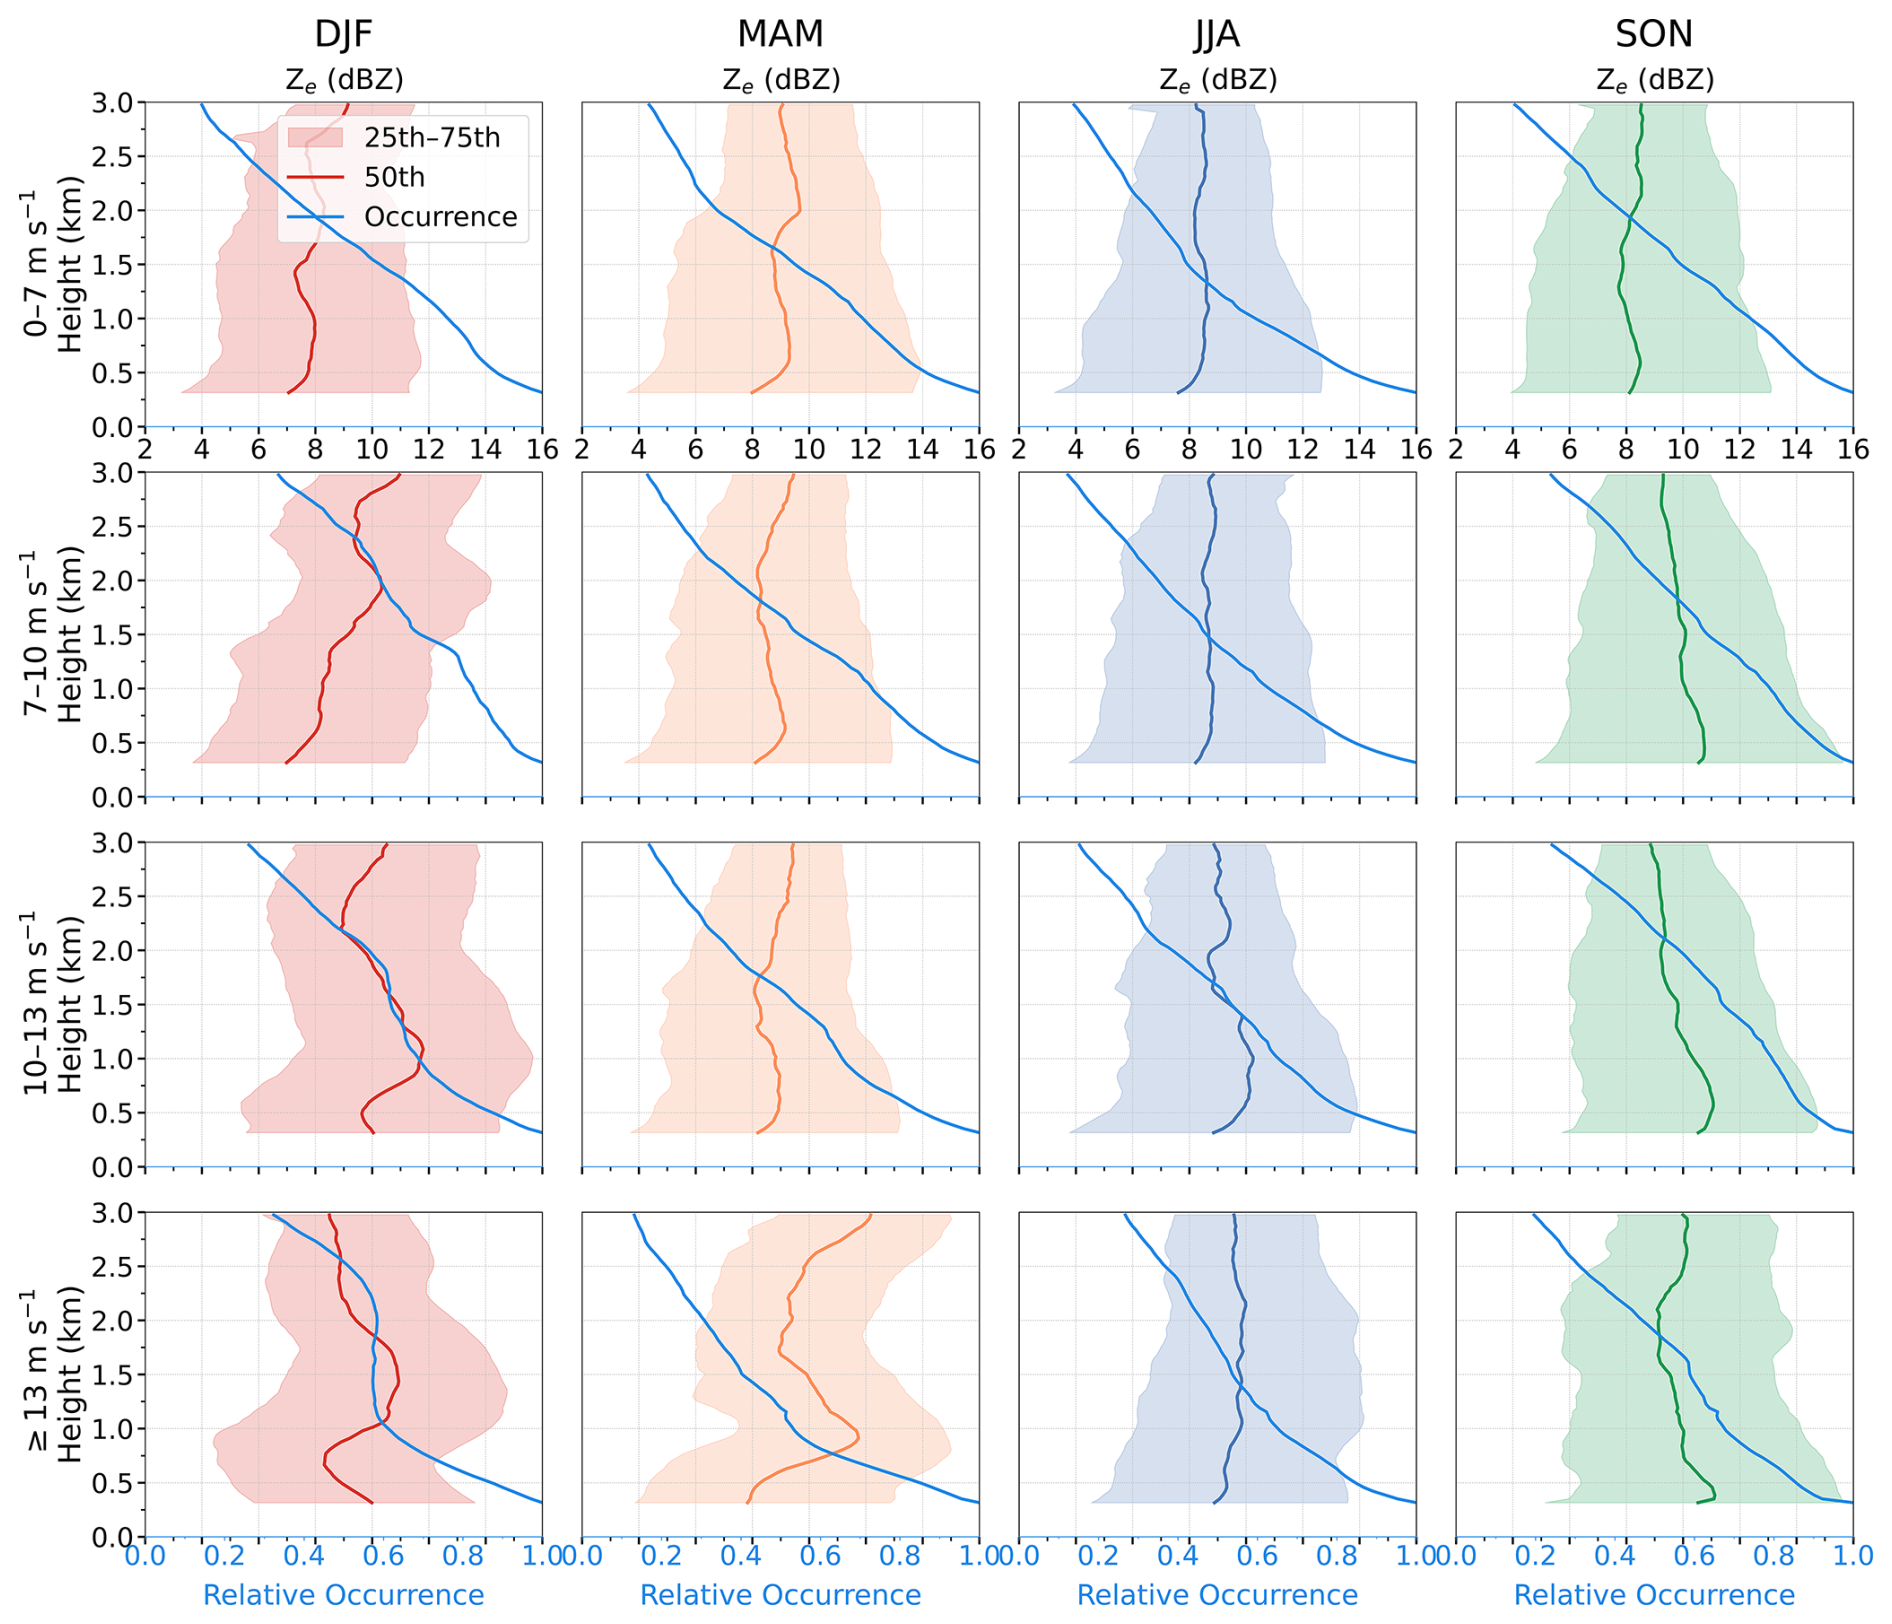
Figure B1Seasonal median profiles of equivalent radar reflectivity under different wind-speed conditions for summer (DJF, red), autumn (MAM, orange), winter (JJA, dark blue), and spring (SON, green). Solid lines denote the median Ze profiles, and the shaded areas indicate the interquartile range between the 25th and 75th percentiles. The light-blue solid line shows the height-dependent relative occurrence of snowfall, normalized by the total number of snowfall cases identified at the lowest usable MRR range gate.
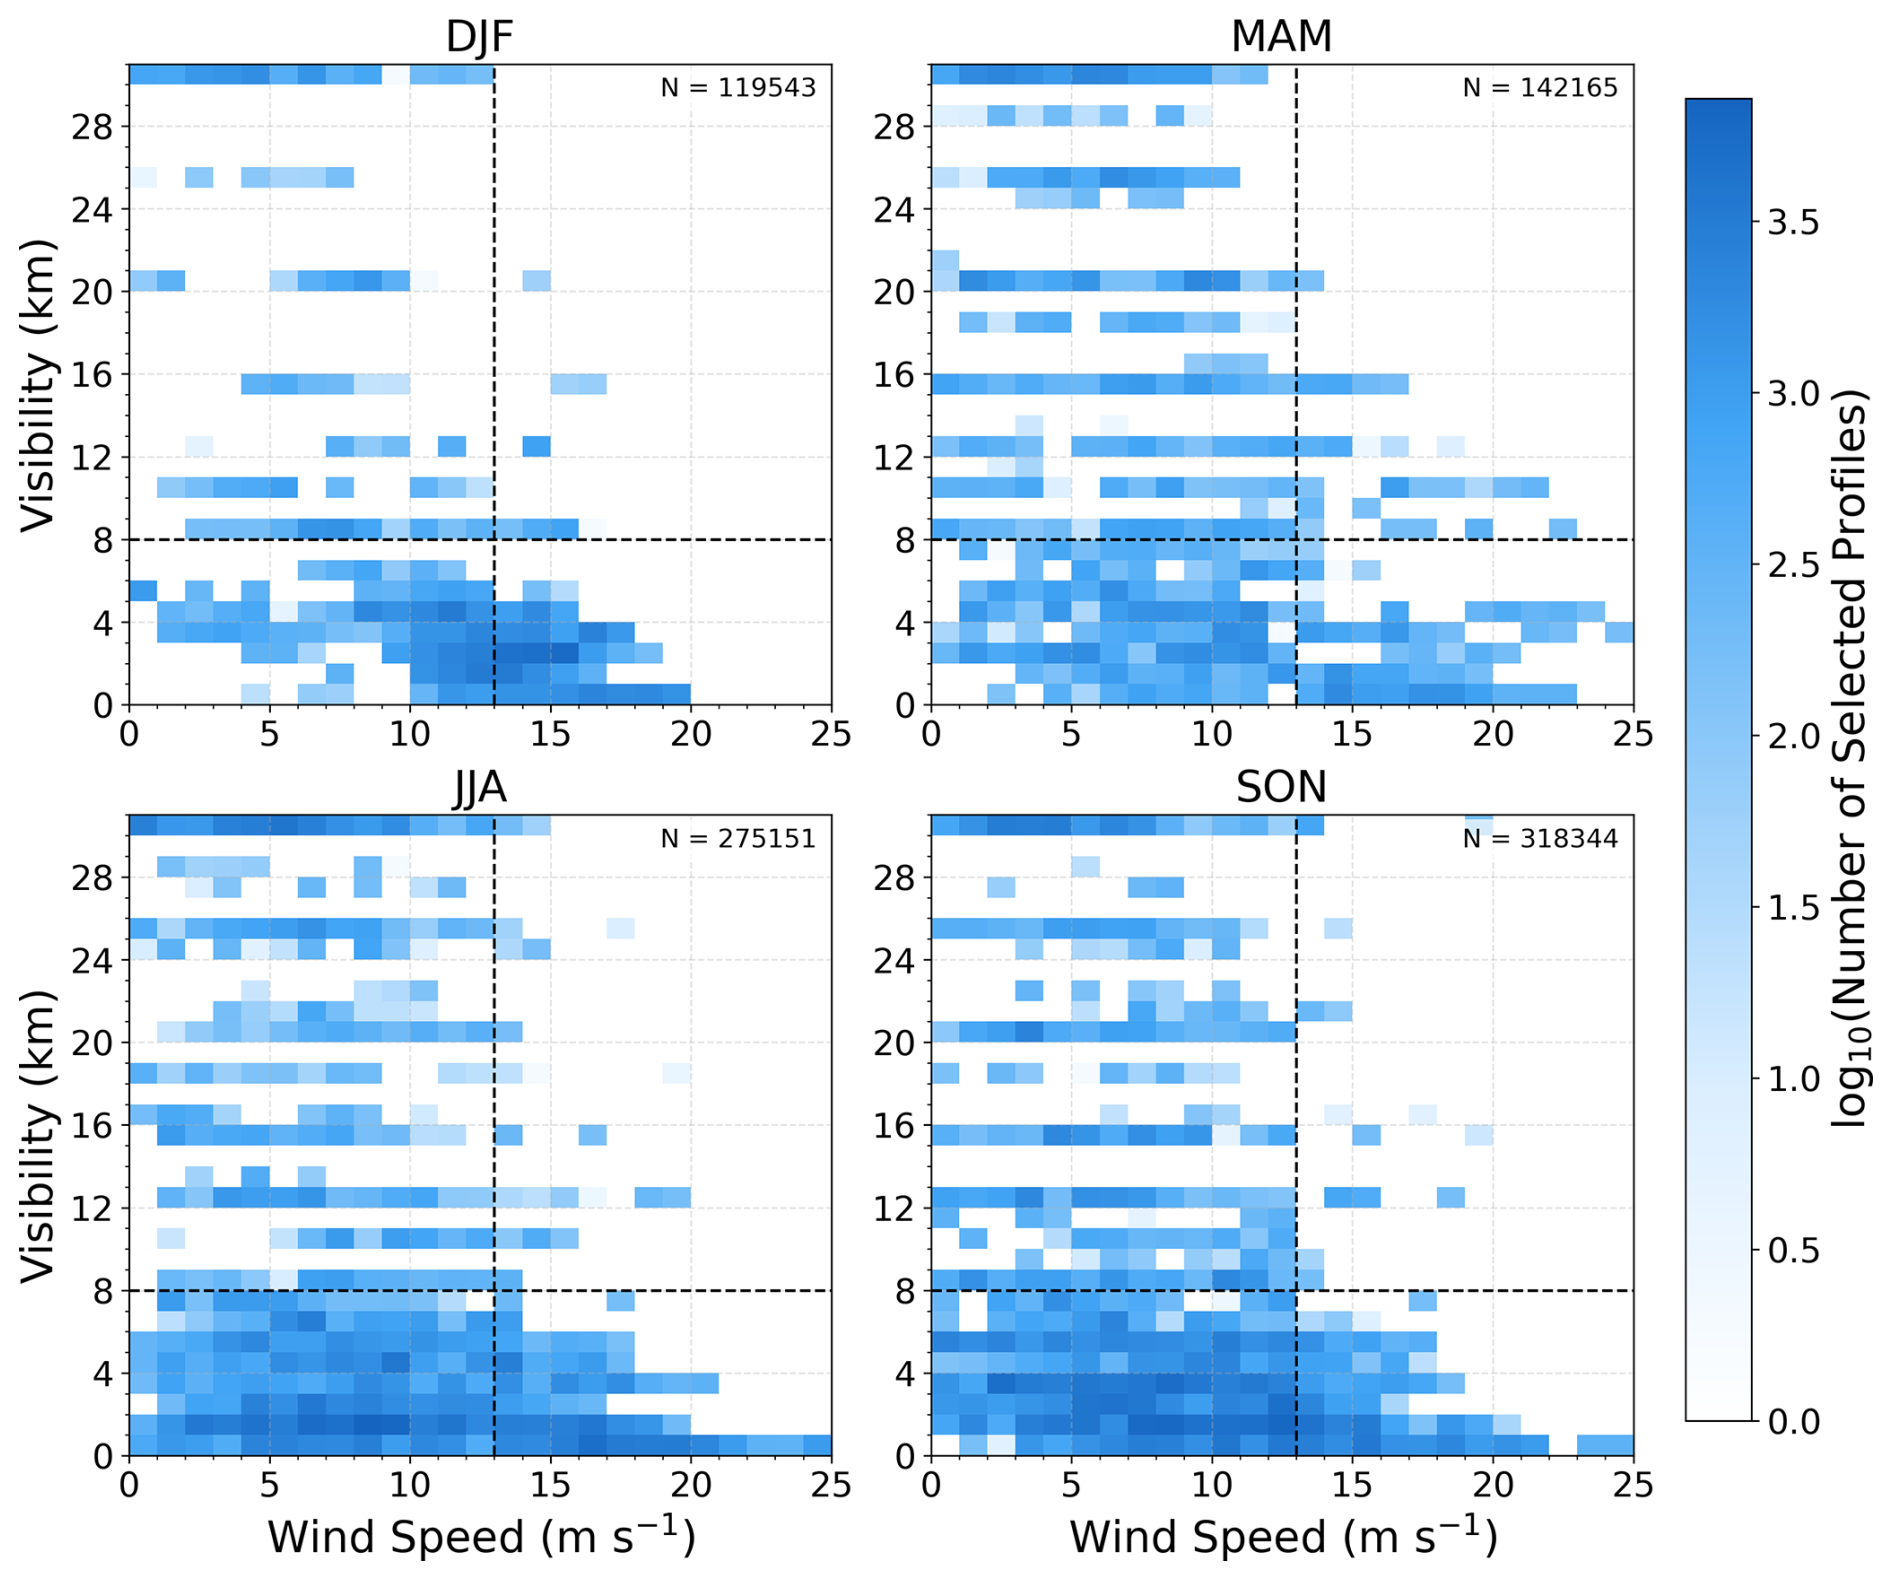
Figure B2Two-dimensional histograms of surface wind speed and visibility for snowfall profiles in different seasons. N denotes the number of snowfall profiles included in the statistics for each season. The vertical black dashed line indicates a wind speed of 13 m s−1, and the horizontal black dashed line indicates a visibility of 8 km.
The MRR data can be accessed from National Arctic and Antarctic Data Center (https://en.pric.org.cn/, last access: 22 July 2026). Surface observations at Great Wall Station can be accessed through the English ScienceDB data page (https://doi.org/10.57760/sciencedb.j00001.00980, Zhang et al., 2024). Additional Great Wall Station observational data can also be made available from the corresponding authors upon request. The ERA5 data used are freely available through the C3S Climate Data Store (https://cds.climate.copernicus.eu, last access: 22 July 2026) and ECMWF archive (https://www.ecmwf.int/en/forecasts/datasets/archive-datasets, last access: 22 July 2026). The data used for plotting the Antarctic map are available from Quantarctica (https://npolar.no/quantarctica/, last access: 22 July 2026; Matsuoka et al., 2021).
This research was designed by all authors. Jiayi Sun, Haoran Li and Minghu Ding carried out the data analysis. Jiayi Sun wrote the initial draft and all coauthors contributed to the writing.
The contact author has declared that none of the authors has any competing interests.
Publisher's note: Copernicus Publications remains neutral with regard to jurisdictional claims made in the text, published maps, institutional affiliations, or any other geographical representation in this paper. The authors bear the ultimate responsibility for providing appropriate place names. Views expressed in the text are those of the authors and do not necessarily reflect the views of the publisher.
The MRR data and AWS were collected by the observers at Great Wall Station in Antarctica. We are grateful to them for providing the meteorological data and AWS information.
This research has been supported by the National Natural Science Foundation of China (grant nos. 42525607, 42475095, and 42305087) and the Basic Research Fund of the Chinese Academy of Meteorological Sciences (grant no. 2024Z007).
This paper was edited by Michiel van den Broeke and reviewed by Christophe Genthon and two anonymous referees.
Agosta, C., Fettweis, X., and Datta, R.: Evaluation of the CMIP5 models in the aim of regional modelling of the Antarctic surface mass balance, The Cryosphere, 9, 2311–2321, https://doi.org/10.5194/tc-9-2311-2015, 2015.
Alexander, S. P., Protat, A., Berne, A., and Ackermann, L.: Radar-derived snowfall microphysical properties at davis, antarctica, J. Geophys. Res.-Atmos., 128, e2022JD038389, https://doi.org/10.1029/2022JD038389, 2023.
DeConto, R. M. and Pollard, D.: Contribution of antarctica to past and future sea-level rise, Nature, 531, 591–597, https://doi.org/10.1038/nature17145, 2016.
Ding, H., Li, H., and Liu, L.: Improved spectral processing for a multi-mode pulse compression Ka–Ku-band cloud radar system, Atmos. Meas. Tech., 15, 6181–6200, https://doi.org/10.5194/amt-15-6181-2022, 2022a.
Ding, M., Han, W., Zhang, T., Yue, X., Fyke, J., Liu, G., and Xiao, C.: Towards more snow days in summer since 2001 at the great wall station, antarctic peninsula: The role of the amundsen sea low, Adv. Atmos. Sci., 37, 494–504, https://doi.org/10.1007/s00376-019-9196-5, 2020.
Ding, M., Zou, X., Sun, Q., Yang, D., Zhang, W., Bian, L., Lu, C., Allison, I., Heil, P., and Xiao, C.: The PANDA automatic weather station network between the coast and Dome A, East Antarctica, Earth Syst. Sci. Data, 14, 5019–5035, https://doi.org/10.5194/essd-14-5019-2022, 2022b.
Grazioli, J., Madeleine, J.-B., Gallée, H., Forbes, R. M., Genthon, C., Krinner, G., and Berne, A.: Katabatic winds diminish precipitation contribution to the antarctic ice mass balance, P. Natl. Acad. Sci. USA, 114, 10858–10863, https://doi.org/10.1073/pnas.1707633114, 2017a.
Grazioli, J., Genthon, C., Boudevillain, B., Duran-Alarcon, C., Del Guasta, M., Madeleine, J.-B., and Berne, A.: Measurements of precipitation in Dumont d'Urville, Adélie Land, East Antarctica, The Cryosphere, 11, 1797–1811, https://doi.org/10.5194/tc-11-1797-2017, 2017b.
Grazioli, J., Berne, A., Ferrone, A., and Gehring, J.: Weather radar measurements in antarctica, in: Advances in Weather Radar. Volume 2: Precipitation science, scattering and processing algorithms, edited by: Bringi, V. N., Mishra, K. V., and Thurai, M., Institution of Engineering and Technology, 409–438, https://doi.org/10.1049/SBRA557G_ch10, 2023.
Li, H. and Moisseev, D.: Two layers of melting ice particles within a single radar bright band: Interpretation and implications, Geophys. Res. Lett., 47, e2020GL087499, https://doi.org/10.1029/2020GL087499, 2020.
Li, H., Tiira, J., von Lerber, A., and Moisseev, D.: Towards the connection between snow microphysics and melting layer: insights from multifrequency and dual-polarization radar observations during BAECC, Atmos. Chem. Phys., 20, 9547–9562, https://doi.org/10.5194/acp-20-9547-2020, 2020.
Maahn, M. and Kollias, P.: Improved Micro Rain Radar snow measurements using Doppler spectra post-processing, Atmos. Meas. Tech., 5, 2661–2673, https://doi.org/10.5194/amt-5-2661-2012, 2012.
Matsuoka, K., Skoglund, A., Roth, G., de Pomereu, J., Griffiths, H., Headland, R., Herried, B., Katsumata, K., Le Brocq, A., Licht, K., Morgan, F., Neff, P. D., Ritz, C., Scheinert, M., Tamura, T., Van de Putte, A., van den Broeke, M., von Deschwanden, A., Deschamps-Berger, C., Van Liefferinge, B., Tronstad, S., and Melvær, Y.: Quantarctica, an integrated mapping environment for antarctica, the southern ocean, and sub-antarctic islands, Environ. Model. Softw., 140, 105015, https://doi.org/10.1016/j.envsoft.2021.105015, 2021.
Planat, N., Gehring, J., Vignon, É., and Berne, A.: Identification of snowfall microphysical processes from Eulerian vertical gradients of polarimetric radar variables, Atmos. Meas. Tech., 14, 4543–4564, https://doi.org/10.5194/amt-14-4543-2021, 2021.
Roussel, M., Wiener, V., Genthon, C., Vignon, E., Bazile, E., Agosta, C., Berne, A., Durán-Alarcón, C., Dufresne, J., and Claud, C.: Assessing the simulation of snowfall at dumont d'urville, antarctica, during the YOPP-SH special observing campaign, Q. J. Roy. Meteor. Soc., 149, 1391–1406, https://doi.org/10.1002/qj.4463, 2023.
Scarchilli, C., Ciardini, V., Grigioni, P., Iaccarino, A., Silvestri, L. D., Proposito, M., Dolci, S., Camporeale, G., Schioppo, R., Antonelli, A., Baldini, L., Roberto, N., Argentini, S., Bracci, A., and Frezzotti, M.: Characterization of snowfall estimated by in situ and ground-based remote-sensing observations at terra nova bay, victoria land, antarctica, J. Glaciol., 66, 1006–1023, https://doi.org/10.1017/jog.2020.70, 2020.
Schoger, S. Y., Moisseev, D., Lerber, A. von, Crewell, S., and Ebell, K.: Snowfall-rate retrieval for K- and W-band radar measurements designed in hyytiälä, finland, and tested at ny-ålesund, svalbard, norway, J. Appl. Meteorol. Climatol., https://doi.org/10.1175/JAMC-D-20-0095.1, 2021.
Souverijns, N., Gossart, A., Lhermitte, S., Gorodetskaya, I. V., Kneifel, S., Maahn, M., Bliven, F. L., and van Lipzig, N. P. M.: Estimating radar reflectivity – snowfall rate relationships and their uncertainties over antarctica by combining disdrometer and radar observations, Atmos. Res., 196, 211–223, https://doi.org/10.1016/j.atmosres.2017.06.001, 2017.
van Wessem, J. M., van de Berg, W. J., Noël, B. P. Y., van Meijgaard, E., Amory, C., Birnbaum, G., Jakobs, C. L., Krüger, K., Lenaerts, J. T. M., Lhermitte, S., Ligtenberg, S. R. M., Medley, B., Reijmer, C. H., van Tricht, K., Trusel, L. D., van Ulft, L. H., Wouters, B., Wuite, J., and van den Broeke, M. R.: Modelling the climate and surface mass balance of polar ice sheets using RACMO2 – Part 2: Antarctica (1979–2016), The Cryosphere, 12, 1479–1498, https://doi.org/10.5194/tc-12-1479-2018, 2018.
Wiener, V., Roussel, M.-L., Genthon, C., Vignon, É., Grazioli, J., and Berne, A.: A 7-year record of vertical profiles of radar measurements and precipitation estimates at Dumont d'Urville, Adélie Land, East Antarctica, Earth Syst. Sci. Data, 16, 821–836, https://doi.org/10.5194/essd-16-821-2024, 2024.
Zhang, W., Wang, X., Wu, L., Bian, L., Lu, C., and Ding, M.: Meteorological observation data from the Great Wall station and Zhongshan station in Antarctica during the past 35 years. V2, Science Data Bank [data set], https://doi.org/10.57760/sciencedb.j00001.00980, 2024.
- Abstract
- Introduction
- Data and methods
- Results
- Discussion and conclusion
- Appendix A: Detailed local topographic map in the vicinity of Great Wall Station
- Appendix B: Seasonal Snowfall Reflectivity Profiles and Wind-Speed–Visibility Distributions
- Data availability
- Author contributions
- Competing interests
- Disclaimer
- Acknowledgements
- Financial support
- Review statement
- References
- Abstract
- Introduction
- Data and methods
- Results
- Discussion and conclusion
- Appendix A: Detailed local topographic map in the vicinity of Great Wall Station
- Appendix B: Seasonal Snowfall Reflectivity Profiles and Wind-Speed–Visibility Distributions
- Data availability
- Author contributions
- Competing interests
- Disclaimer
- Acknowledgements
- Financial support
- Review statement
- References