the Creative Commons Attribution 4.0 License.
the Creative Commons Attribution 4.0 License.
 | 23 Jun 2026
Air mass origin and local impacts on Antarctic snow isotopic composition: an observation and modelling study
Mathieu Casado
Christophe Leroy-Dos Santos
Amaelle Landais
Niels Dutrievoz
Cécile Agosta
Pete D. Akers
Joel Savarino
Andrea Spolaor
Massimo Frezzotti
Barbara Stenni
Water stable isotopes (δ18O and δD) from ice cores are widely used to reconstruct past temperature variations through their well-established relationship with local air temperature, commonly referred to as “isotopic paleothermometer”. However, depositional and post-depositional effects lead to large uncertainties in the use this proxy in Antarctica. The magnitude of these uncertainties strongly depends on site location, with larger impacts in low-accumulation regions of East Antarctic Plateau. Depositional effects include origin of moisture, which exhibits asymmetries shaped by the continent's geographical and topographical features, as well as precipitation intermittency, which introduces aliasing in the archived signal. Post-depositional processes, such as sublimation and firn-atmosphere exchange, further alter the isotopic composition of snow before its transformation into ice, thereby modifying the correlation between δ18O and temperature. Here, we present new water isotope measurements from surface snow collected during the East Antarctic International Ice Sheet Traverse (EAIIST), across a remote region of the East Antarctic Plateau. The traverse – crossing a transitional zone between predominately Indian and Pacific moisture sources – provides unique insights into the key role of air mass origin in shaping the isotopic composition of snow. Comparison with LMDZ6iso simulations indicates that the model successfully captures the spatial variability of δ18O-temperature relationship between different basins, with statistically significant correlations (p < 0.05) when the analysis is extended to the Antarctic dataset. This agreement further suggests the model's ability to predict the temporal slope required for calibrating isotopic ice-core records used for temperature reconstructions, even in regions influenced by multiple moisture sources. Temporal slopes based on monthly precipitation values range from 0.4 ‰ °C−1 to 0.5 ‰ °C−1 for the EAIIST drilling sites. Finally, we quantify the impact of sublimation on isotopic composition of surface snow. Including sublimation in the modelling of surface snow reduces the discrepancy between observed and modelled values, compared to simulations accounting precipitation, from 1.9 ‰ to 1.3 ‰ for δ18O and from 6.6 ‰ to 2.9 ‰ for d-excess. These results highlighting the key role of this post-depositional process on the Antarctic Plateau.
- Article
(5570 KB) - Full-text XML
- BibTeX
- EndNote


Ice cores are valuable archives of past climatic and environmental conditions through many environmental proxies trapped in the ice, such as air bubbles and aerosols, as well as the ice itself, such as its stable water isotopic composition. In East Antarctica, water stable isotopes (δ18O and δD) from the deepest ice cores have been used to reconstruct past temperatures extending back 800 000 years (EPICA community members et al., 2004; Jouzel et al., 2007), and recent efforts aim to extend these reconstructions to 1.5 million years (Beyond EPICA Oldest Ice Core – Parrenin et al., 2017; (Lilien et al., 2021). In this region, ice core temporal resolution is typically limited to multi-annual to multi-decadal scale (Ekaykin et al., 2002; Baroni et al., 2011; Münch et al., 2016). This limitation is due to low accumulation rates and intermittency of precipitation which cause aliasing of the climatic signal recorded by sporadic snowfall events (Ekaykin et al., 2016; Laepple et al., 2018; Casado et al., 2020; Münch et al., 2021). However, ice cores in high-accumulation coastal regions of Antarctica cover shorter temporal ranges but provide finer temporal resolution that can capture seasonal-scale variations (Casado et al., 2023).
Several studies have reported the empirical linear relationship between the isotopic composition of snow and local temperature (Dansgaard, 1964; Lorius et al., 1969; Touzeau et al., 2016). Nevertheless, this relationship is not stable in time and space, as widely documented by direct snow observations and model results (Goursaud et al., 2018; Jouzel et al., 1997). These variations are related to changes in evaporative conditions and transport pathways to condensation sites which influence the isotopic equilibrium and kinetic fractionation processes at each step of the distillation trajectories (Charles et al., 1994; Masson-Delmotte et al., 2011; Werner et al., 2011, Casado et al., 2017). In addition, the second order parameter deuterium excess (d-excess = δD − 8 × δ18O, (Dansgaard, 1964) is highly sensitive to kinetic effects occurring both during evaporation at the ocean surface and along distillation pathways during atmospheric transport. As a result, while over the ocean d-excess is very sensitive to near-surface relative humidity and weakly to temperature, it exhibits the opposite behaviour in central East Antarctica, where it may reflect, at least partially, different moisture origins (Petit et al., 1991; Risi et al., 2013; Vimeux et al., 1999; Jouzel et al., 2003; Masson-Delmotte et al., 2005; Neumann et al., 2005).
Additionally, the reliability of water isotopes as climate proxy from ice core is debated due to the local influence of post-depositional processes in the snowpack. These processes can alter the snow isotopic composition during prolonged exposure at the atmosphere-snow interface and modify the original precipitation's isotope-temperature relationship (Petit et al., 1982; Stenni et al., 2016, Touzeau et al., 2016, Casado et al., 2018). Key post-depositional mechanisms include wind-driven snow redistribution and vapor exchange with the atmosphere, such as sublimation-condensation processes, snowmelt and vapor diffusion within the snowpack driven by forced ventilation (Steen-Larsen et al., 2014; Beria et al., 2018; Casado et al., 2018; Wahl et al., 2022; Ollivier et al., 2025). Among these, sublimation plays an important role especially during the warmer months, decreasing d-excess values (Landais et al, 2017, Casado et al, 2021).
These post-depositional alterations are poorly understood and often overlooked in climatic reconstructions, underscoring the need to better constrain the processes shaping the isotope-temperature relationship in surface snow to improve the reliability of ice core-based temperature estimates (Xiao et al., 2013; Ma et al., 2020).
In this study, we investigate the isotopic composition of snow samples collected roughly every 20 km during the East Antarctic International Ice Sheet Traverse (EAIIST – (Traversa et al., 2023) in 2019–2020. The dataset includes both surface snow and bulk samples, which reflect precipitation over time scales ranging from seasonal to multi-annual periods, respectively. This scientific traverse extended from the coast in Adélie Land into the high interior of the East Antarctic Plateau. We assess the influence of Indian vs. Pacific Ocean moisture sources on the spatial variability of the relationship between δ18O composition of snow and the 2 m air temperature. In addition, we present the d-excess vs. δ18O relationship, which reveals different supersaturation pathways under cold conditions. To place our results in a broader context, we compare them with a subset of surface snow samples from Indian and Pacific sectors of Antarctica, drawn from the dataset compiled by (Masson-Delmotte et al. (2008).
We then evaluate the ability of the atmospheric general circulation model LMDZ6iso to reproduce the observed δ18O-temperature spatial slope by comparing surface snow observations with modelled precipitation. Subsequent to the spatial analysis, we further assess the model's capability to reproduce temporal slopes, which are commonly used in paleoclimate reconstructions of temperature from ice cores.
Finally, surface snow samples collected along the plateau during the outward and return paths of the traverse provide an opportunity to assess post-depositional isotopic modification over time. By comparing the observations with precipitation model outputs, we isolate the impact of sublimation effect on the snow during summer months. This quantification is achieved by applying a metamorphism model proposed by Casado et al. (2021).
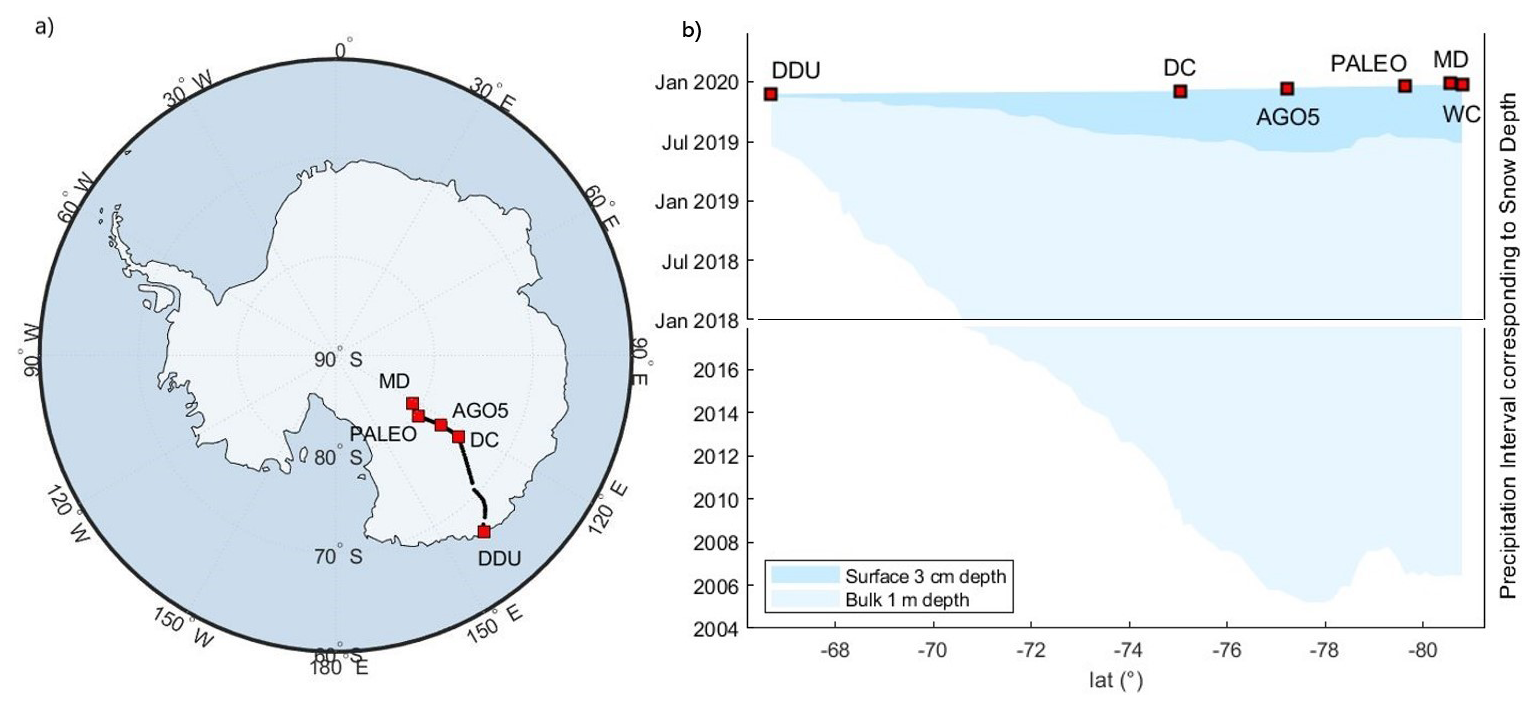
Figure 1(a) Map of EAIIST traverse and (b) precipitation period derived from ERA5, corresponding to surface and bulk snow samples across the traverse. Main sampling sites are marked with red squares: Dumont D'Urville (DDU), Dome C (DC), AGO5, PALEO, and Megadune (MD).
2.1 Geographical area EAIIST
The EAIIST traverse took place during the austral summer 2019–2020. The traverse started in coastal Adélie Land, near the high accumulation site of Dumont D'Urville (DDU: 66°39′ S, 140°01′ E; elevation = 47 ; mean annual temperature of −10.8 °C), until the interior plateau site of Megadune (MD: 80°35′ S, 121°35′ E; elevation = 2973 ), and then returned along the same route back to DDU (Fig. 1a). The traverse route passed by the Dome C site (DC: 75°06′ S, 123°23′ E; elevation = 3233 ; mean annual temperature of −54.5 °C) where the EPICA ice core was drilled (EPICA community members et al., 2004) and where the Concordia station is currently located. Dome C represents the maximum elevation of the traverse.
2.2 EAIIST snow samples and isotope measurements
Two types of surface snow samples were collected: 85 surface samples, representing the upper 3 cm of snow, and 52 bulk samples, consisting of snow integrated over a vertically dug 1 m-deep snowpit. Surface samples were taken at each stop during daytime approximately every 20 km along the 1600 km route from DDU to MD, and onward to DC. A single surface sample at one location was obtained by mixing snow from 10 locations randomly selected over a similar area of 100 m × 100 m, representing an average. Bulk sampling required longer processing time digging 1 m deep snowpit and scratching the snow along the vertical profile and was therefore carried out only during lunch and evening stops. The samples were collected with 50 mL Corning tubes which were sealed to prevent air exchange and kept frozen until arrival to laboratories in Europe. Samples were distributed between the Laboratoire des Sciences du Climat et de l'Environnement of Paris (LSCE, France) and Ca' Foscari University of Venice (UNIVE, Italy) for water isotopic analysis. The samples were melted only immediately prior the measurement to minimise potential alterations of the water isotopic composition. Analyses were performed using a Cavity-Ring Down Spectroscopy (CRDS) analyser PICARRO model L2130-i at UNIVE and LSCE.
The isotopic composition of snow is expressed in delta-notation (‰) (Craig, 1961) relative to laboratory standards, which were previous calibrated against the international standards V-SMOW (Vienna Standard Mean Ocean Water) and V-SLAP (Vienna Standard Light Antarctic Precipitation). The accuracy of PICARRO measurements was determined as the mean difference between measured and true values of laboratory standards, with uncertainty represented by their standard deviation. This yielding an accuracy of −0.01 ‰ for δ18O, −0.07 ‰ for δD, and −0.02 ‰ for d-excess, with corresponding uncertainties of ± 0.07 ‰, ± 0.4 ‰, and ± 0.4 ‰. Previous inter-calibration experiments revealed mean discrepancy between UNIVE and LSCE measurements of the same samples equal to 0.14 ‰ and 0.80 ‰, for δ18O and d-excess, respectively (Petteni et al., 2025).
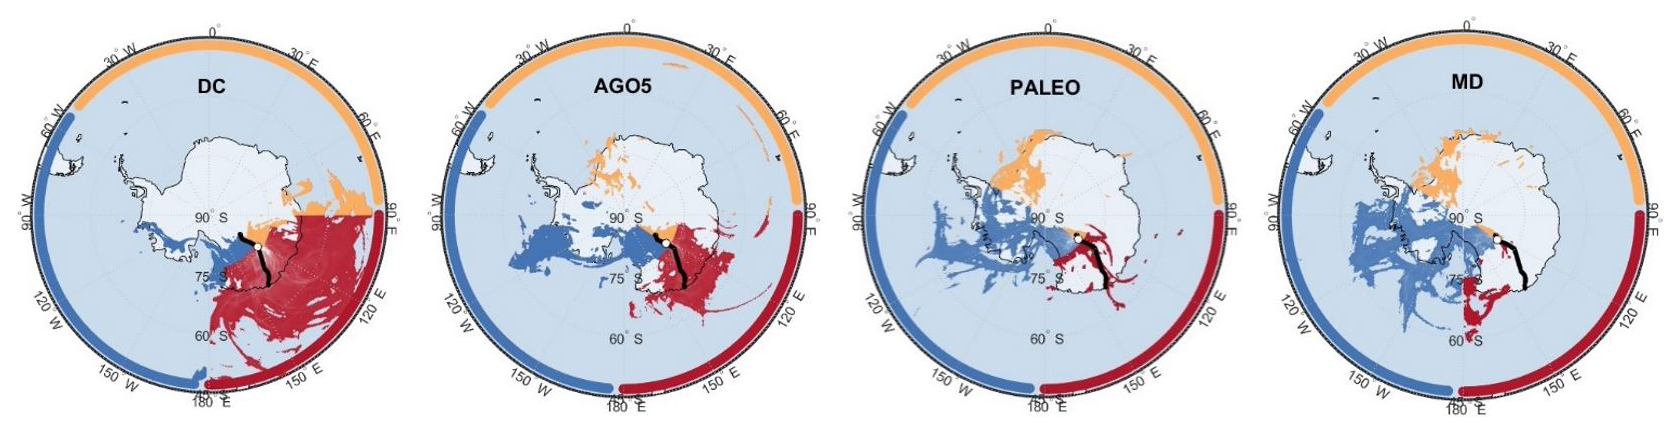
Figure 2Precipitation-weighted air mass back-trajectory distributions for the period 2009–2019 at four key sites: DC, AGO5, PALEO, and MD. Colors indicate air mass origins: Indian (red), Pacific (blue) and Atlantic (orange) oceans.
To estimate the order of magnitude of spatial isotopic variability in surface snow at one location, we report the standard deviation (SD) from previous Antarctic datasets. At Dome C (Casado et al., 2018), the local variability is around 3.4 ‰ for δ18O and 4.1 ‰ for d-excess (defined as 2 SD of replicates obtained in an area of 100 m × 100 m). Since the surface samples correspond at mixed snow from 10 locations, the impact of spatial variability on the error of the mean is expressed as the standard deviation of the mean (also known as standard error, SE):
where s is the SD calculated from individual samples and n is the number of subsamples. Applying this, the expected spatial variability for our composite surface samples is ∼ 1.1 ‰ for δ18O and ∼ 1.3 ‰ for d-excess. Similar SE are observed in the coastal area of Dumont D'Urville, based on the top 2.5 cm of snowpit samples reported by (Landais et al., 2017). Overall, while these values can vary across sites separated by hundreds of kilometres, we set an indicative uncertainty arising from local spatial variability of 1.1 ‰ for δ18O and 1.3 ‰ for d-excess, as reference for interpreting our data.
2.3 Antarctic dataset
To provide a broader spatial analysis, we compare our data with the Antarctic surface snow database of Masson-Delmotte et al. (2008), which offers a comprehensive overview of isotopic variability across the continent. From the original dataset, which includes different types of snow samples, we selected surface snow, bulk snow, snowpit and firn cores that capture signal ranging from annual to approximately 20 years, based on sample depth and local precipitation rates. For the comparison with our snow samples, we divide the dataset in Pacific and Indian sectors, based on (Sodemann and Stohl, (2009). To do this, we classified the region at west of 60° W and the area near the Ross Sea as Pacific sector, while the sampling sites located north then 80° S and between 60 and 180° E as Indian sector. For this dataset, mean δ18O values from LMDZiso model were simulated over the 1980–2000 period, due to the lack of precise temporal coverage of the snow samples.
2.4 FLEXPART back-trajectories
The Lagragian particle dispersion model FLEXPART (FLEXible PARTicle) is employed to calculate 10 d back-trajectories of air masses at 12 h temporal resolution for each sampling site of the traverse located on the Antarctic Plateau. These trajectories are derived for the 500 hPa pressure level, representing mid-tropospheric transport pathways reaching the plateau.
With two trajectories calculated per day over the 2009–2019 period, we computed approximately 7300 trajectories for each site. To allow for a comprehensive multi-annual evaluation and emphasise the air masses leading precipitation events at the sampling sites, the trajectories were averaged and weighted by ERA5 precipitation rates (see Sect. 2.5). The classification of air mass origins into Indian, Pacific and Atlantic sectors is based on their latitudinal and longitudinal distributions, as illustrated in Sect. 3.1, Fig. 2.
2.5 ERA5 climatic signal
We use ERA5 reanalysis data (provided by the European Centre for Medium-Range Weather Forecasts) to estimate the precipitation interval and associated temperature conditions related to snow precipitation of surface and bulk snow samples (Fig. 1b). ERA5 provides hourly precipitation and temperature values at 0.25° spatial resolution.
Prior to the comparison with ERA5, all snow samples were converted to water equivalent using density values of trench measurements at Dome C (Ooms et al., 2026). The densities are equal to 290 kg m−3 for the upper 3 cm of snow and 320 kg m−3 for the upper 1 m. For each sample, precipitation events in ERA5 were sequentially accumulated until the target water-equivalent thickness of the sample was reached. Due to the strong gradient in precipitation rates from the coast (100–300 ) to the plateau (20–50 ), surface samples near DDU represent from 1 to 3 months of snowfalls, whereas those collected on the plateau correspond to up to ∼ 6 months. Similarly, bulk samples represent approximately 1 year of precipitation in coastal areas and up to 15 years at the highest-elevation sites. This estimate considers only snowfall-driven precipitation – excluding accumulation coming from clear-sky precipitation, such as diamond dust and vapor condensation (Stenni et al., 2016) or effects from wind redistribution, erosion, and sublimation – but provides a distinction between seasonal (surface) and multi-seasonal signals (bulk) signals recorded in the samples.
To investigate the δ18O-temperature (δ18O-T) relationship, we compare two temperature metrics. The first is the average 2 m temperature (T) which mainly captures the spatial climatic variability across the continent. The second is the precipitation-weighted temperature (Tpw) which has a more temporal emphasis reflecting the thermal conditions during snowfall events. Indeed, Tpw is an average temperature where the values are weighted according to the amount of snowfalls during each time interval. We calculate T and Tpw for each sampling site, based on the precipitation interval corresponding to surface snow samples (see Sect. 3.1). Furthermore, we calculate the average multi-annual (1980–2020) temperature for both EAIIST and Antarctic snow isotopic database (Masson-Delmotte et al., 2008), enabling a consistent spatial analysis for samples collected during different campaigns.
2.6 LMDZ6iso model data
LMDZ6iso (Risi et al., 2010) is the isotope-enabled version of the atmospheric general circulation model (AGCM) LMDZ6 (Hourdin et al., 2020). We use the LMDZ6iso version 20231022.trunk with the NPv6.3 physical package (Hourdin et al., 2023), which is nearly identical to the IPSL-CM6A atmospheric setup (Boucher et al., 2020), used for phase 6 of the Coupled Model Intercomparison Project CMIP6 (Eyring et al., 2016). We use LMDZ6's standard horizontal Low Resolution (LR) longitude-latitude grid (144 × 142), which corresponds to a 2.0° resolution in longitude and 1.67° in latitude. The vertical grid comprises 79 levels, with the lowest atmospheric level approximately 7 (above ground level) at Dome C. The simulation is nudged towards 6-hourly three-dimensional fields of temperature and wind from the ERA5 reanalysis (Hersbach et al., 2020), using a relaxation time scale of 3 h. Nudging is excluded below the sigma-pressure level equivalent to 850 hPa above sea level, allowing the physics and dynamics of the model to operate freely within the boundary layer. Surface ocean boundary conditions are derived from ERA5 reanalysis monthly mean sea surface temperature and sea-ice concentration fields. The simulation used in this study is described and evaluated over Antarctica in (Dutrievoz et al., 2025). Snow samples are simulated by stacking precipitation events until reaching the target thickness, corresponding to surface and bulk sample depths. The snow layers are precipitation-weighted before averaging, ensuring consistency when compared with the surface and bulk snow data. The error in LMDZ6iso precipitation at Concordia, defined as the difference between modelled and observed values for a supersaturation parameter λ = 0.004 K−1, is 4.0 ‰ for δ18O and 1.9 ‰ for d-excess.
2.7 Snow metamorphism model
The snow metamorphism model proposed by Casado et al. (2021) describes the relative isotopic variations in snow induced by different processes. Additionally, the model quantifies the flux of water transferred from the snow to the atmosphere, starting from the isotopic composition of surface snow remaining after sublimation Rsub-snow, as described the following Eq. (2):
Where Rsnow is the initial composition of the snow, Di and D are the kinetic diffusivity coeffients, αeq-sub is the fractionation coefficient related to sublimation, RH is the relative humidity (Merlivat and Jouzel, 1979) and Ra is the isotopic composition of atmospheric vapor. The exponent k is the roughness parameter (Craig and Gordon, 1965), here set to 0.4. In particular, the model predicts that sublimation during the warmest months lead to a slope steeper than −2 ‰ ‰−1, whereas precipitation input follows a slope of −0.5 ‰ ‰−1.
The isotopic difference between Rsnow and Rsub snow (expressed as ratio) is used to compute the flux of water transferred from the snow to the atmosphere. This computation takes into account the fractionation coefficient associated to sublimation and the initial water quantity of the snow sample. This approach will be used in Sect. 3.6, to isolate the impact of sublimation in surface snow, comparing the outbound and return samples of the traverse.
In addition, we simulate the final composition of the snow, starting from the outbound values and incorporating the snow precipitation input from LMDZ6iso model and taking into account the contribution of sublimation effects for the number of precipitation-free days.
3.1 Air mass back-trajectories
We present precipitation-weighted air mass back-trajectories over the decadal period 2009–2019 for four representative plateau sites (Fig. 2). At Dome C, 90 % of the back-trajectories originates from the Indian Ocean (red), as expected for this part of the East Antarctic Plateau (Sodemann and Stohl, 2009). Although the traverse is topographically divided at Dome C, the transition between the predominance of Indian and Pacific air mass origins occurs farther south. At AGO5, approximately 70 % of precipitation events are associated with the Indian sector, with a secondary influence from Pacific Ocean (blue). Southern sites like PALEO and MD, are influenced by the Pacific Ocean, which accounts for over 85 % of precipitation events, with minor contributions from the Indian (5 %) and Atlantic (10 %) sectors. Based on these observations and the findings of Sodemann and Stohl, (2009) we set the transition between predominately Indian-sourced to predominately Pacific-sourced air masses at approximately 78° S along the EAIIST route (see Appendix A, Fig. A1). Note that these air-mass origins are more representative of the bulk samples rather than the surface snow, as they are computed as the average over 10 years.
3.2 ERA5 temperature signal
The δ18O of surface samples (top 3 cm) collected during the outbound and return ways of the traverse, which represent 5–6 months of snowfalls, exhibits strong correlation with both T and Tpw (R2 = 0.94). However, the two relationships yield different slopes of 0.9 ‰ °C−1 and 0.6 ‰ °C−1, respectively (Fig. 3).
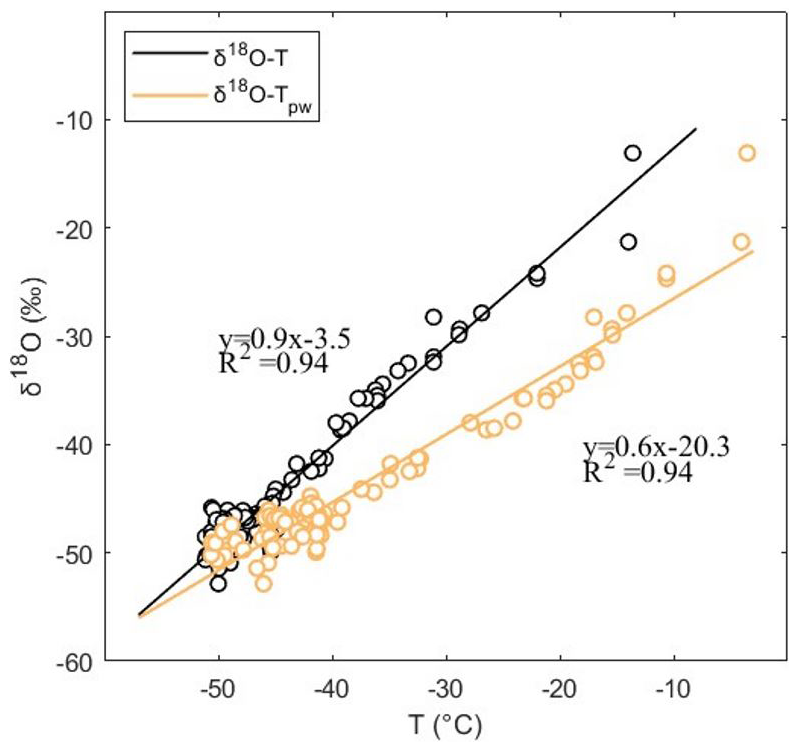
Figure 3δ18O-T vs. δ18O-Tpw relationships evaluated for surface snow samples, calculating mean temperature and precipitation-weighted temperature over time intervals corresponding to 3 cm of snow precipitation.
The δ18O-T slope is consistent with the value obtained from surface, bulk and shallow snow samples of the Antarctic database (Masson-Delmotte et al., 2008) for Adélie Land based on multi-annual temperature (1980–2020). This similarity validates the use of multi-annual temperature (referred as T in the next sections) for spatial analysis of snow samples that represent at least an annual signal. On the other hand, the δ18O-Tpw slope is very close to that observed for precipitation at Dome C (0.5 ‰ °C−1; Dreossi et al., 2024), suggesting that the δ18O-Tpw relationship is closer to approximating the temporal relationship between snow isotopes and local weather.
3.3 Spatial distribution of bulk isotopic composition
The snow isotopic composition of bulk samples ranges from −20.0 ‰ at the coastal site near DDU to −52.5 ‰ at the most inland Megadune site (a comparison with surface samples is provided in Appendix B, Fig. B1). This range greatly exceeds the uncertainty expected from spatial variability per site (∼ 1.1 ‰, see Sect. 2.2), and these values fall well within the range of previous Antarctic surface snow isotopic composition (Fig. 4). Between DDU and Dome C, temperature and δ18O both decline in parallel as the altitude increases. Yet, south of Dome C toward Megadune, the temperature increases as the altitude decreases, but δ18O slightly decreases. Similarly, the d-excess increases linearly from DDU to Dome C but then remains constant further south. Following our back-trajectory air mass results, we divide the EAIIST snow isotopic dataset into two sections split at 78° S.
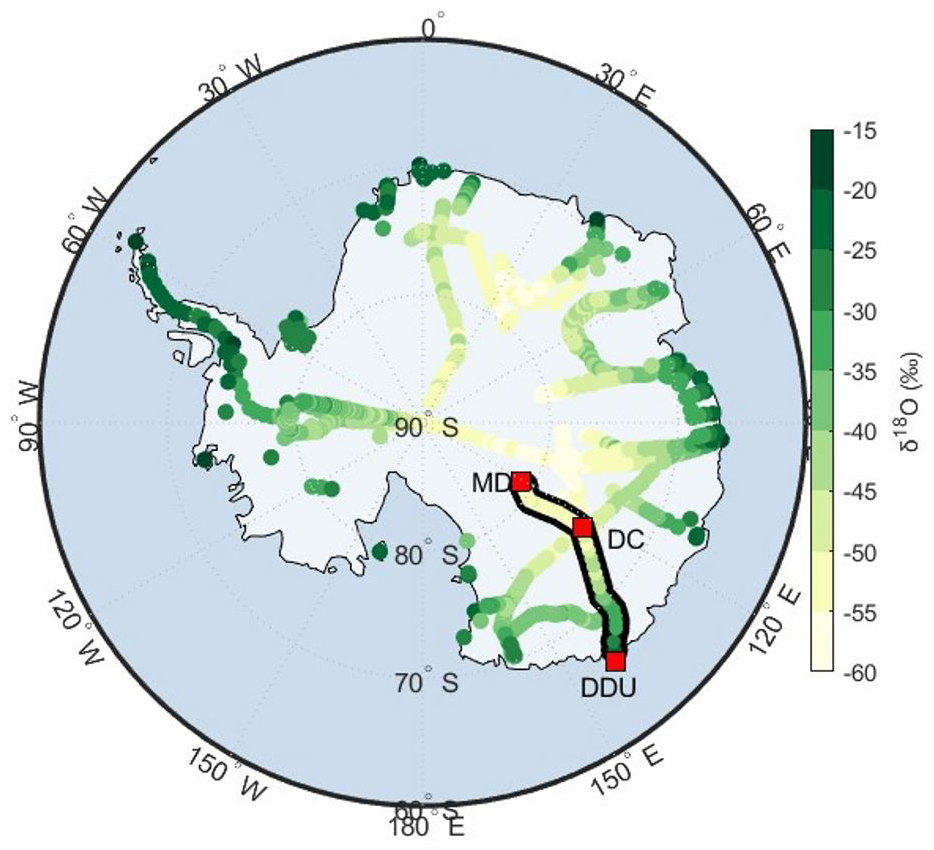
Figure 4Map of Antarctica showing the distribution of the δ18O values of EAIIST bulk samples for Section I (from DDU to DC) and Section II (from DC to MD), outlined with black contours. Values are shown alongside surface, bulk and shallow snow samples from the Antarctic dataset (Masson-Delmotte et al., 2008).
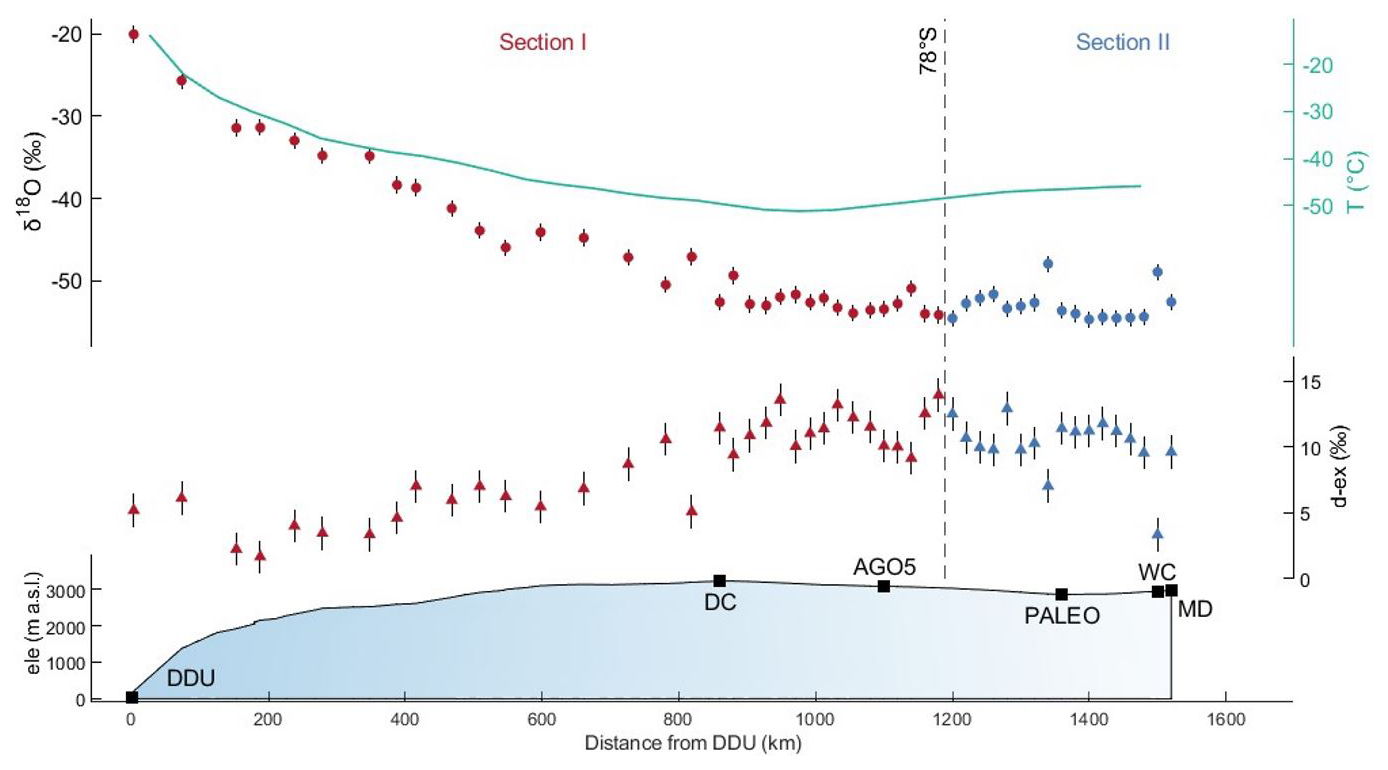
Figure 5Spatial distribution of δ18O and d-excess values of bulk samples for Section I (red dots – north of 78° S) and Section II (blue dots – south of 78° S). The vertical bars represent the uncertainty associated with local variability. Temperature, elevation and distance from DDU are reported.
Table 1Slope and correlation coefficients (R2) of linear relationships between isotopic composition and geographical/climatic variables, calculated for the Antarctic dataset and Sections I and II of the EAIIST traverse. Relationships are shown in bold when statistically significant (defined by p < 0.05).
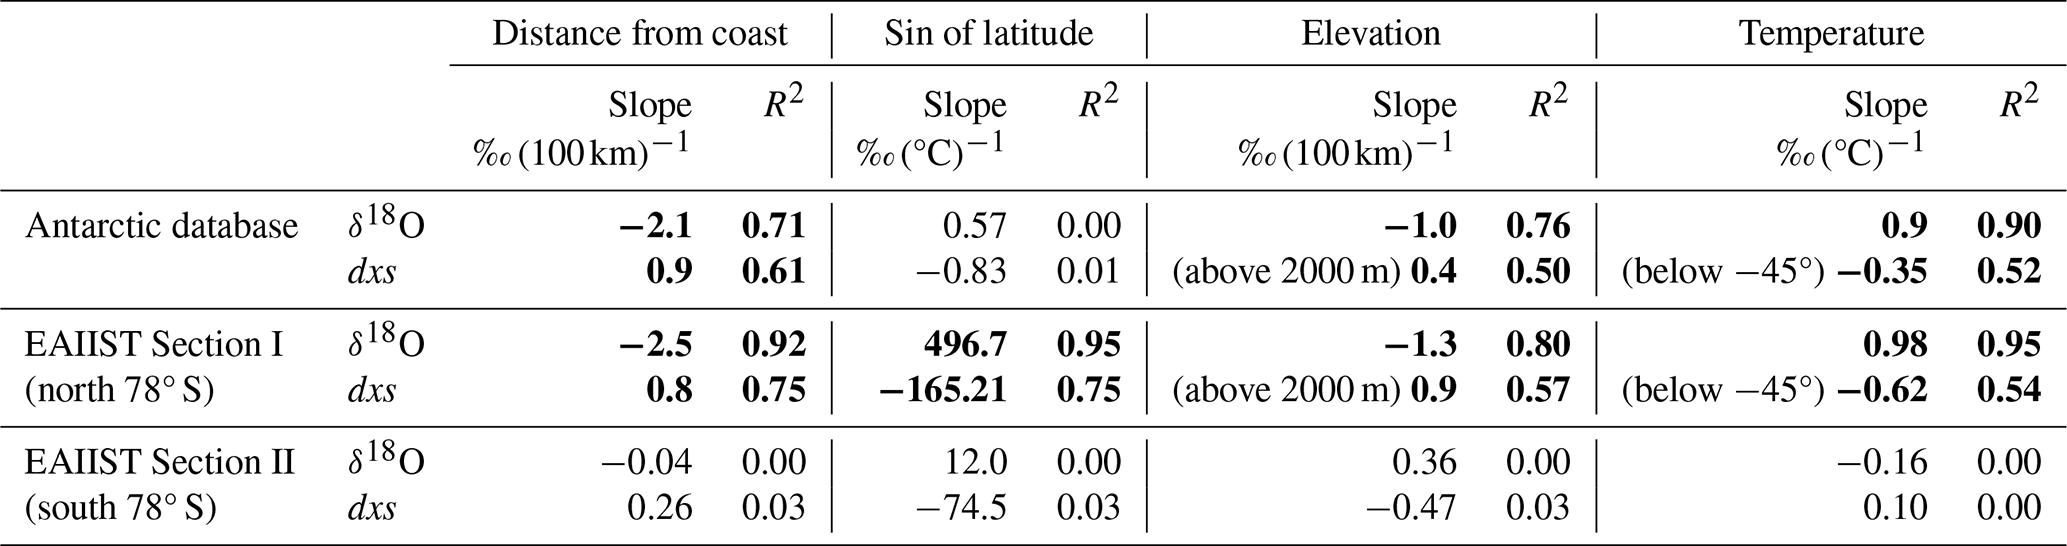
Section I (north of 78° S) exhibits the expected linear relationship between isotopic composition of snow and local climatic and geographic parameters (Table 1, Fig. 5). These factors include distance from the nearest coast, latitude, elevation and mean annual 2 m air temperature. In contrast, in Section II (south of 78° S), these linear correlations disappear for all the mentioned parameters.
Within Section II, where no abrupt temperature variations are observed, two anomalous sites are notable: one located 20 km south of PALEO site, with a δ18O value of −47.9 ‰, and another at the Windcrust site (WC) with a value of −48.9 ‰, roughly 4 ‰ higher than those of the nearby samples. Both sites are also characterised by extremely low d-excess values of 7.0 ‰ and 3.3 ‰, respectively, compared to those observed on the plateau. Such values likely indicate local sublimation (Casado et al., 2021; Wahl et al., 2022). Supporting this interpretation, field observations indicate the presence of large hoar crystals at these sites which experience relatively large strong wind, potentially of katabatic origin (Bintanja, 1998). Although weaker on the plateau than along the continental margins, these winds can persists for extended periods, creating dry conditions that promote sublimation during summer (Grazioli et al., 2017). In Sect. 3.6, we further investigate the impact of sublimation on surface snow based on the comparison between the samples collected during the outward and return paths of the traverse.
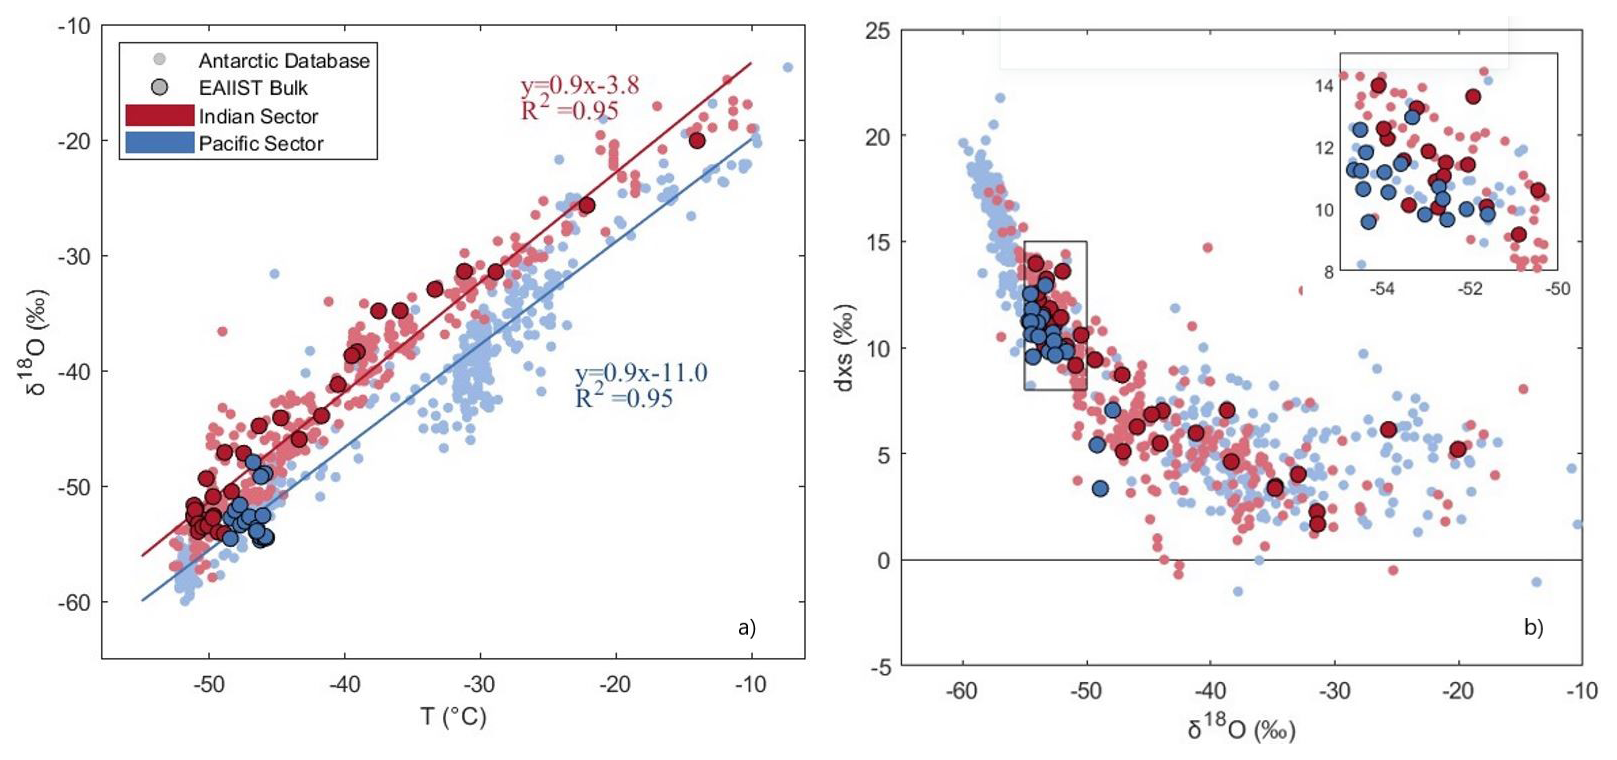
Figure 6(a) δ18O-T relationship and (b) d-excess vs. δ18O for bulk samples of the traverse compared with Antarctic database for Pacific and Indian sectors.
3.4 Moisture origin impact on isotopic composition: observations vs. model outputs
We present the EAIIST and Antarctic datasets subdivided into Pacific and Indian sectors. For the Antarctic dataset, the linear regressions for the δ18O-T relationship independently calculated for each of the two datasets share a common slope of 0.9 ‰ °C−1 but differ in intercept by 7.2 ‰ (Fig. 6a). In the d-excess vs. δ18O relationship, under cold condition (i.e. for δ18O values lower than −45 ‰), the two sectors exhibit distinct compositions, with mean slightly higher d-excess values (∼ 2 ‰) observed for the Indian samples. Instead, in warmer coastal regions, d-excess shows higher variability (Fig. 6b). The comparison with bulk samples of EAIIST reveals that Section I – primarily influenced by Indian sector – exhibits isotopic values consistent with those of the corresponding divide of the Antarctic dataset. In contrast, Section II shows a pattern more aligned with Pacific sector.
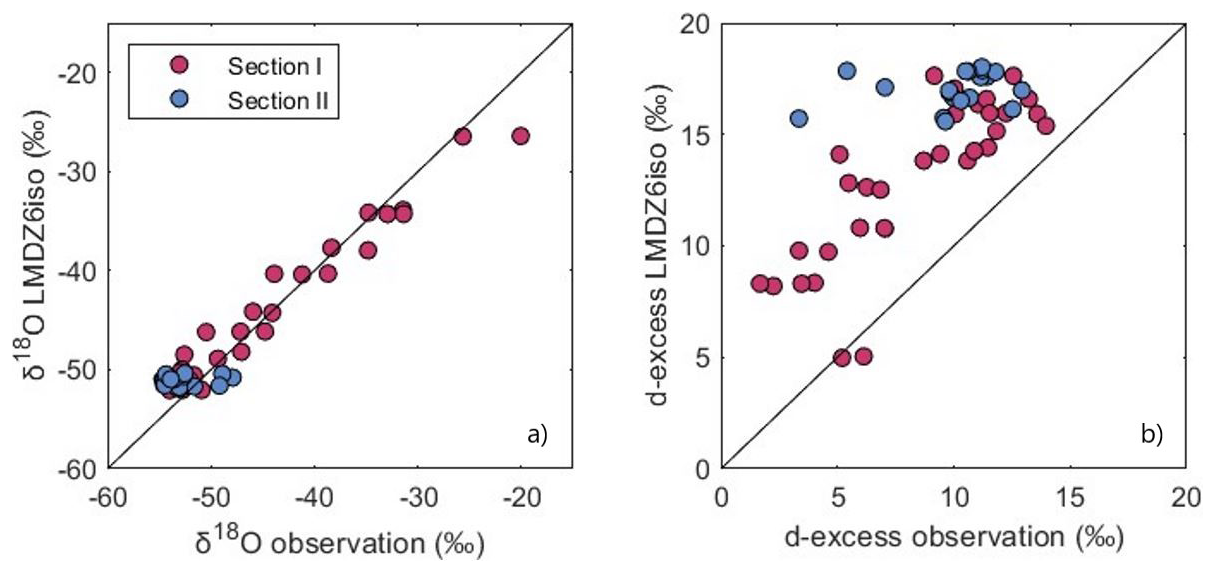
Figure 7(a) δ18O and (b) d-excess LMDZ6iso values vs. bulk observations. The black line is for linear regression.
We compare the observed and LMDZ6iso simulated bulk samples. For δ18O (Fig. 7a), the mean and standard deviation of the differences between observed and modelled δ18O values are −0.95 ± 2.24 ‰ (RMSE = 2.41 ‰), following well the different δ18O-T relationships between Indian and Pacific sector as observed in the Antarctic dataset (Appendix C, Fig. C1). For d-excess (Fig. 7b), the model overestimates the values for both sectors by approximately 5.5 ± 2.48 ‰ (RMSE = 6.07 ‰).
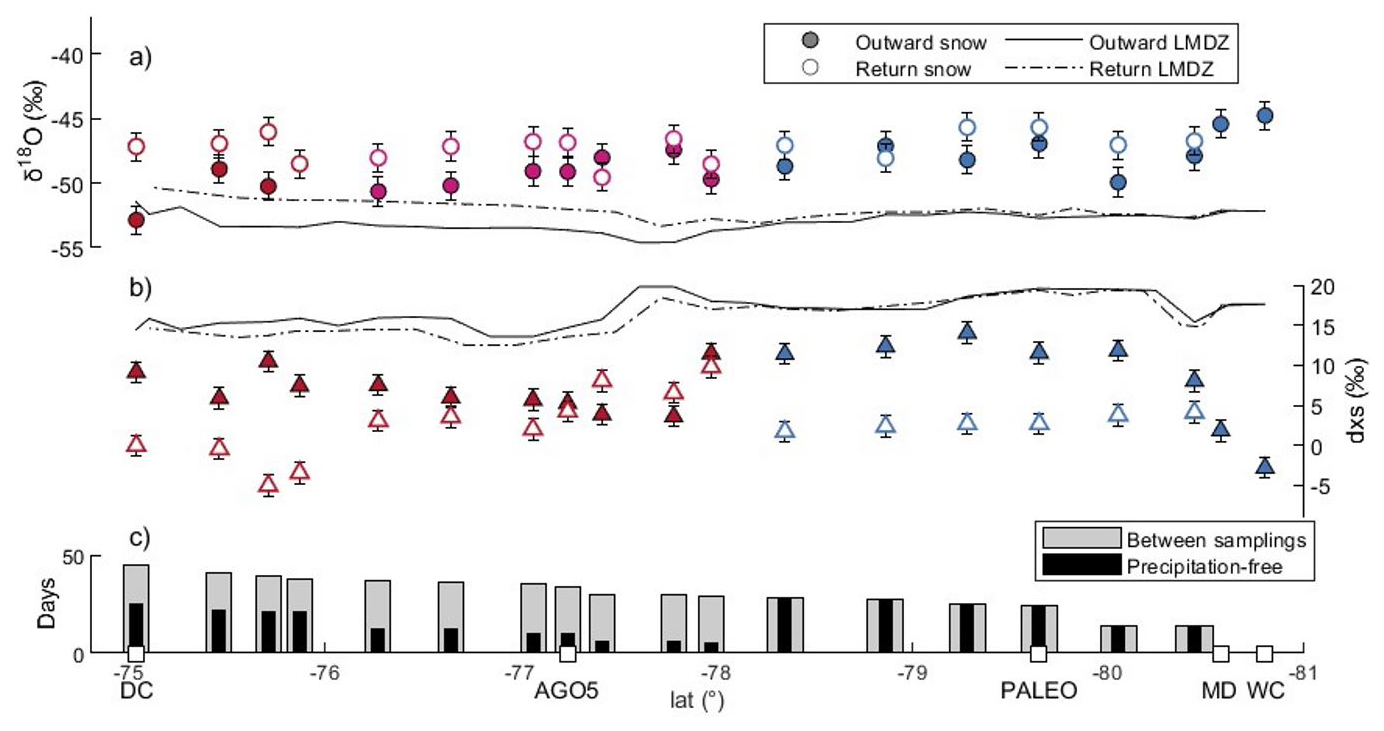
Figure 8(a) δ18O and (b) d-excess composition of outward and return surface snow samples (dots) in comparison to the LMDZ6iso model outputs (lines). Vertical bars indicate spatial variability. (c) The days between the two journeys (grey) and the precipitation-free days prior the return sampling (black).
3.5 Temporal variability of surface isotopic composition
To assess the impact of post-depositional effects on the isotopic composition of the snow, we compare surface samples (representing a seasonal signal) collected during the outward and return ways of the EAIIST traverse across the plateau region (sampled between 10 and 50 d apart). The return isotopic composition is, on average, slightly higher for δ18O by approximately 3 ‰ (Fig. 8a), while d-excess is lower, by 5 ‰–10 ‰ (Fig. 8b). Limited snowfall for most of the sites over the plateau suggests that post-depositional processes could be responsible for the difference observed, allowing for prolonged interaction at the snow-atmosphere interface.
We evaluate the contribution of precipitation to the metamorphism of surface snow between the outward and return journey using the LMDZ6iso simulation outputs. The contribution of precipitation would lead to an increase of up to 2 ‰ for δ18O and a decrease of ∼ 1 ‰ for d-excess at sites north of 78° S. South of 78° S, the model suggests no change in surface snow isotopic composition due to precipitation. Using ERA5, we investigate the precipitation patterns between the outward and return samplings. In Section I, we identify 7–20 precipitation-free days and a total precipitation of 5–8 mm of fresh snow (corresponding to ∼ 25 % of the surface sample). In contrast, Section II experienced 10–20 dry days with no notable precipitation inputs (Fig. 8c).
3.6 Modelled sublimation effects on surface snow
In Sect. 3.5, we showed that precipitation input alone could not explain the change of isotopic composition of the surface samples between the outbound and return journeys. Here, we assess whether sublimation – commonly associated with an enrichment in δ18O along with a decrease of d-excess (Dietrich et al., 2023; Hughes et al., 2021) – can explain, at least in part, the variations observed. To this end, we compare the relative variations in d-excess and δ18O against the snow metamorphism conceptual model proposed by (Casado et al., 2021), which is able to link the relative change of d-excess and δ18O to the sublimated fluxes in the atmosphere (see Sect. 2.7). Overall, our observations support this framework: isotopic changes along Section II – during which no precipitation occur according to ERA5 – closely follow the modelled metamorphic modification of isotopic composition characterised by a slope of of −2 ‰ ‰−1 (blue dots in Fig. 9) (Casado et al., 2021). For Section I, as shown in Sect. 3.5, precipitation accounts for a 25 % of the return sample weight, as a result, we expect a mix with the contibution of precipitation, characterised by a slope of −0.5 ‰ ‰−1 (Casado et al., 2021). We observe that the surface snow in Section I evolved following a slope of −1.1 ‰ ‰−1 (red dots in Fig. 9), which match the hypothesis of an input dominated by sublimation, with a contribution from the precipitation input.
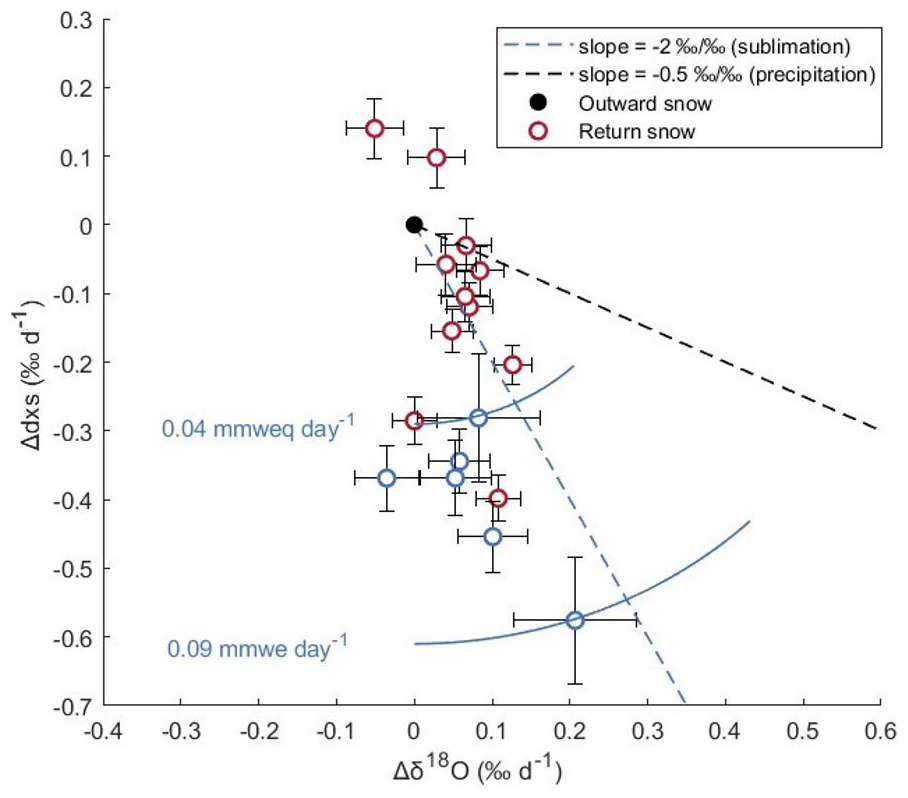
Figure 9d-excess vs. δ18O evolution of snow per day for Section I (empty red dots) and II (empty blue dots) centered on outward composition (black dot), in comparison with modeled sublimation slope (blue dashed line) and precipitation slope (black dashed line). The fluxes relative to sublimation are expressed in . The errorbars represent the uncertainty from spatial variability.
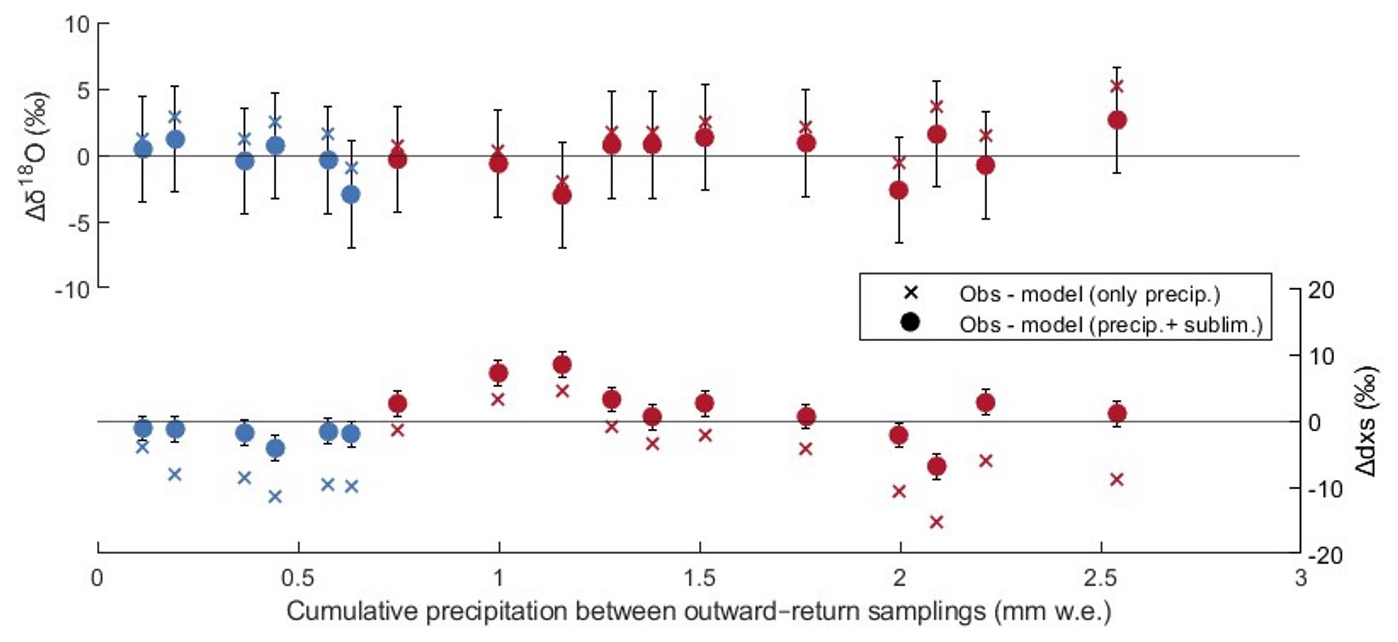
Figure 10Difference between return-snow observations and modelled δ18O and d-excess values, for Section I (red) and Section II (blue). Modelled values are calculated considering either precipitation only (crosses) or both precipitation and sublimation effects (circles). Error bars represent the uncertainty of the LMDZ6iso model in simulating the isotopic precipitation at Concordia (Dutrievoz et al., 2025). The x-axis indicates the cumulative precipitation between the outward and return samplings.
We use Section II data, driven solely by sublimation, to estimate the flux of water transfered from the snow to the atmosphere (eq. Sect. 2.7). The estimated sublimation fluxes range from 0.04 to 0.09 (Fig. 9), falling towards the lower end of previous estimates (0.05–0.35 ; Ollivier et al., 2025). It is important to note that the values reported by Ollivier et al. (2025) represent daily estimates and therefore reflect substantial day-to-day variability driven by changes in insolation, cloud cover, temperature, and wind speed, as well as processes such as nighttime condensation. In contrast, our estimates represent averages over periods of up to 50 d. Therefore, they integrate over both days with intense sublimation and days with limited or no sublimation (e.g., cloudy or snowy conditions), resulting in a narrower overall range.
We use this sublimation impact for modeling the final composition of the snow along the whole traverse, using outward snow samples as the initial condition. This calculation accounts for the number of precipitation-free days between samplings (from ERA5), and incorporates precipitation input from the LMDZ6iso model. The final δ18O and d-excess modeled composition is estimated as:
The difference between observed versus modelled final values are shown in Fig. 10. Red symbols represent Section I sampling sites, characterized by high precipitation (> 1 ) between outbound and return samplings, for which freshly precipitation represents ∼ 25 % of the sampled snow. Blue symbols represent Section II sites with low precipitation (< 1 ), characterised by negligible precipitation. The modelled values are presented considering either only the precipitation input or both precipitation and sublimation effects. Including sublimation in the computation reduces the discrepancy for all Section II sites and for the majority of Section I sites. The mean absolute difference decreases from 1.9 to 1.3 ‰ for δ18O, and from 6.6 to 2.9 ‰ for d-excess.
3.7 Discussion
3.8 Air mass origins and δ18O-temperature slopes
The spatial δ18O-T relationship has traditionally been used to calibrate isotopic paleothermometer (Dansgaard, 1964; Lorius et al., 1969). However, several studies have shown that it is generally less accurate than the δ18O-T temporal slope derived at a single site (Sime et al., 2008; Casado et al., 2017). The EAIIST traverse, which crosses two sectors of East Antarctica influenced by distinct air mass origins yet characterised by relatively similar climatic conditions, provides valuable insights into the role of moisture sources in shaping both spatial and temporal slopes. These observations also highlight the potential to model such relationships in regions where long-term temporal records are not available.
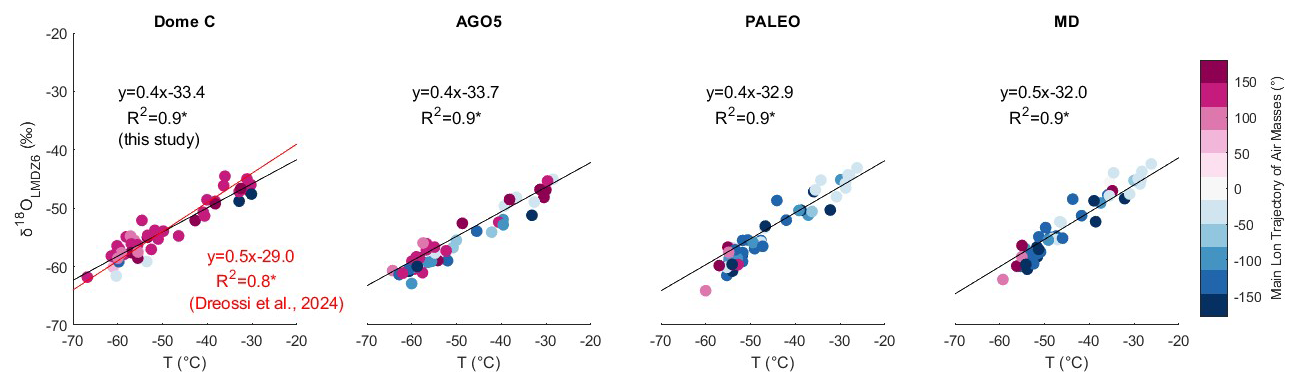
Figure 11δ18O-T relationship for monthly samples simulated by LMDZ6iso at Dome C, AGO5, PALEO and MD sites. The color scale indicates the dominant longitudinal origin of air masses associated with each monthly precipitation event. Significant linear relationship (p value < 0.05) is indicated by asterisks.
The spatial analysis of EAIIST Section I showed a significant δ18O-T relationship over the Indian sector (p < 0.05; Table 1), while no significant correlation was detected for Section II. It is important to note that Section II has limited spatial coverage, as the traverse did not extend to the Pacific coast, and the temperature range along this 300 km transect is correspondingly narrow. Therefore, the absence of a detectable correlation cannot be interpreted as evidence that a δ18O–T relationship is lacking in this sector, as confirmed by analysis of the broader Antarctic dataset (Fig. 6a), which shows statistically significant correlations in both sectors (p < 0.05). The spatial slopes for the two basins are similar (0.9 ‰ °C−1), reflecting comparable thermal history of air mass from the coasts to the high-elevation regions in the interior of the continent (Helsen et al., 2007), while differences in the intercepts are attributed to contrasting vapor isotopic compositions associated with distinct source regions and longer transport pathways for Pacific air masses.
Results from LMDZ6iso model reproduce the inter-sector differences in δ18O-T spatial slopes for EAIIST (Figs. 7a and C1a), and for the broader Antarctic dataset (Fig. C2). Although a comprehensive quantitative evaluation of the LMDZ6iso model is beyond the scope of this study, the qualitative comparison indicates that the model successfully captures the observed spatial variability associated with differing air mass influences. This supports the hypothesis that LMDZ6iso is also able to simulate temporal δ18O-T slopes. However, given the limited spatial coverage of Section II, future field campaigns should be targeted toward the Pacific sector on the East plateau to further investigate and validate this hypothesis.
Monthly δ18O-T relationships, derived from modelled precipitation at single sites (i.e. Dome C, AGO5, PALEO and MD; Fig. 11), account for varying moisture sources and yield temporal slopes of 0.4–0.5 ‰ °C−1 (R2 = 0.9). At Dome C, this prediction is consistent with observed monthly precipitation collected at Concordia Station, which exhibits a temporal slope of ∼ 0.5 ‰ °C−1 (Dreossi et al., 2024).
We note that here the term “snow-precipitation samples” refers to both model outputs and precipitation samples collected immediately after deposition where snow was captured on a wooden platform positioned 1 m above the surface to minimize post-depositional alterations. In contrast, the term “snow-surface sample” refers to material collected directly from the surface during the traverse, representing an integrated signal of multiple precipitation events and influenced by wind redistribution and post-depositional metamorphism.
3.9 Modelled d-excess vs. δ18O relationship
The d-excess vs. δ18O relationship (Fig. 6b) shows high d-excess variability in warmer coastal areas (< 2000 ), reflecting sensitivity to local moisture-source conditions such as temperature, relative humidity in evaporative region, and sea ice extent. Inland (> 2000 ), at the end of the distillation pathways, d-excess becomes more sensitive to condensation temperatures, since it is regulated by independent supersaturation functions (Uemura et al., 2012; Stenni et al., 2016; Touzeau et al., 2016; Landais et al., 2017). This pattern is evident in the Antarctic database and is weaky detectable in EAIIST for very cold sites (δ18O < −50 ‰), where Indian-sector samples show slightly higher d-excess than Pacific-sector samples at similar δ18O values.
LMDZ6iso model does not accurately predict the d-excess values, showing a RMSE equal to 6.07 ‰ (Figs. 7b and C1b). The mismatch primary arises from the model formulation of the isotopic supersaturation parameter (λ) in the AGCM. The chosen value of λ equal to 0.004 K−1 is selected to achive a optimal compromise to correctly simulate both δ18O and d-excess in surface snow, but leads to a systematic overestimation of d-excess (Dutrievoz et al., 2025). In addition, the model do not include post-depositional processes. Sublimation lowers d-excess in surface snow by modifying isotopic composition after deposition (Landais et al., 2017; Wahl et al., 2022). This effect is particularly evident in the observations at Windcrust site (WC; Fig. 5), where low d-excess values (∼ 4 ‰) reflect strong wind activity, substantial erosion of accumulation, and enhanced snow–atmosphere exchange. The influence of wind-snow redistribution and sublimation on the isotopic signal is discussed in detail in Sect. 4.3.
3.10 Impact of post-depositional processes
On the Antarctic plateau, post-depositional effects mainly include wind-driven snow redistribution, and sublimation.
Snow transport by wind is a relatively local process, typically mixing snow from the surrounding areas and one of the main contributions to stratigraphic noise (Hirsch et al., 2023). Studies suggest that the snow shuffled by wind redistribution can reach distances up to ∼ 100 km (Scarchilli et al., 2010; Frezzotti et al., 2007). Such mixing generates stratigraphic effect between precipitation events, leading to δ18O variability of up to 4.4 ‰ within the uppermost 6 cm at Kohnen Station in the plateau interior (Münch et al., 2016). In our dataset, this effect is reduced because we mixed surface snow collected over an extended area at each sampling site and by integrating 1 m of snow depth for bulk samples.
To quantify sublimation, mainly impacting the snow metamorphism in summer, we compared surface snow samples collected during the outbound and return ways of the traverse, where low precipitation and strong snow drift favour prolonged summer atmosphere-snow exposure. Assuming 20 precipitation-free days per summer season, we estimated a sublimation-induced variation corresponding to +2 ‰ yr−1 in δ18O and −8 % yr−1 in d-excess (see Sect. 3.6).
Including this sublimation effect in the modelled isotopic predictions substantially improved the agreement with observations, reducing the discrepancy for d-excess compared to simulations considering precipitation input alone (Fig. 10).
This improvement is particularly evident at sites where cumulative precipitation between samplings is negligible (< 1 ). The remaining differences and variability between observed and modelled values can be partially attributed to uncertainties in ERA5 precipitation and LMDZ6iso model. Previous studies have shown ERA5 overestimates precipitation over the East Antarctic Plateau, with biases reaching up to 50 % relative to satellite-based measurements (Roussel et al., 2020). As a result, our modelling likely represents the maximum contribution of precipitation, implying that the metamorphism would be even greater if actual precipitation were lower. We emphasize that the aim of this study is not to quantify the ability of the combined ERA5-LMDZ6iso in reproducing the absolute isotopic values, but rather to evaluate whether accounting sublimation improved the qualitative representation of surface snow isotopic composition compared to precipitation-only scenarios. These results further reinforced the key role of post-depositional processes in shaping the isotopic composition of surface snow.
In this study, we presented new observational and modelling evidences on the processes shaping the isotopic composition of surface snow across the East Antarctic Plateau. Together, these results provide key insights for the future interpretation of ice cores collected in low-accumulation area:
- i.
Observational snow samples defined the range of isotopic variability associated with distinct moisture-source sectors, an essential consideration in regions where multiple air-mass trajectories coexist and may shift over time.
- ii.
The comparison between observations and LMDZ6iso outputs confirmed the model's ability to reproduce both spatial and temporal δ18O-T slopes. The temporal slope, in particular, is crucial for calibrating the paleothermometer in areas lacking long-term records.
- iii.
Sublimation has a great influence on the isotopic signal, particularly decreasing d-excess in summer. This demonstrates that achieving a robust qualitative assessment of isotopic variability requires the explicit inclusion of isotopic fractionation during sublimation and condensation processes in General Circulation Models (GCMs).
- iv.
Finally, the finding that relatively close drilling sites (e.g. Dome C and PALEO, separated by only few hundred kilometres) may record precipitation from distinct moisture pathways suggests a promising strategy to enhance temperature reconstructions combining ice core records that capture common large-scale climate variability through different precipitation events.
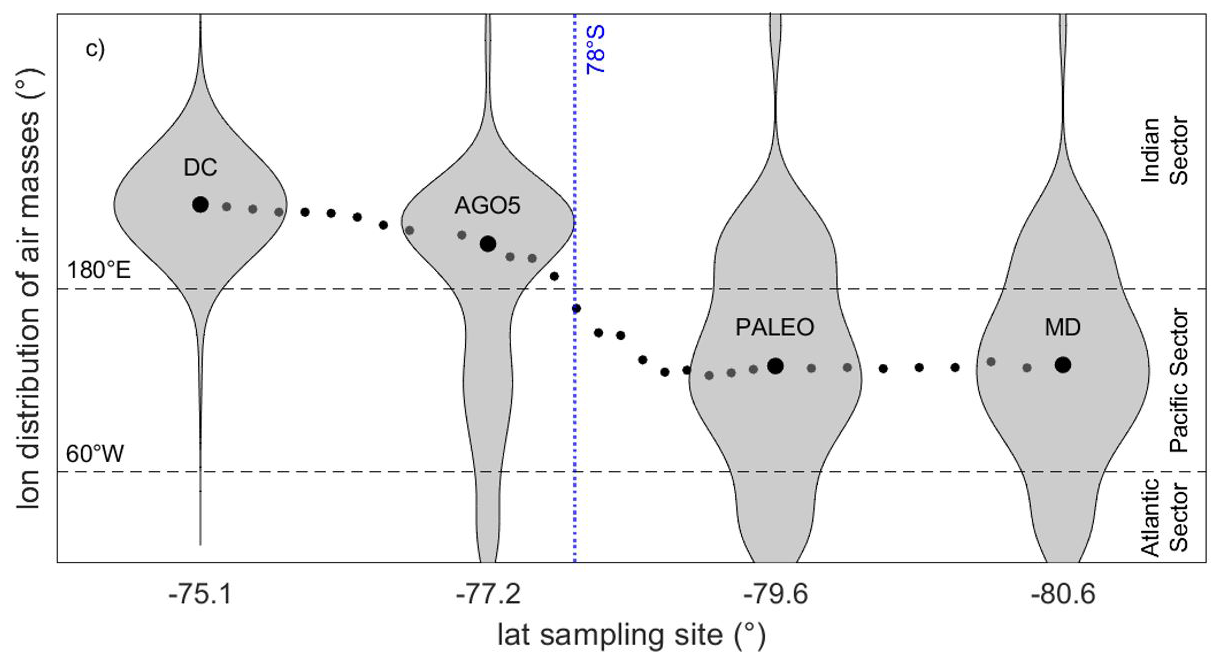
Figure A1Longitudinal distribution back-trajectories over the 2009–2019 period for four representative sites: Dome C, AGO5, PALEO, and MD. The median longitudinal origin of air masses for the 33 sampling sites across the Antarctic Plateau is indicated by black dots.
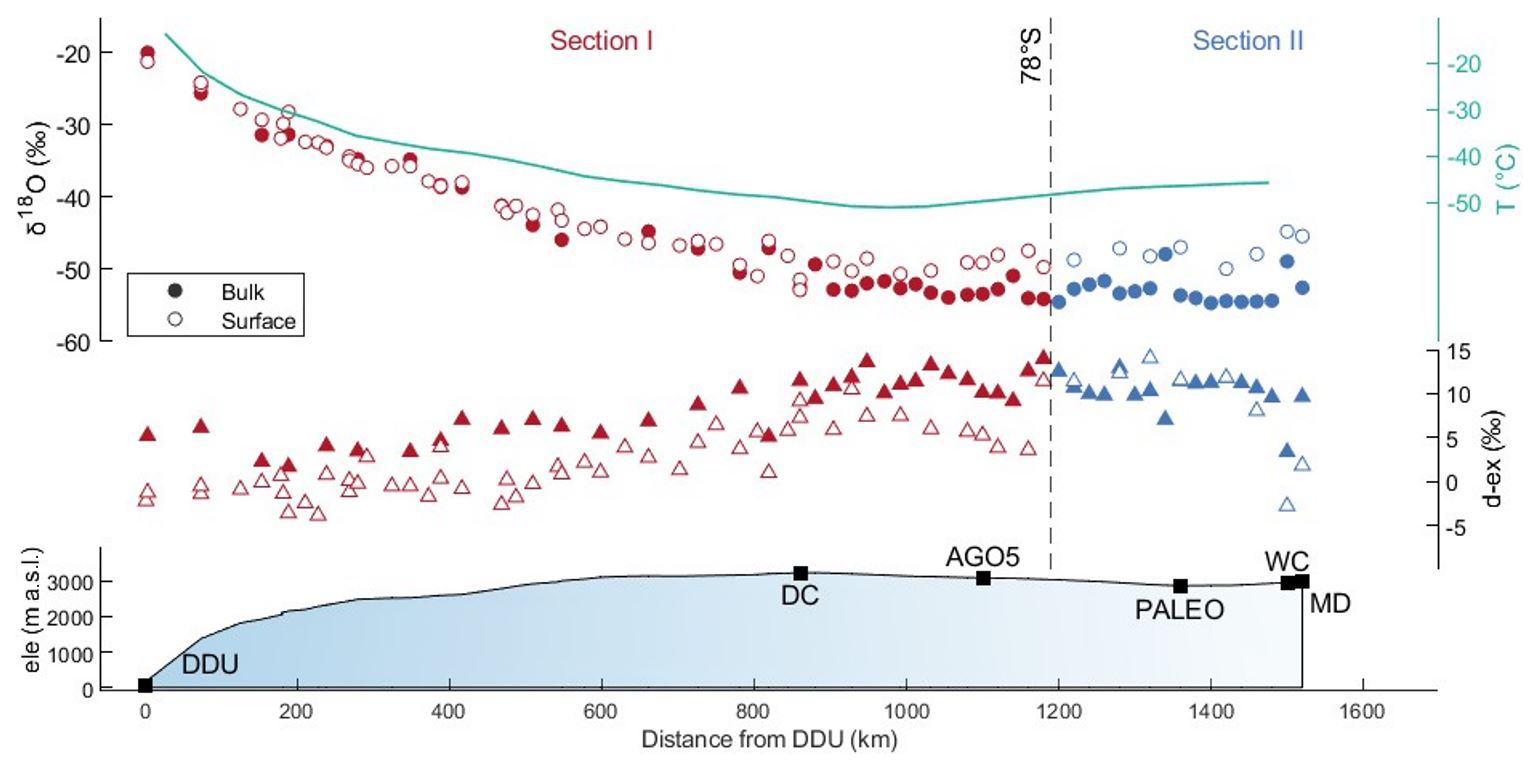
Figure B1Spatial distribution of δ18O and d-excess values of surface (empty markers) and bulk (filled markers) samples for Section I (red – north of 78° S) and Section II (blue – south of 78° S). Temperature, elevation and distance from DDU are reported.
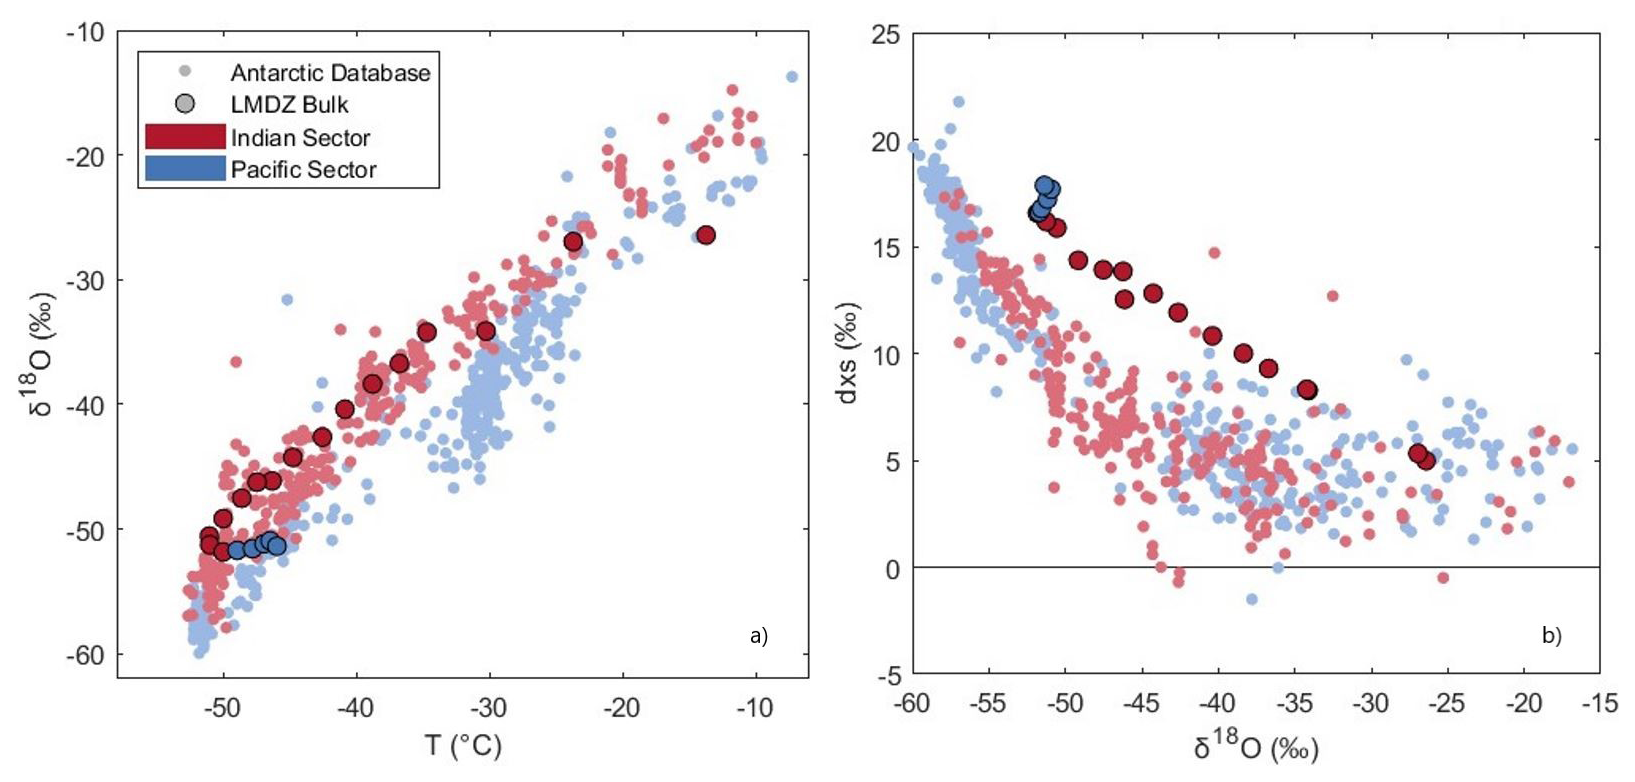
Figure C1(a) δ18O-T relationship and (b) d-excess vs. δ18O for LMDZ6iso bulk samples of the traverse compared to observations from Antarctic database, separated into Pacific and Indian sectors.
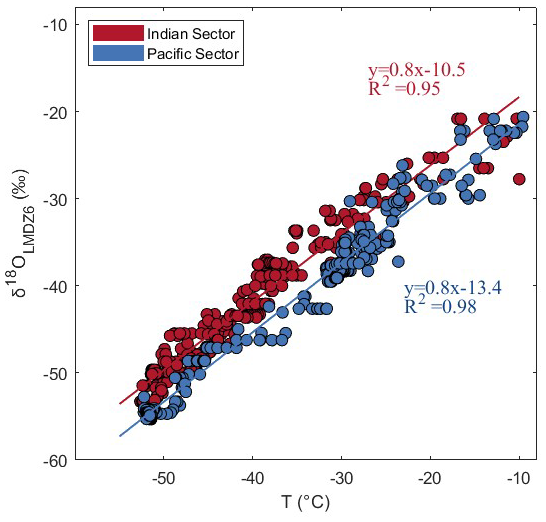
Figure C2δ18O-T spatial relationship predicted by LMDZ6iso for the Antarctic dataset, separated into Pacific and Indian sectors.
The processing of isotopic values, air-mass back trajectories, and modelled isotopic values, as well as the generation of figures, were performed using custom scripts and function provided by MATLAB Version R2023a (MathWorks Inc., Natick, MA, USA). The estimation of water vapour fluxes followed the methodology described by Casado et al. (2021).
The EAIIST isotopic dataset, including geographical data and sampling metadata, is publicly available at Zenodo, https://doi.org/10.5281/zenodo.20735244 (Petteni et al., 2026). The Antarctic isotopic dataset is available from Masson-Delmotte et al. (2008). Precipitation and temperature data were obtained from the ERA5 reanalysis dataset provided by the European Centre for Medium-Range Weather Forecasts (ECMWF). Air-mass back trajectories were computed using the FLEXPART Lagrangian particle dispersion model.
AP and MC performed the measurement in Venice and Paris; AP, CLDS conducted the back-trajectory analysis using the FLEXPART model; AP, ND and CA computed the LMDZ6iso simulations; MC, PDA, JS, AS and MF collected the snow samples during the EAIIST traverse; AP and MC wrote the manuscript draft; AL, ND, PDA, JS, AS, MF and BS reviewed the manuscript.
The contact author has declared that none of the authors has any competing interests.
Publisher's note: Copernicus Publications remains neutral with regard to jurisdictional claims made in the text, published maps, institutional affiliations, or any other geographical representation in this paper. The authors bear the ultimate responsibility for providing appropriate place names. Views expressed in the text are those of the authors and do not necessarily reflect the views of the publisher.
The authors would like to thank all the staff of the East International Ice sheet traverse that made possible the collection of the samples used in this manuscript, and the logistical support received from the PNRA and IPEV for the safe samples handling, storage and transportation. We acknowledge the ANR EAIIST project, grant ANR–16-CE01-0011-01 of the French Agence Nationale de la Recherche, the BNP-Paribas foundation and its Climate Initiative Program, the LEFFE project ADELISE, the LabEx OSUG@2020 (“Investissements d’avenir” – ANR10 LABX56), the technical support from the F2G (French National platform for Coring and Drilling, handled by INSU, Australian Antarctic Science project number AAS 4537, the AAD and the Institute of Marine and Antarctic Studies (IMAS). The maps were produced using MATLAB (MathWorks Inc.) and its Mapping Toolbox.
This work was supported by the Polar Science PhD scholarship from Ca’ Foscari University of Venice and the Erasmus+ program. This research has been supported by PNRA (National Antarctic Research Program) through the “EAIIST” PNRA16_00049-B and “EAIIST-phase2” PNRA19_00093 projects and the European Research Council, Project SAMIR (EU HORIZON: European Research Council, grant no. 101116660).
This paper was edited by Ruth Mottram and reviewed by Harsh Beria and one anonymous referee.
Baroni, M., Bard, E., Petit, J.-R., Magand, O., and Bourlès, D.: Volcanic and solar activity, and atmospheric circulation influences on cosmogenic 10Be fallout at Vostok and Concordia (Antarctica) over the last 60 years, Geochim. Cosmochim. Ac., 75, 7132–7145, https://doi.org/10.1016/j.gca.2011.09.002, 2011.
Beria, H., Larsen, J. R., Ceperley, N. C., Michelon, A., Vennemann, T., and Schaefli, B.: Understanding snow hydrological processes through the lens of stable water isotopes, WIREs Water, 5, e1311, https://doi.org/10.1002/wat2.1311, 2018.
Bintanja, R.: The contribution of snowdrift sublimation to the surface mass balance of Antarctica, Ann. Glaciol., 27, 251–259, https://doi.org/10.3189/1998AoG27-1-251-259, 1998.
Boucher, O., Servonnat, J., Albright, A. L., Aumont, O., Balkanski, Y., Bastrikov, V., Bekki, S., Bonnet, R., Bony, S., Bopp, L., Braconnot, P., Brockmann, P., Cadule, P., Caubel, A., Cheruy, F., Codron, F., Cozic, A., Cugnet, D., D'Andrea, F., Davini, P., de Lavergne, C., Denvil, S., Deshayes, J., Devilliers, M., Ducharne, A., Dufresne, J.-L., Dupont, E., Éthé, C., Fairhead, L., Falletti, L., Flavoni, S., Foujols, M.-A., Gardoll, S., Gastineau, G., Ghattas, J., Grandpeix, J.-Y., Guenet, B., Guez, E., Guilyardi, E., Guimberteau, M., Hauglustaine, D., Hourdin, F., Idelkadi, A., Joussaume, S., Kageyama, M., Khodri, M., Krinner, G., Lebas, N., Levavasseur, G., Lévy, C., Li, L., Lott, F., Lurton, T., Luyssaert, S., Madec, G., Madeleine, J.-B., Maignan, F., Marchand, M., Marti, O., Mellul, L., Meurdesoif, Y., Mignot, J., Musat, I., Ottlé, C., Peylin, P., Planton, Y., Polcher, J., Rio, C., Rochetin, N., Rousset, C., Sepulchre, P., Sima, A., Swingedouw, D., Thiéblemont, R., Traore, A. K., Vancoppenolle, M., Vial, J., Vialard, J., Viovy, N., and Vuichard, N.: Presentation and evaluation of the IPSL-CM6A-LR climate model, J. Adv. Model. Earth Sy., 12, e2019MS002010, https://doi.org/10.1029/2019MS002010, 2020.
Casado, M., Orsi, A. J., and Landais, A.: On the limits of climate reconstruction from water stable isotopes in polar ice cores, Past Glob. Chang. Mag., 25, 146–147, https://doi.org/10.22498/pages.25.3.146, 2017.
Casado, M., Landais, A., Picard, G., Münch, T., Laepple, T., Stenni, B., Dreossi, G., Ekaykin, A., Arnaud, L., Genthon, C., Touzeau, A., Masson-Delmotte, V., and Jouzel, J.: Archival processes of the water stable isotope signal in East Antarctic ice cores, The Cryosphere, 12, 1745–1766, https://doi.org/10.5194/tc-12-1745-2018, 2018.
Casado, M., Münch, T., and Laepple, T.: Climatic information archived in ice cores: impact of intermittency and diffusion on the recorded isotopic signal in Antarctica, Clim. Past, 16, 1581–1598, https://doi.org/10.5194/cp-16-1581-2020, 2020.
Casado, M., Landais, A., Picard, G., Arnaud, L., Dreossi, G., Stenni, B., and Prié, F.: Water isotopic signature of surface snow metamorphism in Antarctica, Geophys. Res. Lett., 48, e2021GL093382, https://doi.org/10.1029/2021GL093382, 2021.
Casado, M., Hébert, R., Faranda, D., and Landais, A.: The quandary of detecting the signature of climate change in Antarctica, Nat. Clim. Change, 13, 1082–1088, https://doi.org/10.1038/s41558-023-01791-5, 2023.
Charles, C. D., Rind, D., Jouzel, J., Koster, R. D., and Fairbanks, R. G.: Glacial–interglacial changes in moisture sources for Greenland: influences on the ice core record of climate, Science, 263, 508–511, https://doi.org/10.1126/science.263.5146.508, 1994.
Craig, H.: Standard for reporting concentrations of deuterium and oxygen-18 in natural waters, Science, 133, 1833–1834, https://doi.org/10.1126/science.133.3467.1833, 1961.
Craig, H. and Gordon, L. I.: Deuterium and oxygen 18 variations in the ocean and the marine atmosphere, in: Stable Isotopes in Oceanographic Studies and Paleotemperatures, edited by: Tongiorgi, E., Laboratorio di Geologia Nucleare, Pisa, Italy, 9–130, 1965.
Dansgaard, W.: Stable isotopes in precipitation, Tellus B, 16, 436–468, https://doi.org/10.1111/j.2153-3490.1964.tb00181.x, 1964.
Dietrich, L. J., Steen-Larsen, H., Wahl, S., Jones, T., Town, M., and Werner, M.: Snow–atmosphere humidity exchange at the ice sheet surface alters annual mean climate signals in ice core records, Geophys. Res. Lett., 50, https://doi.org/10.1029/2023GL104249, 2023.
Dreossi, G., Masiol, M., Stenni, B., Zannoni, D., Scarchilli, C., Ciardini, V., Casado, M., Landais, A., Werner, M., Cauquoin, A., Casasanta, G., Del Guasta, M., Posocco, V., and Barbante, C.: A decade (2008–2017) of water stable isotope composition of precipitation at Concordia Station, East Antarctica, The Cryosphere, 18, 3911–3931, https://doi.org/10.5194/tc-18-3911-2024, 2024.
Dutrievoz, N., Agosta, C., Risi, C., Vignon, É., Nguyen, S., Landais, A., Fourré, E., Leroy-Dos Santos, C., Casado, M., Ollivier, I., Jouzel, J., Roche, D., Minster, B., and Prié, F.: Antarctic water stable isotopes in the global atmospheric model LMDZ6: from climatology to boundary layer processes, EGU General Assembly 2024, Vienna, Austria, 14–19 Apr 2024, EGU24-19539, https://doi.org/10.5194/egusphere-egu24-19539, 2024.
Ekaykin, A., Eberlein, L., Lipenkov, V., Popov, S., Scheinert, M., Schröder, L., and Turkeev, A.: Non-climatic signal in ice core records: lessons from Antarctic megadunes, The Cryosphere, 10, 1217–1227, https://doi.org/10.5194/tc-10-1217-2016, 2016.
Ekaykin, A. A., Lipenkov, V. Y., Barkov, N. I., Petit, J.-R., and Masson-Delmotte, V.: Spatial and temporal variability in isotope composition of recent snow in the vicinity of Vostok station, Antarctica: implications for ice-core record interpretation, Ann. Glaciol., 35, 181–186, https://doi.org/10.3189/172756402781816726, 2002.
EPICA community members: Eight glacial cycles from an Antarctic ice core, Nature, 429, 623–628, https://doi.org/10.1038/nature02599, 2004.
Eyring, V., Bony, S., Meehl, G. A., Senior, C. A., Stevens, B., Stouffer, R. J., and Taylor, K. E.: Overview of the Coupled Model Intercomparison Project Phase 6 (CMIP6) experimental design and organization, Geosci. Model Dev., 9, 1937–1958, https://doi.org/10.5194/gmd-9-1937-2016, 2016.
Frezzotti, M., Urbini, S., Proposito, M., Scarchilli, C., and Gandolfi, S.: Spatial and temporal variability of surface mass balance near Talos Dome, East Antarctica, J. Geophys. Res.-Earth, 112, F02032, https://doi.org/10.1029/2006JF000638, 2007.
Goursaud, S., Masson-Delmotte, V., Favier, V., Orsi, A., and Werner, M.: Water stable isotope spatio-temporal variability in Antarctica in 1960–2013: observations and simulations from the ECHAM5-wiso atmospheric general circulation model, Clim. Past, 14, 923–946, https://doi.org/10.5194/cp-14-923-2018, 2018.
Grazioli, J., Madeleine, J.-B., Gallée, H., Forbes, R. M., Genthon, C., Krinner, G., and Berne, A.: Katabatic winds diminish precipitation contribution to the Antarctic ice mass balance, P. Natl. Acad. Sci. USA, 114, 10858–10863, https://doi.org/10.1073/pnas.1707633114, 2017.
Helsen, M. M., Van de Wal, R. S. W., and Van den Broeke, M. R.: The isotopic composition of present-day Antarctic snow in a Lagrangian atmospheric simulation, J. Climate, 20, 739–756, https://doi.org/10.1175/JCLI4027.1, 2007.
Hersbach, H., Bell, B., Berrisford, P., Hirahara, S., Horányi, A., Muñoz-Sabater, J., Nicolas, J., Peubey, C., Radu, R., Schepers, D., Simmons, A., Soci, C., Abdalla, S., Abellan, X., Balsamo, G., Bechtold, P., Biavati, G., Bidlot, J., Bonavita, M., De Chiara, G., Dahlgren, P., Dee, D., Diamantakis, M., Dragani, R., Flemming, J., Forbes, R., Fuentes, M., Geer, A., Haimberger, L., Healy, S., Hogan, R. J., Hólm, E., Janisková, M., Keeley, S., Laloyaux, P., Lopez, P., Lupu, C., Radnoti, G., de Rosnay, P., Rozum, I., Vamborg, F., Villaume, S., and Thépaut, J.-N.: The ERA5 global reanalysis, Q. J. Roy. Meteor. Soc., 146, 1999–2049, https://doi.org/10.1002/qj.3803, 2020.
Hirsch, N., Zuhr, A., Münch, T., Hörhold, M., Freitag, J., Dallmayr, R., and Laepple, T.: Stratigraphic noise and its potential drivers across the plateau of Dronning Maud Land, East Antarctica, The Cryosphere, 17, 4207–4221, https://doi.org/10.5194/tc-17-4207-2023, 2023.
Hourdin, F., Rio, C., Grandpeix, J.-Y., Madeleine, J.-B., Cheruy, F., Rochetin, N., Jam, A., Musat, I., Idelkadi, A., Fairhead, L., Foujols, M.-A., Mellul, L., Traore, A.-K., Dufresne, J.-L., Boucher, O., Lefebvre, M.-P., Millour, E., Vignon, E., Jouhaud, J., Diallo, F. B., Lott, F., Gastineau, G., Caubel, A., Meurdesoif, Y., and Ghattas, J.: LMDZ6A: the atmospheric component of the IPSL climate model with improved and better tuned physics, J. Adv. Model. Earth Sy., 12, e2019MS001892, https://doi.org/10.1029/2019MS001892, 2020.
Hourdin, F., Ferster, B., Deshayes, J., Mignot, J., Musat, I., and Williamson, D.: Toward machine-assisted tuning avoiding the underestimation of uncertainty in climate change projections, Sci. Adv., 9, eadf2758, https://doi.org/10.1126/sciadv.adf2758, 2023.
Hughes, A. G., Wahl, S., Jones, T. R., Zuhr, A., Hörhold, M., White, J. W. C., and Steen-Larsen, H. C.: The role of sublimation as a driver of climate signals in the water isotope content of surface snow: laboratory and field experimental results, The Cryosphere, 15, 4949–4974, https://doi.org/10.5194/tc-15-4949-2021, 2021.
Jouzel, J., Alley, R. B., Cuffey, K. M., Dansgaard, W., Grootes, P., Hoffmann, G., Johnsen, S. J., Koster, R. D., Peel, D., Shuman, C. A., Stievenard, M., Stuiver, M., and White, J.: Validity of the temperature reconstruction from water isotopes in ice cores, J. Geophys. Res.-Oceans, 102, 26471–26487, https://doi.org/10.1029/97JC01283, 1997.
Jouzel, J., Vimeux, F., Caillon, N., Delaygue, G., Hoffmann, G., Masson-Delmotte, V., and Parrenin, F.: Magnitude of isotope/temperature scaling for interpretation of central Antarctic ice cores, J. Geophys. Res.-Atmos., 108, https://doi.org/10.1029/2002JD002677, 2003.
Jouzel, J., Masson-Delmotte, V., Cattani, O., Dreyfus, G., Falourd, S., Hoffmann, G., Minster, B., Nouet, J., Barnola, J.-M., Chappellaz, J., Fischer, H., Gallet, J.-C., Johnsen, S. J., Leuenberger, M., Loulergue, L., Lüthi, D., Oerter, H., Parrenin, F., Raisbeck, G., Raynaud, D., Schilt, A., Schwander, J., Selmo, E., Souchez, R., Spahni, R., Stauffer, B., Steffensen, J. P., Stenni, B., Stocker, T. F., Tison, J.-L., Werner, M., and Wolff, E. W.: Orbital and millennial Antarctic climate variability over the past 800 000 years, Science, 317, 793–796, https://doi.org/10.1126/science.1141038, 2007.
Laepple, T., Münch, T., Casado, M., Hoerhold, M., Landais, A., and Kipfstuhl, S.: On the similarity and apparent cycles of isotopic variations in East Antarctic snow pits, The Cryosphere, 12, 169–187, https://doi.org/10.5194/tc-12-169-2018, 2018.
Landais, A., Casado, M., Prié, F., Magand, O., Arnaud, L., Ekaykin, A., Petit, J.-R., Picard, G., Fily, M., Minster, B., Touzeau, A., Goursaud, S., Masson-Delmotte, V., Jouzel, J., and Orsi, A.: Surface studies of water isotopes in Antarctica for quantitative interpretation of deep ice core data, C. R. Geosci., 349, 139–150, https://doi.org/10.1016/j.crte.2017.05.003, 2017.
Lilien, D. A., Steinhage, D., Taylor, D., Parrenin, F., Ritz, C., Mulvaney, R., Martín, C., Yan, J.-B., O'Neill, C., Frezzotti, M., Miller, H., Gogineni, P., Dahl-Jensen, D., and Eisen, O.: Brief communication: New radar constraints support presence of ice older than 1.5 Myr at Little Dome C, The Cryosphere, 15, 1881–1888, https://doi.org/10.5194/tc-15-1881-2021, 2021.
Lorius, C., Merlivat, L., and Hagemann, R.: Variation in the mean deuterium content of precipitations in Antarctica, J. Geophys. Res., 74, 7027–7031, https://doi.org/10.1029/JC074i028p07027, 1969.
Ma, T., Li, L., Shi, G., and Li, Y.: Acquisition of post-depositional effects on stable isotopes (δ18O and δD) of snow and firn at Dome A, East Antarctica, Water, 12, 1707, https://doi.org/10.3390/w12061707, 2020.
Masson-Delmotte, V., Jouzel, J., Landais, A., Stievenard, M., Johnsen, S. J., White, J. W. C., Werner, M., Sveinbjörnsdóttir, A., and Fuhrer, K.: GRIP deuterium excess reveals rapid and orbital-scale changes in Greenland moisture origin, Science, 309, 118–121, https://doi.org/10.1126/science.1108575, 2005.
Masson-Delmotte, V., Hou, S., Ekaykin, A., Jouzel, J., Aristarain, A., Bernardo, R. T., Bromwich, D., Cattani, O., Delmotte, M., Falourd, S., Frezzotti, M., Gallée, H., Genoni, L., Isaksson, E., Landais, A., Helsen, M. M., Hoffmann, G., Lopez, J., Morgan, V., Motoyama, H., Noone, D., Oerter, H., Petit, J.-R., Royer, A., Uemura, R., Schmidt, G. A., Schlosser, E., Simões, J. C., Steig, E. J., Stenni, B., Stievenard, M., Van den Broeke, M. R., Van de Wal, R. S. W., Van de Berg, W. J., Vimeux, F., and White, J. W. C.: A review of Antarctic surface snow isotopic composition: observations, atmospheric circulation, and isotopic modeling, J. Climate, 21, 3359–3387, https://doi.org/10.1175/2007JCLI2139.1, 2008.
Masson-Delmotte, V., Buiron, D., Ekaykin, A., Frezzotti, M., Gallée, H., Jouzel, J., Krinner, G., Landais, A., Motoyama, H., Oerter, H., Pol, K., Pollard, D., Ritz, C., Schlosser, E., Sime, L. C., Sodemann, H., Stenni, B., Uemura, R., and Vimeux, F.: A comparison of the present and last interglacial periods in six Antarctic ice cores, Clim. Past, 7, 397–423, https://doi.org/10.5194/cp-7-397-2011, 2011.
Merlivat, L. and Jouzel, J.: Global climatic interpretation of the deuterium–oxygen-18 relationship for precipitation, J. Geophys. Res.-Oceans, 84, 5029–5033, https://doi.org/10.1029/JC084iC08p05029, 1979.
Münch, T., Kipfstuhl, S., Freitag, J., Meyer, H., and Laepple, T.: Regional climate signal vs. local noise: a two-dimensional view of water isotopes in Antarctic firn at Kohnen Station, Dronning Maud Land, Clim. Past, 12, 1565–1581, https://doi.org/10.5194/cp-12-1565-2016, 2016.
Münch, T., Werner, M., and Laepple, T.: How precipitation intermittency sets an optimal sampling distance for temperature reconstructions from Antarctic ice cores, Clim. Past, 17, 1587–1605, https://doi.org/10.5194/cp-17-1587-2021, 2021.
Neumann, T. A., Waddington, E. D., Steig, E. J., and Grootes, P. M.: Non-climate influences on stable isotopes at Taylor Mouth, Antarctica, J. Glaciol., 51, 248–258, 2005.
Ollivier, I., Steen-Larsen, H. C., Stenni, B., Arnaud, L., Casado, M., Cauquoin, A., Dreossi, G., Genthon, C., Minster, B., Picard, G., Werner, M., and Landais, A.: Surface processes and drivers of the snow water stable isotopic composition at Dome C, East Antarctica – a multi-dataset and modelling analysis, The Cryosphere, 19, 173–200, https://doi.org/10.5194/tc-19-173-2025, 2025.
Ooms, A., Casado, M., Picard, G., Arnaud, L., Hörhold, M., Spolaor, A., Traversi, R., Savarino, J., Ginot, P., Akers, P., Twarloh, B., and Masson-Delmotte, V.: Inter-annual snow accumulation and meter-scale variability from trench measurements at Dome C, Antarctica, The Cryosphere, 20, 3235–3255, https://doi.org/10.5194/tc-20-3235-2026, 2026.
Parrenin, F., Cavitte, M. G. P., Blankenship, D. D., Chappellaz, J., Fischer, H., Gagliardini, O., Masson-Delmotte, V., Passalacqua, O., Ritz, C., Roberts, J., Siegert, M. J., and Young, D. A.: Is there 1.5-million-year-old ice near Dome C, Antarctica?, The Cryosphere, 11, 2427–2437, https://doi.org/10.5194/tc-11-2427-2017, 2017.
Petit, J.-R., Jouzel, J., Pourchet, M., and Merlivat, L.: A detailed study of snow accumulation and stable isotope content in Dome C (Antarctica), J. Geophys. Res.-Oceans, 87, 4301–4308, 1982.
Petit, J.-R., White, J. W. C., Young, N. W., Jouzel, J., and Korotkevich, Y. S.: Deuterium excess in recent Antarctic snow, J. Geophys. Res.-Atmos., 96, 5113–5122, 1991.
Petteni, A., Fourré, E., Gautier, E., Spagnesi, A., Jacob, R., Akers, P. D., Zannoni, D., Gabrieli, J., Jossoud, O., Prié, F., Landais, A., Tcheng, T., Stenni, B., Savarino, J., Ginot, P., and Casado, M.: Interlaboratory comparison of continuous flow analysis (CFA) systems for high-resolution water isotope measurements in ice cores, Atmos. Meas. Tech., 18, 5435–5455, https://doi.org/10.5194/amt-18-5435-2025, 2025.
Petteni, A., Stenni, B., and Casado, M.: Snow surface samples from the East Antarctic International Ice Sheet Traverse (EAIIST), Zenodo [data set], https://doi.org/10.5281/zenodo.20735244, 2026.
Risi, C., Bony, S., Vimeux, F., and Jouzel, J.: Water-stable isotopes in the LMDZ4 general circulation model: model evaluation for present-day and past climates and applications, J. Geophys. Res.-Atmos., 115, https://doi.org/10.1029/2009JD013255, 2010.
Risi, C., Noone, D., Frankenberg, C., and Worden, J.: Role of continental recycling in intraseasonal variations of continental moisture, Water Resour. Res., 49, 4136–4156, 2013.
Roussel, M.-L., Lemonnier, F., Genthon, C., and Krinner, G.: Brief communication: Evaluating Antarctic precipitation in ERA5 and CMIP6 against CloudSat observations, The Cryosphere, 14, 2715–2727, https://doi.org/10.5194/tc-14-2715-2020, 2020.
Scarchilli, C., Frezzotti, M., Grigioni, P., De Silvestri, L., Agnoletto, L., and Dolci, S.: Extraordinary blowing snow transport events in East Antarctica, Clim. Dynam., 34, 1195–1206, https://doi.org/10.1007/s00382-009-0601-0, 2010.
Sime, L. C., Tindall, J. C., Wolff, E. W., Connolley, W. M., and Valdes, P. J.: Antarctic isotopic thermometer during a CO2-forced warming event, Clim. Dynam., 31, 813–826, https://doi.org/10.1029/2008JD010395, 2008.
Sodemann, H. and Stohl, A.: Asymmetries in the moisture origin of Antarctic precipitation, Geophys. Res. Lett., 36, L22803, https://doi.org/10.1029/2009GL040242, 2009.
Steen-Larsen, H. C., Sveinbjörnsdottir, A. E., Peters, A. J., Masson-Delmotte, V., Guishard, M. P., Hsiao, G., Jouzel, J., Noone, D., Warren, J. K., and White, J. W. C.: Climatic controls on water vapor deuterium excess in the marine boundary layer of the North Atlantic based on 500 days of in situ, continuous measurements, Atmos. Chem. Phys., 14, 7741–7756, https://doi.org/10.5194/acp-14-7741-2014, 2014.
Stenni, B., Scarchilli, C., Masson-Delmotte, V., Schlosser, E., Ciardini, V., Dreossi, G., Grigioni, P., Bonazza, M., Cagnati, A., Karlicek, D., Risi, C., Udisti, R., and Valt, M.: Three-year monitoring of stable isotopes of precipitation at Concordia Station, East Antarctica, The Cryosphere, 10, 2415–2428, https://doi.org/10.5194/tc-10-2415-2016, 2016.
Touzeau, A., Landais, A., Stenni, B., Uemura, R., Fukui, K., Fujita, S., Guilbaud, S., Ekaykin, A., Casado, M., Barkan, E., Luz, B., Magand, O., Teste, G., Le Meur, E., Baroni, M., Savarino, J., Bourgeois, I., and Risi, C.: Acquisition of isotopic composition for surface snow in East Antarctica and the links to climatic parameters, The Cryosphere, 10, 837–852, https://doi.org/10.5194/tc-10-837-2016, 2016.
Traversa, G., Fugazza, D., and Frezzotti, M.: Megadunes in Antarctica: migration and characterization from remote and in situ observations, The Cryosphere, 17, 427–444, https://doi.org/10.5194/tc-17-427-2023, 2023.
Uemura, R., Masson-Delmotte, V., Jouzel, J., Landais, A., Motoyama, H., and Stenni, B.: Ranges of moisture-source temperature estimated from Antarctic ice cores stable isotope records over glacial–interglacial cycles, Clim. Past, 8, 1109–1125, https://doi.org/10.5194/cp-8-1109-2012, 2012.
Vimeux, F., Masson, V., Jouzel, J., Stievenard, M., and Petit, J.-R.: Glacial–interglacial changes in ocean surface conditions in the Southern Hemisphere, Nature, 398, 410–413, 1999.
Wahl, S., Steen-Larsen, H. C., Hughes, A. G., Dietrich, L. J., Zuhr, A., Behrens, M., Faber, A.-K., and Hörhold, M.: Atmosphere–snow exchange explains surface snow isotope variability, Geophys. Res. Lett., 49, e2022GL099529, https://doi.org/10.1029/2022GL099529, 2022.
Werner, M., Langebroek, P. M., Carlsen, T., Herold, M., and Lohmann, G.: Stable water isotopes in the ECHAM5 general circulation model: toward high-resolution isotope modeling on a global scale, J. Geophys. Res.-Atmos., https://doi.org/10.1029/2011JD015681, 2011.
Xiao, C., Ding, M., Masson-Delmotte, V., Zhang, R., Jin, B., Ren, J., Li, C., Werner, M., Wang, Y., Cui, X., and Wang, X.: Stable isotopes in surface snow along a traverse route from Zhongshan station to Dome A, East Antarctica, Clim. Dynam., 41, 2427–2438, https://doi.org/10.1007/s00382-012-1580-0, 2013.
- Abstract
- Introduction
- Methods
- Results
- Conclusions
- Appendix A: Londitudinal distribution of air mass orising on the East Antarctic Plateau sampling sites
- Appendix B: Spatial distribution of surface and bulk samples
- Appendix C: LMDZ6iso predictions
- Code availability
- Data availability
- Author contributions
- Competing interests
- Disclaimer
- Acknowledgements
- Financial support
- Review statement
- References