the Creative Commons Attribution 4.0 License.
the Creative Commons Attribution 4.0 License.
 | 17 Jun 2026
Multi-annual and seasonal patterns of Murtèl rock glacier borehole deformation, environmental controls and implications for kinematic monitoring
Isabelle Gärtner-Roer
Jan Beutel
Andreas Vieli
Information about rock glacier deformation with depth is crucial for understanding the kinematic processes responsible for variations in rock glacier velocity. The majority of studies on rock glacier kinematics have been limited to surface measurements. Understanding which processes lead to the observed displacement signal on the rock glacier surface is important because it is a parameter of the essential climate variable (ECV) “permafrost”. Here, we present a unique record of the nearly eight-year-long borehole deformation data at high temporal resolution from the Murtèl rock glacier in the Swiss Alps. The extracted velocity time series with depth shows that seasonal variations are only observed in the active layer (AL), while in the ice-rich core and the shear zone the velocity remains relatively stable. Interannual variability in deformation is driven by both the AL and the ice-rich core components, while the shear zone shows minimal change over the years. The AL, ice-rich core and shear zone components of deformation make up 20 %, 24 % and 56 % of surface displacement respectively. Compared to previous borehole inclinometer data, we find an unusually high fraction of surface displacement happening in the AL at Murtèl rock glacier. There are multiple rock glacier studies that report a fast response in surface velocity to water input from snowmelt or rainfall. In contrast, at Murtèl rock glacier we find that surface acceleration begins multiple weeks after the snowmelt period ends. The largest peaks in surface velocity coincide with the years with the highest ground surface temperature rather than the years with the most snowmelt. We postulate that the deep ice-rich and cold permafrost core of Murtèl rock glacier prevents the pore water pressure in the shear zone to change at a seasonal timescale. The borehole deformation and temperature data suggest that the seasonal cycle in AL deformation is strongly related to thermal processes and the melting of refrozen seasonal ice. The comparison of three independent approaches for measuring surface displacement shows that the borehole inclinometer and geodetic survey measurements agree well over multi-annual timescales. The continuous GNSS surface observations slightly overestimate the seasonal acceleration, but match the long-term background displacement well. Our borehole deformation data provide novel information on how representative surface velocities are for rock glacier deformation at depth and on various timescales.
- Article
(12124 KB) - Full-text XML
- BibTeX
- EndNote


Rock glaciers are a prominent permafrost landform found in mountain environments. As they are widely spread, they largely influence the geomorphic evolution of periglacial landscapes, in former times and today. Rock glaciers are bodies of perennially frozen sediment which creep downslope. Active landforms typically creep at rates from a few decimeters to a few meters per year (Kellerer-Pirklbauer et al., 2024). Even though measurements of rock glacier movements go back to the early 1900s, only in the last 40 years kinematic investigations have revealed the importance of external forcings on rock glacier creep (Haeberli, 1985; Arenson et al., 2002; Cicoira et al., 2021). Atmospheric warming has been linked to both the irreversible loss of permafrost ice and rock glacier acceleration (Roer et al., 2005; Kääb et al., 2007; Haberkorn et al., 2021; Kellerer-Pirklbauer et al., 2024). Mountain permafrost sites from Svalbard to the Alps have been warming on average 0.41 °C in the last decade, with the colder permafrost sites warming faster than the warmer ones (Noetzli et al., 2024). In parallel, periods of pronounced warming rates, such as 2015 to 2020 in the Alps, have experienced an increase in rock glacier velocity (Kellerer-Pirklbauer et al., 2024). The synchronicity between mean annual air temperatures and rock glacier velocity (RGV) has led to RGV being added in 2022 as a parameter to the ”permafrost” Essential Climate Variable (ECV) (Hu et al., 2025). RGV is defined as the annual average horizontal velocity measured at the surface of a rock glacier (RGIK, 2023). The internal structure of rock glaciers is known to be heterogeneous and the displacement velocity changes non-linearly with depth (Arenson et al., 2002; Haeberli et al., 2006; Emmert and Kneisel, 2017; Buchli et al., 2018; Fey and Krainer, 2020). The displacement signal at the rock glacier surface typically represents the combination of different deformation processes in three layers: the top coarse-blocky active layer (AL), the main permafrost ice-rich core, and a frozen fine grained layer called the shear zone, where most of the deformation occurs (Arenson et al., 2002; Kenner et al., 2020; Cicoira et al., 2021). Studies that describe the distribution of deformation across these three layers are scarce and most mountain permafrost sites are limited to measuring deformation at the surface via geodetic methods (Wahrhaftig and Cox, 1959; Barsch and Hell, 1976; Haeberli, 1985; Benedict et al., 1986; Lambiel and Delaloye, 2004; Roer, 2007; Cicoira et al., 2022). These surface measurements are then averaged into a single RGV value which is used as a parameter for the ECV. So, the RGV does not specify at which depth deformation occurs or where it changes over time. Measuring deformation with depth requires the instrumentation of vertical boreholes with inclinometers. Vertical deformation profiles of rock glaciers were first acquired at three sites in the Engadine region of Switzerland. These early measurements were limited to annual temporal resolutions and lasted from 1987 to 1995 (Arenson et al., 2002). These measurements revealed that, depending on the site, about 60 % to over 90 % of the surface displacement happens in the shear zone (Arenson et al., 2002). However, the annual temporal resolution did not allow seasonal investigations of deformation with depth. In 2010, three boreholes were drilled in the destabilized Furggwanghorn rock glacier to measure deformation at higher temporal resolution (Buchli et al., 2018). However, after 10 months all boreholes were destroyed due to the large magnitudes of displacement at Furggwanghorn rock glacier (Buchli et al., 2018). The borehole deformation data from this rock glacier showed that almost all of the surface displacement occurs at the shear zone and that there seems to be a seasonal pattern (Buchli et al., 2018). The previous periodic measurements cannot attribute seasonal velocity changes to a specific layer; however, they can do for multiannual changes. More borehole sites are needed to evaluate whether the results from Furggwanghorn rock glacier are site-specific or can be applied to other rock glaciers.
The driving processes of seasonal cycles in rock glacier deformation are complex with past research producing variable results. There are studies which report that the infiltration of liquid water into the rock glacier core and the shear zone drives seasonal variations in movement (Ikeda et al., 2008; Wirz et al., 2016; Cicoira et al., 2019b; Kenner et al., 2020; Bast et al., 2024). The other known aspect of seasonal controls of rock glacier creep are thermal processes. For ice-rich rock glaciers, the plastic deformation component of surface displacement is considerable. According to Glen's flow-law of ice, the temperature of the viscous material is the main factor influencing its deformation for a given stress condition (Nye, 1952). Seasonal variations in the temperature of a rock glacier are limited to depths shallower than the zero annual amplitude depth, which is typically above 10 to 20 m. In these depths, the temperature regime is affected by both winter and summer meteorological conditions (Vonder Mühll and Haeberli, 1990; Schneider et al., 2012). So far, it is not trivial to claim whether the summer or winter are more important to establish the thermal processes driving seasonal variations in deformation. However, often the shear zone is below the depth of the zero annual amplitude, so temperature is unlikely to directly drive seasonal variations in the shear zone deformation (Buchli et al., 2018). Therefore, previous studies concluded that since the shear zone temperature is approximately constant, the variability in deformation must be due to changes in water infiltration (Kenner et al., 2020). If the seasonal deformation cycle were to occur primarily in the shallow subsurface, then summer temperatures could be important. The scarcity of high temporal resolution borehole deformation data makes it uncertain which processes primarily drive seasonal changes in rock glacier deformation. The large differences in temperature and internal structure between different rock glaciers and often even within one landform raise the question of whether the processes described in previous studies are site-specific or not.
The first objective of this study is to use the continuous high temporal resolution deformation record from the 2015 borehole drilled in Murtèl rock glacier to determine how deformation varies over different timescales and with depth. The second objective is to explore the depth-dependent thermo-hydrological controls of seasonal deformation changes at Murtèl rock glacier. The third objective is to compare the surface displacements measured by the three different systems available at Murtèl rock glacier: borehole inclinometer, GNSS and geodetic survey using a total station.
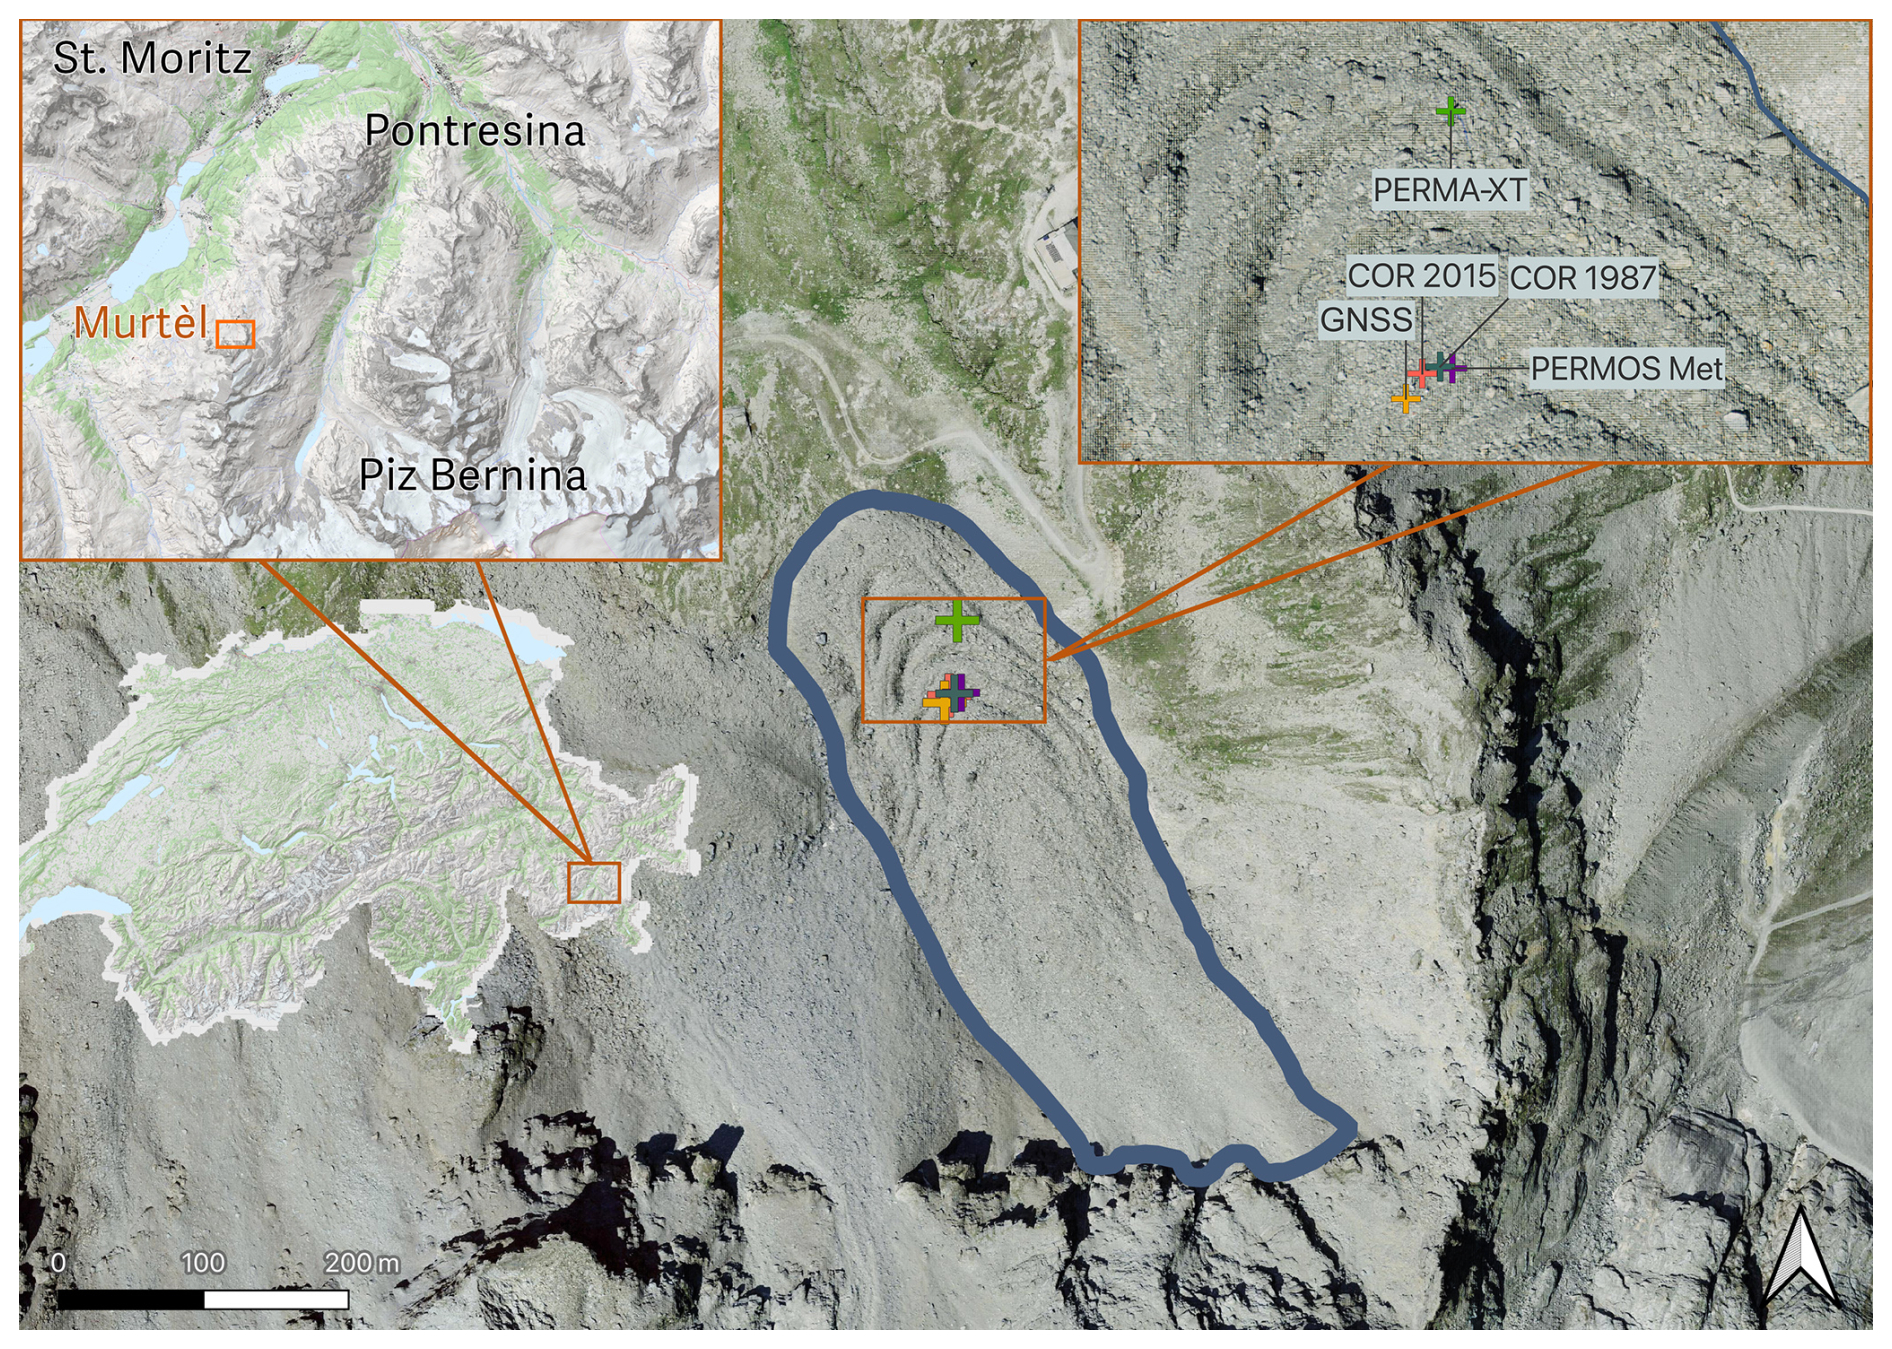
Murtèl rock glacier, in the Engadine region of the Swiss Alps (Fig. 1), is an active rock glacier located between 2640–2800 m a.s.l. in a NNW-facing slope. The mean annual air temperature (MAAT) at the site during the 1998–2022 period is −1.5 °C (PERMOS, 2024). Murtèl is one of the most investigated rock glaciers worldwide and is characterized by its high ice content of approximately 90 % in the main 20 m thick core (Haeberli et al., 1988; Hoelzle et al., 2002; Gärtner-Roer and Hoelzle, 2021). It is also the slowest moving rock glacier monitored in the Engadine region (Vonder Mühll and Haeberli, 1990; Kellerer-Pirklbauer et al., 2024). The first borehole was drilled in 1987 down to 62 m (COR 1987), which established the first long-term time series of borehole temperatures in the region and also the first deformation measurements from a borehole in a rock glacier (Haeberli et al., 1988; Arenson et al., 2002). The inclinometer installed in 1987 was limited to an annual measurement frequency (Haeberli et al., 1998). In addition, the 1987 drilling allowed for a first description of the stratigraphy of Murtèl rock glacier (Haeberli et al., 1988). Two more boreholes were drilled in 2000 providing more data about the internal structure of Murtèl rock glacier (Arenson et al., 2002).
In 2015 a new borehole (COR 2015) was drilled a few meters away from the 1987 borehole to continue the long-term temperature record and install an automatic ShapeAccelArray (SAA) chain to measure continuous horizontal deformation with depth (Fig. 2). The drilling was non-destructive in the ice-rich parts, allowing to gather more data on the internal structure of Murtèl rock glacier (Noetzli et al., 2021). The borehole is equipped with thermistor sensors to 60 m depth and the SAA chain down to 40 m producing inclinometer-equivalent data. The borehole temperature data are provided directly from the PERMOS data portal (https://www.permos.ch/data-portal, last access: 11 June 2026). For this study, the borehole temperature is used to calculate the vertical ground heat flux at each sensor's depth using an average thermal conductivity for a rock and ice mixture of 2.5 W m−1 K−1 (Vonder Mühll et al., 1998; Scherler et al., 2014). The annual active layer thickness (ALT) is extracted based on the annual maximum depth of the 0 °C isotherm found by linearly interpolating between the available thermistors. The periods of phase change in the AL, known as the zero curtains, are extracted by finding the time segments where the temperature of the lowest sensor in the AL remains constant at around 0 °C for at least two weeks.
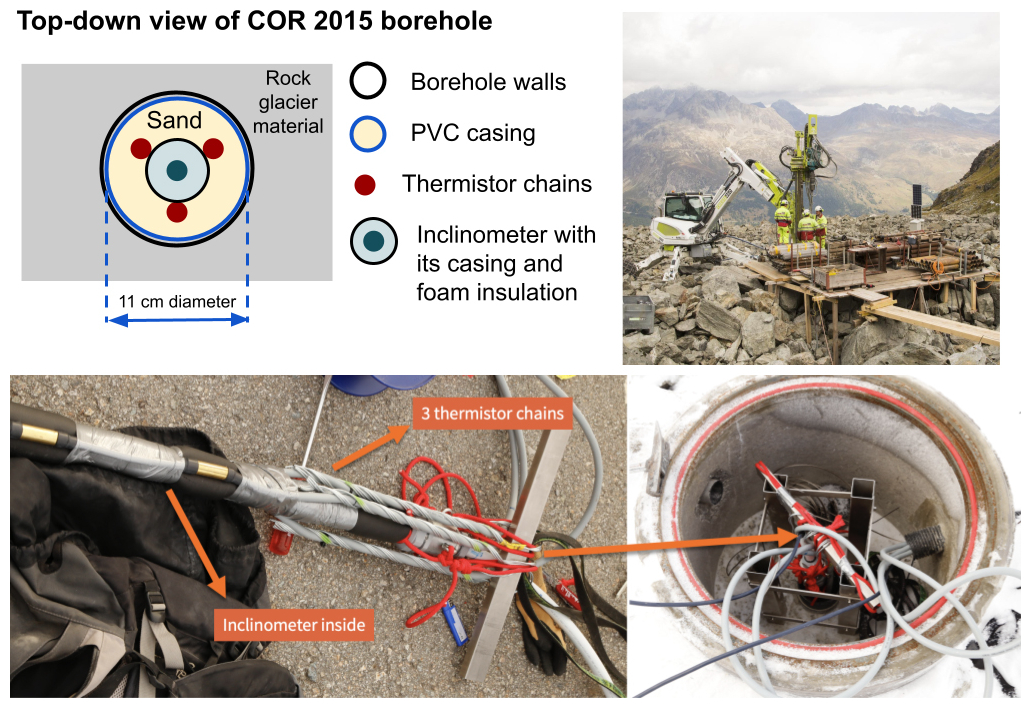
Figure 2The installation of the 2015 borehole in Murtèl rock glacier. Sketch of the top-down cross-section of the borehole (top-left). Photo of the drilling of the 2015 borehole (top-right). Configuration of thermistor-inclinometer bundle inserted in the borehole with its top concrete chamber (bottom). Photos by Alexander Bast.
The borehole deformation data are recorded using a SAA field instrument made up of 50 cm long inextensible segments each equipped with triaxial MEMS gravity sensors measuring tilt angle from the vertical at 8 h intervals. The data are stored continuously and automatically to an on-site data logger. The accuracy of the SAA sensors is ±0.0005 radians (0.029°). The measured angles are then converted to x, y and z displacement using the Measurand SAASuite v3.07 software (https://measurand.com/products/data-viewing-and-analysis/, last access: 16 June 2026). The bottom of the borehole is stable in place, so that the calculated displacements can be integrated from the bottom up to arrive at a surface displacement measurement. The displacement measurement accuracy reported by the manufacturer Measurand over 1.5 years of testing operation is ±1.5 mm.
In 2016, a GNSS station was installed on a large boulder next to the 2015 borehole to measure sensor positions at 30 s intervals and has been processed to derive daily surface displacements. The GNSS has also a two-axis inclinometer that continuously measures the tilt angle. The GNSS bundle is mounted on a mast on top of the boulder, which is approximately one meter high. The GNSS displacement data are corrected for the rotational movement of the boulder and the mast by subtracting the rotational component derived from the tilt measured by the inclinometer. The orientation of the mast inclination relative to the direction of the rock glacier movement was taken into account by only subtracting the rotational component parallel to the direction of motion. For further specifications about the GNSS station and the data collection procedure we refer to Cicoira et al. (2022).
Both the SAA and GNSS data are processed by computing x and y displacement vectors relative to a reference position at the start of the measurement period in 2016. These displacement vectors are then used to calculate the horizontal displacement in each of the SAA chain segments and at the GNSS station, resulting in a cumulative daily time series of horizontal displacement from 2016 to 2023. The daily displacement of Murtèl rock glacier is generally at the sub-centimeter scale, so the daily series is resampled to a monthly resolution. The monthly displacement data are then differentiated over time to calculate the monthly velocity at the surface for the GNSS and at varying depths for the SAA chain. Annual velocity data are also calculated based on the calendar year. Using the SAA data, layer-specific velocity differences for the AL, the ice-rich core, and the shear zone are calculated by taking the difference of the velocity from the top to the bottom of the corresponding layers. The fraction of deformation, as a percentage, that occurs in a given layer relative to the total surface displacement is calculated by dividing the layer-specific velocity values by the surface displacement. These fractions are then compared to the values calculated from the existing deformation profiles of the few older studies available for other rock glaciers (Arenson et al., 2002; Ikeda et al., 2008; Kenner et al., 2017). The shear strain rate is calculated by dividing the horizontal velocity difference between adjacent SAA sensors by their vertical spacing (0.5 m). The peak in the vertical profile of annual mean shear strain rate, averaged over the measurement period, is used to determine the shear zone depth.
As additional independent displacement observations, being part of the PERMOS monitoring strategy, geodetic surveys are carried out once a year since 2009, measuring the location of marked boulders on the surface of the rock glacier using a total station (Roer, 2007; Kellerer-Pirklbauer et al., 2026). Out of the 10 survey points on Murtèl rock glacier, this study uses the one located on the GNSS station boulder, a few meters from the 2015 borehole. The total displacement from the GNSS and geodetic surveys is calculated as the horizontal distance between the coordinates at the start and end of the data series, while the SAA total displacement is calculated by integrating the monthly surface velocities over time. So, the total surface displacement is being measured by three different methods independently: borehole SAA, GNSS and geodetic surveys. These three measuring methods are then compared and evaluated against each other.
Ten years after the 1987 borehole drilling, a meteorological station was installed by PERMOS 5 m from the 2015 borehole (Mittaz et al., 2000) (Fig. 1). The variables measured that are relevant for this study are air temperature, ground surface temperature, and snow height. For these three variables, the annual means and maxima are computed. The snow height time series is used to calculate the start of snow accumulation, the duration when the snowpack is thicker than 70 cm (depth at which the thermal regime of the permafrost and that of the atmosphere become decoupled; Keller, 1994; Vonder Mühll et al., 1998; Hoelzle et al., 1999), the start date of the snow-free period, and the daily snowmelt energy. The latter is calculated by converting the decrease in snow height into an energy flux using an average snow density of 300 kg m−3 and a specific latent heat of fusion of water of 334×103 J kg−1 (Scherler et al., 2014). Two temporal phases, warm and cold, are defined based on seasonal processes using the weather and borehole data. The start of the snow-free period marks the beginning of the warm phase which lasts until the borehole temperature at 0.5 m decreases below 0 °C and the cold phase starts. The other in situ weather station used is the PERMA-XT meteorological station installed in August 2020, which includes an unheated rain gauge to measure rainfall (Amschwand et al., 2024). This rainfall data from 2020 to 2023 were extrapolated back to 1997 based on regression coefficients with the warm phase precipitation data from the MeteoSwiss Piz Corvatsch station (located 1.3 km away at 3298 m elevation). The Piz Corvatsch station air temperature measurements are used to fill data gaps in the air temperature series from the in situ PERMOS station using the same regression approach as for the rainfall. All listed environmental variables are qualitatively and quantitatively compared with the deformation data using linear regressions. These regressions are then compiled into a matrix to extract the statistically most significant driving variables for deformation. The combination of the statistically significant variables is then used to train a multiple linear regression model to predict the surface velocity data.
3.1 Borehole deformation trends with depth
The SAA chain installed in the 2015 borehole on Murtèl rock glacier has collected deformation data with depth for nearly eight years (2016–2023; Fig. 3). The surface movement measured by the SAA chain results in an average of 12 cm yr−1. During the total measurement period from August 2016 to July 2023, the top of the borehole moved horizontally by a total of 87 cm. Two meters below the surface, the average annual velocity drops to 9.5 cm yr−1. This represents a relatively high shear strain rate in the AL of 0.007 yr−1 (Table 1). The average strain rate (or vertical gradient of the deformation profile) of the AL is the second highest out of the three layers. This high strain rate in the top few meters is well visible in the vertical deformation profile in Fig. 3 starting in 2017. The average difference in annual velocity from the top to the bottom of the AL is 2.6 cm yr−1, which makes up about 20 % of the surface movement (Table 1). The AL thickness extracted from the borehole temperatures is on average 3.5 m, until 2021 when it begins to deepen towards 4 m. Below 2 m the strain rate becomes lower, as illustrated by the smaller vertical gradient in the deformation profiles in Fig. 3. A unique feature is observed at around 7–9 m where the deformation reverts to increase with depth before returning to decrease with depth at 9 m (Fig. 3). From 9–21 m the deformation continues to decrease with depth at a relatively constant strain rate. At 21 m the deformation decreases more rapidly with depth until 26 m, at which the highest strain rates are found in the shear zone. The mean annual velocity difference from the top to the bottom of the ice-rich core is 3 cm yr−1, which is 23 % of the surface velocity. The shear zone is identified to extend from 26.5–28 m. The velocity decreases from 6.6 cm yr−1 at 25 m to 0.1 cm yr−1 at 30 m. The shear zone maximum strain rate is 0.04 yr−1 (Table 1). The velocity difference across the shear zone is 5.9 cm yr−1 or 56 % of the surface velocity.
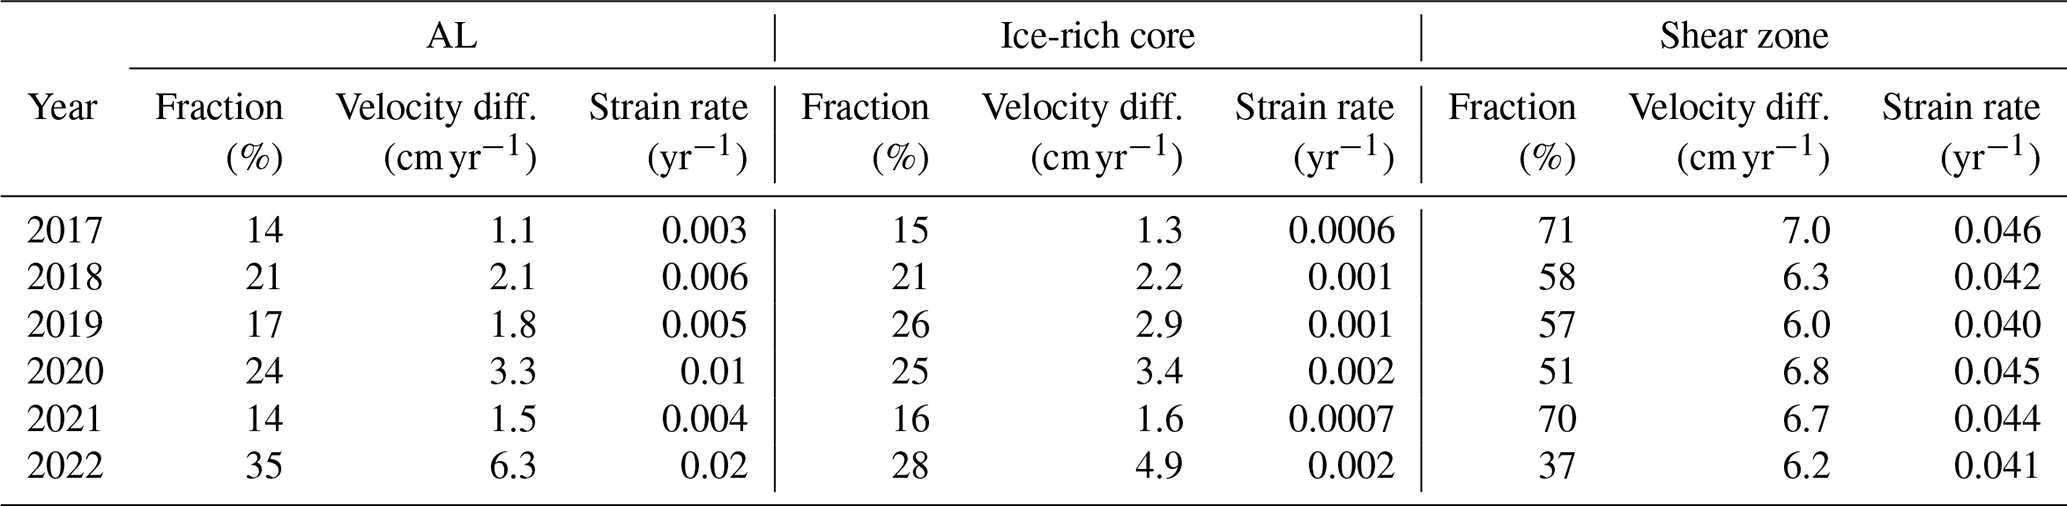
Table 1The average fraction of the total displacement at the surface represented by each layer, the velocity difference from the top to the bottom of each layer, and the shear strain rate over each layer for the 2016–2023 period.
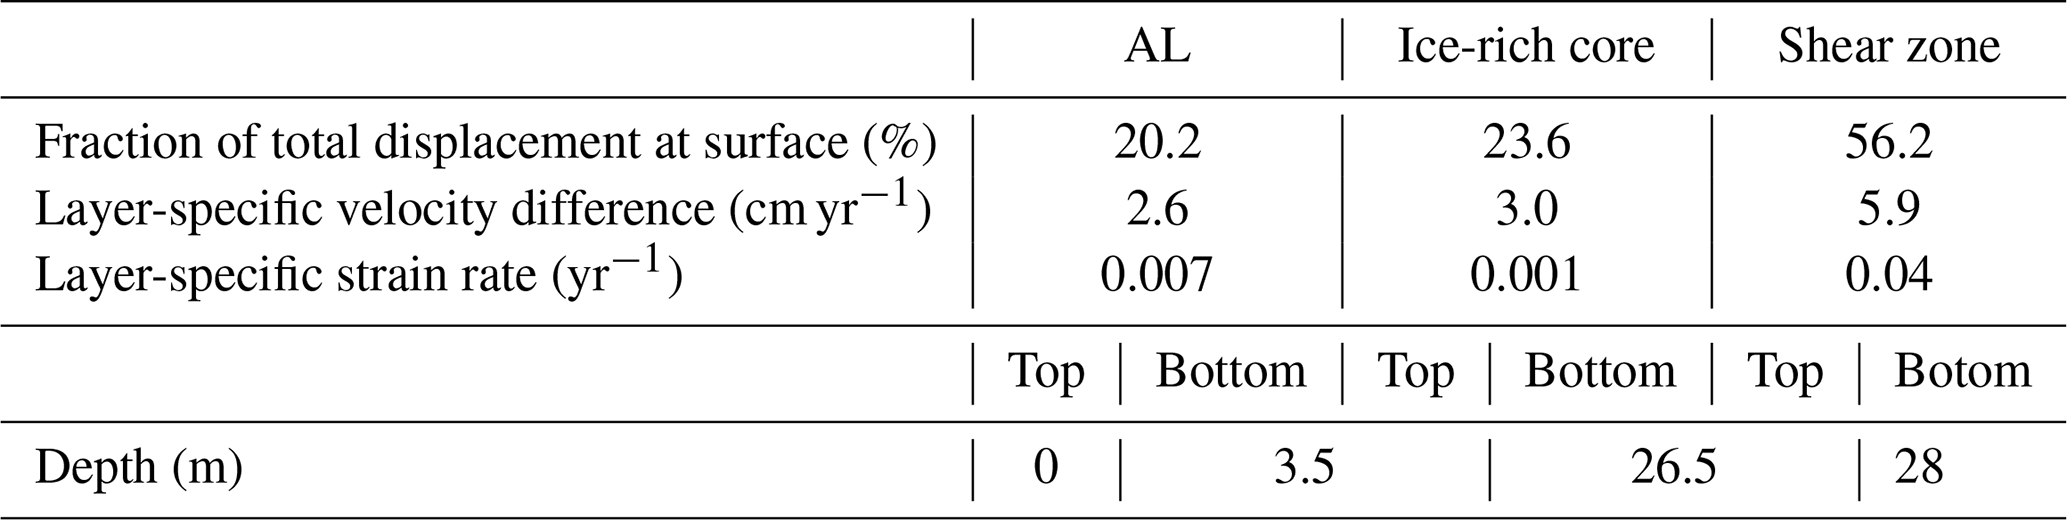
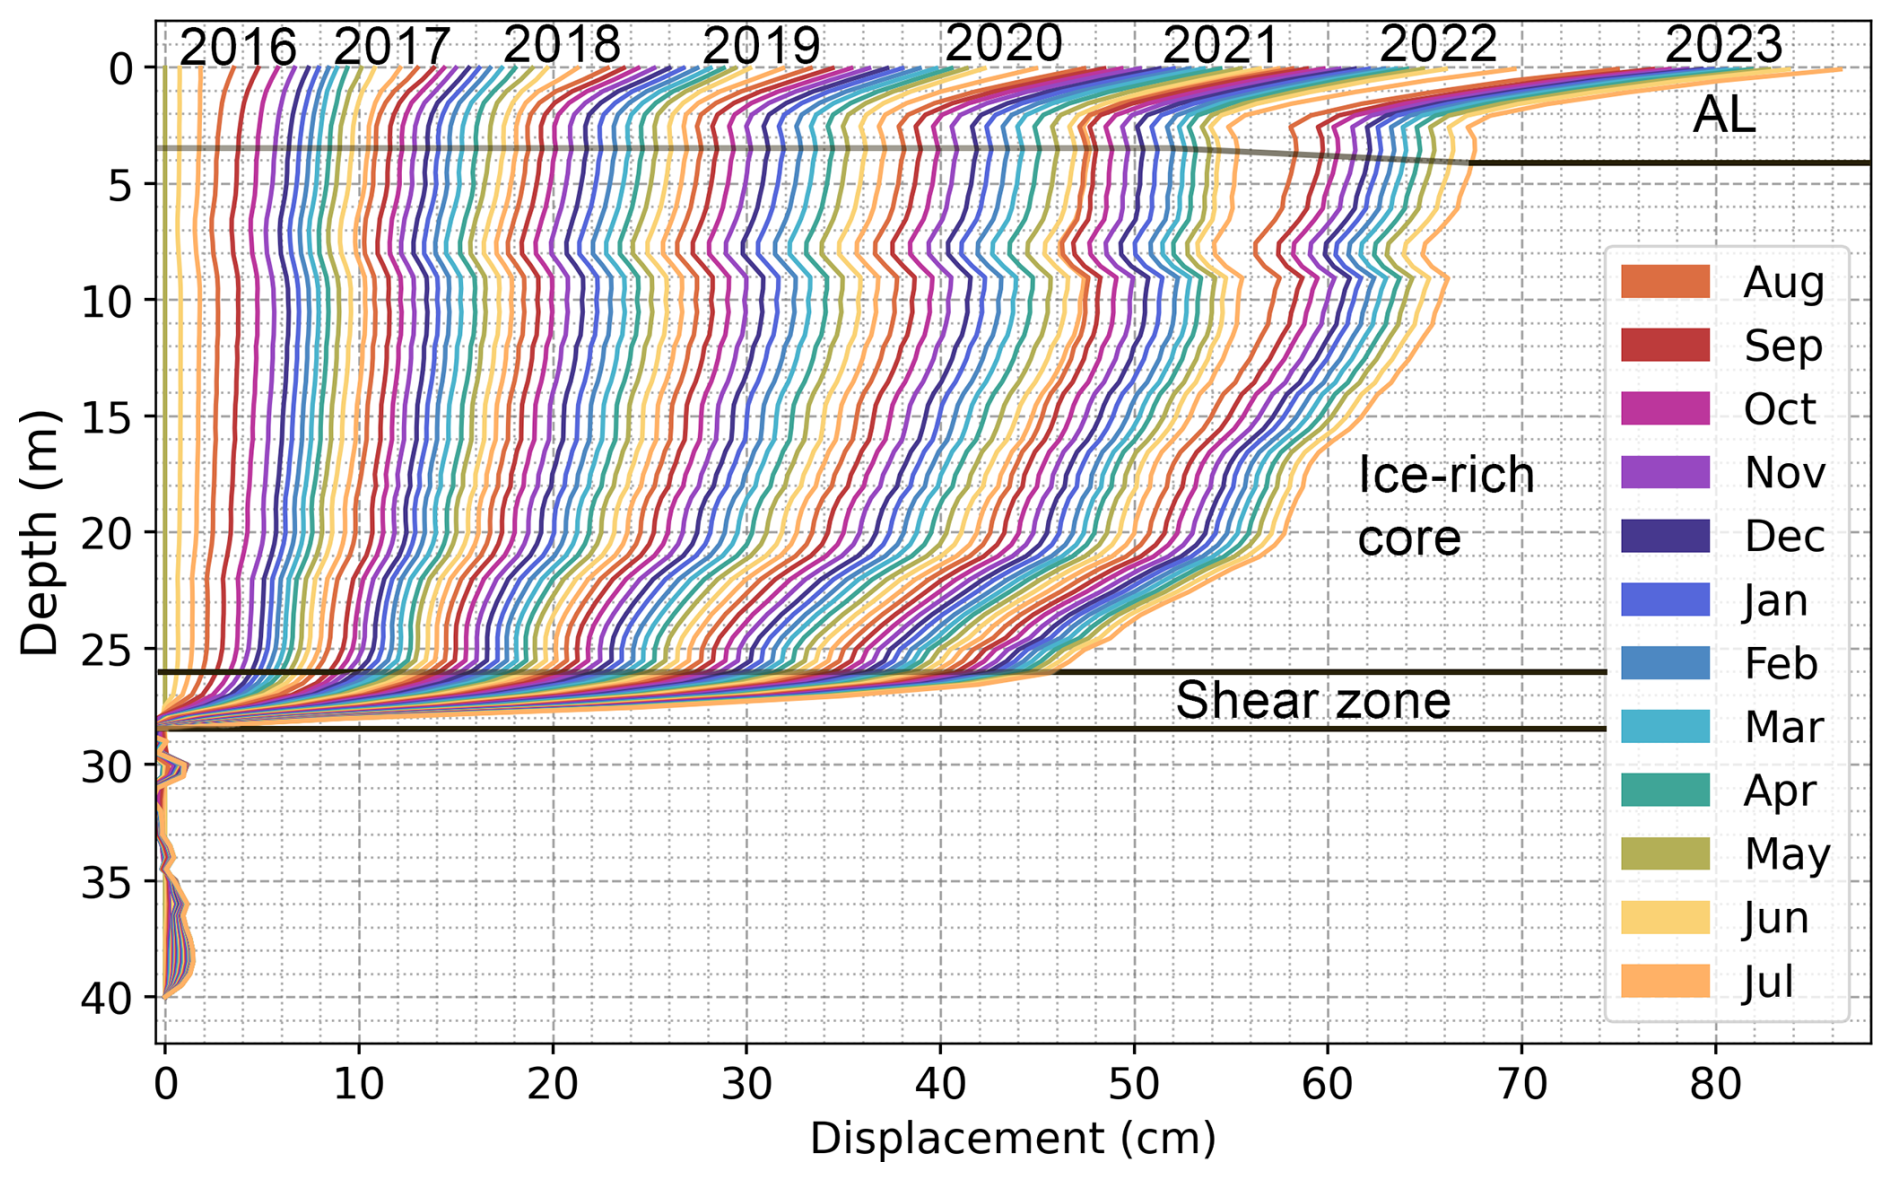
Figure 3Monthly cumulative deformation profiles from the SAA data in the 2015 borehole at Murtèl rock glacier starting in August 2016 and ending in July 2023. The relevant layers of the AL and shear zone are labeled at the according depths.
3.2 Annual trends of borehole deformation
The interannual variability of the borehole deformation varies across different depths (Fig. 4a). The annual velocity difference from the top to the bottom of the AL ranges from approximately 1 to 6 cm yr−1 (Table 2). In other terms, the average annual strain rate () in the AL varies from 0.003 to 0.02 yr−1. The ice-rich core velocity difference ranges from approximately 1 cm yr−1 ( yr−1) to 5 cm yr−1 (0.002 yr−1), and the velocity difference from the top to the bottom of the shear zone stays relatively constant, ranging from approximately 6 cm yr−1 (0.04 yr−1) to 7 cm yr−1 (0.05 yr−1) (Table 2). A similar pattern of decreasing interannual variability with depth is observed in the annual average borehole temperature profiles (Fig. 4b). During the six years with complete borehole deformation data, the annual near-surface velocity shows an increasing trend. The years 2020 and 2022 have especially high annual surface velocities of 12.5 and 17 cm yr−1 respectively (Fig. 4a). The active layer (AL) and ice-rich core deformation are the dominant contributors to this increase in deformation, while the shear zone deformation remains relatively constant (Table 2). In 2020, the AL contributed 24 % to the surface displacement and 35 % in 2022. The ice-rich core contributed 25 % to the surface displacement in 2020 and 28 % in 2022 (Table 2). The annual velocity measured at the surface is not always representative of the velocity at depth. For example, while at the surface, velocity in 2019 was higher than in 2021, from 7 m to the shear zone the velocity in 2019 is lower than in 2021 (Fig. 4a). In 2018 the surface velocity was similar to that in 2021; however, the velocity at depth in 2018 is approximately 1.5 cm yr−1 lower than in 2021. From the surface to 8 m the deformation was highest in 2022, while below 8 m the highest deformation was in 2020. For some years, such as 2017, when the surface velocity is low, the deformation at depth is also low.
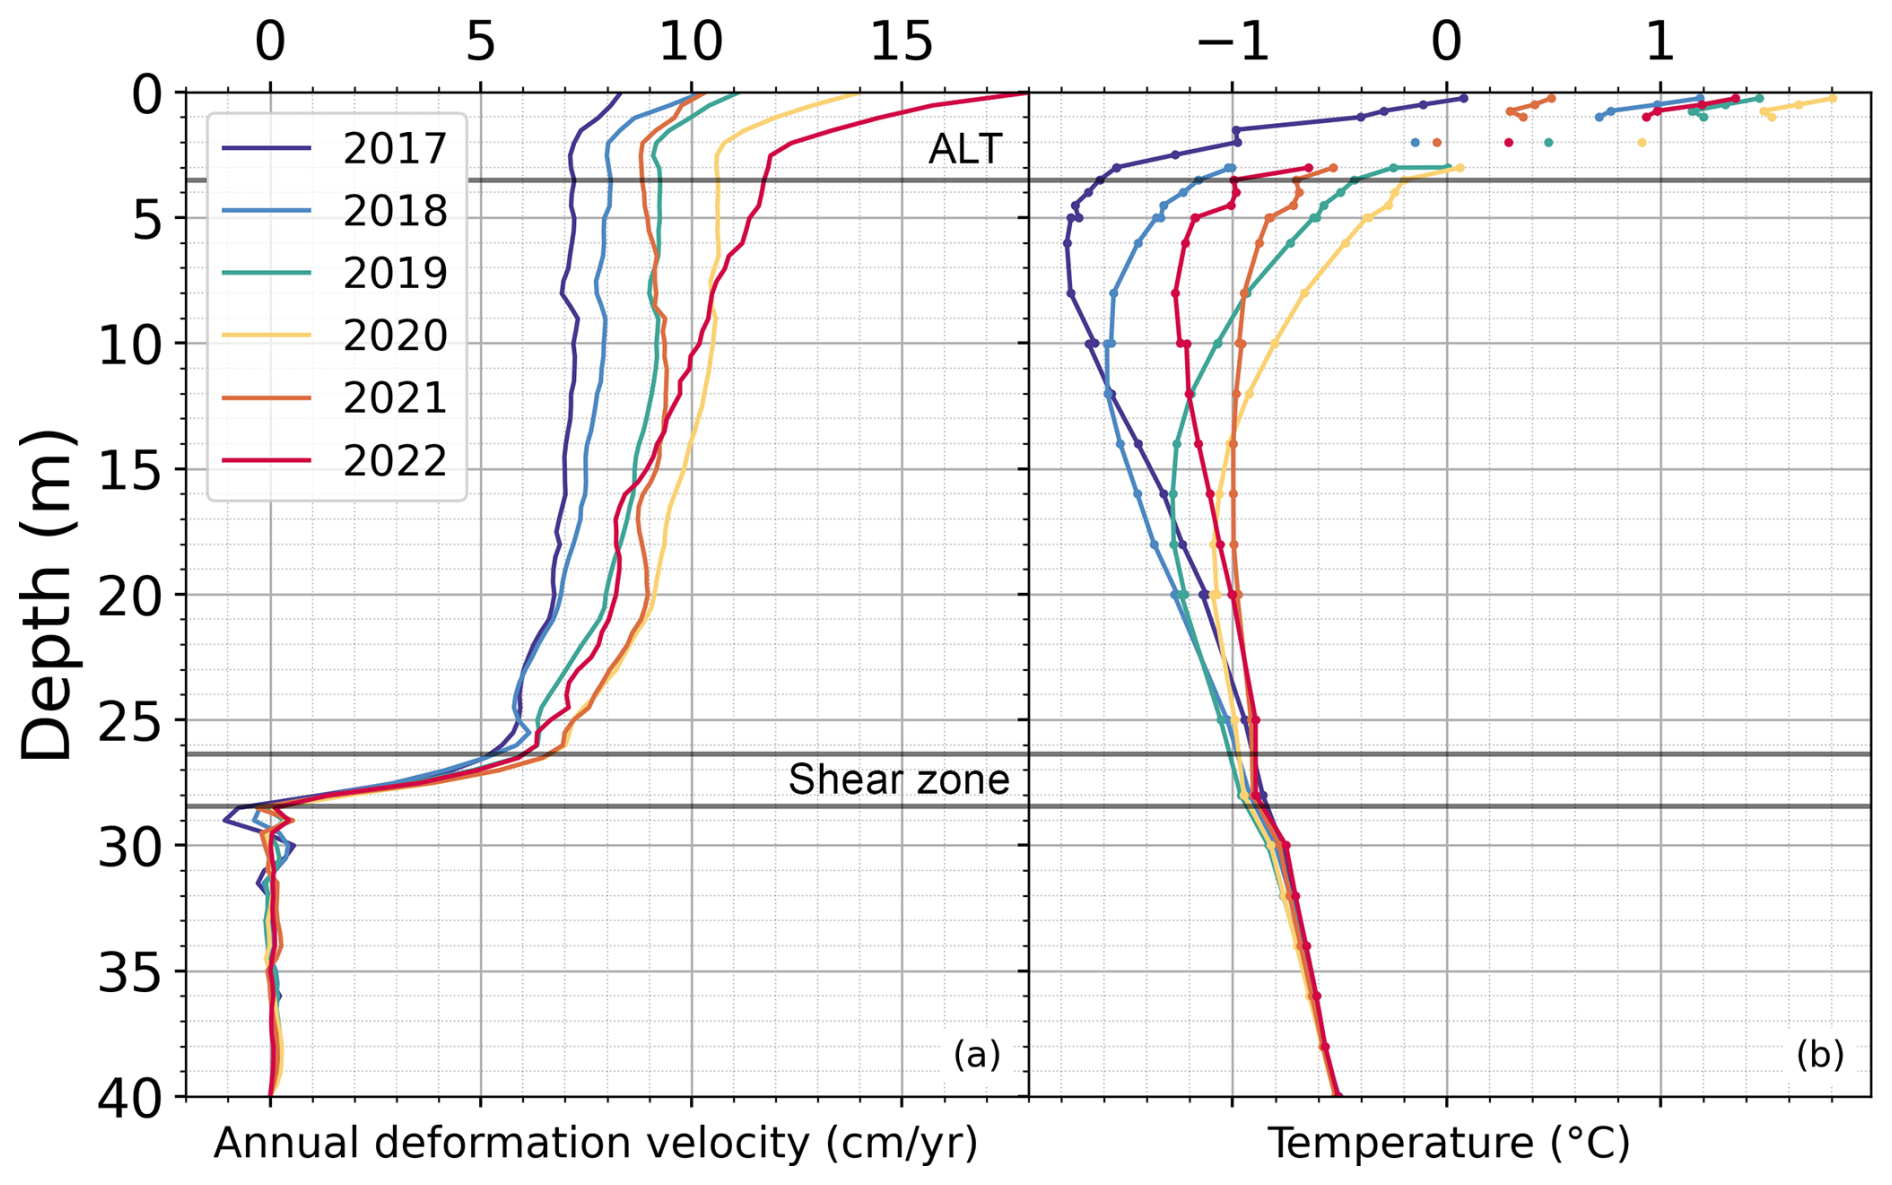
Table 2For each layer and each year the fraction of deformation, as a percentage, relative to surface annual displacement, the layer-specific velocity difference, and the layer-specific shear strain rate are shown.
3.3 Seasonal variations of borehole deformation
The monthly displacement data measured by the borehole SAA chain allow to investigate the seasonal variations in the creep of Murtèl rock glacier with depth. Of the three identified layers, only the AL consistently experiences a seasonal cycle in velocity. Starting in mid-August, the AL accelerates and peaks around early September followed by lower deformation during the cold phase from November on (Fig. 5b). The velocity during the cold phase does not vary much from year to year. During the seasonal peaks, the velocity at the surface is about four times higher than in the shear zone. In 2020 and 2022, when the seasonal peaks in surface velocity are especially high, there is also seasonal acceleration in the ice-rich core deformation (Fig. 5). In 2022, an increase in monthly velocity during the warm phase can be seen down to 15 m. In 2021, the seasonal peak in AL deformation is missing and the velocities in the ice-rich core decrease to negative values; this special event will be discussed in Sect. 4.3. The monthly velocity over the shear zone does not show a seasonal pattern and is stable at a mean of 0.5 cm per month. The GNSS station measures a surface velocity similar to the SAA chain velocity during winter and a similar timing of the acceleration pattern in summer, with the peaks being on average 67 % higher in magnitude than those measured at the top of the SAA chain (Fig. 5b). The only year when this is not the case is 2022 when the GNSS peak occurs one month before the SAA peak, although the magnitudes are similar. The annual displacements measured by the geodetic surveys are difficult to compare because they are measured over different periods. However, an acceleration can be observed around 2018, 2020 and 2022 (Fig. 5a).
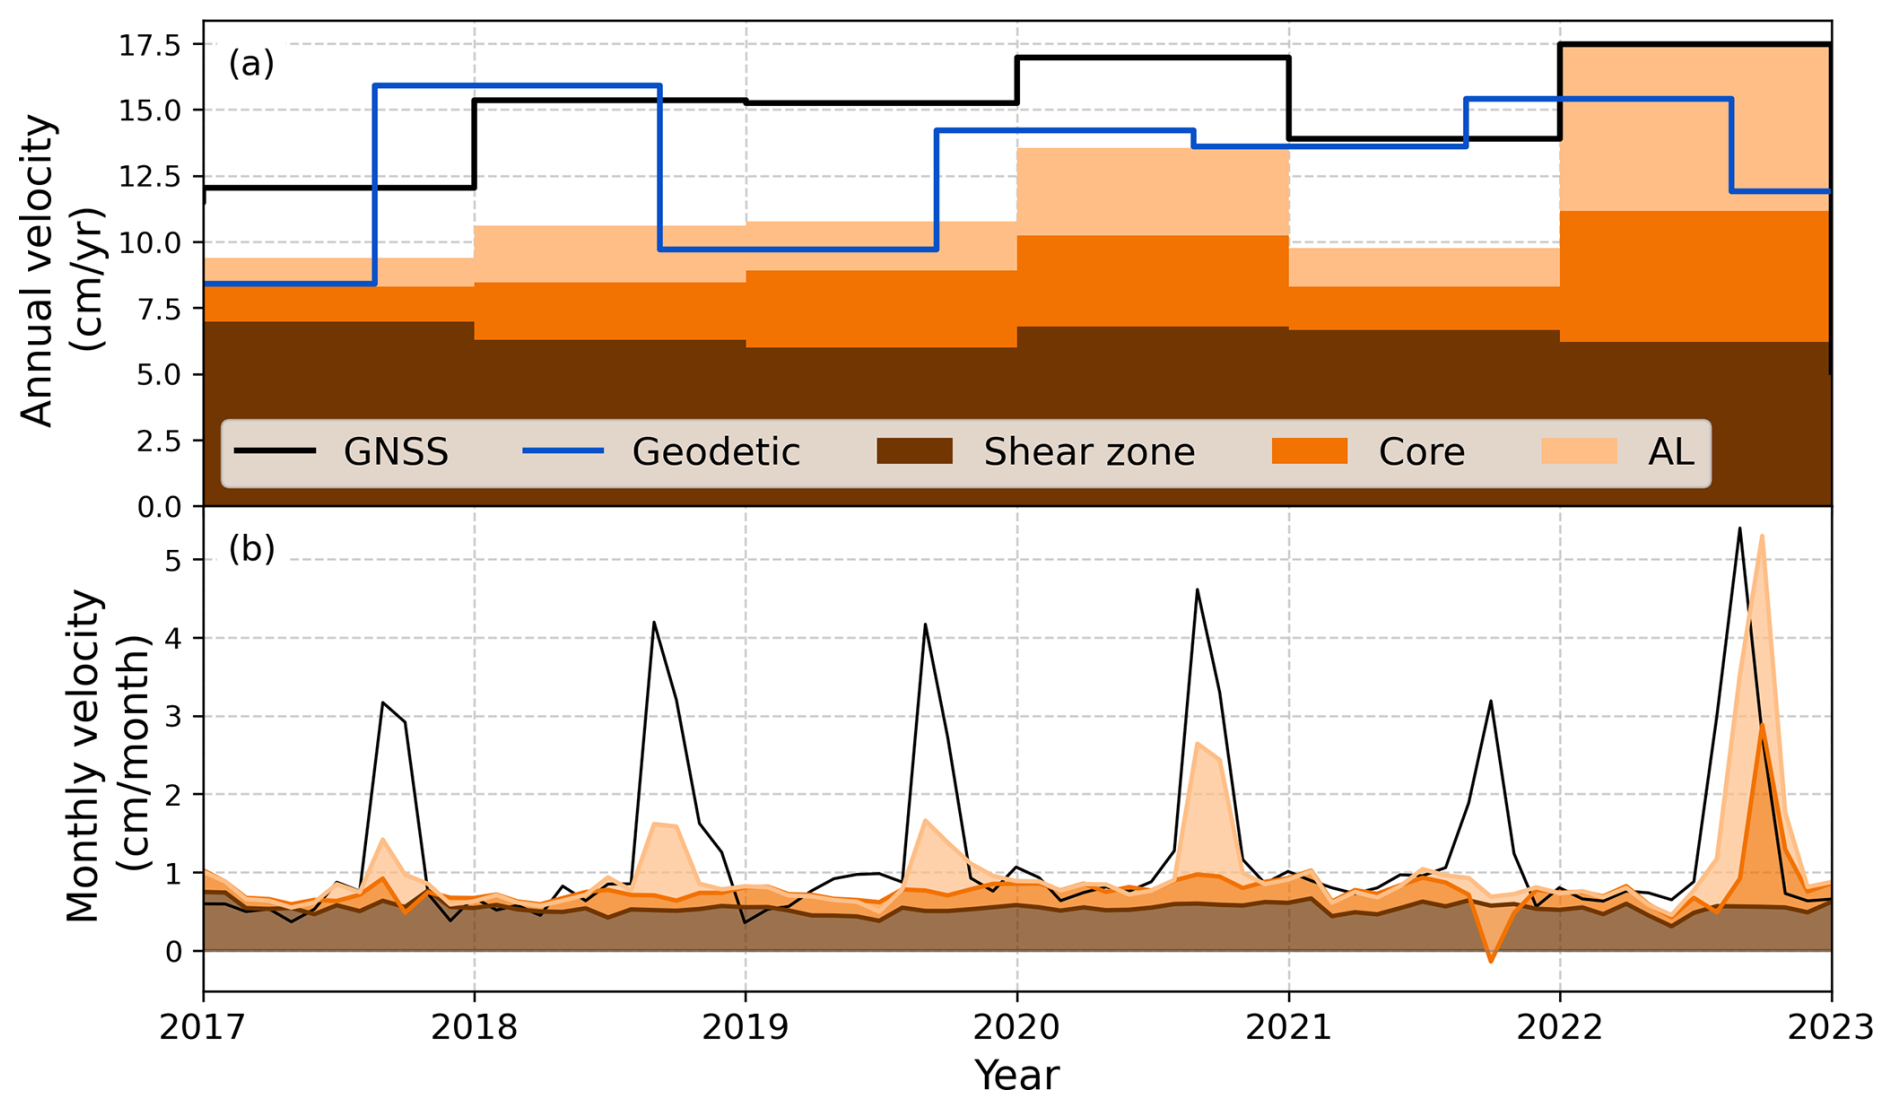
Figure 5Layer-specific cumulative velocity over time: (a) at an annual resolution and (b) at a monthly resolution. Measurement are from the borehole SAA, the GNSS station and the geodetic marker (only with an annual resolution).
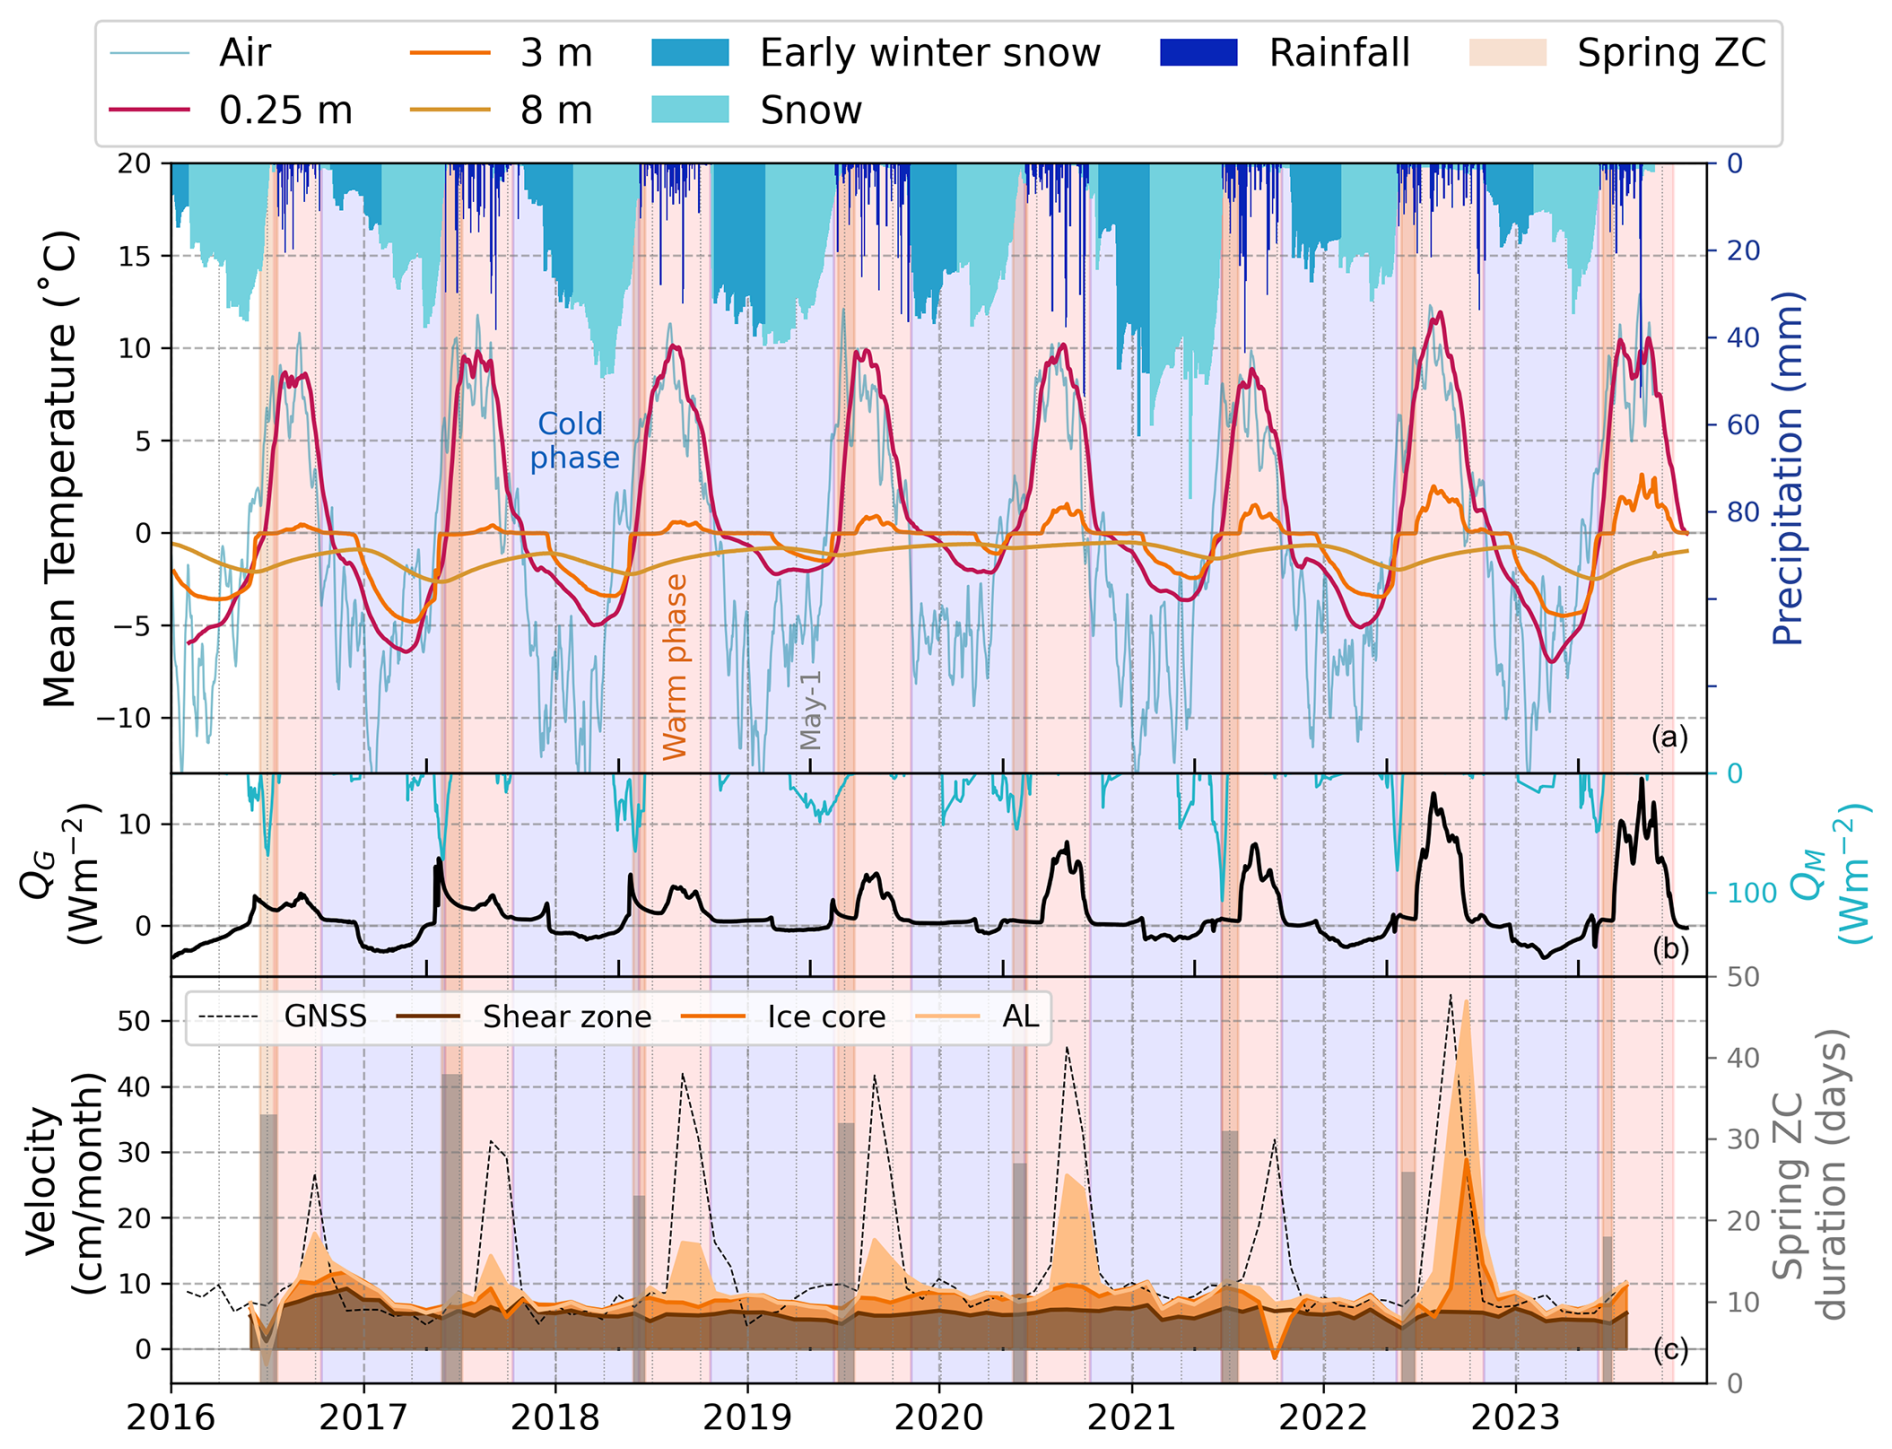
Figure 6Temporal variations in deformation in context of external climatic forcings. (a) Daily snow height, daily precipitation rate and air temperature for Murtèl together with borehole temperatures at 0.25, 3 and 8 m from the 2015 borehole (data from PERMOS; PERMOS, 2024). (b) Ground heat flux (QG) measured at 3.5 m in the 2015 borehole and snowmelt energy flux (QM). (c) Monthly layer-specific velocity for AL, ice-rich core and shear zone together with the GNSS velocity and the spring zero curtain (ZC) duration. The spring ZC is shaded in light orange, the warm phase is shaded in a lighter orange and the cold phase is light blue.
3.4 Seasonality in atmospheric conditions and borehole temperatures
The strong seasonality in both the atmospheric conditions and borehole temperatures is illustrated in Fig. 6a. The annual snowfall amount is rather variable, with winters such as 2021–2022 and 2022–2023 having low snow accumulation, while others such as 2020–2021 having high snow accumulation. The cold phase starts when the ground temperature goes below freezing and the warm phase starts with the disappearance of the snow cover. During the warm phase, the temperature of the air and that at 0.25 m depth in the borehole closely follow each other, whereas in the cold phase the air temperature is clearly colder than the temperature at 0.25 m depth (Fig. 6a). The maximum warm phase temperature at 0.25 m is relatively constant at about 10 °C, except for the colder summers of 2016 and 2021, and the warm summer of 2022. The minimum cold phase temperature at 0.25 m is more variable from approximately −6 to −2 °C. The duration of the warm phase ranges from 110 to 165 d, with 2021 having the shortest warm phase and 2022 the longest. The duration of the cold phase ranges from 210 to 250 d, with 2020 having the shortest cold phase and 2021 the longest (Table A1). The peak in snowmelt energy is typically observed between late May and early June and before the start of the spring zero curtain in the AL (Fig. 6b). On average, the spring zero curtain lasts about one month from May to June and the snow melts out by mid-June. The autumn zero curtain spans from the end of October to November (Table A2). The annual maximum ground heat flux at 3.5 m occurs during snowmelt for the first three years, after which it occurs later in the summer before the maximum AL temperatures are reached.
4.1 Layer-specific contributions to deformation
The active layer (AL) is the only layer in Murtèl rock glacier to experience a consistent seasonal cycle in deformation. Compared to other rock glaciers with shorter or older data series, Murtèl has a high fraction (20 %) of surface displacement happening in the AL (Table 3). High AL displacement has also been measured in the 1987 borehole inclinometer record at Murtèl rock glacier and in the shallow inclinometer record at Ritigraben rock glacier (Fig. C1; Arenson et al., 2002; Lugon and Stoffel, 2010). The deformation data from the old borehole at Murtèl rock glacier were collected using a fundamentally different methodological approach, where the inclinometer had to be extracted manually along a metal rail each year to record the data. So, the fact that a strong AL deformation was still observed using this old method strengthens the validity of the high AL deformation measured by the new SAA chain. The other sites with borehole inclinometer measurements report at most only 8 % of surface displacement occurring in the AL (Table 3). The 23 m thick ice-rich core in Murtèl rock glacier makes up 26 % of the total surface displacement. The inclinometer measurements from the 1987 borehole at Murtèl rock glacier report that the ice-rich core contributes to about 33 % of surface movement (Arenson et al., 2002). Nearby Muragl and Schafberg rock glaciers have a contribution of the ice-rich core to surface displacement of 3 %–47 % and 17 %–20 % respectively (Table 3). Furggwanghorn rock glacier has close to zero deformation in the ice-rich core (Buchli et al., 2018). So, there is a large variation in the contribution of the ice-rich core to rock glacier deformation between different sites, likely due to the composition of the ice-rich core and its thickness.
The shear zone (26.5–28 m) represents the largest fraction of surface displacement at Murtèl rock glacier (56.2 %). This shear zone contribution in the 2015 borehole agrees relatively well with the 59 % calculated from the old 1987 inclinometer data (Table 3). At other rock glaciers with inclinometers down to the shear zone, the fraction to total deformation varies greatly from 50 % to over 90 %. Murtèl rock glacier is at the lower end of this range, while at the other end, Furggwanghorn rock glacier has a shear zone displacement that is almost equal to its surface displacement (Buchli et al., 2018). The 1987 inclinometer data measured a deeper shear zone at 28–31 m compared to the 26.5–28 m for the 2015 borehole (Arenson et al., 2002). The depth of the shear zone between the two boreholes is difficult to compare as the they are in different locations and the depth of the shear zone plane is likely not spatially uniform. The fraction of surface displacement that occurs in the shear zone depends on the stratigraphy of the shear zone and its depth (Kääb et al., 2007; Kenner et al., 2020; Bast et al., 2024). At Murtèl rock glacier, the ice content above the shear zone is still high with only some thin layers of fine sediment. In the shear zone, the ice content decreases substantially and is replaced by frozen fine sediments with a few coarser particles, reducing its shear strength. Below the shear zone, the debris becomes coarser and the ice content approaches zero. The high strain rates generally found in the shear zone could be linked to this high heterogeneity in the stratigraphy around the shear zone leading to strain localization (Moore, 2014). The thin shear zones found at shallower depths at other rock glaciers measure high contributions to surface displacement compared to the deeper shear zones (Table 3). The new SAA data from the Murtèl rock glacier borehole highlight how different sites can have different vertical distributions of deformation, with the shear zone generally having the largest component. In summary, compared to other sites, the ice-rich Murtèl rock glacier has a relatively low fraction of deformation in the shear zone and relatively high deformation in the ice-rich core and the AL.
Table 3Layer-specific fractions of surface displacement calculated from deformation profiles in different rock glacier boreholes instrumented with an inclinometer. Values in parenthesis are from Arenson et al. (2002) if different from ones reported here.
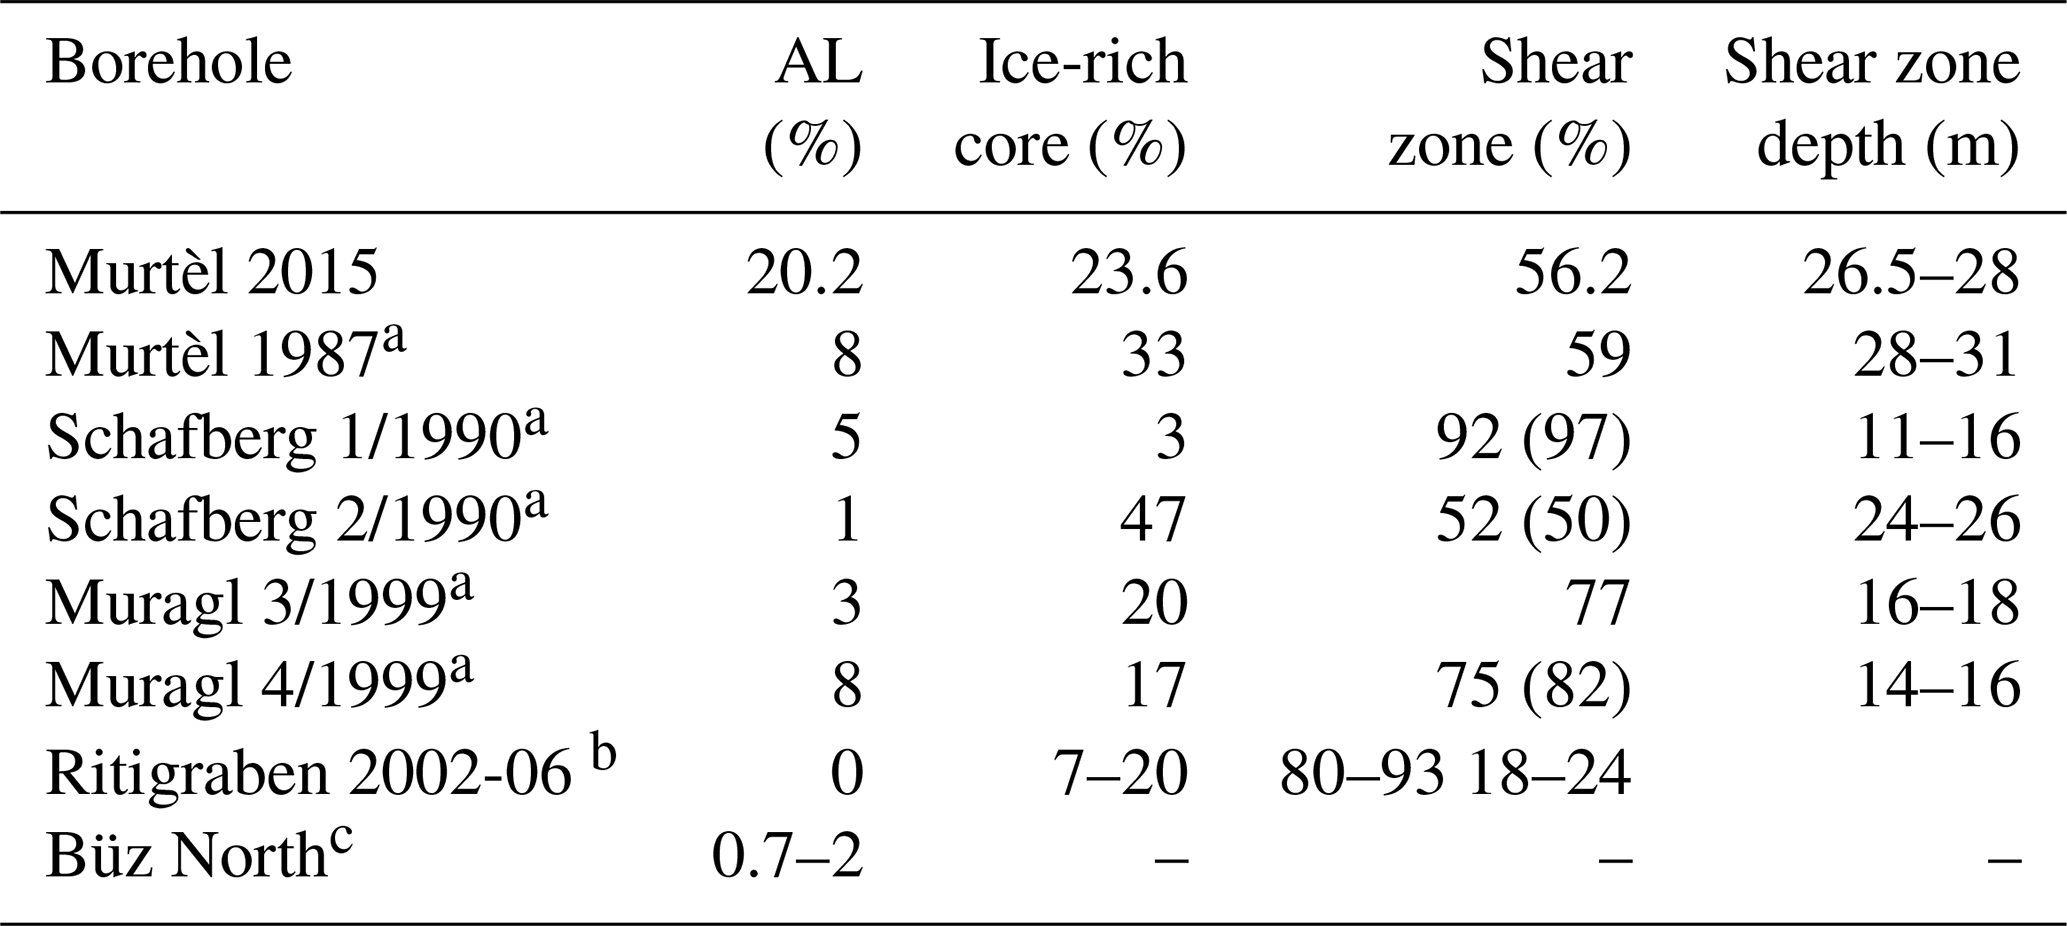
a Arenson et al. (2002); b Kenner et al. (2017); c Ikeda et al. (2008)
4.2 Seasonal controls of deformation
4.2.1 Cold phase controls
During the cold phase, the snowpack acts as an insulator to the permafrost temperatures, and this has consequences on the deformation below. Figure 6a shows how, during the cold phase, the decrease in temperature in the borehole is more attenuated compared to the decrease in air temperature. An early winter with high snow accumulation acts to insulate the permafrost below and leads to warmer permafrost temperatures (Hoelzle et al., 1999; Kenner et al., 2020; Amschwand et al., 2024). The amount of snow accumulation from November to January has a positive and significant correlation with the average March-April temperature at the top of the permafrost table for the periods 1997–2022 and 2016–2022 (R2=0.64, 0.79 respectively). So, a high accumulation of early winter snow leads to warmer permafrost temperatures both during and after the winter. The years with the least negative ground heat flux during the cold phase are also the years with the most snow accumulation during the early winter (Fig. 6a–b). A persistent thick snow cover leads to less winter cooling of the permafrost at depth, which carries over into the following warm phase, as within the ice-rich core a significant correlation was found between the cold and warm phase temperatures (Fig. B2). The ice-rich core has a higher heat capacity due to its high ice content, and therefore, there is a longer phase lag for its annual temperature cycle. So, the early winter snow accumulation has a lasting effect on the following warm phase temperatures in the ice-rich core. The warm phase temperatures in the ice-rich core are strongly correlated with the annual deformation within this layer (Fig. B1c). So, years with a snow-rich early winter experience warmer winter borehole temperatures, which in the ice-rich core are followed by higher warm phase temperatures, and thereby higher deformation.
4.2.2 Warm phase controls
Many rock glacier kinematic studies report seasonal surface acceleration during or shortly after the spring melt (Ikeda et al., 2008; Kenner et al., 2020; Bast et al., 2024). The relatively high water flow speed measured in rock glaciers indicates a high drainage efficiency of meltwater (Krainer and Mostler, 2002; Buchli et al., 2013; Bast et al., 2024). However, for Murtèl rock glacier, the time lag from the end of the seasonal melt, which can be from the end of May to July, to the start of acceleration in displacement in August is on the scale of weeks to months. This is much longer compared to a time-lag of only a few days found at eight other rock glaciers (Buchli et al., 2013; Wirz et al., 2016; Kenner et al., 2020). At Murtèl rock glacier there are, on average, 50 d from the end of the spring zero curtain to when the maximum surface velocity occurs (Table B1). Direct measurements of water content in Murtèl rock glacier are not available, therefore the timing and duration of the snowmelt and spring zero curtain are used as proxies for meltwater production. The mean snow height in April to June is not correlated with the annual displacement measured by the top of the SAA chain (R2=0.1) and is negatively correlated with the annual maximum GNSS velocity (R2=0.6). This suggests that years with more snowmelt in spring have a lower peak in surface velocity. In 2021, after a snow-rich winter and a mild and wet summer, Murtèl rock glacier had its lowest seasonal peak in velocity, while the nearby Schafberg rock glacier had its highest annual velocity (Bast et al., 2024). For three rock glaciers in the Matter Valley, Switzerland, short peaks in surface velocity were measured shortly after rainfall rates of 10 mm d−1 or above (Wirz et al., 2016). However, no short-lasting peaks in velocity after large precipitation events can be observed at Murtèl rock glacier. Cicoira et al. (2019b) report that at Dirru rock glacier seasonal acceleration is driven by the water input from snowmelt and rainfall. The sum of warm phase precipitation at Murtèl rock glacier does not have a significant correlation with the magnitude of peak surface velocity for both the GNSS and SAA data. All of this suggests that the timing and magnitude of the seasonal acceleration observed in the AL of Murtèl rock glacier cannot be explained by the influx of water from snowmelt or rainfall alone.
Thermal processes in the active layer (AL) during the warm phase are found to be linked to the acceleration in the AL deformation. The timing of the end of the spring zero curtain sets the start of positive ground heat flux through the AL during the warm phase (Fig. 6b). The earlier the spring zero curtain ends, the warmer the AL becomes, as the coupling between the atmosphere and the AL begins earlier (Fig. 7a). During the snowmelt and the thawing of the AL ground ice, 20 %–30 % of the meltwater can refreeze near the bottom of the AL (Amschwand et al., 2025). At Murtèl rock glacier ice was observed during the summer 2015 drilling at a depth of 2.7 m, so within the 3.5 m thick AL. An earlier onset of the thaw season, with positive ground heat flux, leads to more melting of this refrozen ice, which reduces shear resistance and increases deformation. Amschwand et al. (2024) found that 70 % of the incoming radiation at the surface of Murtèl rock glacier is absorbed in the AL as latent heat used to melt ground ice. So, a plausible agent for the observed high AL deformation is a high heat content that thaws more of the refrozen AL seasonal ice and reduces shear resistance. The ground heat flux through the AL was the most statistically relevant variable for the multiple linear regression (MLR) model built to predict monthly GNSS velocities using four different thermal variables (R2=0.66, Fig. B3). Moreover, when the AL reaches its maximum thickness later in the season, the maximum GNSS velocity is higher (Fig. 7e). In other words, more persistent warm conditions in the AL create favorable conditions for high surface movements and thereby AL deformation. In 2022 both Murtèl and Schafberg rock glaciers recorded one of the highest AL summer temperatures. Murtèl experienced then its highest seasonal velocity peak, while Schafberg rock glacier showed a strong deceleration (Bast et al., 2024). This indicates that different rock glaciers respond differently to seasonal external forces and that the drivers of rock glacier creep go beyond ground temperatures.
Another process behind the AL deformation may be that the ice-free debris matrix that makes up the top of the AL goes through a seasonal consolidation driven by gravity after the AL ground ice thaws. In such a case, the grain-size distribution of the blocks in the AL becomes important. Arenson et al. (2002) state that the shear resistance caused by the interlocking forces of the individual grains in the AL is higher for larger grains compared to smaller ones. The top of the AL at Murtèl rock glacier is especially coarse, so this consolidation mechanism would be limited by the high interlocking forces. Future inclinometer measurements of AL deformation at other sites would be needed to further evaluate the interpretations presented here.
Depending on the rock glacier, ground surface temperatures can be a useful tool for inferring the timing and magnitude of peak deformation. On average, at Murtèl rock glacier the time lag between the annual maximum ground surface temperature and the GNSS velocity is only 15 d, while at Ritigraben, Muragl and Schafberg rock glaciers this time lag is much longer at 2–3 months (Cicoira et al., 2019a). The shorter time lag between temperature and velocity at Murtèl rock glacier exemplifies the important link between temperature and creep at a seasonal timescale. The maximum ground temperature at 10 m occurs 5 months later than at the surface, which is similar to the 6 months observed by Vonder Mühll and Haeberli (1990) also at Murtèl rock glacier. So, only at longer timescales can the temperature at depth be a general indicator of the deformation at depth. In fact, as seen in Fig. 4b, the cold temperature profiles for 2017 and 2018 agree well with the lower annual deformation velocity for these years. Similarly, the warm temperature profile for 2020 corresponds to a high annual deformation velocity. The correlation between the mean annual borehole temperature and the annual deformation is the strongest for depths 8–15 m (Fig. B1a). The apparent link between ice-rich core temperatures and deformation supports the claim that the ice-rich core of rock glaciers experiences plastic deformation. Glen's law for ice flow states that stress and temperature are the main drivers for creep, and for rock glaciers this is relevant when the debris content is lower than 40 %, such as in the case of the Murtèl ice-rich core (Moore, 2014). Using a change in the observed mean temperatures in the ice-rich core from −1.3 °C in 2016 to −1.0 °C in 2023 to perform a hypothetical thermal adjustment to the rate factor while assuming that the shear stress in the ice-rich core remains constant, Glen's law predicts that the strain rate should have only increased by a factor of 1.02 during this period. The measured increase in strain rate using a velocity difference across the ice-rich core of 1.9 cm yr−1 in 2016 and 3.4 cm yr−1 in 2023 is of a factor of 1.8. So, Glen's law of ice flow and its temperature dependence through the rate factor cannot alone explain the change in strain rate of the ice-rich core at Murtèl rock glacier. The presence of the debris-rich active layer on top and the shear zone below create additional boundary conditions for the deformation dynamics of the ice-rich core which are not taken into account by Glen's law. The few thin debris-rich layers within the ice-rich core are also likely to lead to variations in the flow parameters of Glen's flow law within the ice-rich core or even lead to other creep mechanisms than plastic deformation. The creep of debris-poor ice is known to depend on the ice content and grain size, which affect the strain rate response to the applied shear stress (Cicoira et al., 2021). Various laboratory experiments found that when the debris content exceeds about 40 %, the interlocking forces between debris particles become dominant enough to increase the shear resistance and thus reduce the strain rate (Bucki and Echelmeyer, 2004; Ladanyi, 2003; Moore, 2014). So, rock glacier ice-rich cores with low debris content should experience higher strain rates and therefore a larger contribution to surface displacement, as observed at Murtèl rock glacier.
Hydrology has been suggested to be an important driver of seasonal changes in deformation in the shear zone (Cicoira et al., 2019b). In some rock glaciers, for example Schafberg, studies report that the pore water pressure in the shear zone can vary seasonally as a response to water infiltration (Kenner et al., 2017, 2020; Bast et al., 2024). The hydrological response of the shear zone depends on the hydraulic conductivity of the ice-rich core above. The efficiency of the drainage system depends on the temperature and the stratigraphy of the permafrost (Cicoira et al., 2019b). Murtèl rock glacier has a thick cold permafrost core, and most depths have annual mean temperatures below −1 °C (Fig. 4). Cold ice has a lower permeability, making it more unlikely that a seasonal drainage system develops at depth. As a result, drastic changes in pore pressure around the shear zone are not expected, unlike at warmer sites. So, it is reasonable that at Murtèl rock glacier, the shear zone velocity is stable both seasonally and multi-annually. It is important to note that due to the variety of the stratigraphy and internal structure of different rock glaciers, there may not be a universal dominant seasonal control of deformation. For example, a rock glacier with predominantly plastic deformation is likely to respond more to thermal forcings, than a rock glacier with a larger shear zone component, which is likely to be more sensitive to changes in pore water pressure (Kenner et al., 2017).
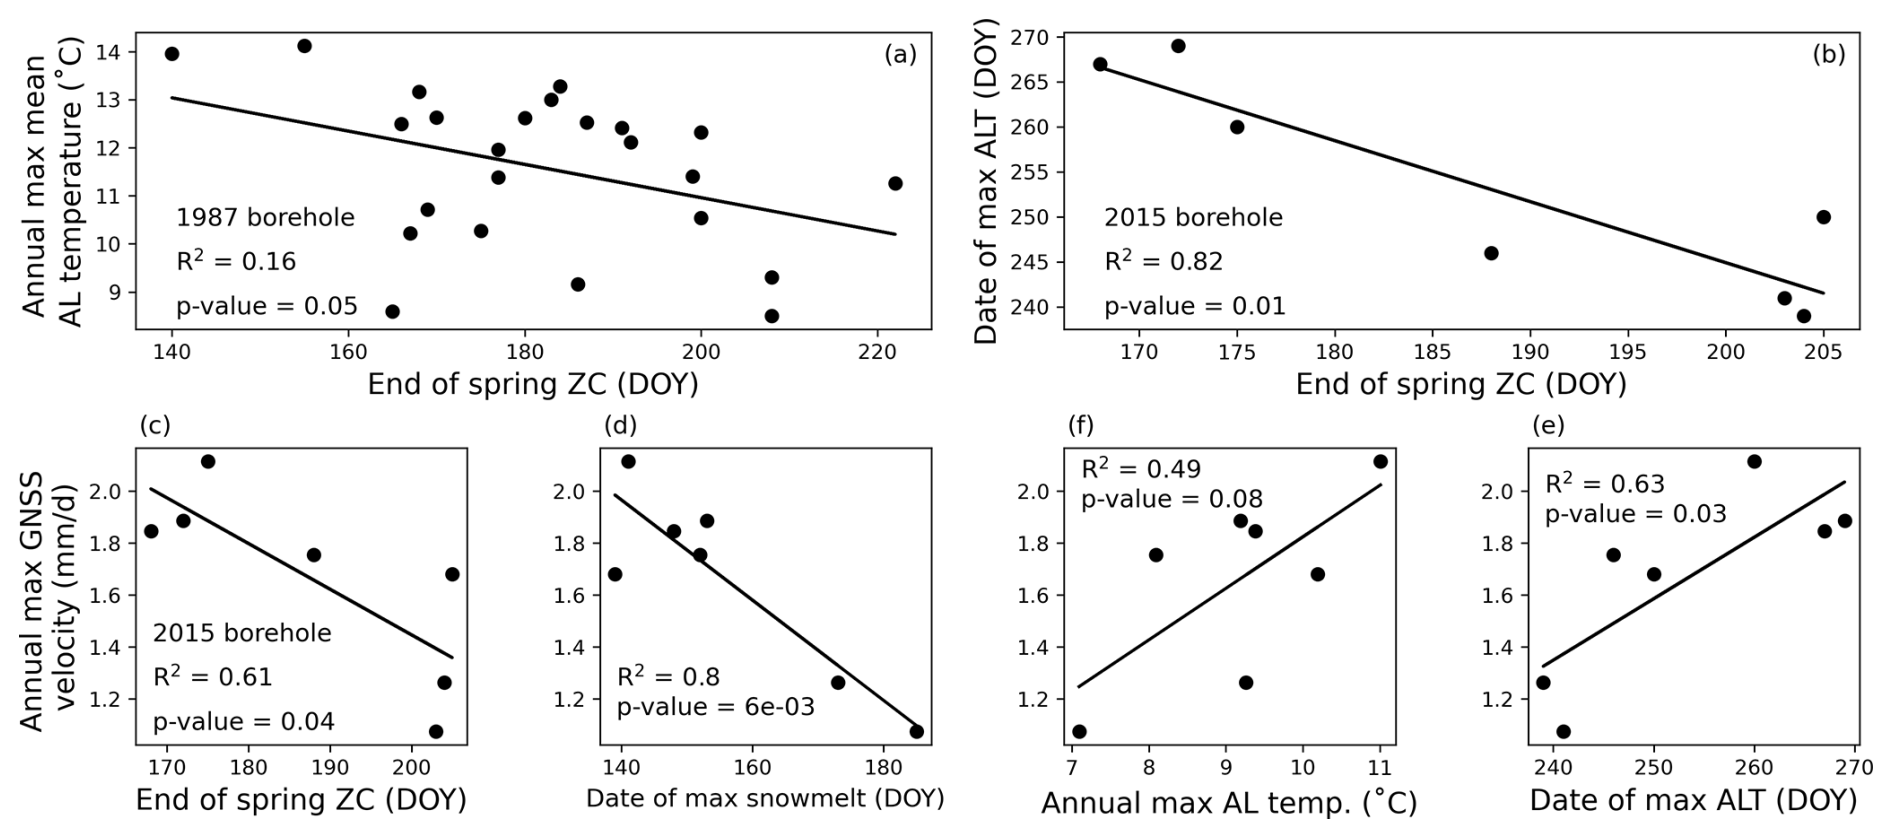
Figure 7Linear regression analysis between the end of spring zero curtain (ZC) and the annual maximum mean AL temperature for (a) the 1987 borehole data and (b) the 2015 borehole data. Linear regression analysis for years 2016–2022 between the annual maximum GNSS velocity and (c) the date of the end of the spring ZC, (d) date when snowmelt is the highest, (e) the annual maximum AL temperature, and (f) the date when AL thickness reaches its maximum. Data source: PERMOS (2024).
4.3 SAA chain behavior and limitations
In the monthly time series of borehole velocity data, there are two summers that stand out: 2021 and 2022 (Fig. 5). From August to September 2021, both the AL and the ice-rich core experienced unusually low velocities, with the ice-rich core recording negative values, meaning that the SAA chain moved horizontally backwards. In the vertical deformation profile of 2021 the most pronounced inversion in velocity is observed at the permafrost table and extends down to only about 5 m (Fig. C2). Below approximately 15 m the velocity remains positive and relatively constant. It is difficult to say what caused the apparent backward movement of the SAA chain segments at the top of the ice-rich core; however, it can be speculated that the SAA chain itself buckled backward within the filling material inside the casing of the borehole. During these few months, the SAA chain only moved backwards by about 1 cm, which is well below the 11 cm diameter of the borehole casing. The GNSS station did measure a surface velocity peak during 2021, so this supports the idea that the cause of this SAA chain behavior is structural and specific to the borehole. The lack of a velocity peak in 2021 is also what caused the correlation analysis to be weaker with the SAA data compared to the GNSS data. In 2022, an almost opposite SAA chain behavior occurs, where towards the bottom of the AL an unusually strong acceleration in August and September occurs (Fig. C3). This acceleration behavior can be observed down to 15 m depth, so it is unclear whether this event originated at the permafrost table or deeper in the ice-rich core. The cause of this deviation of a few centimeters from the typical seasonal acceleration is again likely to derive from an adjustment of the chain within the filling material in the borehole casing. Both 2021 and 2022 have the largest deviations from the typical horizontal direction of movement, which would fit with an unusual movement of the chain within the casing (Fig. C4). Direct observations of the state of the SAA chain in the borehole are not possible, and this limits the evaluation of such events. It is also important to consider that errors during the mandatory data conversion with the Measurand propriety software cannot be assessed as it is not open-source and its processing steps are unknown. Buchli et al. (2016) suggest that this software likely performs not only the trigonometric conversion of the angular data to displacement vectors but additional steps to account for the flexing and strain on the joints that link the SAA segments. The only data available to validate the SAA data are the inclinometer records from the old 1987 borehole. The deformation profiles from the old and the new borehole have a very similar shape with similar values for the fraction of deformation in each layer and the depths of the shear zones only differ by 2 m (Table 3, Fig. C1). The similarity is reassuring, as the inclinometer chain in the 1987 borehole had a very different installation and measurement technique. Any large systematic errors of the 2015 SAA data can be ruled out as the total displacement integrated at the top of the SAA chain differs only a few centimeters from that measured by the geodetic surveys of the surface block a few meters away. This also demonstrates that the seasonal peaks measured in the AL by the SAA chain are robust because otherwise the difference in total surface displacement to the geodetic data would be much larger. In the future, a GNSS station placed directly on top of the borehole chamber would further strengthen the validation of the near-surface SAA data. For now, an accuracy assessment of the SAA data can be done using the measurements at depths below the shear zone, where it is assumed that there should be no displacement. There, the observed maximum total displacement measured over the 7.25 years is 2 cm, and this can be used to estimate an annual velocity uncertainty of 0.3 cm yr−1 which is three times more than that reported by the manufacturer. This, then, can be considered as an upper bound of the instrument uncertainty, and it remains well below the typical surface velocity magnitudes of 1–5 cm per month. This gives confidence in the kinematic patterns and processes inferred from the SAA data throughout this study.
4.4 Evaluating the methods to measure surface displacement
Murtèl rock glacier, given its abundance of kinematic monitoring, provides the unique opportunity to compare different measurement methods of rock glacier movement. The GNSS station at Murtèl rock glacier measures more deformation than the borehole SAA chain, although the two stations are only a few meters apart. The total displacement of the GNSS station calculated from the distance of its position in July 2016 to August 2023 is 101 cm, while aggregating the displacement of the uppermost SAA segment yields 86 cm. Most of the discrepancy between the GNSS and the SAA data occurs during the warm phase when the seasonal peaks in GNSS deformation exceed those of the SAA (Fig. 5). The GNSS receiver is mounted on a one-meter-tall mast on top of a single large boulder that exhibits additional movements on top of the general translational movement of the active layer, leading to higher values of displacement. The inclinometer of the GNSS station measures an increase in tilt during the seasonal acceleration towards a different direction than that of the rock glacier creep, suggesting that the boulder experiences separate rotational movements (Fig. C5a). The corrected GNSS total displacement after removing the rotational component is 1.5 cm lower, providing a slight improvement (Fig. 8). A difference in the total displacement of 14 cm over seven years between the GNSS system and the SAA chain is an acceptable result, considering that the SAA chain integrates the movement across 80 segments over 40 m depth. Moreover, even with these methodological differences, the timing of the seasonal surface velocity peaks is very similar between the GNSS and the borehole SAA data (Fig. 5b).
The total geodetic displacement measured by the total station over the entire period differs only by 3 cm relative to the total displacement measured by the SAA chain (Fig. 8). At first sight, this is perhaps surprising given the apparent large difference between the annual geodetic velocities and those of the SAA in Fig. 5a. However, it is important to note that the annual geodetic survey dates are at the end of August, such that in most years the true seasonal velocity peak is not fully captured. So, the annual values may not agree, but in the long-term it captures the total displacement well. A sensitivity analysis using alternative survey dates to calculate annual velocities from the GNSS and SAA data reveals that surveying at the end of September is sufficient to capture the appropriate annual velocity signal (Fig. C6). So, future geodetic surveys on Murtèl rock glacier would benefit by taking place in late September or later, provided that early snow does not limit access to the site. In summary, at longer timescales, the GNSS, SAA and geodetic displacement data agree relatively well. The GNSS total displacement deviates by about 10 % relative to the other methods, likely due to additional movements of the boulder it is mounted on. Rock glacier velocity (RGV) taken as a single mean value from surface measurements is often used to correlate with climatic variables as a parameter of the “permafrost” ECV (Kellerer-Pirklbauer et al., 2024; Hu et al., 2025). This study illustrates how different point measurements of surface displacement can lead to different results at annual timescales and that surface velocity may differ from velocity at depth. At the surface, the annual maximum monthly velocity from the GNSS was found to have the strongest correlations to atmospheric variables. Based on the borehole SAA data at Murtèl rock glacier, the annual variations in surface velocity are mostly limited to the active layer. The process understanding gained from this extensive data set from Murtèl rock glacier suggests that the degree of representativeness of changes in surface RGV for movement at depth depends on the internal structure and thermal regime of the rock glacier. For example, the thick and cold ice-rich core of Murtèl rock glacier limits the amount of meltwater infiltrating at depth, limiting the seasonal acceleration to near the surface. So, in order to reliably explain processes linking RGV and climatic factors, information about internal processes should be considered.
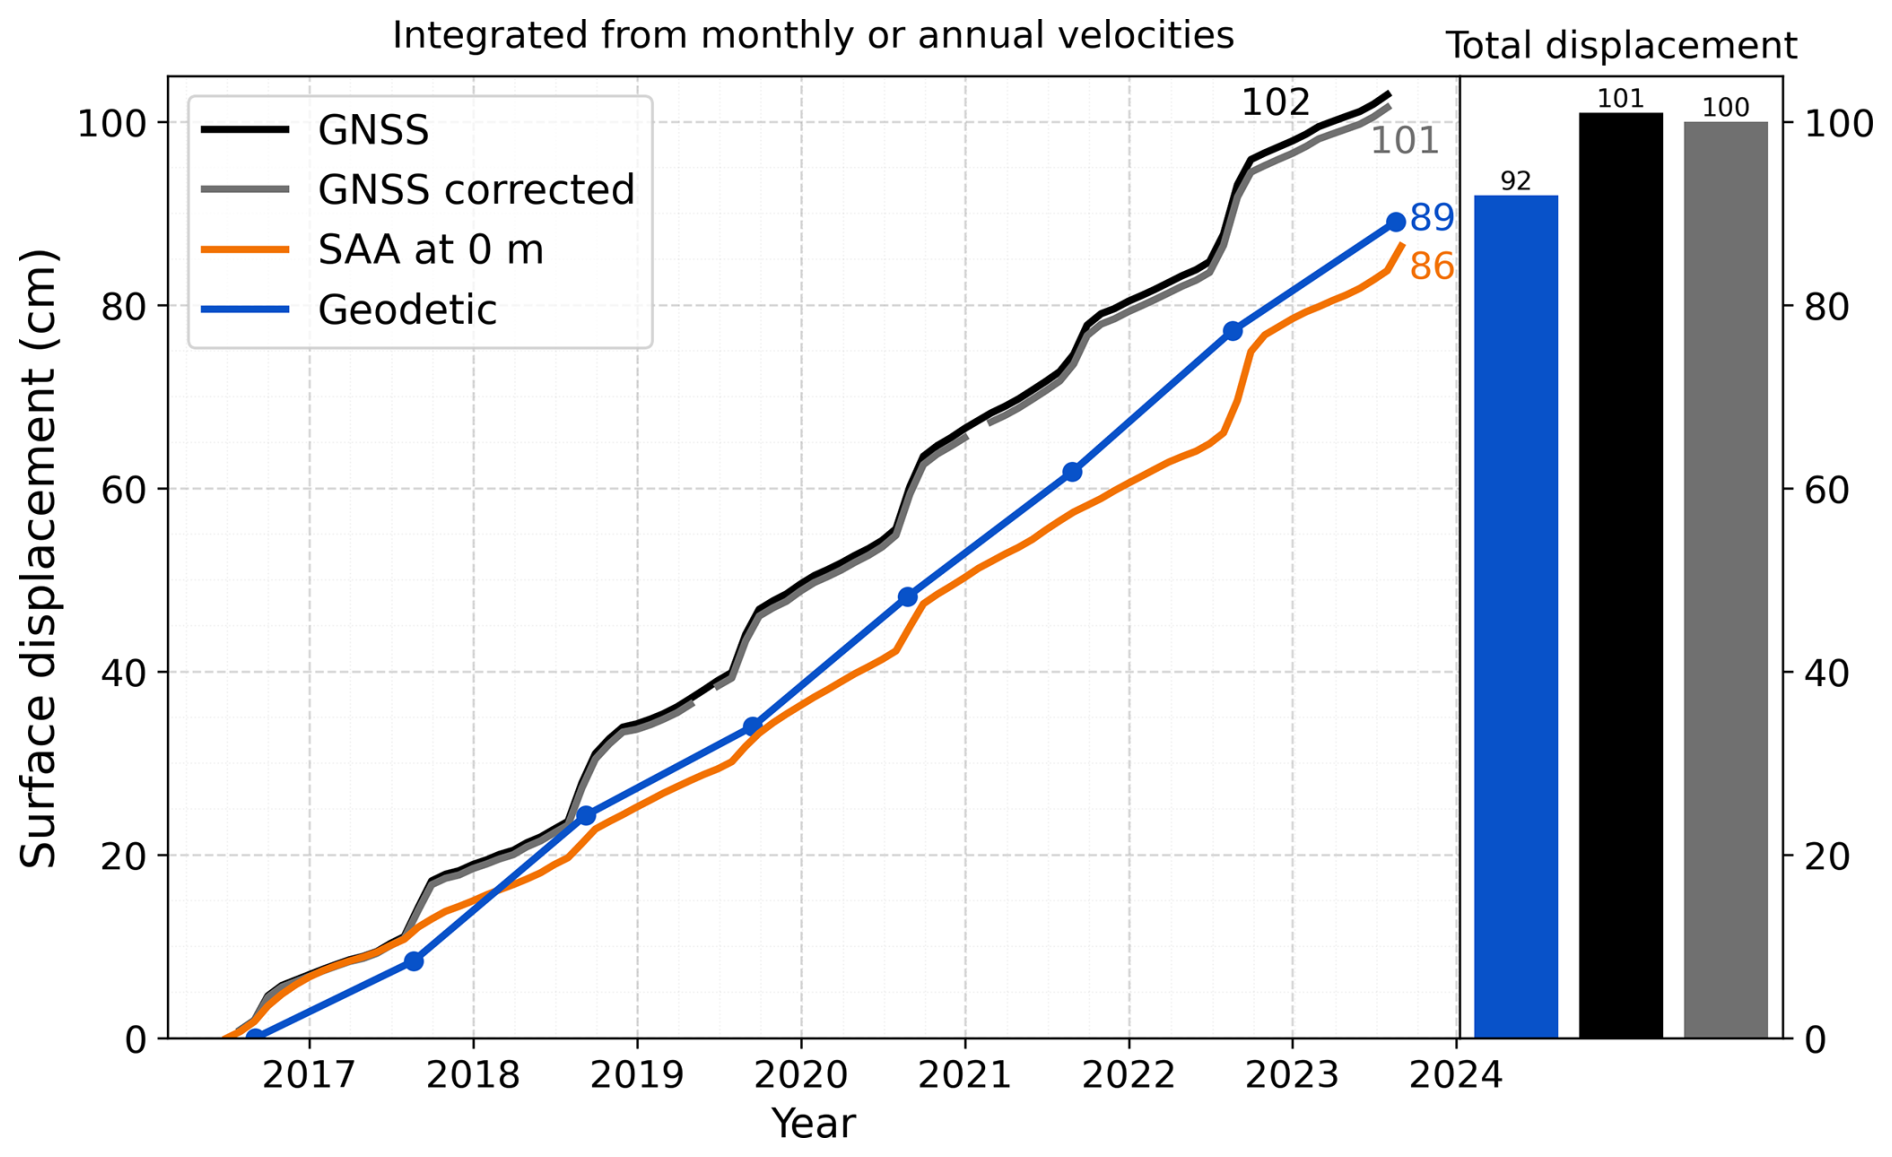
Figure 8Comparison between the surface displacement measured by the GNSS, SAA and geodetic station. The GNSS corrected data subtracts the rotational movement of the mast from the horizontal displacement. The cumulative lines are the integrated displacement from the monthly or yearly velocity data. The total displacement (cm) measured over the entire observation period by the GNSS and the geodetic station is shown on the right. Data source: PERMOS and PermaSense.
At Murtèl rock glacier temperature and deformation are both continuously measured from a thermistor and SAA chain bundle in a borehole since 2016. These observations are complemented with a GNSS station, annual geodetic surveys and a meteorological station. This provides a unique data set and opportunity to investigate rock glacier kinematics in detail, including deformation with depth and process understanding. The borehole deformation data collected over seven years indicate that, on an interannual timescale, most of the temporal variation in deformation is driven by the active layer (AL) and the ice-rich core. On a seasonal timescale, fluctuations are evident only in the AL, and at lower magnitude and only for a few years in the ice-rich core. The shear zone deformation remains constant at around 5.9 cm yr−1 throughout the observation period. Compared to the few other rock glaciers with borehole deformation data, we observe a larger proportion of deformation occurring in the AL. The vertical distribution of seasonal fluctuations in deformation at Murtèl rock glacier is driven by its thick and cold ice-rich core. Compared to other rock glaciers, Murtèl has a high ice content and cold temperatures, likely inhibiting the development of an efficient drainage system at a seasonal timescale. The years with the warmest summers had the highest deformation, but the years with highest water input from snowmelt did not experience particularly high deformation. Thermal forcing on the production of meltwater at the permafrost table seems to explain the near-surface summer acceleration well, while the stable shear zone deformation indicates an absence of water controls at depth. During the almost eight-year measurement period, the geodetic measurements of surface displacement match very well with the total displacement from the SAA chain. At an annual timescale, there are larger differences in the measured velocities between the SAA chain and the geodetic station, which can be largely explained by the different timing of the measurements. The continuous GNSS data agree well with the winter background velocity and the timing of the summer acceleration pattern as measured by the borehole SAA chain. However, the magnitudes of the GNSS velocity peaks are higher than those of the SAA measurements. The finding that most of the seasonal acceleration is limited to the active layer raises the need for more data on internal processes of rock glaciers to better understand where the strong correlations between RGV and climate variables come from. For this, it is important to continue the long-term monitoring of rock glacier deformation, especially with depth. This study shows how the unique seven-year record of high resolution deformation and temperature data with depth combined with meteorological data is crucial to identify subsurface processes and related forcings. Although Murtèl is especially cold and slow-moving and might not represent a typical Alpine rock glacier, the findings related to the seasonality distribution of deformation with depth are relevant for other similar sites where long-term borehole data are not available.
Table A1Durations in days of the cold and warm phase for each hydrological year.
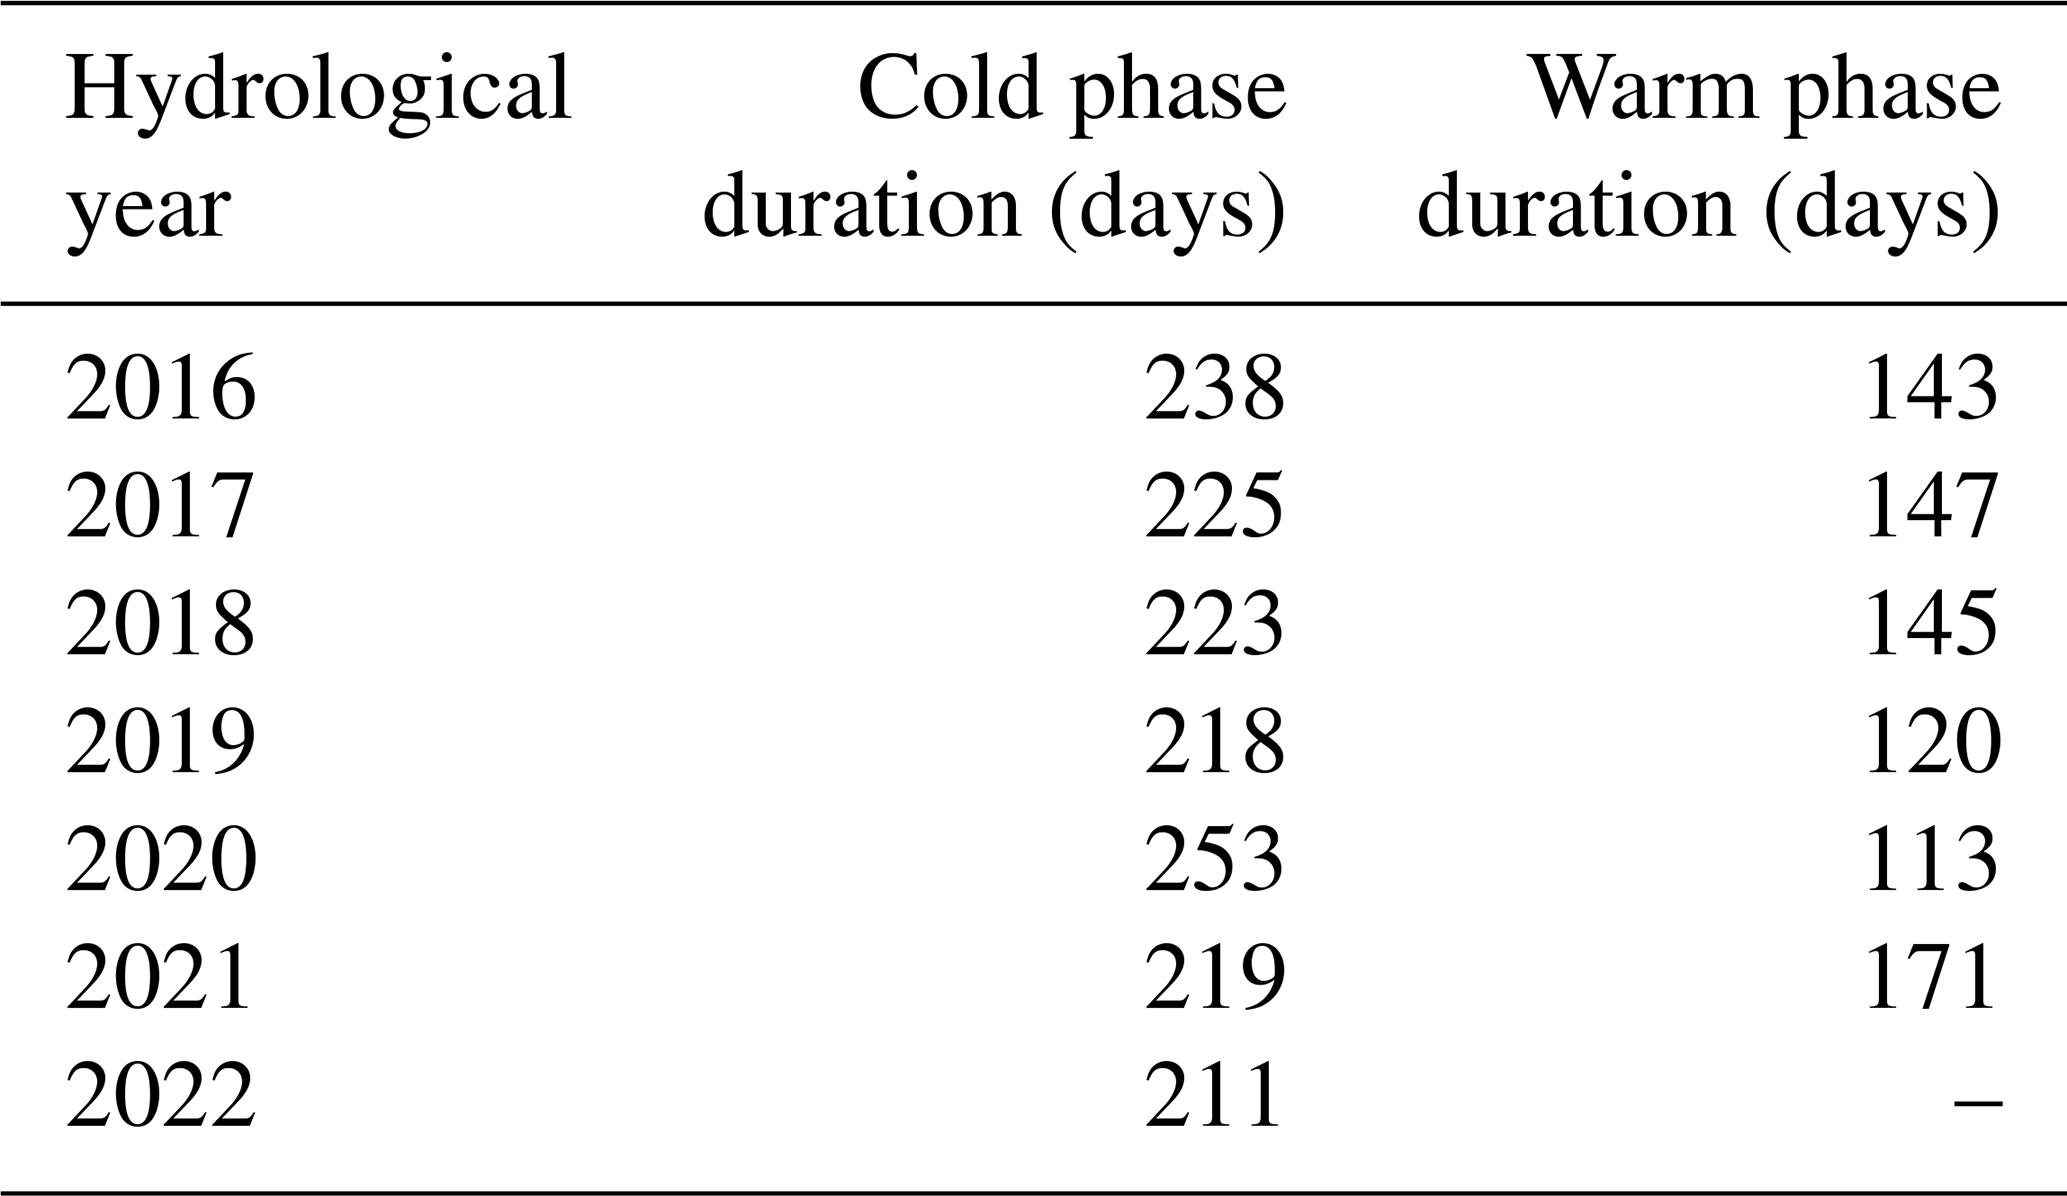
Table A2The spring and autumn ZC duration, start and end dates for each year based on the 2015 borehole temperatures.
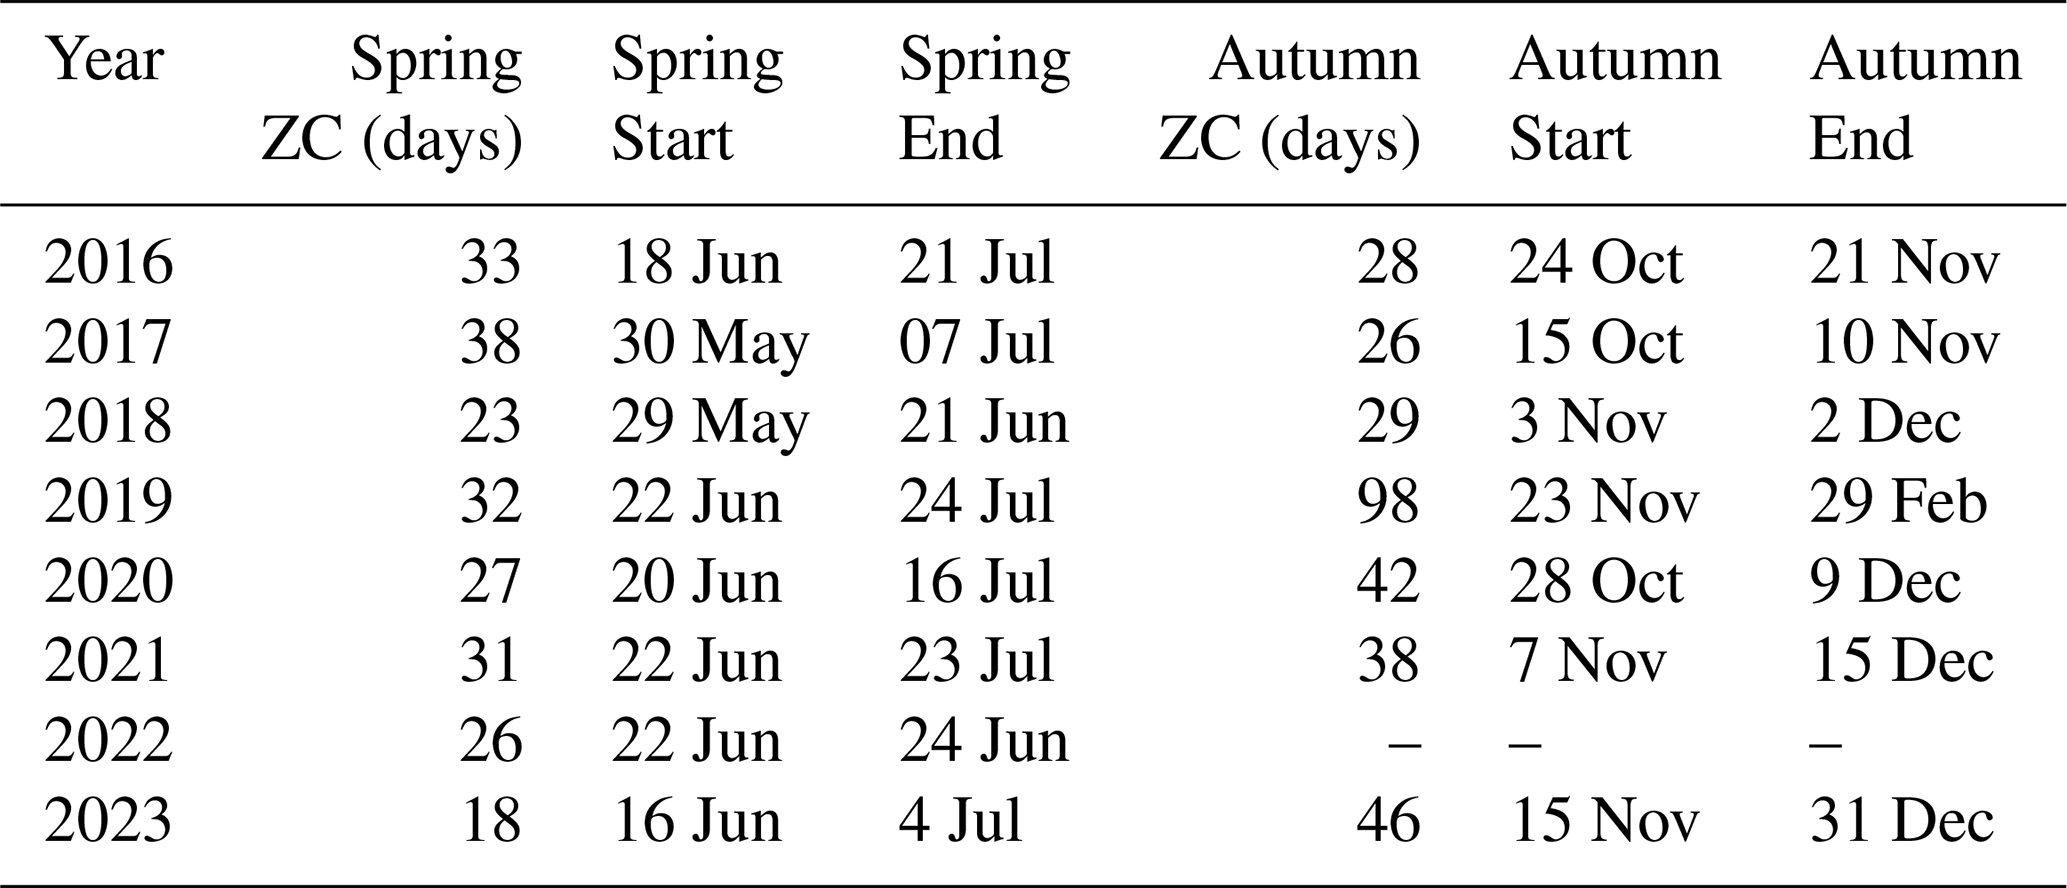
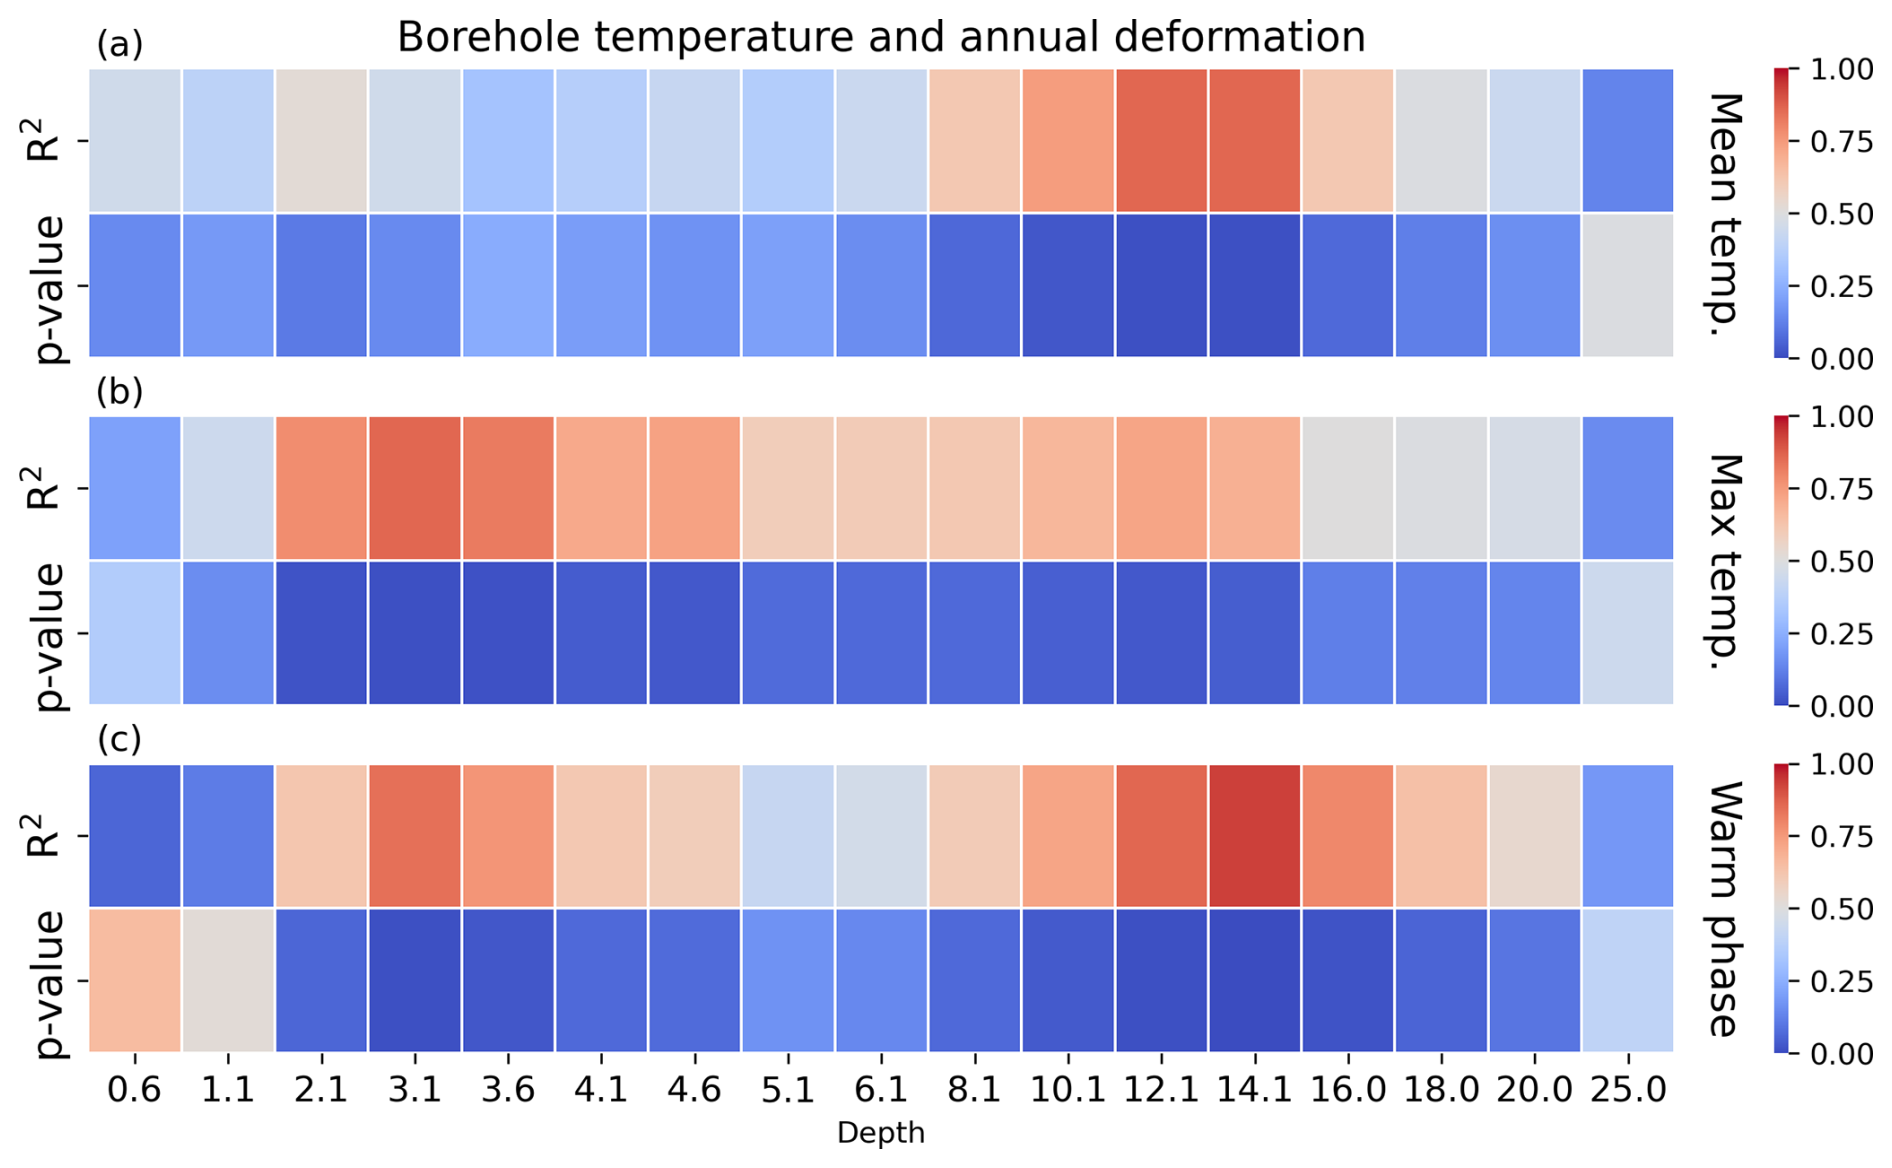
Figure B1Linear correlation matrix showing the R2 and p value of regressions between the mean (a), maximum (b) and warm phase (c) annual borehole temperature at various depths and the annual deformation at that depth.
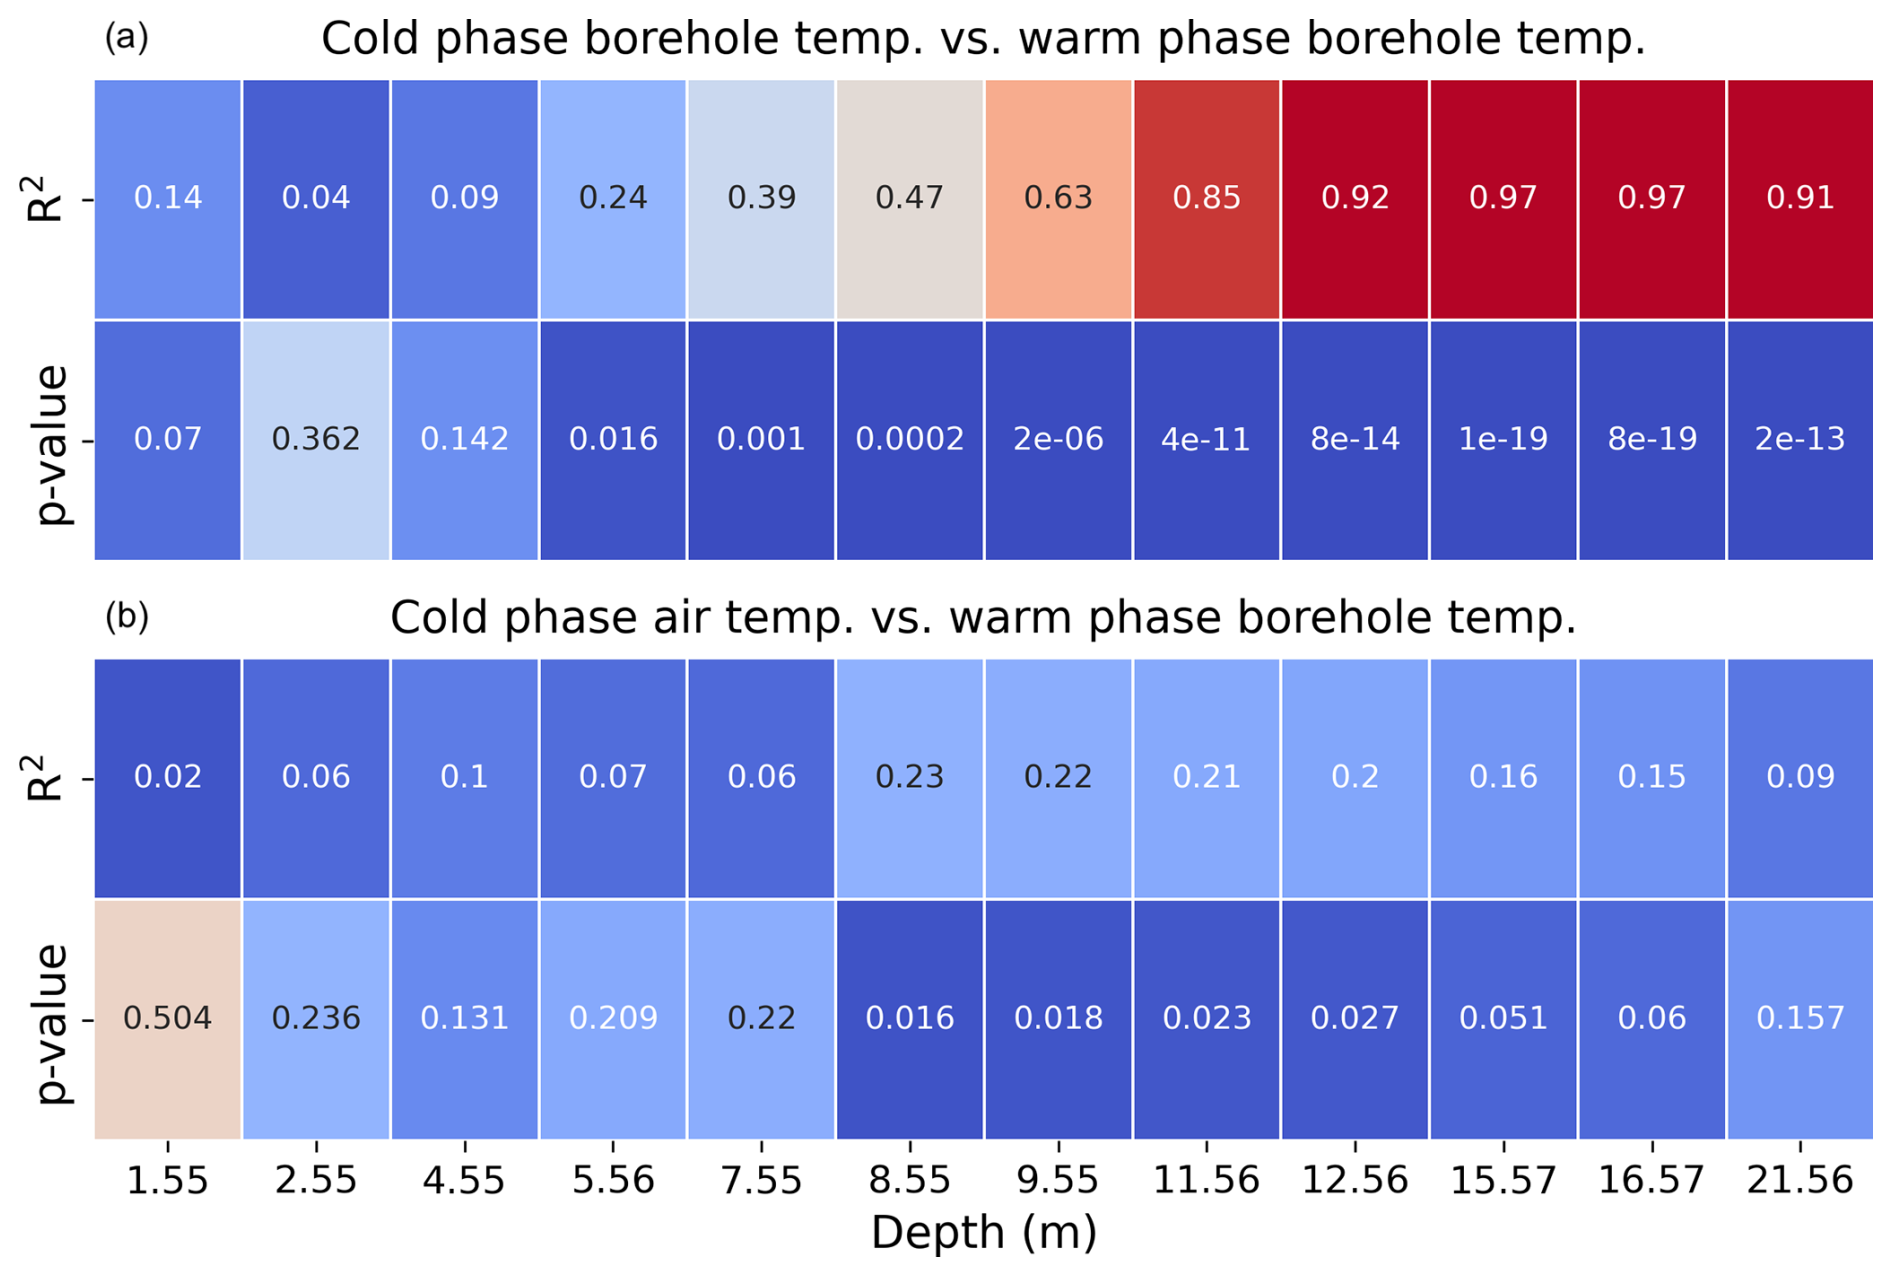
Figure B2Linear correlation matrix showing the R2 and p values of regressions between the mean cold phase borehole temperature and the mean warm phase borehole temperature at varying depths (a); and between the mean cold phase air temperature and the mean warm phase borehole temperature at varying depths (b) from 1998 to 2022.
Table B1Yearly data of spring ZC end dates based on the 2015 borehole temperatures, date of maximum GNSS surface displacement, and the time lag between the two.
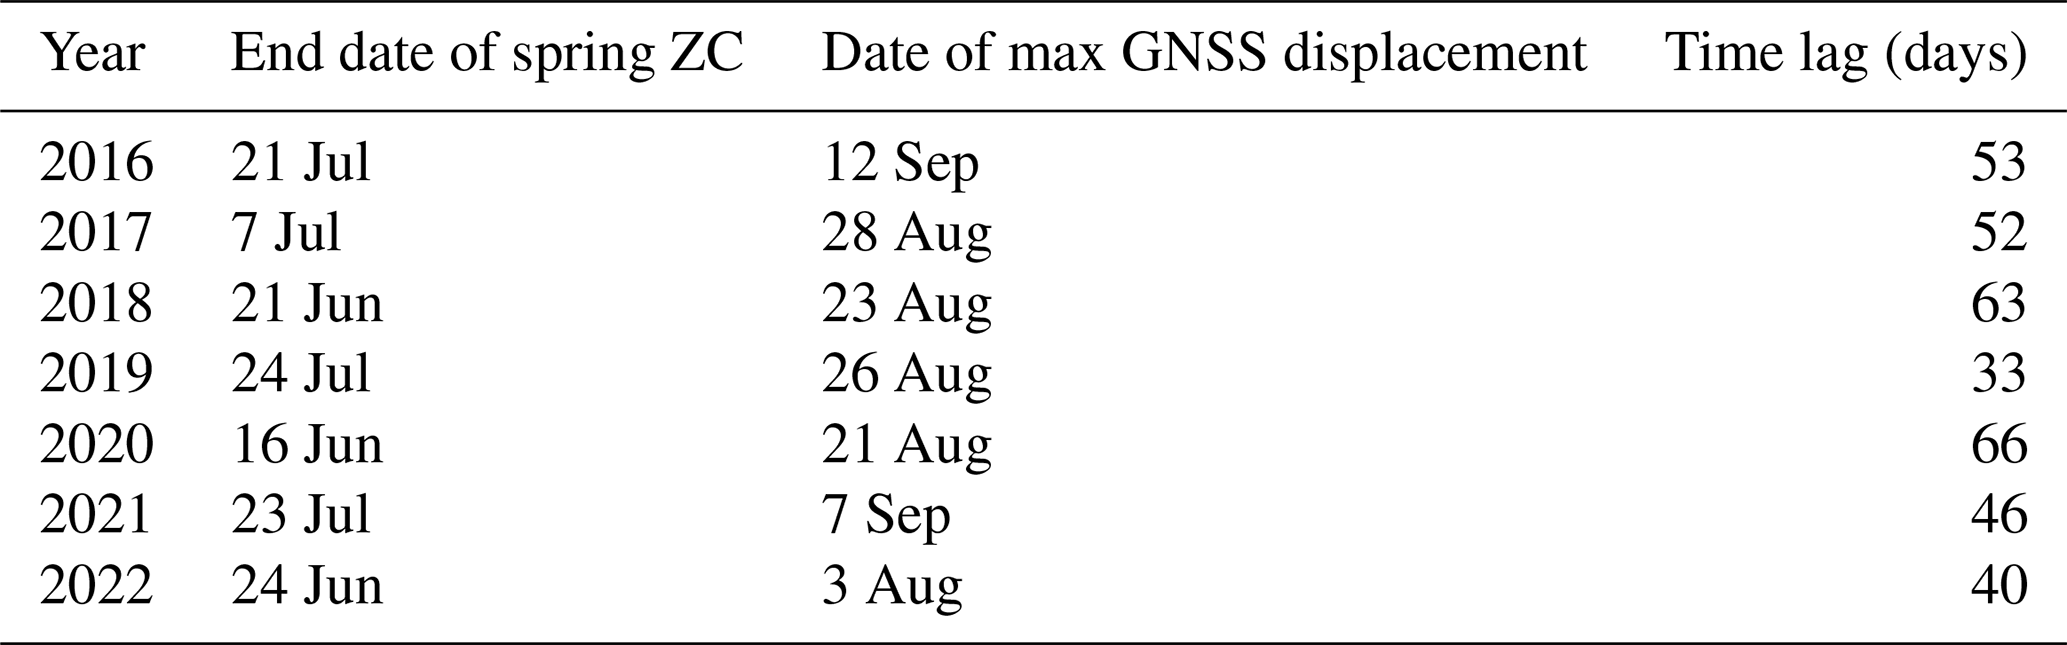
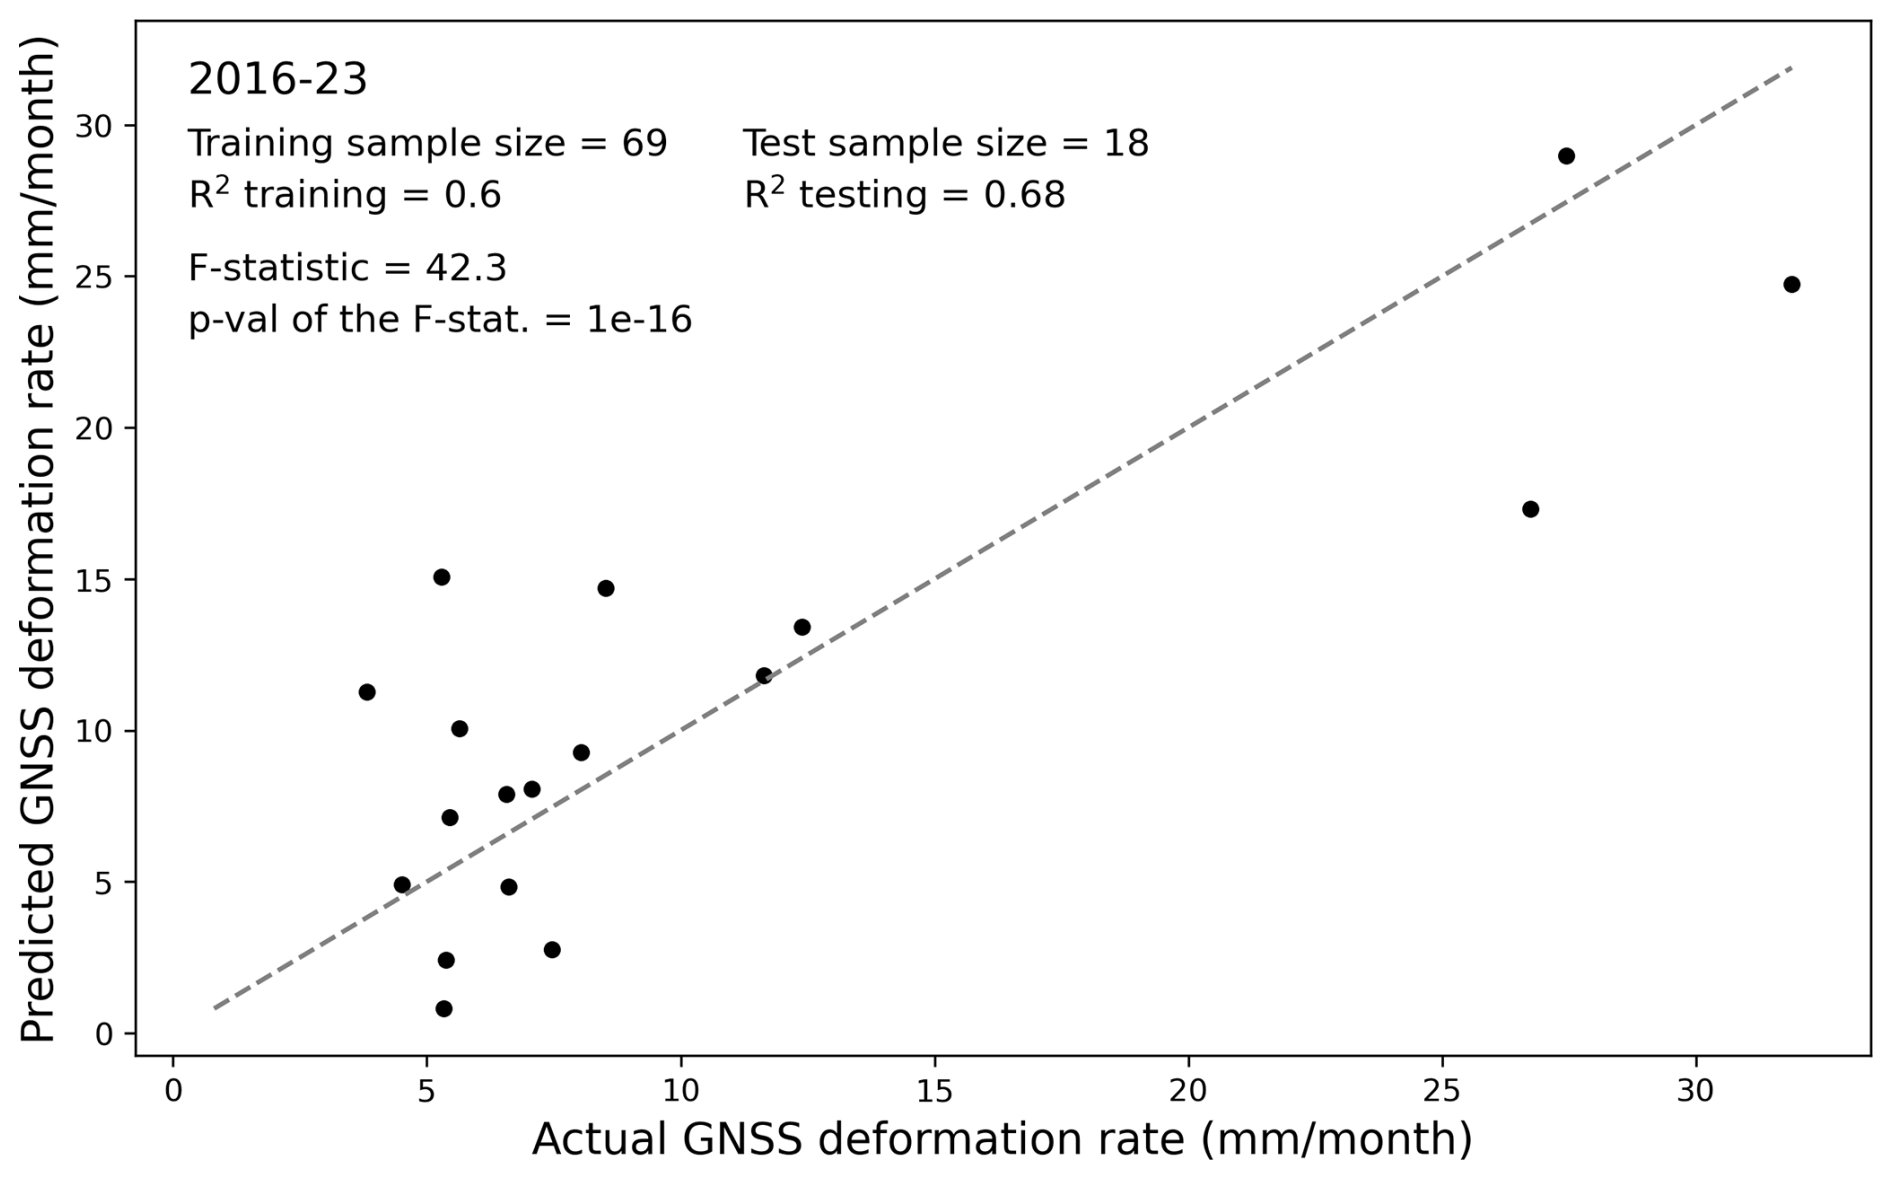
Figure B3MLR model results from the testing data subset using the monthly-averaged air and surface temperature, AL mean temperature, and QG at 3.5 m depth as drivers of the GNSS velocity. Grey dashed line is a 1:1 line for scale. Data source: PERMOS and PermaSense.
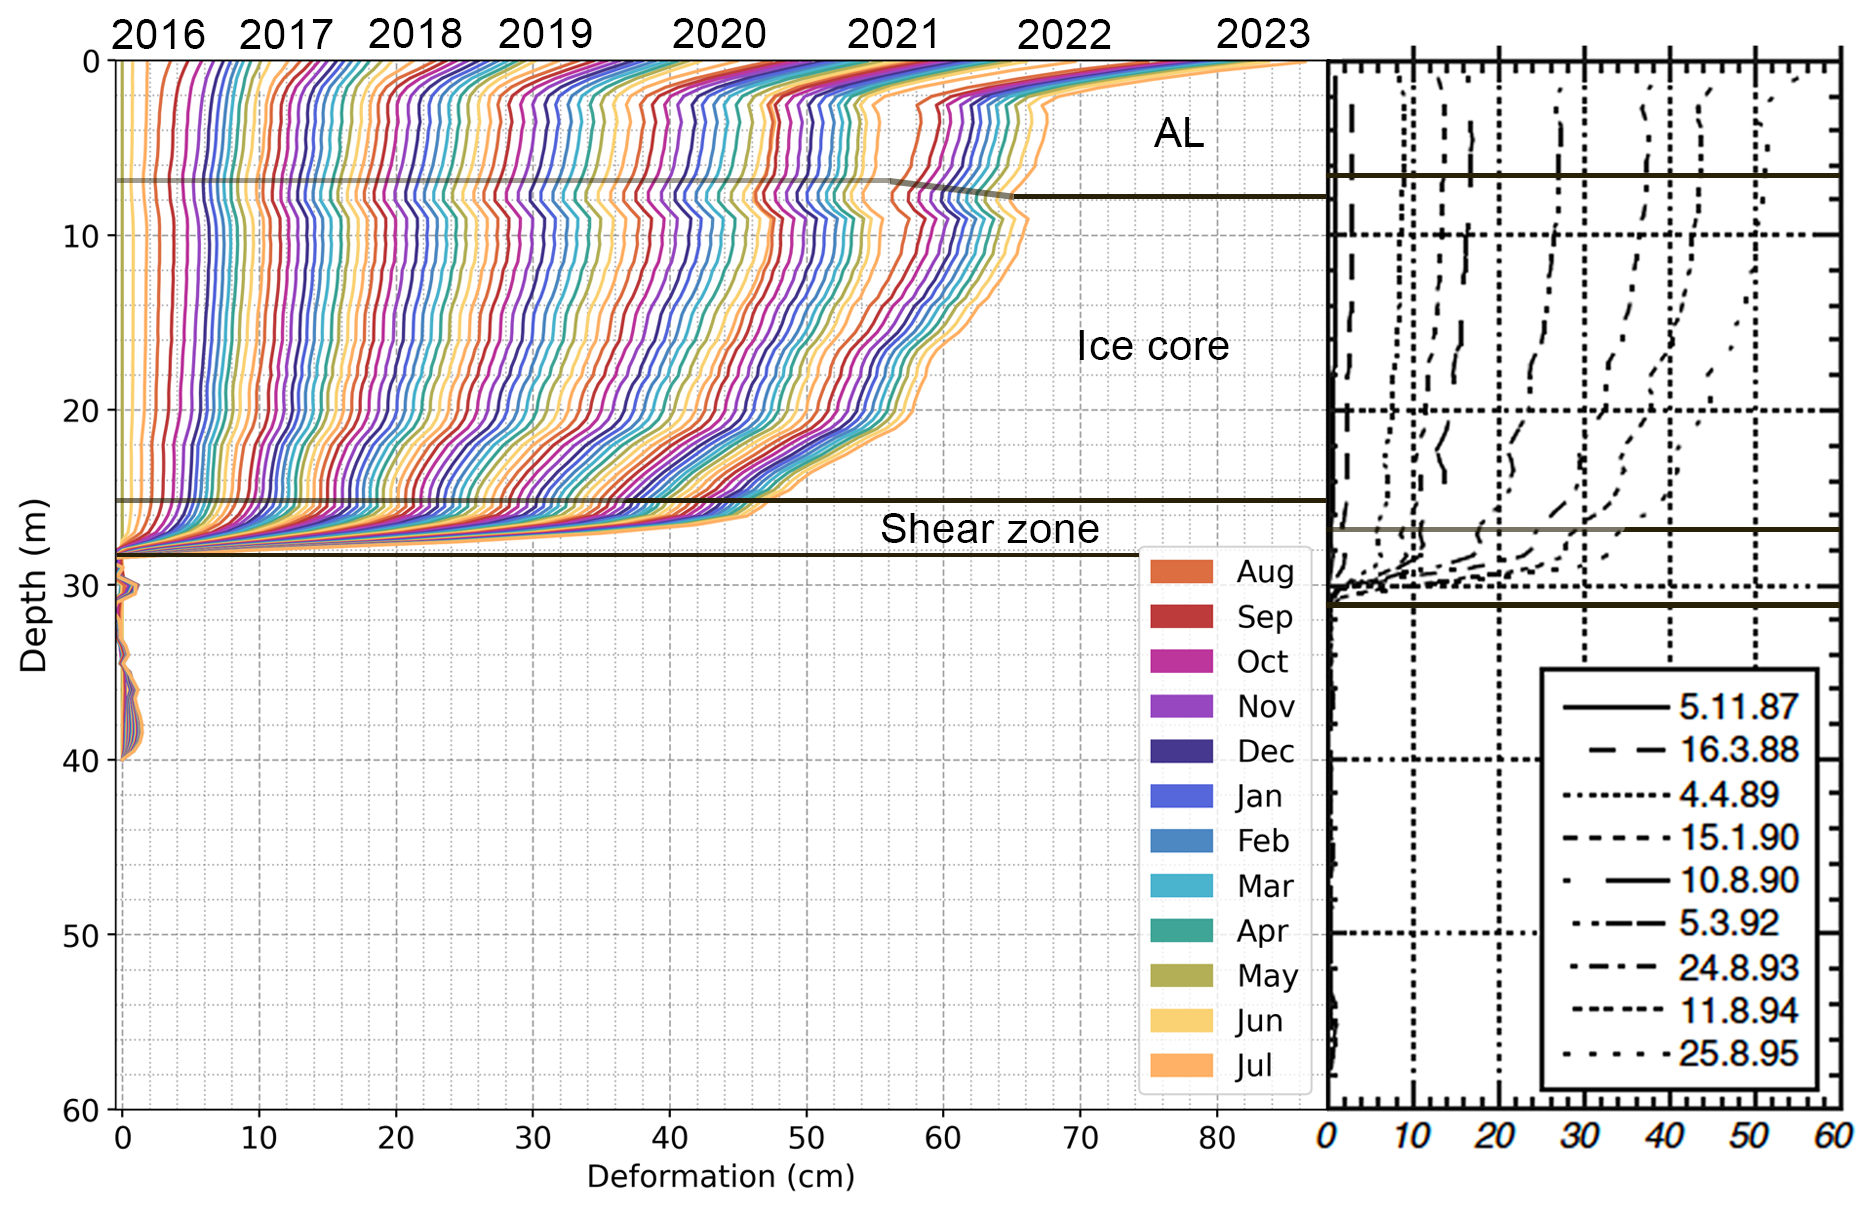
Figure C1Monthly cumulative deformation profiles from the inclinometer data in both the 1987 and the 2015 borehole at Murtèl rock glacier. Graph of old deformation profiles adapted from Arenson et al. (2002).
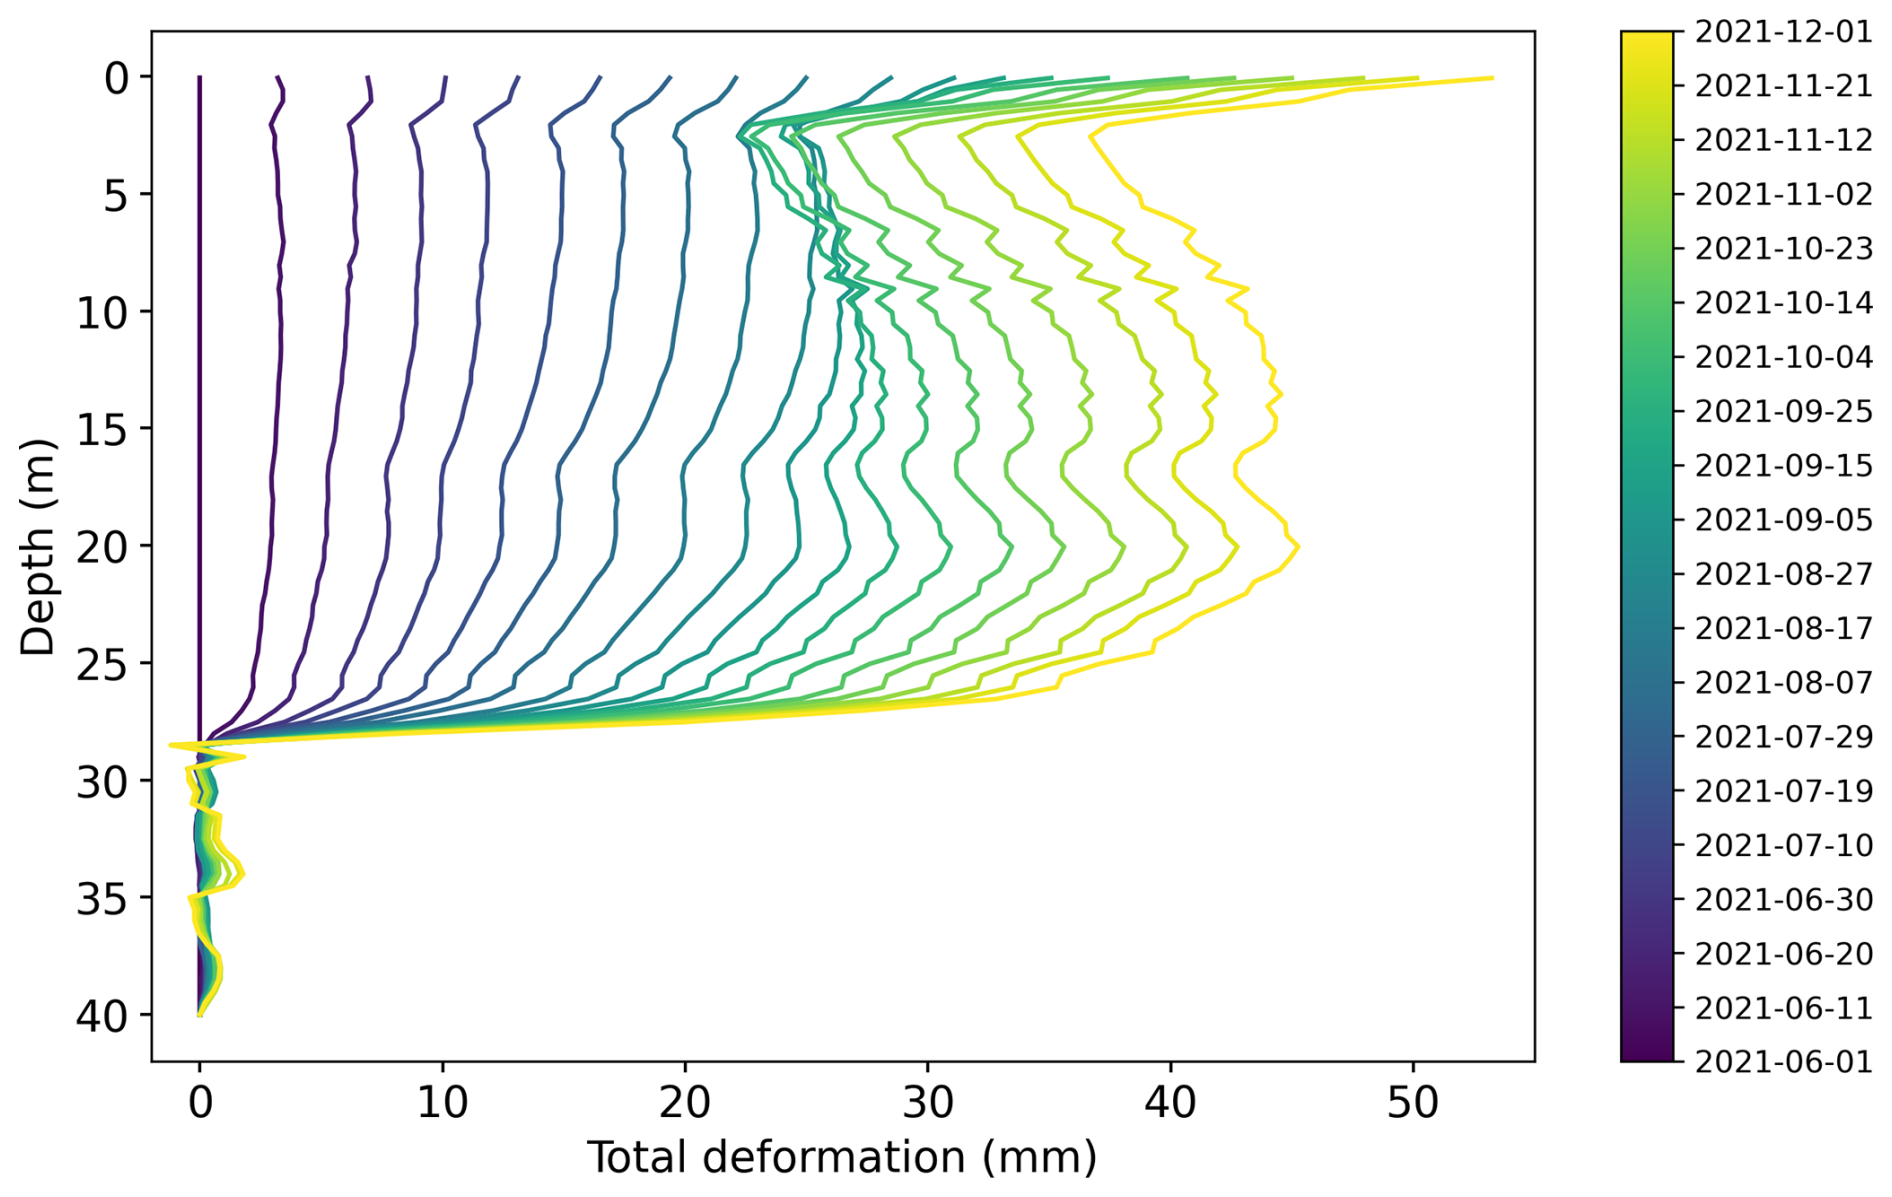
Figure C2Vertical deformation profile from June to December 2021 during the unique deceleration event measured by the SAA in Murtèl 2015 borehole.
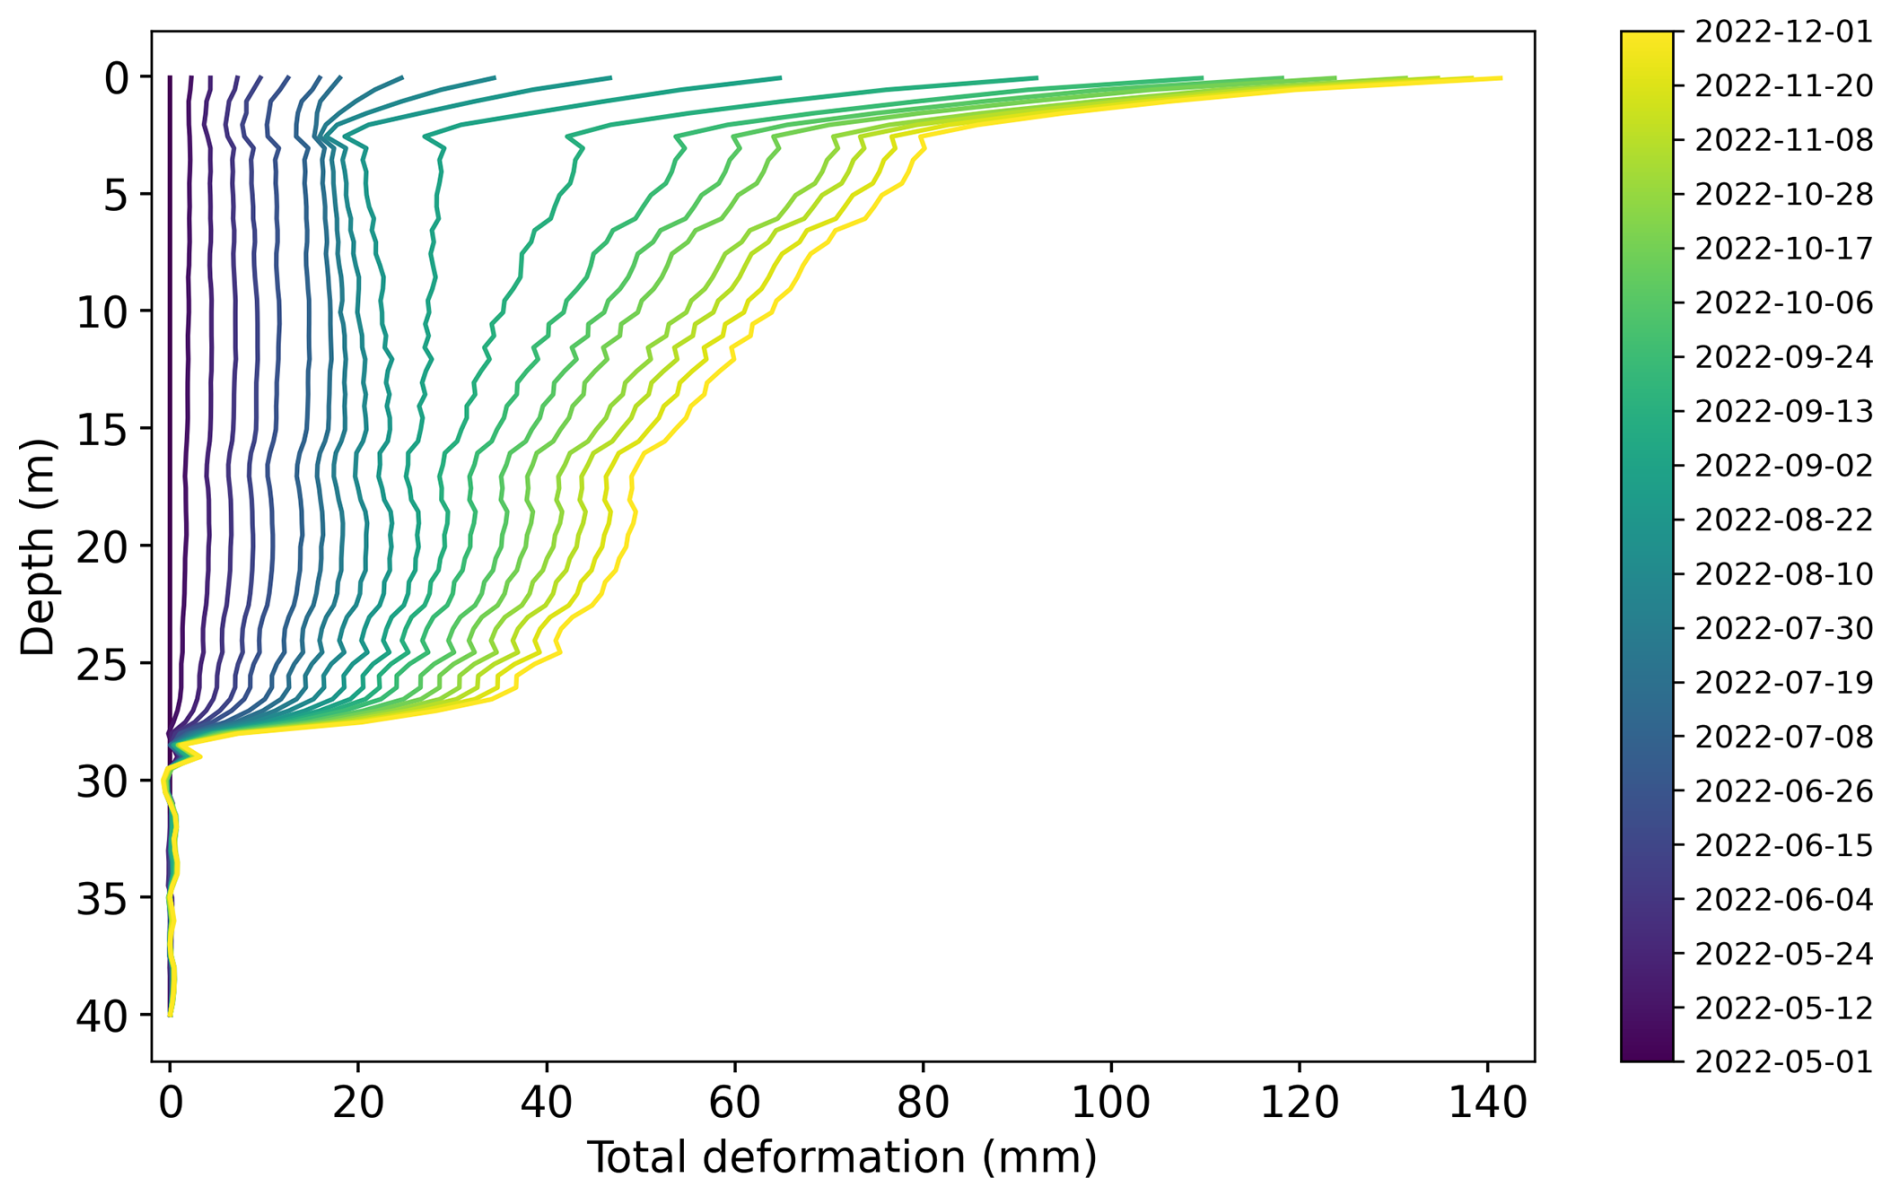
Figure C3Vertical deformation profile from May to December 2022 during the unique deceleration event measured by the SAA in Murtèl 2015 borehole.
Figure C4Top-down view of the horizontal direction of the borehole SAA movement where the x direction aligns with West and y direction with North.
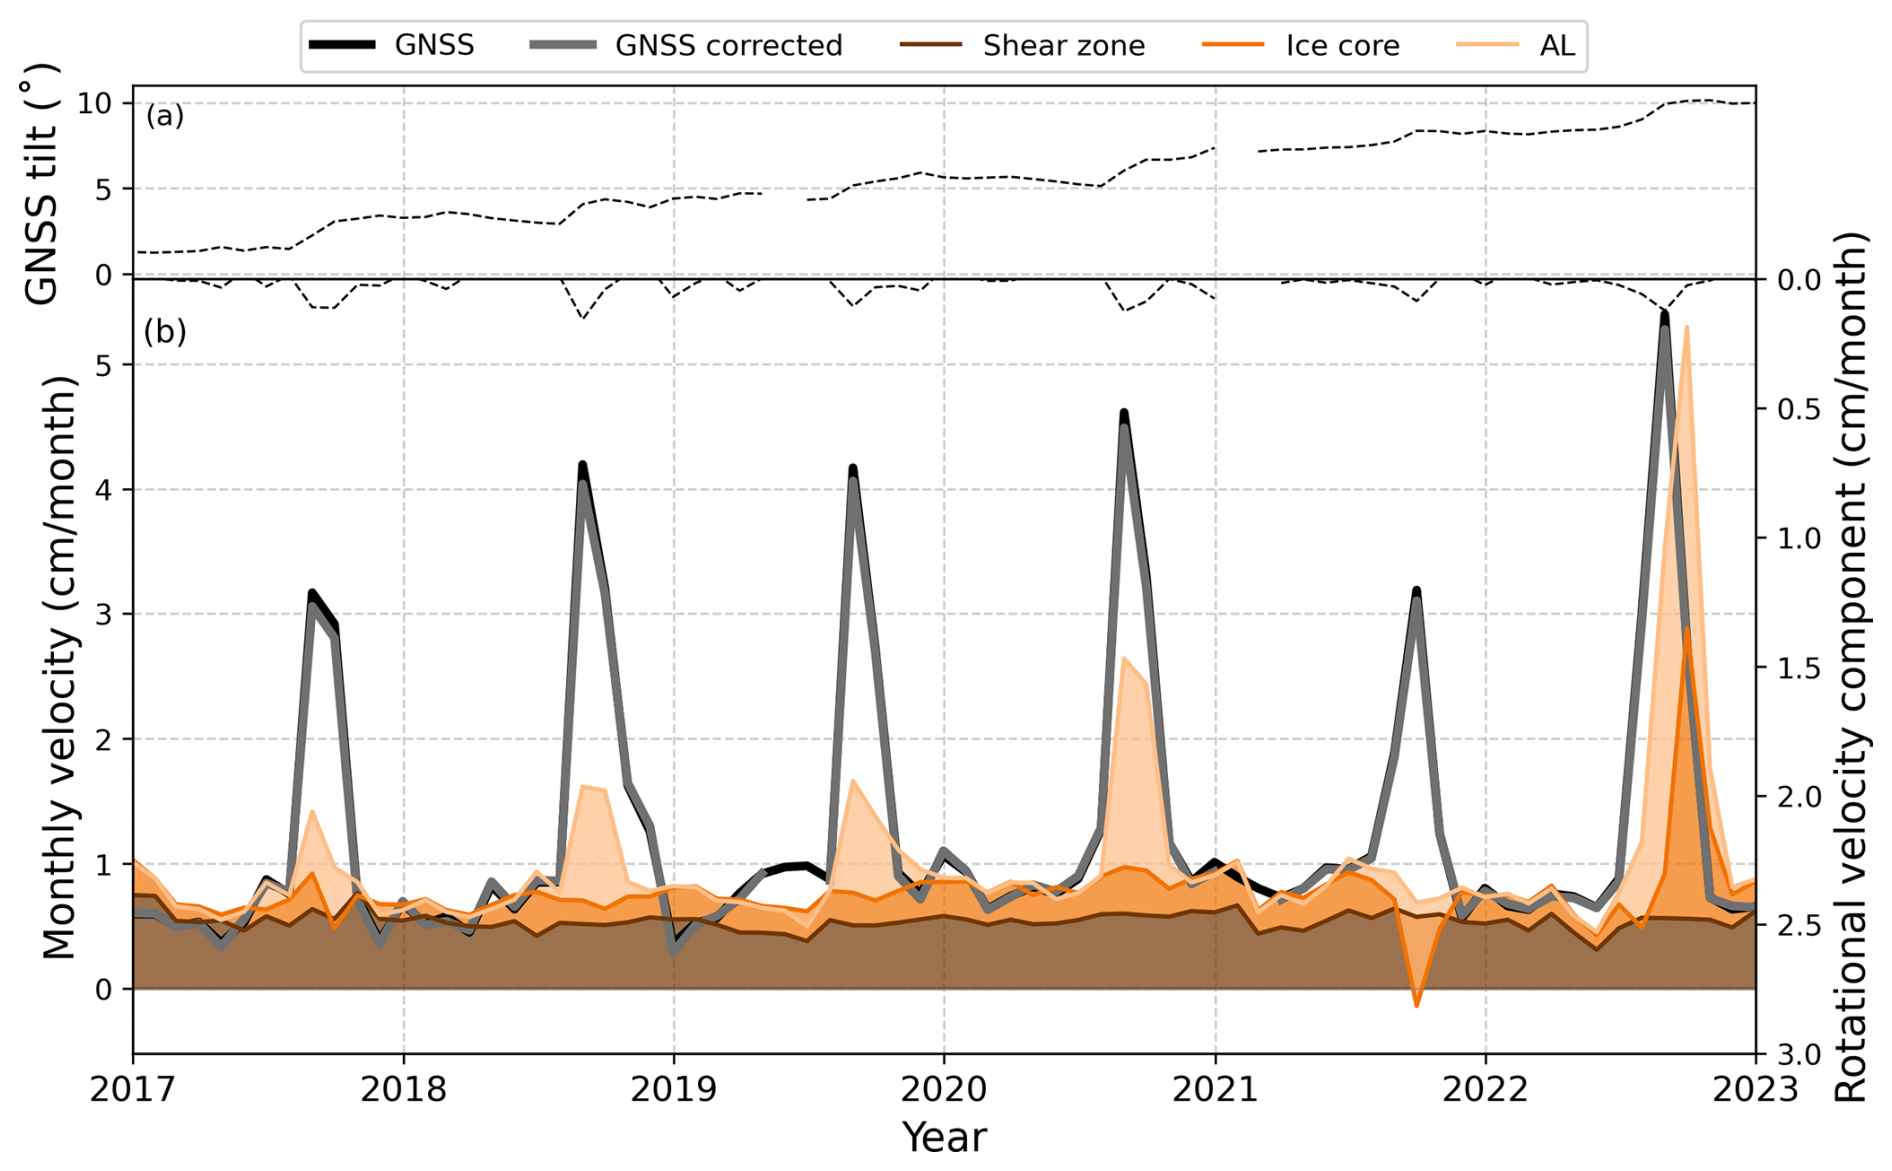
Figure C5Monthly GNSS tilt (a). Monthly deformation rate measured at the surface by the GNSS station and the borehole SAA with the different layers stacked on top of each other. On top the calculated rotational component of the velocity from the GNSS station is shown and used to correct the GNSS velocity (b). Data source: PERMOS and PermaSense.
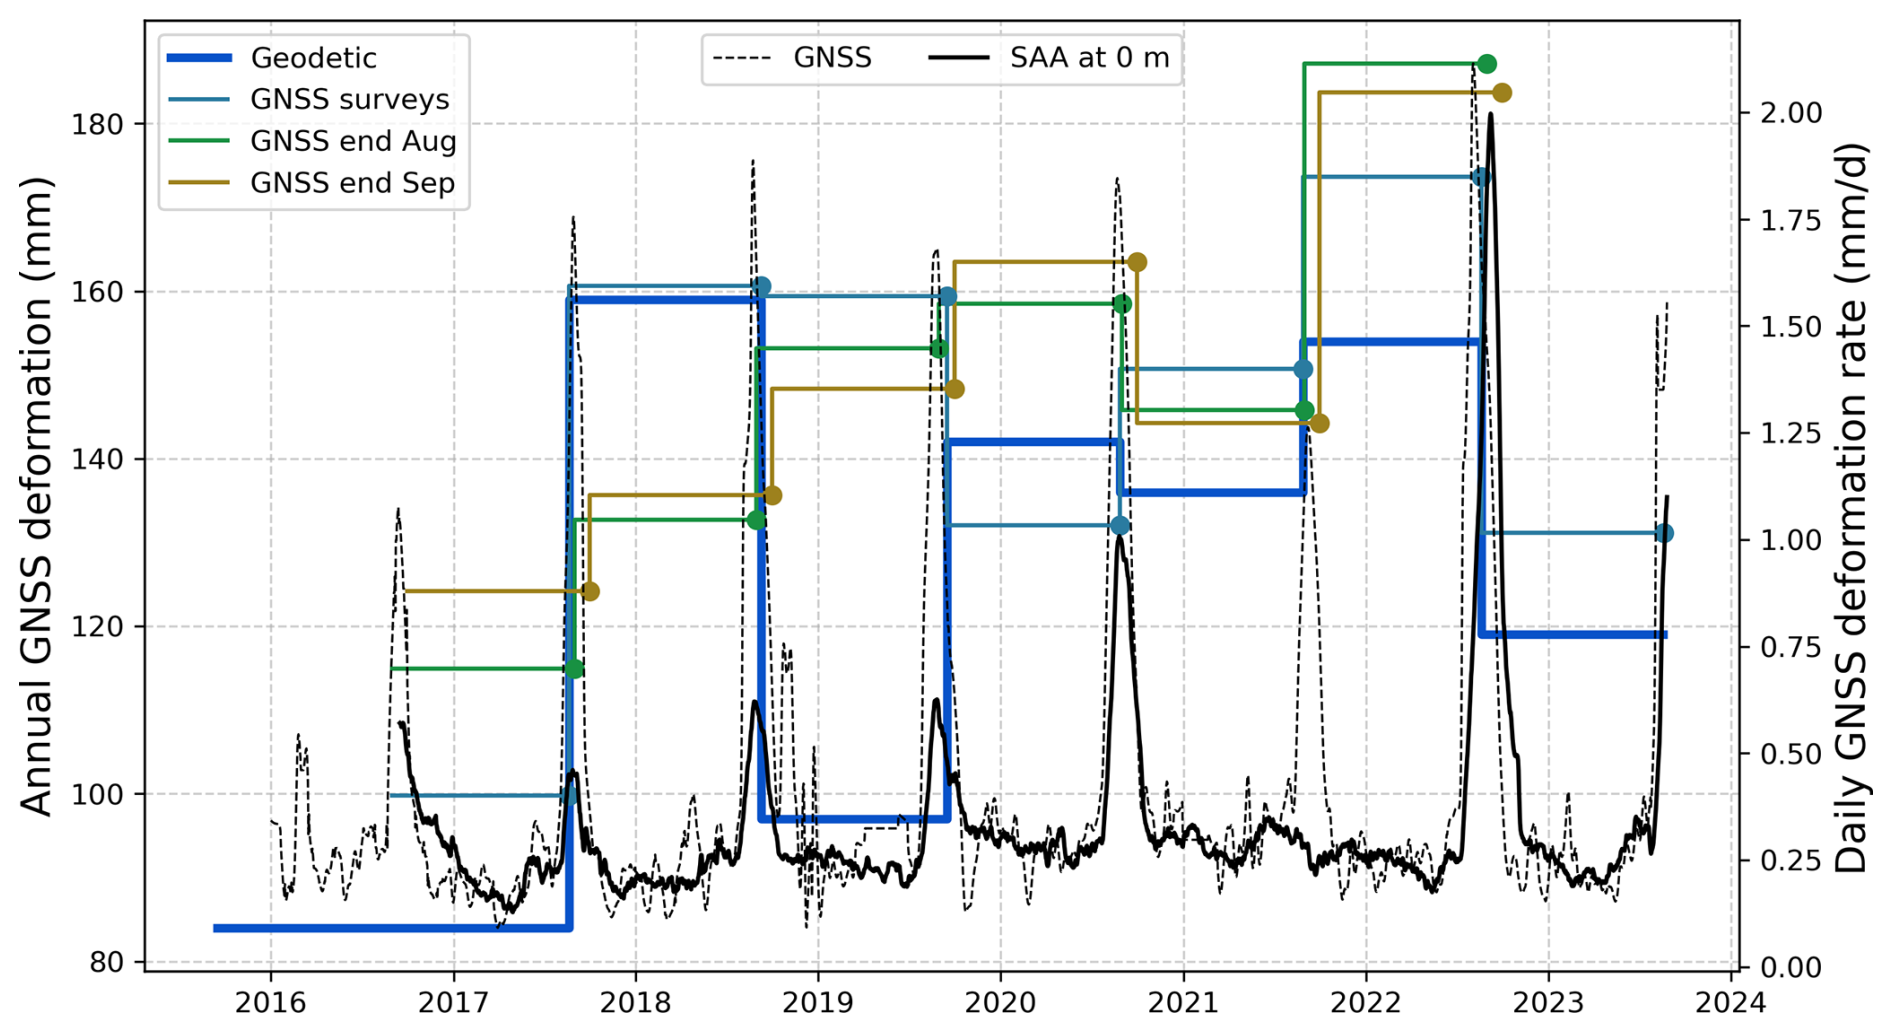
Figure C6Sensitivity analysis by shifting the annual intervals at which the GNSS values are defined in comparison with the timing of the seasonal peaks illustrated by the daily GNSS and SAA data.
The PERMOS borehole temperature and weather data is all available through their online data portal at https://www.permos.ch/data-portal (last access: 11 June 2026). The precipitation data used from the PERMA-XT station is available at https://www.permos.ch/doi/permos-spec-2023-1 (last access: 25 July 2025). The Piz Corvatsch weather station data is available upon request from MeteoSwiss. The borehole SAA data is made available on Zenodo (https://doi.org/10.5281/zenodo.15782682; Saibene, 2025). The code to process and visualize the data is available on GitHub which can be found in the Zenodo publication.
GS performed the data preparation and analysis for this study and wrote the manuscript. IGR, JB and AV provided supervision with the interpretation of the data and the editing of the manuscript. AV and IGR were responsible for the setup and maintenance of the borehole inclinometer and temperature monitoring. JB supplied the GNSS data and contributed to its comparison with other displacement data. IGR compiled the geodetic surveys and contributed to its comparison with other displacement data.
The contact author has declared that none of the authors has any competing interests.
Publisher's note: Copernicus Publications remains neutral with regard to jurisdictional claims made in the text, published maps, institutional affiliations, or any other geographical representation in this paper. The authors bear the ultimate responsibility for providing appropriate place names. Views expressed in the text are those of the authors and do not necessarily reflect the views of the publisher.
The findings presented in this paper are largely based on the data produced by the new 2015 borehole drilled in Murtèl rock glacier. The drilling and maintenance of the borehole would not have been possible without the investment by PERMOS and its funding bodies (in particular FOEN), SensAlpin, and especially Alexander Bast, who organized and supervised the drilling campaign. We also acknowledge Alessandro Cicoira, Tobias Bolch and Diego Wasser for their support in maintaining measurements and the initial data viewing and handling, and Dominik Amschwand for the installation of the PERMA-XT meteorological station. PERMOS also carried out the installation and operation of the on-site meteorological station at Murtèl rock glacier.
This paper was edited by Christian Hauck and reviewed by Robert Kenner and Lukas U. Arenson.
Amschwand, D., Scherler, M., Hoelzle, M., Krummenacher, B., Haberkorn, A., Kienholz, C., and Gubler, H.: Surface heat fluxes at coarse blocky Murtèl rock glacier (Engadine, eastern Swiss Alps), The Cryosphere, 18, 2103–2139, https://doi.org/10.5194/tc-18-2103-2024, 2024. a, b, c
Amschwand, D., Tschan, S., Scherler, M., Hoelzle, M., Krummenacher, B., Haberkorn, A., Kienholz, C., Aschwanden, L., and Gubler, H.: Seasonal ice storage changes and meltwater generation at Murtèl rock glacier (Engadine, eastern Swiss Alps): estimates from measurements and energy budgets in the coarse blocky active layer, Hydrol. Earth Syst. Sci., 29, 2219–2253, https://doi.org/10.5194/hess-29-2219-2025, 2025. a
Arenson, L., Hoelzle, M., and Springman, S.: Borehole deformation measurements and internal structure of some rock glaciers in Switzerland, Permafrost Periglac., 13, 117–135, https://doi.org/10.1002/ppp.414, 2002. a, b, c, d, e, f, g, h, i, j, k, l, m, n, o
Barsch, D. and Hell, G.: Photogrammetrische Bewegungsmessungen am Blockgletscher Murtèl I, Oberengadin, Schweizer Alpen, Zeitschrift für Gletscherkunde und Glazialgeologie, 11, 111–142, 1976. a
Bast, A., Kenner, R., and Phillips, M.: Short-term cooling, drying, and deceleration of an ice-rich rock glacier, The Cryosphere, 18, 3141–3158, https://doi.org/10.5194/tc-18-3141-2024, 2024. a, b, c, d, e, f, g
Benedict, J. B., Benedict, R. J., and Sanville, D.: Arapaho Rock Glacier, Front Range, Colorado, U.S.A.: A 25-Year Resurvey, Arct. Alp. Res., 18, 349–352, https://doi.org/10.1080/00040851.1986.12004096, 1986. a
Buchli, T., Merz, K., Zhou, X., Kinzelbach, W., and Springman, S. M.: Characterization and Monitoring of the Furggwanghorn Rock Glacier, Turtmann Valley, Switzerland: Results from 2010 to 2012, Vadose Zone J., 12, 1–15, https://doi.org/10.2136/vzj2012.0067, 2013. a, b
Buchli, T., Laue, J., and Springman, S. M.: Amendments to Interpretations of SAAF Inclinometer Data from the Furggwanghorn Rock Glacier, Turtmann Valley, Switzerland: Results from 2010 to 2012, Vadose Zone J., 15, 1–3, https://doi.org/10.2136/vzj2015.09.0132, 2016. a
Buchli, T., Kos, A., Limpach, P., Merz, K., Zhou, X., and Springman, S. M.: Kinematic investigations on the Furggwanghorn Rock Glacier, Switzerland, Permafrost Periglac., 29, 3–20, https://doi.org/10.1002/ppp.1968, 2018. a, b, c, d, e, f, g
Bucki, A. K. and Echelmeyer, K. A.: The flow of Fireweed rock glacier, Alaska, U.S.A., J. Glaciol., 50, 76–86, https://doi.org/10.3189/172756504781830213, 2004. a
Cicoira, A., Beutel, J., Faillettaz, J., Gärtner-Roer, I., and Vieli, A.: Resolving the influence of temperature forcing through heat conduction on rock glacier dynamics: a numerical modelling approach, The Cryosphere, 13, 927–942, https://doi.org/10.5194/tc-13-927-2019, 2019a. a
Cicoira, A., Beutel, J., Faillettaz, J., and Vieli, A.: Water controls the seasonal rhythm of rock glacier flow, Earth Planet. Sc. Lett., 528, 115844, https://doi.org/10.1016/j.epsl.2019.115844, 2019b. a, b, c, d
Cicoira, A., Marcer, M., Gärtner‐Roer, I., Bodin, X., Arenson, L. U., and Vieli, A.: A general theory of rock glacier creep based on in‐situ and remote sensing observations, Permafrost Periglac., 32, 139–153, https://doi.org/10.1002/ppp.2090, 2021. a, b, c
Cicoira, A., Weber, S., Biri, A., Buchli, B., Delaloye, R., Da Forno, R., Gärtner-Roer, I., Gruber, S., Gsell, T., Hasler, A., Lim, R., Limpach, P., Mayoraz, R., Meyer, M., Noetzli, J., Phillips, M., Pointner, E., Raetzo, H., Scapozza, C., Strozzi, T., Thiele, L., Vieli, A., Vonder Mühll, D., Wirz, V., and Beutel, J.: In situ observations of the Swiss periglacial environment using GNSS instruments, Earth Syst. Sci. Data, 14, 5061–5091, https://doi.org/10.5194/essd-14-5061-2022, 2022. a, b
Emmert, A. and Kneisel, C.: Internal structure of two alpine rock glaciers investigated by quasi-3-D electrical resistivity imaging, The Cryosphere, 11, 841–855, https://doi.org/10.5194/tc-11-841-2017, 2017. a
Fey, C. and Krainer, K.: Analyses of UAV and GNSS based flow velocity variations of the rock glacier Lazaun (Ötztal Alps, South Tyrol, Italy), Geomorphology, 365, 107261, https://doi.org/10.1016/j.geomorph.2020.107261, 2020. a
Gärtner-Roer, I. and Hoelzle, M.: Rockglaciers of the Engadine, in: Landscapes and Landforms of Switzerland, edited by: Reynard, E., pp. 235–248, Springer International Publishing, Cham, ISBN 978-3-030-43201-0 978-3-030-43203-4, https://doi.org/10.1007/978-3-030-43203-4_16, 2021. a
Haberkorn, A., Kenner, R., Noetzli, J., and Phillips, M.: Changes in Ground Temperature and Dynamics in Mountain Permafrost in the Swiss Alps, Front. Earth Sci., 9, 626686, https://doi.org/10.3389/feart.2021.626686, 2021. a
Haeberli, W.: Creep of Mountain Permafrost: Internal Structure and Flow of Alpine Rock Glaciers, Ph.D. thesis, ETH Zürich, Zürich, 1985. a, b
Haeberli, W., Huder, J., Keusen, H. R., Pika, J., and Röthlisberger, H.: Core drilling through rock glacier permafrost, https://www.researchgate.net/publication/245800726 (last access: 16 June 2026), 1988. a, b, c
Haeberli, W., Hoelzle, M., Kääb, A., Keller, F., Mühll, D. V., and Wagner, S.: Ten years after the drilling through the permafrost of the active rock glacier Murtel, eastern Swiss Alps : Answered questions and new perspectives, vol. 55, pp. 403–410, Collection Nordicana, Yellowknife, Canada, https://api.semanticscholar.org/CorpusID:51799942 (last access: 1 June 2024), 1998. a
Haeberli, W., Hallet, B., Arenson, L., Elconin, R., Humlum, O., Kääb, A., Kaufmann, V., Ladanyi, B., Matsuoka, N., Springman, S., and Mühll, D. V.: Permafrost creep and rock glacier dynamics, Permafrost Periglac., 17, 189–214, https://doi.org/10.1002/ppp.561, 2006. a
Hoelzle, M., Wegmann, M., and Krummenacher, B.: Miniature Temperature Dataloggers for mapping and monitoring of permafrost in high mountain areas: First experience from the Swiss Alps, Permafrost Periglac., 10, 113–124, https://doi.org/10.1002/(SICI)1099-1530(199904/06)10:2<113::AID-PPP317>3.0.CO;2-A, 1999. a, b
Hoelzle, M., Mühll, D. V., and Haeberli, W.: Thirty years of permafrost research in the Corvatsch‐Furtschellas area, Eastern Swiss Alps: A review, Norsk Geografisk Tidsskrift – Norwegian Journal of Geography, 56, 137–145, https://doi.org/10.1080/002919502760056468, 2002. a
Hu, Y., Arenson, L. U., Barboux, C., Bodin, X., Cicoira, A., Delaloye, R., Gärtner‐Roer, I., Kääb, A., Kellerer‐Pirklbauer, A., Lambiel, C., Liu, L., Pellet, C., Rouyet, L., Schoeneich, P., Seier, G., and Strozzi, T.: Rock Glacier Velocity: An Essential Climate Variable Quantity for Permafrost, Rev. Geophys., 63, e2024RG000847, https://doi.org/10.1029/2024RG000847, 2025. a, b
Ikeda, A., Matsuoka, N., and Kääb, A.: Fast deformation of perennially frozen debris in a warm rock glacier in the Swiss Alps: An effect of liquid water, J. Geophys. Res.-Earth Surf., 113, 2007JF000859, https://doi.org/10.1029/2007JF000859, 2008. a, b, c, d
Kääb, A., Frauenfelder, R., and Roer, I.: On the response of rockglacier creep to surface temperature increase, Glob. Planet. Change, 56, 172–187, https://doi.org/10.1016/j.gloplacha.2006.07.005, 2007. a, b
Keller, F.: Interaktionen zwischen Schnee und Permalrost: eine Grundlagenstudie im Oberengadin., Tech. Rep. 127, Versuchsanstalt für Wasserbau, Hydrologie und Glaziologie, ETH Zürich, 1994. a
Kellerer-Pirklbauer, A., Bodin, X., Delaloye, R., Lambiel, C., Gärtner-Roer, I., Bonnefoy-Demongeot, M., Carturan, L., Damm, B., Eulenstein, J., Fischer, A., Hartl, L., Ikeda, A., Kaufmann, V., Krainer, K., Matsuoka, N., Morra Di Cella, U., Noetzli, J., Seppi, R., Scapozza, C., Schoeneich, P., Stocker-Waldhuber, M., Thibert, E., and Zumiani, M.: Acceleration and interannual variability of creep rates in mountain permafrost landforms (rock glacier velocities) in the European Alps in 1995–2022, Environ. Res. Lett., 19, 034022, https://doi.org/10.1088/1748-9326/ad25a4, 2024. a, b, c, d, e
Kellerer-Pirklbauer, A., Bodin, X., Delaloye, R., Lambiel, C., Gärtner-Roer, I., Damm, B., Ikeda, A., Kaufmann, V., Krainer, K., Seppi, R., Scapozza, C., Stocker-Waldhuber, M., and Thibert, E.: Rock glacier velocity monitored by annual in-situ geodetic surveys: Long-term challenges, solutions and suggestions, Geomorphology, 495, 110117, https://doi.org/10.1016/j.geomorph.2025.110117, 2026. a
Kenner, R., Phillips, M., Beutel, J., Hiller, M., Limpach, P., Pointner, E., and Volken, M.: Factors Controlling Velocity Variations at Short‐Term, Seasonal and Multiyear Time Scales, Ritigraben Rock Glacier, Western Swiss Alps, Permafrost Periglac., 28, 675–684, https://doi.org/10.1002/ppp.1953, 2017. a, b, c, d
Kenner, R., Pruessner, L., Beutel, J., Limpach, P., and Phillips, M.: How rock glacier hydrology, deformation velocities and ground temperatures interact: Examples from the Swiss Alps, Permafrost Periglac., 31, 3–14, https://doi.org/10.1002/ppp.2023, 2020. a, b, c, d, e, f, g, h
Krainer, K. and Mostler, W.: Hydrology of Active Rock Glaciers: Examples from the Austrian Alps, Arct. Antarct. Alp. Res., 34, 142–149, https://doi.org/10.1080/15230430.2002.12003478, 2002. a
Ladanyi, B.: Rheology of ice/rock systems and interfaces, Permafrost, 1–2, 621–626, https://www.arlis.org/docs/vol1/ICOP/55700698/Pdf/Chapter_110.pdf (last access: 29 April 2025), 2003. a
Lambiel, C. and Delaloye, R.: Contribution of real‐time kinematic GPS in the study of creeping mountain permafrost: examples from the Western Swiss Alps, Permafrost Periglac., 15, 229–241, https://doi.org/10.1002/ppp.496, 2004. a
Lugon, R. and Stoffel, M.: Rock-glacier dynamics and magnitude–frequency relations of debris flows in a high-elevation watershed: Ritigraben, Swiss Alps, Glob. Planet. Change, 73, 202–210, https://doi.org/10.1016/j.gloplacha.2010.06.004, 2010. a
Mittaz, C., Hoelzle, M., and Haeberli, W.: First results and interpretation of energy-flux measurements over Alpine permafrost, Ann. Glaciol., 31, 275–280, https://doi.org/10.3189/172756400781820363, 2000. a
Moore, P. L.: Deformation of debris-ice mixtures: Deformation of debris ice mixtures, Rev. Geophys., 52, 435–467, https://doi.org/10.1002/2014RG000453, 2014. a, b, c
Noetzli, J., Arenson, L. U., Bast, A., Beutel, J., Delaloye, R., Farinotti, D., Gruber, S., Gubler, H., Haeberli, W., Hasler, A., Hauck, C., Hiller, M., Hoelzle, M., Lambiel, C., Pellet, C., Springman, S. M., Vonder Muehll, D., and Phillips, M.: Best Practice for Measuring Permafrost Temperature in Boreholes Based on the Experience in the Swiss Alps, Front. Earth Sci., 9, 607875, https://doi.org/10.3389/feart.2021.607875, 2021. a
Noetzli, J., Isaksen, K., Barnett, J., Christiansen, H. H., Delaloye, R., Etzelmüller, B., Farinotti, D., Gallemann, T., Guglielmin, M., Hauck, C., Hilbich, C., Hoelzle, M., Lambiel, C., Magnin, F., Oliva, M., Paro, L., Pogliotti, P., Riedl, C., Schoeneich, P., Valt, M., Vieli, A., and Phillips, M.: Enhanced warming of European mountain permafrost in the early 21st century, Nat. Commun., 15, 10508, https://doi.org/10.1038/s41467-024-54831-9, 2024. a
Nye, J. F.: The Mechanics of Glacier Flow, J. Glaciol., 2, 82–93, https://doi.org/10.3189/S0022143000033967, 1952. a
PERMOS: Swiss Permafrost Bulletin 2023, Tech. Rep. 5, Swiss Permafrost Monitoring Network PERMOS, 2024. a, b, c, d
RGIK: Rock Glacier Velocity as an associated parameter of ECV Permafrost: Baseline concepts (Version 3.2), https://bigweb.unifr.ch/Science/Geosciences/Geomorphology/Pub/Website/IPA/CurrentVersion/Current_RockGlacierVelocity.pdf (last access: 16 June 2026), 2023. a
Roer, I.: Rockglacier Kinematics in a High Mountain Geosystem, Ph.D. thesis, Universität Bonn, https://hdl.handle.net/20.500.11811/10497 (last access: 24 June 2025), 2007. a, b
Roer, I., Kääb, A., and Dikau, R.: Rockglacier acceleration in the Turtmann valley (Swiss Alps): Probable controls, Norsk Geografisk Tidsskrift – Norwegian Journal of Geography, 59, 157–163, https://doi.org/10.1080/00291950510020655, 2005. a
Saibene, G.: Borehole deformation data 2016–2023 from Murtèl rock glacier (Engadine, Switzerland), Zenodo [data set], https://doi.org/10.5281/zenodo.15782682, 2025. a
Scherler, M., Schneider, S., Hoelzle, M., and Hauck, C.: A two-sided approach to estimate heat transfer processes within the active layer of the Murtèl–Corvatsch rock glacier, Earth Surf. Dynam., 2, 141–154, https://doi.org/10.5194/esurf-2-141-2014, 2014. a, b
Schneider, S., Hoelzle, M., and Hauck, C.: Influence of surface and subsurface heterogeneity on observed borehole temperatures at a mountain permafrost site in the Upper Engadine, Swiss Alps, The Cryosphere, 6, 517–531, https://doi.org/10.5194/tc-6-517-2012, 2012. a
SwissTopo: https://www.swisstopo.admin.ch/de (last access: 26 May 2026), 2025. a
Vonder Mühll, D. and Haeberli, W.: Thermal Characteristics of the Permafrost within an Active Rock Glacier (Murtèl/Corvatsch, Grisons, Swiss Alps), J. Glaciol., 36, 151–158, https://doi.org/10.3189/S0022143000009382, 1990. a, b, c
Vonder Mühll, D., Stucki, T., and Haeberli, W.: Borehole temperatures in alpine permafrost: a ten year series, 55, 1089–1095, Collection Nordicana, Yellowknife, Canada, https://www.arlis.org/docs/vol1/ICOP/40770716/CD-ROM/Proceedings/PDF001189/164016.pdf (last access: 16 January 2025), 1998. a, b
Wahrhaftig, C. and Cox, A.: Rock glaciers in the Alaska range, Geol. Soc. Am. Bull., 70, 383, https://doi.org/10.1130/0016-7606(1959)70[383:RGITAR]2.0.CO;2, 1959. a
Wirz, V., Gruber, S., Purves, R. S., Beutel, J., Gärtner-Roer, I., Gubler, S., and Vieli, A.: Short-term velocity variations at three rock glaciers and their relationship with meteorological conditions, Earth Surf. Dynam., 4, 103–123, https://doi.org/10.5194/esurf-4-103-2016, 2016. a, b, c
- Abstract
- Introduction
- Methods
- Results
- Discussion
- Conclusions
- Appendix A: Phases and zero curtains
- Appendix B: Controls on deformation
- Appendix C: Deformation profiles, time series and unique events
- Data availability
- Author contributions
- Competing interests
- Disclaimer
- Acknowledgements
- Review statement
- References