the Creative Commons Attribution 4.0 License.
the Creative Commons Attribution 4.0 License.
 | 16 Jun 2026
Brief communication: Hypergravity testing of thawing rates in frozen sand
Michael H. Gardner
Simeon Buttery
Soo-Min Ham
Hamad Khan
Daniel W. Wilson
Jason T. DeJong
The active layer above permafrost experiencing seasonal freeze-thaw can range from a few centimeters to tens of meters in thickness, which complicates physical modeling of this phenomenon. This study shows capabilities developed to investigate freeze-thaw in a hypergravity environment that will enable system-level experiments which tie model predictions of permafrost behavior to field observations of permafrost temperature cycling. By leveraging scaling in a hypergravity setting, this research will allow for permafrost layers to be generated on a prototype scale that capture the full thickness of the active layer on the order of tens of meters. We present preliminary results showing requirements and techniques for sample preparation, insulation, and feasible experiment run times in a 1 m radius centrifuge.
- Article
(2200 KB) - Full-text XML
- BibTeX
- EndNote


Permafrost – earth materials (soil or rock and included moisture, gases and organic material) that remain at or below 0 °C for at least two consecutive years (Lewkowicz et al., 2025) – plays an important role in the global carbon cycle, natural hazards, and infrastructure performance (Portner et al., 2019). The thickness of the active layer overlying permafrost, which thaws and freezes seasonally, is most affected by air temperatures and precipitation (Murton, 2021). As the global climate changes, associated increases in air temperature and changing precipitation characteristics are likely to induce increased thickness and temperature variability in the active layer. This has substantial implications in terms of infrastructure performance (Hjort et al., 2022) and ground stability (Niu et al., 2016), as well as global carbon release (Schuur et al., 2015), forced migration (Ramage et al., 2021), and release of potential pathogens during thawing (Wu et al., 2022).
Thus, understanding how air temperature and precipitation changes influence both the rate and depth at which permafrost may thaw is important for estimating climate change impacts. The active layer typically ranges from a few centimeters to several meters, but can be more than 10 m thick (Murton, 2021), which complicates physical modeling of this phenomenon since laboratory tests only provide element-level measurements of the freezing, thawing, and refreezing processes and it often is not possible to create experiments at field scale. Many field studies have investigated warming-induced impacts on permafrost (for example, Henry and Molau, 1997; Salmon et al., 2016; Hicks Pries et al., 2017; Hanson et al., 2017; Nottingham et al., 2020; Qin et al., 2023; Bai et al., 2023) with tested depths ranging from 5 cm up to 2 m, and planform dimensions up to several meters. Recent work by Wagner et al. (2018) included field experiments at the decameter scale where an approximately m soil volume was tested over a period of 63 d. These field tests demonstrate both the potential for further field testing over larger areas and depths to investigate the impacts of future climate scenarios on permafrost regions and civil infrastructure while also highlighting the challenges in conducting field-scale experimentation, especially at greater depths.
Understanding how temperature fluctuations propagate through the soil column, and how these changes impact various aspects of permafrost response would benefit from methods that are able to link field-scale observations to element-level laboratory tests. Here, hypergravity testing in a geotechnical centrifuge is a promising approach that enables testing of a permafrost layer at prototype scale that captures the full thickness of the active layer – testing can be designed such that the centrifuge model scales to an equivalent prototype that describes the scale of interest in the field. While hypergravity testing has found broad applications within geotechnical engineering (Boulanger et al., 2020; DeJong et al., 2025), it has also previously been applied to permafrost applications. For example, tests have explored soft sediment deformation during thawing (Harris et al., 2000), solufluction during freeze-thaw cycling (Kern-Luetschg and Harris, 2008; Thomas et al., 2009), ice wedge casting (Harris et al., 2005), and periglacial slope stability as a function of soil properties (Harris et al., 2008). More recent tests have investigated contaminant transport as a function of permafrost degradation (Nadeau, 2019), thawing in saturated clay around subway tunnels (Zhou and Tang, 2015), and steel piles in frozen and thawing soils (Clarkson et al., 2024). These tests leverage scaling characteristics based on an enhanced gravity field in the centrifuge such that small-scale models can be used to replicate the conditions at field scale. However, when conducting this class of testing, it is important to ensure that boundary conditions do not affect the process of interest in such a way that laboratory conditions do not replicate the prototype configuration of interest. In the case of permafrost testing in the centrifuge, careful consideration must be given to temperature and heat flux boundary conditions, both in terms of what might be representative conditions for the process at hand, and how the experimental configuration may introduce undesirable heat fluxes into the system that cause deviation from the desired model configuration. As such, it is important to measure temperature in the experiments in such a way that the boundary conditions can be verified and confirmed to provide the necessary temperature and heat flux boundary conditions.
To this end, we are developing the capability to investigate permafrost freeze-thaw in a hypergravity environment with a specific focus on insulation requirements to maintain appropriate boundary conditions that maintain a top-down thawing profile where heat exchange only occurs through the top surface of the soil. This will enable system-level experiments that can tie model predictions of permafrost behavior to field-scale observations of permafrost temperature cycling due to temperature fluctuations at the soil surface. Here, we present preliminary results showing requirements and developed techniques in terms of sample preparation, insulation, and feasible experiment run times for maintaining desired boundary conditions in a 1-m radius geotechnical centrifuge. Our experiments focus on how heat flux, sample preparation, and insulation affect thawing rates and spatial evolution of temperatures of frozen soil.
We include a brief discussion on scaling in a hypergravity setting to illustrate how soil stress and heat diffusion scale in an enhanced gravity field, or g-field. Further details and many examples of different applications (Boulanger et al., 2020; Garnier et al., 2007; Schofield, 1980) can be found in the literature. The basic premise used here is that we test a scale model of a prototype in a g-field enhanced by the same factor, N, to maintain identical scaling of stresses, as shown below. The factor N is referenced to the earth's gravitational field, such that the scaled model in the centrifuge will experience a gravitational force N times normal gravity. In the following discussion, scale factors for a quantity will be denoted by the symbol for the quantity with an asterisk. For example, if L is the symbol for length, then the ratio of the length in the model to the length in the prototype would be denoted as L*.
When investigating stress-dependent behavior of soil in hypergravity models, it is necessary to ensure that the stresses in the model scale identically to the prototype case to ensure the stress-strain response observed in the scaled model is representative of the desired prototype. Thus, the scaling factor for the stress should be one, or . Identical materials are used in the model and prototype so that identical mechanical properties are maintained (Kutter, 1995). In doing so, the scaling factor for density will be . The required scaling factor for gravity can then be calculated as:
The subscripts m and p represent the model and prototype respectively, and h is the depth at which the stress is being calculated. Rearranging and noting that h scales the same as any other length, the scaling factor for gravity is established as:
Thus, for a model where lengths have been reduced by a factor N, the gravitational acceleration must be increased by the same factor, , to achieve the desired scaling of stresses. When considering heat diffusion through the soil, conductive heat transfer is described by the heat equation:
where u is the temperature and α represents the thermal conductivity of the medium through which heat is diffusing. Temperature will not depend on gravitational acceleration and we assume that the thermal conductivity of the soil does not change based on g-level since it is a material property. Thus, based on the scaling factors necessary for maintaining identical scaling of stresses, the time rate of scaling of conductive heat transfer will scale to be (Savvidou, 1988) since the length scaling factor is squared in the Laplacian on the right-hand side of Eq. (6). In other words, heat transfer will occur N2 times faster in the model than in the prototype. This scaling has been experimentally verified by Krishnaiah and Singh (2004). When considering phase change as described by the Stefan Condition (Alexiades, 2018) through energy conservation across the interface, we consider the following differential equation:
where the density (ρ), latent heat (L), and thermal conductivities of the liquid and solid (kL and kS, respectively) are material properties and thus do not depend on gravity. There is no gravitational term in this equation and thus the enhanced gravity in the centrifuge will not impact thawing/freezing. However, length quantities in the model are scaled down by a factor of N. Considering the left side of the equation, it will have a factor while the right side of the equation will have a N factor. Solving for time, we find that time rate of scaling for phase change will scale to be . Thus, heat conduction and phase change will have the same time rate scaling.
Tests were performed at the UC Davis Center for Geotechnical Modeling using the 1-m radius beam centrifuge. For this set of experiments, cohesionless sandy soils were prepared at two different relative densities to assess the influence of void space on the rate at which thawing occurs in the samples. Furthermore, we tested specimens both in an insulated and uninsulated container to evaluate insulation requirements to create a one-dimensional thawing front and temperature profile throughout the majority of the centrifuge container. The model soil depth was 20 cm and tests were conducted at 25 times the earth's gravitational acceleration, or 25g. Thus, in prototype scale the soil depth scales to 5 m. The general configuration for the experiments is shown in Fig. 1 and, below, we provide details on different aspects of the experimental setup and measurements taken.
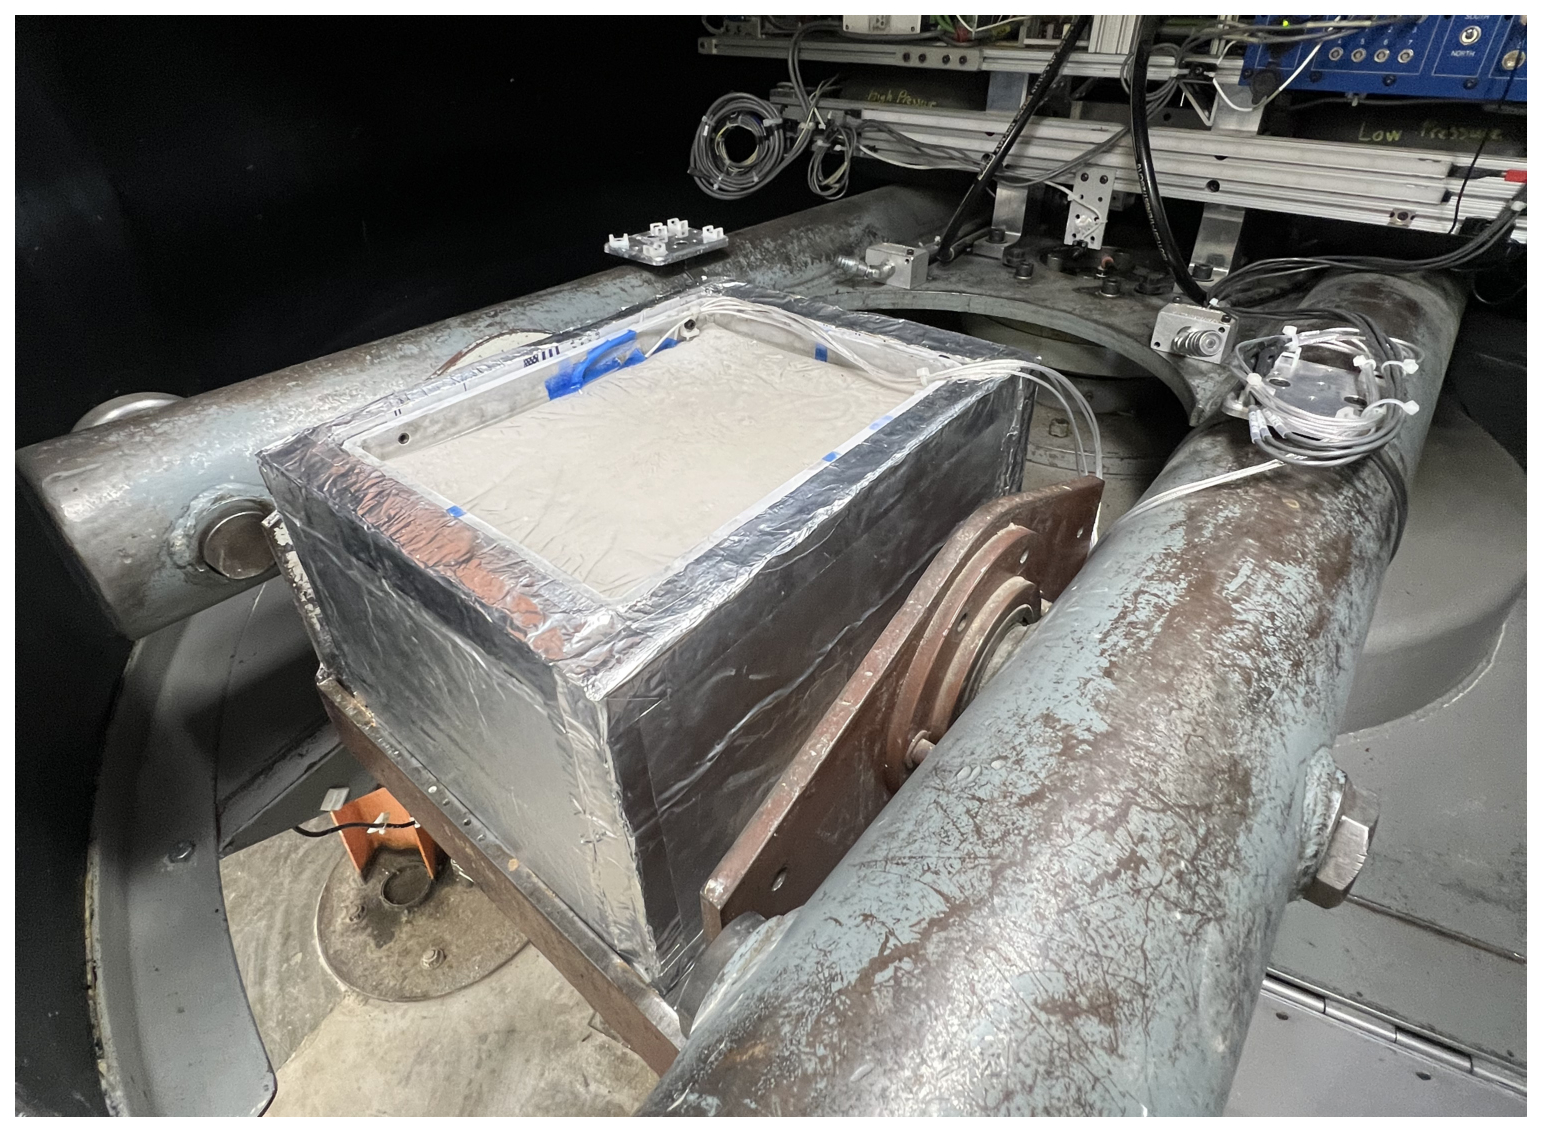
Figure 1Insulated sample place on 1 m radius centrifuge. Aluminium container is surrounded by insulation (silver panels on outside of soil container), while wiring for resistance temperature detectors can be seen emerging from the soil near the back left.
3.1 Soil Preparation and Sensor Placement
F-65 Ottawa Silica Sand (Carey et al., 2020) was used to prepare samples at a relative density (DR) of 40 % and 80 % to represent soils in a “loose” and “dense” state, where the loose sample contains more void space to hold water compared to the dense sample of the same volume. Dry soil was air pluviated into a rigid aluminum container (length 35.4 cm × 26.4 cm width × 24.0 cm depth) from a specific height that is calibrated based on the desired relative density, air moisture content, and soil type – F-65 in this case. Soil is placed in 2 cm layers to allow for sensor placement within the specimens. For the 40 % DR sample, 4 resistance temperature detectors (RTDs) were placed at the locations shown in Fig. 2a to measure temperature change in the sample during testing. Similarly, 16 RTDs were installed in the 80 % DR specimen as indicated in Figure 2b. The difference between the number of RTDs used between the two tests is based purely on the number of signal conditioners that were available at the time when tests were conducted, with more signal conditioners being available for the dense tests. However, care was taken to place RTDs in similar locations compared to the loose tests so that we could have direct comparison between the dense and loose tests. General-purpose Pt100 RTDs with a nominal resistance of 100Ω at 0 °C and a stated measurement accuracy of ±1.5 % were used. Configured in a 3-wire arrangement, these sensors are representative of low-cost, non-standard RTDs commonly available through online marketplaces. Signal conditioning was performed using a combination of National Instruments NI-9217 and Advantech ADAM-6015 RTD input modules, as well as TWTADE Pt100 transmitters manufactured by Suzhou Taishun Electronics.
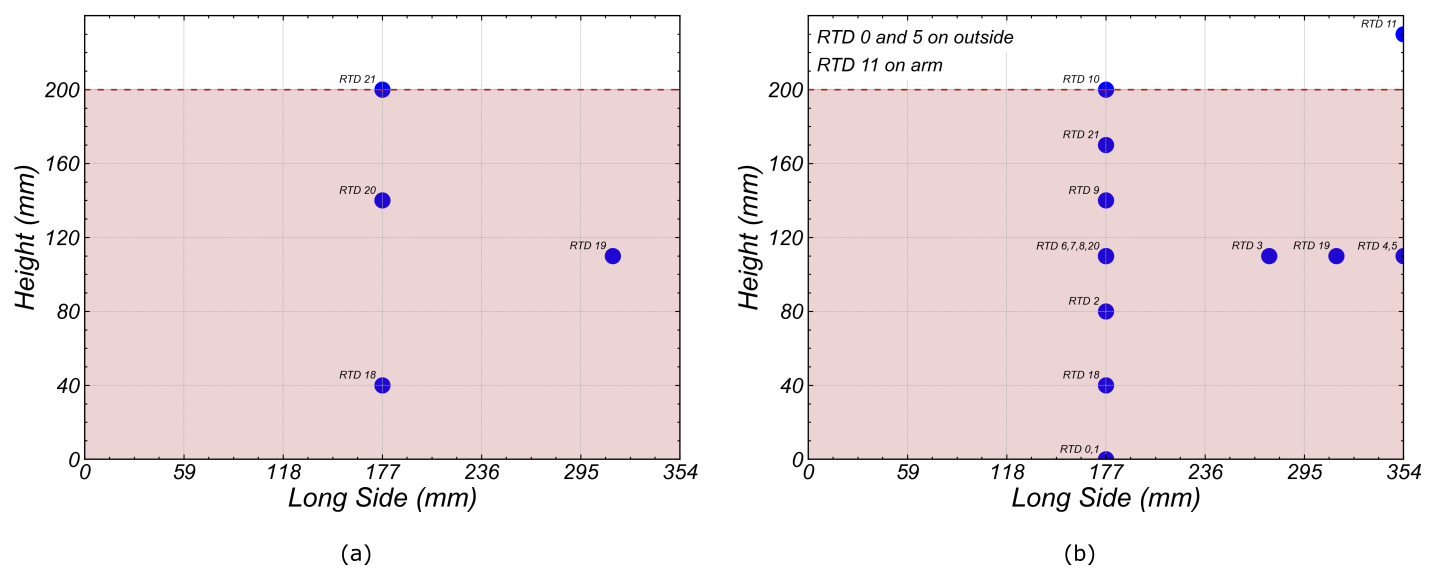
Figure 2Resistance Temperature Detector (RTD) sensor placement in section view: (a) Loose sample and (b) dense sample. All dimensions shown are in model scale.
Once all sensors are placed and the sample is at the desired height, the soil is slowly saturated. This is done by tilting the container slightly and allowing water to slowly infiltrate from the lowest edge to avoid large pockets of air being trapped in the pore space. Additionally, a sponge is placed on top of the soil to distribute inflow and limit the amount of disturbance from water splashing on the surface.
3.2 Freezing Procedure
The saturated sample is placed in a freezer to completely freeze the soil prior to testing on the centrifuge. In order to minimize disturbance of the soil fabric due to volume expansion of water during the freezing process, the sample is frozen from the bottom up so that water is able to migrate to the surface freely. As illustrated in Fig. 3a, this is achieved by placing insulation around the sides and top of the container, while directing airflow within the freezer towards the uninsulated bottom of the container. After freezing, excess ice that has formed on the top of the soil is melted away to avoid having an ice buffer that shields the underlying soil during testing. This is done by using a heat gun and a peristaltic pump. Once all excess ice is removed from the top of the sample, it is returned to the freezer to re-freeze the soil near the surface.
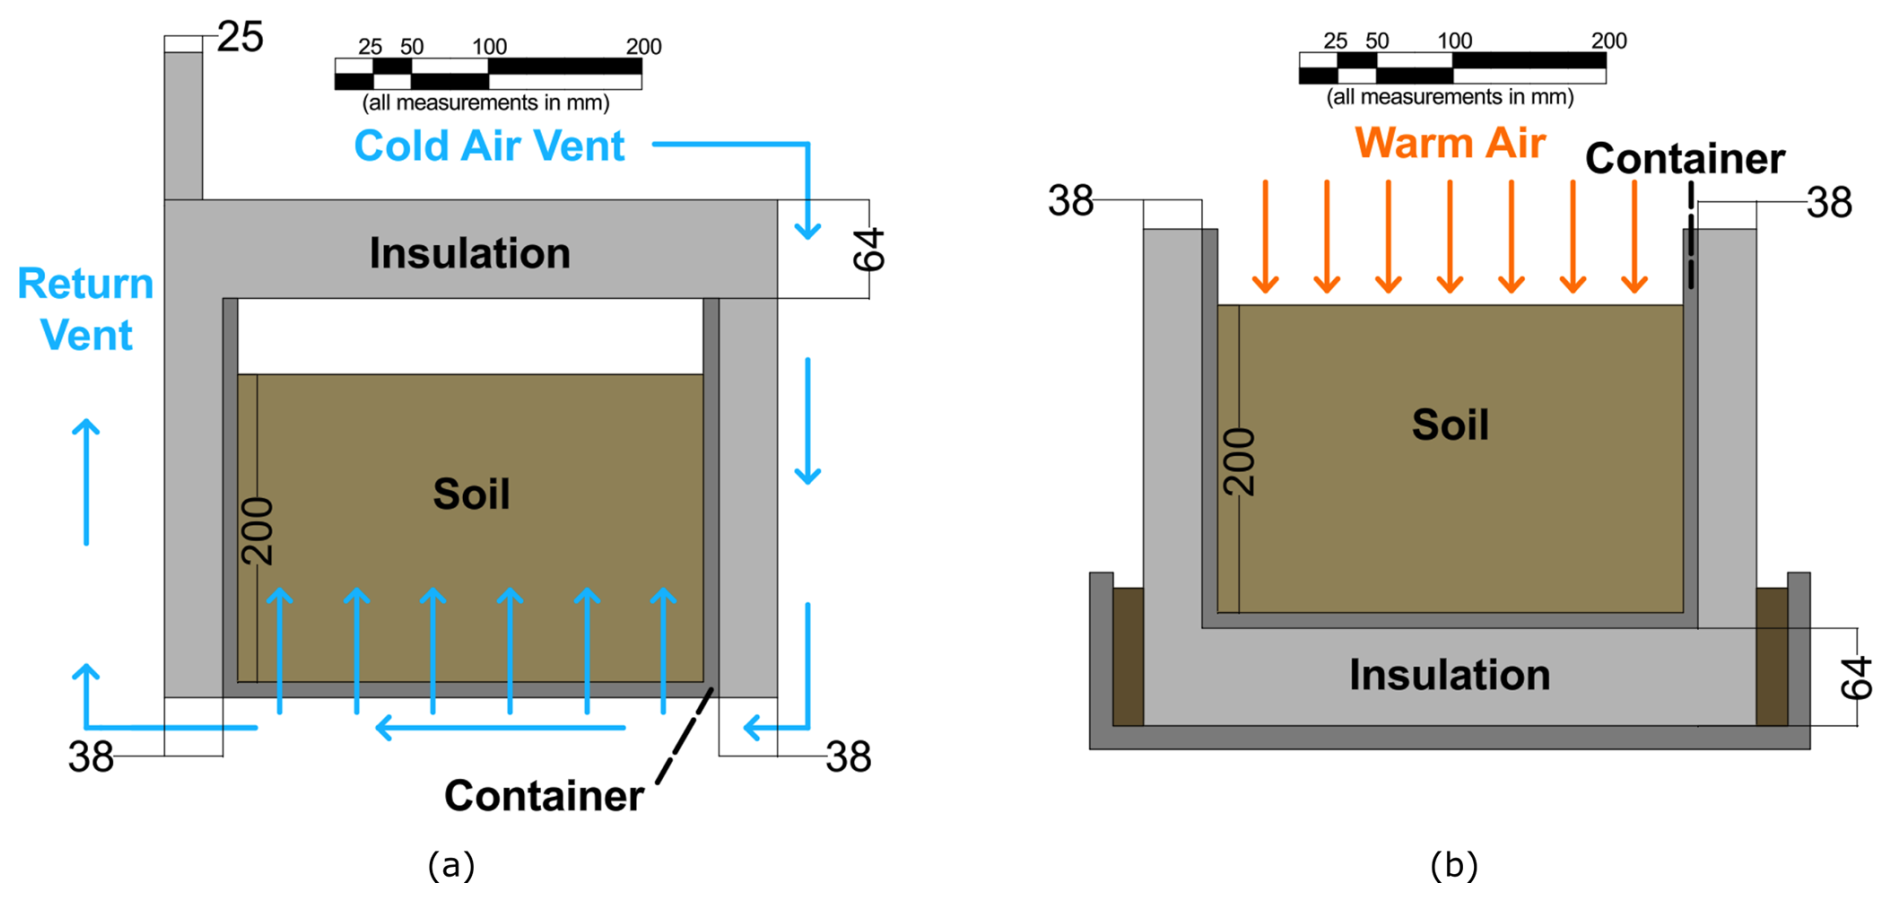
Figure 3Schematic illustrating model setup during freezing and during testing on the centrifuge arm. All dimensions shown are in model scale (mm). (a) Freezing configuration to ensure models freeze from bottom to top. Airflow is directed next to the uninsulated bottom to ensure heat flux is through the lower portion of the model during freezing. (b) Configuration of model on centrifuge arm. Bottom and sides of the container are insulated to ensure heat enters the model through the top soil surface.
3.3 Insulation
Insulated and uninsulated tests of both the dense and loose samples were tested to evaluate the insulation required to maintain a one-dimensional thawing front throughout the container during testing. Thus, the samples were first placed in the centrifuge uninsulated and temperature data was collected as soil thawed due to ambient temperatures during spinning. After this test, samples were re-frozen and placed on the centrifuge with insulation around the sides and bottom of the container, as shown in Fig. 3b. Insulation consisted of 3.81 cm thick insulation sheets with an RSI-value of 1.69 m2 K−1 W−1 placed around the sides, and two sheets (one 3.81 cm and one 2.54 cm sheet for a total thickness of 6.35 cm) on the bottom of the container to account for loss of insulation due to compression during testing at 25g.
Here, we present key results and a summary of observations; however, all data is available in the published data set (Gardner et al., 2025).
4.1 Insulation Requirements
The time-varying temperature for both the insulated and uninsulated cases for the loose sample are shown in Fig. 4a, and for the dense sample in Fig. 4b – note that all values are shown in prototype scale. For the uninsulated tests, the order in which the temperature increases at different sensor locations clearly indicates that the sample is heating from all sides and that the center of the sample is the last to fully thaw – the influence of the exposed aluminum container in particular can be seen in the slope of the uninsulated tests where it is able to efficiently transfer heat from the warm air in the centrifuge rotunda directly into the soil. For these uninsulated tests, it is thus not possible to maintain a one-dimensional, top down thawing profile for any reasonable amount of testing time and results from these tests would not be representative of what anticipated conditions would be in the field.
Comparatively, when placing insulation around the sides and bottom of the container, the order at which thawing is observed at the different sensor locations indicates that the sample thaws from the surface downward. This better approximates the thawing process that would be observed in the active layer. For the prototype scale tested, the one-dimensional thawing profile can reasonably be maintained for approximately 150 d for the dense sample and 120 d for the loose sample, where reported times are in prototype scale. Considering the scaling approach used for these tests, if the tests were conducted at higher g-levels, the prototype times tested could be extended. Of course, this would also mean that the prototype depth of the active layer would be increased, so consideration would need to be given to both the desired prototype depth and time that is being modeled. In the case of our experiments, we were restricted to a 1 m radius centrifuge; however, larger systems would expand the range of scenarios that could be tested.
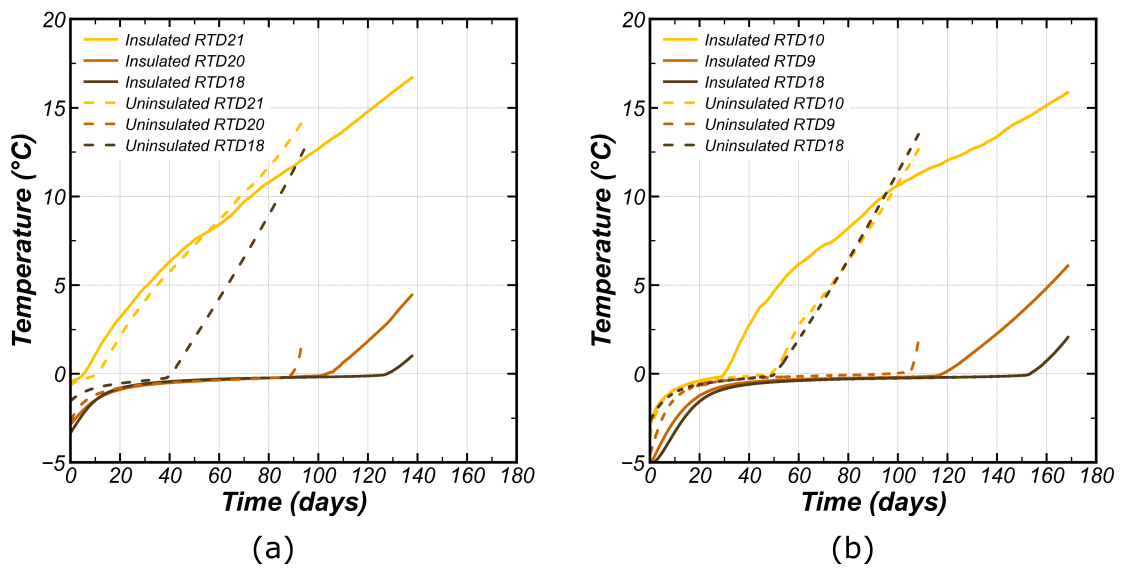
Figure 4Recorded temperatures for (a) loose and (b) dense sample preparations. For both sample preparations, results are shown for insulated and uninsulated tests. Substantial benefit of insulation can clearly be seen in both cases, where a one-dimensional thawing profile is maintained for 120 d for the loose sample and 150 d for the dense sample when insulated. Sensor comparisons taken to be at same locations between dense and loose samples.
Figure 5 shows a comparison between the two-phase Stefan Condition (as described by Eq. 7) and the measured temperature time histories for the dense tests (both insulated and uninsulated). For this comparison, we calibrated the analytical solution to the measured values at RTD 21 for the insulated case as this sensor location best matches assumptions in the solution of Eq. (7). The properties used for this sensor location are then applied to all other locations to evaluate the efficacy of the insulation and potential introduction of undesirable heat into the soil sample. In this preliminary testing, the impact of simply placing insulation around the sides and bottom of the aluminum container can be clearly seen when comparing the insulated (Fig. 5a) with the uninsulated (Fig. 5b) case. In Fig. 5a, the temperature time histories for RTDs 20 and 21 match the Stefan equation quite well. However, RTD 18 and the later times for RTD 20 show faster thawing compared to the analytical prediction. This indicates the initial efficacy of the insulation in maintaining a 1-D thawing front, but how heat introduced into the system through the top of the aluminum container causes the deepest sensor (RTD 18) to thaw before the sensor in the middle of the sample (RTD 20). A small portion along the top of the container (Fig. 3b) was still exposed to the surrounding air in the insulated tests. This small exposure of the top of the aluminum container, which has higher heat conductivity, provided a pathway for heat to flow into the container and introduce undesirable heat to the bottom and sides of the frozen sample, partially compromising the one-dimensional thawing profile of the test. While this did not compromise our tests entirely, it did reduce the feasible run times for which a top-down thawing profile could be maintained. Comparatively, as illustrated in Fig. 5b, when no insulation is placed around the container, both the timing and slope of the analytical and measured temperature time histories diverge substantially. The soil near the bottom of the container thaws much more rapidly than any of the other locations and a 1-D thawing profile is never achieved. Further, due to the essentially infinite capacity of the warm air surrounding the aluminum container, large amounts of heat can be introduced into the sample in such a way that violates the assumed boundary conditions for Eq. (7). Future testing specifically addresses this issue by ensuring the aluminum centrifuge container is completely wrapped in insulation on both the inside and outside, with exposure only where instrumentation must be secured for testing.
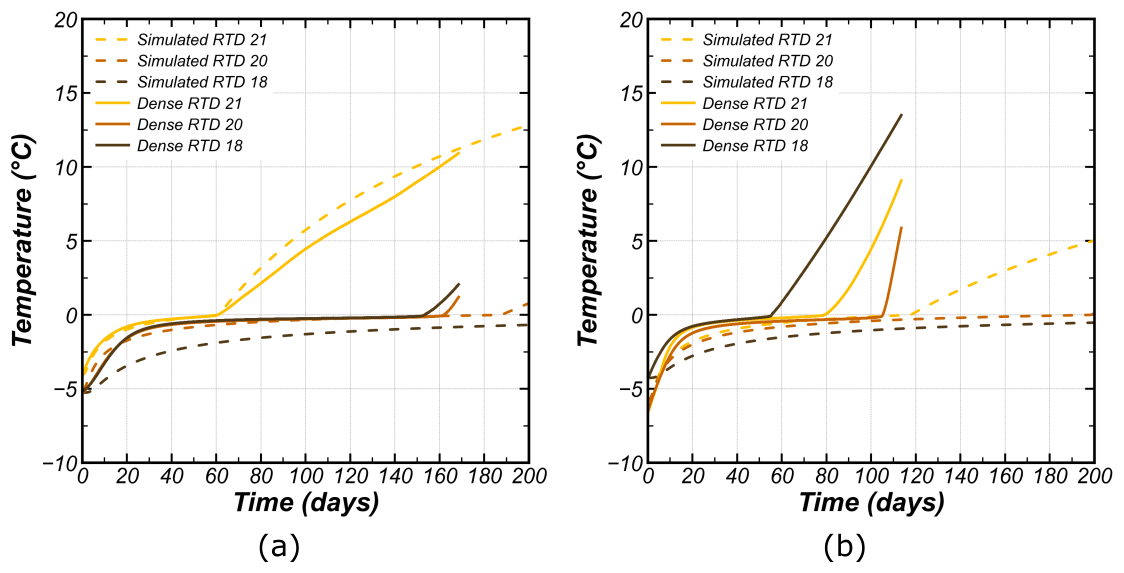
Figure 5Comparison between measured temperature time histories at the center of the sample compared with the 2-phase Stefan Condition, as described by Eq. (7). (a) Insulated Test: The efficacy of the insulation is evident as there is good agreement between the measured values and analytical solution; however, the influence of heat entering the insulated model through the aluminum container can be seen through the increasing temperature at the bottom of the model. (b) Uninsulated Test: The rapid increase in temperature of the model, especially at the bottom, in the uninsulated tests can be clearly seen. The steep slopes in the temperature time histories post-phase change also indicate the substantial heat flux into the soil sample through the aluminum container
4.2 Soil Density Effects
The relative density of the soil was observed to have a strong influence on the rate at which thawing occurs within the samples during testing. Figure 6 shows a comparison of the time-varying temperature in the dense and loose samples for the insulated tests. As shown, the loose soils thawed consistently faster than the dense soils at all measured locations. Similar trends were observed in the uninsulated tests, but are not shown here. The difference in the thawing rates between the dense and loose soil preparations can be explained by considering the difference in thermal conductivity of the soil particles and ice, and their relative amounts present in each of the soil samples. For dry, silica-rich sandy soils, the thermal conductivity ranges from approximately 0.1–1.0 W mK−1 (Chen, 2008; Tarnawski et al., 2009; Tetteh et al., 2024) while the thermal conductivity of ice ranges from approximately 2.1–2.6 W mK−1 (Bonales et al., 2017). The relative amount of ice present in the loose sample compared to the dense sample is higher since the volume of the pore space is greater and completely filled with ice. As such, estimating the equivalent thermal conductivity as a function of the relative amounts of soil particles and ice present in a given soil volume would yield a higher value for the loose sample compared to the dense sample. Thus, the loose sample is able to conduct heat at a faster rate compared to the dense sample and will show faster phase transition and temperature increase compared to the dense sample.
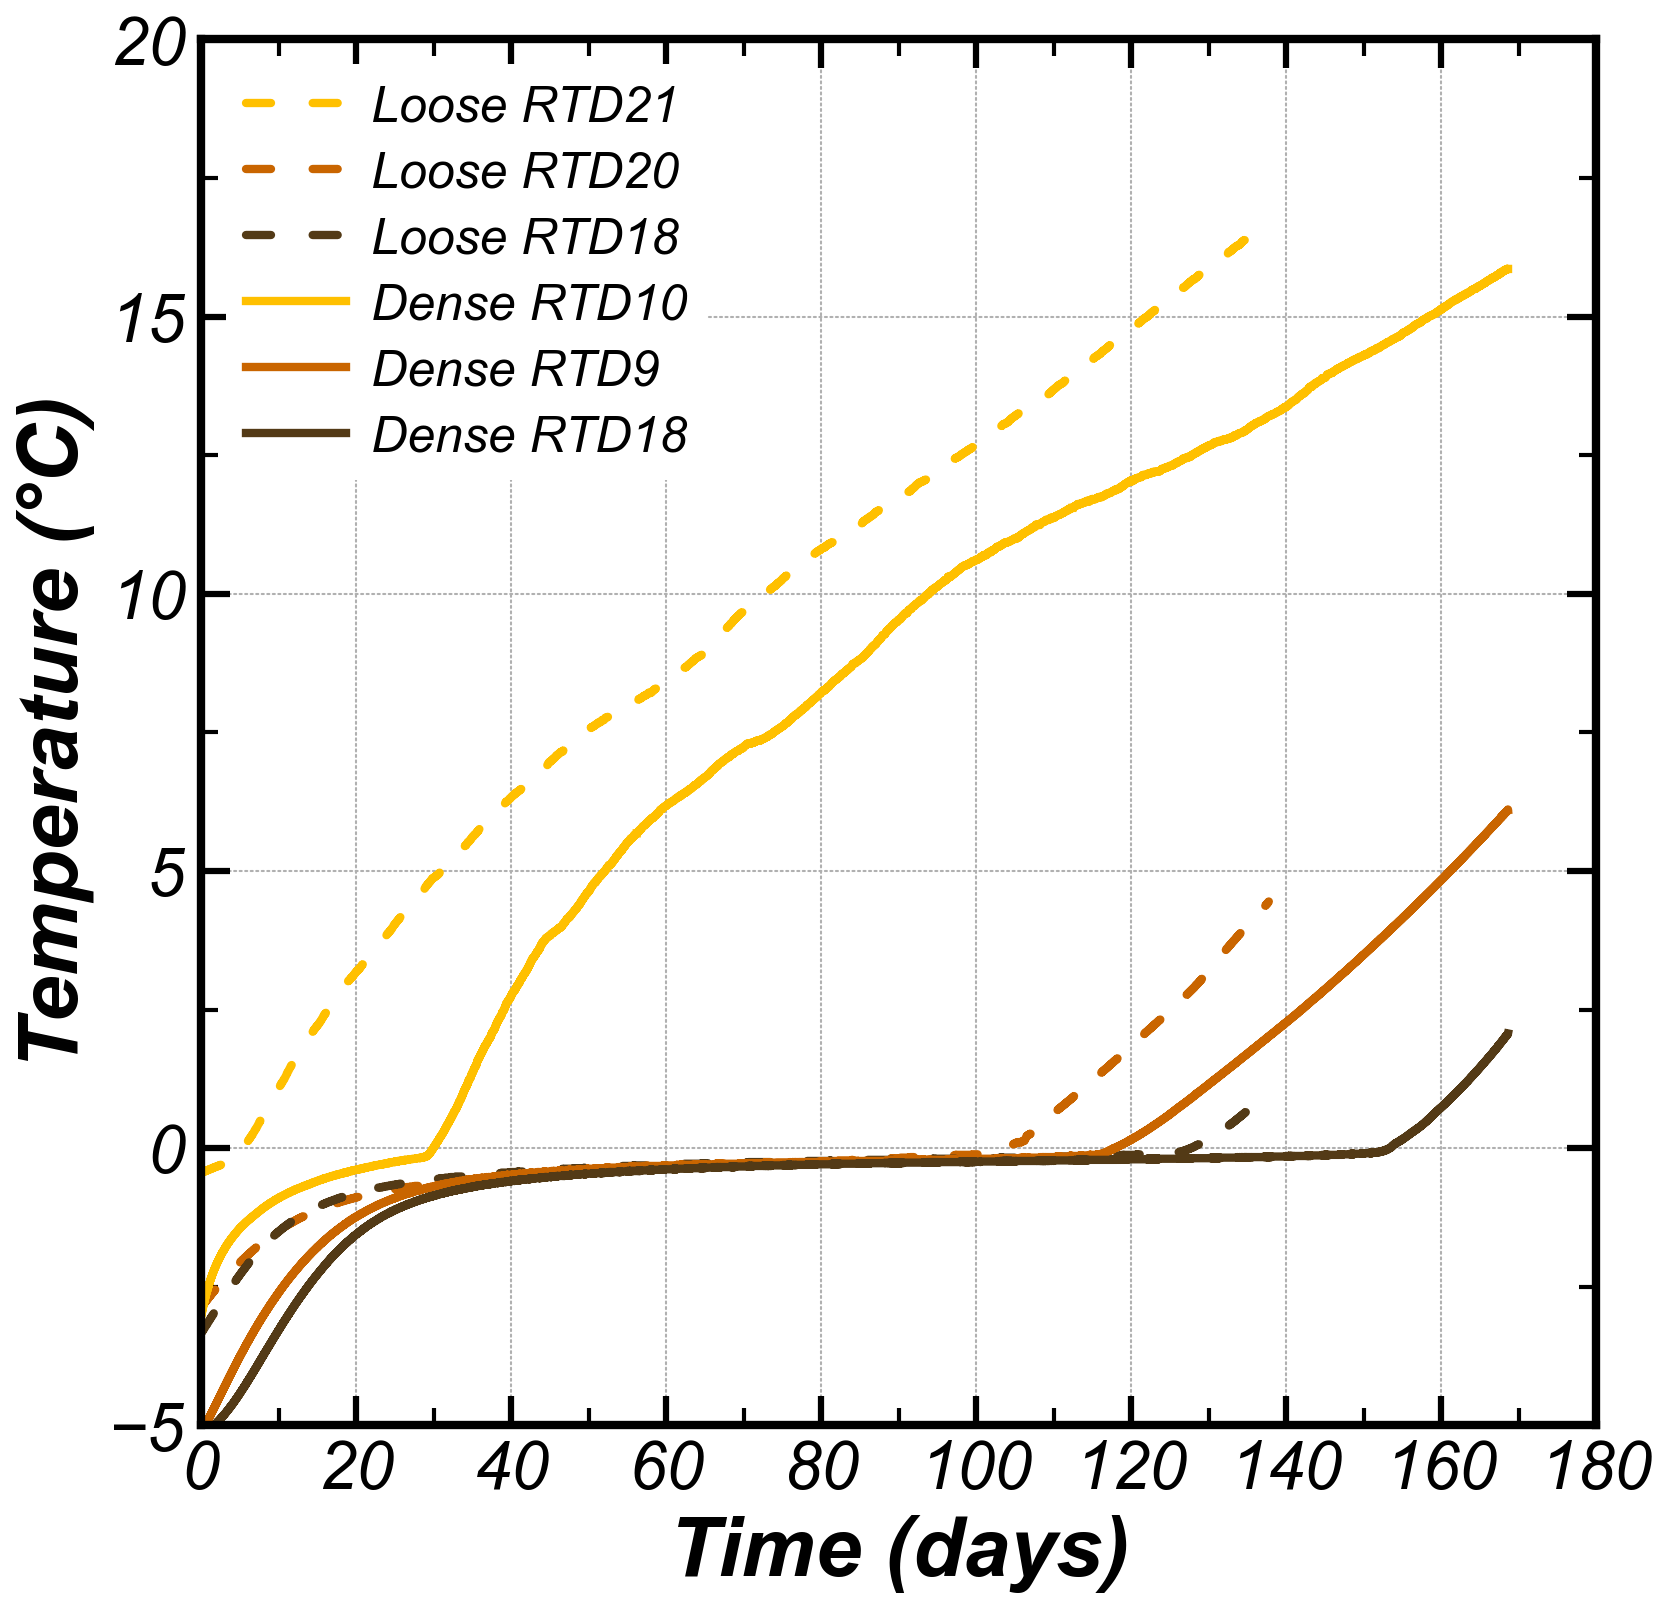
Figure 6Thawing rate comparison for dense and loose sample preparations for insulated tests. The dense sample shows a substantially slower thawing rate compared to the loose sample. Sensor locations taken to be at same locations between loose and dense samples.
Hypergravity testing in a geotechnical centrifuge provides a means by which to conduct system-level experiments that tie element level phenomena to field scale observations. To investigate the application of this approach in modeling the active layer in permafrost regions, we developed and tested capabilities for conducting hypergravity testing on thawing rates of frozen soil in a 1 m radius geotechnical centrifuge. Specifically, we show that a one-dimensional thawing profile that approximates how soil thaws during higher air temperatures at the soil surface can be achieved without active cooling by adequately insulating the sides and bottom of the centrifuge container. When insulating the container, careful consideration must be given to potential heat entry points, as heat flows readily through the aluminum container and can lead to undesirable thawing patterns. This was illustrated through comparison of the measured temperature time histories with predicted temperature time histories based on the analytical solution to the Stefan Condition. The entry of undesirable heat through small exposures of more conductive material allow heat to be quickly transferred to the other portions of the sample, which can lead to deviations from the one-dimensional thawing profile.
Further, we conducted experiments with two different soil sample preparations – one relatively dense and one relatively loose sample – that show the influence of soil fabric on the rate at which it thaws. For the two specimens prepared with the same silica sand, the influence of the soil density and associated void space was shown to influence the rate at which heat can flow through the sample. Thus, it should be expected that heat flux will be highly dependent on soil fabric and type, both of which will vary spatially in the field. Our results here consider only a very limited set and further research is necessary to establish how heterogeneity influences spatial variability in soil thawing rates. An important consideration for this aspect would be to consider the influence that sample freezing may have on the desired soil fabric. In this work, we ensured that the prepared fabric was minimally disturbed by freezing the sample from the bottom up. Since the sandy material is free-draining, this allowed water to migrate to the top of the sample as ice formed below it without substantial expansion within the soil pore space.
The capabilities and procedures discussed here illustrate the basic requirements to maintain temperature boundary conditions for conducting hypergravity testing of frozen soil, and the spatial and temporal scales that may be considered using this approach. Considering these preliminary results, there are opportunities for substantial expansion on how this approach can be applied. In our work, we did not implement an active cooling system and thawing rates could not be controlled by maintaining a specific temperature at the top soil boundary. However, current research is focused on creating testing capabilities that provide active cooling such that temperature conditions of the centrifuge container and soil samples can be directly controlled, enabling testing of thawing and freezing cycles.
Data are publicly available and can be accessed on the NSF NHERI DesignSafe repository through the following DOI: https://doi.org/10.17603/ds2-mwar-sp11 (Gardner et al., 2025).
MHG and JTD conceived the study; SB, SH, and HK conducted the centrifuge experiments; all authors analyzed the experimental results together and contributed to writing the manuscript.
The contact author has declared that none of the authors has any competing interests.
Publisher's note: Copernicus Publications remains neutral with regard to jurisdictional claims made in the text, published maps, institutional affiliations, or any other geographical representation in this paper. The authors bear the ultimate responsibility for providing appropriate place names. Views expressed in the text are those of the authors and do not necessarily reflect the views of the publisher.
The authors would like to thank the staff at the Center for Geotechnical Modeling (CGM) at UC Davis for their assistance during design of the experimental setup and during the centrifuge experiments. The CGM is supported by a grant from the US National Science Foundation (CMMI-2037883). Support from the UC Davis Academic Senate Grant (FL25MG) enabled development of the testing capabilities necessary for this research.
This research has been supported in part by a grant from the UC Davis Academic Senate (grant no. FL25MG) and the NSF Division of Civil, Mechanical and Manufacturing Innovation (grant no. CMMI-2037883).
This paper was edited by Mahya Roustaei and reviewed by Lukas U. Arenson and one anonymous referee.
Alexiades, V.: Mathematical modeling of melting and freezing processes, Routledge, https://doi.org/10.1201/9780203749449, 2018. a
Bai, Y., Peng, Y., Zhou, W., Xie, Y., Li, Q., Yang, G., Chen, L., Zhu, B., and Yang, Y.: SWAMP: A new experiment for simulating permafrost warming and active layer deepening on the Tibetan Plateau, Methods Ecol. Evol., 14, 1732–1746, https://doi.org/10.1111/2041-210X.14124, 2023. a
Bonales, L., Rodríguez, A. C., and Sanz, P.: Thermal conductivity of ice prepared under different conditions, Int. J. Food Prop., 20, 610–619, https://doi.org/10.1080/10942912.2017.1306551, 2017. a
Boulanger, R. W., Wilson, D. W., Kutter, B. L., DeJong, J. T., and Bronner, C. E.: NHERI centrifuge facility: large-scale centrifuge modeling in geotechnical research, Frontiers in Built Environment, 6, 121, https://doi.org/10.3389/fbuil.2020.00121, 2020. a, b
Carey, T. J., Stone, N., and Kutter, B. L.: Grain size analysis and maximum and minimum dry density testing of Ottawa F-65 sand for LEAP-UCD-2017, in: Model tests and numerical simulations of liquefaction and lateral spreading: LEAP-UCD-2017, Springer, 31–44, https://doi.org/10.1007/978-3-030-22818-7_2, 2020. a
Chen, S. X.: Thermal conductivity of sands, Heat Mass Transfer, 44, 1241–1246, https://doi.org/10.1007/s00231-007-0357-1, 2008. a
Clarkson, C., Eichhorn, G., and Siemens, G.: Centrifuge modelling of axially loaded steel piles in cold and thawing frozen sand, Int. J. Phys. Model. Geo., 24, 124–135, https://doi.org/10.1680/jphmg.22.00062, 2024. a
DeJong, J. T., Wilson, D. W., Martinez, A., Ziotopoulou, K., Ham, S.-M., and Boulanger, R. W.: NHERI centrifuge facility: systems-scale hypergravity modeling in engineering and scientific research, Frontiers in Built Environment, 11, 1568832, https://doi.org/10.3389/fbuil.2025.1568832, 2025. a
Gardner, M., Buttery, S., Ham, S.-M., Khan, H., and DeJong, J.: Hypergravity Testing of Thawing Rates in Frozen Sand – Dense and Loose F65 Ottowa Sand, Designsafe-CI [data set], https://doi.org/10.17603/ds2-mwar-sp11, 2025. a, b
Garnier, J., Gaudin, C., Springman, S. M., Culligan, P., Goodings, D., Konig, D., Kutter, B., Phillips, R., Randolph, M., and Thorel, L.: Catalogue of scaling laws and similitude questions in geotechnical centrifuge modelling, Int. J. Phys. Model. Geo., 7, 01–23, https://doi.org/10.1680/ijpmg.2007.070301, 2007. a
Hanson, P. J., Riggs, J. S., Nettles, W. R., Phillips, J. R., Krassovski, M. B., Hook, L. A., Gu, L., Richardson, A. D., Aubrecht, D. M., Ricciuto, D. M., Warren, J. M., and Barbier, C.: Attaining whole-ecosystem warming using air and deep-soil heating methods with an elevated CO2 atmosphere, Biogeosciences, 14, 861–883, https://doi.org/10.5194/bg-14-861-2017, 2017. a
Harris, C., Murton, J., and Davies, M. C.: Soft-sediment deformation during thawing of ice-rich frozen soils: results of scaled centrifuge modelling experiments, Sedimentology, 47, 687–700, https://doi.org/10.1046/j.1365-3091.2000.00322.x, 2000. a
Harris, C., Murton, J. B., and Davies, M. C.: An analysis of mechanisms of ice-wedge casting based on geotechnical centrifuge simulations, Geomorphology, 71, 328–343, https://doi.org/10.1016/j.geomorph.2005.03.006, 2005. a
Harris, C., Smith, J. S., Davies, M. C., and Rea, B.: An investigation of periglacial slope stability in relation to soil properties based on physical modelling in the geotechnical centrifuge, Geomorphology, 93, 437–459, https://doi.org/10.1016/j.geomorph.2007.03.009, 2008. a
Henry, G. and Molau, U.: Tundra plants and climate change: the International Tundra Experiment (ITEX), Glob. Change Biol., 3, 1–9, https://doi.org/10.1111/j.1365-2486.1997.gcb132.x, 1997. a
Hicks Pries, C. E., Castanha, C., Porras, R., and Torn, M.: The whole-soil carbon flux in response to warming, Science, 355, 1420–1423, https://doi.org/10.1126/science.aal1319, 2017. a
Hjort, J., Streletskiy, D., Doré, G., Wu, Q., Bjella, K., and Luoto, M.: Impacts of permafrost degradation on infrastructure, Nature Reviews Earth & Environment, 3, 24–38, https://doi.org/10.1038/s43017-021-00247-8, 2022. a
Kern-Luetschg, M. and Harris, C.: Centrifuge modelling of solifluction processes: displacement profiles associated with one-sided and two-sided active layer freezing, Permafrost Periglac., 19, 379–392, https://doi.org/10.1002/ppp.633, 2008. a
Krishnaiah, S. and Singh, D.: Centrifuge modelling of heat migration in soils, Int. J. Phys. Model. Geo., 4, 39–47, https://doi.org/10.1680/ijpmg.2004.040303, 2004. a
Kutter, B. L.: Recent advances in centrifuge modeling of seismic shaking, in: International Conferences on Recent Advances in Geotechnical Earthquake Engineering and Soil Dynamics, University of Missouri–Rolla, https://scholarsmine.mst.edu/icrageesd/03icrageesd/session16/4 (last access: 13 June 2026), 1995. a
Lewkowicz, A. G., O'Neill, H. B., Wolfe, S. A., Roy-Léveillée, P., Roujanski, V. E., Hoever, E., Gruber, S., Brooks, H., Rudy, A. C., Koenig, C. E., Brown, N., and Bonnaventure, P.: Glossary of Permafrost Science and Engineering, Canadian Permafrost Association, https://doi.org/10.3138/cpa-gpse, 2025. a
Murton, J. B.: Permafrost and climate change, in: Climate change, Elsevier, 281–326, https://doi.org/10.1016/B978-0-443-32838-1.00013-8, 2021. a, b
Nadeau, P. J. A.: Geotechnical Centrifuge Modelling of Contaminant Transport through Frozen Soil, PhD thesis, Royal Military College of Canada, https://espace.rmc.ca/jspui/handle/11264/1785 (last access: 13 June 2026), 2019. a
Niu, F., Luo, J., Lin, Z., Fang, J., and Liu, M.: Thaw-induced slope failures and stability analyses in permafrost regions of the Qinghai-Tibet Plateau, China, Landslides, 13, 55–65, https://doi.org/10.1007/s10346-014-0545-2, 2016. a
Nottingham, A. T., Meir, P., Velasquez, E., and Turner, B. L.: Soil carbon loss by experimental warming in a tropical forest, Nature, 584, 234–237, https://doi.org/10.1038/s41586-020-2566-4, 2020. a
Portner, H., Roberts, D., Masson-Delmotte, V., Zhai, P., Tignor, M., Poloczanska, E., Mintebeck, K., Nicolai, M., Okem, A., Petzold, J., Rama, B., and Weyer, N.: IPCC the ocean and cryosphere in a changing climate summary for policmakers, IPCC Spec. Rep. Ocean Cryosph. a Chang. Clim, 42, https://doi.org/10.1017/9781009157964, 2019. a
Qin, W., Chen, Y., Wang, X., Zhao, H., Hou, Y., Zhang, Q., Guo, X., Zhang, Z., and Zhu, B.: Whole-soil warming shifts species composition without affecting diversity, biomass and productivity of the plant community in an alpine meadow, Fundamental Research, 3, 160–169, https://doi.org/10.1016/j.fmre.2022.09.025, 2023. a
Ramage, J., Jungsberg, L., Wang, S., Westermann, S., Lantuit, H., and Heleniak, T.: Population living on permafrost in the Arctic, Population and Environment, 1–17, https://doi.org/10.1007/s11111-020-00370-6, 2021. a
Salmon, V. G., Soucy, P., Mauritz, M., Celis, G., Natali, S. M., Mack, M. C., and Schuur, E. A.: Nitrogen availability increases in a tundra ecosystem during five years of experimental permafrost thaw, Glob. Change Biol., 22, 1927–1941, https://doi.org/10.1111/gcb.13204, 2016. a
Savvidou, C.: Centrifuge modelling of heat transfer in soil, in: Centrifuge, vol. 88, Balkema Rotterdam, 583–591, 1988. a
Schofield, A. N.: Cambridge geotechnical centrifuge operations, Geotechnique, 30, 227–268, https://doi.org/10.1680/geot.1980.30.3.227, 1980. a
Schuur, E. A. G., McGuire, A. D., Schädel, C., Grosse, G., Harden, J. W., Hayes, D. J., Hugelius, G., Koven, C. D., Kuhry, P., Lawrence, D. M., Natali, S. M., Olefeldt, D., Romanovsky, V. E., Schaefer, K., Turetsky, M. R., Treat, C. C., and Vonk, J. E.: Climate change and the permafrost carbon feedback, Nature, 520, 171–179, https://doi.org/10.1038/nature14338, 2015. a
Tarnawski, V. R., Momose, T., Leong, W., Bovesecchi, G., and Coppa, P.: Thermal conductivity of standard sands. Part I. Dry-state conditions, Int. J. Thermophys., 30, 949–968, https://doi.org/10.1007/s10765-009-0596-0, 2009. a
Tetteh, S., Juul, G., Järvinen, M., and Santasalo-Aarnio, A.: Improved effective thermal conductivity of sand bed in thermal energy storage systems, Journal of Energy Storage, 86, 111350, https://doi.org/10.1016/j.est.2024.111350, 2024. a
Thomas, H. R., Cleall, P., Li, Y.-C., Harris, C., and Kern-Luetschg, M.: Modelling of cryogenic processes in permafrost and seasonally frozen soils, Geotechnique, 59, 173–184, https://doi.org/10.1680/geot.2009.59.3.173, 2009. a
Wagner, A. M., Lindsey, N. J., Dou, S., Gelvin, A., Saari, S., Williams, C., Ekblaw, I., Ulrich, C., Borglin, S., Morales, A., and Ajo-Franklin, J.: Permafrost Degradation and Subsidence Observations during a Controlled Warming Experiment, Sci. Rep., 8, 10908, https://doi.org/10.1038/s41598-018-29292-y, 2018. a
Wu, R., Trubl, G., Taş, N., and Jansson, J. K.: Permafrost as a potential pathogen reservoir, One Earth, 5, 351–360, https://doi.org/10.1016/j.oneear.2022.03.010, 2022. a
Zhou, J. and Tang, Y.: Artificial ground freezing of fully saturated mucky clay: Thawing problem by centrifuge modeling, Cold Reg. Sci. Technol., 117, 1–11, https://doi.org/10.1016/j.coldregions.2015.04.005, 2015. a