the Creative Commons Attribution 4.0 License.
the Creative Commons Attribution 4.0 License.
 | 21 Apr 2026
Glacier mass balance and its response to 2022 heatwaves for Kangxiwa Glacier in the eastern Pamir: insights from time-lapse photography
Ying Xie
Baiqing Xu
Meilin Zhu
Yu Fan
Pengling Wang
Song Yang
Wenqing Zhao
Wei Yang
Contrary to the widespread glacier mass loss in High Mountain Asia under global warming, glaciers in the Pamir-Karakoram region have exhibited anomalously less negative mass balances and even slight mass gains in recent decades. While geodetic studies have quantified decadal-scale mass loss, the process of glacier mass balance and its response to extreme climate events remain poorly understood due to the scarcity of high temporal resolution of mass balance observations. This study analyses the characteristics of daily glacier mass balance during the period from 2019/2020 to 2022/2023 and their responses to the 2022 heatwaves based on time-lapse photography, ablation stake/snow pit measurements and nearby meteorological records collected at the Kangxiwa Glacier in the eastern Pamir. Our results showed that the Kangxiwa Glacier experienced weak mass loss in 2019/2020 and 2020/2021 balance years and significant mass deficits in 2021/2022 and 2022/2023. Observations show that the Kangxiwa Glacier is a spring-accumulation and summer-ablation type, with spring (April–June) accumulation of 200–295 mm w.e. and summer (July–September) mass loss of 306–884 mm w.e. during the past four years. The heatwaves in July-August 2022 caused an abnormal mass loss of over 800 mm w.e. within 40 d, depleting all winter snow accumulation one month earlier than the other three years and driving the equilibrium line altitude above the glacier summit. Characterized by weakened westerly circulation, the 2022 heatwaves led to increased incoming radiation and reduced precipitation. These heatwaves likely affected not only the eastern Pamir region but also the western Kunlun Mountains. Our finding revealed that short-term heatwaves can trigger substantial glacier mass loss in the eastern Pamir, once considered climate-resilient, suggesting that “Pamir–Karakoram” anomaly is increasingly challenged by the growing frequency of extreme heat events.
- Article
(8335 KB) - Full-text XML
-
Supplement
(1072 KB) - BibTeX
- EndNote


Under global climate warming, glaciers on Tibetan Plateau and its surrounding regions have suffered from significant mass loss over recent decades (Brun et al., 2017; Bhattacharya et al., 2021; Hewitt, 2011; Hugonnet et al., 2021; Shean et al., 2020). However, the notable exception, called the “Pamir–Karakoram” anomaly, observed in the western Kunlun, Karakoram and the eastern Pamir ranges, where glaciers have remained in balance or experienced slight mass gains since at least the 1970s (Hewitt, 2011; Berthier and Brun, 2019; Brun et al., 2017; Kääb et al., 2015; Farinotti et al., 2020). Recent studies suggested that this anomaly might be transitioning to a generalized thinning, indicating the end of the “Pamir–Karakoram” anomaly (Hugonnet et al., 2021).
Glaciers in Central Asia are a critical component of the hydrological cycle, providing substantial runoff during the dry summer months for agriculture or hydropower (Huss and Hock, 2018). In-depth analysis of glacier mass changes and their climate response is therefore essential for water resource management and regional sustainability. Geodetic studies have successfully determined decadal glacier mass changes (Shean et al., 2020; Hugonnet et al., 2021). However, the heterogeneous climatic and topographical conditions across the Tibetan Plateau and surroundings result in high spatial variability in glacier mass balance (Brun et al., 2019; Barandun et al., 2021; Barandun and Pohl, 2023; Zhu et al., 2023). In addition, long-term glaciological measurements are scarce across the western Tibetan Plateau, particularly in the western Kunlun, the Pamir and Karakoram ranges (Barandun and Pohl, 2023; Yao et al., 2022; Zemp et al., 2023). Direct glaciological measurements using ablation stakes and snow pits enable the derivation of seasonal and annual mass balance, supporting model calibration and validation (Cogley et al., 2011; Kaser et al., 2003). The limited availability of in-situ observations and detailed analysis of physical ablation and accumulation processes has hindered a comprehensive understanding of the factors driving glacier mass changes in this region.
Extreme events such as heatwaves have caused abnormal high-elevation melting in the world (Chen et al., 2023; Gui et al., 2024; Hassan et al., 2024; Little et al., 2019), threatening water security and triggering glacier-related disasters (Kääb et al., 2018; Shugar et al., 2021; Zhao et al., 2022). For example, a 25 d heatwave in Switzerland in 2022 caused melt equivalent to 35 % of the total summer ablation (Cremona et al., 2023). Similarly, the 2022 heatwave induced unexpected melting on the central Tibetan Plateau (Zhu et al., 2024a; Zhu et al., 2024b) and severe mass loss at Urumqi Glacier No. 1 in the eastern Tien Shan (Xu et al., 2024). The increasing intensity, frequency and duration of regional extreme heatwaves around the world pose a significant threat to mountain glaciers (Colucci et al., 2017; Perkins-Kirkpatrick and Lewis, 2020). The glaciological method and geodetic mass balance method can provide mass balance data at multi-year, annual, and seasonal scales. However, both approaches face challenges in capturing the high temporal evolution of surface mass balance, limiting our understanding of glacier responses to short-term extreme events.
Recent advancements in high temporal resolution monitoring techniques to monitor ablation, such as the SmartStake by rolling the steel wire up (A2 Photonic Sensors, 2021), automated cameras monitoring colour-coded ablation stakes (Landmann et al., 2021; Cremona et al., 2023), and terrestrial laser scanning techniques (Voordendag et al., 2023), have provided new insights into short-term surface mass balance variations, including their response to extreme melt events (Cremona et al., 2023). New indices like the Glacier Loss Day, which was defined as the day when net mass balance becomes negative and winter snow is exhausted (Voordendag et al., 2023), have provided new insights into short-term mass balance variations. In the summer of 2022, heatwaves swept across many parts of the Northern Hemisphere, causing extreme heat events in North America, Europe, and the Yangtze River in China (Lu et al., 2024). However, the processes and mechanisms through which these heatwaves impact glaciers in the eastern Pamir – long considered climatically stable – remain poorly constrained. To address this critical knowledge gap, this study prioritizes time-lapse camera observations to capture daily surface mass balance, complemented by in-situ stake measurements for cross-validation, and integrates ground-based meteorological station records and reanalysis datasets to interpret the associated climatic contexts and underlying mechanisms. Based on these high-temporal-resolution daily surface mass balance datasets, this study aims to (1) characterize the contrasting seasonal mass balance patterns of the Kangxiwa Glacier in the eastern Pamir under varying climatic forcing regimes across the 2019/2020 to 2022/2023 balance years; (2) quantify the sensitivity of surface mass balance to the extreme 2022 summer heatwaves; and (3) identify the atmospheric circulation anomalies linked to the 2022 heatwaves using ERA5 reanalysis data, and further explore regional glacier response.
The study area is located near Muztagh Ata (7546 m a.s.l.) and Kongur Shan (7719 m a.s.l.) in the eastern Pamir, Central Asia (Fig. 1). This region hosts a total of 434 glaciers covering 1018 km2, with a continental glacier regime characterized by cold and arid conditions (Shi and Liu, 2000). The climate of eastern Pamir is dominantly controlled by the westerly jet stream (Yao et al., 2012). Data from the Taxkorgan Meteorological Station (3091 m a.s.l., ∼50 km south of Muztagh Ata) show a mean annual temperature of 3.7 °C and annual precipitation of ∼70 mm over the period of 1960–2015 (Li et al., 2022; Lv et al., 2020).
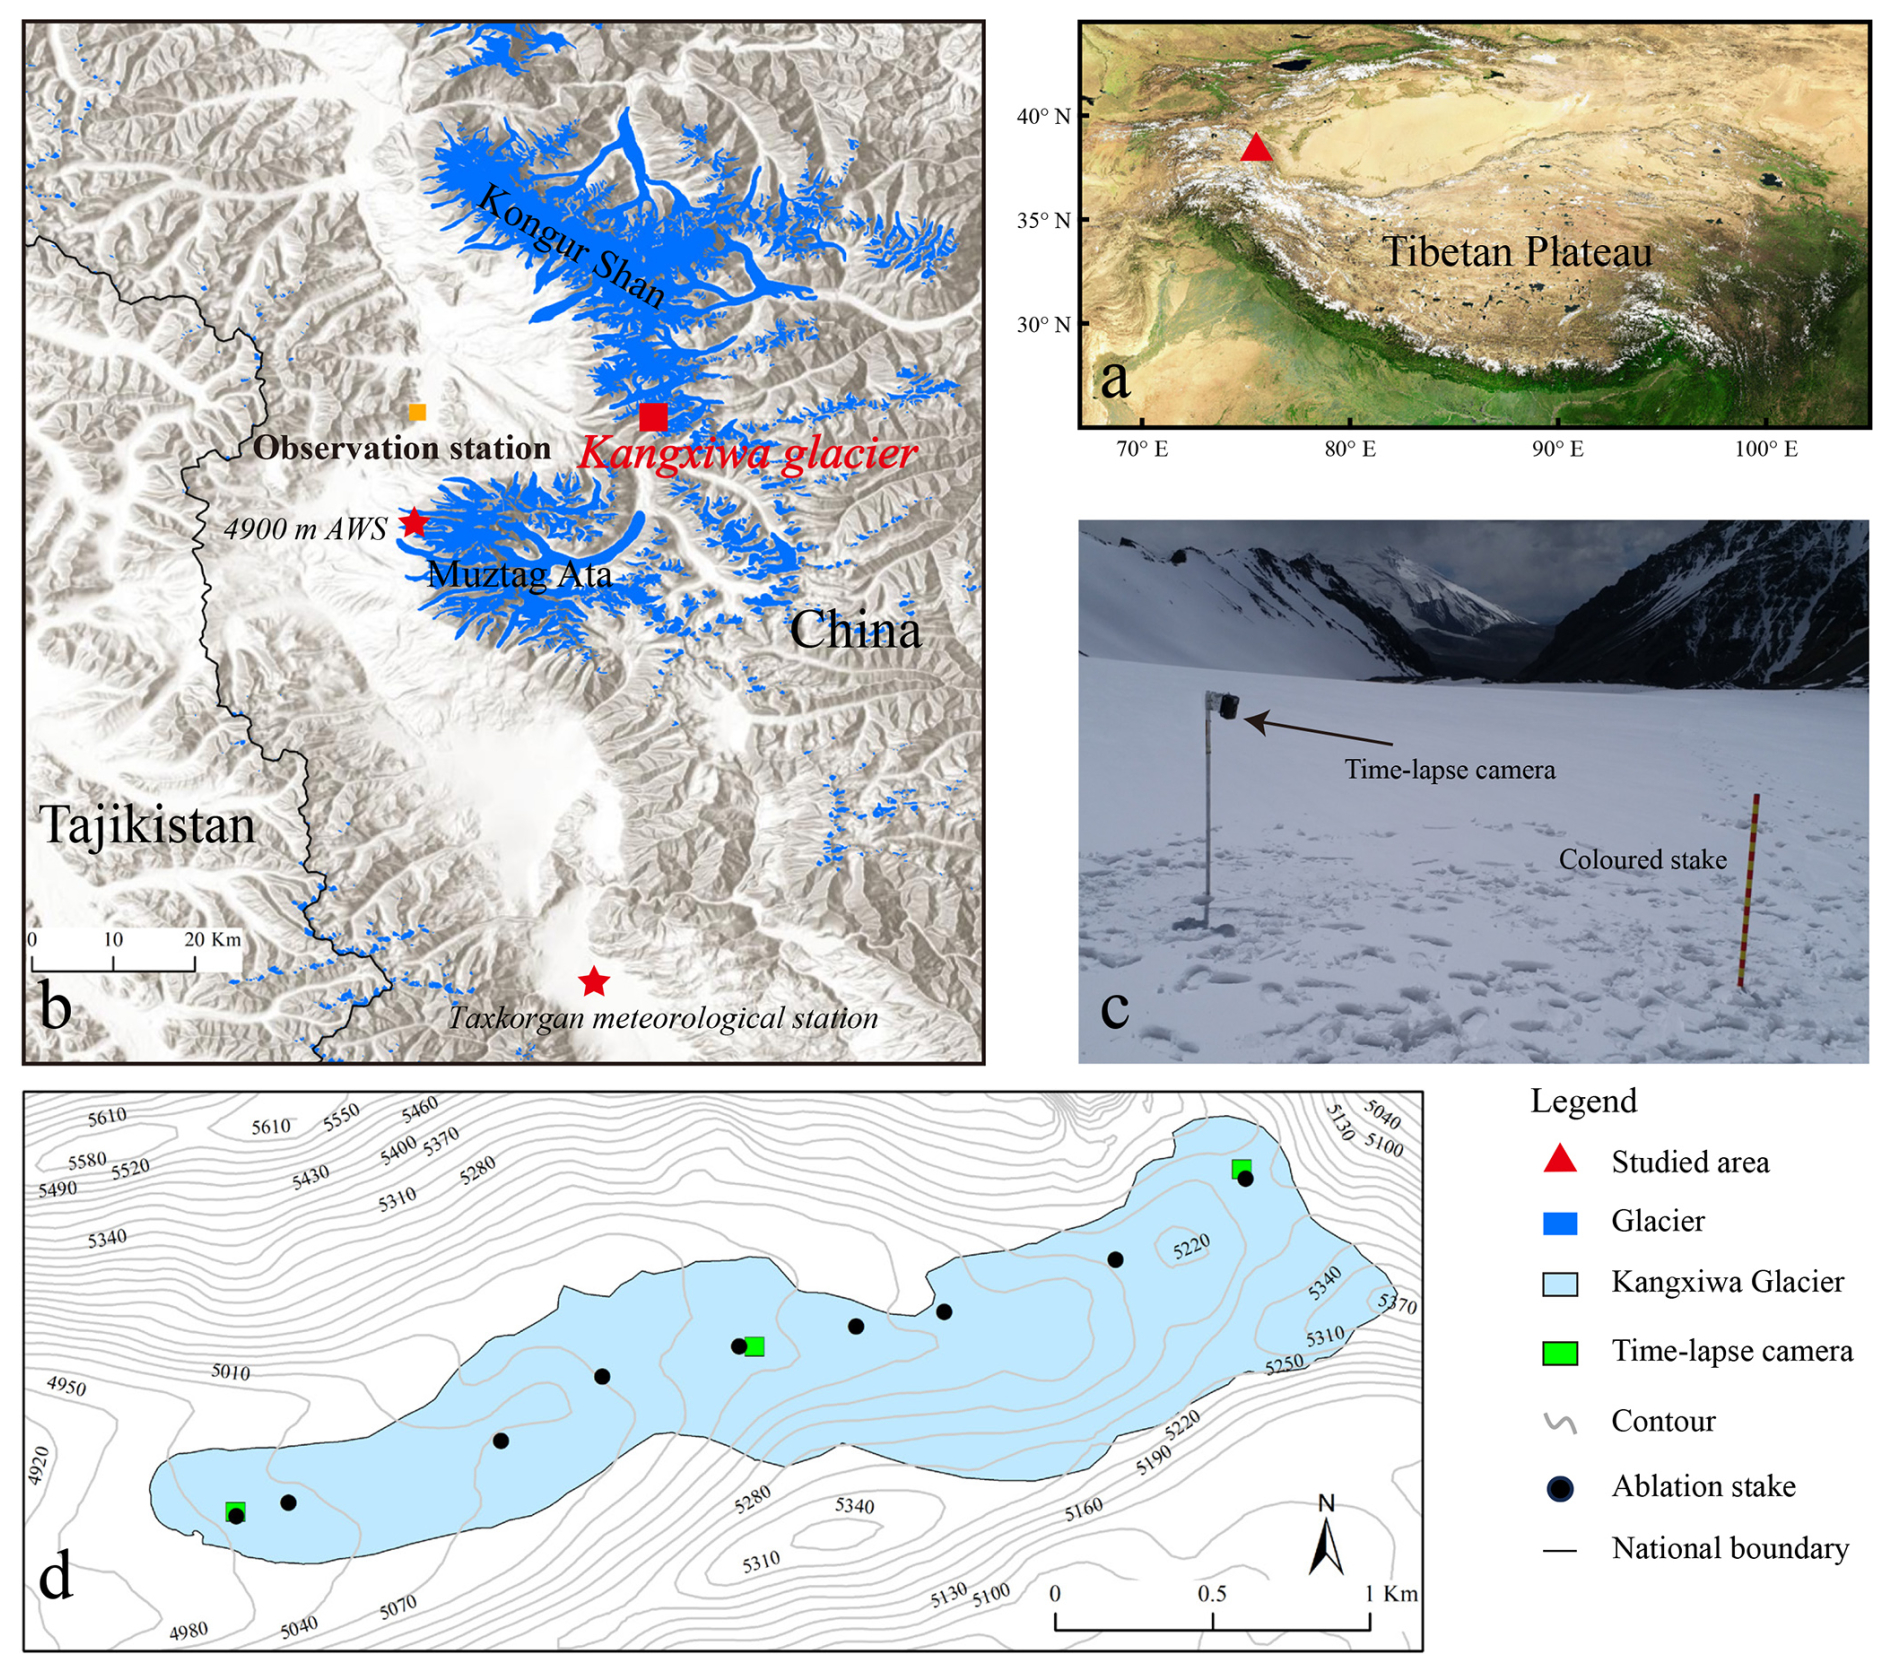
Figure 1Study region and the distribution of in-situ measurements. (a) Location of the studied area in the eastern Pamir, Central Asia; (b) the location of Kangxiwa Glacier (red square), Automatic Weather Station (AWS) at the elevation of 4900 m and Taxkorgan meteorologic station (red stars); the background is from World hillshade layer (http://www.arcgis.com, last access: 10 September 2025) and the glacier outline was obtained from the Randolph Glacier Inventory (RGI 7.0); (c) photograph of the time-lapse camera and colour-coded stake on the Kangxiwa Glacier at 5300 m a.s.l. (20 June 2020); (d) topographic map of the Kangxiwa Glacier showing the locations of three time-lapse camera monitoring systems and the ablation stakes for in-situ surface mass balance observations.
Kangxiwa Glacier (38.28° N, 75.28° E) is a debris-free valley glacier on the western slope of Kongur Shan, extending from 5350 to 4960 m a.s.l. with an area of 1.86 km2 and length of ∼3 km. This glacier was selected as the benchmark glacier for long-term measurements (Yao et al., 2022). Geodetic estimates indicate that the average mass balance of Kangxiwa Glacier was m water equivalent (w.e.) and a near-balanced regional glacier mass state ( m w.e.) in the whole eastern Pamir during 2000–2019 (Hugonnet et al., 2021), with mass loss of m w.e. during 2019–2022 (Falaschi et al., 2023) and a low area shrinkage rate of % per decade from 2000 to 2017 (Li et al., 2022).
3.1 Surface mass balance measurements by stakes and snow pits
Glaciological observation of Kangxiwa Glacier has been conducted by the Muztagh Ata Station for Westerly Environment Observation and Research, Chinese Academy of Sciences (Fig. 1b) since the 2010/2011 hydrologic year. Nine ablation stakes were installed along the central flow line of the Kangxiwa Glacier to measure point-scale surface mass balance following standard glaciological methods in this research (Cogley et al., 2011; Kaser et al., 2003). In-situ measurements of stake exposure height, snow stratigraphy, and snow density were conducted at the onset (early June) and the end (late September) of each ablation season (Fig. 1d). Ice density was assumed to be 900 kg m−3 (Huss, 2013). Seasonal (winter and summer) and annual point mass balance were derived for the 2019/2020 to 2022/2023 balance years. These annual and seasonal mass balances serve as ground truth for validating the accuracy of daily surface mass balance retrieved from time-lapse camera observations in this study.
3.2 Surface mass balance monitoring by time-lapse camera
3.2.1 Time-lapse camera monitoring systems
Three time-lapse camera systems were deployed at the glacier terminus (5005 m a.s.l.), mid-glacier (5137 m a.s.l.), and accumulation zone (5300 m a.s.l.) (Fig. 1d). The monitoring system adhered to methodologies established in prior research (Landmann et al., 2021; Cremona et al., 2023), integrating color-coded aluminum stakes and time-lapse cameras to quantify the stake melt-out length. The aluminum stakes were marked at 5 cm intervals with alternating red and yellow bands (Fig. 1c), installed vertically on the glacier surface and photographed hourly by fixed-position Forsafe H801 time-lapse cameras. The distance between each stake and its corresponding camera was approximately 6–10 m. Powered by 8 AA batteries and a solar panel, the cameras ensured continuous field operation. Featuring waterproof specifications, the camera captured images in JPEG format and stored them on a microSD card. In this study, cameras at 5137 and 5300 m began operation on 1 October 2019 and the camera at 5005 m started on 20 June 2020. Seasonal maintenance included the replacements of stakes, microSD cards and batteries.
3.2.2 Changes of stake melt-out length
A semi-automatic procedure was developed to measure the stake melt-out length, focusing on addressing the challenge of illumination variation in natural environments. The Hue-Saturation-Value (HSV) colour space was used for image processing because it separates luminance from colour information, unlike the standard RGB colour space where intensity and colour are intermingled. In the HSV method, H represents the colour type, such as red, yellow or blue; S refers to the purity of a colour, describing how much a pure colour is diluted with white light; and V represents the colour's brightness, ranging from black to white. These characteristics make HSV particularly suitable for analysing and segmenting images captured under diverse lighting conditions (Ganesan et al., 2014; Hamuda et al., 2017; Yu et al., 2021).
Prior to image processing, photographs taken between 12:00 and 19:00 (UTC+8) were selected to ensure optimal lighting, and blurry images taken during heavy snowfall were manually excluded. A fixed frame was then defined to encompass the stake, leveraging its stable position across consecutive shots (Fig. 2a). Stake contour detection relied on exploiting the difference in saturation values between the stake and the glacier surface (Fig. 2b). This involved applying a Gaussian filter to suppress high-frequency noise, followed by a morphological top-hat filter on the S-channel of the HSV colour space to enhance differentiation between the stake and the background. The method proposed by Otsu (1979) was used for automatic thresholding during S-channel binarization, with the largest connected region selected as the stake in order to eliminate minor segmentation artefacts.
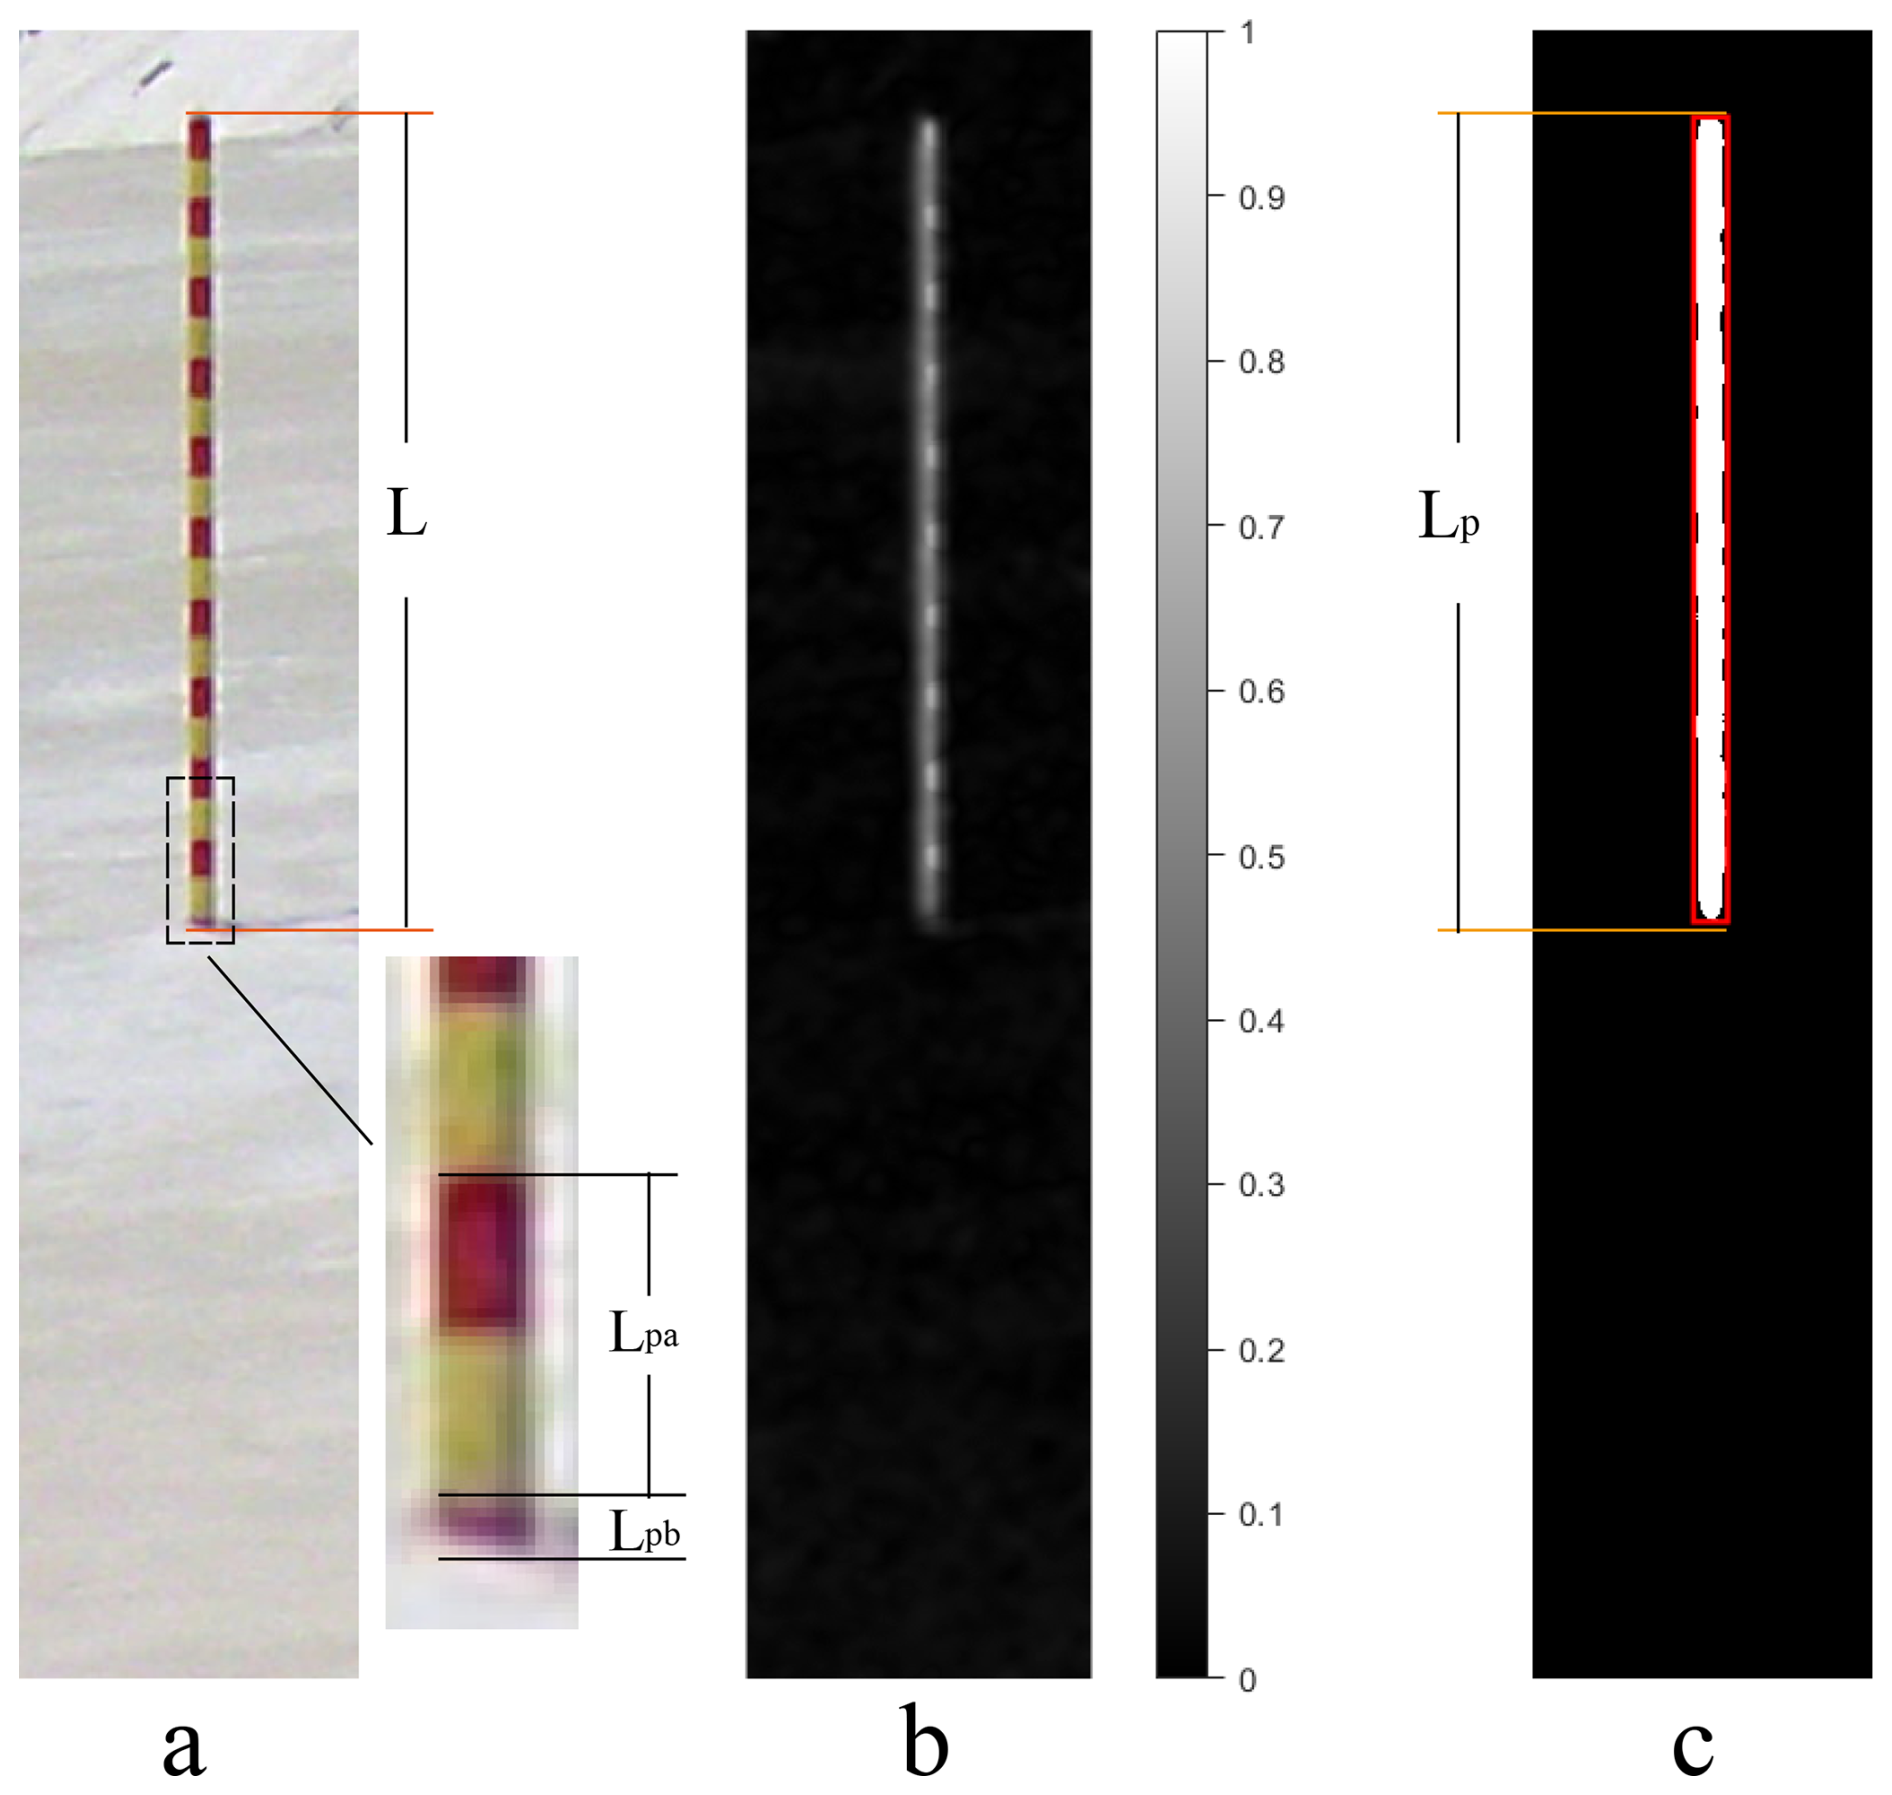
Figure 2Illustration of image processing workflow. (a) Original image with a frame and a zoomed inset of the coloured stake bottom. (b) Grayscale representation of the S channel from the HSV colour space; (c) calibration stake contour with a red minimum bounding rectangle.
The pixel length of the stake (Lp), which is defined as the height of the minimum bounding rectangle (Fig. 2c), was converted to a real-world length in centimetres (L) using a linear relationship (Fig. S1 in the Supplement). This relationship was established through a comparative analysis of Lp and L in reference images. Reference images were manually selected to cover the full measurement range of Lp. For each reference image, L was manually calculated by incorporating the total number of visible coloured bands (N), the pixel length of the bottom section (Lpb), and the pixel lengths of the two adjacent upper bands (Lpa), which were manually counted and measured, respectively (Eq. 1). Figure S1 shows the significantly linear relationships between L and Lp of the reference images for each monitoring period at each monitoring site.
The performance of stake melt-out length derived from time-lapse cameras was validated by comparing with manually camera photo inspection and tape measurements during field campaigns (Fig. S2). During the image selection for manually inspection, the reference images were excluded to ensure the independence of the validation dataset. The semi-automated procedure demonstrated strong agreement with both methods, yielding a range of −3 to 2 cm across the validation samples. These comparisons highlight the robustness of the time-lapse camera-based semi-automated workflow for quantifying stake melt-out length variations.
3.2.3 Glacier mass balance derived from stake melt-out length
The daily changes in the stake melt-out length recorded by three cameras were converted into changes in mass balance by multiplying by the corresponding density for different surface conditions (snow vs. bare ice) through visual inspection of the photos (Fig. S3). For bare ice, a density of 900 kg m−3 was used. For snow surfaces, a mean snow density of 405 kg m−3, which was the average density of snow pits measured at the three monitoring sites over the period 2020–2023, was applied. To account for uncertainty from snow density, two boundary values of 286 and 587 kg m−3, which were the minimum and maximum snow densities measured during the onset and late ablation season, were incorporated into the analysis. Limited data gaps were interpolated using adjacent measured values. The data gap at the 5005 m site from 1 October 2019 to 20 June 2020 was filled via daily mean mass balance value derived from the corresponding stake measurements.
Glacier-wide daily mass balance was then derived by area-weighted sum of point-scale mass balance estimates from the three cameras. A 30 m resolution SRTM DEM was employed to quantify the area distribution with its elevations. The cameras were deployed near the terminus, middle and upper region of Kangxiwa Glacier, allowing the entire glacier to be partitioned into three distinct zones centered approximately on each camera's installation site. These three zones corresponded to the elevation ranges of 4960–5080 m (area weighting factor: 0.33), 5080–5200 m (area weighting factor: 0.38), and 5200–5390 m (area weighting factor: 0.29). Notably, each zone aligns with one camera deployment location and accounts for roughly one-third of Kangxiwa Glacier's total area. Kangxiwa Glacier features relatively flat topography (Fig. 1), and mass balance measurements from 9 ablation stakes further confirmed a linear elevation-dependent mass balance. These characteristics justified the extrapolation of glacier-wide mass balance from the limited set of point observations. Finally, the camera-derived mass balance estimates were validated against results obtained via traditional glaciological methods based on the 9 ablation stakes across the glacier.
3.3 Meteorological stations and the reanalysis data
A Campbell automatic weather station (38.28° N, 75.04° E, 4900 m a.s.l.; AWS4900; Fig. 1b) was deployed on the western slope of Muztagh Ata in 2011 at a similar elevation to the Kangxiwa Glacier terminus. It continuously recorded half-hourly measurements of wind speed, wind direction, air temperature, relative humidity, atmospheric pressure, incoming/outgoing shortwave and longwave radiation, and all-weather precipitation by T200B precipitation gauge (Zhu et al., 2018). This dataset was used to characterise the near-surface meteorological features of the study area over the past four years and identify extreme weather events. This provides a basis for explaining short-term abnormal changes in glacier mass balance. Data from the Taxkorgan Meteorological Station, located approximately 50 km south of Muztagh Ata, were used to analyse long-term climate change trends in the eastern Pamir.
To investigate the possible climate mechanism for abnormal glacier mass loss, this study also employed the fifth generation of reanalysis data from the European Centre for Medium-Range Weather Forecasts (ERA5) with 2.5° horizontal resolution, which has been widely used in climate research (Hoffmann et al., 2019; Song et al., 2024) and glacier change analyses (Zhu et al., 2024b). By analysing the spatial anomalies pattern of geopotential height, wind fields, and surface air temperature, we investigated the change of large-scale atmospheric circulation and discussed its possible influences on extreme weather events and the subsequent responses of glacier surface mass balance.
4.1 Performance of glacier mass balance estimation based on time-lapse camera observations
Figure 3 shows a comparison of the cumulative point mass balance estimates derived from the time-lapse cameras and the glaciological method at the three camera sites (5005, 5137 and 5300 m) on the Kangxiwa Glacier during the period from 2019/2020 to 2022/2023 balance years. Figure 4a further presents the seasonal comparative performance of point-scale mass balance (winter and summer). Quantitative comparisons reveal that the mean seasonal mass balance differences between the two datasets at the three monitoring sites are −64, −13, and 2 mm w.e., with corresponding standard deviations of 193, 137 and 104 mm w.e., respectively. Over the entire observation period, the mean discrepancies between the two datasets yield an overall mean of 26±149 mm w.e.. These discrepancies between the two methods could be largely attributed to temporal variations in snowpack density throughout the observation period.
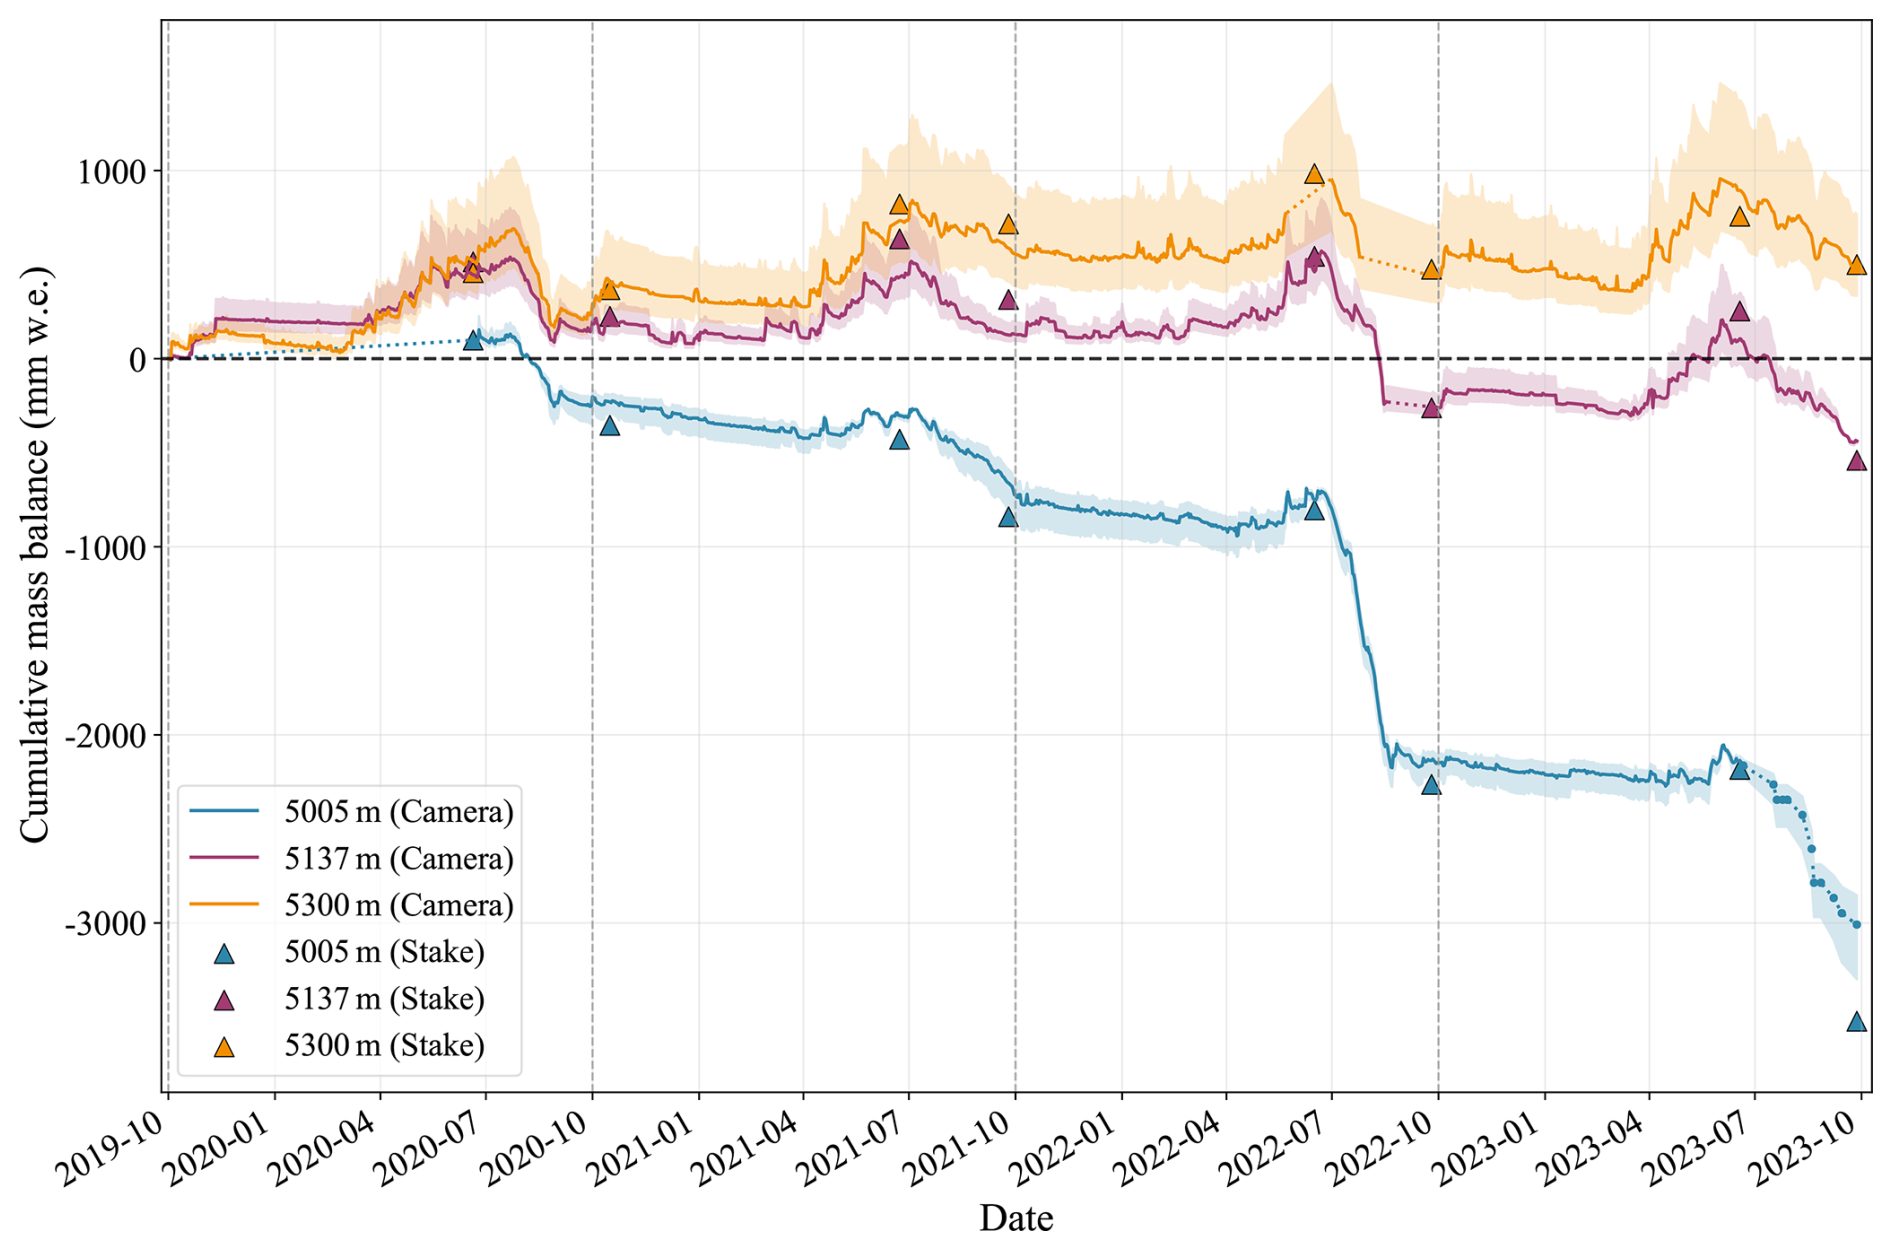
Figure 3Comparison of the cumulative mass balance estimated using time-lapse cameras (lines) and the glaciological methods (triangles) at the three locations (5005, 5137 and 5300 m) on the Kangxiwa Glacier. The thin dotted lines denote gap-filled data.
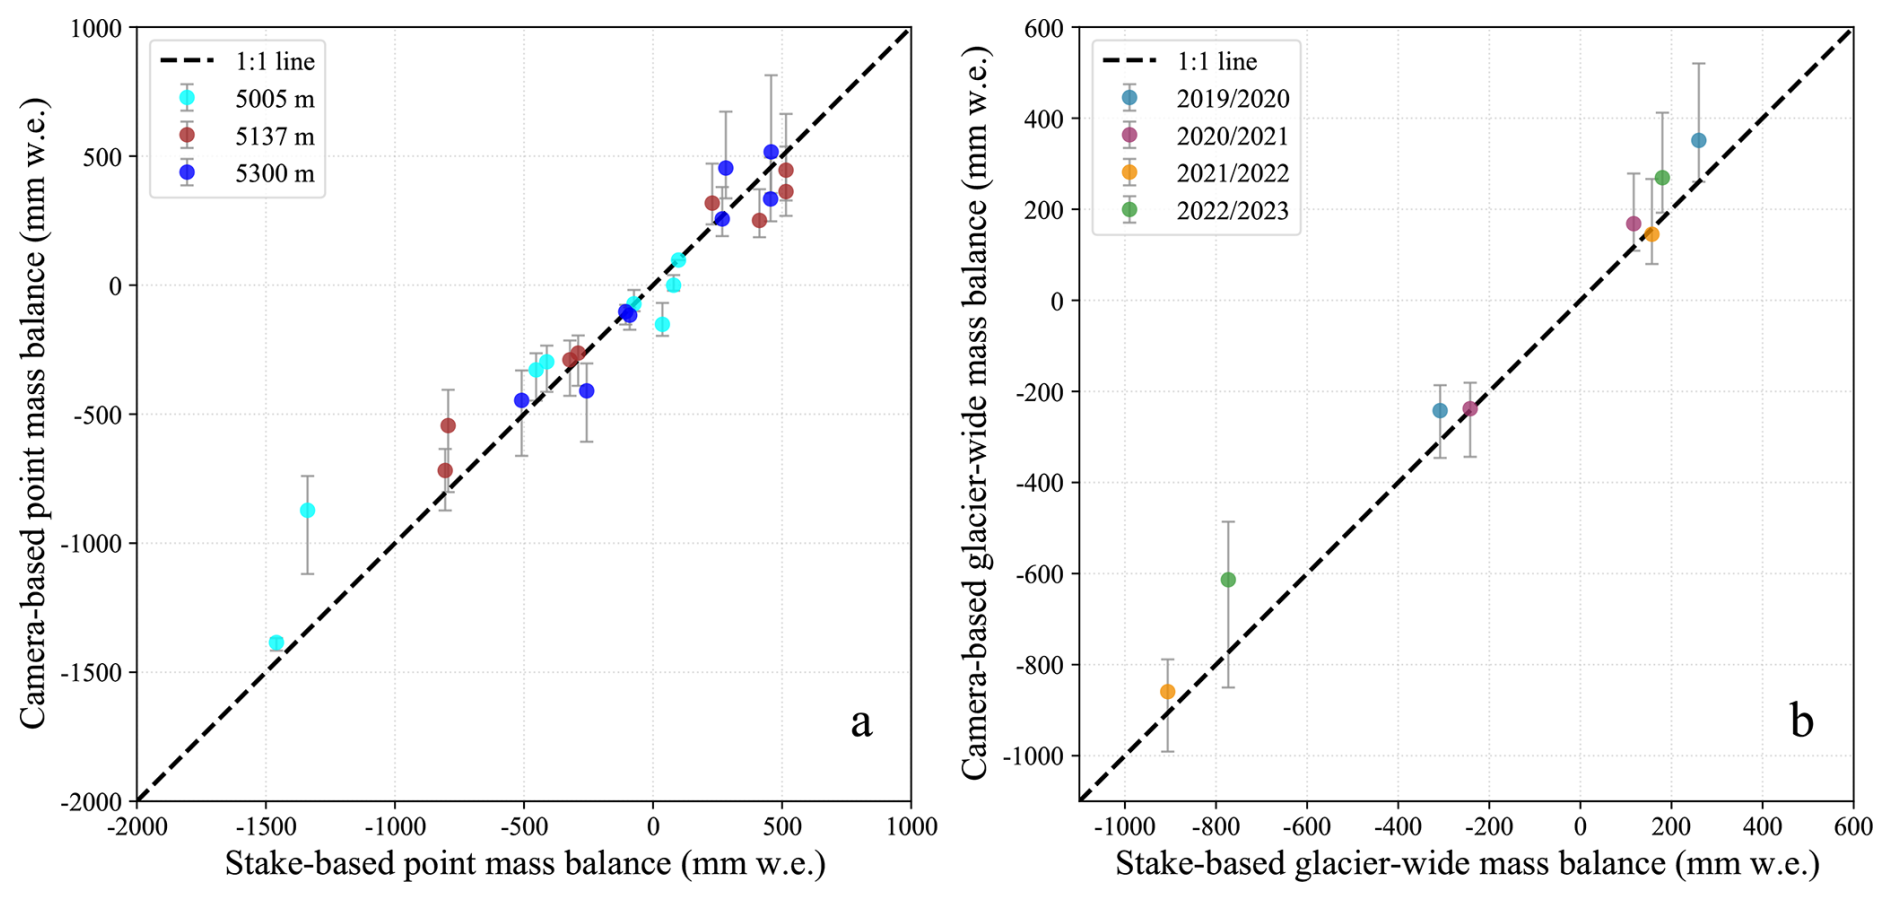
Figure 4The comparison of seasonal point-scale mass balance (a) and glacier-wide mass balance (b) measured by using the stake method and the time-lapse photography on the Kangxiwa Glacier. The vertical bars represent the uncertainty bounds of camera-based results which were derived from the minimum and maximum snow densities, respectively.
At the glacier-wide scale (Fig. 4b), the camera-based seasonal mass balances exhibit a robust linear correlation with the stake-based counterparts (e.g., R2=0.98), with almost all in-situ stake-based values falling well within the uncertainty bounds of the camera-based estimates. The mean discrepancy between the two datasets is 62±54 mm w.e., indicating high consistency between the camera-based method and the glaciological stake method. This robust agreement not only validates the reliability of time-lapse camera observations for quantifying glacier mass balance but also establishes a solid foundation for investigating temporal evolution characteristics of glacier-wide mass changes for the Kangxiwa Glacier.
4.2 Evolution of glacier surface mass balance during the 2019/2020–2022/2023 hydrological years
Figure 5a compares the annual cumulative changes in the glacier-wide surface mass balance of the Kangxiwa Glacier during the 2019/2020–2022/2023 hydrological years, which can be broadly categorised into three phases: a balance period from October to mid-April, a snow accumulation period from mid-April to June/July, and an intense ablation period from June/July to September. During the balance period, low temperatures and low precipitation resulted in limited changes in the stake melt-out length, with the cumulative mass balance fluctuating between −78 and +188 mm w.e. The slight surface mass loss observed during this period was likely caused by sublimation or mechanical snow drift driven by strong winter wind, as evidenced by the transition of snow-covered surfaces to exposed bare ice under cold winter conditions (Fig. S3). During the accumulation period (mid-April to June/July), the glacier experienced different maximum snow accumulation across the entire glacier ranging from 258 to 445 mm w.e. At an elevation of 5300 m a.s.l., maximum snow depth reached 1.0–1.5 m (Fig. S3). Notably, monthly accumulation peaks generally occurred in May (Fig. S4).
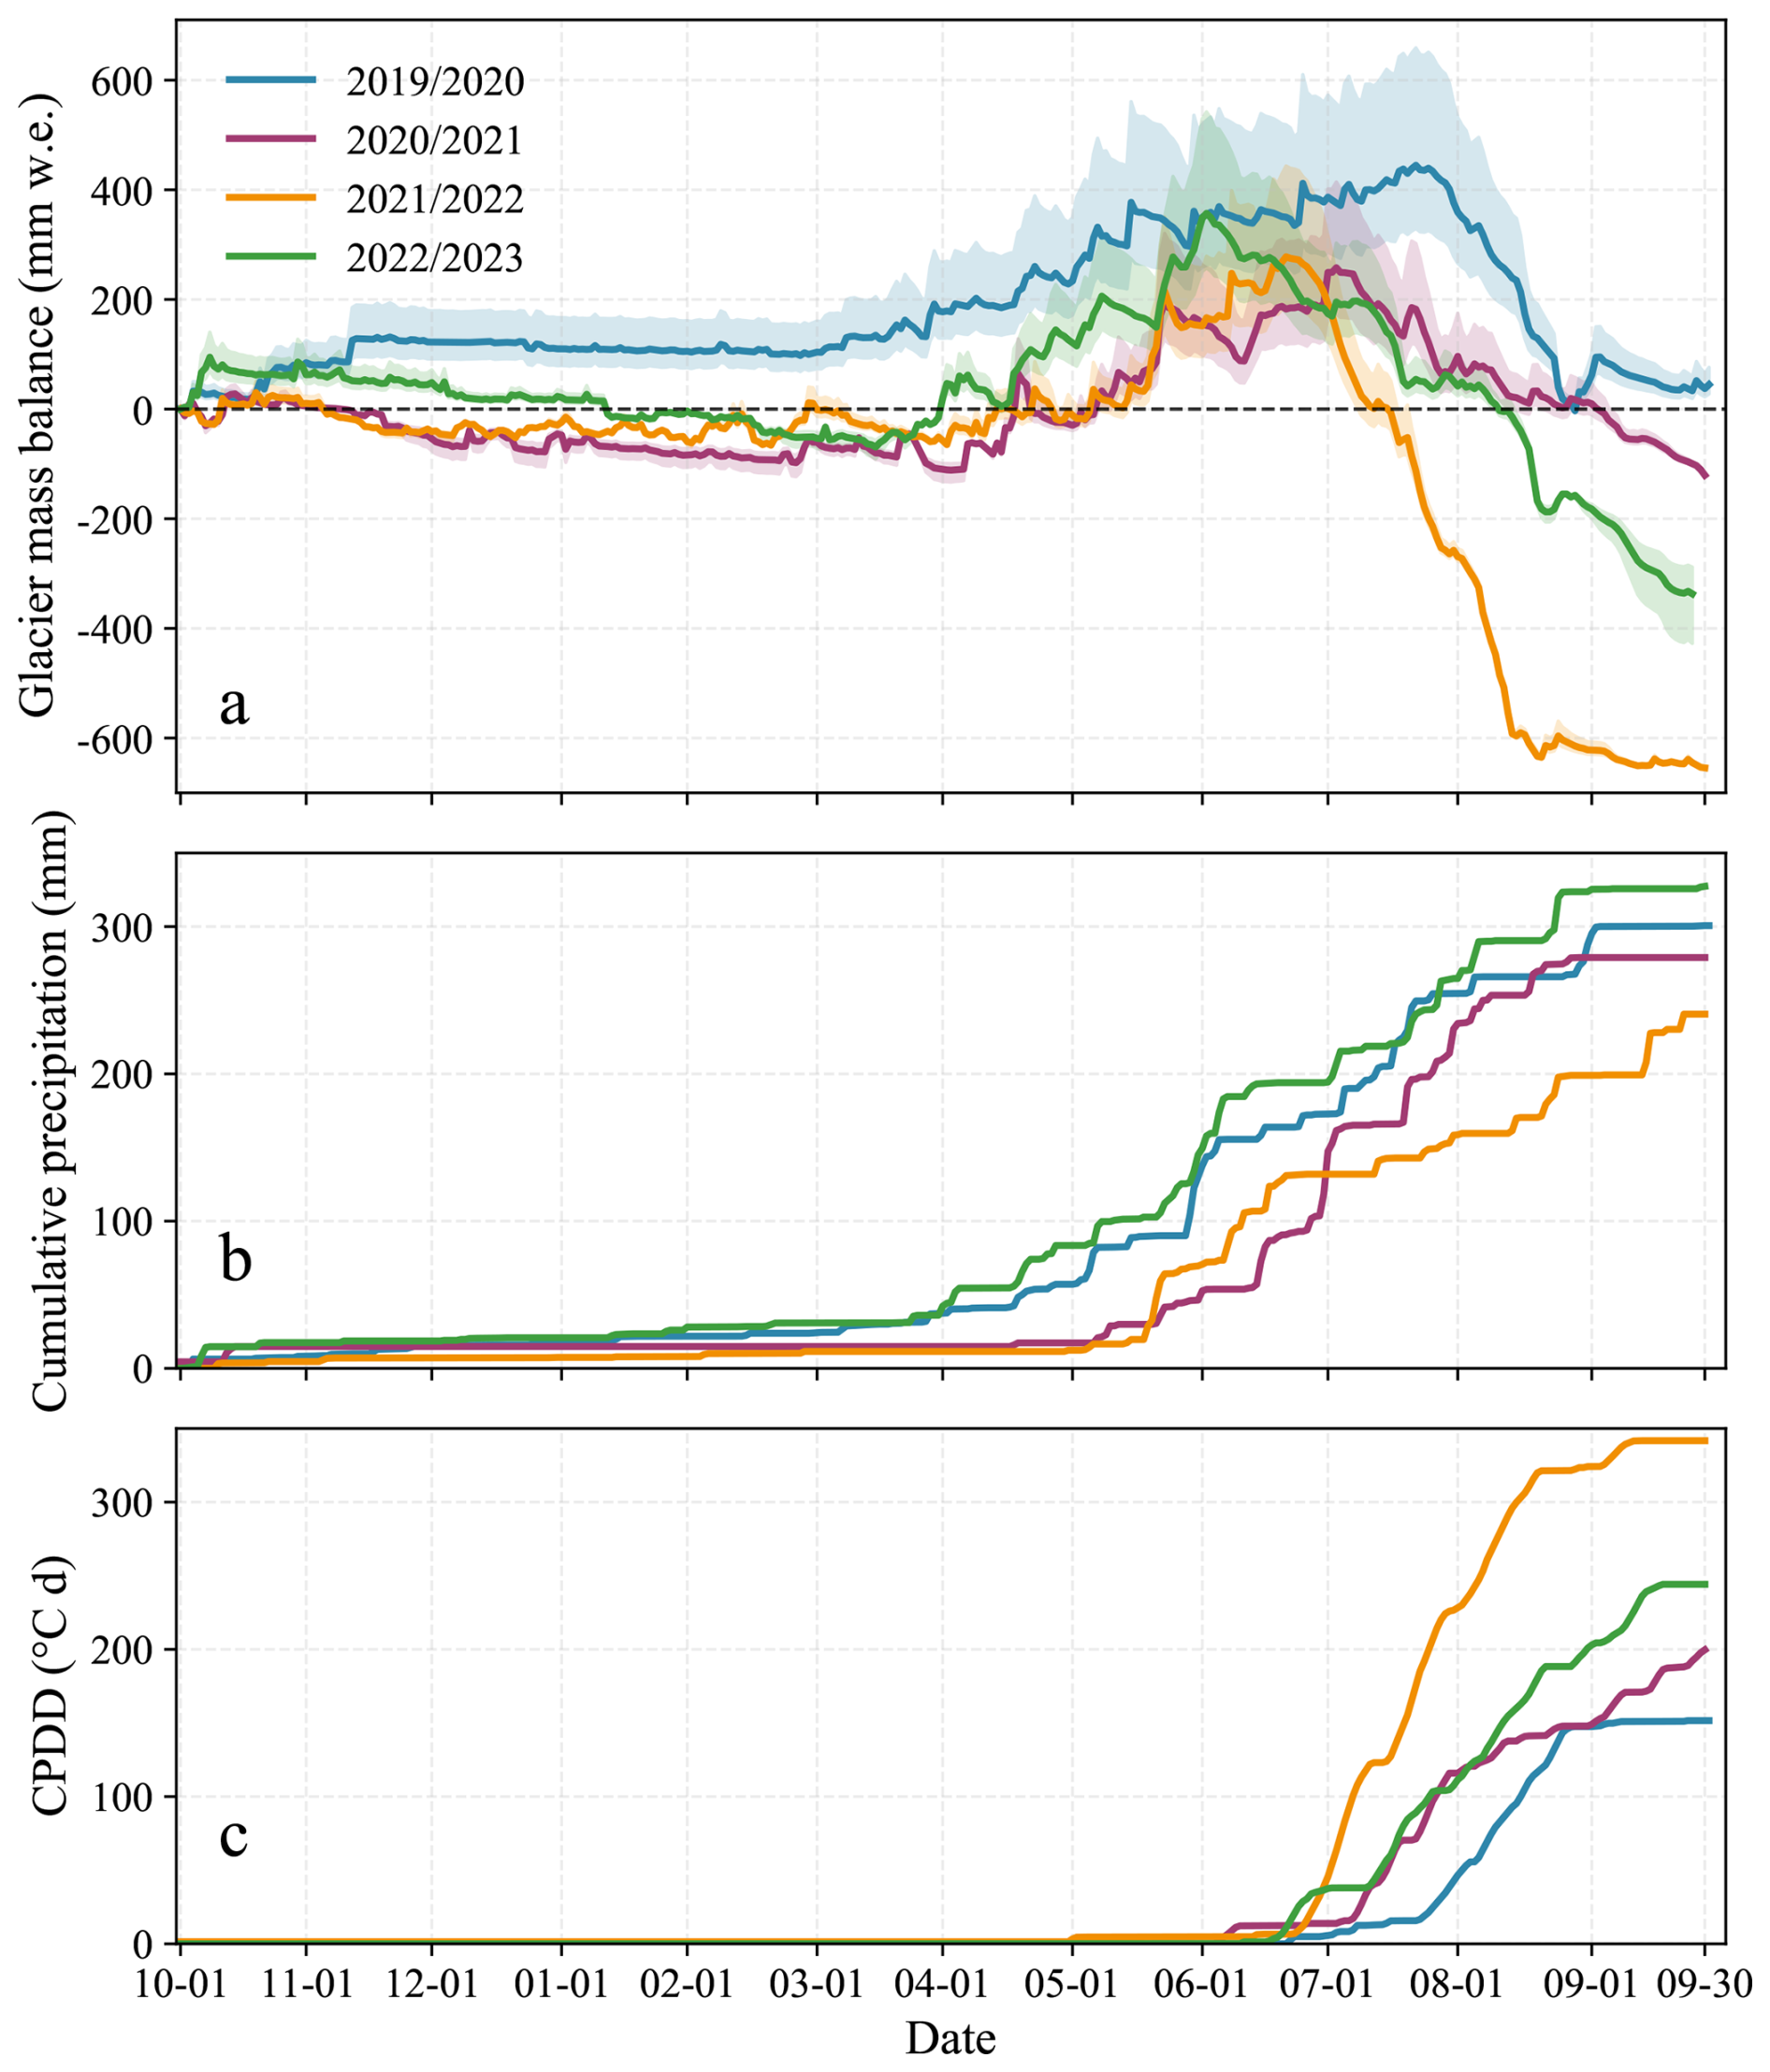
Figure 5Cumulative glacier-wide mass balance of the Kangxiwa Glacier during the 2019/2020–2022/2023 hydrological years with the uncertainties by shaded area (a). The cumulated precipitation (b) and the cumulated positive degree day recorded by the AWS4900 (c).
The phase of glacier mass loss is predominantly confined to the period from June/July to September, with significant interannual variability manifested in multiple key aspects. First, the onset of surface mass loss – after the annual maximum net accumulation is reached – exhibits substantial interannual differences: the earliest initiation was observed on around 2 June 2023, whereas the latest occurred around 22 July 2020. The Glacier Loss Day – defined as the date when the net mass balance transitions to negative and all winter snow accumulation is depleted (Voordendag et al., 2023) – occurred on around 11 July 2022, approximately one month earlier than in other years (e.g., ∼ 3 September 2021; ∼ 26 August 2023). Notably, no Glacier Loss Day was recorded in the 2019/2020 hydrologic year, a phenomenon attributed to abundant winter-spring snow accumulation coupled with relatively low summer air temperature (Fig. 5b, c). The earliest Glacier Loss Day in the 2021/2022 hydrologic year was partly caused by the lowest precipitation in the accumulation season. Specifically, the AWS4900 shows that the cumulative precipitation for the 2021/2022 hydrologic year was only 131.8 mm until 11 July, while the corresponding values were 195.9, 165.1, and 218.7 mm for the 2019/2020, 2020/2021, and 2022/2023 hydrologic years, respectively.
Beyond the timing of ablation onset, the duration of glacier mass loss also exhibits marked interannual variability. Specifically, it was approximately 40 d in 2020 (from ∼ 23 July to 30 August), 80 d in 2021 (11 July to 30 September), 58 d in 2022 (26 June to 22 August), and 120 d in 2023 (2 June to 30 September). Another interannual variability lies in the magnitude of annual surface mass loss, with values of −414, −334, −907 and −694 mm w.e. in the 2019/2020, 2020/2021, 2021/2022 and 2022/2023 hydrologic years, respectively. The most significant mass loss occurred in July–August 2022 (Fig. 5), with the mass loss in July 2022 being four times greater than the mean for the three other years. AWS4900 records indicate that interannual fluctuations in both air temperature and precipitation were the primary drivers of significant differences in both the duration and intensity of surface mass loss during the 2019/2020–2022/2023 hydrological years (Fig. 5). The exceptional mass loss in 2022, for instance, coincided with an anomalous summer of pronounced warming and aridity. This is evidenced by the fact that cumulative positive degree days (CPDDs) at AWS4900 reached 341.7 °C d, which is 1.4–2.3 times higher than in the other three years, while total precipitation during July–August amounted to only 67.2 mm, approximately 50 % lower than the average for the corresponding period across the other three years.
The annual mass balance of the Kangxiwa Glacier exhibited significant variability throughout the study period. A slight positive balance was recorded in the 2019/2020 hydrological year (+45 mm w.e.), followed by a weak negative balance in 2020/2021 (−121 mm w.e.). This contrasts sharply with the substantial mass loss observed in the following two years: −654 mm w.e. in 2021/2022 and −337 mm w.e. in 2022/2023. Four-year observations revealed that the interannual accumulation differences of the Kangxiwa Glacier were limited to be ∼187 mm w.e., with the maximum accumulation of 445 mm w.e. in the 2019/2020 hydrological year and the minimum of 258 mm w.e. in the 2020/2021 hydrological year (Fig. 5). A comparative analysis between the 2019/2020 and 2021/2022 hydrologic years reveals that the 2021/2022 experienced less accumulation of 167 mm w.e. in winter season, but more ablation of 494 mm w.e. in summer season. These results emphasize that interannual variability in the glacier mass balance of Kangxiwa Glacier was predominantly driven by the variability in mass loss during the ablation season.
Meanwhile, linear altitudinal interpolation of two complementary datasets – camera-based point mass balances from three elevations and stake – based measurement from 9 ablation stakes – allowed for the quantification of the equilibrium line altitude (ELA) over the study period. The ELAs displayed significant interannual fluctuations: the highest ELA surpassed the glacier summit during 2021/2022 balance year, whereas the lowest ELA (5079–5086 m a.s.l.) occurred in 2019/2020.
4.3 Glacier response to the heatwaves in the summer of 2022
Both ERA5 reanalysis data and ground-based meteorological station observations revealed an unprecedented summer warming event in 2022 in the eastern Pamir, with the most pronounced anomaly recorded in July (Figs. 6 and S5). The ERA5 temperature data confirmed that the corresponding grid point of the Kangxiwa Glacier in July 2022 was the highest recorded between 1981 and 2024 (Fig. 6a). The AWS4900 records showed that the average July temperature during 2012–2023 was 2.9 °C, while it reached 6.2 °C in July 2022, constituting a substantial positive temperature anomaly (Fig. 6b). Additionally, daily maximum temperature recorded at Taxkorgan station during summer 2022 was significantly higher than the long-term mean for 1957–2023 (Fig. S5), with 61 % of days in July exceeding the 90th percentile of historical temperatures and satisfying the criteria for an extreme heat event as defined by Lu et al. (2024). This evidence indicates that July 2022 was characterized by significantly elevated temperatures relative to historical baselines. This exceptional climatic event provides a unique opportunity to analyse how glaciers respond to extreme heatwaves in the eastern Pamir.
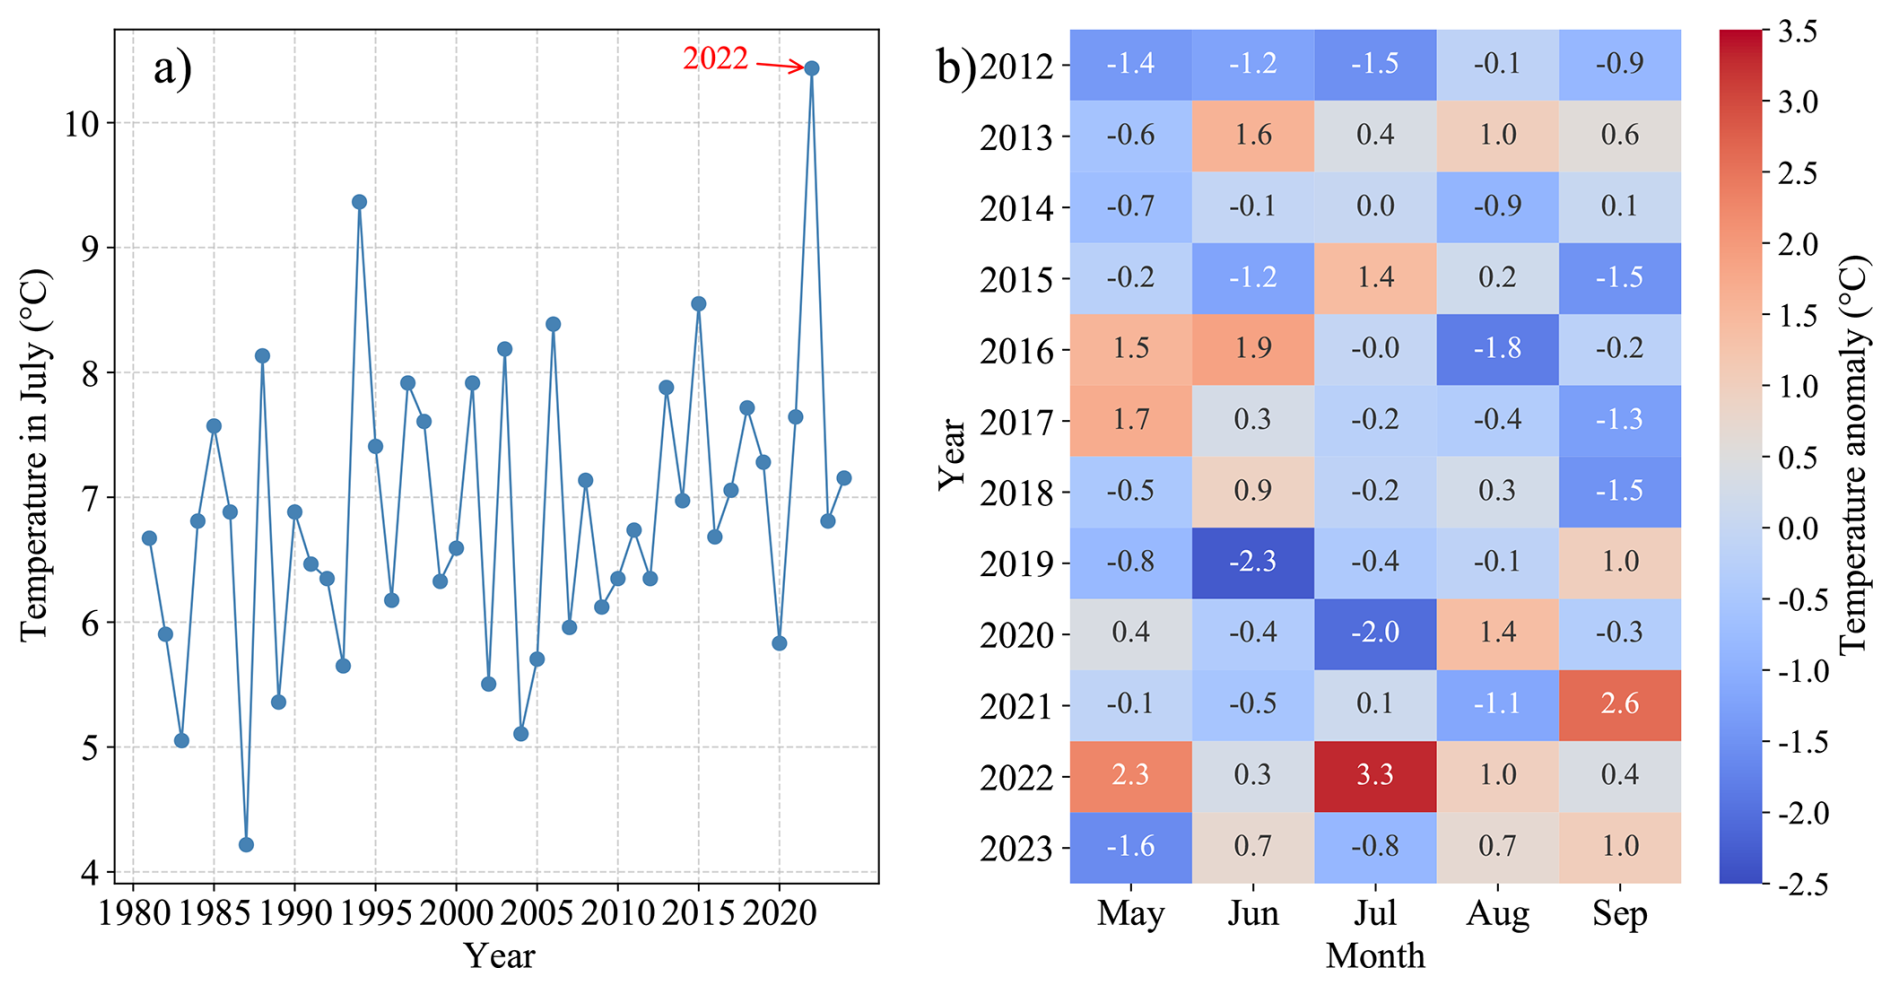
Figure 6Variation of mean ERA5 air temperature in July at the corresponding grid point of Kangxiwa Glacier during the period from 1981 to 2024 (a) and heatmap of monthly air temperature anomaly from May to September during 2012–2023 recorded by AWS4900 (b).
Based on AWS4900 records, three extreme heat events were identified between 26 June and 11 July, 18–30 July, and 5–17 August 2022 (Fig. 7). During the first two heatwaves, daily temperatures were 6.2 °C and 4.4 °C higher than the three-year average, with a maximum anomaly of +10 °C on 5 July (Fig. 7a). Concurrently, daily incoming solar radiation exceeded the average by 90.6 W m−2 (+31 %) and 48.7 W m−2 (+17 %) (Fig.7b), while total precipitation decreased by 40.4 mm (−100 %) and 31.3 mm (−76 %). These conditions, characterized by increased temperatures, reduced snow replenishment, and intensified solar radiation, drove anomalous mass loss (Figs. 5, 7). The first extreme event induced a mean mass loss rate of −16 mm w.e. d−1, whereas the three-year average for the same period exhibited a near-balanced state. The second heatwave exacerbated mass loss to −19 mm w.e. d−1, which is ∼4 times the three-year mean (−1 to −7 mm w.e. d−1). This significant ablation accelerated the depletion of spring-accumulated snow (Fig. 8) and thus contributed to the advance of the Glacier Loss Day by one month (Fig. 5).
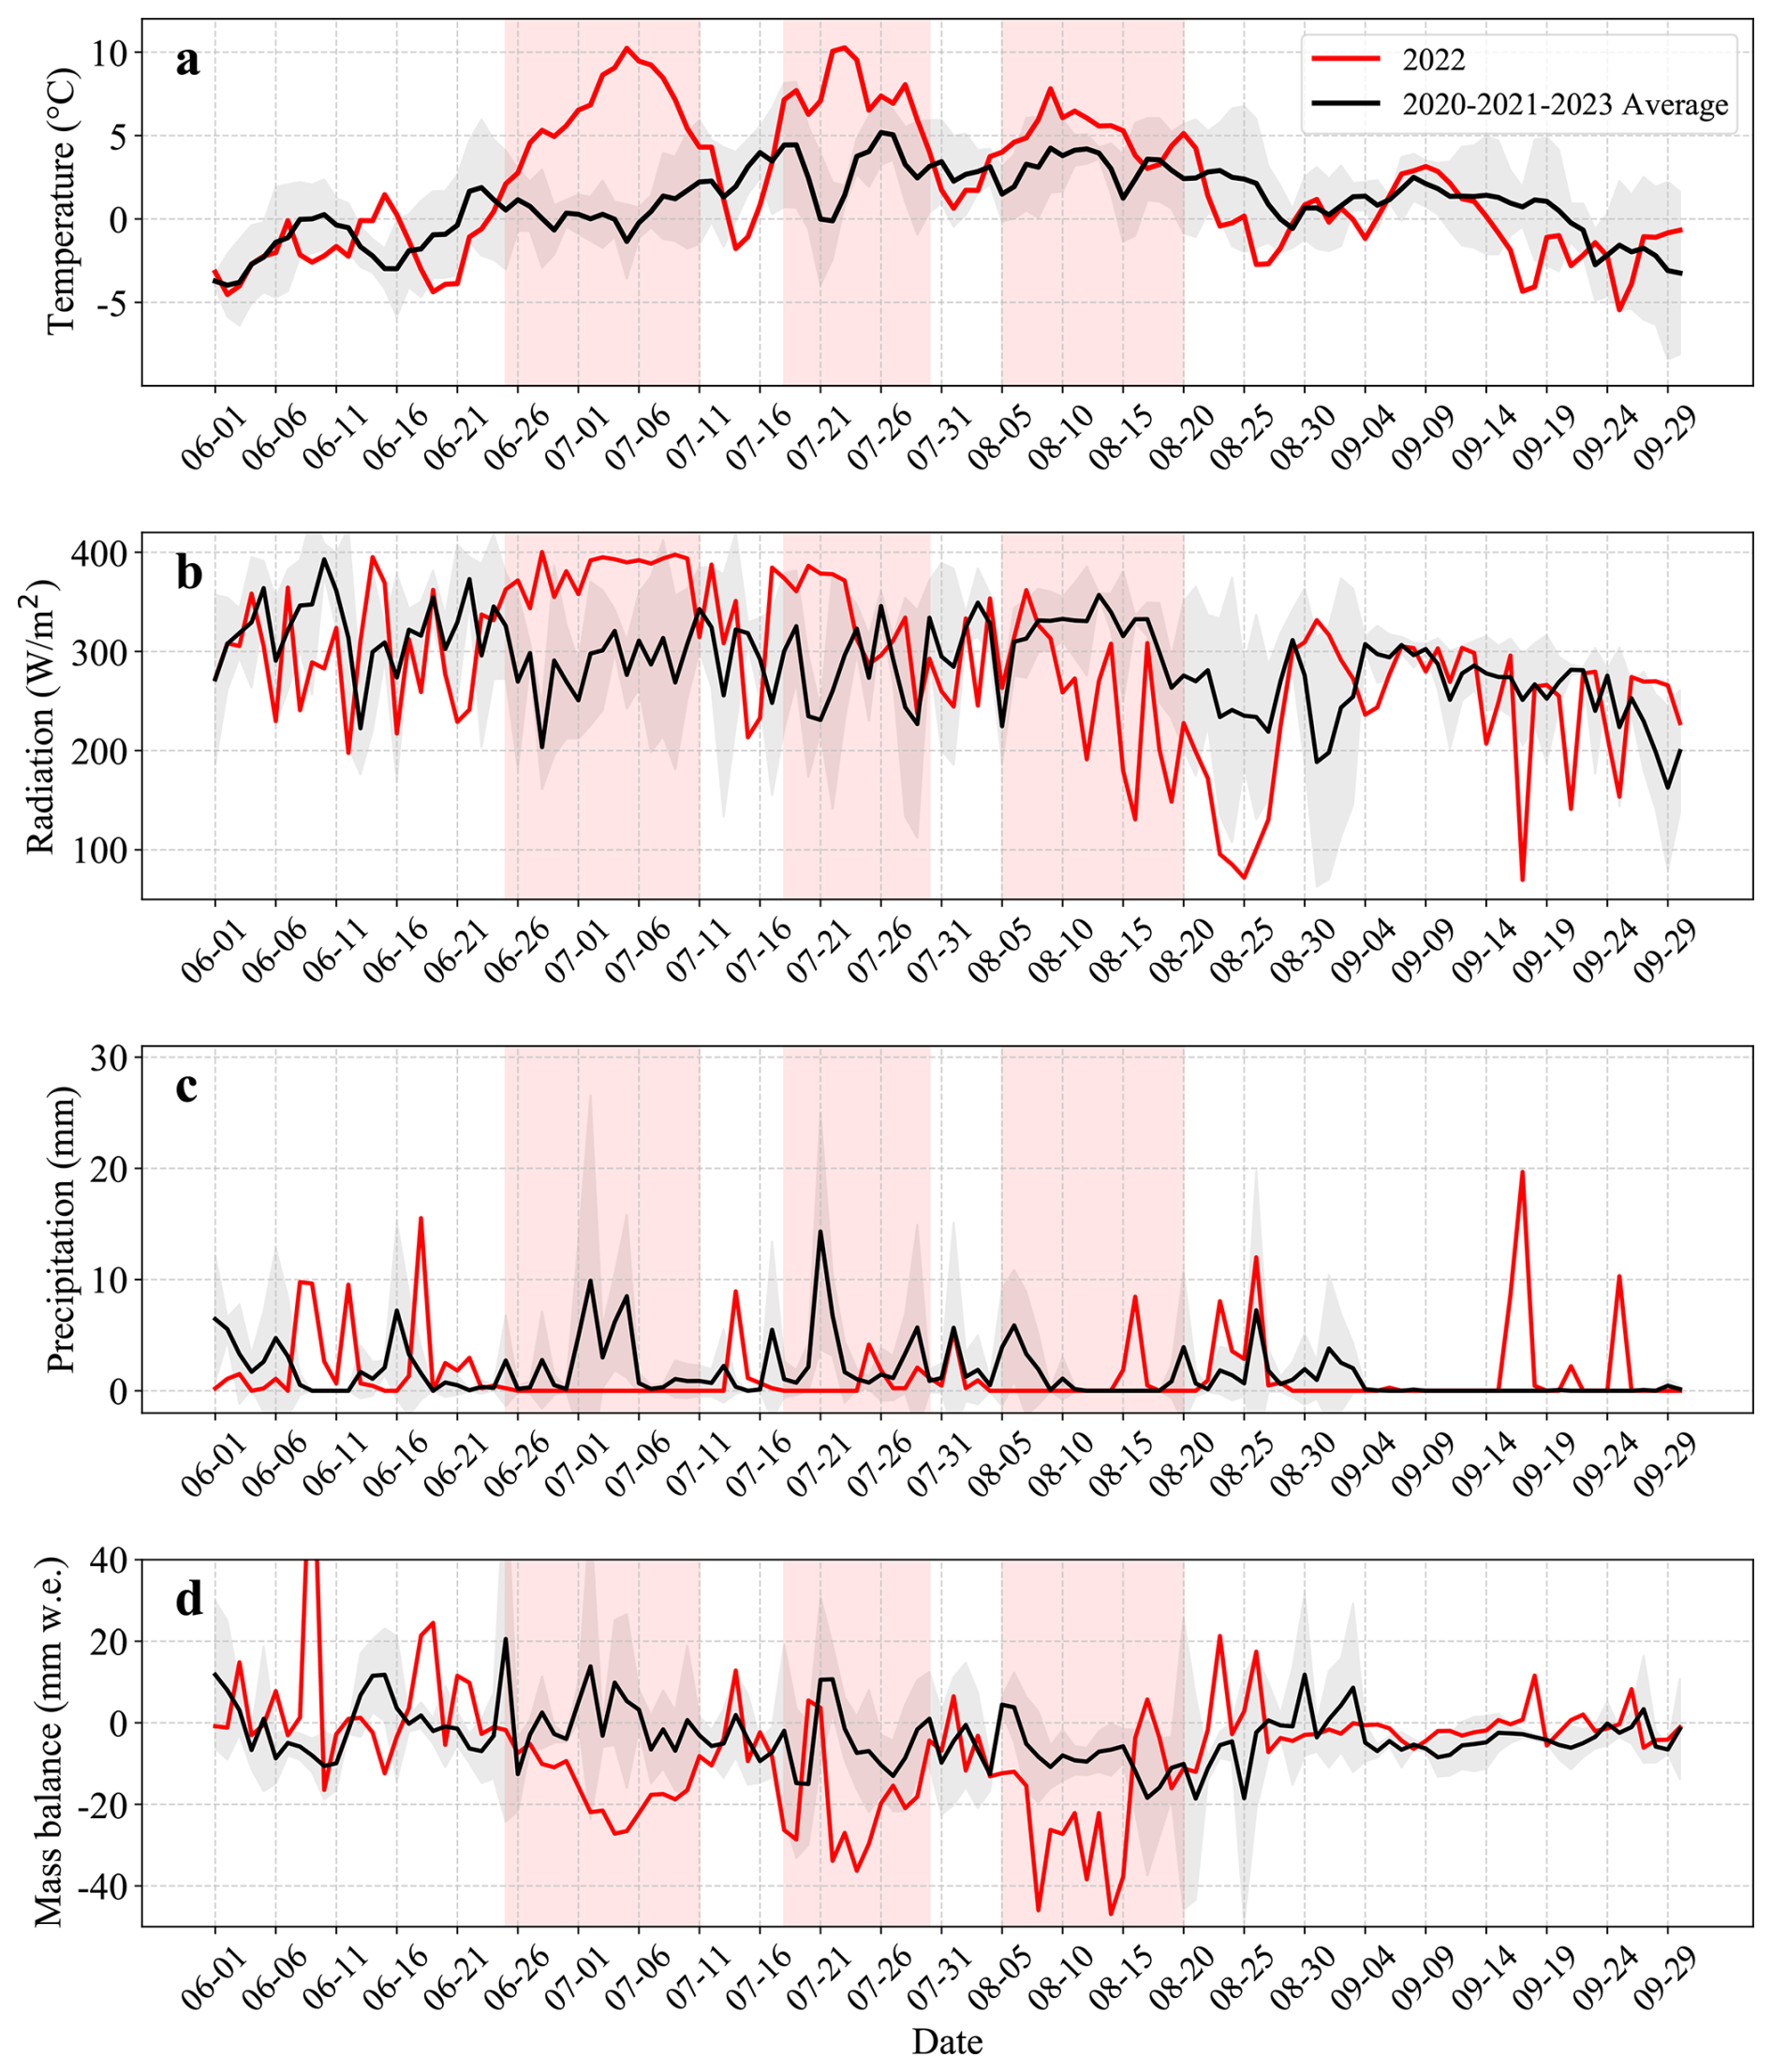
Figure 7Comparison of daily air temperature (a), daily incoming shortwave radiation (b), daily precipitation (c) and daily glacier-wide mass balance (d) at the Kangxiwa Glacier during the ablation season (June–September), showing the difference between 2022 and the other three years. The grey line shows the average for 2020, 2021 and 2023 with standardized variation (grey shaded area), while the red line shows the records for 2022. Light red rectangles highlight three heatwave events. The meteorological data was derived from the AWS4900.
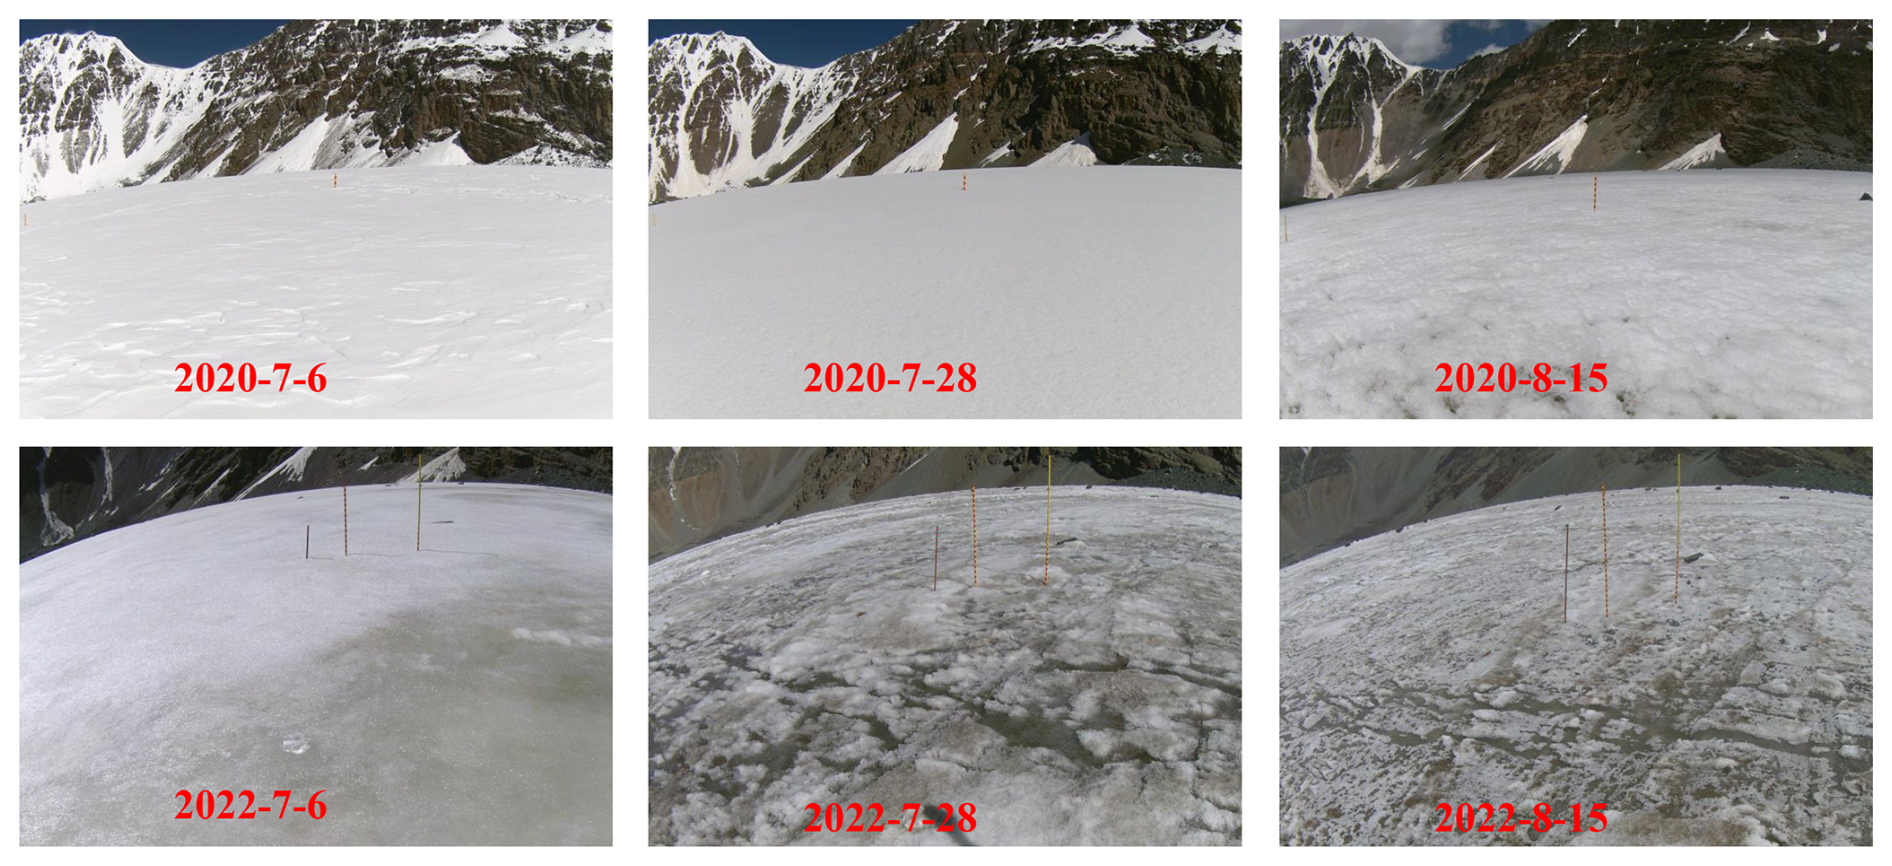
Figure 8Contrasting glacier surface conditions at the elevation of 5005 m between July–August 2020 and 2022.
The weather conditions during the August heatwave and the corresponding glacier response were obviously different from those during the two July heatwaves. The air temperature during the August heatwave was only 2.5 °C higher than the corresponding average of the other three years. The reduced shortwave radiation of 54.9 W m−2 (−17.1 %) and the increased longwave radiation of 26.1 W m−2 (+10.2 %) indicate the increased cloud cover over the eastern Pamir during this period (Liu et al., 2021). There was no significant change in precipitation. The August heatwave was therefore characterized by moderate warming and cloudy conditions. In contrast, the magnitude of mass loss during the August heatwave was even more intensive than those during the two July heatwaves (Fig. 7d). Mass loss intensity increased to 23 mm w.e. d−1 during the August heatwave, which is 16 mm w.e. d−1 higher than the mean value for the corresponding periods of the other three years.
Glacier surface melting is critically linked to the energy supply and the surface conditions. The precipitation phase may greatly influence the snow accumulation and the surface albedo condition (Jouberton et al., 2022). Seasonal snowfall and rainfall amount at each camera-monitored site for each hydrological year were estimated using the method proposed by Ding et al. (2014), combined with meteorological data from AWS4900 and the Muztagh Ata observation station (3650 m a.s.l.). Snowfall accounted for 94 % of total precipitation at the glacier terminus (5050 m a.s.l.), 96 % at the mid–glacier site (5137 m a.s.l.), and 99 % at the upper–glacier site (5300 m a.s.l.) in the warmest 2022. The scarcity of rainfall in summer season across the glacierized area indicates that precipitation phase transitions likely played a limited role in modulating the surface energy–mass balance. At the 5005 m site, the number of bare ice days from June to September reached 42 in 2021/2022, compared to 4, 23, and 13 d for the 2019/2020, 2020/2021, and 2022/2023 hydrologic years respectively. This marked increase in bare ice days enhanced glacier surface energy absorption, which partly explained the substantial mass loss in the summer of 2022. Given the moderate temperature anomaly and reduced shortwave radiation during the August heatwave, the intensive mass loss could be primarily attributed to the exceptionally low surface albedo of exposed ice (Fig. 8), which amplified solar radiation absorption and subsequent melt processes (Mölg et al., 2014).
5.1 Mass balance characteristics in the eastern Pamir
Glaciers in the Muztagh Ata have been in a near-equilibrium state since at least the 1970s (Kääb et al., 2015; Bolch et al., 2019; Brun et al., 2017; Holzer et al., 2015). Based on the high-resolution Pléiades stereo images, Falaschi et al. (2023) analyses the annual and seasonal glacier mass balance in Muztagh Ata and address that the mean mass loss of 2020, 2021 and 2022 was , , m w.e. Our measurements at the Kangxiwa Glacier in the Muztagh Ata region for the 2019/2020 and 2020/2021 hydrological years are consistent with the previous knowledge of near-equilibrium in this region (Yao et al., 2012; Falaschi et al., 2023; Bhattacharya et al., 2021; Hugonnet et al., 2021). However, the mass balance in 2021/2022 and 2022/2023 hydrological years displayed the significant mass loss. In particular, the mass loss in 2022 was the most negative and agrees well with the reported unprecedented mass loss of the Urumqi No. 1 Glacier in the eastern Tien Shan (Xu et al., 2024) and the notable mass loss in the European Alps (Berthier et al., 2024; Cremona et al., 2023; Voordendag et al., 2023). Similar to the Swiss glaciers, the equilibrium line altitude of the Kangxiwa Glacier rose above the glacier summit in 2022 due to heatwaves. Extremely high air temperatures covered Eurasia and North America, with long-lasting extreme heat events affecting China (Lu et al., 2023). During the summer of 2022, three heatwaves within a 40 d period caused a mass loss equivalent to over 90 % of the total ablation losses for the season, demonstrating the pivotal role of heatwaves in driving local glacier ablation in this region. Similar regional heatwaves around the world (Colucci et al., 2017; Perkins-Kirkpatrick and Lewis 2020; Zhang et al., 2025) pose substantial threat to mountain glaciers. Such significant mass loss by short-time heatwaves could influence the long-term changes of glacier ablation.
We further compared the annual mass balance of the Kangxiwa Glacier with those of nearby glaciers from 2019/2020 to 2022/2023 (WGMS, 2025), including Zulmart Glacier (Glacier No. 139) and Glacier No. 457 in the Pamir, as well as Abramov Glacier in the Pamir Alay. The annual mass balance of Zulmart Glacier, which is about 200 km northwest of Kangxiwa Glacier, was −210, −206, −311, and −271 mm w.e. for the 2019/2020, 2020/2021, 2021/2022, and 2022/2023 hydrologic years, respectively. Similar to the Kangxiwa Glacier, the Zulmart Glacier also exhibited the most negative mass balance in 2022, which is likely attributed to the same impact of extreme high temperatures in July. In contrast, neither the Abramov Glacier nor the No. 457 Glacier showed similar patterns. These contrasting mass loss patterns are likely modulated by divergent climatic regimes and topographic conditions, which influence mass change patterns and climatic sensitivities across the Pamir (Brun et al., 2019; Wang et al., 2019).
Based on our daily mass balance dataset, it is evident that the accumulation in April–May is the primary driver of annual accumulation magnitude in eastern Pamir. Barandun et al. (2018) found that glaciers in the west Pamir region experience snow accumulation at the start of the hydrologic year, receiving over 1 m w.e. of accumulation during the winter season. These different accumulation patterns are linked to divergent precipitation seasonality between the east and west Pamirs, driving the formation of distinct mass accumulation types (Maussion et al., 2014). Published geodetic estimates reveal striking west–east disparities in glacier mass balance since 2000, with a mean mass loss of −0.26 m w.e. a−1 in the western Pamir but a near-balanced state (−0.02 m w.e. a−1) in the eastern Pamir (Bolch et al., 2019).
Furthermore, variations in the timing of heatwave occurrence and their combination with seasonal distribution of precipitation can also contribute to substantial disparities in the response of glacier surface mass balance to climatic conditions. As illustrated in Fig. 5, the mass loss in 2019/2020 was concentrated in August (−346 mm w.e.), following a period of high accumulation (+445 mm w.e.). In contrast, the 2022 mass balance process featured low spring accumulation and extremely strong summer ablation driven by heatwaves in July and August. While the ablation periods in 2021 and 2023 were significantly longer than in other years, the average summer ablation intensity was moderate. Unlike the stable mass accumulation observed in June across the other three years, the Kangxiwa Glacier experienced early ablation (−107 mm w.e.) in June 2023, followed by the highest ablation in September over the four-year period. Cumulative mass loss from June onward reached 628 mm w.e. in 2023, which was slightly less than the maximum loss in 2022. These divergent patterns of mass balance evolution not only underscore the complexity of glacier responses to climate change in this region but also highlight the critical importance of continuous, high-temporal-resolution monitoring of glacier surface mass changes to inform future model-based explanations (Barandun and Pohl, 2023).
5.2 The anomalous circulations in July 2022 and its influence on glacier balance
The extraordinary mass loss of the Kangxiwa Glacier in the eastern Pamir and Urumqi Glacier No. 1 in the eastern Tien Shan in 2022 (Xu et al., 2024) suggests that heatwaves may affect glacier conditions in the region on a wider scale. Analysis using ERA5 reanalysis data indicates that the July heatwave event was mainly located on the Pamir Plateau (Fig. 9a). The overall impact of the 2022 heatwave was felt in the western Kunlun Mountains and the Pamir Plateau where glaciers were previously considered in equilibrium or having a positive glacier mass balance (Brun et al., 2017; Kääb et al., 2015; Hugonnet et al., 2021).
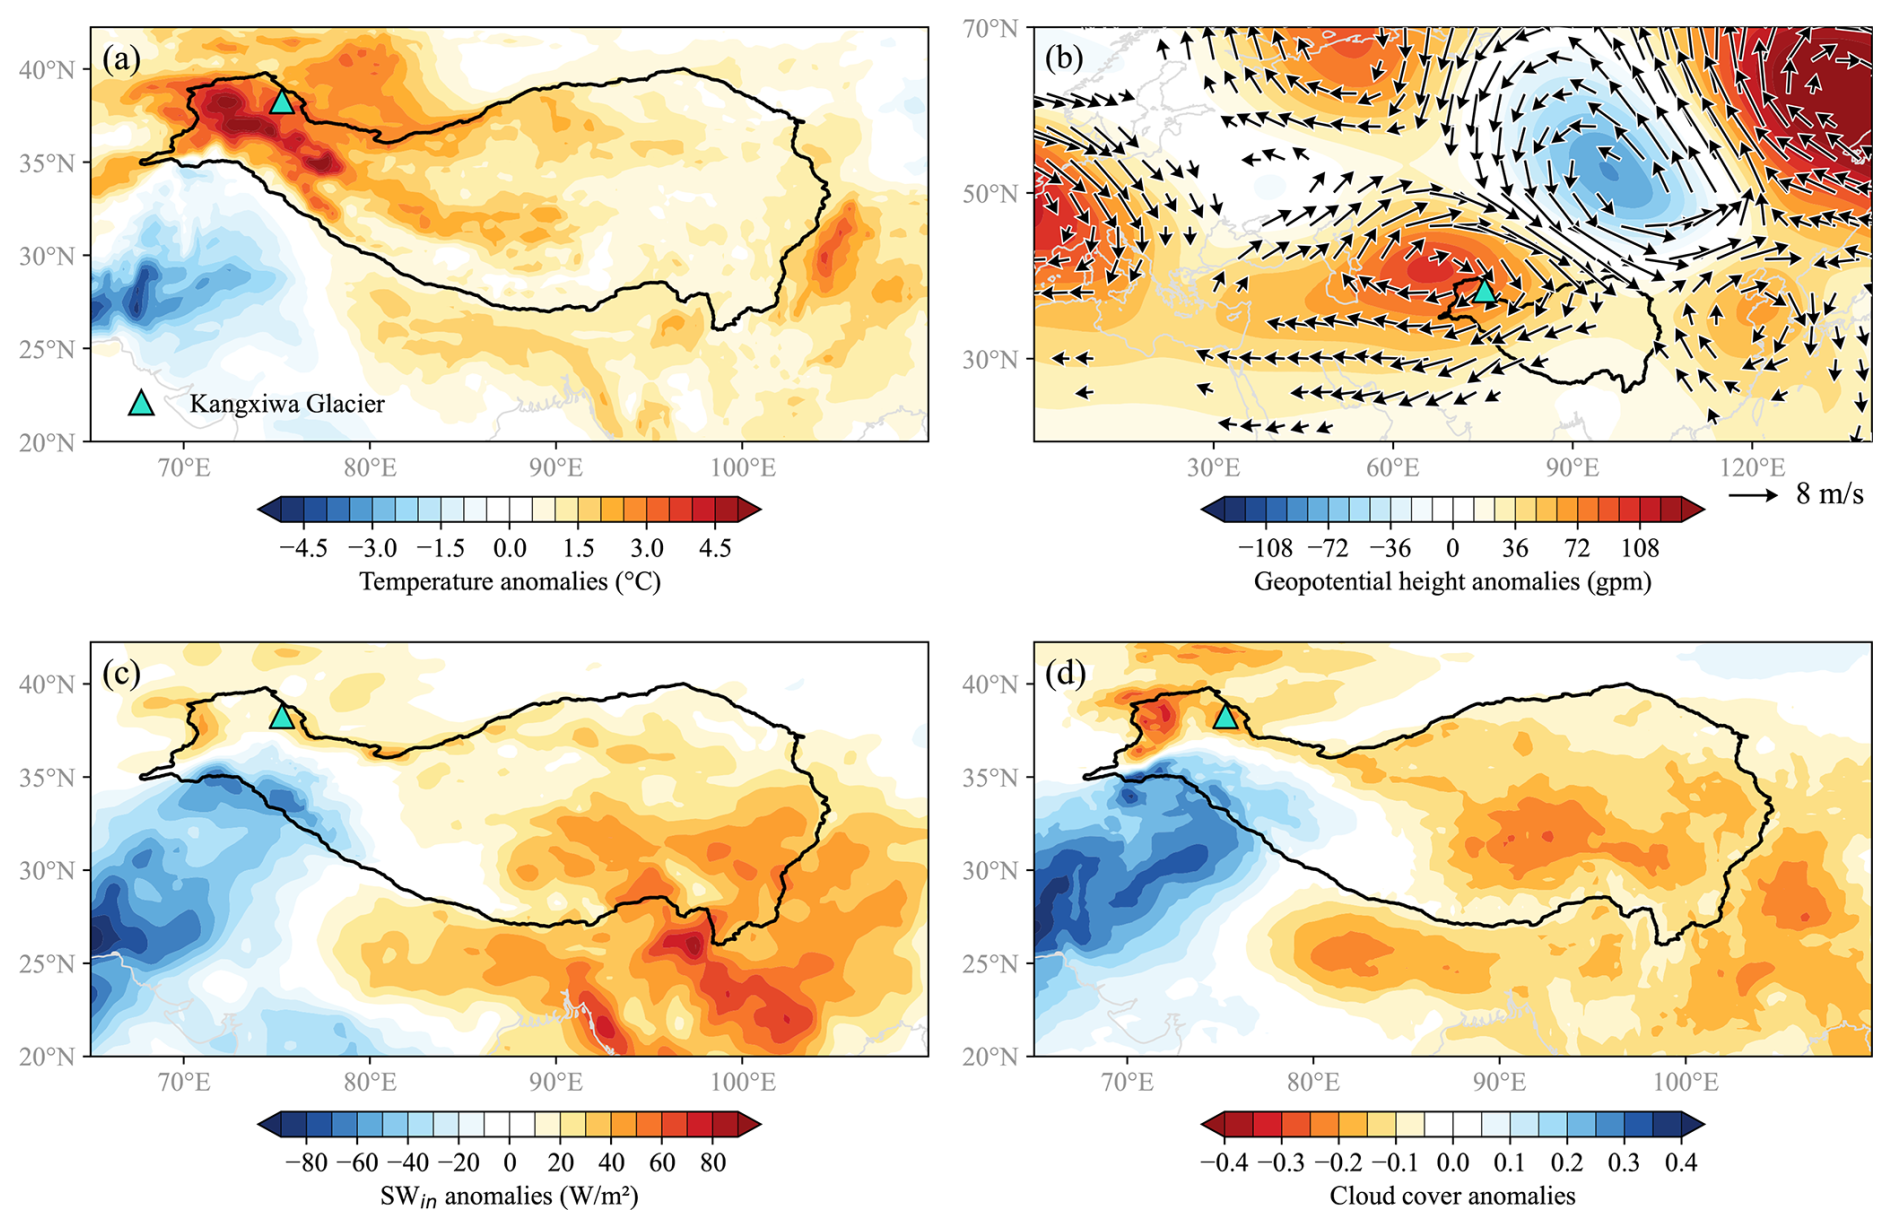
Figure 9The anomalies of meteorological variables and atmospheric circulations in July 2022 compared with climatological (1991–2020) average. (a) Air temperature; (b) geopotential height (unit: gpm) and wind field anomalies at 200 hPa; (c) shortwave incoming radiation (SWin, unit: W m−2) anomaly; (d) cloud cover fraction anomaly. Black lines represent the domain of the Tibetan Plateau (Zhang et al., 2021).
We analysed anomalies in temperature, solar radiation, cloud cover, geopotential height and wind fields at 200 hPa during July 2022, compared to the climatological average from 1991 to 2020, to investigate the anomalous large-scale atmospheric circulations linked to the 2022 July mass balance anomaly in this study area. Anomalously high temperatures of over 4 °C were observed across the Pamir Plateau and the western Kunlun Mountains. This suggests that other glaciers in the region may also have experienced significant mass loss during the summer of 2022. Latest research in the Northwestern Pamirs found that enhanced glacier mass loss was linked to the 2022 July heatwave (Jouberton et al., 2025). Numerous studies have linked heatwaves and high-temperature events to anticyclonic systems (Deng et al., 2023; Jiang et al., 2023; Song et al., 2024). Figure 9b shows that an upper-level anticyclonic anomaly developed over the northwestern flank of the Tibetan Plateau at 200 hPa. Under these circulation patterns, strong easterly wind anomalies occur on the southern side of the anticyclonic anomaly, reducing the westerly wind at 30–40° N. A decrease in westerly winds means less atmospheric water is delivered to the Pamir, resulting in reduced precipitation and cloud cover. Abnormal anticyclonic circulation can suppress convection and cause strong subsidence, resulting in reduced cloud cover (Fig. 9d). The decrease in cloud cover, in turn, leads to increased incoming shortwave radiation. Figure 9c indicates anomalously high shortwave radiation during the July 2022 heatwave events. For example, AWS4900 records showed that shortwave incoming radiation exceeded the average for 2020–2021–2023 by 90.6 W m−2 (+31 %) and 48.7 W m−2 (+17 %) during the two heatwave events. This enhanced solar radiation further amplified the heatwave. This enhanced solar radiation further intensified the heatwaves. Overall, anticyclonic circulation anomalies contributed to air descent and anomalous diabatic heating, resulting in sunny and dry weather in eastern Pamir in July 2022 (Fig. 5). This favoured an increase in shortwave radiation to heat the land, which can increase outgoing longwave radiation and turbulent heat fluxes from the land surface to the atmosphere, causing higher air temperatures.
Additionally, soil moisture anomalies and teleconnections via Rossby wave trains (Hood et al., 2020) are also potential contributing factors. Low soil moisture anomalies on the Tibetan Plateau may have intensified the development of heatwaves through land–atmosphere feedback mechanisms (Jiang et al., 2023). The anomalous anticyclone in eastern Pamir appears to be linked to the propagation of wave energy from an upstream mid-latitude wave train originating in the northwestern North Atlantic (Deng et al., 2023; Song et al., 2024). Anticyclone development above western Europe (Fig. 9b) may have acted as a conduit for Rossby wave propagation to the anticyclone developed under the Northwestern flank of the Tibetan Plateau, linking glacier mass balance in this region to large-scale climate mode such as the Atlantic Multidecadal Oscillation.
Our study demonstrates that integrating time-lapse camera imagery with in situ glaciological measurements provides a reliable method for quantifying daily surface mass balance of glaciers in the eastern Pamir region. The results revealed the pronounced interannual variability in the surface mass balance of Kangxiwa Glacier during the 2019/2020–2022/2023 hydrological years: a modest positive balance in 2019/2020, followed by successive negative balances, with a record loss in 2021/2022. High temporal resolution observations characterize eastern Pamir glaciers as “spring-accumulation and summer-ablation” type, with accumulation concentrated in April–June and ablation in July–September. Notably, short-term heatwaves could greatly enhance the mass loss and then dominate annual surface mass balance in this region. Three heatwaves in July–August 2022 induced over 800 mm w.e. of mass loss within 40 d. Coupled with below-average winter–spring accumulation, these heatwaves pushed the equilibrium line altitude above the glacier's maximum elevation. The 2022 extreme melt was linked to weakened westerly circulation over Central Asia, a large-scale atmospheric pattern suppressing moisture transport and amplifying summer warming. Amid global warming and more frequent extreme heat, eastern Pamir glaciers – once considered climate-resilient – face heightened threats to their stability. Our findings clarify their vulnerability to short-term climatic extremes and validate a practical surface mass balance monitoring method for remote mountain regions.
Data in this study are available upon request from the corresponding author.
The supplement related to this article is available online at https://doi.org/10.5194/tc-20-2279-2026-supplement.
X.Y., W.Y analysed the data and write the manuscript. M.Z., Y.F., S.Y., P.W., W.Z. assisted in collecting all data and discussion. Funding acquisition, W.Y., B.X. All authors have read and agreed to the published version of the manuscript.
The contact author has declared that none of the authors has any competing interests.
Publisher's note: Copernicus Publications remains neutral with regard to jurisdictional claims made in the text, published maps, institutional affiliations, or any other geographical representation in this paper. The authors bear the ultimate responsibility for providing appropriate place names. Views expressed in the text are those of the authors and do not necessarily reflect the views of the publisher.
We would like to sincerely acknowledge and express our deep appreciation to the editor Etienne Berthier, reviewer Annelies Voordendag, two anonymous reviewers, and Dr. Martin Hoelzle for their thorough review of this work.
The study was supported by the National Key R&D Program of China (grant no. 2024YFF0808601), National Natural Science Foundation of China (grant no. 422711382), Excellent Research Group Program for Tibetan Plateau Earth System (grant no. 42588201), Lhasa Science and Technology Plan Project (grant no. LSKJ202406), Science and Technology Plan Projects of Tibet Autonomous Region (grant no. XZ202301ZY0022G), Key Innovation Team of National Climate Centre “Climate Change Monitoring and Projection in the Third Pole Region” (grant no. NCCCXTD007). We acknowledge the Nagqu Forestry and Grassland Bureau for funding supporting.
This paper was edited by Etienne Berthier and reviewed by Annelies Voordendag and two anonymous referees.
A2 Photonic Sensors: SmartStake: Monitor the glacier ablation with sub-hourly time step and millimetric accuracy, https://a2photonicsensors.com/smartstake-mon (last access: 10 September 2025), 2021.
Barandun, M. and Pohl, E.: Central Asia's spatiotemporal glacier response ambiguity due to data inconsistencies and regional simplifications, The Cryosphere, 17, 1343–1371, https://doi.org/10.5194/tc-17-1343-2023, 2023.
Barandun, M., Huss, M., Usubaliev, R., Azisov, E., Berthier, E., Kääb, A., Bolch, T., and Hoelzle, M.: Multi-decadal mass balance series of three Kyrgyz glaciers inferred from modelling constrained with repeated snow line observations, The Cryosphere, 12, 1899–1919, https://doi.org/10.5194/tc-12-1899-2018, 2018.
Barandun, M., Pohl, E., Naegeli, K., McNabb, R., Huss, M., Berthier, E., Saks, T., and Hoelzle, M.: Hot spots of glacier mass balance variability in Central Asia, Geophys. Res. Lett., 48, e2020GL092084, https://doi.org/10.1029/2020GL092084, 2021.
Berthier, E. and Brun, F.: Karakoram geodetic glacier mass balances between 2008 and 2016: persistence of the anomaly and influence of a large rock avalanche on Siachen glacier, J. Glaciol., 65, 494–507, https://doi.org/10.1017/jog.2019.32, 2019.
Berthier, E., Vincent, C., and Six, D.: Exceptional thinning through the entire altitudinal range of Mont-Blanc glaciers during the 2021/22 mass balance year, J. Glaciol., 70, e30, 1–6, https://doi.org/10.1017/jog.2023.100, 2024.
Bhattacharya, A., Bolch, T., Mukherjee, K., King, O., Menounos, B., Kapitsa, V., Neckel, N., Yang, W., and Yao, T.: High Mountain Asian glacier response to climate revealed by multi-temporal satellite observations since the 1960s, Nat. Commun., 12, 4133, https://doi.org/10.1038/s41467-021-24180-y, 2021.
Bolch, T., Shea, J. M., Liu, S., Azam, F. M., Gao, Y., Gruber, S., Immerzeel, W. W., Kulkarni, A., Li, H., Tahir, A. A., Zhang, G., and Zhang, Y.: Status and change of the cryosphere in the extended Hindu Kush Himalaya region, in: Wester, P., Mishra, A., Mukherji, A., and Shrestha, A. B. (Eds.), The Hindu Kush Himalaya Assessment, Springer, Cham, 209–255, https://doi.org/10.1007/978-3-319-92288-1_7, 2019.
Brun, F., Berthier, E., Wagnon, P., Kääb, A., and Treichler, D.: A spatially resolved estimate of High Mountain Asia glacier mass balances from 2000 to 2016, Nat. Geosci., 10, 668–673, https://https://doi.org/10.1038/ngeo2999, 2017.
Brun, F., Wagnon, P., Berthier, E., Jomelli, V., Maharjan, S. B., Shrestha, F., and Kraaijenbrink, P. D. A.: Heterogeneous influence of glacier morphology on the mass balance variability in High Mountain Asia, J. Geophys. Res.-Earth Surf., 124, 1331–1345, https://doi.org/10.1029/2018JF004838, 2019.
Chen, W., Yao, T., Zhang, G., Woolway, R. I., Yang, W., Xu, F., and Zhou, T.: Glacier surface heatwaves over the Tibetan Plateau, Geophys. Res. Lett., 50, e2022GL101115, https://doi.org/10.1029/2022GL101115, 2023.
Cogley, J. G., Hock, R., Rasmussen, L. A., Arendt, A. A., Bauder, A., Braithwaite, R. J., Jansson, P., Kaser, G., Möller, M., Nicholson, L., and Zemp, M.: Glossary of Glacier Mass Balance and Related Terms, IHP-VII Technical Documents in Hydrology No. 86, IACS Contribution No. 2, UNESCO-IHP, Paris, https://unesdoc.unesco.org/ark:/48223/pf0000192525 (last access: 25 February 2026), 2011.
Colucci, R., Giorgi, F., and Torma, C.: Unprecedented heat wave in December 2015 and potential for winter glacier ablation in the eastern Alps, Sci. Rep., 7, 7090, https://doi.org/10.1038/s41598-017-07415-1, 2017.
Cremona, A., Huss, M., Landmann, J. M., Borner, J., and Farinotti, D.: European heat waves 2022: contribution to extreme glacier melt in Switzerland inferred from automated ablation readings, The Cryosphere, 17, 1895–1912, https://doi.org/10.5194/tc-17-1895-2023, 2023.
Deng, Z., Zhou, S., Wang, M., He, L., Qing, Y., and Qian, Z.: Variations in summer surface air temperature over the eastern Tibetan Plateau: connection with Barents-Kara Spring Sea Ice and Summer Arctic Oscillation, J. Geophys. Res.-Atmos., 128, e2023JD039765, https://doi.org/10.1029/2023JD039765, 2023.
Ding, B., Yang K., Qin, J., Wang, L., Chen, Y., and He, X.: The dependence of precipitation types on surface elevation and meteorological conditions and its parameterization, J. Hydrol., 513, 154–163, https://doi.org/10.1016/j.jhydrol.2014.03.038, 2014.
Falaschi, D., Bhattacharya, A., Guillet, G., Huang, L., King, O., Mukherjee, K., Rastner, P., Yao, T., and Bolch, T.: Annual to seasonal glacier mass balance in High Mountain Asia derived from Pléiades stereo images: examples from the Pamir and the Tibetan Plateau, The Cryosphere, 17, 5435–5458, https://doi.org/10.5194/tc-17-5435-2023, 2023.
Farinotti, D., Immerzeel, W. W., de Kok, R. J., Quincey, D. J., and Dehecq, A.: Manifestations and mechanisms of the Karakoram glacier anomaly, Nat. Geosci., 13, 8–16, https://doi.org/10.1038/s41561-019-0513-5, 2020.
Ganesan, P., Rajini, V., Sathish, B. S., and Shaik, K. B.: HSV color space based segmentation of region of interest in satellite images, 2014 International Conference on Control, Instrumentation, Communication and Computational Technologies (ICCICCT), 101–105, https://doi.org/10.1109/ICCICCT.2014.6992938, 2014.
Gui, K., Zhou, T., Zhang, W., and Zhang, X.: Land-atmosphere coupling amplified the record-breaking heatwave at altitudes above 5000 meters on the Tibetan Plateau in July 2022, Weather Clim. Extrem., 45, 100717, https://doi.org/10.1016/j.wace.2024.100717, 2024.
Hamuda, E., McGinley, B., Glavin, M., and Jones, E.: Automatic crop detection under field conditions using the HSV colour space and morphological operations, Comput. Electron. Agric., 133, 97–107, https://doi.org/10.1016/j.compag.2016.11.021, 2017.
Hassan, W. U., Nayak, M. A., Saharwardi, M. S., Dar, J. A., Dasari, H. P., Hoteit, I., and Abualnaja, Y.: Unveiling the devastating effect of the spring 2022 mega-heatwave on the South Asian snowpack, Commun. Earth Environ., 5, 707, https://doi.org/10.1038/s43247-024-01857-y, 2024.
Hewitt, K.: Glacier change, concentration, and elevation effects in the Karakoram Himalaya, Upper Indus Basin, Mt. Res. Dev., 31, 188–200, https://doi.org/10.1659/MRD-JOURNAL-D-11-00020.1, 2011.
Hoffmann, L., Günther, G., Li, D., Stein, O., Wu, X., Griessbach, S., Heng, Y., Konopka, P., Müller, R., Vogel, B., and Wright, J. S.: From ERA-Interim to ERA5: the considerable impact of ECMWF's next-generation reanalysis on Lagrangian transport simulations, Atmos. Chem. Phys., 19, 3097–3124, https://doi.org/10.5194/acp-19-3097-2019, 2019.
Holzer, N., Vijay, S., Yao, T., Xu, B., Buchroithner, M., and Bolch, T.: Four decades of glacier variations at Muztagh Ata (eastern Pamir): a multi-sensor study including Hexagon KH-9 and Pléiades data, The Cryosphere, 9, 2071–2088, https://doi.org/10.5194/tc-9-2071-2015, 2015.
Hood, L. L., Redman, M. A., Johnson, W. L., and Galarneau, T. J.: Stratospheric Influences on the MJO-Induced Rossby Wave Train: Effects on Intraseasonal Climate, J. Climate, 33, 365–389, https://doi.org/10.1175/JCLI-D-18-0811.1, 2020.
Hugonnet, R., McNabb, R., Berthier, E., Menounos, B., Nuth, C., Girod, L., Farinotti, D., Huss, M., Dussaillant, I., and Brun, F.: Accelerated global glacier mass loss in the early twenty-first century, Nature, 592, 726–731, https://doi.org/10.1038/s41586-021-03436-z, 2021.
Huss, M.: Density assumptions for converting geodetic glacier volume change to mass change, The Cryosphere, 7, 877–887, https://doi.org/10.5194/tc-7-877-2013, 2013.
Huss, M. and Hock, R.: Global-scale hydrological response to future glacier mass loss, Nat. Clim. Change, 8, 135–140, https://doi.org/10.1038/s41558-017-0049-x, 2018.
Jiang, J., Liu, Y., Mao, J., and Wu, G.: Extreme heatwave over Eastern China in summer 2022: the role of three oceans and local soil moisture feedback, Environ. Res. Lett., 18, 044025, https://doi.org/10.1088/1748-9326/acc5fb, 2023.
Jouberton, A., Shaw, T. E., Miles, E., McCarthy, M., Fugger, S., Ren, S. T., Dehecq, A., Yang, W., and Pellicciotti, F.: Warming-induced monsoon precipitation phase change intensifies glacier mass loss in the southeastern Tibetan Plateau, P. Natl. Acad. Sci. USA, 119, e2109796119, https://doi.org/10.1073/pnas.2109796119, 2022.
Jouberton, A., Shaw, T. E., Miles, E., Kneib, M., Fugger, S., Buri, P., McCarthy, M., Kayumov, A., Navruzshoev, H., Halimov, A., Kabutov, K., Homidov, F., and Pellicciotti, F.: Snowfall decrease in recent years undermines glacier health and meltwater resources in the Northwestern Pamirs, Commun. Earth Environ., 6, 691, https://doi.org/10.1038/s43247-025-02611-8, 2025.
Kääb, A., Treichler, D., Nuth, C., and Berthier, E.: Brief Communication: Contending estimates of 2003–2008 glacier mass balance over the Pamir–Karakoram–Himalaya, The Cryosphere, 9, 557–564, https://doi.org/10.5194/tc-9-557-2015, 2015.
Kääb, A., Leinss, S., Gilbert, A., Bühler, Y., Gascoin, S., Evans, S. G., Bartelt, P., Berthier, E., Brun, F., Chao, W.-A., Farinotti, D., Gimbert, F., Guo, W., Huggel, C., Kargel, J. S., Leonard, G. J., Tian, L., Treichler, D. and Yao, T.: Massive collapse of two glaciers in western Tibet in 2016 after surge-like instability, Nat. Geosci., 11, 114–120, https://doi.org/10.1038/s41561-017-0039-7, 2018.
Kaser, G., Fountain, A., and Jansson, P.: A manual for monitoring the mass balance of mountain glaciers with particular attention to low latitude characteristics, UNESCO, Paris, 107 pp. + Appendices, https://wgms.ch/downloads/Kaser_etal_UNESCO_2003.pdf (last access: 25 February 2026), 2003.
Landmann, J. M., Künsch, H. R., Huss, M., Ogier, C., Kalisch, M., and Farinotti, D.: Assimilating near-real-time mass balance stake readings into a model ensemble using a particle filter, The Cryosphere, 15, 5017–5040, https://doi.org/10.5194/tc-15-5017-2021, 2021.
Li, Z., Wang, N., Chen, A., Zhang, L., and Zhang, Y.: Slight change of glaciers in the Pamir over the period 2000–2017, Arct. Antarct. Alp. Res., 54, 13–24, https://doi.org/10.1080/15230430.2022.2028475, 2022.
Little, K., Kingston, D., Cullen, N., and Gibson, P.: The role of atmospheric rivers for extreme ablation and snowfall events in the Southern Alps of New Zealand, Geophys. Res. Lett., 46, 2761–2771, https://doi.org/10.1029/2018GL081669, 2019.
Liu, W., Zhang, D., Qin, X., van den Broeke, M. R., Jiang, Y., Yang, D., and Ding, M.: Monsoon Clouds Control the Summer Surface Energy Balance on East Rongbuk Glacier (6,523 m Above Sea Level), the Northern of Mt. Qomolangma (Everest), J. Geophys. Res.-Atmos., 126, e2020JD033998, https://doi.org/10.1029/2020JD033998, 2021.
Lu, G., Li, Q., Sun, X., Zhao, M., Dong, L., Wu, Q., Wang, L., Zhao, L., Duan, C., Yin, Y., Wang, P., and Shen X.: Comparative analysis of peak-summer heatwaves in the Yangtze–Huaihe River Basin of China in 2022 and 2013: Thermal effects of the Tibetan Plateau, Atmos. Res., 300, 107222, https://doi.org/10.1016/j.atmosres.2024.107222, 2024.
Lu, R., Xu, K., Chen, R., Chen, W., Li, F., and Lv, C.: Heat waves in summer 2022 and increasing concern regarding heat waves in general, Atmos. Ocean Sci. Lett., 16, 100290, https://doi.org/10.1016/j.aosl.2022.100290, 2023.
Lv, M., Quincey, D., Guo, H., King, O., Liu, G., Yan, S., Lu, X., and Ruan, Z.: Examining geodetic glacier mass balance in the eastern Pamir transition zone, J. Glaciol., 66, 927–937, https://doi.org/10.1017/jog.2020.54, 2020.
Maussion, F., Scherer, D., Mölg, T., Collier, E., Curio, J., and Finkelnburg, R.: Precipitation Seasonality and Variability over the Tibetan Plateau as Resolved by the High Asia Reanalysis, J. Climate, 27, 1910–1927, https://doi.org/10.1175/JCLI-D-13-00282.1, 2014.
Mölg, T., Maussion, F., and Scherer, D.: Mid-latitude westerlies as a driver of glacier variability in monsoonal High Asia, Nat. Clim. Change, 4, 68–73, https://doi.org/10.1038/nclimate2055, 2014.
Otsu, N.: A threshold selection method from gray-level histograms, IEEE Trans. Syst. Man. Cybern., 9, 62–66, https://doi.org/10.1109/TSMC.1979.4310076, 1979.
Perkins-Kirkpatrick, S. E. and Lewis, S. C.: Increasing trends in regional heatwaves, Nat. Commun., 11, 3357, https://doi.org/10.1038/s41467-020-16970-7, 2020.
Shean, D. E., Bhushan, S., Montesano, P., Rounce, D. R., Arendt, A., and Osmanoglu, B.: A Systematic, Regional Assessment of High Mountain Asia Glacier Mass Balance, Front. Earth Sci., 7, 363, https://doi.org/10.3389/feart.2019.00363, 2020.
Shi, Y. and Liu, S.: Estimation on the response of glaciers in China to the global warming in the 21st century, Chin. Sci. Bull., 45, 668–672, https://doi.org/10.1007/BF02886048, 2000.
Shugar, D. H., Jacquemart, M., Shean, D., Bhushan, S., Upadhyay, K., Sattar, A., Schwanghart, W., McBride, S., De Vries, M. V. W., Mergili, M., Emmer, A., Deschamps-Berger, C., McDonnell, M., Bhambri, R., Allen, S., Berthier, E., Carrivick, J. L., Clague, J. J., Dokukin, M., Dunning, S. A., Frey, H., Gascoin, S., Haritashya, U. K., Huggel, C., Kääb, A., Kargel, J. S., Kavanaugh, J. L., Lacroix, P., Petley, D., Rupper, S., Azam, M. F., Cook, S. J., Dimri, A. P., Eriksson, M., Farinotti, D., Fiddes, J., Gnyawali, K. R., Harrison, S., Jha, M., Koppes, M., Kumar, A., Leinss, S., Majeed, U., Mal, S., Muhuri, A., Noetzli, J., Paul, F., Rashid, I., Sain, K., Steiner, J., Ugalde, F., Watson, C. S., and Westoby, M. J.: A massive rock and ice avalanche caused the 2021 disaster at Chamoli, Indian Himalaya, Science, 373, 300–306, https://doi.org/10.1126/science.abh4455, 2021.
Song, Q., Wang, C., Yao, Y., and Fan, H.: Unraveling the Indian monsoon's role in fueling the unprecedented 2022 Marine Heatwave in the Western North Pacific, npj Clim. Atmos. Sci., 7, 90, https://doi.org/10.1038/s41612-024-00645-x, 2024.
Voordendag, A., Prinz, R., Schuster, L., and Kaser, G.: Brief communication: The Glacier Loss Day as an indicator of a record-breaking negative glacier mass balance in 2022, The Cryosphere, 17, 3661–3665, https://doi.org/10.5194/tc-17-3661-2023, 2023.
Wang, R., Liu, S., Shangguan, D., Radić, V., and Zhang, Y.: Spatial heterogeneity in glacier mass-balance sensitivity across High Mountain Asia, Water, 11, 776, https://doi.org/10.3390/w11040776, 2019.
WGMS: Latest glacier mass balance data, http://wgms.ch/latest-glacier-mass-balance-data/ (last access: 25 February 2026), 2025.
Xu, C., Li, H., Wang, F., Li, Z., Zhou, P., and Liu, S.: Heatwaves in summer 2022 forces substantial mass loss for Urumqi Glacier No. 1, China, J. Glaciol., 70, e77, https://doi.org/10.1017/jog.2024.4, 2024.
Yao, T., Thompson, L., Yang, W., Yu, W., Gao, Y., Guo, X., Yang, X., Duan, K., Zhao, H., Xu, B., Pu, J., Lu, A., Xiang, Y., Kattel, D. B., and Joswiak, D.: Different glacier status with atmospheric circulations in Tibetan Plateau and surroundings, Nat. Clim. Change, 2, 663–667, https://doi.org/10.1038/nclimate1580, 2012.
Yao, T., Bolch, T., Chen, D., Gao, J., Immerzeel, W., Piao, S., Su, F., Thompson, L., Wada, Y., and Wang, L.: The imbalance of the Asian water tower, Nat. Rev. Earth Environ., 3, 618–632, https://doi.org/10.1038/s43017-022-00299-4, 2022.
Yu, L., Chou, S., Wu, H., Chen, Y., and Chen, Y.: Rapid and semi-quantitative colorimetric loop-mediated isothermal amplification detection of ASFV via HSV color model transformation, J. Microbiol. Immunol. Infect., 54, 963–970, https://doi.org/10.1016/j.jmii.2020.08.003, 2021.
Zemp, M., Gärtner-Roer, I., Nussbaumer, S. U., Welty, E. Z., Dussaillant, I., and Bannwart, J. (Eds.): Global Glacier Change Bulletin No. 5 (2020–2021), ISC(WDS)/IUGG(IACS)/UNEP/UNESCO/WMO, World Glacier Monitoring Service, Zurich, Switzerland, 134 pp., ISBN: 978-3-033-10025-5, https://doi.org/10.5904/wgms-fog-2023-09, 2023.
Zhang, T., Deng, G., Liu, X., He, Y., Shen, Q., and Chen, Q.: Heatwave magnitude quantization and impact factors analysis over the Tibetan Plateau, npj Clim. Atmos. Sci., 8, 2, https://doi.org/10.1038/s41612-024-00877-x, 2025.
Zhang, Y., Li, B., Liu, L., and Zheng, D.: Redetermine the region and boundaries of Tibetan Plateau, Geogr. Res., 40, 1543–1553, https://doi.org/10.11821/dlyj020210138, 2021.
Zhao, C., Yang, W., Westoby, M., An, B., Wu, G., Wang, W., Wang, Z., Wang, Y., and Dunning, S.: Brief communication: An approximately 50 Mm3 ice-rock avalanche on 22 March 2021 in the Sedongpu valley, southeastern Tibetan Plateau, The Cryosphere, 16, 1333–1340, https://doi.org/10.5194/tc-16-1333-2022, 2022.
Zhu, F., Zhu, M., Guo, Y., and Yao, T.: Observation and simulation of runoff during an extreme heatwave in a glacial basin on the Central Tibetan Plateau, Hydrol. Process., 38, e70014, https://doi.org/10.1002/hyp.70014, 2024a.
Zhu, F., Zhu, M., Yang, W., Wang, Z., Guo, Y., and Yao, T.: Drivers of the extreme early spring glacier melt of 2022 on the central Tibetan Plateau, Earth Space Sci., 11, e2023EA003297, https://doi.org/10.1029/2023EA003297, 2024b.
Zhu, M., Yao, T., Yang, W., Xu, B., Wu, G., and Wang, X.: Reconstruction of the mass balance of Muztag Ata No. 15 glacier, eastern Pamir, and its climatic drivers, J. Glaciol., 64, 259–274, https://doi.org/10.1017/jog.2018.16, 2018.
Zhu, M., Thompson, L. G., Yao, T., Jin, S., Yang, W., Xiang, Y., and Zhao, H.: Opposite mass balance variations between glaciers in western Tibet and the western Tien Shan, Global Planet. Change, 220, 103997, https://doi.org/10.1016/j.gloplacha.2022.103997, 2023.