the Creative Commons Attribution 4.0 License.
the Creative Commons Attribution 4.0 License.
 | 16 Sep 2025
Seasonal and interannual variability in freshwater sources for Greenland's fjords
Willem Jan van de Berg
Brice Noël
Lorenz Meire
Michiel R. van den Broeke
The magnitude, source, release location, and timing of freshwater that ends up in the numerous Greenland fjords is of special interest for ice–ocean interactions and ecosystems. In this study, we investigate intra- and interannual variability in the various freshwater sources for Greenland's fjords in seven climatologically distinct regions. For this, we use direct and statistically downscaled output from regional climate models for the mass fluxes, process-based estimates of basal melt, and observational data for solid ice discharge. For the period 1940/1958 through 2023, we separately quantify runoff from the Greenland ice sheet, peripheral ice caps and tundra regions, and precipitation directly falling in the fjords. From 2009 onwards, the available data allow us to resolve the full seasonal cycle of freshwater input. The results indicate a diverse range of relative contributions from freshwater sources between seasons and regions. Freshwater input in fjords in the wet South-East and North-West is dominated by solid ice discharge (55 % and 67 %, respectively) with a small contribution of tundra runoff, whereas in the relatively drier North, North-East, and South-West the contribution of tundra runoff is more important (20 %, 25 %, and 30 %, respectively). Precipitation in fjords and tundra runoff can represent a large fraction of the monthly total, i.e. up to 11 % and 35 %, respectively, for winter and spring. However, the relative contribution of tundra runoff has been decreasing with time as the result of rapid increases in ice sheet and ice cap runoff over the past decades following atmospheric and oceanic warming. We show that the regional glacier-integrated melt-over-accumulation (MoA) ratio is a good predictor for the relative contributions of solid ice discharge, tundra runoff, and ice sheet runoff. These findings have implications for the use of freshwater fluxes forcing in regional ocean models and fjord studies and enhance our understanding of their impact on ocean and fjord circulation and biogeochemistry.
- Article
(8387 KB) - Full-text XML
- BibTeX
- EndNote


Greenland fjords constitute the hydrological connection between the Greenland ice sheet and the surrounding ocean. Of special interest for ice–ocean interactions and ecosystems are the source, magnitude, release location, and timing of freshwater that ends up in the numerous Greenland fjords. The source of freshwater input influences both the timing and location of its entry into the fjords. For instance, tundra runoff typically enters the fjord near the surface and peaks in spring when the seasonal snowpack melts, whereas in glacial fjords runoff can both enter fjords at the surface and/or subglacially, with a pronounced peak in summer (Sanchez et al., 2023). These differences in the magnitude and timing of freshwater input result in different fjord circulation regimes (Mortensen et al., 2014), altering primary productivity, CO2 uptake, cloud formation, and ecosystems in fjords with marine-terminating glaciers compared to those without (Meire et al., 2017; Stuart-Lee et al., 2021; Meire et al., 2023; Wieber et al., 2025). Depending on the origin of the freshwater source, the concentration of nutrients and organic carbon can vary substantially (Hopwood et al., 2020).
Recent and future increases in freshwater discharge from the contiguous Greenland ice sheet (GrIS) and smaller glaciers and ice caps (GICs) (van den Broeke et al., 2009, 2016; Mankoff et al., 2021; Khan et al., 2022) have the potential to significantly affect regional and large-scale ocean circulation; however specific timing, geographic location, and release depth are often not considered in global climate models (Yang et al., 2016; Dukhovskoy et al., 2019; Martin and Biastoch, 2023). To date, no global models and only a few regional models have had a sufficient spatial resolution to resolve Greenland's fjords (Hallberg, 2013; Hewitt et al., 2017; Fox-Kemper et al., 2019; Gelderloos et al., 2022). Most of these models assume that (i) freshwater enters the fjords and the ocean at near-surface levels, (ii) freshwater input is constant throughout the year, or (iii) freshwater storage in fjords is negligible (Jackson et al., 2017; Dukhovskoy et al., 2021; Jackson et al., 2023; Martin and Biastoch, 2023). Often, these assumptions are inaccurate. It has been shown that in fjords in western Greenland, freshwater storage delays its export to the continental shelf by a single to several months, depending on the fjord geometry and season and the presence of land- or marine-terminating glaciers (Gladish et al., 2015; Stuart-Lee et al., 2021; Sanchez et al., 2023). In glacial fjords, a positive feedback exists between the strength of the fjord circulation and glacial melt (Zhao et al., 2022), which implies that the magnitude and timing of freshwater input co-determines the total freshwater export onto the continental shelf.
To improve understanding and support modelling efforts, freshwater fluxes into Greenland fjords have been quantified through observations and models for Greenland as a whole and locally for individual fjords. Although useful for budget studies, Greenland total freshwater flux provides a limited perspective, as freshwater that leaves the fjord is transported in boundary currents along Greenland and might end up in a deep-convection region far from where it was released (Gillard et al., 2016; Duyck and De Jong, 2023). The different freshwater sources have different mixing depths, which further affects their pathways; e.g. one model study assumed freshwater to be distributed over the upper 77 m on the shelf, which in the case of dominating solid ice discharge may be too shallow and for tundra and GIC runoff too deep (Gillard et al., 2016). Therefore, models aiming to accurately simulate freshwater pathways should consider the type of freshwater input. To this end, recent spatially resolved studies estimate freshwater fluxes from marine-terminating glaciers or stream outlets (Mankoff et al., 2020a; Slater et al., 2022; Karlsson et al., 2023). These studies excluded the magnitude of terrestrial (tundra) runoff, which is perhaps the least known freshwater source (Marson et al., 2021). Bamber et al. (2018) estimated total Greenland tundra runoff at approximately 80 Gt yr−1 (1958–2016), while Igneczi and Bamber (2025) found a higher number of 140–160 Gt yr−1. Some studies attempt to estimate freshwater fluxes into a limited number of individual fjords, studying freshwater retention, salt and heat budgets, and the impact of increased runoff on primary production (Jackson and Straneo, 2016; Oksman et al., 2022; Sanchez et al., 2023).
This study aims to improve and interpret Greenland-wide and regional estimates of freshwater sources for Greenland's fjords. To assess their relative importance, we combine high-spatial- and high-temporal-resolution model data of precipitation, GrIS and GIC surface runoff, and basal melt with observational estimates of solid ice discharge. In addition, we quantify tundra runoff originating from rain and seasonal snowmelt. This enables us to assess on a regional scale how the distribution between freshwater sources changes throughout the year and how and why the magnitude and (seasonal) freshwater input into Greenland fjords have fluctuated over the past decades.
After introducing the methods and data sources in Sect. 2, we discuss the yearly sums and seasonal cycles of different freshwater sources in Sect. 3 and finish with a comparison to various other datasets and climatological interpretation in Sect. 4 and a summary in Sect. 5.
2.1 Data sources
To estimate sources of freshwater input into Greenland fjords, we combine different models and observational products (Table 1). As a default for runoff, melt, sublimation, and precipitation, we used output from the polar regional atmospheric climate model RACMO2.3p2 (Noël et al., 2019) (henceforth RACMO). The used run was forced at 3-hourly intervals (6-hourly before 1990) by the fifth-generation reanalysis (ERA5) of the European Centre for Medium-Range Weather Forecasts (ECMWF) and starts in 1958. Over Greenland, RACMO runs at a native spatial resolution of ∼ 5.5 × 5.5 km2 (Noël et al., 2019). The output of this simulation is further statistically downscaled to a 1 × 1 km2 polar stereographic grid (Noël et al., 2016, 2019). For comparison with RACMO precipitation, the Copernicus Arctic Regional Reanalysis (CARRA-West) (henceforth CARRA) is used, which has a 2.5 × 2.5 km2 resolution and uses the HARMONIE-AROME model, cycle Cy40h1 (Schyberg et al., 2020; Box et al., 2023). CARRA-West runoff is unrealistically small over land and ice (i.e. <10 % of the RACMO estimate) and is not used here.
For comparison with RACMO runoff, we use outputs from the Modèle Atmosphérique Régional (MAR) version 14 forced at 6-hourly intervals by ERA5 since 1940. MAR runs at 5 × 5 km2 spatial resolution and is statistically downscaled to the same 1 × 1 km2 grid as RACMO (Fettweis et al., 2020).
Basal melt on a 1 × 1 km2 grid is taken from Karlsson et al. (2021b), who used a composite of estimates for basal melt from geothermal heat, friction, and heat from surface meltwater, with the latter contributing to seasonal variability. Monthly values represent 1991–2023 averages. Basal melt has a total uncertainty of 21 %.
The freshwater components presented here and discussed in detail in the following subsections are GrIS runoff, GIC runoff, tundra runoff, basal melt, GrIS solid ice discharge (which represents the flux of solid ice across the grounding line, i.e. combining calving and submarine melt), and direct precipitation spatially integrated over the fjord surfaces. These components are presented as yearly sums since 1940/1958 and monthly sums since 1990 and are aggregated regionally (see below for region definitions) unless specified otherwise. The differences between the default products (boldface in Table 1) and other products are typically small. That is why the default values are being reported in the figures and main text, and the differences with other products are discussed in Sect. 4.5.
2.1.1 Runoff
RACMO (1958–2023) provides the default products for GrIS and GIC runoff, while MAR runoff outputs (1940–2023) are used for comparison. Both have been statistically downscaled to 1 × 1 km2 for the given period. The uncertainty in previous downscaled RACMO runoff products was estimated to be 20 % for GrIS and 40 % for GICs (Noël et al., 2019). Whereas runoff from the GICs and GrIS can be easily statistically downscaled because of the strong elevation dependency of melt and hence runoff, as described by Noël et al. (2019), this is more challenging for the tundra and therefore not done yet. Tundra has much lower runoff values (from seasonal snowmelt) than ice-covered regions (i.e. from ice and snowmelt); therefore statistical downscaling based on elevation gradients must be applied separately. This has not been done yet, and therefore a 1 km runoff grid was obtained by nearest-neighbour interpolation of the original 5.5 km resolution data. The tundra runoff uncertainty is estimated to be 10 % following Bamber et al. (2018). We do not apply a routing delay; i.e. all runoff is assumed to enter the fjords immediately, with the exception of ponding that is allowed at the ice surface in MAR, based on Zuo and Oerlemans (1996). Lakes are not represented in these versions of RACMO and MAR.
2.1.2 Precipitation
Precipitation into fjords is taken from two data sources. The default is the native RACMO precipitation (rain and snow) product (1958–2023), linearly interpolated onto a 1 × 1 km2 grid (Huai et al., 2022), and the second source used for comparison is CARRA. We assumed both snow and rain directly contribute to the freshwater input to the fjords; i.e. we neglected the precipitation phase and the possible storage effect of mass accumulation on top of sea ice. When using the CARRA data, the difference between the 30 and 6 h accumulated precipitation fields resulted in the daily precipitation, accounting for spin-up issues of the water cycle as recommended by the developers. The CARRA time span is 1991–2023, and we reproject the monthly and yearly sums on a 1 × 1 km2 grid using nearest-neighbour interpolation. The uncertainty for the precipitation products is not given, and therefore it is assumed to be represented by the difference between RACMO and CARRA (15 %). Precipitation was masked to only include fjords. We selected fjords by creating a convex hull around Greenland and Qeqertarsuaq (Disko Island), separately, using Python's scipy.convexhull following the procedure proposed by Slater et al. (2022). We chose values for the parameters concavity (2) and length threshold (10) and removed all small clusters of grid cells (<30 km2) that were not branches of fjords (defined by calculating the fraction of land in a 4 km radius and setting the threshold to 75 % to exclude small bays that would have almost 50 % ocean in their surroundings). Then we removed all “land” points using the RACMO land sea mask on a 1 × 1 km2 resolution, leaving us with “sea” points that we classified as fjords. For a sensitivity analysis of fjord extent in the Discussion (Sect. 4.4), the convex hull was extended from only the main island to also include small offshore islands. Precipitation is defined as precipitation onto the fjord area, neglecting potential interference of sea ice, as discussed in Sect. 4.6.
2.1.3 Solid ice discharge
For solid ice discharge, the default dataset consists of monthly values since 1986 for individual marine-terminating glaciers and is grouped per region (Mankoff et al., 2020b). Winter observations from before 2009 are scarce, and missing values were linearly interpolated for annual values. However, monthly means for the seasonal cycle of relative contributions are calculated from 2009 onwards. The dataset excludes calving from GICs, which is considered small (see Sect. 4.6). A similar procedure is used for a second solid ice discharge dataset from King et al. (2020), which has larger seasonal variability and is used for comparison in the Discussion (Sect. 4.5).
2.2 Region definitions
Because this study considers freshwater fluxes into fjords, which differs from most hydrological, glaciological, and oceanic applications, Greenland is divided into seven climatologically distinct regions (Fig. 1): North (NO), North-East (NE), North-West (NW), Central East (CE), Central West (CW), South-West (SW), and South-East (SE). These are based on the seven land/ice basins from Slater et al. (2020) that in turn are based on the Mouginot et al. (2019) ice divides. We made one adjustment by moving the boundary between SE and CE northward, along the Mouginot et al. (2019) ice divide, to better follow hydrological catchments, as well as to make the regions more comparable in size. Place names used in this study follow the convention by Oqaasileriffik, which has a map available on their website (Oqaasileriffik (The Language Secretariat of Greenland), 2024).
2.3 Melt-over-accumulation ratio
For interpretation purposes (see Sect. 4.2) the melt-over-accumulation (MoA) ratio is calculated using the following equation applied to the GrIS and GICs mask in the seven basins:
All parameters have units of millimetres of water equivalent (mm w.e.) and are taken from RACMO downscaled to 1 × 1 km2 on the ice-covered surfaces. Rain is defined as total precipitation minus snowfall.
Noël et al. (2019)Fettweis et al. (2020)Noël et al. (2019)Huai et al. (2022)Køltzow et al. (2022)Mankoff et al. (2020b)King et al. (2020)Karlsson et al. (2021a)Table 1Data sources used in this study. Datasets in boldface are used as default data in the results (Sect. 3), while the others are used for the sensitivity analysis in Sect. 4.5. Statistically downscaled data are indicated with an arrow. Solid ice discharge is not plotted on a grid and therefore indicated with n.a.
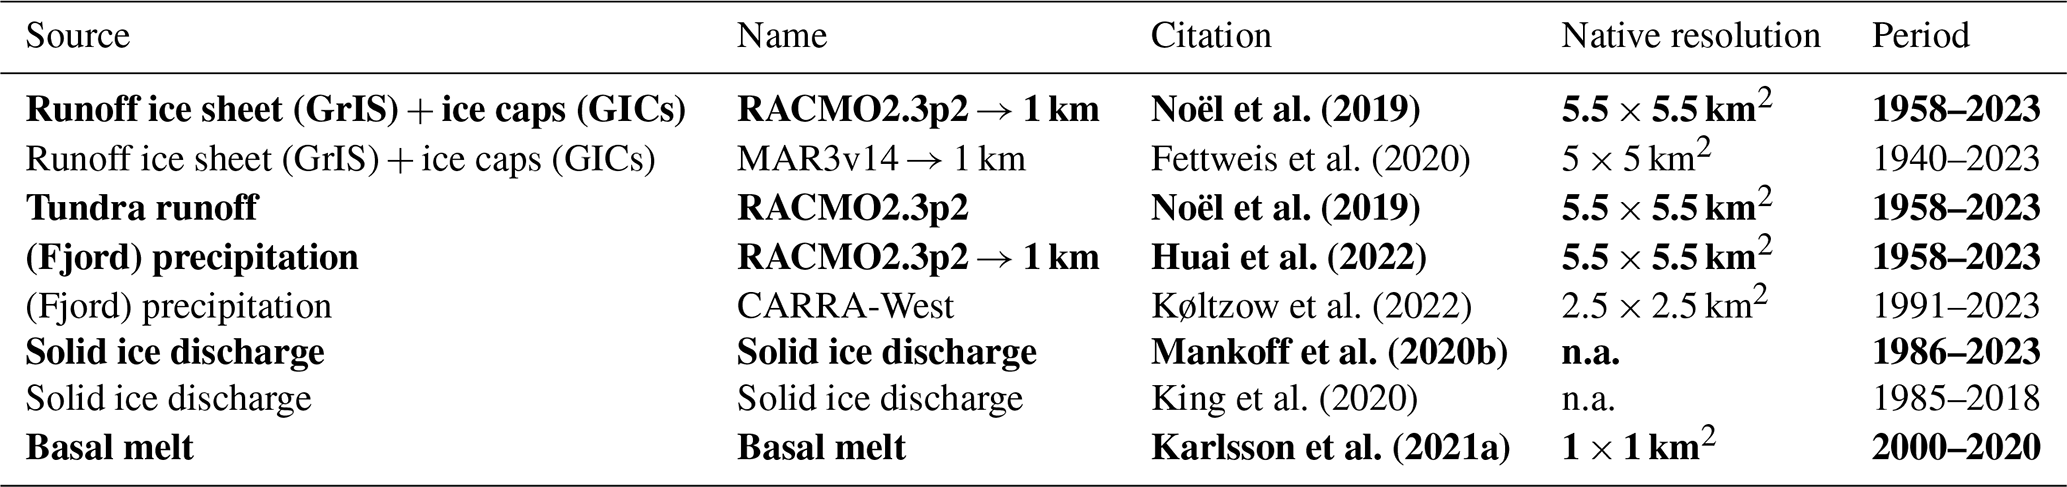
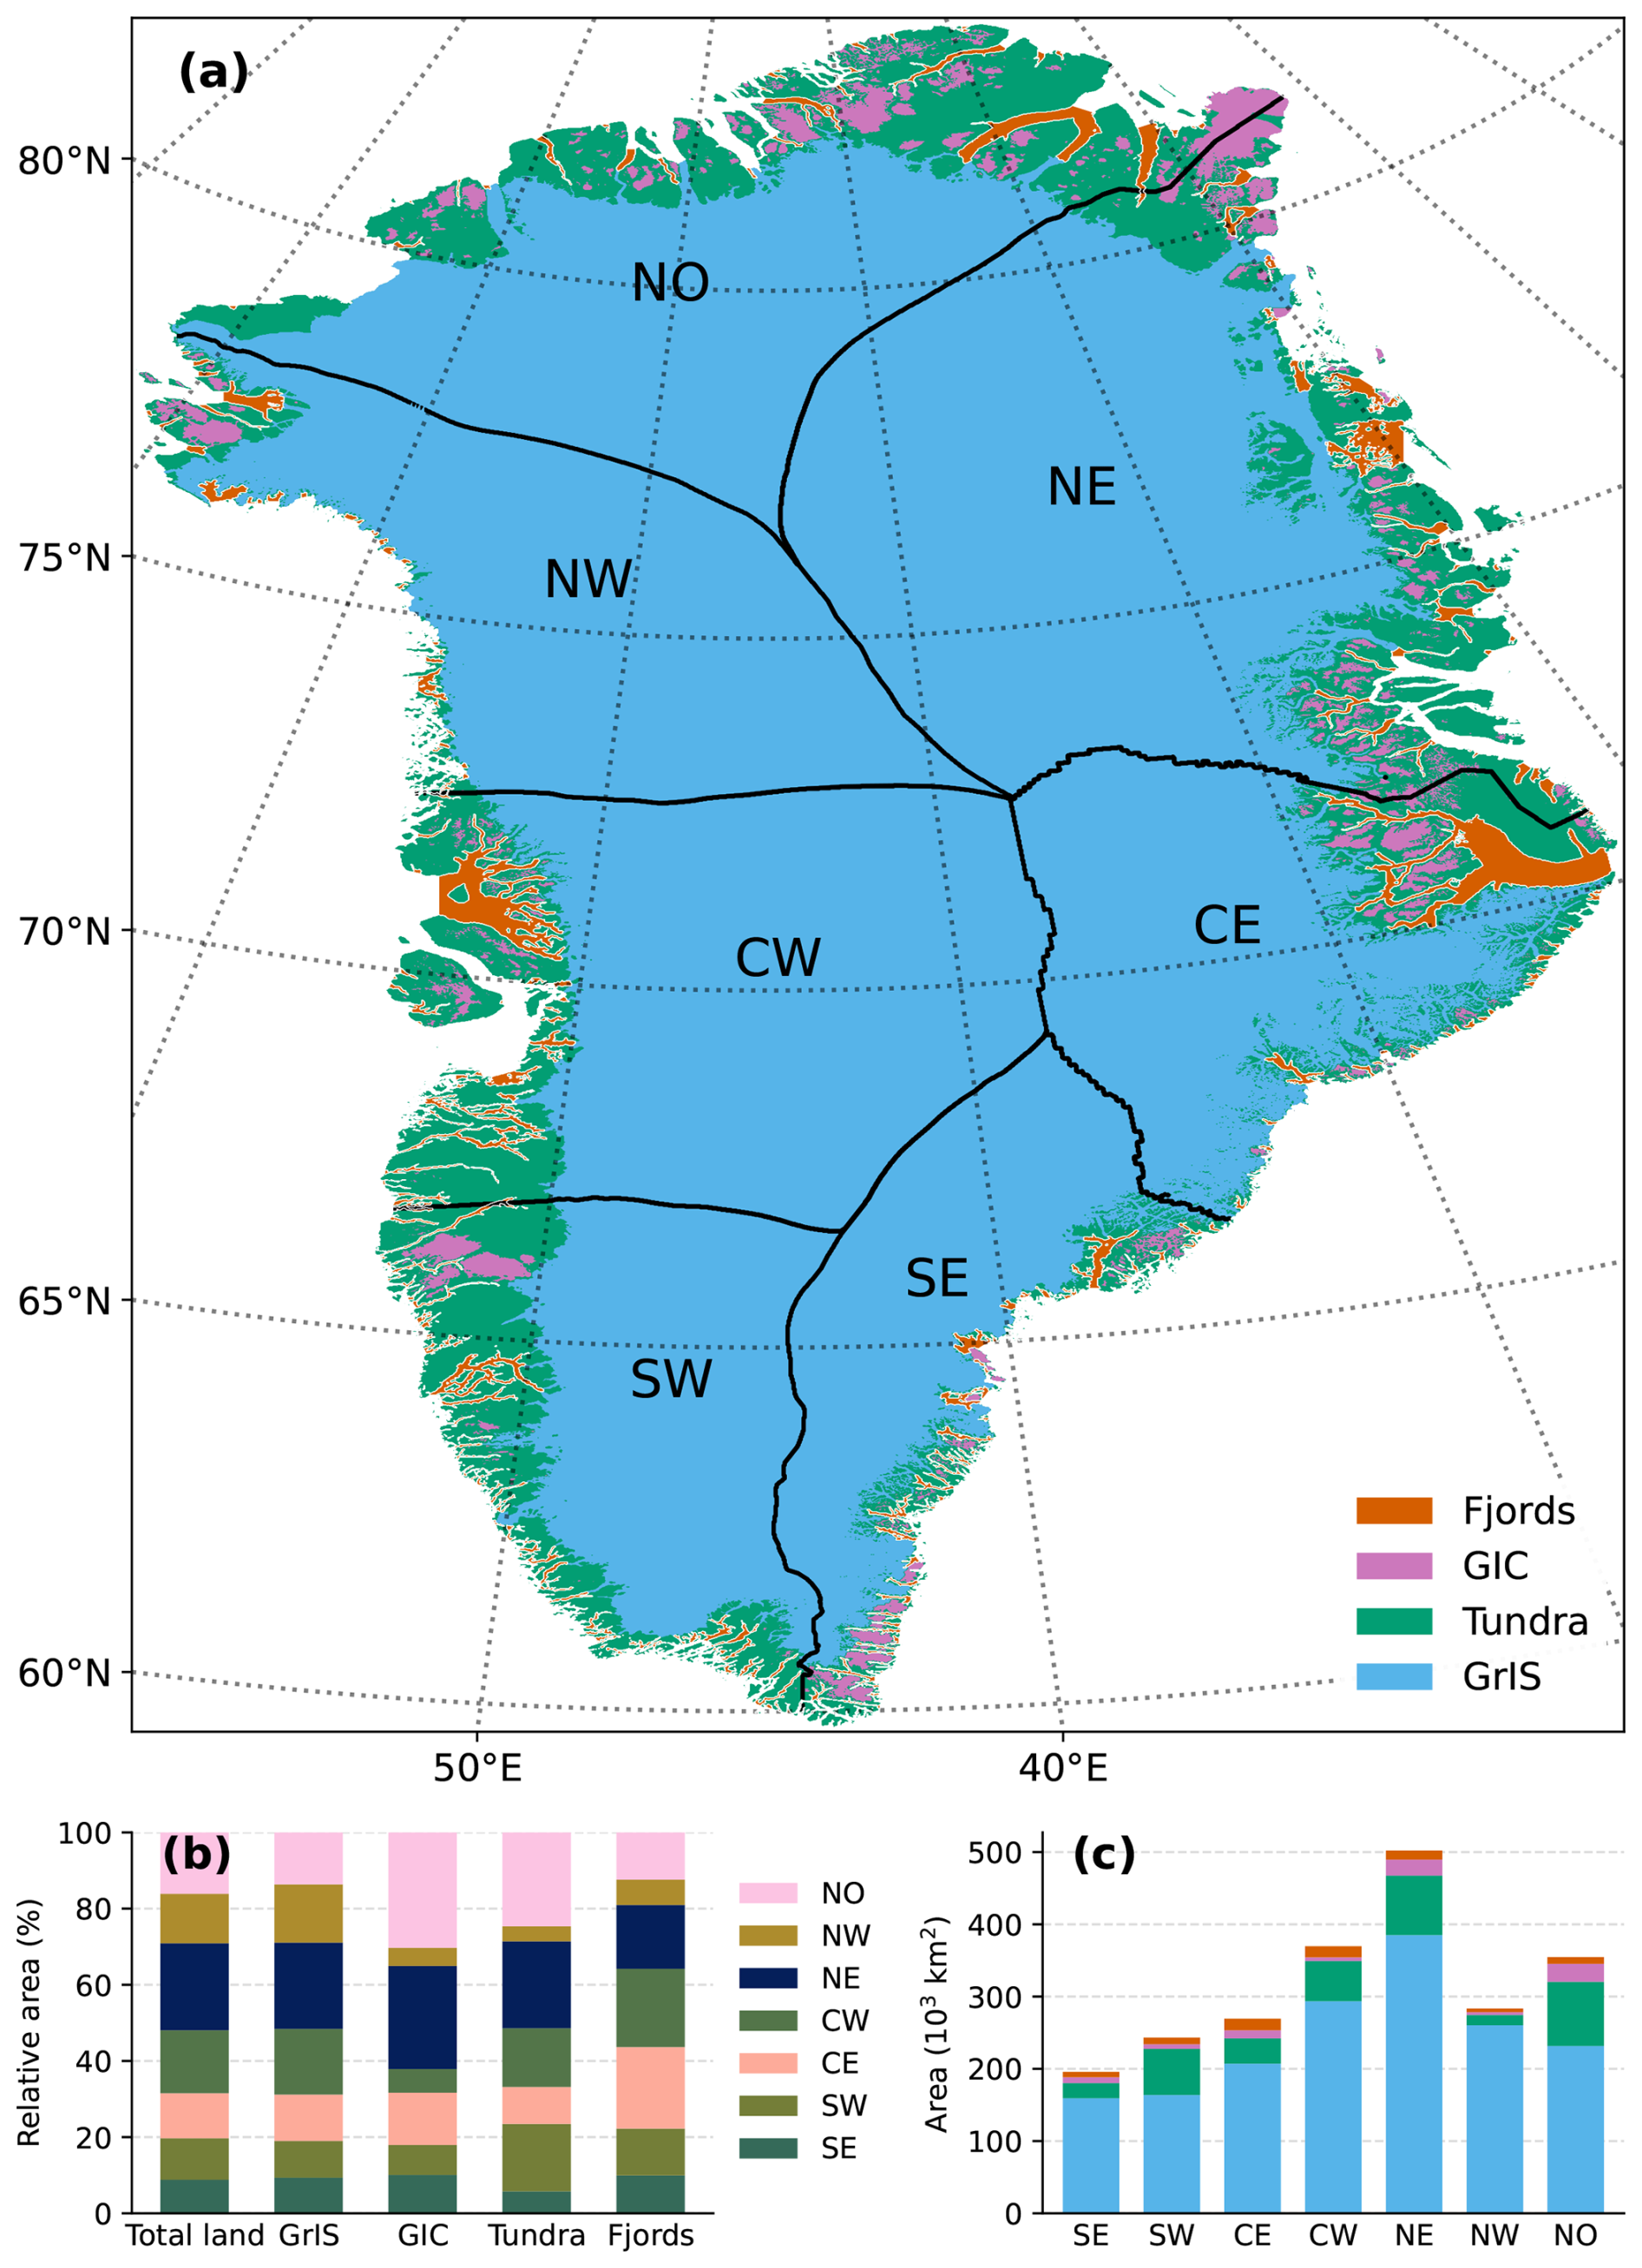
Figure 1(a) Masks of different surface types at 1 × 1 km2 resolution representing the contiguous Greenland ice sheet (GrIS; orange), tundra (green), glaciers and ice caps (GICs; purple), and fjords (red). Thick black lines delineate the seven climatological regions used in this study. (b) Relative contribution of different regions to total surface type area. (c) Total area per surface type and region.
3.1 Greenland-integrated freshwater input into fjords
Figure 2 shows a time series of the different components of the total annual freshwater input into Greenland's fjords, using six different data sources (see Methods). Combined, the annual total freshwater input into Greenland fjords averages 1144 (±170) Gt yr−1 (0.035 Sv, sverdrup) between 1990 and 2023, where ± in this section represents uncertainty per source described in the Methods (Sect. 2). The main contributor is solid ice discharge (462 ± 43 Gt yr−1), accounting for 40 % of the total. On average, GrIS (meltwater) runoff is the second-largest source of freshwater into the fjords (31 %, 357 ± 53 Gt yr−1), but in years with extreme surface melt, such as 2010, 2012, and 2019, GrIS runoff exceeds the contribution of solid ice discharge. The third-largest contributor is tundra runoff (15 %, 175 ± 17 Gt yr−1), followed by GIC runoff (6 %, 71 ± 28 Gt yr−1) and (fjord) precipitation (5 %, 54 ± 8 Gt yr−1). Basal melt contributes 2 % (23 ± 5 Gt yr−1).
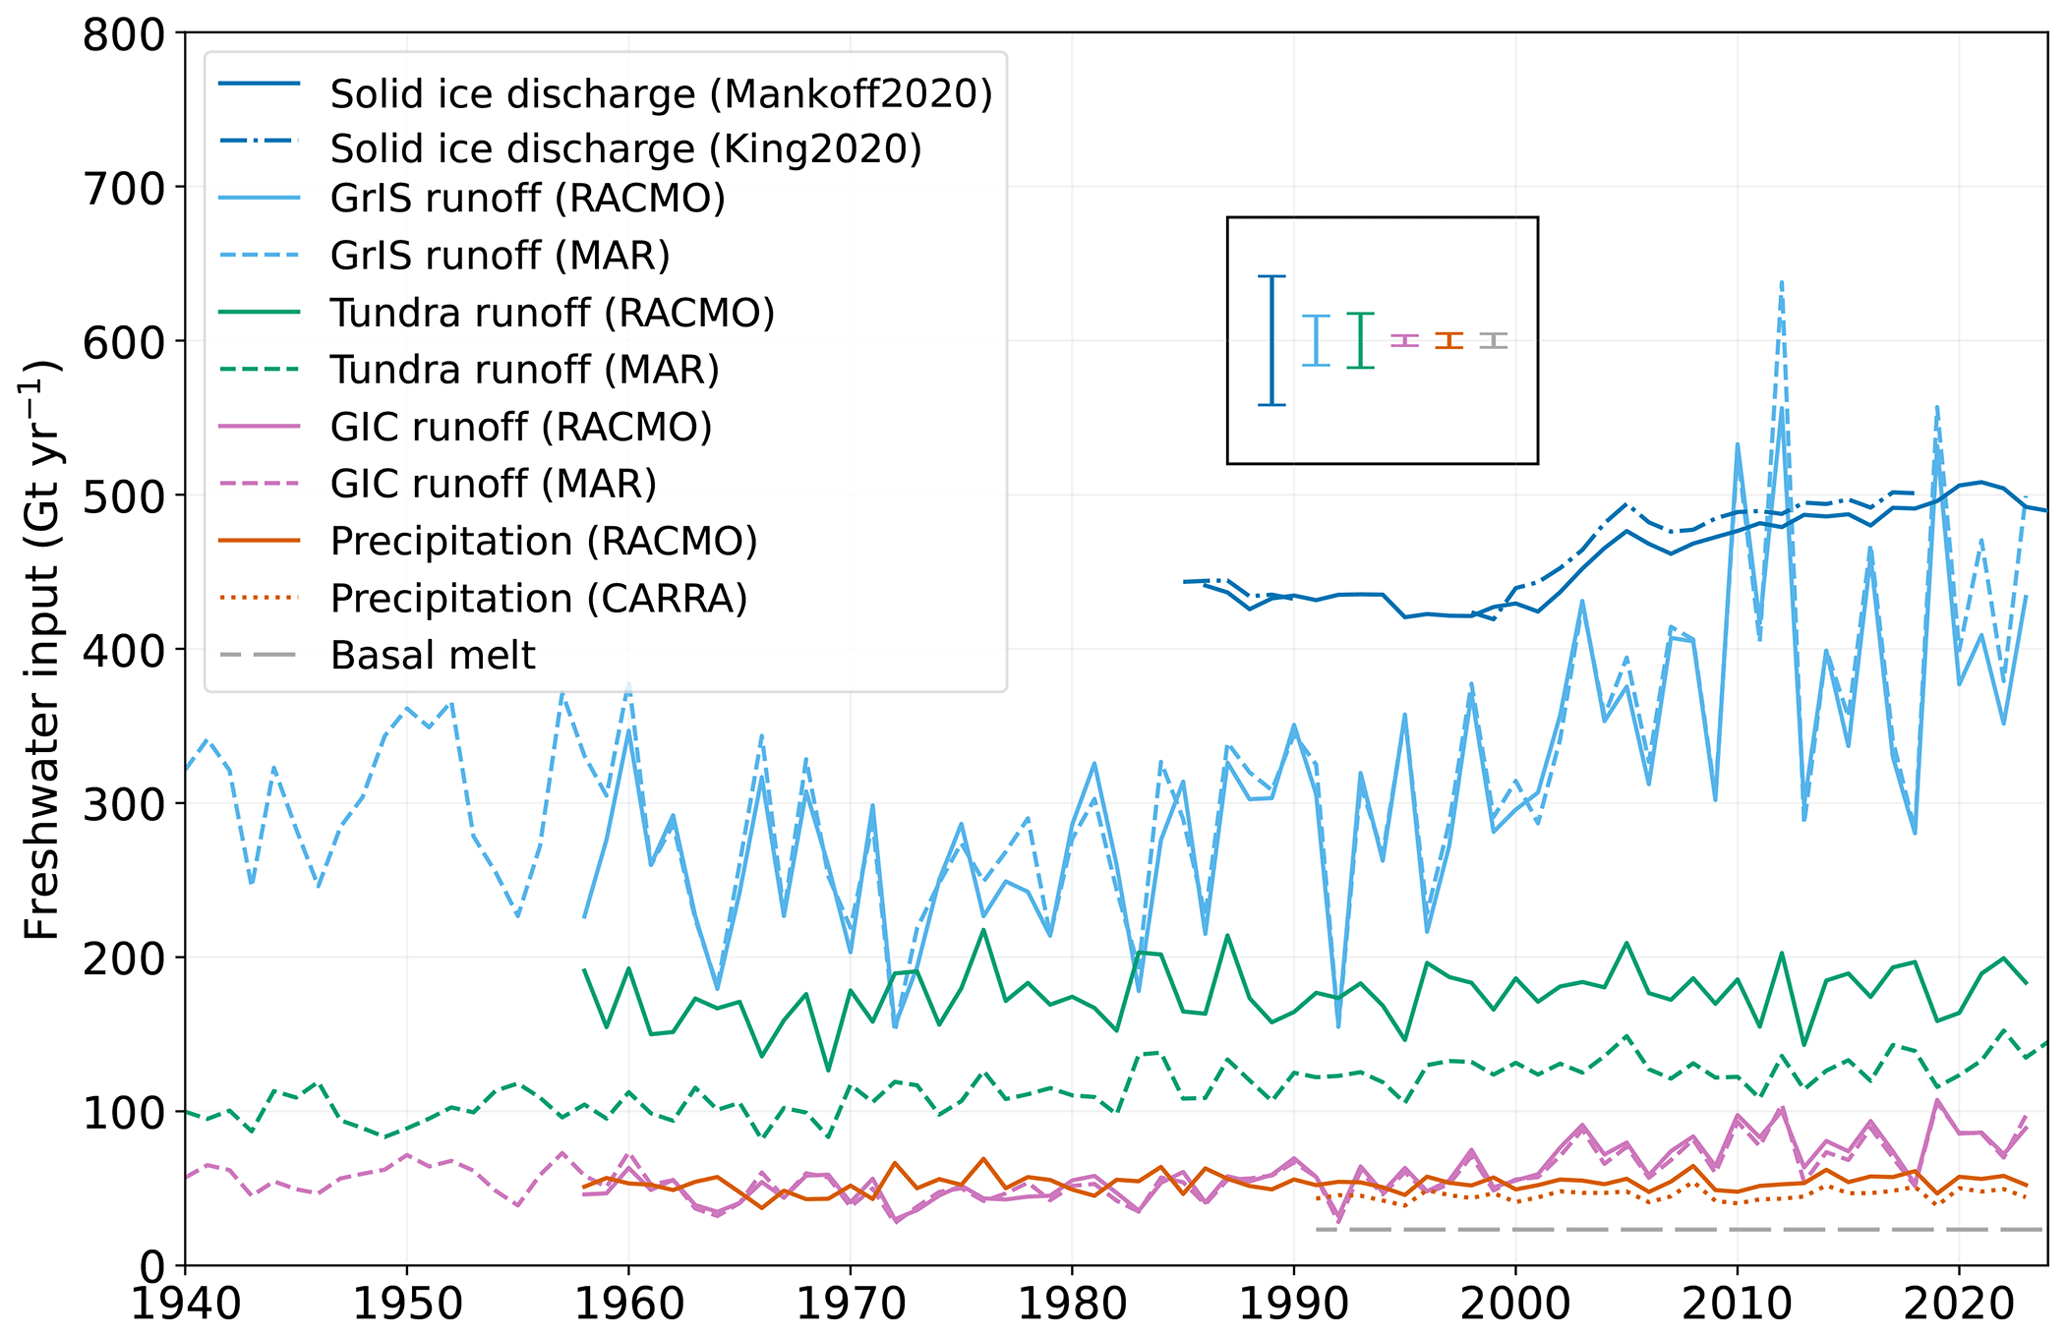
Figure 2Time series of annual, Greenland total freshwater input into fjords for different components between 1940–2023. Error bars represent typical uncertainty per freshwater source.
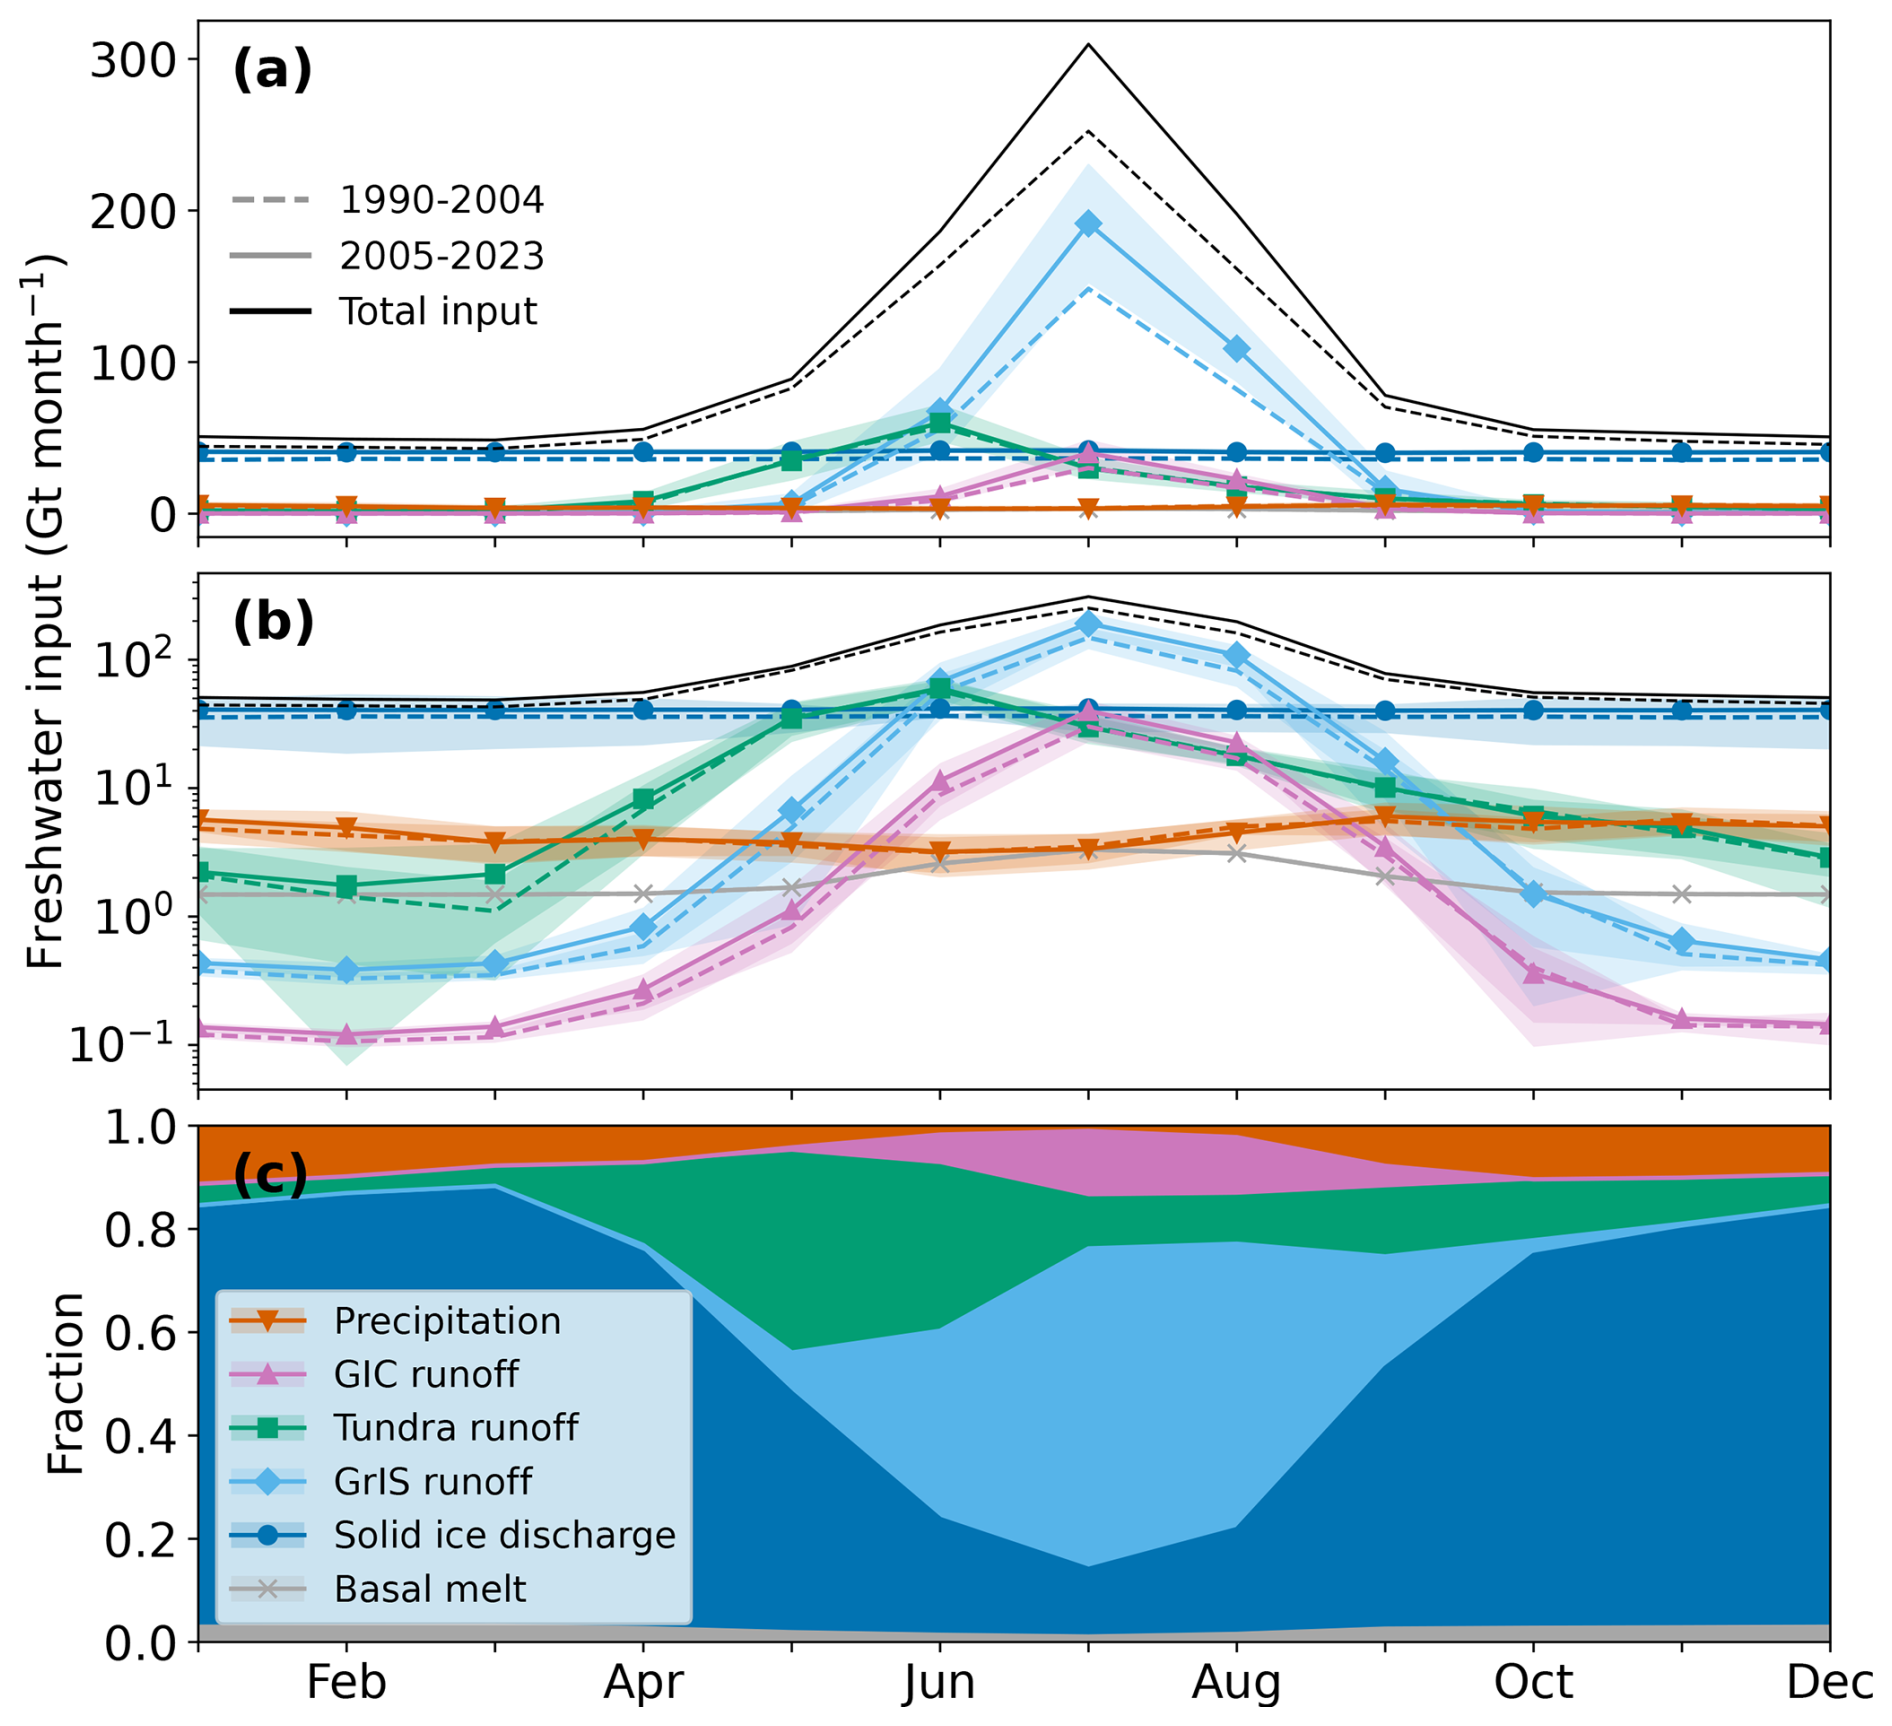
Figure 3Average seasonal cycle of components of Greenland total freshwater input with solid ice discharge (blue), GrIS runoff (orange), GIC runoff (purple), tundra runoff (green), and (fjord) precipitation (red) and basal melt (brown). (a) Average seasonal cycle of freshwater components and total (black) for 1990–2004 (dashed) and 2005–2023 (solid). Shading represents the standard deviation due to interannual variability. (b) As in (a) but with a log scale. (c) Seasonal cycle of the relative source contributions to the total freshwater input between 2009–2023 (see Methods). Datasets used are indicated in boldface in Table 1.
The period with data availability for all default components spans from 1990 through 2023, allowing for the calculation of absolute and relative changes in annual freshwater sources over time. Total average freshwater input since 2010 is 1239 (±180) Gt yr−1, calculated to compare to other studies in Sect. 4.1. The freshwater sources that have been increasing most rapidly since 1990 are GrIS and GIC runoff, whose relative contribution to the total fjord freshwater input increased by 0.17 % yr−1 (p=0.04) and 0.05 % yr−1 (p=0.002), respectively. Tundra runoff is also increasing in absolute terms but slower than the other components, resulting in a decrease in its relative contribution of 0.08 % yr−1 (p=0.002). Precipitation in fjords is changing very slowly in an absolute sense; i.e. its relative contribution is decreasing by 0.03 % yr−1 (p=0.01).
For the period when monthly resolution is available for all components (2009–2023), Fig. 3 shows the average seasonal cycle of the Greenland total freshwater input into fjords based on monthly sums using (a) absolute linear, (b) absolute logarithmic, and (c) relative scales. Figure 3c is based on the default datasets (Table 1), and values are presented in Tables A1 and A2. Most freshwater input occurs during July at the peak of the melt season (296 ± 57 Gt), and least occurs during March in late winter (48 ± 4 Gt). Freshwater input during winter months is primarily driven by solid ice discharge (82 ± 0.4 %, 41 ± 1 Gt per month, in DJF, December–January–February), whereas summer freshwater input is dominated by GrIS runoff (up to 68 ± 3.5 %, 172 ± 28 Gt per month, in July). Greenland tundra runoff peaks in early summer, when the seasonal snow melts (Fig. 3a) with a maximum of 36 ± 3 % of the total freshwater input occurring in May (Fig. 3c). While direct precipitation in fjords contributes little on average, when examined at a monthly scale, it can account for up to 11 ± 2 % of the total in January (Fig. 3c). Basal melt accounts for a maximum of 3 ± 0.6 % (March). There is an increase in summer GrIS runoff in the latter half of the period (2005–2023) compared to the first half (1990–2004), along with a rise in monthly solid ice discharge (Fig. 3a).
3.2 Regional freshwater input into fjords
In order to study how the sources of freshwater are influenced by different climatic conditions across Greenland, surface types, (sea) ice conditions, and fjord geometry, Greenland is divided into seven different regions (Fig. 1). First, we discuss the time series of annual totals per region (Fig. 4) and then the seasonal cycle focusing on the relative contributions of the freshwater sources (Fig. 5). In the following paragraphs, we will report 1990–2023 annual means of datasets indicated in boldface in Table 1, with a standard deviation of the annual values (±), unless reported differently. The absolute and relative average values can be found in Tables A3 and A4, respectively. These results will be put into a climatological context in the Discussion (Sect. 4.2).
Annual freshwater input shows large variations between the regions, but on average freshwater input per sector is 251 Gt yr−1 for SE, 178 Gt yr−1 for SW, 179 Gt yr−1 for CE, and 183 Gt yr−1 for CW, and for the northern regions it is 119 Gt yr−1 for NE, 146 Gt yr−1 for NW, and 88 Gt yr−1 for NO between 1990 through 2023 (Fig. 4). In NO (Fig. 4a), which in an absolute sense provides the least freshwater to fjords of all basins, all freshwater sources except (fjord) precipitation increase over time. Other regions did not have a significant trend in precipitation. This region typically has large interannual variability in all runoff sources. At the start of the period, solid ice discharge was dominant (24 ± 2 Gt yr−1, 1990–2004), but later in the period GrIS runoff took over as the dominant freshwater input in NO fjords (36 ± 11 Gt yr−1, 2005–2023). In NO, tundra runoff has a relatively large share in the total regional freshwater input (17 ± 3 Gt yr−1) compared to other regions, which is associated with the relatively large tundra area in this dry part of Greenland, where the ice sheet is mainly land-terminating (Fig. 1b). The pattern for NE (Fig. 4b) is similar to the pattern for NO, with the exception of a relatively smaller role of GIC runoff (12 ± 4 Gt yr−1) and even more tundra runoff (30 ± 5 Gt yr−1), making the latter occasionally the largest freshwater contribution in this region. In contrast, the wetter NW (Fig. 4c) has glaciers that are mainly marine-terminating, with a relatively narrow tundra and a small fjord area (Fig. 1b). Here, the freshwater input into fjords is clearly dominated by solid ice discharge (100 ± 8 Gt yr−1), which is greater than the combined contributions of all other sources. GrIS runoff accounts for approximately 30 % of the input, while the other sources are relatively small. The NW solid ice discharge has been increasing since the early 2000s, in line with earlier work that diagnosed the cause to be increasing ocean temperatures (Wood et al., 2018).
In CW (Fig. 4d), the contribution of GrIS runoff (63 ± 18 Gt yr−1) has been increasing but with high interannual variability. In recent years, it has been occasionally larger than solid ice discharge, which remains the overall main contributor (83 ± 9 Gt yr−1). In contrast to most other regions, solid ice discharge decreased between 2013 and 2018 (Fig. 4d). Tundra runoff is relatively large in this region (21 ± 3 Gt yr−1). Basal melt, (fjord) precipitation, and GIC runoff are of a similar small magnitude, with each contributing 3 % to the annual total. In CE (Fig. 4e), the largest input source is solid ice discharge (77 ± 6 Gt yr−1), closely followed by GrIS runoff. Tundra runoff is approximately twice as large as GIC runoff (11 ± 2 Gt yr−1) or (fjord) precipitation (14 ± 3 Gt yr−1). This is the region where (fjord) precipitation has the largest relative contribution (up to 20 %), partly due to the relatively large fjord area (Fig. 1c). The largest and an increasing contributor in the SW (Fig. 4f) is GrIS runoff (80 ± 23 Gt yr−1). Especially before 2006, tundra runoff (55 ± 9 Gt yr−1) incidentally exceeded GrIS runoff during cold summers. Finally, the wet SE (Fig. 4g) has a narrow ablation zone, and the freshwater input into SE fjords is dominated by solid ice discharge (138 ± 7 Gt yr−1). Similar to NW, solid ice discharge in SE has been gradually increasing since the early 2000s (Fig. 4g).
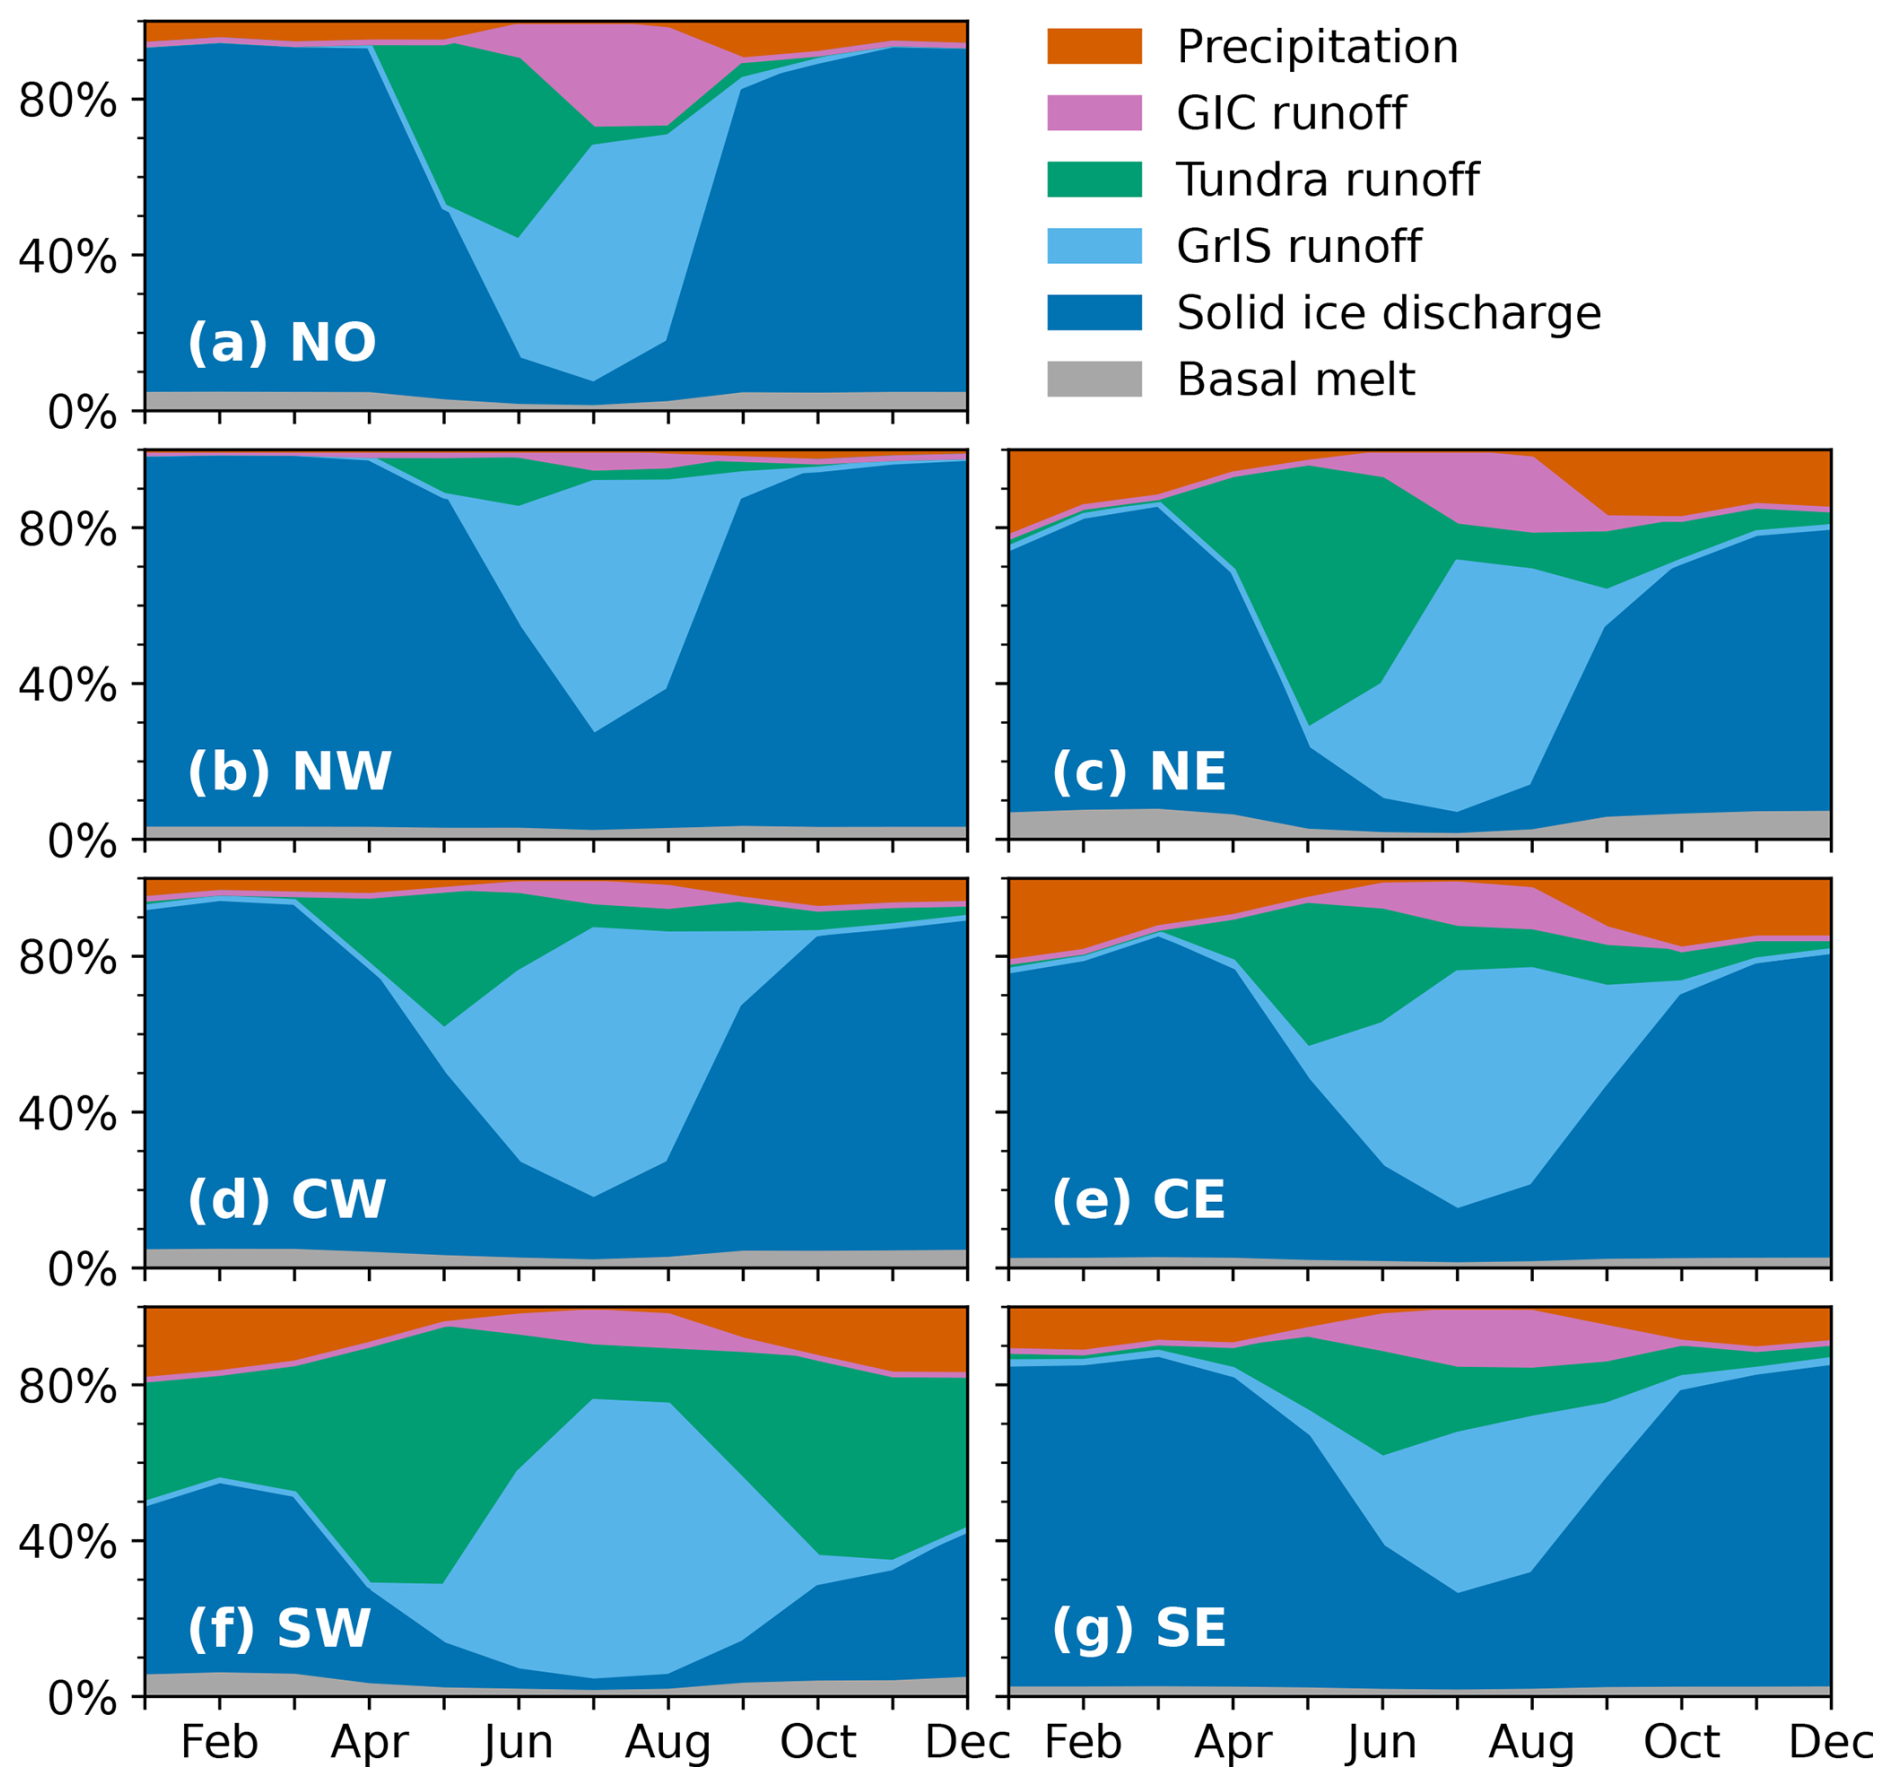
3.2.1 Seasonal cycle of relative freshwater contributions per region
To further characterize the freshwater sources geographically and temporally, Fig. 5 shows the seasonal cycle per region based on the relative monthly contributions since 2009, for datasets indicated in Table 1. In all regions, GrIS runoff is the dominant freshwater source in July and August (Fig. 5), underlining the non-uniform distribution of this freshwater flux through the year, with a strong summer peak. In some regions (SE, NW) with high accumulation and/or narrow ablation zones, however, the contribution of GrIS runoff in summer is only slightly larger than that of solid ice discharge in the same months (Fig. 5b, g). Both GrIS and GIC runoff have their largest contributions in July, but their relative contribution varies per region. In NO, the latter accounts for up to 25 % of the annual freshwater input (Fig. 5a), while in NW, it does not exceed 5 % (Fig. 5b). The relative contribution of solid ice discharge is always important in winter when the runoff fluxes are small. Regional variations occur during summer, when the solid ice discharge share is low in the SW (Fig. 5f), while in other regions (NW, SE) it remains the second-largest freshwater source throughout summer (Fig. 5b, g). The largest share of tundra runoff of all seasons and regions (69 %) is in May in SW (Fig. 5f). In the SW, tundra runoff even contributes in winter leading to the highest annual average (31 %), due to the relatively high proportion of non-glaciated areas in the region and the year-round occurrence of seasonal snowmelt (Fig. 1b). In other regions, the tundra runoff contribution to total freshwater input also peaks in May. There are similarities between the seasonal cycle for each region, and many sources peak in the same month. However, the magnitude of this source's contribution to the total freshwater input, as well as its relevance at any given time, varies.
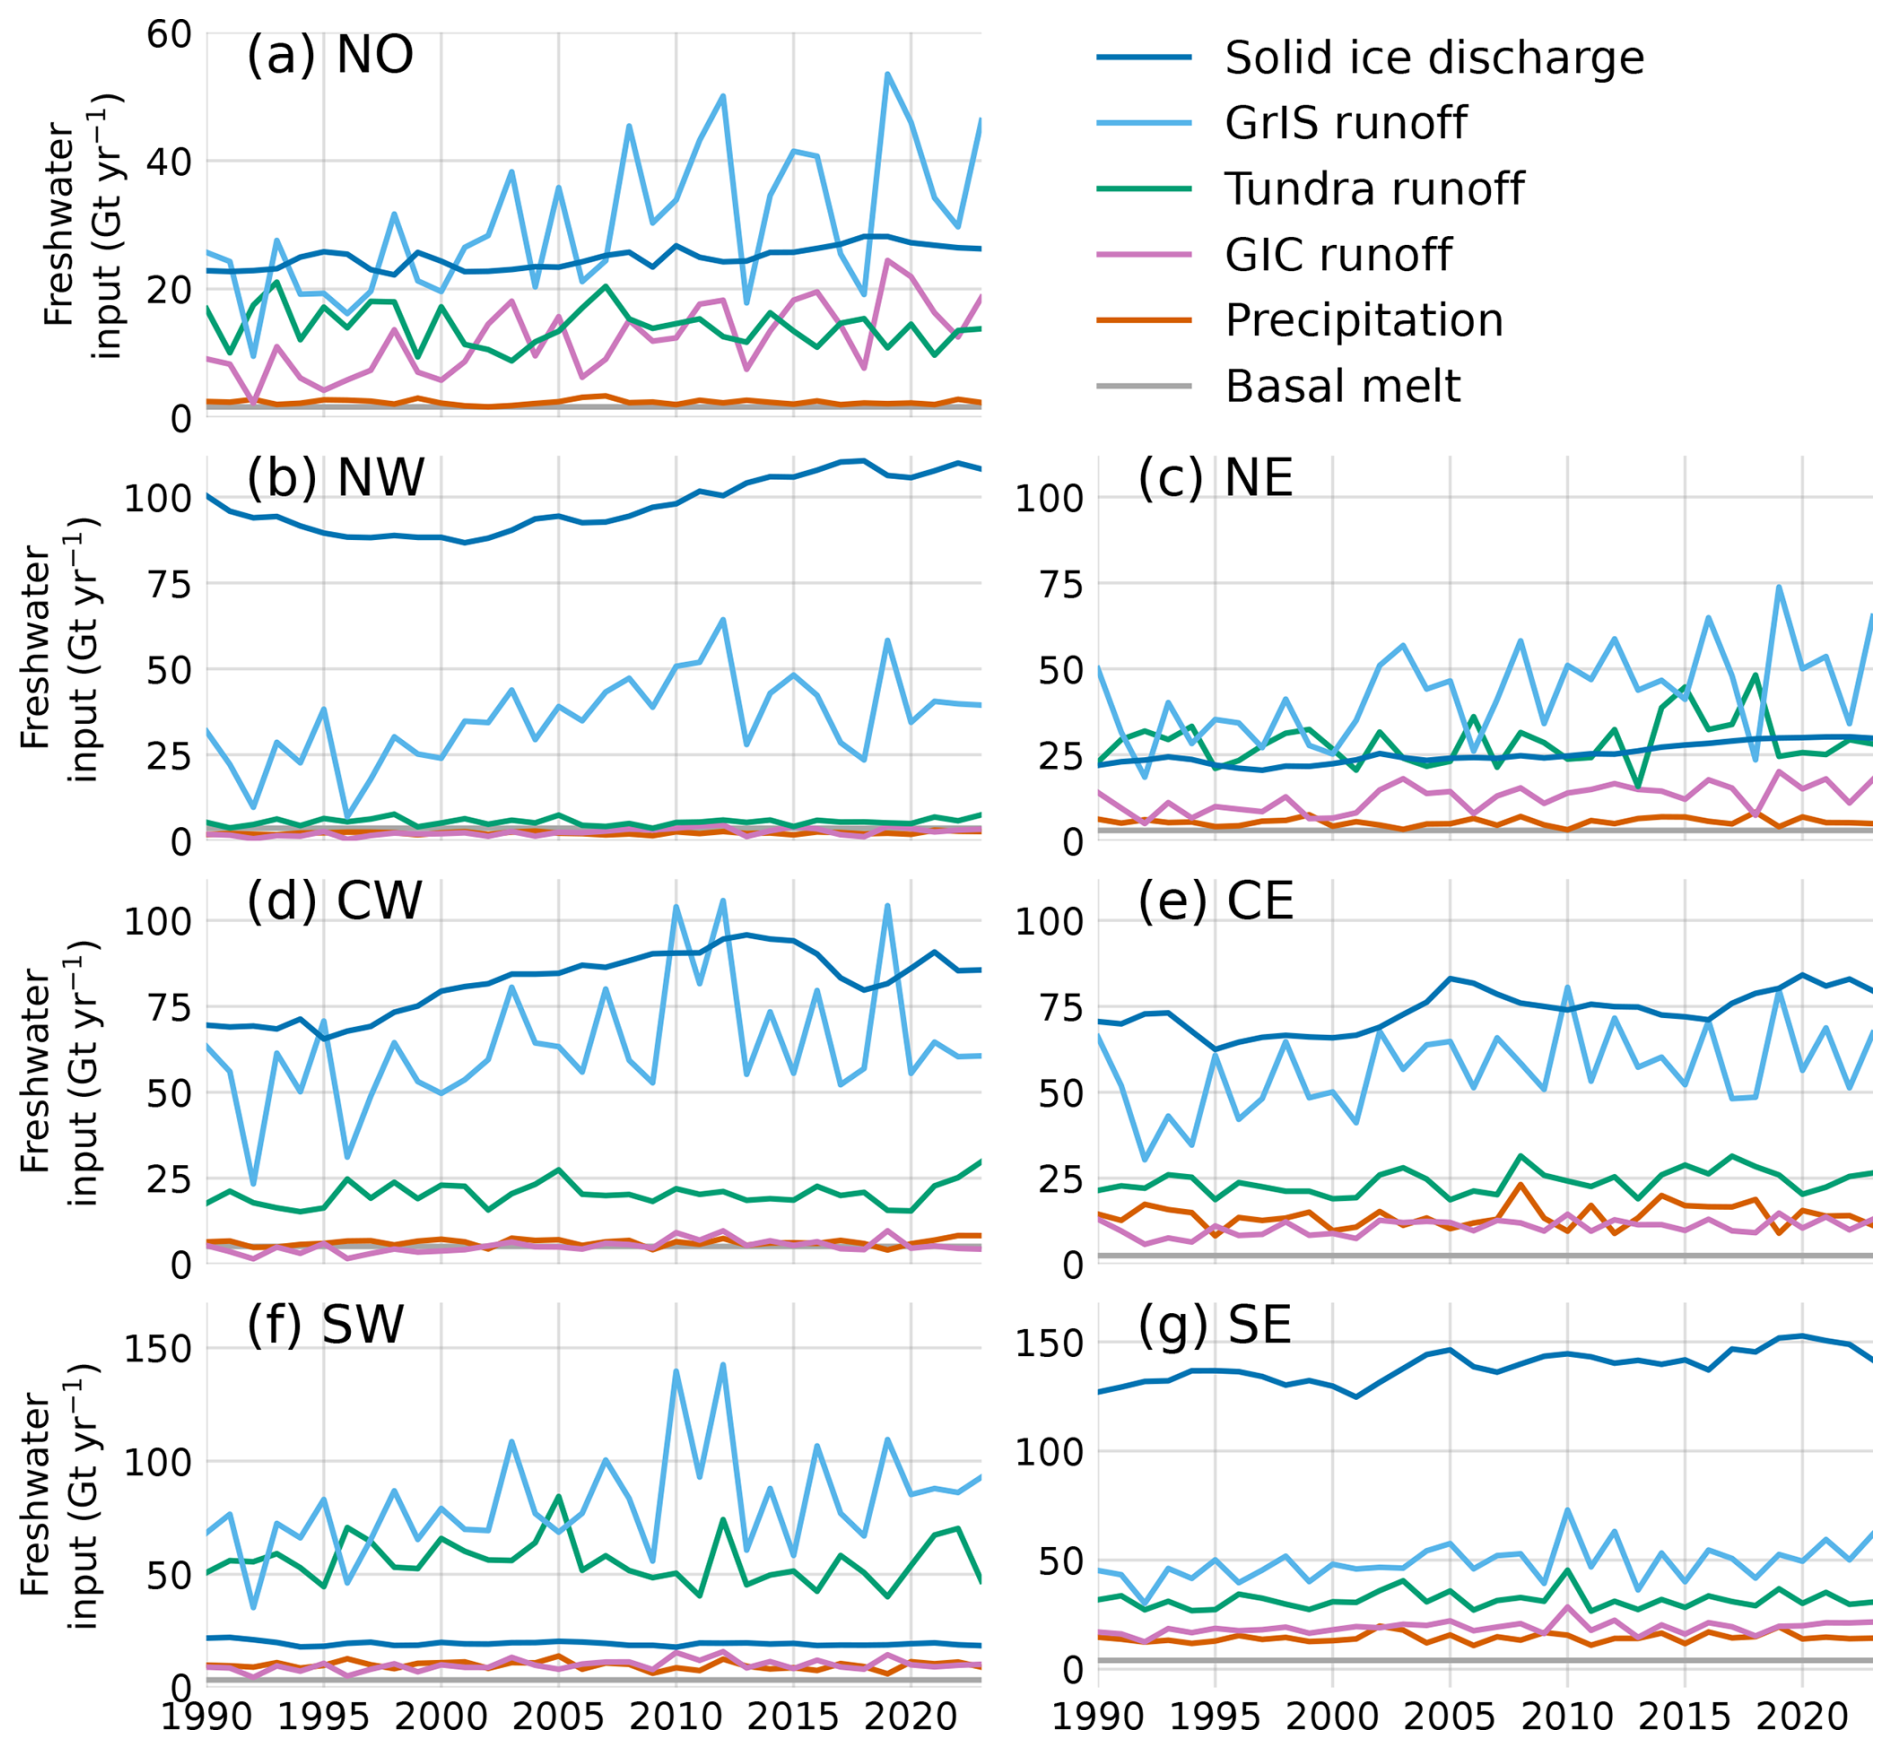
Figure 4Time series of annual freshwater input per region between 1990–2023. Datasets used are indicated in boldface in Table 1.
3.2.2 Trends in seasonal freshwater input
Using the monthly data from 1990 through 2023, (sub)seasonal trends in the various freshwater components are examined. All freshwater sources originating from land ice, i.e. GrIS solid ice discharge and GrIS and GIC runoff, are increasing in all regions and have been discussed previously. However, the patterns for tundra runoff and (fjord) precipitation are more ambiguous and will be discussed in further detail below.
A positive trend in tundra runoff is found for CE, NW, NE, and SE in different seasons. In CE, an increase of 0.15 ± 0.04 Gt yr−2 (p=0.002) is observed, with more than half of the absolute increase occurring in summer (JJA, June–July–August). In NW, tundra runoff increased by 9 % or 0.05 ± 0.01 Gt yr−2 (p=0.002), of which 0.03 Gt yr−2 was in JJA (p=0.02), due to increasing annual precipitation. In NE, tundra runoff has been increasing by 0.20 ± 0.09 Gt yr−2 (p=0.043). In SE there is a positive summer (JJA) trend of 0.05 (±0.03) Gt yr−2 (p=0.07, 2.5 % of total annual precipitation). No significant trend was found for tundra runoff in other seasons or regions.
Fjord precipitation mostly shows no significant trends except in CE and SE. CE has an increase in the months September–October of 0.04 Gt yr−2 (±0.02, p=0.02). In SE, there is a spring (MAM, March–April–May) increase of 0.04 ± 0.02 Gt yr−2 (p=0.01) (3 % of total). In summary, there is an increase in summer tundra runoff in CE, NW, and SE, and in CE and SE there is a small (fjord) precipitation increase in spring and fall.
4.1 Comparison with other research
This study uses regional climate model data and observations of solid ice discharge to estimate the freshwater input from different sources entering Greenland's fjords. We find an average total annual Greenland freshwater input into fjords of 1.14 × 10³ Gt yr−1 for 1990–2023 (1.24 × 10³ Gt yr−1 since 2010). We estimate uncertainty to be 20 %, based on lower estimates for Greenland-wide surface mass balance. The average annual rates are compared for 2010–2016, a period with a relatively smaller trend than the preceding years and covered by all studies in this comparison. The annual rate in this study is slightly smaller than the total Arctic freshwater input found by Bamber et al. (2018) (1300 Gt yr−1 since 2010), which included non-Greenland ice caps. The region we study is a subset of the broader Arctic region analysed by Bamber et al. (2018), making their estimate useful for context and as an upper bound for our values. GrIS runoff between 2010–2016 is higher in Bamber et al. (2018) and Igneczi and Bamber (2025) than estimated in this study. Before 2000, GrIS runoff was significantly higher in Bamber et al. (2018) than in this study (∼ 350 vs. ∼ 250 Gt yr−1).
We find higher tundra runoff than Bamber et al. (2018) (150 vs. 80 Gt yr−1) and than Mankoff et al. (2020a) (100–130 Gt yr−1). Igneczi and Bamber (2025) estimated a total tundra runoff based on MAR of between 140–160 Gt yr−1 (1950–2021), similar to values found in this study using RACMO output (Sect. 3.1). Observational studies show that tundra and GrIS and GIC runoff estimates are very sensitive to the selected region and are easily underestimated in regional climate models, with differences of up to 30 %–50 % between point measurements and regional climate models when specifically matching regions or even more than 100 % for smaller catchments (van As et al., 2014, 2018; Mankoff et al., 2020a; Abermann et al., 2021). Yet, there are very few observational studies of total Greenland runoff and even less on tundra runoff, making estimates of the latter the least certain factor in the total freshwater input in its surrounding fjords and seas in this study.
4.2 Differences between regions and their implications
To determine potential drivers behind these regional differences, freshwater components were correlated with the melt-over-accumulation (MoA) ratio (Sect. 2.3), based on land-ice-integrated mass fluxes in each region (Fig. 6a, b). The MoA ratio has been used previously in firn studies to determine the climatic conditions under which melt would generate runoff in the accumulation zone. Previous work has identified a theoretical MoA ratio threshold between 0.6 and 0.7, indicating the onset of runoff (Pfeffer et al., 1991; Braithwaite et al., 1994). More recently, MoA has been used to predict when melt ponding starts on Antarctic ice shelves (van Wessem et al., 2023). In this study, MoA is used as a climatological indicator over the ice sheet, which we hypothesize is highly relevant to the partitioning between solid ice discharge and liquid water runoff into fjords. MoA does not directly depend on runoff but on melt as well as snowfall; the relative regional sizes of ablation and accumulation areas and the potential for meltwater buffering (through snowfall) also become important. We find that the fraction of total freshwater by solid ice discharge is strongly and negatively correlated with MoA (Fig. 6a), while tundra runoff fraction shows a strong and positive correlation (Fig. 6b). A somewhat weaker correlation exists between the fraction of total freshwater of GrIS runoff and MoA (r=0.78, p=0.04, not shown). Furthermore, the regional fractions to total freshwater input of both GrIS and tundra runoff decrease with an increasing fraction of solid ice discharge (Fig. 6c, d). Yet, no such relation is found for fraction of GIC runoff or precipitation. These results can be intuitively understood: in a region with a smaller MoA ratio, i.e. experiencing relatively low melt and/or high accumulation, the ice sheet extends further towards and into the ocean. This leads to relatively narrow tundra and ablation zones and a higher contribution of solid ice discharge at the expense of GrIS and tundra runoff. To our knowledge, no studies have identified a strong link between MoA and freshwater input fractions in Greenland fjords. In contrast, freshwater input fractions into fjords poorly correlate with temperature, melt, or snowfall. This novel result will facilitate the interpretation of e.g. future changes in the distribution of freshwater fluxes in terms of climate change. Higher temperatures increase melt, hence GrIS runoff, and allow for a higher exposed-land fraction, while more solid precipitation has the opposite effect. Both southern regions are relatively mild, but due to their different precipitation regimes, their freshwater fractions are different. Similarly, the NW sector is drier than the SW sector, but because of the lower temperatures, the freshwater fluxes in the NW are even more dominated by solid ice discharge than the SE sector.
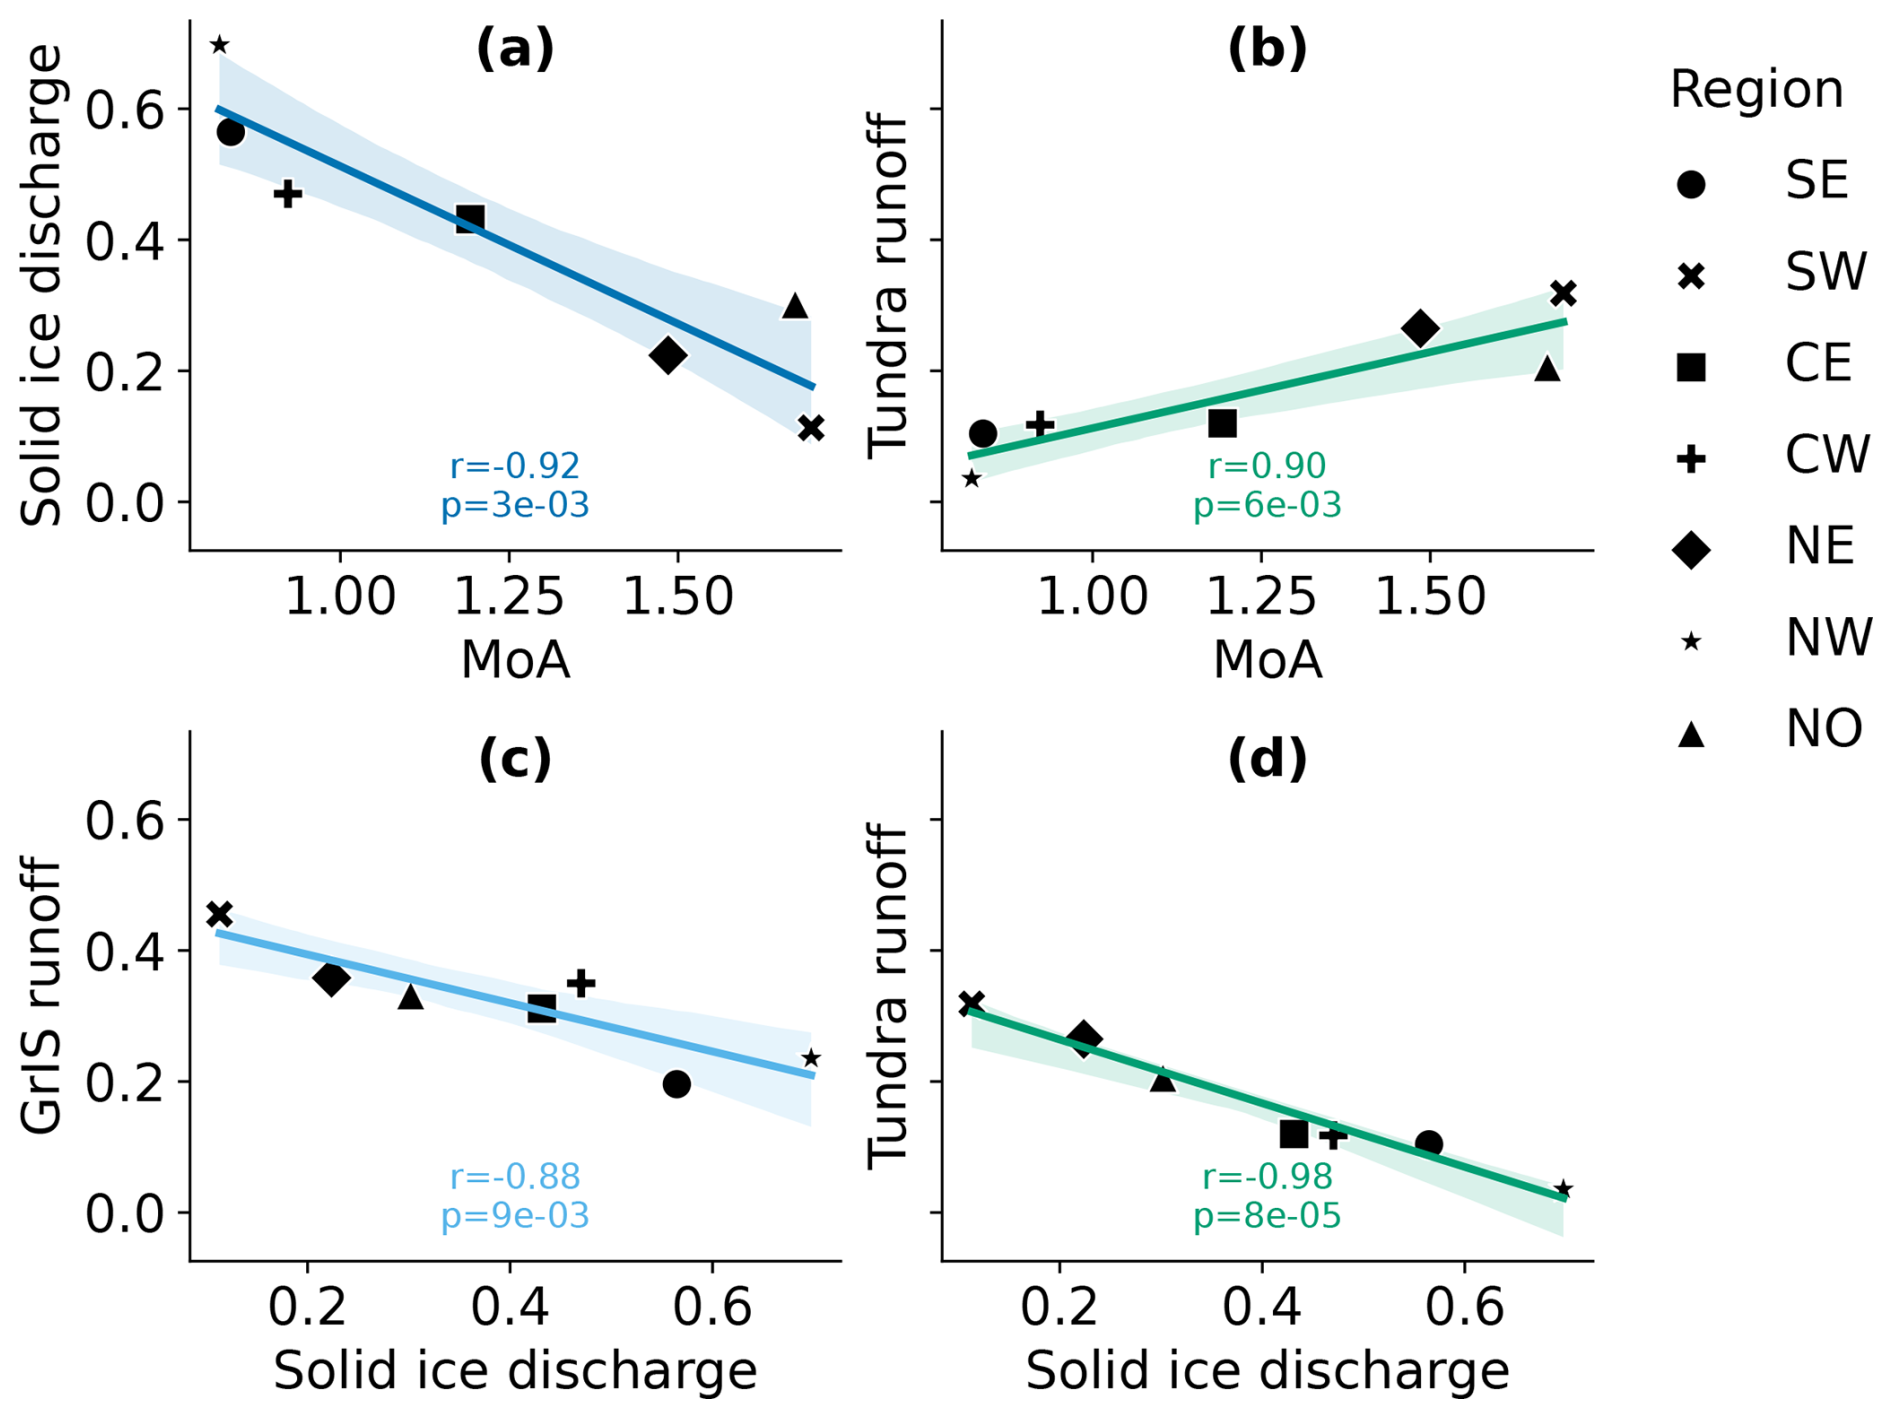
Figure 6Correlation plots for the seven regions between the (a) fraction (of total freshwater input) of solid ice discharge and MoA, (b) fraction of tundra runoff and MoA, (c) fraction of solid ice discharge and fraction of GrIS runoff, and (d) fraction of solid ice discharge and fraction of tundra runoff and their respective r and p values.
4.3 Contribution of tundra runoff and (fjord) precipitation
Annual mean tundra runoff is on average 15 % of the total runoff (1990–2023), exceeding the relative contributions estimated in previous work (9 %–11 % estimated from Fig. 3 in Bamber et al., 2018). Seasonal contributions from tundra runoff and fjord precipitation to Greenland-wide freshwater input can reach up to 35 % and 11 %, respectively. The south and east of Greenland have relatively high precipitation rates (Fettweis et al., 2020; van Dalum et al., 2024), which leads to the regions CE, SE, SW, and NE having a relatively high contribution of fjord precipitation to the total freshwater input (monthly percentages up to 22 %, 12 %, 20 %, and 22 %, respectively), especially from October until April, when runoff is small (Fig. 5). This study also identifies an increase in summertime fjord precipitation in CE and SE, but no significant trends in annual totals are found. Although summertime fjord precipitation has a relatively low contribution to the total freshwater input, its impact differs from runoff as all precipitation enters the fjord surface waters directly in a relatively spatially homogeneously fashion, thereby increasing stratification. While the precipitation phase (liquid or solid) is unlikely to have a large impact on freshwater input, it has a large impact on the heat budget. For example, snowfall into fjords can have a cooling effect on the upper layers, decreasing stratification, but this is outside the scope of this study.
In CE, NE, NW, and SE we find an increase in (summer) tundra runoff. Compared to glacial runoff, tundra runoff brings a different type of nutrients to fjords, and its entry point is less concentrated than runoff and solid ice discharge from marine-terminating glaciers. This ultimately affects ecosystems (Hopwood et al., 2020), e.g. by shifting spring blooms to different communities. Despite the increase in absolute tundra runoff, its relative importance for the fjord freshwater balance is decreasing in time as freshwater sources from land ice are increasing more rapidly. An obvious reason is the limited water storage in the tundra seasonal snow cover compared to land ice.
4.4 Sensitivity to the fjord definition
The region covered by a fjord is hard to define, and some freshwater studies only considered land surface basins (Khan et al., 2022) or included or excluded large bays such as Disko Bay and Kangertittivaq (formerly known as Scoresby Sund). To address the sensitivity of our results regarding how fjords are defined, we performed a fjord area sensitivity test. When being more lenient in the algorithm outlining fjords to include bays such as Disko Bay and by running the algorithm not only for the mainland but also for all barrier islands, the total fjord (and bay) area increases by up to 87 % (Fig. A1). The largest relative increase in area is found in the NW (and NE) at +177 % (+160 %), while in CE, the fjord area only increases by 7 %. This results in up to 186 % (181 %) increases in (fjord) precipitation in NE (NW) and 15 % more in CE. In NE and NW, this increases the relative contribution of (fjord) precipitation from 5 % to 8 % and from 2 % to 3 % between 1990–2023. In CE, we find an increase from 8 % to 9 %.
4.5 Choice of data sources
In the previous sections, we used RACMO-based freshwater fluxes and solid ice discharge from Mankoff et al. (2020b). As discussed in this section, using alternative estimates does not considerably change the absolute and relative contribution of the freshwater input sources. CARRA gives slightly lower (fjord) precipitation values than RACMO (on average 7 Gt yr−1 less or 15 %), but the temporal variability is comparable (Fig. 2). The lower precipitation results in a decrease in the maximum (monthly) share of fjord precipitation from 12 % to 10 %. Regionally, the difference is largest in the SW in DJF (+3 %), which is true for most regions, except for NO, where the largest reduction in the total share is in May (−3 %) (Fig. A2).
GrIS runoff from MAR is higher than RACMO (+3 %, 1990–2023), especially since 2010 (+5 %) (Fig. A3). This is not the case for GICs, which is 3 % lower in MAR on average (1990–2023). The impact on the relative share of GrIS runoff to freshwater is only +1 % (1990–2023). Regionally, the differences between MAR and RACMO are most noticeable in NW (+8 Gt yr−1), SW (+11 Gt yr−1), and CE (−9 Gt yr−1). The difference leads to a higher share of GrIS runoff when using MAR in NO, NW, and SW (+2.3 %, +3.6 %, and +3.4 %, respectively) and a lower share in CE (−3.4 %). For GIC runoff, the largest change is −3 Gt yr−1 in MAR in NE, reducing the relative share of GIC runoff by 1.9 % in NE.
We find that tundra runoff in RACMO is 36 % higher than in MAR (175 vs. 128 Gt yr−1, averaged over 1990–2023). Differences are especially large in NO and NE, where the difference is 8 Gt yr−1 (47 %) and 13 Gt yr−1 (43 %), respectively. Using MAR tundra runoff thus results in a decrease in the tundra runoff contribution to the total freshwater input in fjords of 9 % and 17 %, respectively. This shows that in MAR the contribution of tundra runoff remains significant, but the large model differences require further investigation.
Solid ice discharge in Mankoff et al. (2020b) is only 0.9 % smaller than in the study by King et al. (2020). For their common epoch of monthly values (2009–2018) (see Sect. 2.1.3), the datasets agree on annual totals (Fig. 2). The latter dataset shows larger seasonal variability, resulting in a small maximum mean increase of 1 Gt in July over the whole of Greenland (Fig. A5) and a small relative change compared to the other components of 0.4 % in September (Fig. A5). Regionally differences are larger, leading to relatively less solid ice discharge in NO, NW, and CE, decreasing the percentage share of solid ice discharge by 1.5 (±0.3) % on average (Fig. A5). In the other regions (NE, CW, SW, SE) the relative share of solid ice discharge increases by 0.6 (±0.3) % on average. The changes are not uniform over the months but are still considered small. We conclude that uncertainty due to the use of different data sources is less than the interannual variability during the period 2009–2023.
4.6 Neglected processes and fluxes
Apart from the above-discussed uncertainties, this study covers freshwater input but not the freshwater budget of fjords. It moreover neglects (i) the storage effect of sea ice, i.e. collecting snow and rain accumulation; (ii) the advection of sea ice into and out of the fjords; and (iii) sea ice preventing precipitation from directly entering the fjord waters. The effect of sea ice on the fjord's freshwater budget varies per region and season. Most sea ice in Arctic fjords is landfast and thus will melt in the same fjord where it originally formed, temporarily storing freshwater rather than being a separate source (Cottier et al., 2010). Large regional and temporal variability exists in sea ice presence and the timing of formation and melt. In SE Greenland, Arctic sea ice can originate offshore, importing freshwater, while fjords in the SW can remain largely ice-free throughout the year (Moon et al., 2024; Stuart-Lee et al., 2021). The timing of seasonal sea ice break-up differs regionally: in SE Greenland, it occurs between May and August, while NO fjords can be ice-covered throughout most of the year (Moon et al., 2024; Johnson et al., 2011; Zahn et al., 2024). We hypothesize that the uncertainty resulting from neglected sea ice processes will be larger with increasing latitude, with more in the east than in the west and in winter months. Exploring the impact of sea ice on the freshwater budget is a potential avenue for future research.
Another process not considered is that the transformation from solid ice to freshwater may happen outside the fjord if icebergs leave the fjord (Moon et al., 2018). Finally, our study neglects freshwater storage effects in the fjord, as fjord circulation is outside the scope of this study. We excluded solid ice discharge from the GICs, as it is estimated to be only 2.3–3.2 Gt yr−1 between 2000–2020 on average per decade (Kochtitzky et al., 2023), and the dataset does not specify discharge on a regional and monthly scale. Solid ice discharge is determined by applying fixed flux gates, which comes with the advantage that the solid ice discharge in this study is consistent with earlier work (Mouginot et al., 2019; Mankoff et al., 2020b; King et al., 2020). However, the disadvantage is that we neglect solid ice discharge due to systematic glacier front retreat, which is estimated to have averaged 42 Gt yr−1 since 2000 for the total ice sheet (Greene et al., 2024), i.e. similar to or larger in magnitude than basal melt over the studied period. Because the glacier front advances in winter and retreats in summer (63 ± 6 Gt seasonally; Mankoff et al., 2020b; Greene et al., 2024), the use of fixed flux gates likely leads to an underestimation of solid ice discharge in summer and an overestimation in winter. This error is however less important for a study addressing freshwater input assuming fixed outlines of the fjord, like we do here, than one addressing the freshwater budget of fjords.
We estimated freshwater input into Greenland fjords based on regional climate models (runoff, precipitation, melt-over-accumulation ratio), process-based estimates (basal melt), and satellite products (solid ice discharge). We individually quantified the contributions of solid ice discharge from the contiguous Greenland ice sheet (GrIS), GrIS runoff, runoff from peripheral glaciers and ice caps (GICs) and tundra runoff, and precipitation falling directly into the fjords. We provide a seasonally resolved analysis from 1990 onwards, from when estimates of all contributing fluxes are available at a monthly time resolution. We estimated that averaged over Greenland between 1990–2023, the relative contributions to the freshwater input are 40 % for solid ice discharge; 33 % and 7 % for GrIS and GIC runoff, respectively; 15 % for tundra runoff; and 5 % for fjord precipitation. Considerable regional and seasonal variations exist. In winter, direct precipitation into fjords can contribute up to 11 % to the total freshwater input Greenland-wide, and in May the relative contribution of tundra runoff peaks at 35 %. The SE and NW regions of Greenland have a solid-ice-discharge-dominated freshwater regime, while the freshwater sources in the SW are dominated by tundra runoff and GrIS and GIC runoff. The regional glacial melt-over-accumulation ratio is shown to be a good predictor of the regional partitioning of freshwater input into fjords; a high melt-over-accumulation ratio relates to a low relative contribution of solid ice discharge and higher relative contributions of tundra and GrIS runoff. The large variability in time and space of the freshwater input into Greenland fjords needs to be taken into account to understand their present and future impact on ecosystems and ocean circulation.
Table A1Average relative input per freshwater source for the whole of Greenland between 2009–2023, in percentage (%).
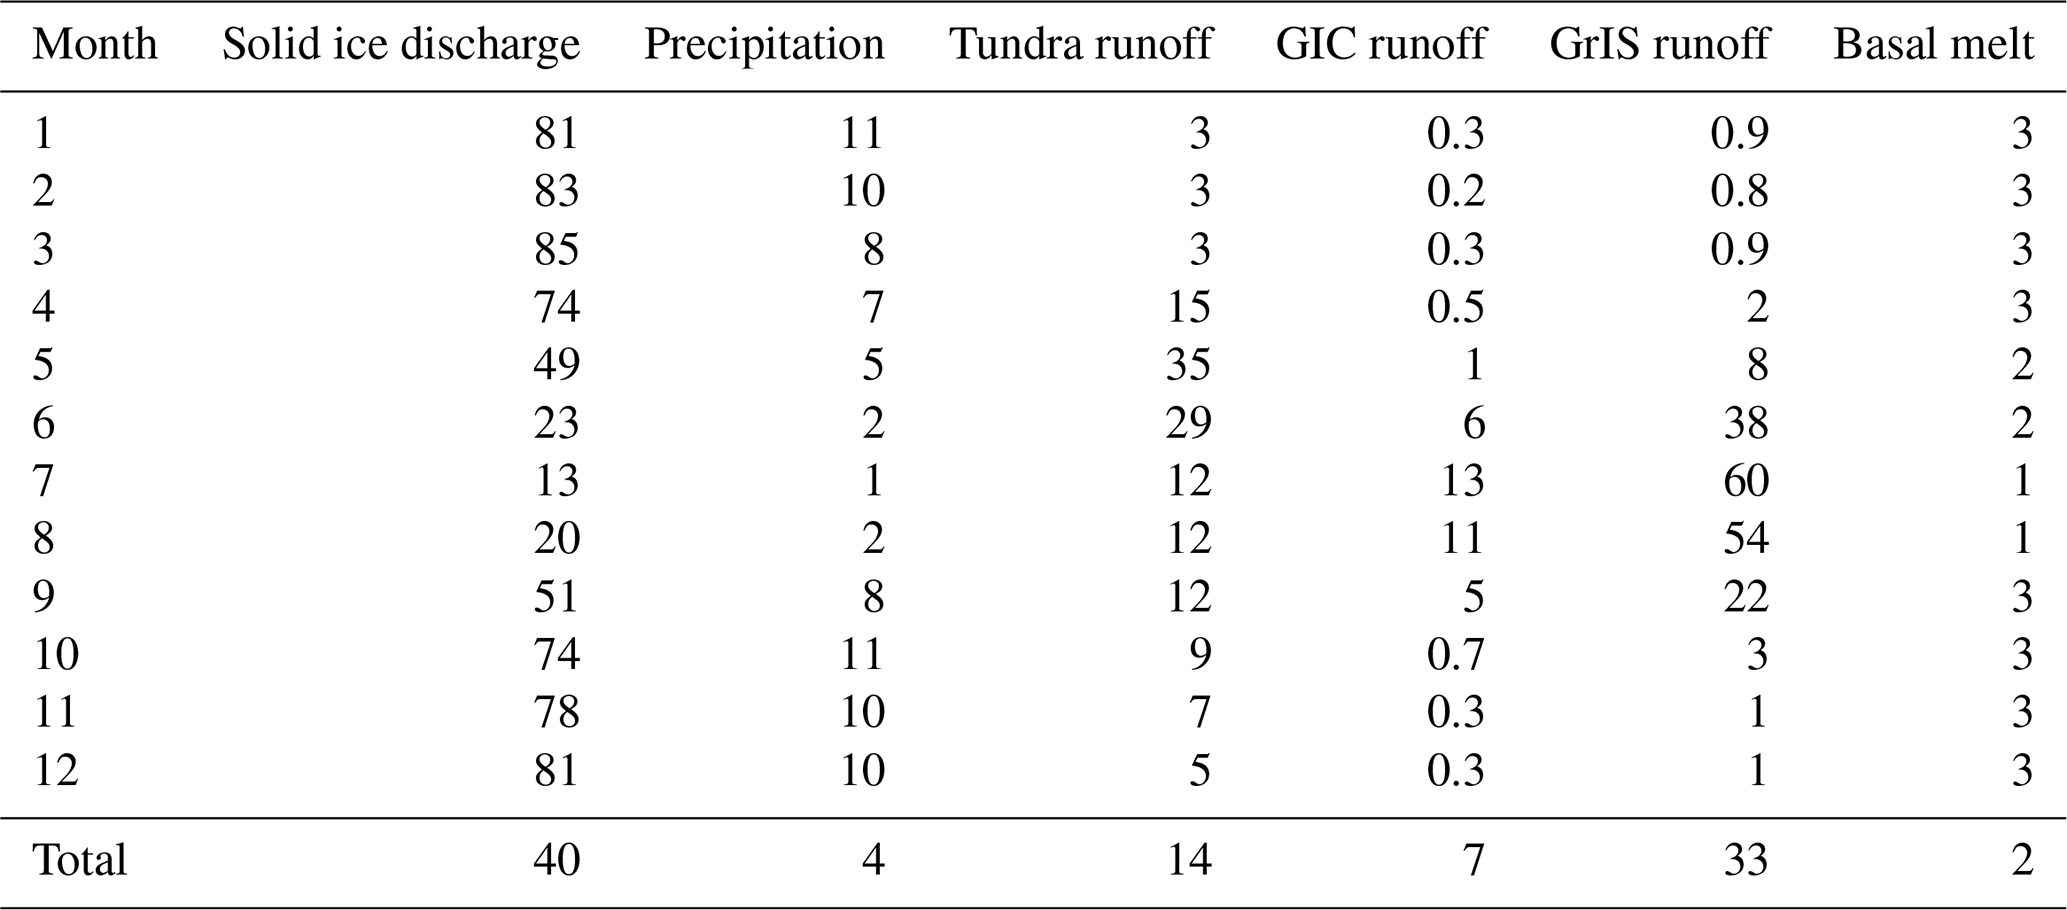
Table A2Average absolute input from freshwater sources into Greenland fjords between 1990–2023 with a standard deviation of interannual variability (±), in gigatonnes per year (Gt yr−1).
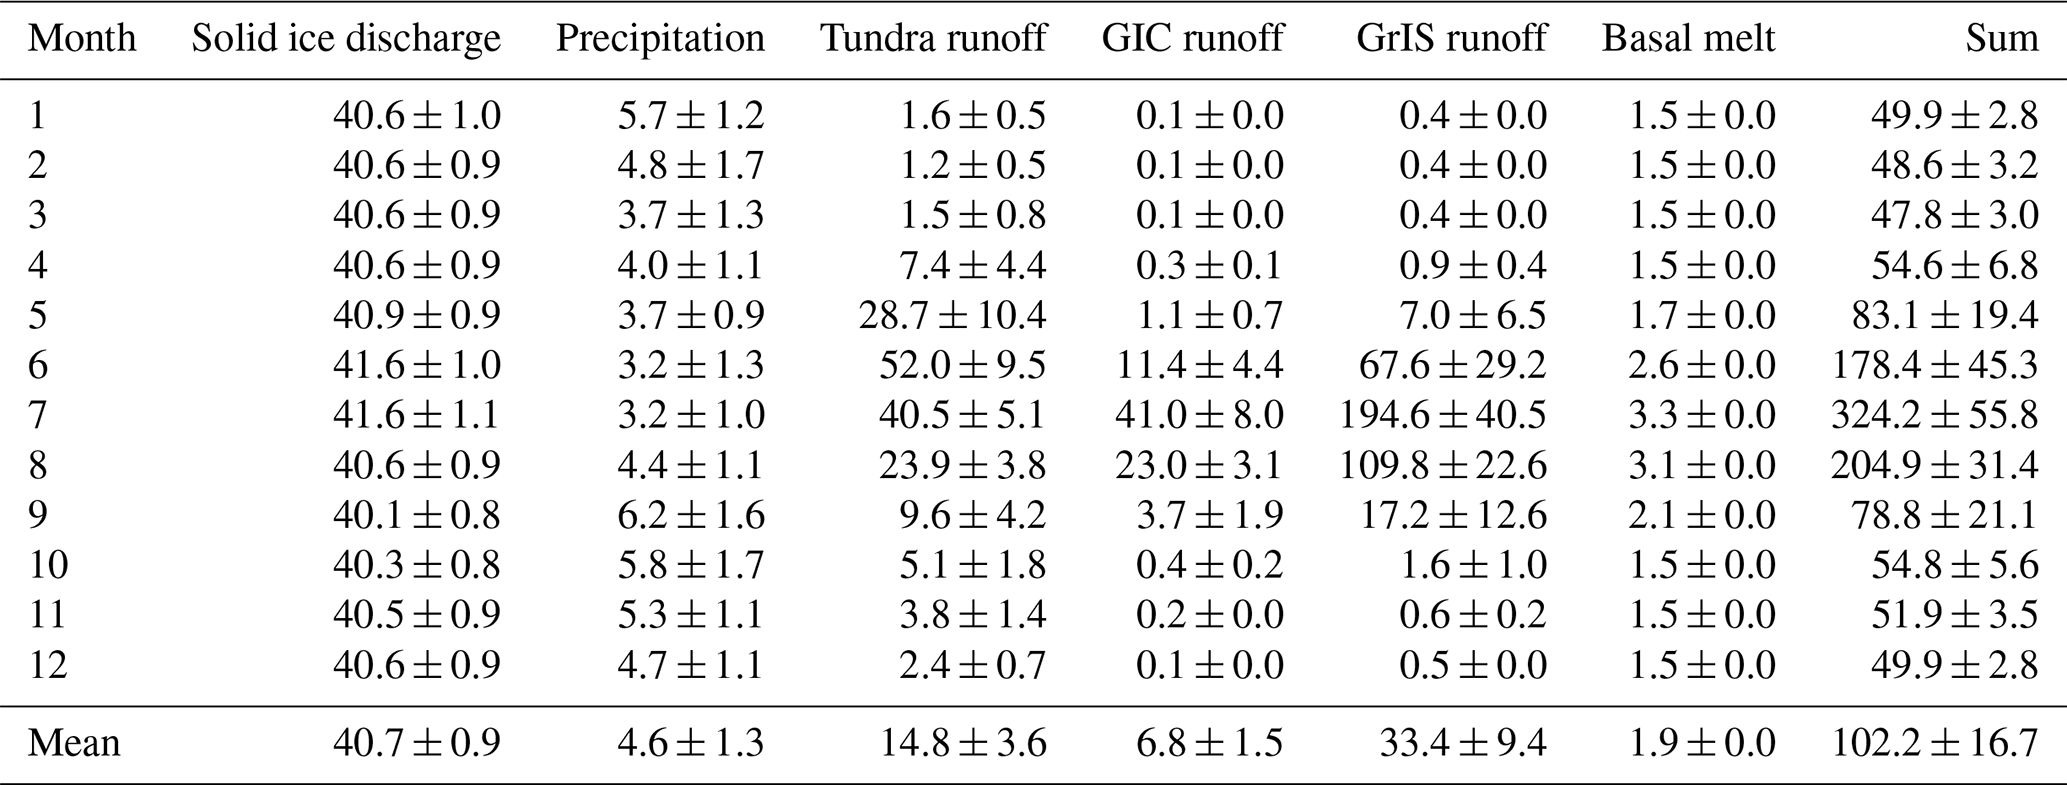
Table A3Average absolute input from freshwater sources into fjords per region between 1990–2023, in gigatonnes per year (Gt yr−1).
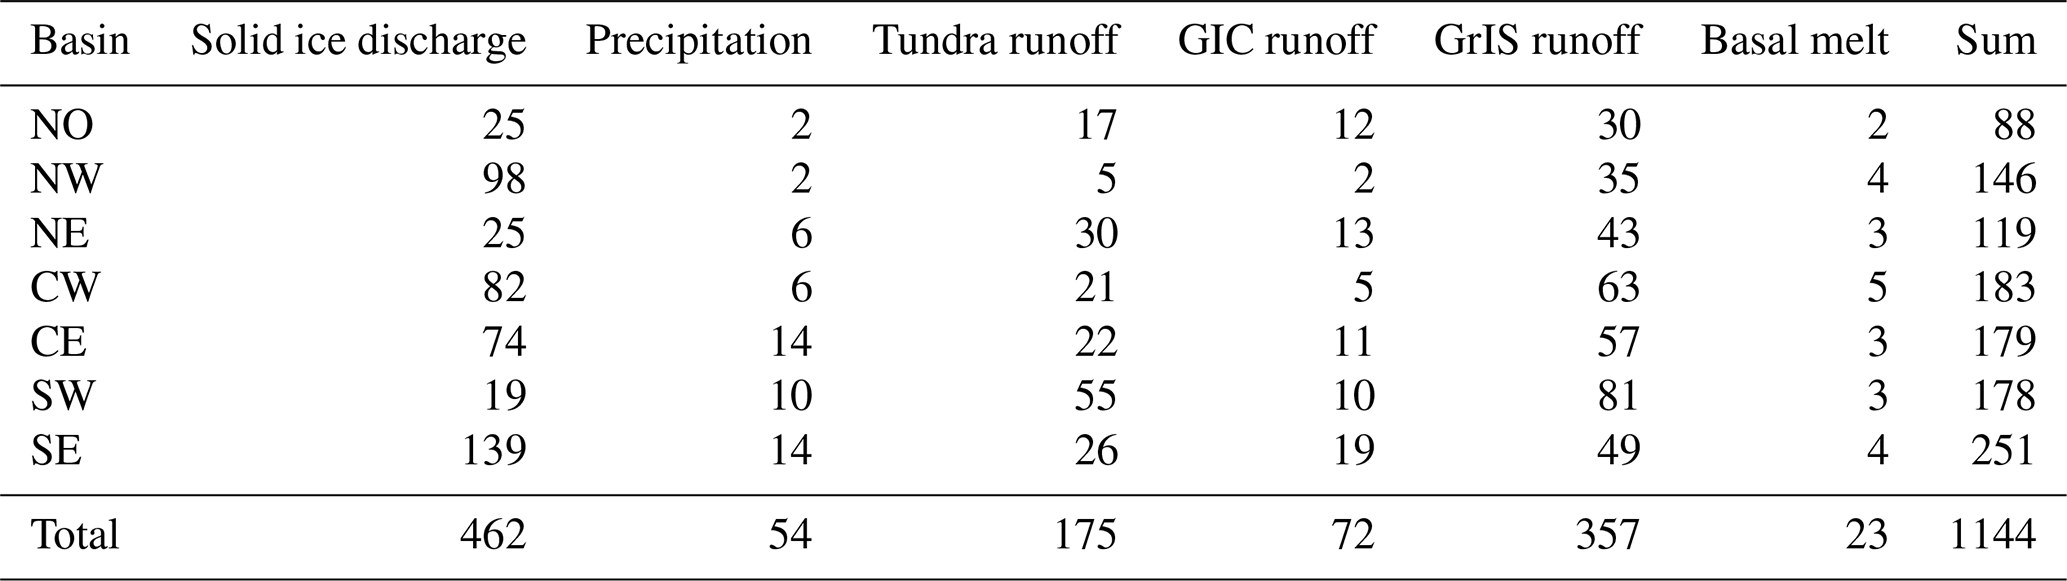
Table A4Average relative input from freshwater sources into fjords per region between 1990–2023, in percentage (%).
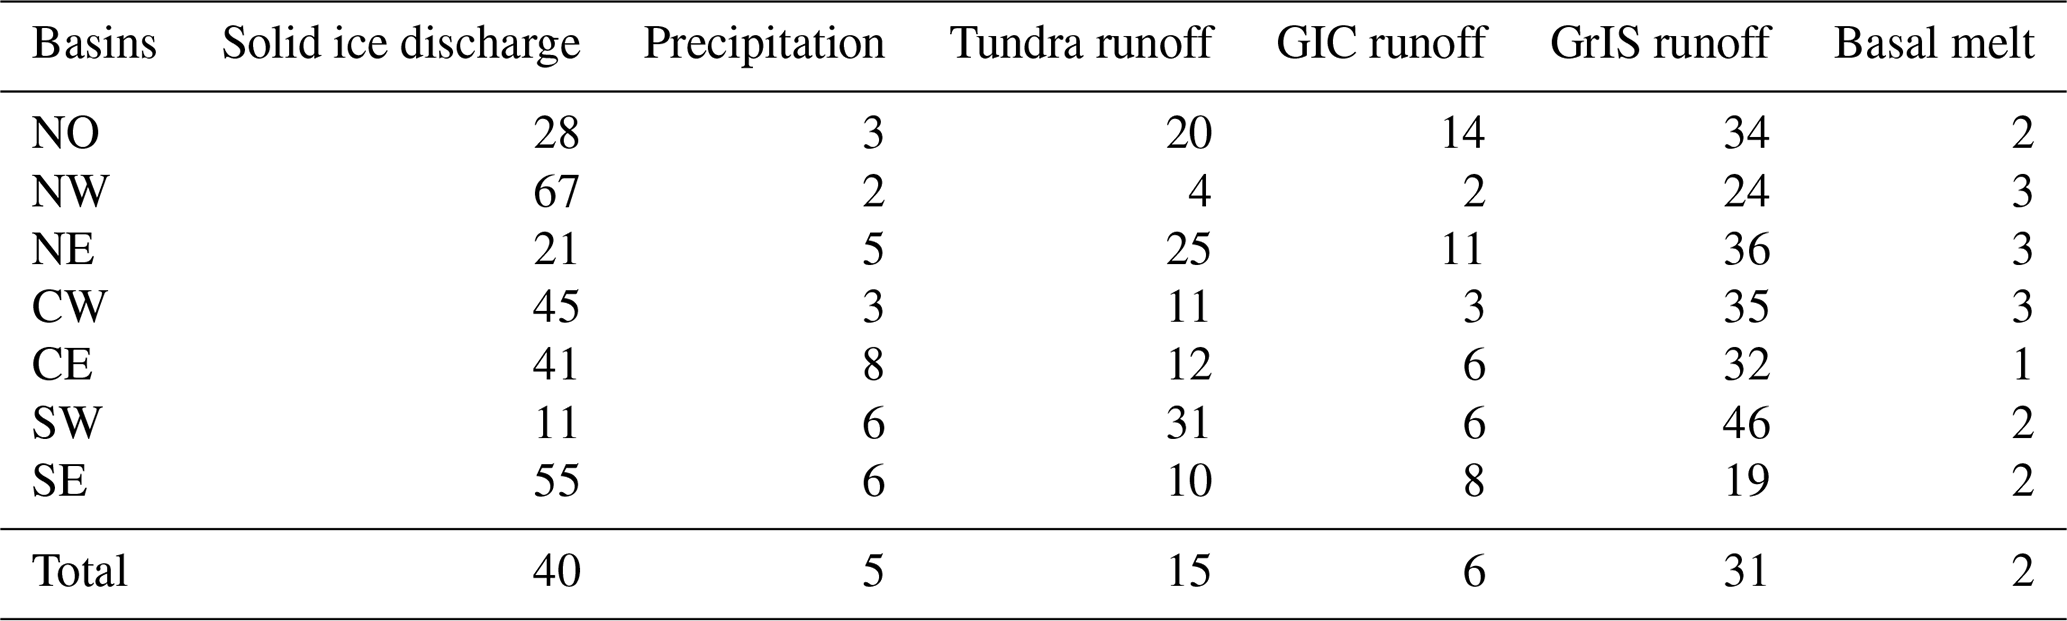
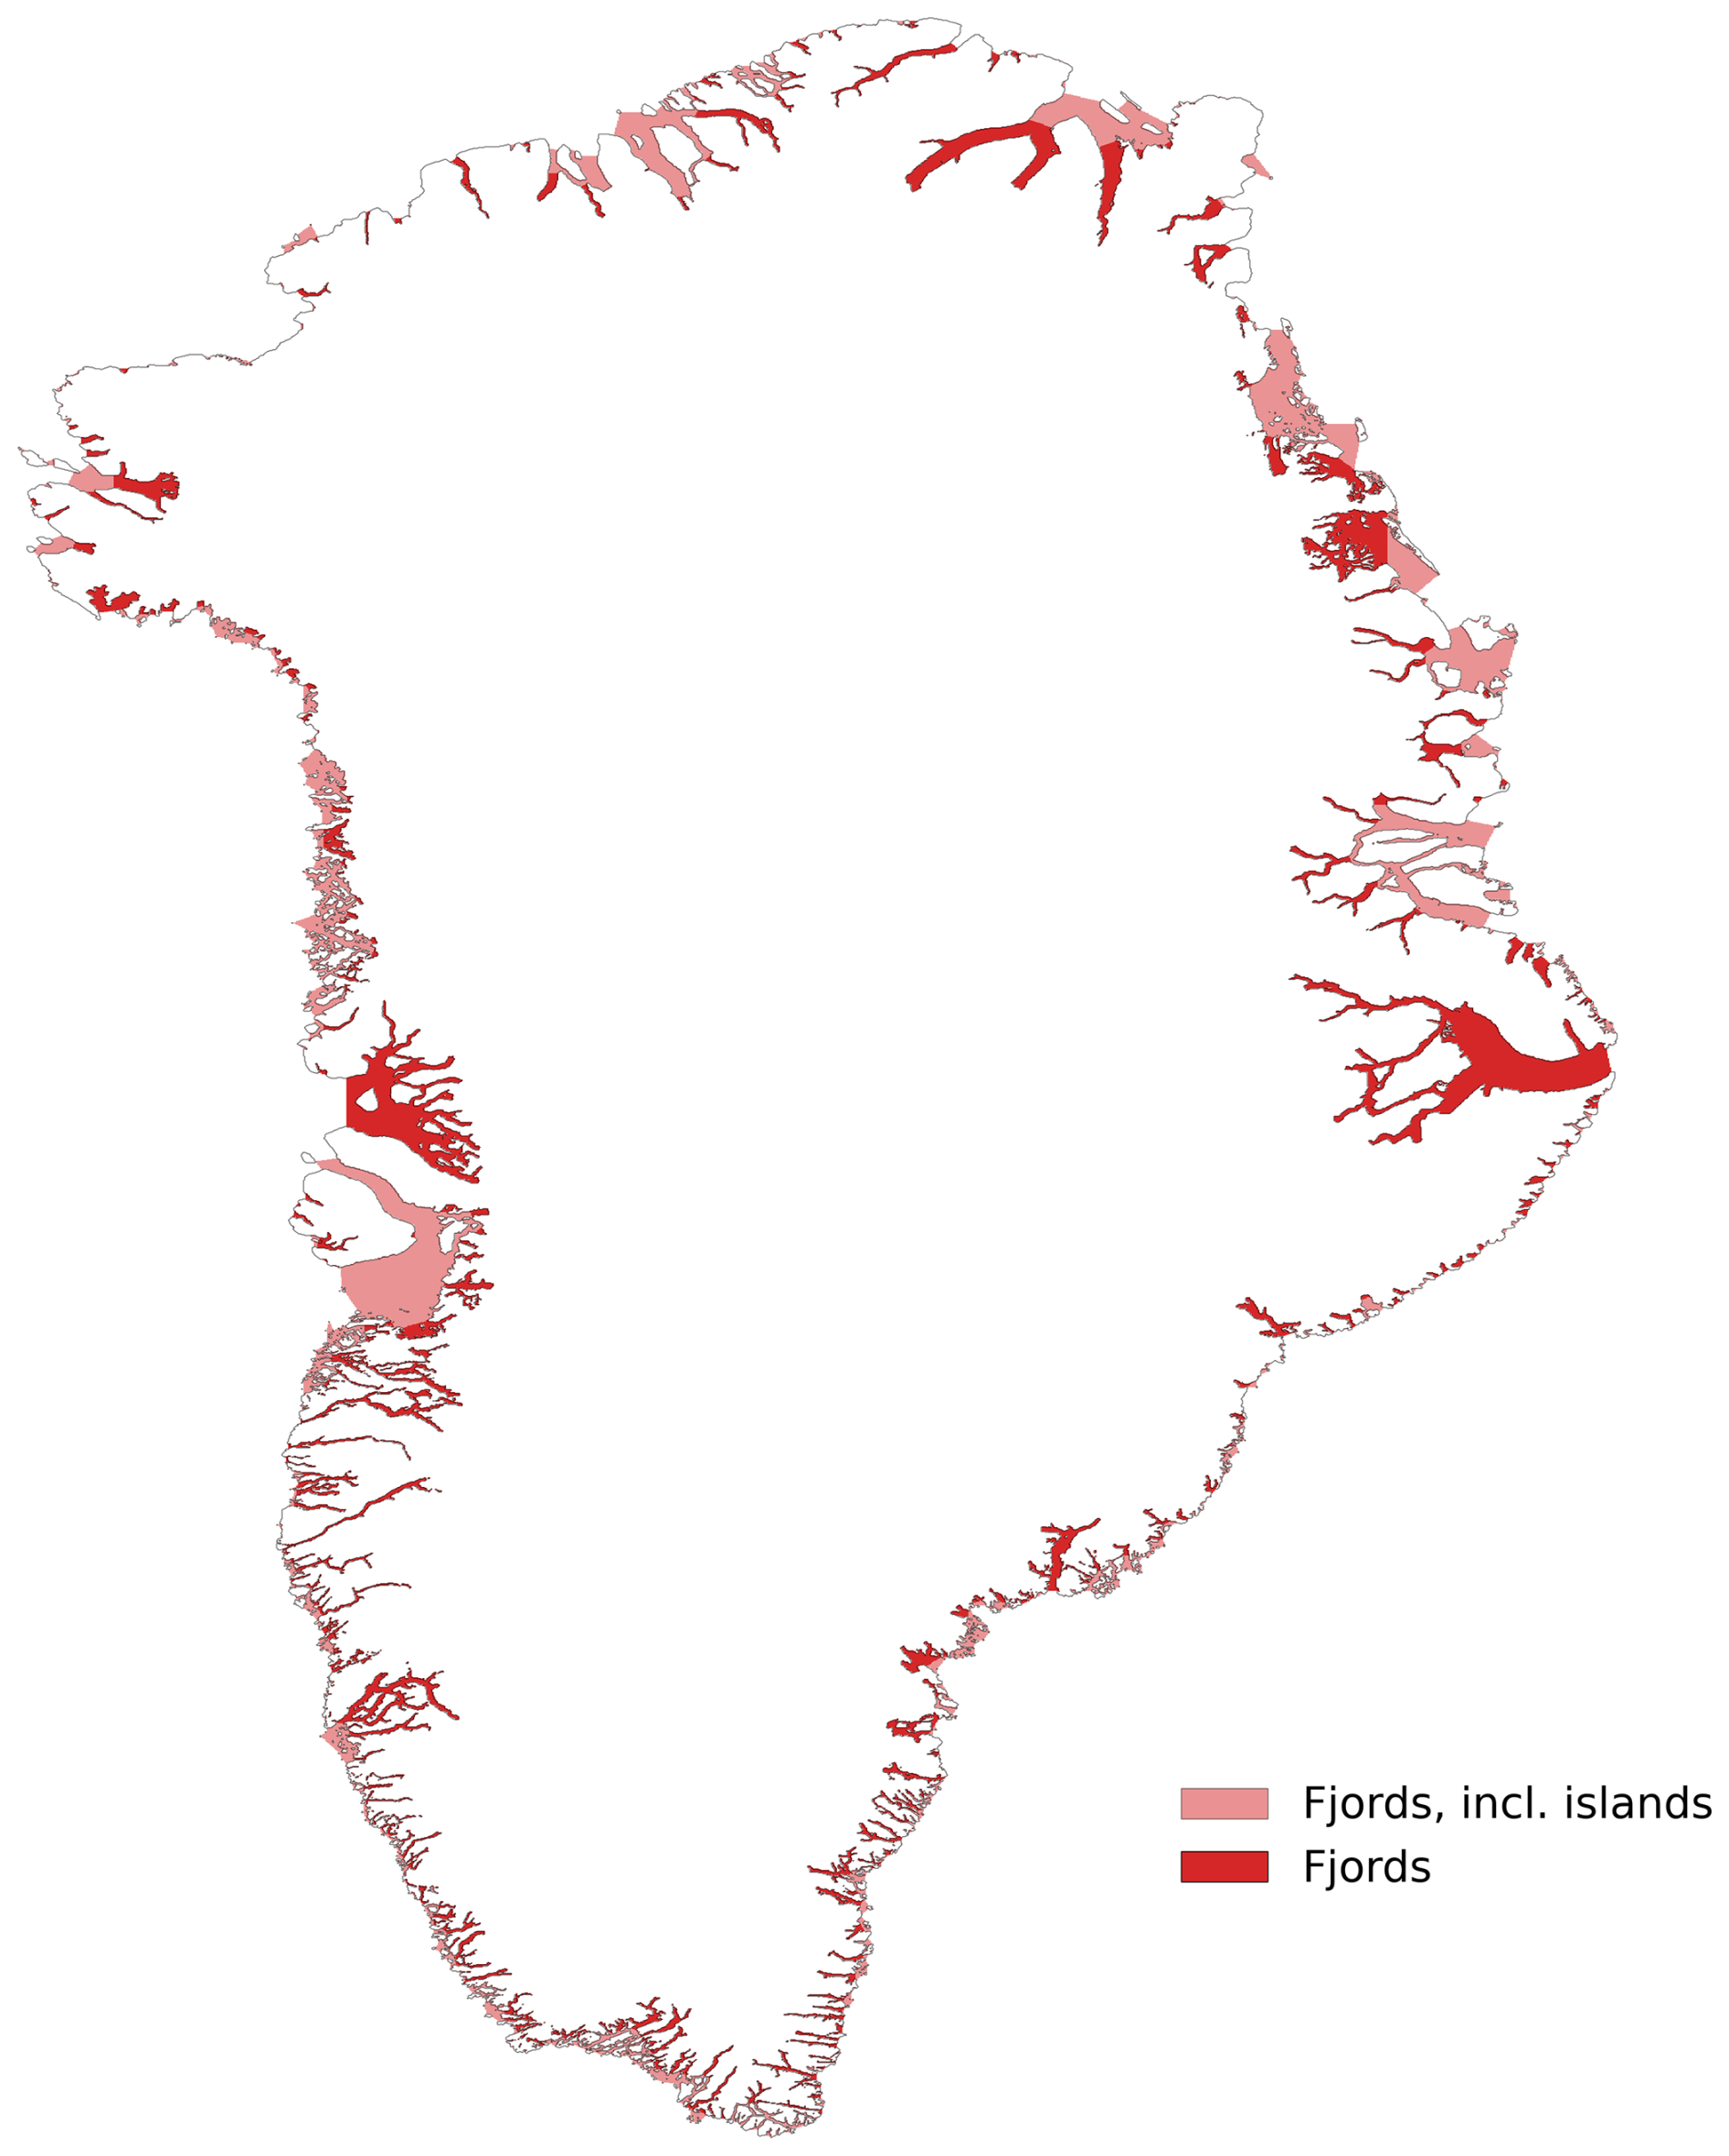
Figure A1Fjord mask used in this study (dark red) and large “fjord” mask used for sensitivity, including islands and small bays (light red). The fjord area is 75 × 103 km2 in the default case and 140 × 103 km2 when also large bays are taken into account.
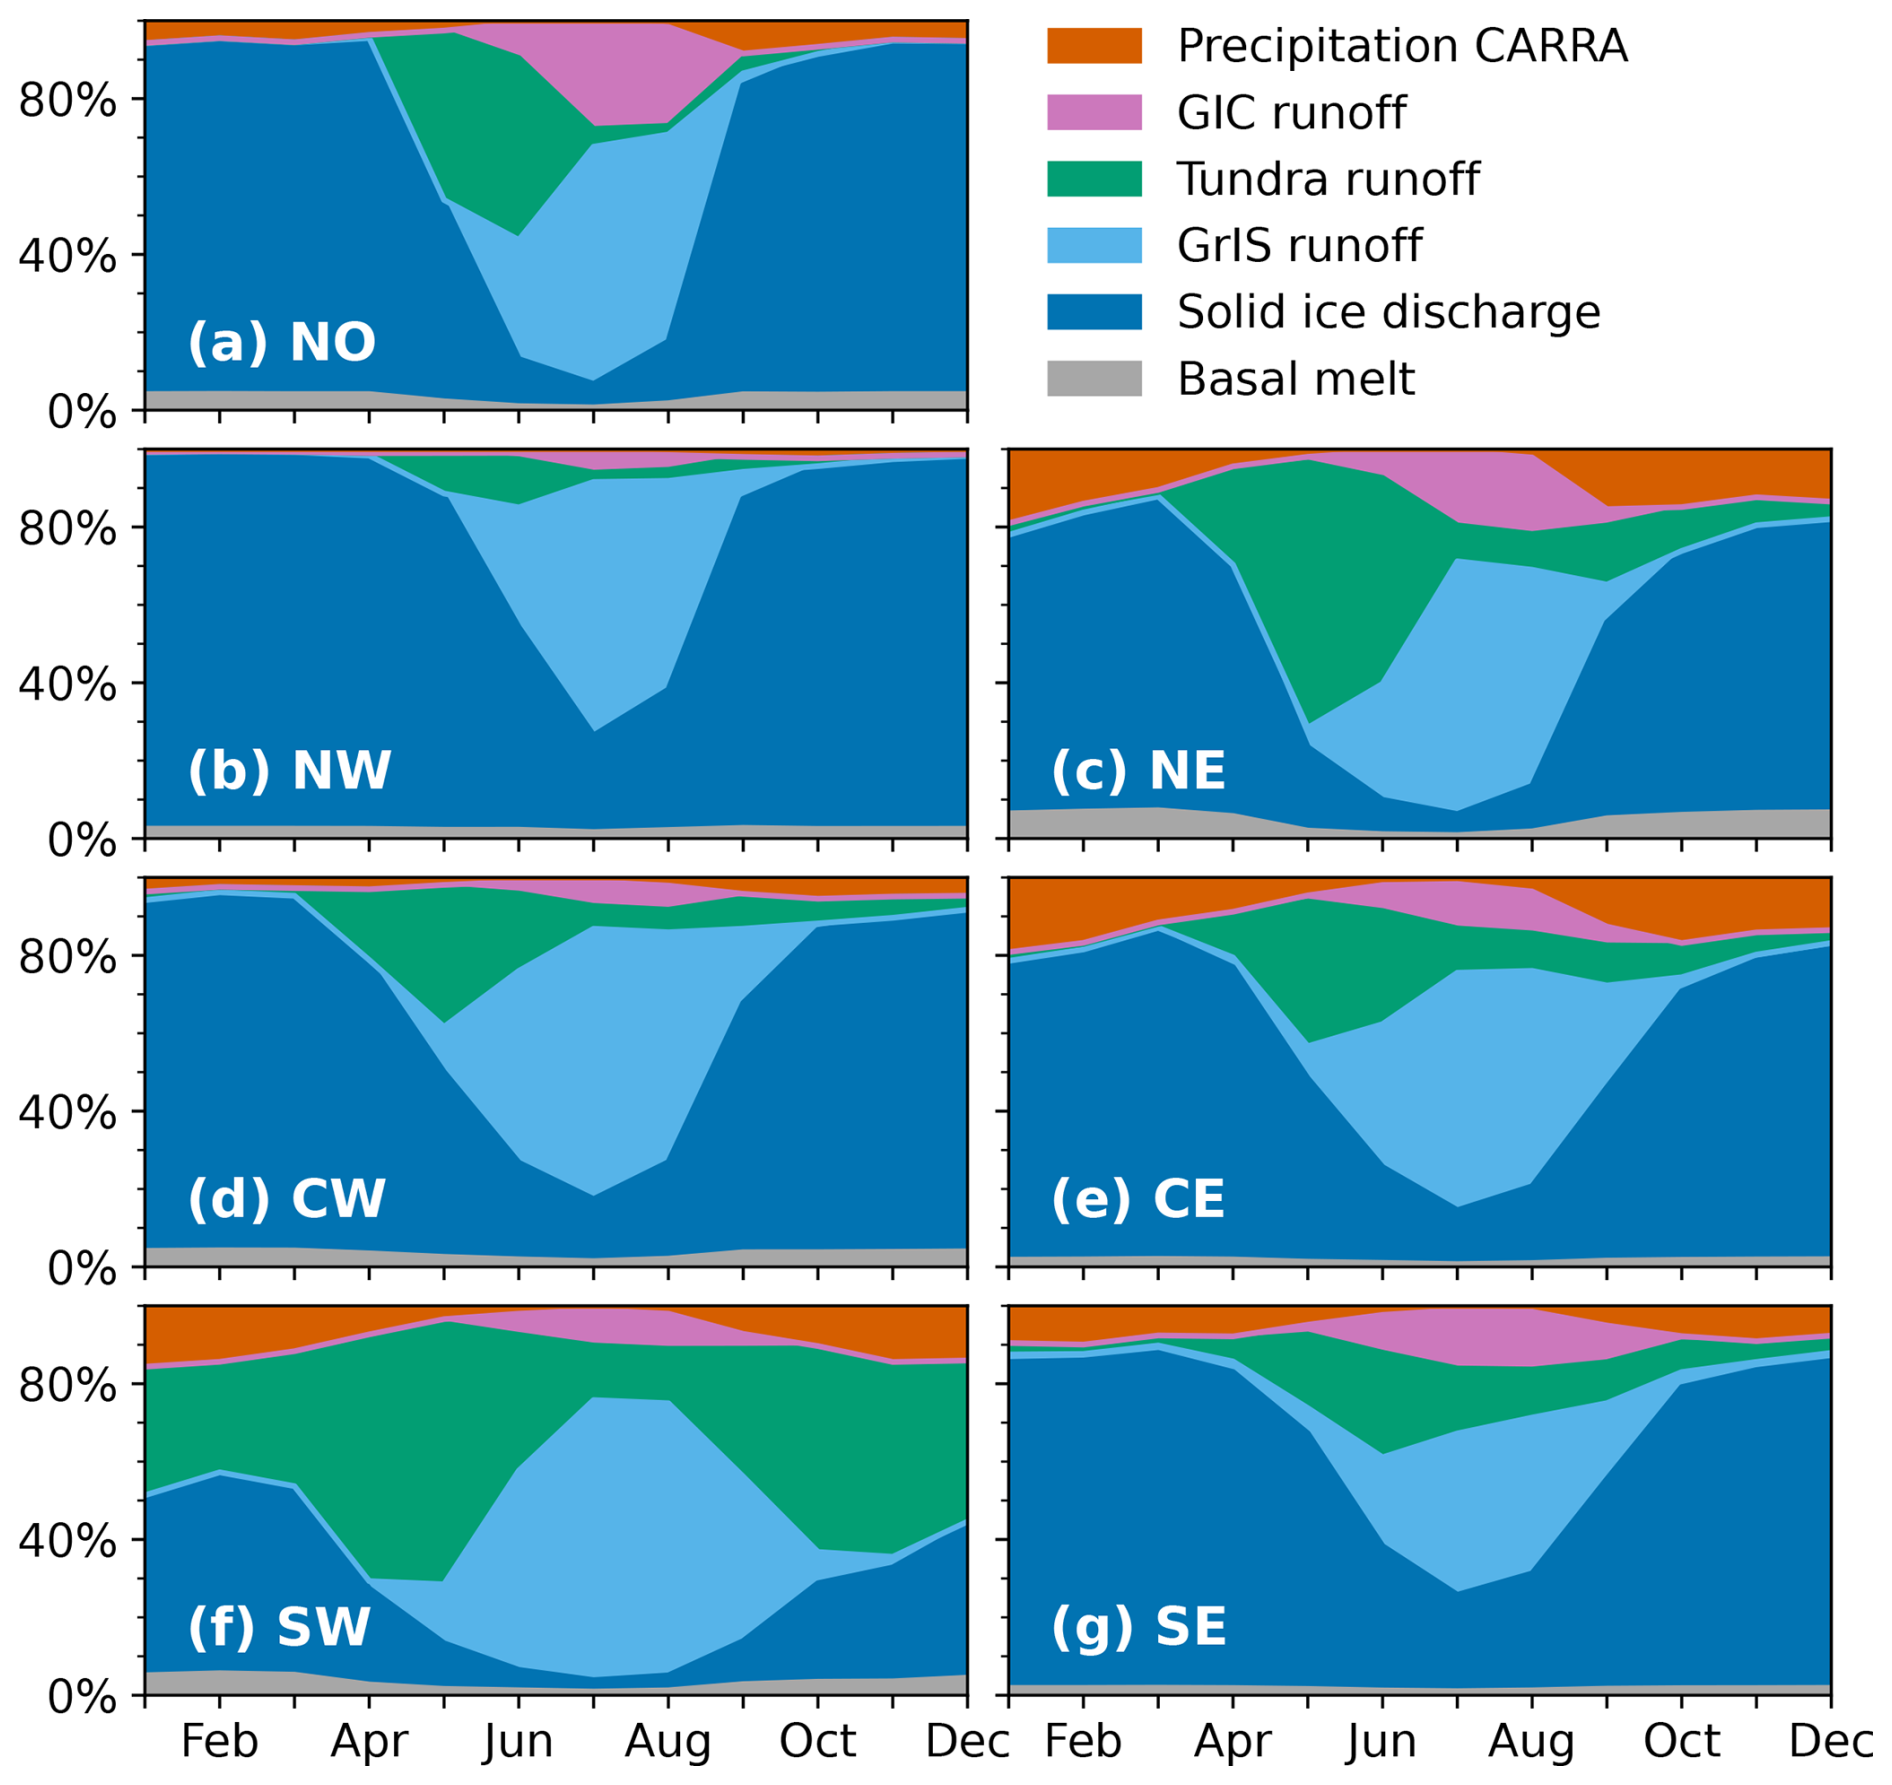
Figure A2Seasonal cycle of the relative contribution of sources to the total freshwater input between 2009–2023 per region, with (fjord) precipitation from CARRA-West.
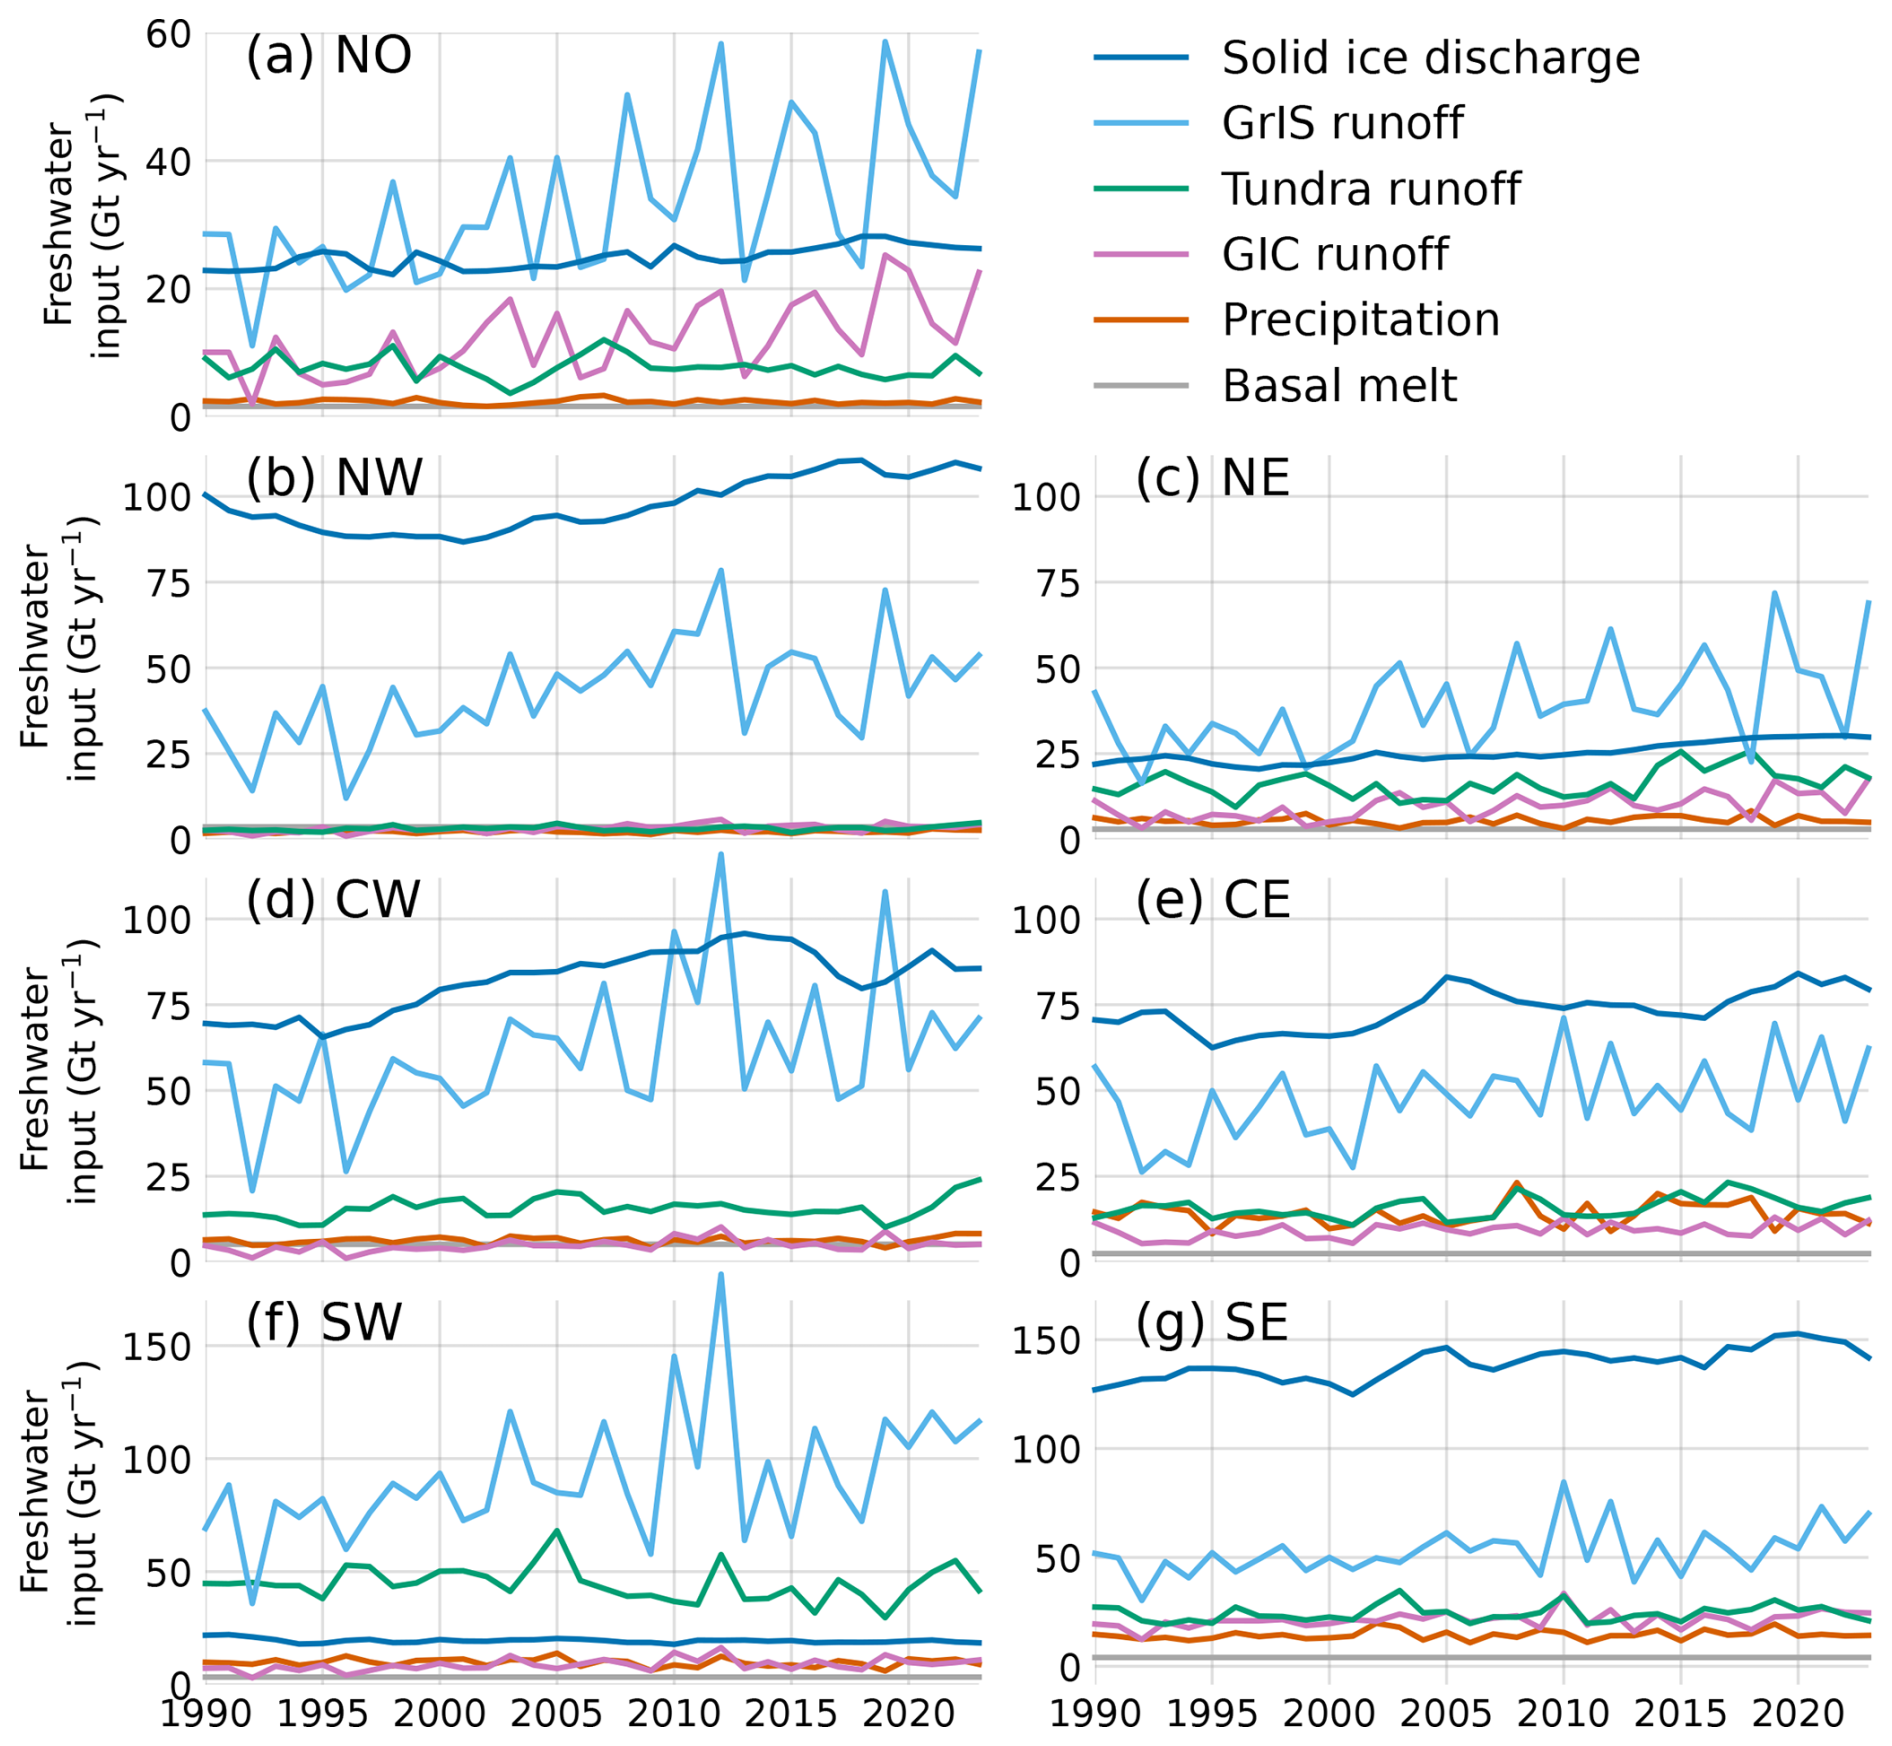
Figure A3Time series of annual freshwater input per region between 1990–2023, with GIC and GrIS runoff from MAR.
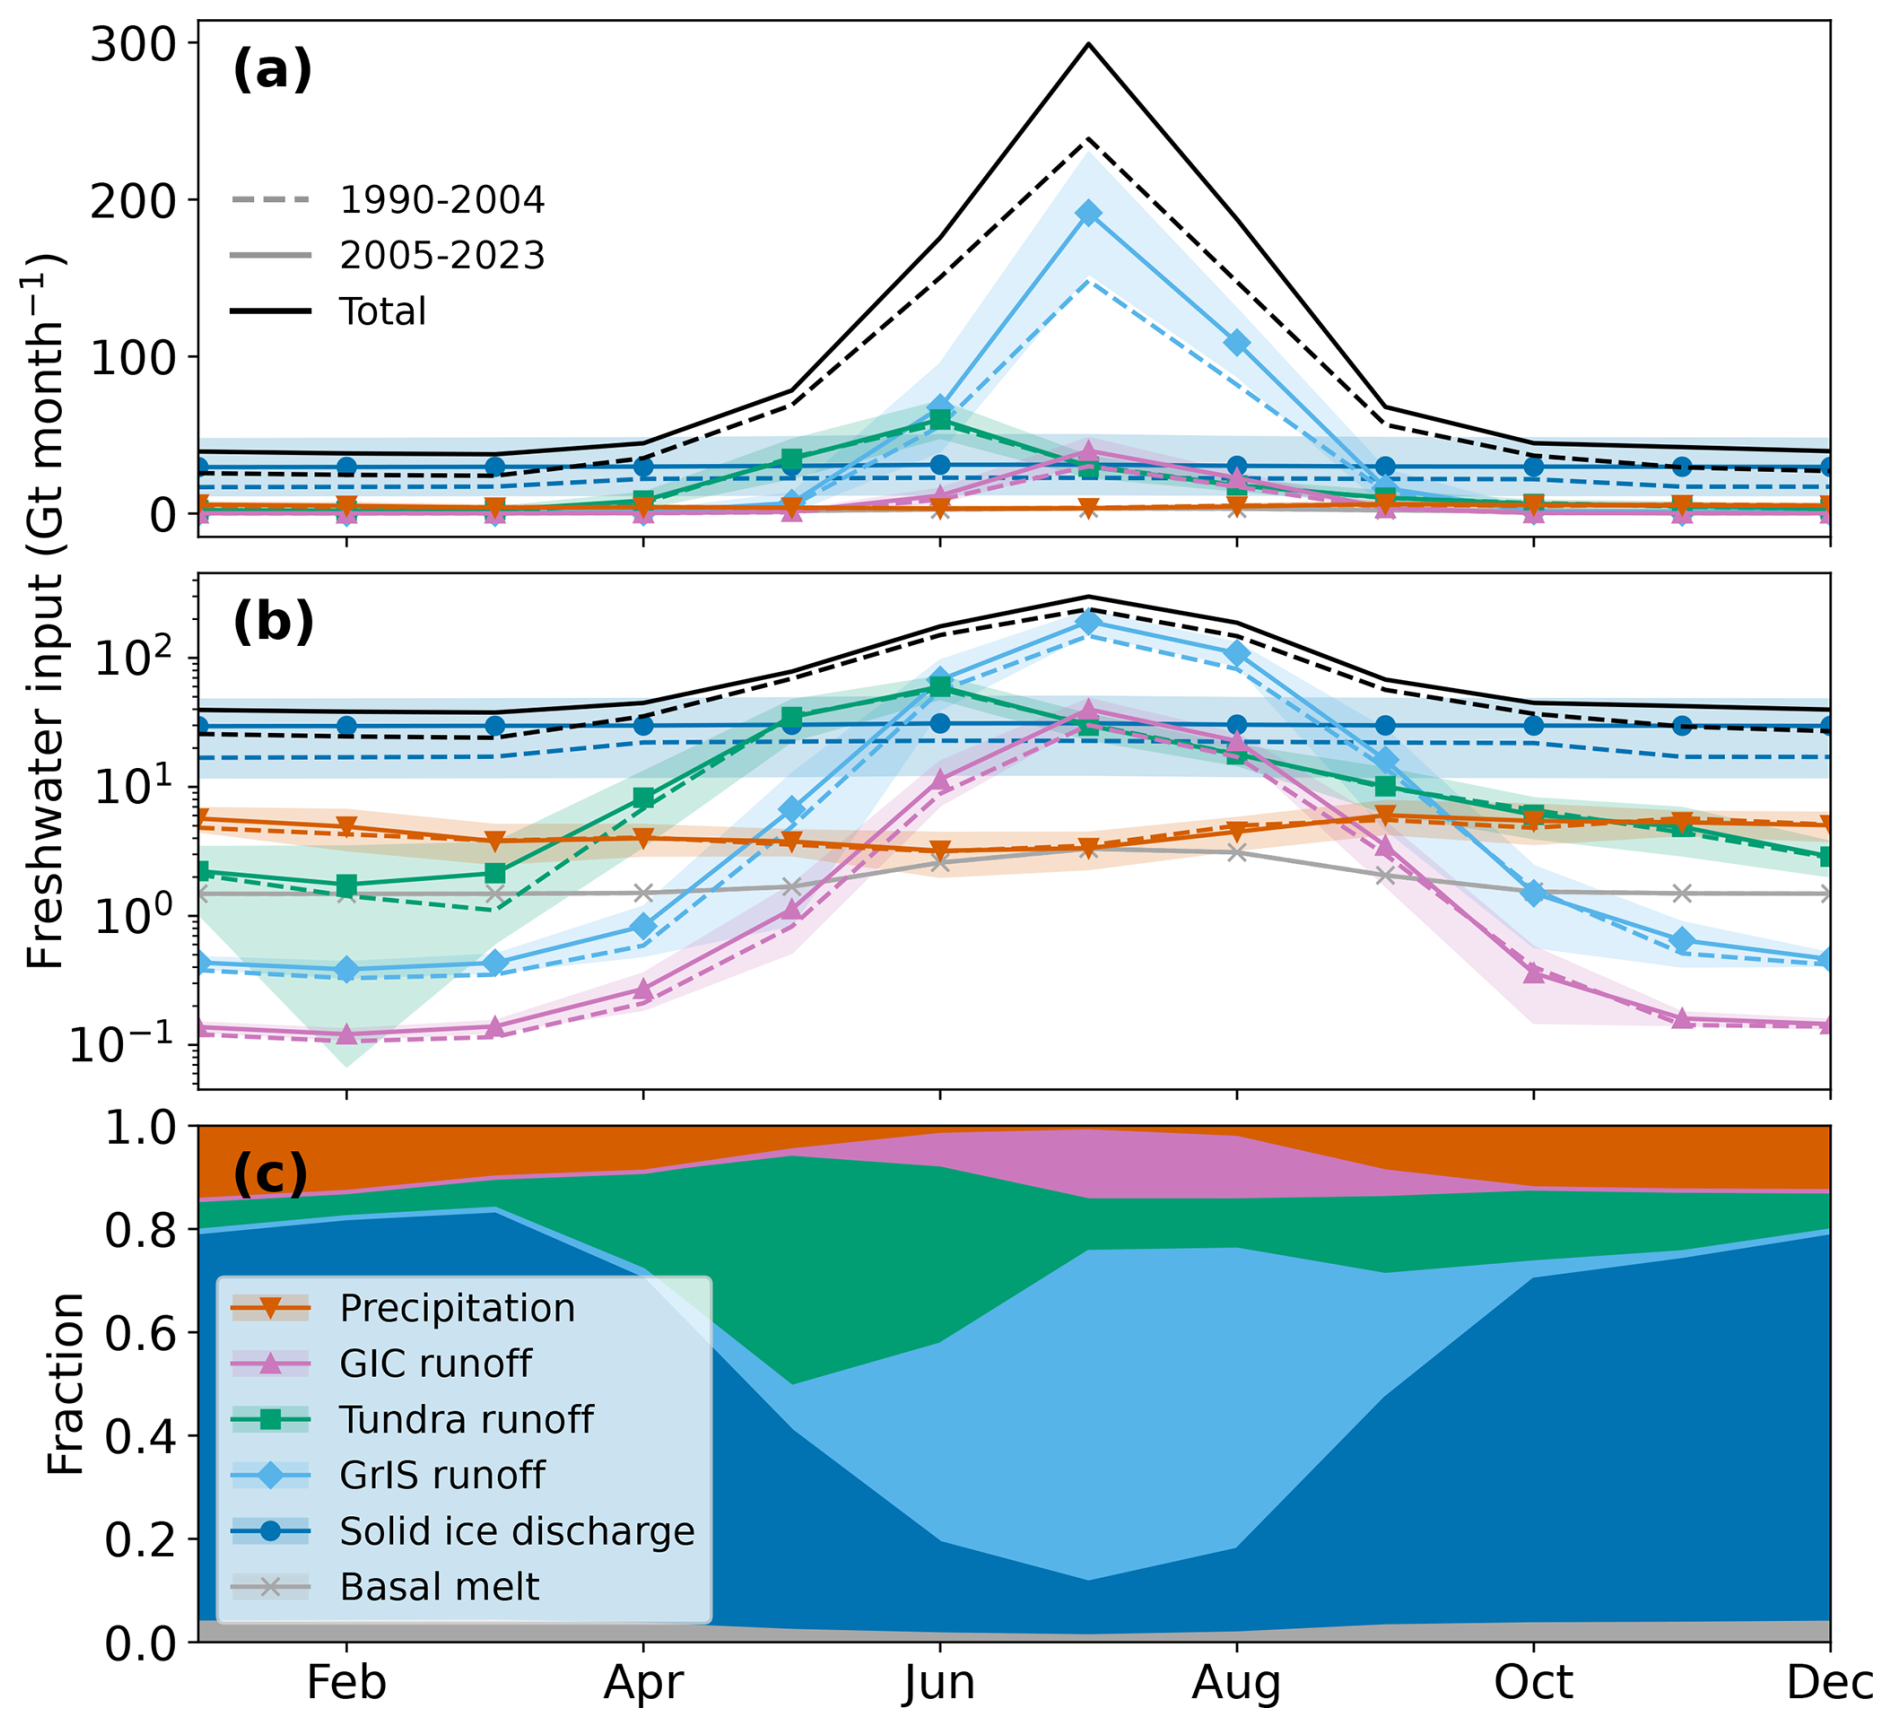
Figure A4Average seasonal cycle of Greenland total freshwater input based on monthly averages with solid ice discharge by King et al. (2020) (blue), GrIS runoff (orange), GIC runoff (purple), tundra runoff (green) and fjord precipitation (red), and basal melt (brown). (a) Average seasonal cycle for 1990–2004 (dashed) and 2005–2023 (solid). Shading represents the standard deviation due to interannual variability. (b) As in a but with a log scale. (c) Seasonal cycle of the relative source contributions to the total freshwater input between 2009–2023.
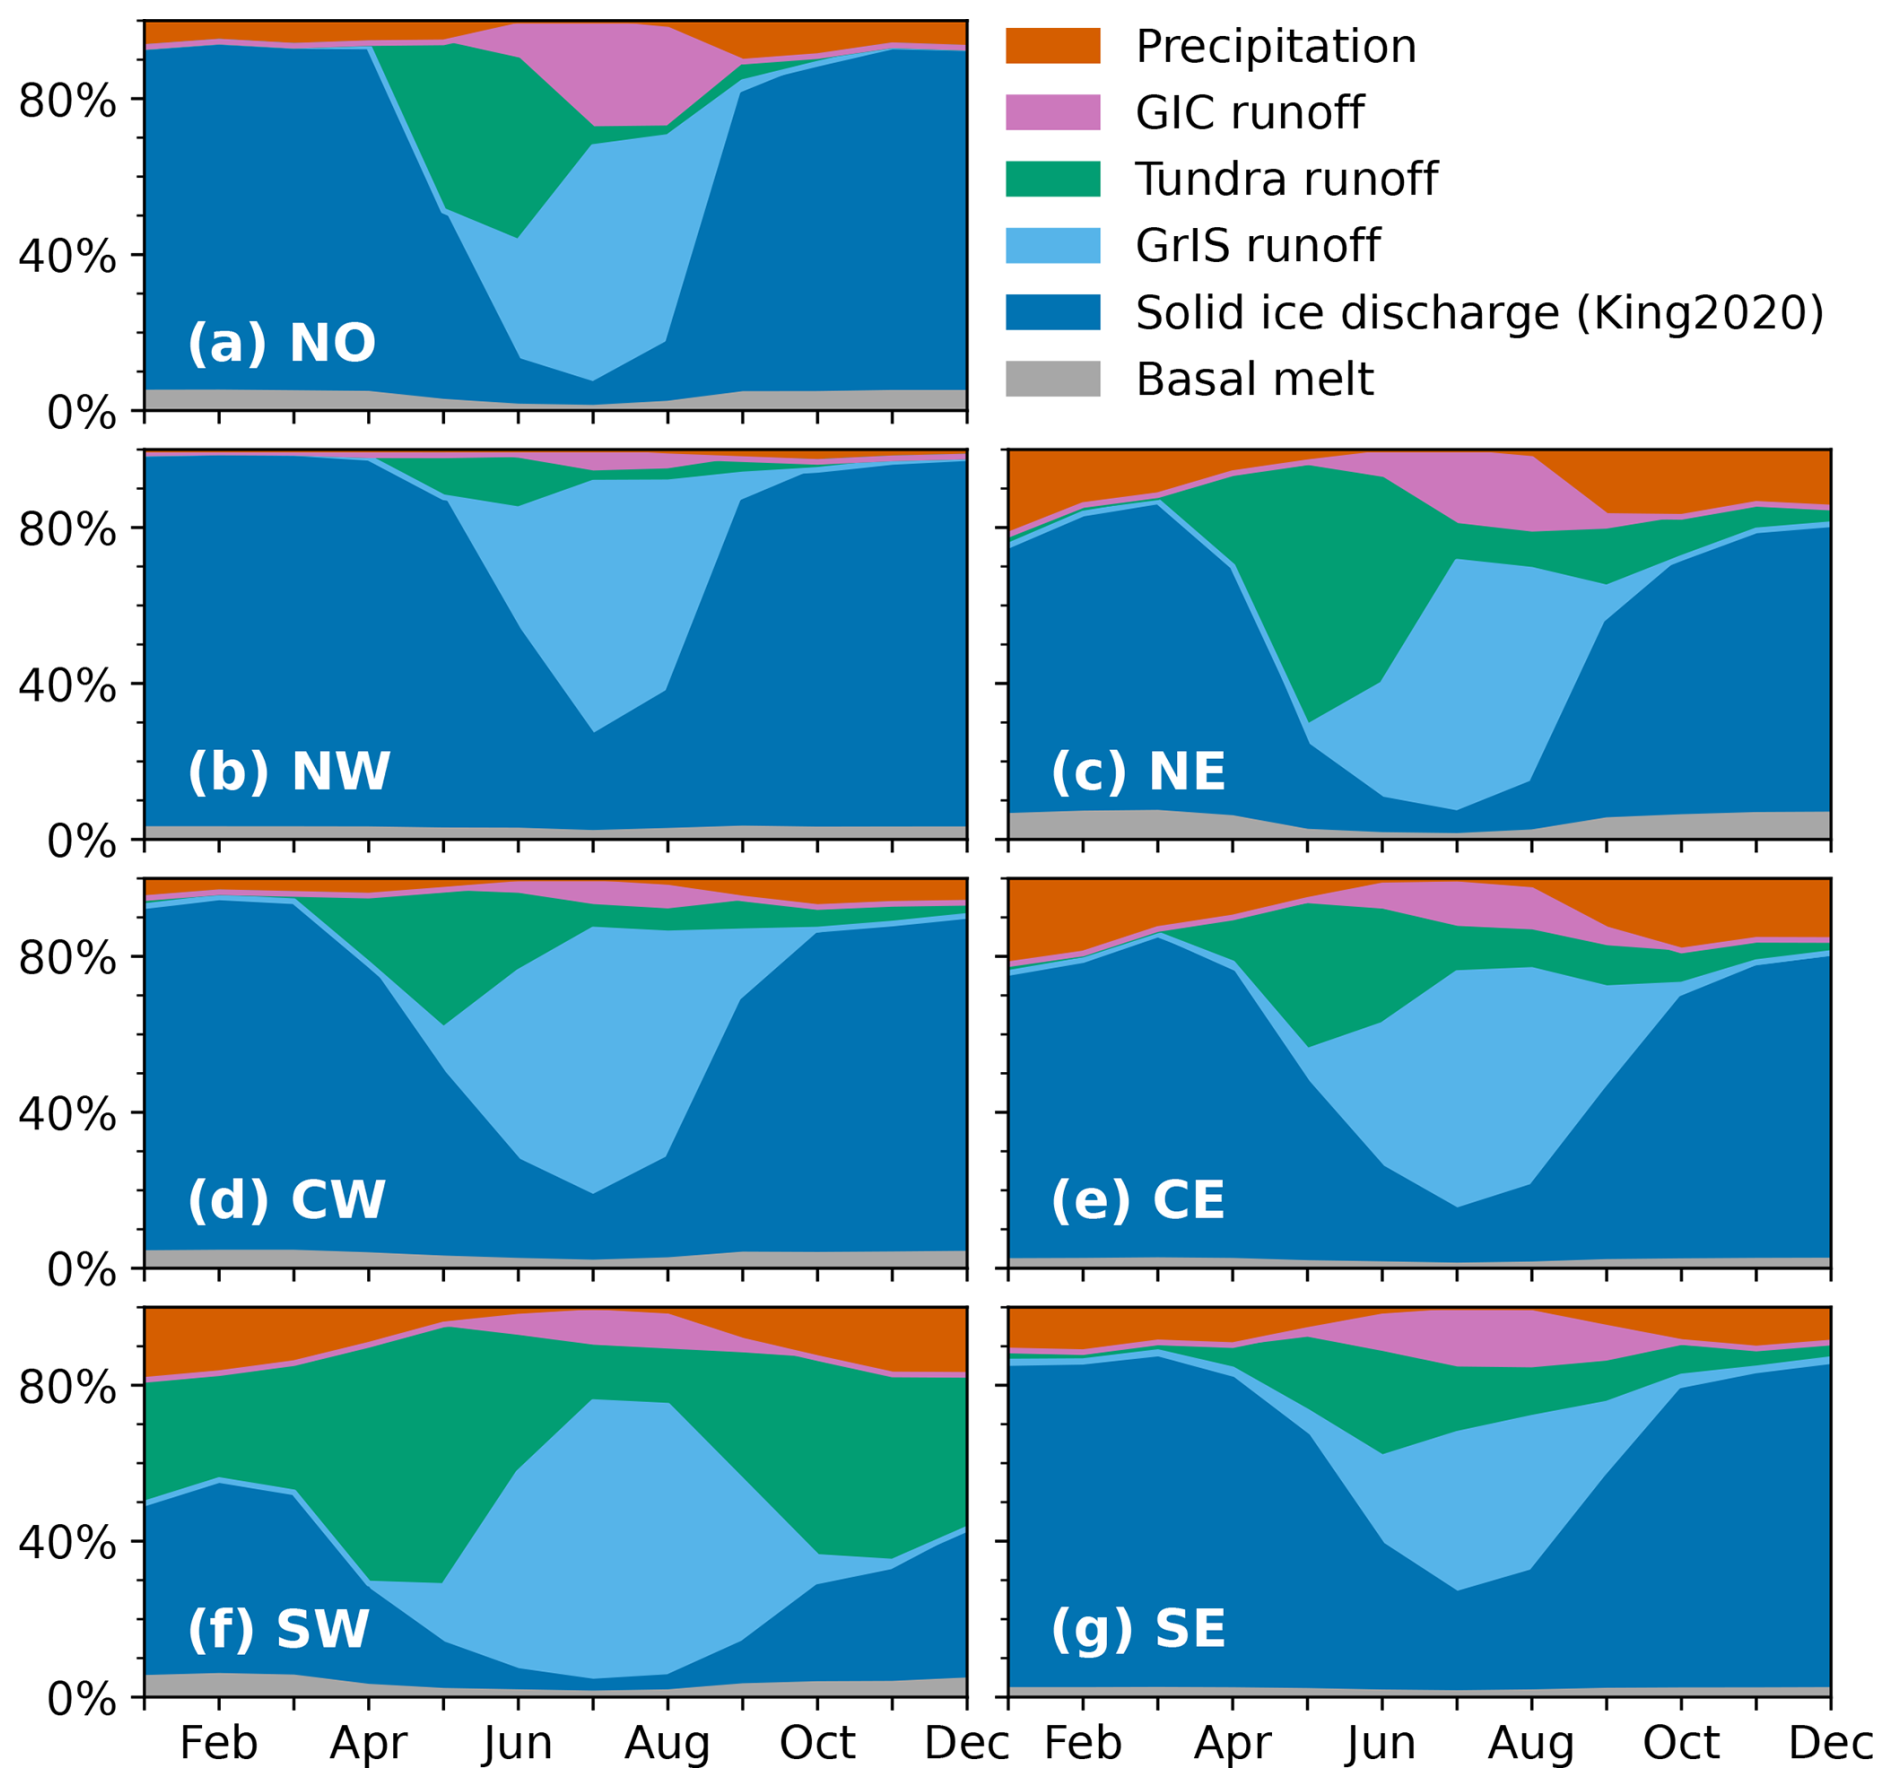
Figure A5Seasonal cycle of the relative contribution of sources to the total freshwater input between 2009–2023 per region but with solid ice discharge by King et al. (2020).
The (downscaled) RACMO and MAR datasets presented in this paper were previously published in Noël et al. (2019) and Fettweis et al. (2020). The 1 km RACMO and MAR data used in this paper, as well as the region and fjord masks, are available from https://doi.org/10.5281/zenodo.15013761 (Vries, 2025), respectively. The solid ice discharge data are available from Mankoff et al. (2020b) and King et al. (2020) (https://doi.org/10.22008/promice/data/ice_discharge, Mankoff, 2020; https://doi.org/10.5061/dryad.qrfj6q5cb, King and Howat, 2020). The CARRA data are available through https://doi.org/10.24381/cds.713858f6 (Schyberg et al., 2020). The code and data required for figures are available from https://github.com/AnnekeV/Varia-Fresh-Fjords and https://doi.org/10.5281/zenodo.15013761, respectively (Vries, 2025). Data analysis and figure plotting were done using Python 3.12, and the map was made using QGIS (https://www.qgis.org, van Rossum and L. Drake, 2009; QGIS Development Team, 2025).
ALV, WJvdB, and MRvdB designed the study, and ALV carried it out. BN provided regional climate model data. All co-authors were involved in the scientific discussions that led to this study. ALV prepared the manuscript with contributions from all co-authors.
At least one of the (co-)authors is a member of the editorial board of The Cryosphere. The peer-review process was guided by an independent editor, and the authors also have no other competing interests to declare.
Publisher's note: Copernicus Publications remains neutral with regard to jurisdictional claims made in the text, published maps, institutional affiliations, or any other geographical representation in this paper. While Copernicus Publications makes every effort to include appropriate place names, the final responsibility lies with the authors.
This article is part of the special issue “Northern hydrology in transition – impacts of a changing cryosphere on water resources, ecosystems, and humans (TC/HESS inter-journal SI)”. It is not associated with a conference.
Anneke L. Vries acknowledges the use of LanguageTool for suggesting corrections for spelling and grammar mistakes in the final stage of preparing this paper (LanguageTool, 2025). Brice Noël is a research associate of the Fonds de la Recherche Scientifique de Belgique – FNRS (F.R.S.–FNRS).
Anneke L. Vries and Lorenz Meire were funded by the UU-NIOZ project “Greenland fjords as gateways between the ice sheet and the ocean” and the Greenland Climate Research Center. Michiel R. van den Broeke is supported by EMBRACER (summit grant SUMMIT.1.034), financed by the Netherlands Organisation for Scientific Research (NWO), and the Netherlands Earth System Science Center (NESSC), financed by the Dutch Ministry of Education, Culture and Science.
This paper was edited by Andrea Popp and reviewed by Ken Mankoff and one anonymous referee.
Abermann, J., Langley, K., Myreng, S. M., Rasmussen, K., and Petersen, D.: Heterogeneous timing of freshwater input into Kobbefjord, a low-arctic fjord in Greenland, Hydrol. Process., 35, e14413, https://doi.org/10.1002/hyp.14413, 2021. a
Bamber, J. L., Tedstone, A. J., King, M. D., Howat, I. M., Enderlin, E. M., van den Broeke, M. R., and Noel, B.: Land Ice Freshwater Budget of the Arctic and North Atlantic Oceans: 1. Data, Methods, and Results, J. Geophys. Res.-Oceans, 123, 1827–1837, https://doi.org/10.1002/2017JC013605, 2018. a, b, c, d, e, f, g, h
Box, J. E., Nielsen, K. P., Yang, X., Niwano, M., Wehrlé, A., van As, D., Fettweis, X., Køltzow, M. A., Palmason, B., Fausto, R. S., van den Broeke, M. R., Huai, B., Ahlstrøm, A. P., Langley, K., Dachauer, A., and Noël, B.: Greenland ice sheet rainfall climatology, extremes and atmospheric river rapids, Meteorol. Appl., 30, e2134, https://doi.org/10.1002/MET.2134, 2023. a
Braithwaite, R. J., Laternser, M., and Pfeffer, W. T.: Variations of near-surface firn density in the lower accumulation area of the Greenland ice sheet, Pâkitsoq, West Greenland, J. Glaciol., 40, 477–485, https://doi.org/10.3189/S002214300001234X, 1994. a
Cottier, F. R., Nilsen, F., Skogseth, R., Tverberg, V., Skardhamar, J., and Svendsen, H.: Arctic fjords: A review of the oceanographic environment and dominant physical processes, Geol. Soc. Sp., 344, 35–50, https://doi.org/10.1144/SP344.4, 2010. a
Dukhovskoy, D. S., Yashayaev, I., Proshutinsky, A., Bamber, J. L., Bashmachnikov, I. L., Chassignet, E. P., Lee, C. M., and Tedstone, A. J.: Role of Greenland Freshwater Anomaly in the Recent Freshening of the Subpolar North Atlantic, J. Geophys. Res.-Oceans, 124, 3333–3360, https://doi.org/10.1029/2018JC014686, 2019. a
Dukhovskoy, D. S., Yashayaev, I., Chassignet, E. P., Myers, P. G., Platov, G., and Proshutinsky, A.: Time Scales of the Greenland Freshwater Anomaly in the Subpolar North Atlantic, J. Climate, 34, 8971–8987, https://doi.org/10.1175/JCLI-D-20-0610.1, 2021. a
Duyck, E. and De Jong, M. F.: Cross-Shelf Exchanges Between the East Greenland Shelf and Interior Seas, J. Geophys. Res.-Oceans, 128, e2023JC019905, https://doi.org/10.1029/2023JC019905, 2023. a
Fettweis, X., Hofer, S., Krebs-Kanzow, U., Amory, C., Aoki, T., Berends, C. J., Born, A., Box, J. E., Delhasse, A., Fujita, K., Gierz, P., Goelzer, H., Hanna, E., Hashimoto, A., Huybrechts, P., Kapsch, M.-L., King, M. D., Kittel, C., Lang, C., Langen, P. L., Lenaerts, J. T. M., Liston, G. E., Lohmann, G., Mernild, S. H., Mikolajewicz, U., Modali, K., Mottram, R. H., Niwano, M., Noël, B., Ryan, J. C., Smith, A., Streffing, J., Tedesco, M., van de Berg, W. J., van den Broeke, M., van de Wal, R. S. W., van Kampenhout, L., Wilton, D., Wouters, B., Ziemen, F., and Zolles, T.: GrSMBMIP: intercomparison of the modelled 1980–2012 surface mass balance over the Greenland Ice Sheet, The Cryosphere, 14, 3935–3958, https://doi.org/10.5194/tc-14-3935-2020, 2020. a, b, c, d
Fox-Kemper, B., Adcroft, A., Böning, C. W., Chassignet, E. P., Curchitser, E., Danabasoglu, G., Eden, C., England, M. H., Gerdes, R., Greatbatch, R. J., Griffies, S. M., Hallberg, R. W., Hanert, E., Heimbach, P., Hewitt, H. T., Hill, C. N., Komuro, Y., Legg, S., Sommer, J. L., Masina, S., Marsland, S. J., Penny, S. G., Qiao, F., Ringler, T. D., Treguier, A. M., Tsujino, H., Uotila, P., and Yeager, S. G.: Challenges and prospects in ocean circulation models, Frontiers in Marine Science, 6, 434281, https://doi.org/10.3389/FMARS.2019.00065, 2019. a
Gelderloos, R., Haine, T. W., and Almansi, M.: Subinertial Variability in Four Southeast Greenland Fjords in Realistic Numerical Simulations, J. Geophys. Res.-Oceans, 127, e2022JC018820, https://doi.org/10.1029/2022JC018820, 2022. a
Gillard, L. C., Hu, X., Myers, P. G., and Bamber, J. L.: Meltwater pathways from marine terminating glaciers of the Greenland ice sheet, Geophys. Res. Lett., 43, 873–10, https://doi.org/10.1002/2016GL070969, 2016. a, b
Gladish, C. V., Holland, D. M., Rosing-Asvid, A., Behrens, J. W., and Boje, J.: Oceanic Boundary Conditions for Jakobshavn Glacier. Part I: Variability and Renewal of Ilulissat Icefjord Waters, 2001–14, J. Phys. Oceanogr., 45, 3–32, https://doi.org/10.1175/JPO-D-14-0044.1, 2015. a
Greene, C. A., Gardner, A. S., Wood, M., and Cuzzone, J. K.: Ubiquitous acceleration in Greenland Ice Sheet calving from 1985 to 2022, Nature, 625, 523–528, https://doi.org/10.1038/s41586-023-06863-2, 2024. a, b
Hallberg, R.: Using a resolution function to regulate parameterizations of oceanic mesoscale eddy effects, Ocean Model., 72, 92–103, https://doi.org/10.1016/J.OCEMOD.2013.08.007, 2013. a
Hewitt, H. T., Bell, M. J., Chassignet, E. P., Czaja, A., Ferreira, D., Griffies, S. M., Hyder, P., McClean, J. L., New, A. L., and Roberts, M. J.: Will high-resolution global ocean models benefit coupled predictions on short-range to climate timescales?, Ocean Model., 120, 120–136, https://doi.org/10.1016/J.OCEMOD.2017.11.002, 2017. a
Hopwood, M. J., Carroll, D., Dunse, T., Hodson, A., Holding, J. M., Iriarte, J. L., Ribeiro, S., Achterberg, E. P., Cantoni, C., Carlson, D. F., Chierici, M., Clarke, J. S., Cozzi, S., Fransson, A., Juul-Pedersen, T., Winding, M. H. S., and Meire, L.: Review article: How does glacier discharge affect marine biogeochemistry and primary production in the Arctic?, The Cryosphere, 14, 1347–1383, https://doi.org/10.5194/tc-14-1347-2020, 2020. a, b
Huai, B., van den Broeke, M. R., Reijmer, C. H., and Noël, B.: A Daily 1-km Resolution Greenland Rainfall Climatology (1958–2020) From Statistical Downscaling of a Regional Atmospheric Climate Model, J. Geophys. Res.-Atmos., 127, e2022JD036688, https://doi.org/10.1029/2022JD036688, 2022. a, b
Igneczi, A. and Bamber, J. L.: A high-resolution pan-Arctic meltwater discharge dataset from 1950 to 2021, Earth Syst. Sci. Data, 17, 3203–3218, https://doi.org/10.5194/essd-17-3203-2025, 2025. a, b, c
Jackson, L. C., Alastrué de Asenjo, E., Bellomo, K., Danabasoglu, G., Haak, H., Hu, A., Jungclaus, J., Lee, W., Meccia, V. L., Saenko, O., Shao, A., and Swingedouw, D.: Understanding AMOC stability: the North Atlantic Hosing Model Intercomparison Project, Geosci. Model Dev., 16, 1975–1995, https://doi.org/10.5194/gmd-16-1975-2023, 2023. a
Jackson, R. H. and Straneo, F.: Heat, Salt, and Freshwater Budgets for a Glacial Fjord in Greenland, J. Phys. Oceanogr., 46, 2735–2768, https://doi.org/10.1175/JPO-D-15-0134.1, 2016. a
Jackson, R. H., Shroyer, E. L., Nash, J. D., Sutherland, D. A., Carroll, D., Fried, M. J., Catania, G. A., Bartholomaus, T. C., and Stearns, L. A.: Near-glacier surveying of a subglacial discharge plume: Implications for plume parameterizations, Geophys. Res. Lett., 44, 6886–6894, https://doi.org/10.1002/2017GL073602, 2017. a
Johnson, H. L., Münchow, A., Falkner, K. K., and Melling, H.: Ocean circulation and properties in Petermann Fjord, Greenland, J. Geophys. Res.-Oceans, 116, C01003, https://doi.org/10.1029/2010JC006519, 2011. a
Karlsson, N. B., Solgaard, A. M., Mankoff, K. D., Gillet-Chaulet, F., MacGregor, J. A., Box, J. E., Citterio, M., Colgan, W. T., Larsen, S. H., Kjeldsen, K. K., Korsgaard, N. J., Benn, D. I., Hewitt, I. J., and Fausto, R. S.: Greenland Ice Sheet Basal Melt, v2, Dataverse [data set], https://doi.org/10.22008/FK2/PLNUEO, 2021a. a
Karlsson, N. B., Solgaard, A. M., Mankoff, K. D., Gillet-Chaulet, F., MacGregor, J. A., Box, J. E., Citterio, M., Colgan, W. T., Larsen, S. H., Kjeldsen, K. K., Korsgaard, N. J., Benn, D. I., Hewitt, I. J., and Fausto, R. S.: A first constraint on basal melt-water production of the Greenland ice sheet, Nat. Commun., 12, 3461, https://doi.org/10.1038/s41467-021-23739-z, 2021b. a
Karlsson, N. B., Mankoff, K. D., Solgaard, A. M., Larsen, S. H., How, P. R., Fausto, R. S., and Sørensen, L. S.: A data set of monthly freshwater fluxes from the Greenland ice sheet's marine-terminating glaciers on a glacier-basin scale 2010-2020, GEUS Bulletin, 53, https://doi.org/10.34194/geusb.v53.8338, 2023. a
Khan, S. A., Colgan, W., Neumann, T. A., van den Broeke, M. R., Brunt, K. M., Noël, B., Bamber, J. L., Hassan, J., and Bjørk, A. A.: Accelerating Ice Loss From Peripheral Glaciers in North Greenland, Geophys. Res. Lett., 49, e2022GL098915, https://doi.org/10.1029/2022GL098915, 2022. a, b
King, M. and Howat, I.: Data from: Dynamic ice loss from the Greenland Ice Sheet driven by sustained glacier retreat, DRYAD [data set], https://doi.org/10.5061/dryad.qrfj6q5cb, 2020. a
King, M. D., Howat, I. M., Candela, S. G., Noh, M. J., Jeong, S., Noël, B. P., van den Broeke, M. R., Wouters, B., and Negrete, A.: Dynamic ice loss from the Greenland Ice Sheet driven by sustained glacier retreat, Communications Earth & Environment, 1, 1, https://doi.org/10.1038/s43247-020-0001-2, 2020. a, b, c, d, e, f, g
Kochtitzky, W., Copland, L., King, M., Hugonnet, R., Jiskoot, H., Morlighem, M., Millan, R., Khan, S. A., and Noël, B.: Closing Greenland's Mass Balance: Frontal Ablation of Every Greenlandic Glacier From 2000 to 2020, Geophys. Res. Lett., 50, e2023GL104095, https://doi.org/10.1029/2023GL104095, 2023. a
Køltzow, M., Schyberg, H., Støylen, E., and Yang, X.: Value of the Copernicus Arctic Regional Reanalysis (CARRA) in representing near-surface temperature and wind speed in the north-east European Arctic, Polar Res., 41, https://doi.org/10.33265/POLAR.V41.8002, 2022. a
LanguageTool: LanguageTool, https://languagetool.org/, 2025. a
Mankoff, K. D.: Greenland Ice Sheet solid ice discharge from 1986 through last month, v100, Dataverse [data set], https://doi.org/10.22008/promice/data/ice_discharge, 2020. a
Mankoff, K. D., Noël, B., Fettweis, X., Ahlstrøm, A. P., Colgan, W., Kondo, K., Langley, K., Sugiyama, S., van As, D., and Fausto, R. S.: Greenland liquid water discharge from 1958 through 2019, Earth Syst. Sci. Data, 12, 2811–2841, https://doi.org/10.5194/essd-12-2811-2020, 2020a. a, b, c
Mankoff, K. D., Solgaard, A., Colgan, W., Ahlstrøm, A. P., Khan, S. A., and Fausto, R. S.: Greenland Ice Sheet solid ice discharge from 1986 through March 2020, Earth Syst. Sci. Data, 12, 1367–1383, https://doi.org/10.5194/essd-12-1367-2020, 2020b. a, b, c, d, e, f, g
Mankoff, K. D., Fettweis, X., Langen, P. L., Stendel, M., Kjeldsen, K. K., Karlsson, N. B., Noël, B., van den Broeke, M. R., Solgaard, A., Colgan, W., Box, J. E., Simonsen, S. B., King, M. D., Ahlstrøm, A. P., Andersen, S. B., and Fausto, R. S.: Greenland ice sheet mass balance from 1840 through next week, Earth Syst. Sci. Data, 13, 5001–5025, https://doi.org/10.5194/essd-13-5001-2021, 2021. a
Marson, J. M., Gillard, L. C., and Myers, P. G.: Distinct Ocean Responses to Greenland's Liquid Runoff and Iceberg Melt, J. Geophys. Res.-Oceans, 126, e2021JC017542, https://doi.org/10.1029/2021JC017542, 2021. a
Martin, T. and Biastoch, A.: On the ocean's response to enhanced Greenland runoff in model experiments: relevance of mesoscale dynamics and atmospheric coupling, Ocean Sci., 19, 141–167, https://doi.org/10.5194/os-19-141-2023, 2023. a, b
Meire, L., Mortensen, J., Meire, P., Juul-Pedersen, T., Sejr, M. K., Rysgaard, S., Nygaard, R., Huybrechts, P., and Meysman, F. J.: Marine-terminating glaciers sustain high productivity in Greenland fjords, Glob. Change Biol., 23, 5344–5357, https://doi.org/10.1111/gcb.13801, 2017. a
Meire, L., Paulsen, M. L., Meire, P., Rysgaard, S., Hopwood, M. J., Sejr, M. K., Stuart-Lee, A., Sabbe, K., Stock, W., and Mortensen, J.: Glacier retreat alters downstream fjord ecosystem structure and function in Greenland, Nat. Geosci., 16, 671–674, https://doi.org/10.1038/s41561-023-01218-y, 2023. a
Moon, T., Sutherland, D. A., Carroll, D., Felikson, D., Kehrl, L., and Straneo, F.: Subsurface iceberg melt key to Greenland fjord freshwater budget, Nat. Geosci., 11, 49–54, https://doi.org/10.1038/s41561-017-0018-z, 2018. a
Moon, T. A., Cohen, B., Black, T. E., Laidre, K. L., Stern, H. L., and Joughin, I.: Characterizing southeast Greenland fjord surface ice and freshwater flux to support biological applications, The Cryosphere, 18, 4845–4872, https://doi.org/10.5194/tc-18-4845-2024, 2024. a, b
Mortensen, J., Bendtsen, J., Lennert, K., and Rysgaard, S.: Seasonal variability of the circulation system in a west Greenland tidewater outlet glacier fjord, Godthåbsfjord (64° N), J. Geophys. Res.-Earth, 119, 2591–2603, https://doi.org/10.1002/2014JF003267, 2014. a
Mouginot, J., Rignot, E., Bjørk, A. A., van den Broeke, M., Millan, R., Morlighem, M., Noël, B., Scheuchl, B., and Wood, M.: Forty-six years of Greenland Ice Sheet mass balance from 1972 to 2018, P. Natl. Acad. Sci. USA, 116, 9239–9244, https://doi.org/10.1073/PNAS.1904242116, 2019. a, b, c
Noël, B., van de Berg, W. J., Machguth, H., Lhermitte, S., Howat, I., Fettweis, X., and van den Broeke, M. R.: A daily, 1 km resolution data set of downscaled Greenland ice sheet surface mass balance (1958–2015), The Cryosphere, 10, 2361–2377, https://doi.org/10.5194/tc-10-2361-2016, 2016. a
Noël, B., van de Berg, W. J., Lhermitte, S., and van den Broeke, M. R.: Rapid ablation zone expansion amplifies north Greenland mass loss, Science Advances, 5, eaaw0123, https://doi.org/10.1126/SCIADV.AAW0123, 2019. a, b, c, d, e, f, g, h
Oksman, M., Kvorning, A. B., Larsen, S. H., Kjeldsen, K. K., Mankoff, K. D., Colgan, W., Andersen, T. J., Nørgaard-Pedersen, N., Seidenkrantz, M.-S., Mikkelsen, N., and Ribeiro, S.: Impact of freshwater runoff from the southwest Greenland Ice Sheet on fjord productivity since the late 19th century, The Cryosphere, 16, 2471–2491, https://doi.org/10.5194/tc-16-2471-2022, 2022. a
Oqaasileriffik (The Language Secretariat of Greenland): Nunat Aqqi – Stednavne – Place names, https://asiaq.maps.arcgis.com/apps/View/index.html?appid=c5c7d9d52a264980a24911d7d33914b5 (last access: 1 June 2025), 2024. a
Pfeffer, W. T., Meier, M. F., and Illangasekare, T. H.: Retention of Greenland runoff by refreezing: Implications for projected future sea level change, J. Geophys. Res.-Oceans, 96, 22117–22124, https://doi.org/10.1029/91JC02502, 1991. a
QGIS Development Team: QGIS Geographic Information System, QGIS Development Team [software], 2025. a
Sanchez, R., Slater, D., and Straneo, F.: Delayed Freshwater Export from a Greenland Tidewater Glacial Fjord, J. Phys. Oceanogr., 53, 1291–1309, https://doi.org/10.1175/JPO-D-22-0137.1, 2023. a, b, c
Schyberg, H., Yang, X., Køltzow, M., Amstrup, B., Bakketun, A., Bazile, E., Bojarova, J., Box, J. E., Dahlgren, P., Hagelin, S., Homleid, M., Horányi, A., Høyer, J., Johansson, A., Killie, M. A., Körnich, H., Le Moigne, P., Lindskog, M., Manninen, T., Nielsen Englyst, P., Nielsen, K. P., Olsson, E., Palmason, B., Peralta Aros, C., Randriamampianina, R., Samuelsson, P., Stappers, R., Støylen, E., Thorsteinsson, S., Valkonen, T., and Wang, Z. Q.: Arctic regional reanalysis on single levels from 1991 to present, Copernicus Climate Change Service (C3S) Climate Data Store (CDS) [data set], https://doi.org/10.24381/cds.713858f6, 2020. a, b
Slater, D. A., Felikson, D., Straneo, F., Goelzer, H., Little, C. M., Morlighem, M., Fettweis, X., and Nowicki, S.: Twenty-first century ocean forcing of the Greenland ice sheet for modelling of sea level contribution , The Cryosphere, 14, 985–1008, https://doi.org/10.5194/tc-14-985-2020, 2020. a
Slater, D. A., Carroll, D., Oliver, H., Hopwood, M. J., Straneo, F., Wood, M., Willis, J. K., and Morlighem, M.: Characteristic Depths, Fluxes, and Timescales for Greenland's Tidewater Glacier Fjords From Subglacial Discharge-Driven Upwelling During Summer, Geophys. Res. Lett., 49, e2021GL097081, https://doi.org/10.1029/2021GL097081, 2022. a, b
Stuart-Lee, A. E., Mortensen, J., Kaaden, A. S. d., and Meire, L.: Seasonal Hydrography of Ameralik: A Southwest Greenland Fjord Impacted by a Land-Terminating Glacier, J. Geophys. Res.-Oceans, 126, e2021JC017552, https://doi.org/10.1029/2021JC017552, 2021. a, b, c
van As, D., Andersen, M. L., Petersen, D., Fettweis, X., Van Angelen, J. H., Lenaerts, J. T., Van Den Broeke, M. R., Lea, J. M., Bøggild, C. E., Ahlstrøm, A. P., and Steffen, K.: Increasing meltwater discharge from the Nuuk region of the Greenland ice sheet and implications for mass balance (1960–2012), J. Glaciol., 60, 314–322, https://doi.org/10.3189/2014JOG13J065, 2014. a
van As, D., Hasholt, B., Ahlstrøm, A. P., Box, J. E., Cappelen, J., Colgan, W., Fausto, R. S., Mernild, S. H., Mikkelsen, A. B., Noël, B. P., Petersen, D., and van den Broeke, M. R.: Reconstructing Greenland Ice Sheet meltwater discharge through the Watson River (1949–2017), Arct. Antarct. Alp. Res., 50, S100010, https://doi.org/10.1080/15230430.2018.1433799, 2018. a
van Dalum, C. T., van de Berg, W. J., Gadde, S. N., van Tiggelen, M., van der Drift, T., van Meijgaard, E., van Ulft, L. H., and van den Broeke, M. R.: First results of the polar regional climate model RACMO2.4, The Cryosphere, 18, 4065–4088, https://doi.org/10.5194/tc-18-4065-2024, 2024. a
van den Broeke, M., Bamber, J., Ettema, J., Rignot, E., Schrama, E., Van Berg, W. J. D., Van Meijgaard, E., Velicogna, I., and Wouters, B.: Partitioning recent Greenland mass loss, Science, 326, 984–986, https://doi.org/10.1126/SCIENCE.1178176, 2009. a
van den Broeke, M. R., Enderlin, E. M., Howat, I. M., Kuipers Munneke, P., Noël, B. P. Y., van de Berg, W. J., van Meijgaard, E., and Wouters, B.: On the recent contribution of the Greenland ice sheet to sea level change, The Cryosphere, 10, 1933–1946, https://doi.org/10.5194/tc-10-1933-2016, 2016. a
van Rossum, G. and L. Drake, F.: Python 3 Reference Manual, CreateSpace, Scotts Valley, CA, USA, 242 pp., ISBN 978-1-4414-1269-0, 2009. a
van Wessem, J. M., van den Broeke, M. R., Wouters, B., and Lhermitte, S.: Variable temperature thresholds of melt pond formation on Antarctic ice shelves, Nat. Clim. Change, 2023 13, 161–166, https://doi.org/10.1038/s41558-022-01577-1, 2023. a
Vries, A. L.: Data supporting: “Seasonal and interannual variability of freshwater sources for Greenland's fjords” submitted to The Cryosphere special issue “Northern hydrology in transition – impacts of a changing cryosphere on water resources, ecosystems, and humans” on November 29, 2024 by Vries et al. v2, Zenodo [data set], https://doi.org/10.5281/zenodo.15013761, 2025. a, b
Wieber, C., Jensen, L. Z., Vergeynst, L., Meire, L., Juul-Pedersen, T., Finster, K., and Šantl-Temkiv, T.: Terrestrial runoff is an important source of biological ice-nucleating particles in Arctic marine systems, Atmos. Chem. Phys., 25, 3327–3346, https://doi.org/10.5194/acp-25-3327-2025, 2025. a
Wood, M., Rignot, E., Fenty, I., Menemenlis, D., Millan, R., Morlighem, M., Mouginot, J., and Seroussi, H.: Ocean-Induced Melt Triggers Glacier Retreat in Northwest Greenland, Geophys. Res. Lett., 45, 8334–8342, https://doi.org/10.1029/2018GL078024, 2018. a
Yang, Q., Dixon, T. H., Myers, P. G., Bonin, J., Chambers, D., and Van Den Broeke, M. R.: Recent increases in Arctic freshwater flux affects Labrador Sea convection and Atlantic overturning circulation, Nat. Commun., 7, 10525, https://doi.org/10.1038/ncomms10525, 2016. a
Zahn, M. J., Laidre, K. L., Simon, M., Stafford, K. M., Wood, M., Willis, J. K., Phillips, E. M., and Fenty, I.: Consistent Seasonal Hydrography From Moorings at Northwest Greenland Glacier Fronts, J. Geophys. Res.-Oceans, 129, e2024JC021046, https://doi.org/10.1029/2024JC021046, 2024. a
Zhao, K. X., Stewart, A. L., and McWilliams, J. C.: Linking Overturning, Recirculation, and Melt in Glacial Fjords, Geophys. Res. Lett., 49, e2021GL095706, https://doi.org/10.1029/2021GL095706, 2022. a
Zuo, Z. and Oerlemans, J.: Modelling albedo and specific balance of the Greenland ice sheet: calculations for the Søndre Strømfjord transect, J. Glaciol., 42, 305–317, https://doi.org/10.3189/S0022143000004160, 1996. a