the Creative Commons Attribution 4.0 License.
the Creative Commons Attribution 4.0 License.
 | 04 Sep 2025
Optimizing rock glacier activity classification in South Tyrol (northeastern Italy): integrating multisource data with statistical modelling
Stefan Steger
Giovanni Cuozzo
Francesca Bearzot
Volkmar Mair
Claudia Notarnicola
As a consequence of atmospheric warming, high-altitude periglacial and glacial environments exhibit clear signs of cryosphere degradation, and the Alps serve as a natural laboratory for studying the primary effects on permafrost-related features. Our research in South Tyrol, northeastern Italy, aimed to develop an updated classification system, based on remote sensing data and statistical models, for rock glacier activity, categorizing it as active, transitional, or relict according to the new Rock Glacier Inventories and Kinematic (RGIK) guidelines. While the current regional inventory includes activity attributes based on morphological observations and differential interferometric synthetic aperture radar (DInSAR) coherence, it lacks a comprehensive classification that also considers climatic drivers, displacement rates, and morphometric parameters. To fill this gap, we utilized the Alaska Satellite Facility's interferometric synthetic aperture radar (InSAR) cloud computing, employing the Small Baseline Subset (SBAS) and Miami InSAR time-series software in Python (MintPy) algorithms to extract velocity data for each rock glacier investigated in this study. Additionally, we analysed geomorphological and climatic maps derived from in situ and remote sensing data to obtain descriptive parameters influencing rock glacier development and activity. From a wide range of potential variables, we selected eight key predictors, representing physical (e.g. temperature), morphological (e.g. roughness), and dynamic attributes (e.g. velocity and coherence indicators). These predictors were integrated in a multiclass generalized additive model (GAM) classifier to categorize the mapped landforms. Applying this model to the entire dataset (achieving an area under the curve (AUC) over 0.9) allowed us to address gaps in previous classification methods and provided activity attributes for previously unclassified rock glaciers, along with associated uncertainty values. Our approach enhanced the previous classification, leaving only 3.5 % of features unclassified compared to 13 % in morphological classification and 18.5 % in the DInSAR-based method. The results revealed a predominance of relict features (∼75 %) and a smaller number of active ones (∼10 %). The result of the distribution of active, transitional, and relict classes suggests that the transition from active to relict states is not direct. Instead, an intermediate transitional phase is commonly observed. This comprehensive approach refines the categorization of mapped features and improves our understanding of the factors influencing rock glacier activity in the alpine environment in South Tyrol.
- Article
(5572 KB) - Full-text XML
-
Supplement
(825 KB) - BibTeX
- EndNote


Rock glaciers are widespread periglacial landforms in mountain regions and are regarded as key geomorphological evidence of permafrost presence in alpine environments (Haeberli, 2000; Janke and Bolch, 2022). They consist of a continuous, thick, seasonally frozen debris layer (known as the active layer), covering ice-supersaturated debris or pure ice. They are characterized by gravity-driven creep as a consequence of ice/debris mixture deformations under permafrost conditions (Haeberli et al., 2006), which promote a distinctive surface topography (i.e. ridges and furrow complexes, convex transverse or longitudinal surface undulations).
The large-scale spatial distribution of rock glaciers is influenced by the complex interaction of topographic factors and climate, specifically by mean annual air temperature and precipitation. However, on a local scale, their distribution is dictated by local factors such as slope and aspect, structure and lithology of bedrock, debris input, heat budget of the ground, shading, and duration and thickness of snow cover (Cicoira et al., 2019; Kenner and Magnusson, 2017; Bodin et al., 2009). Rock glacier distribution and evolution and current permafrost degradation may affect the slope stability, runoff patterns, vegetation coverage, and water availability and quality, promoting landslides, geological disasters, debris flows, destabilization phenomena (Pruessner et al., 2021; Marcer et al., 2019; Gruber and Haeberli, 2007), and direct or indirect risk to human activities and/or facilities (e.g. infrastructures, buildings) (Hassan et al., 2021; Arenson and Jakob, 2017). Furthermore, some rock glaciers act as essential hydrological reserve in high mountain systems, prolonging long-term water (and ice) storage; consequently, their presence and abundance could affect the amount and properties of runoff from high mountain watersheds (Bearzot et al., 2023; Wagner et al., 2021; Brighenti et al., 2019).
The genesis of rock glaciers has been debated for a long time, with some studies linking them to periglacial conditions and the presence of permafrost (Knight et al., 2019; Haeberli et al., 2006) or associating them with paraglacial processes (Frauenfelder and Kääb, 2000). Others suggest a glacial origin for rock glaciers (Monnier et al., 2013; Krainer and Mostler, 2000; Whalley and Palmer, 1998), proposing that they evolve from debris-covered glaciers, with interstitial ice being of glacial origin rather than meteoric (i.e. permafrost). Depending on their permafrost content and activity, rock glaciers have been categorized into three categories: (i) active rock glaciers, in which the internal deformation of frozen material and ice produces an effective surface displacement; (ii) inactive rock glaciers that still contain ice but have stopped moving; and (iii) relict rock glaciers that no longer contain ice and consequently have no movement (RGIK, 2023). The active and inactive rock glaciers are commonly grouped together into a class called intact rock glaciers. Although widely used, this classification is strongly dependent on the operator skills and, unless there is subsurface information regarding the presence or lack of permafrost, remains uncertain. In response to the ongoing increase in permafrost temperature, an acceleration trend has been observed worldwide, although with different phases based on the geographical regions and the characteristics of the individual landforms. For these reasons, the existing rock glacier classification was redefined as follows: (i) active rock glaciers (active), which move downslope over most of their surface and present steep front and lateral margins and contain freshly exposed material on top; (ii) transitional rock glaciers (transitional), which show slow movement to no downslope movement over most of their surface and can either evolve towards a relict or an active state, depending on topographic and climatic context; and (iii) relict rock glaciers (relict), which show no evidence of recent movement, generally characterized by smoothed lateral and frontal margins and by the presence of vegetation and soil cover (RGIK, 2023). Therefore, this updated classification does not consider the ground ice content but rather the efficiency of sediment conveyance, namely the surface movement at the time of observations.
In the regional territory of South Tyrol (eastern Italian Alps), two rock glacier activity classifications coexist over the same inventory: one is the South Tyrol Inventory produced by the Autonomous Province of Bolzano/Bozen (PAB), and the other one was created by Bertone et al. (2019). Although a descriptive attribute of activity from independent morphological observations and an SAR coherence-based estimation is already included in the two datasets, a comprehensive definition of activity based on the integration of climatic drivers, displacement rates, and morphological parameters is lacking. Such an integrated approach is increasingly important, particularly as rock glacier velocity has gained attention as a key metric. Notably, velocity has recently been recognized as a new essential climate variable (ECV) (Kellerer-Pirklbauer et al., 2024), underscoring the need to incorporate velocity-based indicators when assessing the state of activity.
The primary innovation of this study lies in the analysis of multiple variables, each one describing a key evidence or predisposing condition of rock glacier activity, integrated through multivariate statistical analysis in a predictive generalized additive model (GAM). We derived the input variables by integrating multiple data sources, including multispectral satellite imagery (Landsat, MODIS), radar data (Sentinel-1), interpolated ground measurements from weather stations, and variables extracted from digital terrain model (DTM) analysis.
To this aim, we propose a workflow where (i) we firstly exploit satellite remote sensing products and implement routines to extract velocity attributes and environmental descriptors at the regional scale; (ii) we calibrate and validate a predictive multiclass generalized additive model (GAM) that maximizes their explanatory potential; and (iii) we apply the model to the entire dataset, reclassifying each landform in a specific activity class. Our approach effectively highlights which variables (such as climatic, morphological, and dynamic parameters) and interactions best control each rock glacier's class of activity in the area investigated. Throughout this paper, the recent classification (active, transitional, and relict classes) was considered to define the activity of rock glaciers.
The study area covers the entire South Tyrol region (northeastern Italy, ∼7400 km2) and extends over altitudes between approximately 200 m a.s.l. in the valley bottoms to 3900 m a.s.l. at the Ortler peak. The Periadriatic Line (PL; Fig. 1a) separates the central eastern part, where sedimentary and metasedimentary rocks of the South Alpine domain outcrop, from the western regions characterized by the metamorphic lithologies of the Austroalpine and Pennidic domain, outcropping in the northeasternmost sector (Stingl and Mair, 2005). The climate of South Tyrol exhibits a predominantly continental character, with a mean annual precipitation sum (period 1981–2010; Crespi et al., 2021) generally around 1000 mm. However, the precipitation varies largely in South Tyrol from a regional point of view: the western sector, which includes Val Venosta (Fig. 1b) and its side valleys, such as Val Senales, Val di Trafoi, Val Martello, and Val d'Ultimo, has less precipitation (average annual precipitation ≤825.2 mm) than the central and eastern sector, which includes the vast highland in central and eastern South Tyrol (average annual precipitation >825.2 mm) (Hao et al., 2019). The mean annual temperature extracted over the same period (1981–2010) is around 12 °C in the valley bottoms and decreases on the slopes until reaching the 0 °C isotherm at around 2400–2500 m a.s.l. (Crespi et al., 2021; Carturan et al., 2023).
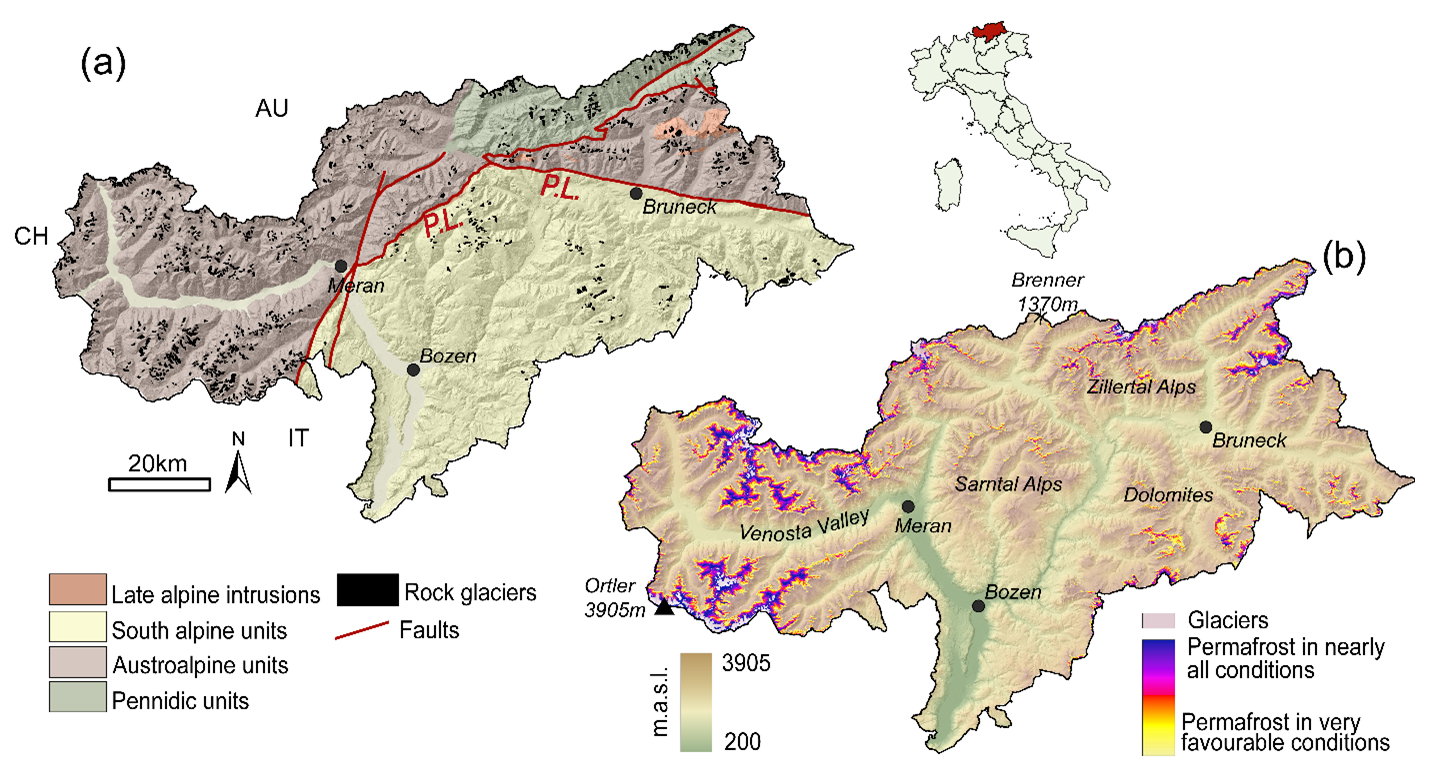
Figure 1South Tyrol region: (a) lithological and structural map of the main geological units and faults in South Tyrol. Rock glaciers of the Autonomous Province of Bolzano/Bozen dataset are highlighted in black. (b) Digital elevation model with permafrost and glacier distribution. Data source: Autonomous Province of Bolzano.
Regarding the permafrost map (https://www.provincia.bz.it/edilizia/progettazione/alto-adige.asp, last access: May 2024), the region is characterized by discontinuous mountain permafrost which develops from a minimum height of 2300–2400 to 2500 m a.s.l. (Fig. 1b), according to sector- and site-specific climate conditions (Boeckli et al., 2012).
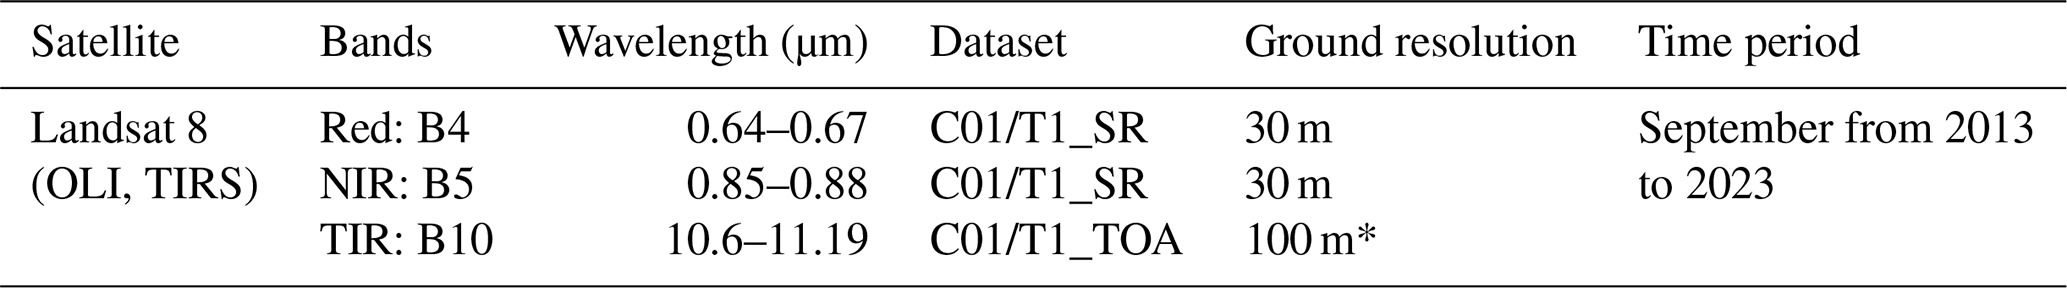
Multisource and multi-platform data from remote sensing products and ground-based measurements were collected and jointly analysed. Using MODIS and Landsat satellite data allows the extraction of environmental parameters, such as snow cover duration and land surface temperature. MODIS, on board the Terra and Aqua satellites, with its multispectral capabilities and daily repeat time, demonstrated efficacy in extracting the snow cover area both regionally and globally (Notarnicola, 2020). Using Landsat 8 Collection 2 Tier 1 data, we extracted land surface temperature (LST), an ECV recognized by both the Global Climate Observing System (GCOS) and the European Space Agency's Climate Change Initiative (CCI) (Galve et al., 2022; Parastatidis et al., 2017; Ermida et al., 2020). LST was derived from the thermal bands (B10 and B11) of the thermal infrared sensor (TIRS), which has a native spatial resolution of 100 m. Additionally, multispectral surface reflectance bands (SR_B1 to SR_B7) and the QA_PIXEL band from the Operational Land Imager (OLI), with a spatial resolution of 30 m, were used for preprocessing tasks, such as cloud masking and emissivity correction.
Sentinel-1 SAR images were processed using HyP3 software (Sect. 2.3) to retrieve dynamic attributes, i.e. velocity and coherence values, over the entire area of interest (AOI).
These variables, coupled with a range of data pertaining to rock glacier morphometry and encompassing factors such as slope angle, elevation, lithology, and climate conditions, lead to a redefinition of activity classifications for all the mapped landforms within the pre-existing dataset. The overall workflow is sketched in Fig. 2.
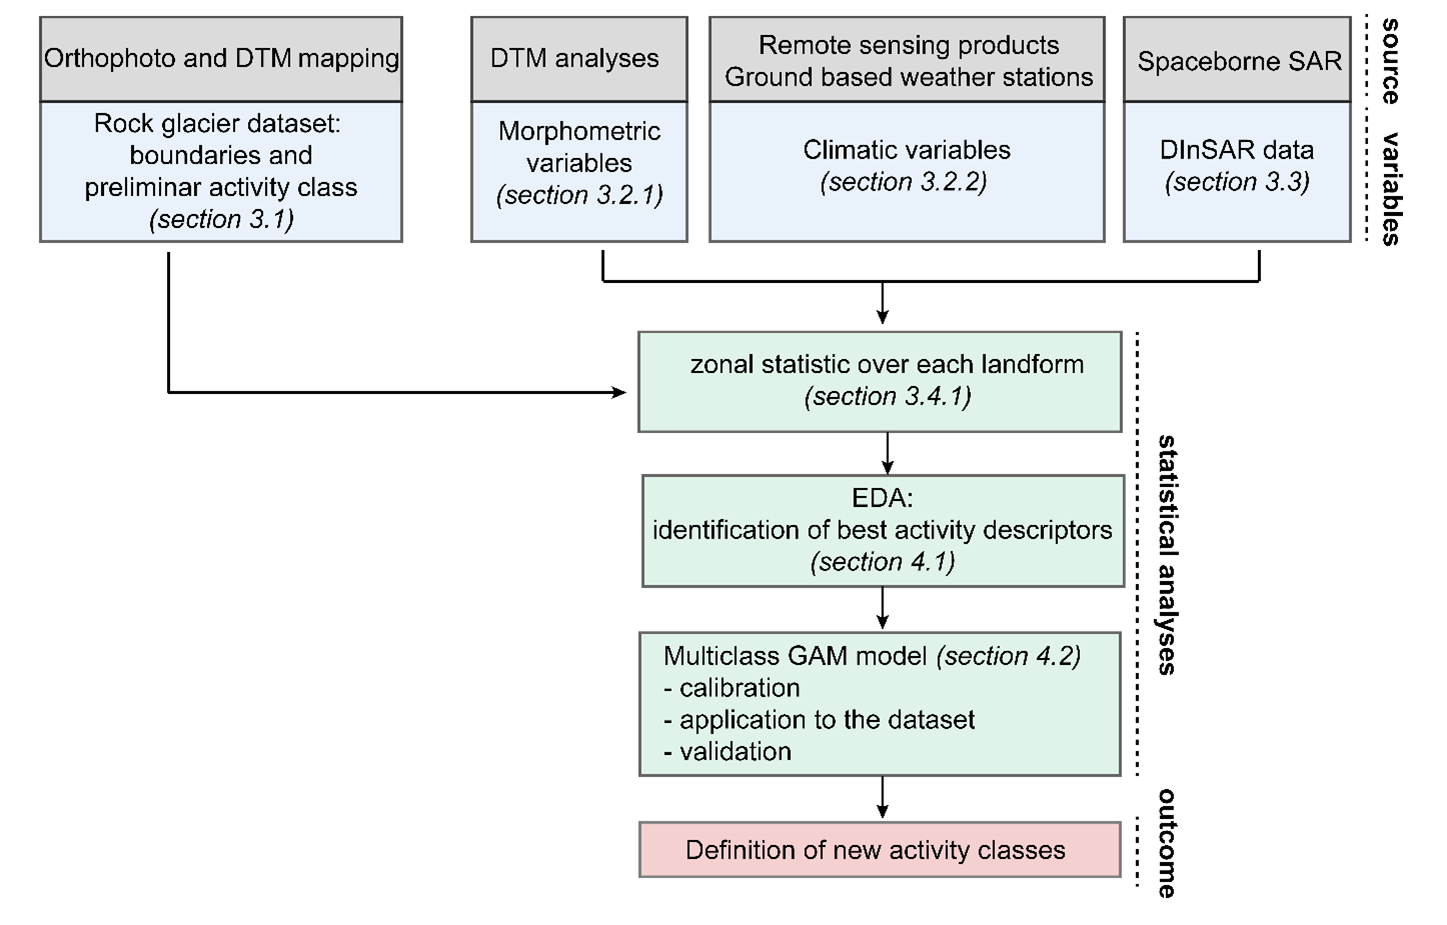
Figure 2Schematic workflow illustrating the variables employed and the steps involved in the statistical analysis to derive the final activity class.
3.1 Rock glacier dataset
This study utilized a comprehensive rock glacier dataset (year 2010) covering the entire South Tyrol region. This dataset is freely available on the WebGIS portal of the provincial administration of South Tyrol (https://test-data.civis.bz.it/dataset/rock-glacier, last access: May 2023.) and accounts for 1779 features. The identification and mapping of periglacial landforms were conducted by using light detection and ranging (lidar) digital terrain models (DTMs) with a ground sample distance of 2.5 m, supplemented by orthophotos from 2000 (1 m resolution), 2006 (50 cm resolution), 2008 (10 cm resolution), and 2014 (20 cm resolution). The resulting catalogue not only includes boundary polygons but also incorporates descriptive features and qualitative aspects, determined through visual morphological inspection of each form. Employing this approach, a classification attribute has been assigned, categorizing forms, where feasible, into active, inactive, and relict states (Table 1).
Table 1Activity attributes of the Autonomous Province of Bolzano/Bozen (PAB) classification (row) and those from Bertone coherence-based classification (column). Active, transitional, relict, and n. d. (not defined) correspond to the new preliminary labels attributed combining the two initial attributes.
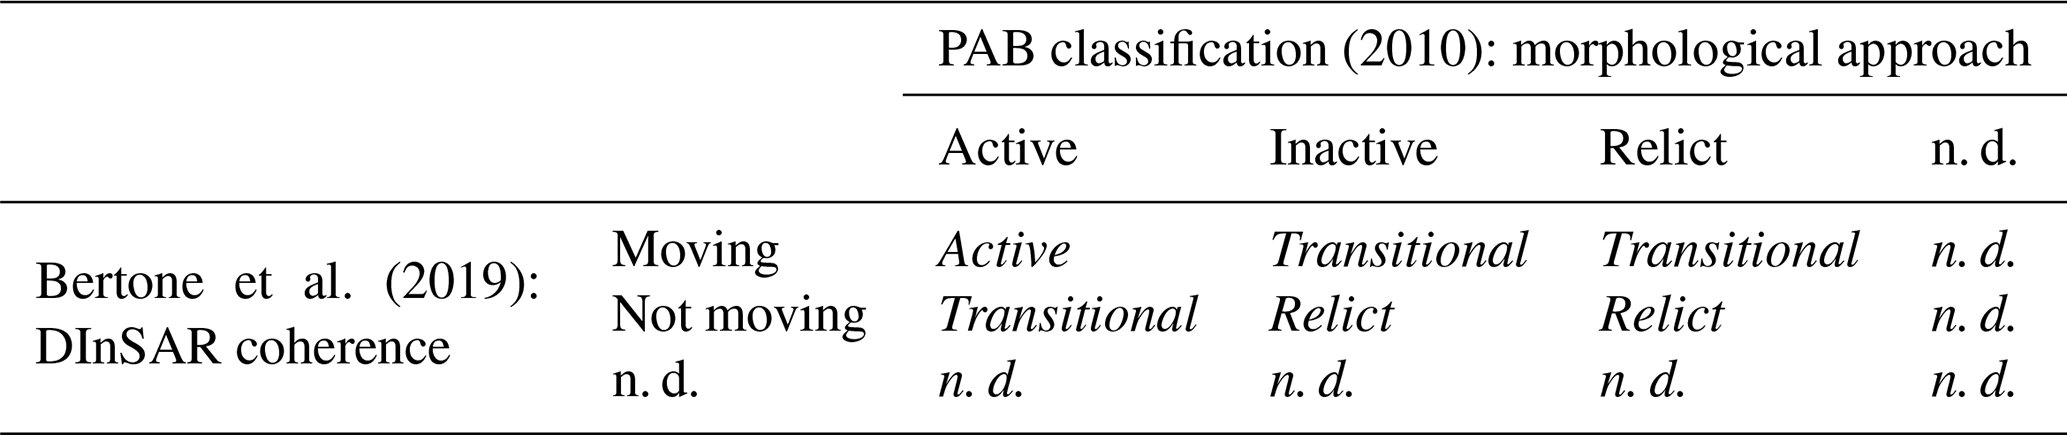
Among all the features, 13.5 % are classified as active, 70 % are classified as relict, and 3.3 % are classified as inactive. The remaining part could not be classified (not defined – n. d.) based on a simple geomorphological approach. Starting from the same catalogue, Bertone et al. (2019) reclassified all the features by adopting an interferometric coherence-based approach, which was used as an indicator of displacements. Considering only a kinematic approach, the features were reclassified as (i) “moving”, for those rock glaciers with displacement detectable using coherence, and (ii) “not moving”, for rock glaciers where displacement was not detectable (Table 1). Based on this classification, 13 % of the mapped features are moving, 68 % are not moving, and the remaining 18 % could not be classified simply with the interferometric synthetic aperture radar (InSAR) coherence approach because of vegetation cover, rock glacier dimensions that are too small, or layover and shadowing conditions.
The two classifications offer distinct kinematic attributes, with one (Autonomous Province of Bolzano/Bozen Inventory) focusing on the potential presence of inner permafrost and its morphological expression and the other (Bertone's Inventory) providing an indication of surface movements. To integrate both perspectives and gather a singular and consistent activity indicator aligned with the newly proposed Rock Glacier Inventories and Kinematics (RGIK) classes (RGIK, 2023), we categorized rock glaciers as “active” only if they exhibited movement in both classifications. The “relict” class was assigned to rock glaciers showing no movement in both datasets and determined to be either inactive or relict. For the remaining cases, which did not fall into the aforementioned categories, we classified them as “transitional”, excluding features that could not be classified (Table 1).
This reclassification serves to diminish uncertainty in categorizing the active and relict forms, as these groups align more consistently. However, greater uncertainty is associated with the transitional class, where the two classifications do not converge.
3.2 Rock glacier dataset
To comprehensively characterize the rock glacier area, we extracted terrain attributes linked to local topographic and climatic site conditions, along with area characteristics that can influence debris supply, such as the main lithology (Table 2).
Table 2Spatial environmental parameters extracted for each rock glacier.
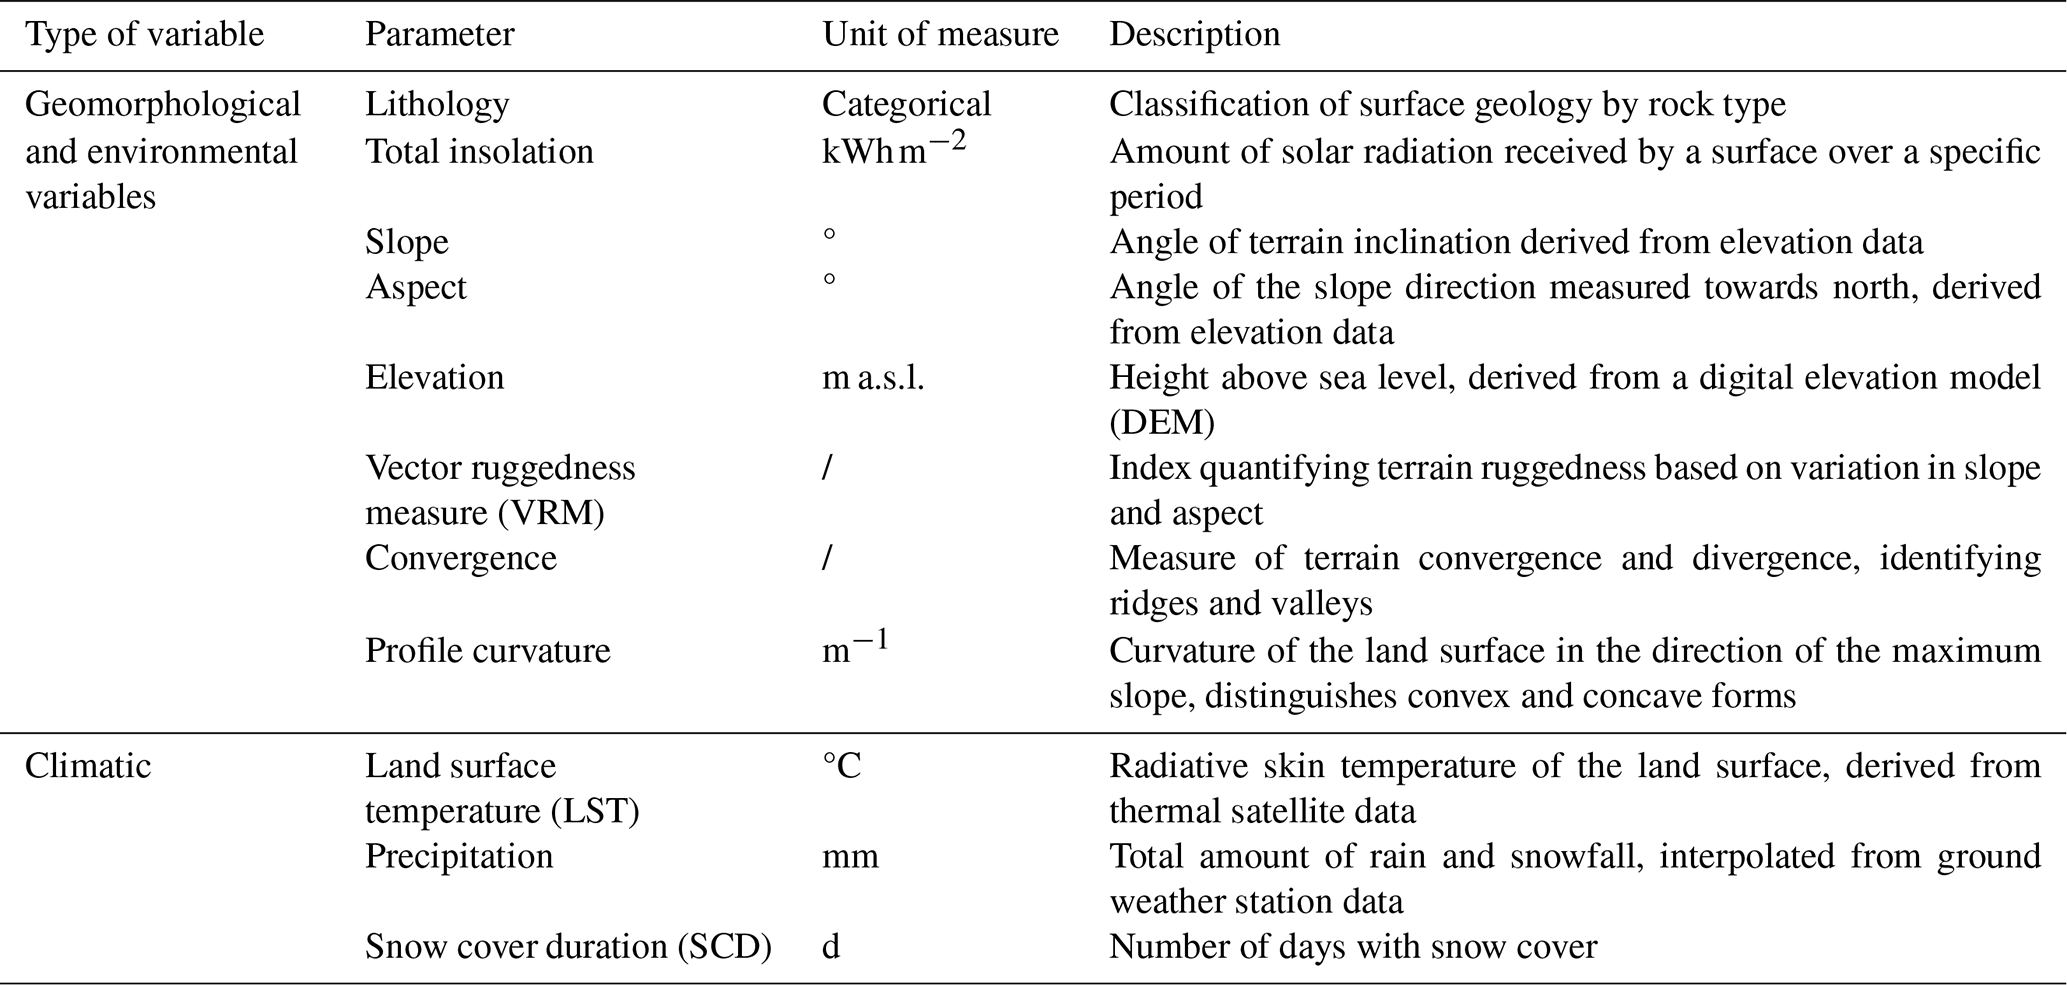
3.2.1 Geomorphological and environmental variables
The lithology varies significantly across the AOI (Fig. 1) due to the juxtaposition of rocks from different geodynamic settings. Starting from a geological map of South Tyrol (scale 1:25 000 derived from CARG surveys at 1:10 000 scale; http://www.provincia.bz.it/costruire-abitare/edilizia-pubblica/geologia-e-prove-materiali.asp, last access: May 2023) and based on the origin of the lithologies (sedimentary, igneous, or metamorphic), we categorized them into four macro-classes: (i) granitoids and volcanic rocks, (ii) metasediments and low metamorphic facies, (iii) facies from middle to high metamorphism, and (iv) sedimentary cover. Then, as our main goal is classifying the activity class of mapped rock glaciers rather than analysing factors contributing to their initiation, we also incorporated morphological indexes sensitive to various permafrost dynamics (Table 2). Active landforms should in fact display a more swollen appearance due to the presence of inner permafrost and deformation that often leads to the formation of furrows and transversal ridges, inducing a consequent increase in surface roughness. On the other hand, relict rock glaciers, with limited or absent permafrost core, may have a more convex and flatter surface with consequently lower values of vector ruggedness measure (VRM) and positive profile curvature.
Terrain attributes obtained from a smoothed 10 m DEM resolution (downsampling of the 2006 digital elevation model at 2.5 m from the Autonomous Province of Bolzano/Bozen, http://geokatalog.buergernetz.bz.it/geokatalog/#!, last access: May 2023) were incorporated into the analysis, as they are expected to capture the overall characteristics of the topographic niche of rock glaciers. All the analyses took place in SAGA GIS 9.03 and ArcGIS 10.8.
3.2.2 Climatic variables
Land surface temperature
Land surface temperature (LST; Fig. S1 in the Supplement) represents the radiative skin temperature of the land surface, as measured in the direction of the remote sensor. While acknowledging the disparities between ground surface temperature (GST) and LST, the latter generally displays a pattern that may closely follow the GST variability, suggesting the possibility of linking GST to LST products (Serban et al., 2023; Sun et al., 2015). As consequence, due to the lack of ground measurements that could be used to retrieve the GST, we considered Landsat-derived LST to be an indicator of surface temperature variability, sensitive to factors such as elevation, slope, aspect, soil structure, snow, and vegetation cover.
Analyses were carried out on the Google Earth Engine (GEE) platform by using the code proposed by Ermida et al. (2020) to process thermal infrared (TIR) band signals provided by Landsat 8 over the period 2013–2023 (Table 3).
Table 3Dataset used to compute LST in GEE.
* Resampled to 30 m.
The distribution of the rock glaciers is spread across a wide range of elevation (1850–3100 m a.s.l.). Since several of them, especially those classified as relict, occupy low-altitude sectors and can be covered by bushes and shrubs, some precautions were imposed on the algorithm to quantify the LST properly, such as the correction of the Normalized Difference Vegetation Index (NDVI) to emissivity to adjust it for the surface vegetation contribution (Malakar et al., 2018; Parastatidis et al., 2017; Ermida et al., 2020). A cloud filter was also added to exclude images with a cloud coverage exceeding 20 % over the scene. For the analyses, we then only consider images acquired in September to emphasize potential spatial differences between rock glaciers bearing permafrost and areas with no permafrost. In September, as the air temperature begins to drop, the differing response rates of permafrost and rocks to this change can lead to a more pronounced temperature delta. In addition, after the warmer summer months, permafrost may still be in the process of thawing, during which the heat absorption phenomenon occurs, contributing to a slower increase in temperature compared to rocks without permafrost.
Precipitation
Mean seasonal precipitation maps (Figs. S2 and S3 in the Supplement) were extracted, starting from high-resolution gridded datasets (cell size of 250 m) of daily precipitation records for Trentino South Tyrol (Crespi et al., 2021).
We analysed a 20-year time frame spanning 2000 to 2018, calculating the average precipitation values for both summer (July to September) and winter (from October to June). This differentiation is crucial in high-altitude environments due to the necessity of discerning between periods dominated by liquid precipitation in summer and those characterized by solid precipitation in winter. This is particularly important because the weather station in South Tyrol collects precipitation data without distinguishing between these two contributions.
Snow cover duration
Snow cover duration (SCD; Fig. S4 in the Supplement) on the ground significantly affects the ground thermal regime modifying the heat insulation, water storage, and runoff contribution, but the interaction of ground temperature and snow cover is not entirely straightforward, and its effects on permafrost conditions can change according to snow depth, type, and water content (meaning snow water equivalent, SWE; Bender et al., 2020). However, analysing the thickness and snow water equivalent (SWE) of the snow cover falls beyond the scope of this study, as it would require supplementary ground-based measurements that are not readily available or easily extendable across all mapped features at the regional scale. Here, we only consider the snow cover duration, retrieved from the MODIS satellite with 250 m spatial resolution, to be the number of days per year having a multispectral indication of snow on the ground (Notarnicola et al., 2013). However, in this context, we do not regard SCD as a predisposing factor for the formation of rock glaciers due to its implications for the thermal state of permafrost. Instead, we consider the temporal duration of snow cover in relation to the observed activity of rock glaciers, viewing SCD primarily as a factor influencing the modulation of activity states rather than as a prerequisite for their formation.
3.3 InSAR data
We utilized Copernicus Sentinel-1 C-band single-look complex (SLC) radar data acquired in the snow-free period between July and October spanning the years 2020–2022. The combination of Sentinel-1's extensive swath width and rapid revisit time renders it well suited for monitoring widespread landscape-scale deformations. The data were collected in interferometric wide (IW) swath mode with a swath width of 250 km, employing vertical co-polarization (VV) along both ascending orbit 117 (68 SAR images and 165 interferograms) and descending orbit 168 (57 SAR images and133 interferograms). The Sentinel-1 SLCs exhibit a spatial resolution of 22 m in the azimuth (along-track direction) and 2.7–3.5 m in the range (across-track direction).
We set a revisit time range of 6, 12, 24, and 30 d and computed interferometric pairs employing the Small Baseline Subset (SBAS) processing of Sentinel-1 data through the Alaska Satellite Facility's Hybrid Pluggable Processing Pipeline (ASF HyP3; Fig. 3), a web-based SAR data processing platform that primarily utilizes Amazon services. Multi-looking was performed, involving 10 looks in range and 2 looks in azimuth, resulting in interferograms with a pixel spacing of about 40 m. ASF HyP3 then utilized the 2021 release of the 30 m Copernicus “GLO-30” digital elevation model (DEM) product to eliminate the topographic component of the phase and geocode the interferograms. The Atmospheric Phase Screen (APS) contribution in interferograms was filtered through a convolutional neural network (CNN) approach (Brencher et al., 2023). This method was employed to eliminate both stratified and turbulent atmospheric noise.
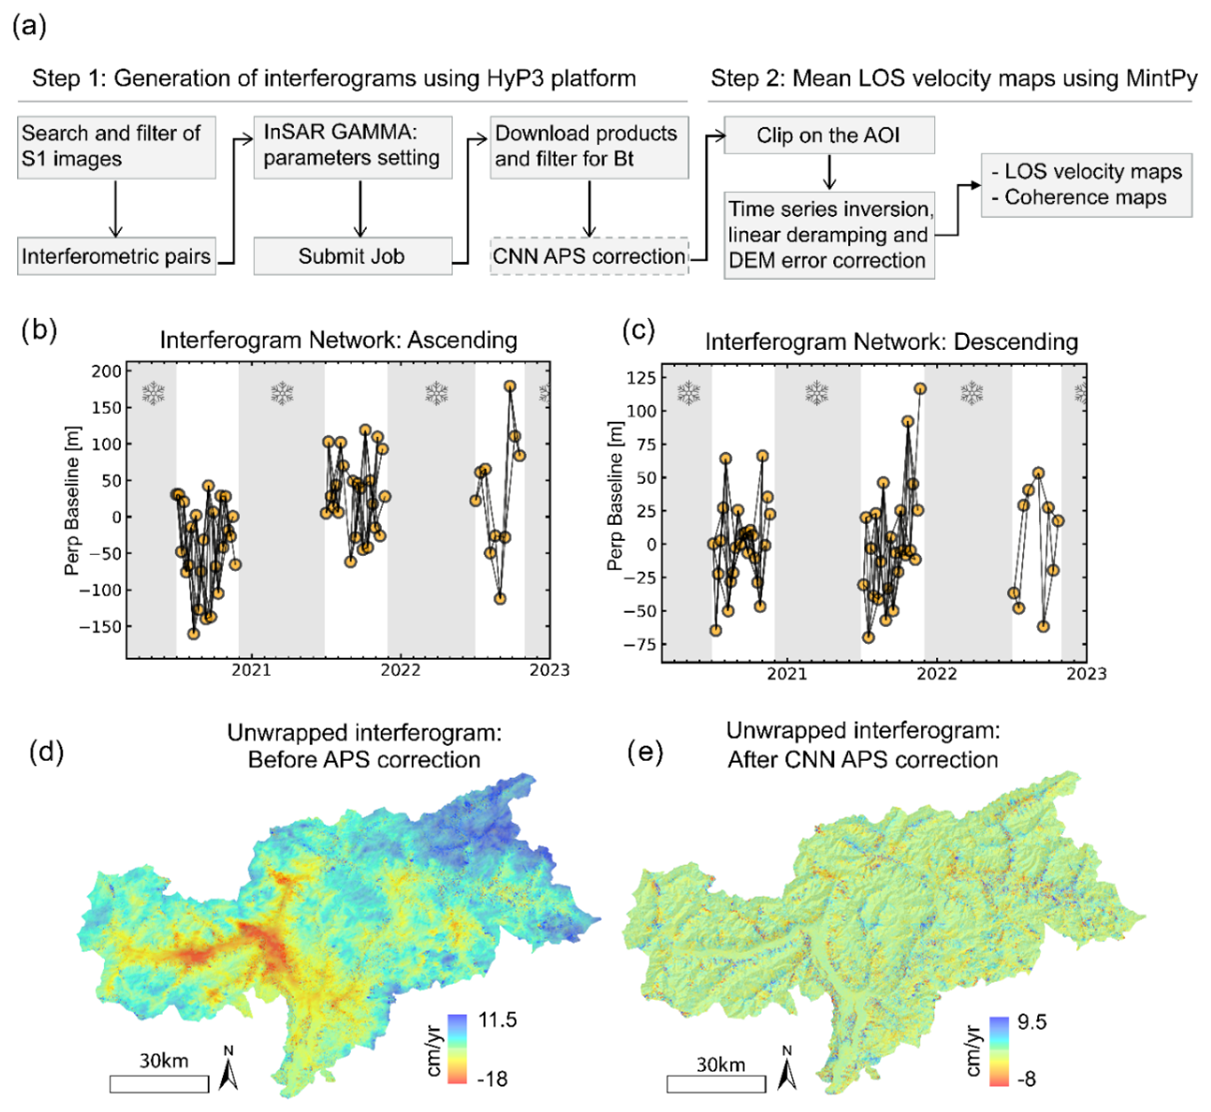
Figure 3First and second steps of the DInSAR processing chain: (a) workflow implemented in HyP3-MintPy and CNN correction, interferometric pairs elaborated for the ascending (b) and descending (c) geometry, example of an unwrapped interferogram (d) without CNN APS filtering and (e) with a CNN APS filter.
The key strengths of this approach stem from its independence of external atmospheric data or synthetic training data; instead, corrections are derived directly from the observed ones. After the atmospheric filtering, unwrapped interferograms were re-ingested in the Python-based Miami InSAR time-series software MintPy (Yunjun et al., 2019) to produce mean line-of-sight (LOS) displacement rate maps. MintPy works based on a weighted least-squares inversion formula (Yunjun et al., 2019). By default, and starting from the interferometric stack, it estimates the average velocity as the slope of the best-fitting line to the displacement time series corrected for the APS contribution. All deformations are referred to a single point within the analysis that is automatically selected among the pixels with high average spatial coherence (>0.85; Yunjun et al., 2019).
For each polygon, we selected the most suitable acquisition geometry, and we provided the corresponding C index (Notti et al., 2014) to indicate how well each landform is caught from the satellite according to the combination of slope, aspect, and satellite orbit parameters (LOS, orbital angle, and azimuth angle). In refining the velocity maps, we employed coherence, velocity, and topographic filters (Fig. 4) to remove pixels with high uncertainty due to geometric and displacement uncertainties. Areas affected by layover and shadowing were discarded from the displacement map, as were areas with coherence values under 0.25.
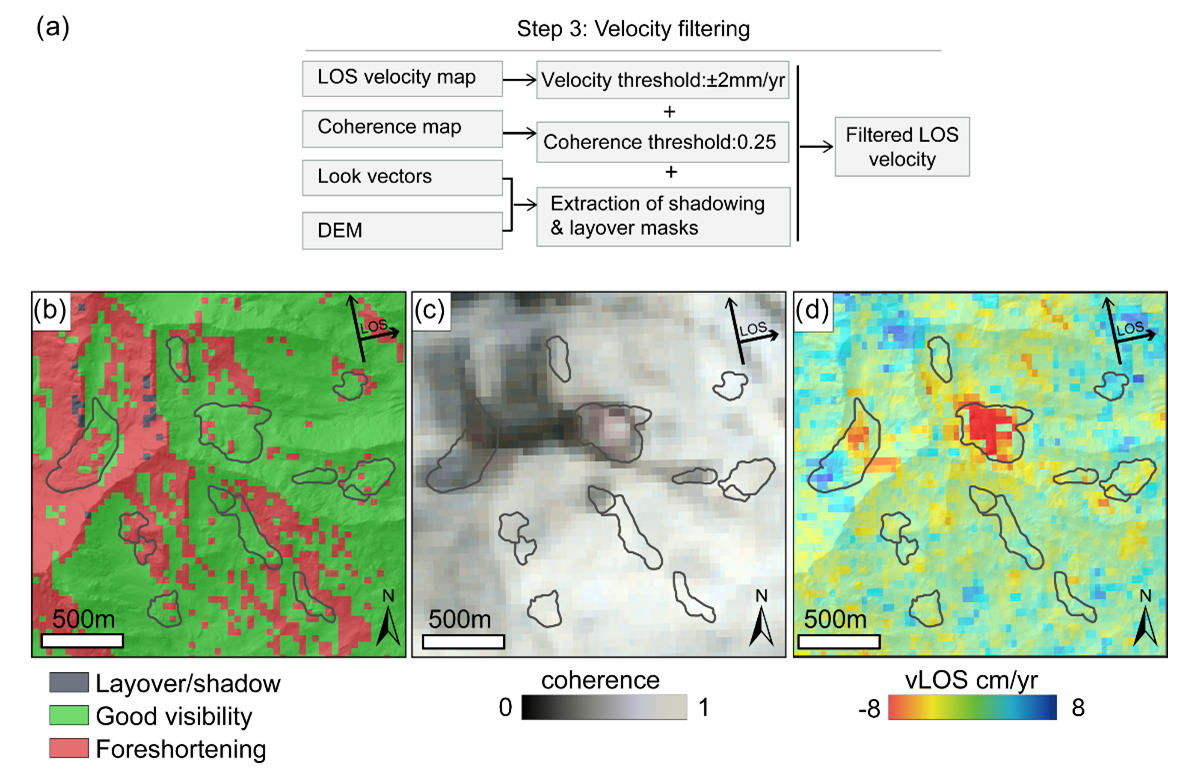
Figure 4Third step of the DInSAR processing chain: (a) workflow adopted to filter velocity product applying coherence, velocity, and topographic masks; (b) visibility map; (c) coherence map; (d) final filtered velocity map.
3.4 Data extraction and integration
3.4.1 Extraction of environmental and climatic statistics
For each rock glacier polygon, mean values for environmental and climatic variables were assigned based on the values within the polygon boundary. Furthermore, for differential interferometric synthetic aperture radar (DInSAR)-related variables (i.e. velocity and coherence), additional statistical descriptors were extracted, such as variance and 25th–75th and 90th percentiles. Finally, each rock glacier was given an estimation based on how much of its area is covered by the filtered SAR data (Fig. 4). This information can be considered a measure of uncertainty associated to the data based on the spatial coverage within each polygon.
Starting from the distribution map of the rock glaciers and considering their displacement range, we then made two distinctions: (i) movements strictly related to periglacial processes that are confined within mapped rock glacier boundaries and (ii) movements less influenced by permafrost creep and deformation mechanisms and lacking respective morphological evidence that are placed in the surrounding areas of polygon boundaries. To accomplish this diversification, around each mapped landform, at a distance of 100 m, a 100 m wide buffer (Fig. S5 in the Supplement) was generated to address areas with no visible displacement ascribable to periglacial deformations. The selection of a 100 m buffer was chosen, since it provides a balance that ensures meaningful data extraction for analysis while avoiding excessive noise from unrelated features. In the case of adjacent forms or multiple rock glaciers coalescing into one body, these rims were cut to avoid overlaps between different features.
The delineation of surrounding areas external to the rock glaciers serves a dual purpose: it facilitates the comparison step between parameters measured inside the periglacial landform and its immediate surroundings, and it permits the differentiation of contributions from permafrost movement and potential deformations (such as gravitational movements) which could affect the slope stability. Consequently, we also computed the delta of values between the interior and exterior of the rock glaciers. This calculation accentuates variations (e.g. velocity difference) that may be attributed to the presence and activity of permafrost or other sources of deformation.
3.4.2 Statistical modelling
To discern the key factors influencing the distinction between active, relict, and transitional rock glacier classes, we performed an initial exploratory data analysis. This exploration served to inform the selection of explanatory variables by assessing their potential impact on defining the activity class and examining their relationships with the response variables. Subsequently, a GAM was employed to investigate the associations between the chosen predictor variables derived from both environmental and DInSAR datasets and the response variables.
GAM provides a versatile framework for examining non-linear associations between the response variables (here, the three activity classes of rock glaciers: active, transitional, and relict) and continuous variables (e.g. morphometric and DInSAR indexes) by enabling the incorporation of both parametric and non-parametric covariates, facilitating the exploration of individual effects (Brenning and Azócar, 2010; Thiessen et al., 2024). GAMs are often used in environmental and geomorphological studies (Miska and Jan, 2005; Rudy et al., 2017) to investigate the non-linear interaction between variables but also to model the spatial distribution of rock glaciers in remote regions (as in Brenning et al., 2007).
The initial phase of the model construction involved the determination of smoothing parameters, which control the flexibility of the model, for continuous variables. This process utilized internal cross-validation, with a constraint of four effective degrees of freedom for spline parameterization. The significance of each term was assessed based on p values, with the null hypothesis (no effect of the term) being rejected at a threshold of 0.05. Consequently, only terms demonstrating a significant effect (p values <0.05) were incorporated into the final model (Wood, 2013). In the model setup, we examined not only the individual predictors influencing outcomes but also the interaction terms considered. Interactions can in fact reveal relationships that may not be apparent when considering single predictors. For example, understanding how morphometric characteristics and DInSAR indexes interact can help to uncover the mechanisms driving the activity classes of rock glaciers. Additionally, we utilize the accumulated local effects (ALE; Apley and Zhu, 2020) approach for GAM to interpret the influence of each predictor variable on the model, providing insights into their respective impacts on the response variable. The GAM was then fitted to the data, and its performance was evaluated using receiver operating curve (ROC) analysis for a multinomial response variable with three classes. Once its performance was verified, the model was finally applied for the classification of unknown features, and predictive performance estimates were computed through multiple independent test sets employing 2, 5, and 10 k-fold cross-validation selections. The calculation of predictive performance involved iteratively dividing the original dataset into training data (utilized for model fitting) and test data (employed for calculating the area under the receiver operating characteristic curve (AUROC) metric).
4.1 Exploratory data analysis
The exploratory data analysis allowed first insights into empirical associations between the rock glacier classes and potential predictor variables.
Considering the classification in Table 1, we analysed the distribution of morphometric and environmental variables among the active, transitional, and relict classes. In this step, boxplots and conditional density plots were used to highlight the distribution of continuous variables over the three classes, specifically focusing on parameters where the interquartile ranges display higher divergence among classes. The boxplots in Fig. 5 are constructed so that the lower edge corresponds to the 25th percentile (Q1), the middle line is the median (the 50th percentile), and the upper edge is the 75th percentile (Q3). The whiskers extend to the most extreme data points that are not considered outliers. This range is considered between 1.5⋅IQR from Q3 and 1.5⋅IQR from Q1. Beyond these limits, points are considered outliers.
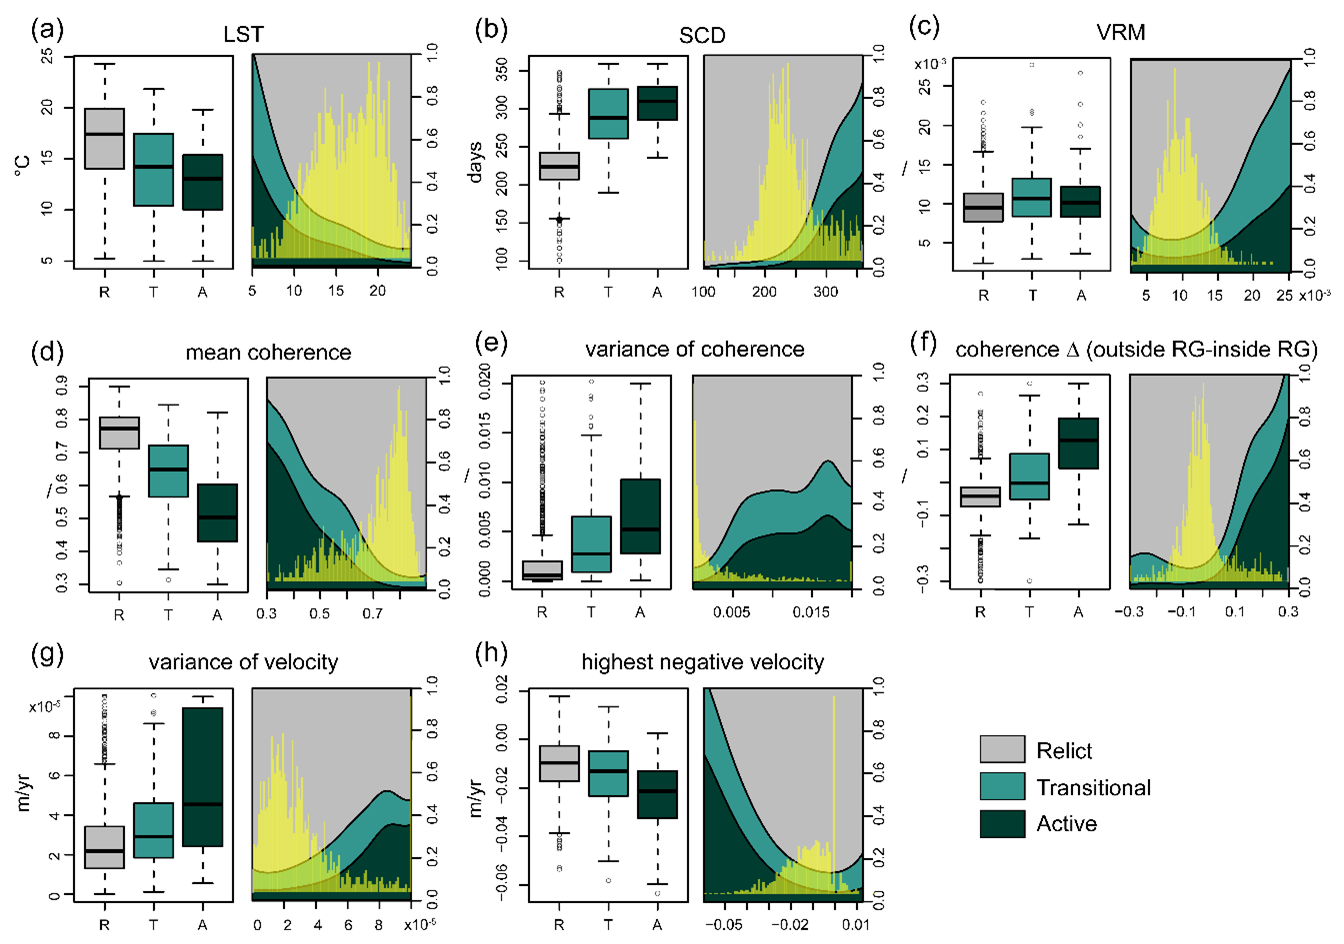
Figure 5Variables retained for the discrimination of the three activity classes of rock glaciers. Both boxplots and conditional density plots are reported for each variable. The boxplots show the distribution of values for each variable in each class, and the conditional density plots describe how the conditional distribution (0–1) of the categorical variables (active, transitional, and relict) and y changes over a numerical variable. Yellow bars show the distribution (density) of the variable: (a) LST; (b) SCD; (c) VRM; (d) mean coherence; (e) variance of coherence representing the variability of coherence values inside rock glacier polygons; (f) coherence Δ, computed as the difference between the mean values inside the 100 m rim of each rock glacier and the mean value inside the rock glacier; (g) variance of velocity; and (h) highest velocity values. Negative values are only considered to retain movements away from the satellite.
In this analysis, both rock-glacier-related values (computed inside the boundary of the landforms) and delta values (computed as the difference between the rock glacier and the corresponding outer area) were considered.
In particular, the variables that yielded the most significant results are LST, SCD, VRM, mean and variance values of coherence, coherence difference (from inside the rock glacier and the area outside), variance in velocity, and highest velocity (Fig. 5). Land surface temperature (Fig. 5a) serves as a discerning factor delineating among distinct categories of landforms: relict, transitional, and active rock glaciers. Relict landforms exhibit the highest temperature regime, characterized by a mean LST value of approximately 17 °C. Transitional landforms occupy an intermediary position, displaying a mean LST value of around 14 °C. Meanwhile, active rock glaciers share a similar mean LST value to transitional ones, albeit with lower maximum temperatures. This differential temperature range across the rock glacier classes underscores the utility of LST as a diagnostic parameter for delineating the thermal conditions favouring or limiting the activity of these landforms. Similarly, snow cover duration (SCD) exhibits notable discriminative characteristics among the various rock glacier classes. Relict rock glaciers demonstrate a mean SCD of 225 d, whereas transitional and active classes display longer durations, with respective values of 290 and 310 d of snow cover (Fig. 5b). Here, SCD solely reflects the presence of snow cover on the ground without providing details regarding snow depth or water content within the snowpack. Surface roughness (Fig. 5c), expressed by vector ruggedness measure (VRM), also provides an indication of the surface conditions controlled by permafrost deformation, with transitional and active classes holding a slightly higher VRM than relict ones. Therefore, recognizing its significance in representing potential surface variations, we retained this parameter and incorporated it into the subsequent analysis in conjunction with other parameters. Coherence-related metrics, such as mean coherence value (Fig. 5d), coherence variance within each polygon (Fig. 5e), and coherence delta between the rock glacier landform and the surrounding 100 m rim (Fig. 5f), emerge as highly discriminative indicators among the three activity classes, as evidenced by boxplots that exhibit minimal overlap. Generally, active rock glaciers have a low coherence value and a mean value around 0.5, while relict rock glaciers, which keep a higher surface stability, reach values of 0.8. Velocity values prove to be an effective classification tool, especially considering vLOS variance (Fig. 5g), related to internal surface variations of velocity, possibly between discrete sectors or lobes, and the highest velocity value recorded in each rock glacier (Fig. 5h).
We opted not to include mean velocity because it may not adequately represent displacement rates. Averaging positive and negative velocities could significantly underestimate the magnitude of movement for various features. Instead, we chose to focus on the highest negative velocity, as it provides a more accurate representation of displacement rates without averaging opposing values.
Less influence is exerted by other morphometric indexes (Fig. 6), such as aspect, slope, total insolation, curvature, and convergence, that did not lead to an evident distinction among the classes. In contrary, elevation shows a high capacity in separating the relict class from transitional and active classes. However, we did not consider this variable, since its contribution also affects the LST measure that has a strong elevation-related trend. Keeping the elevation parameter would have added redundancy in data.
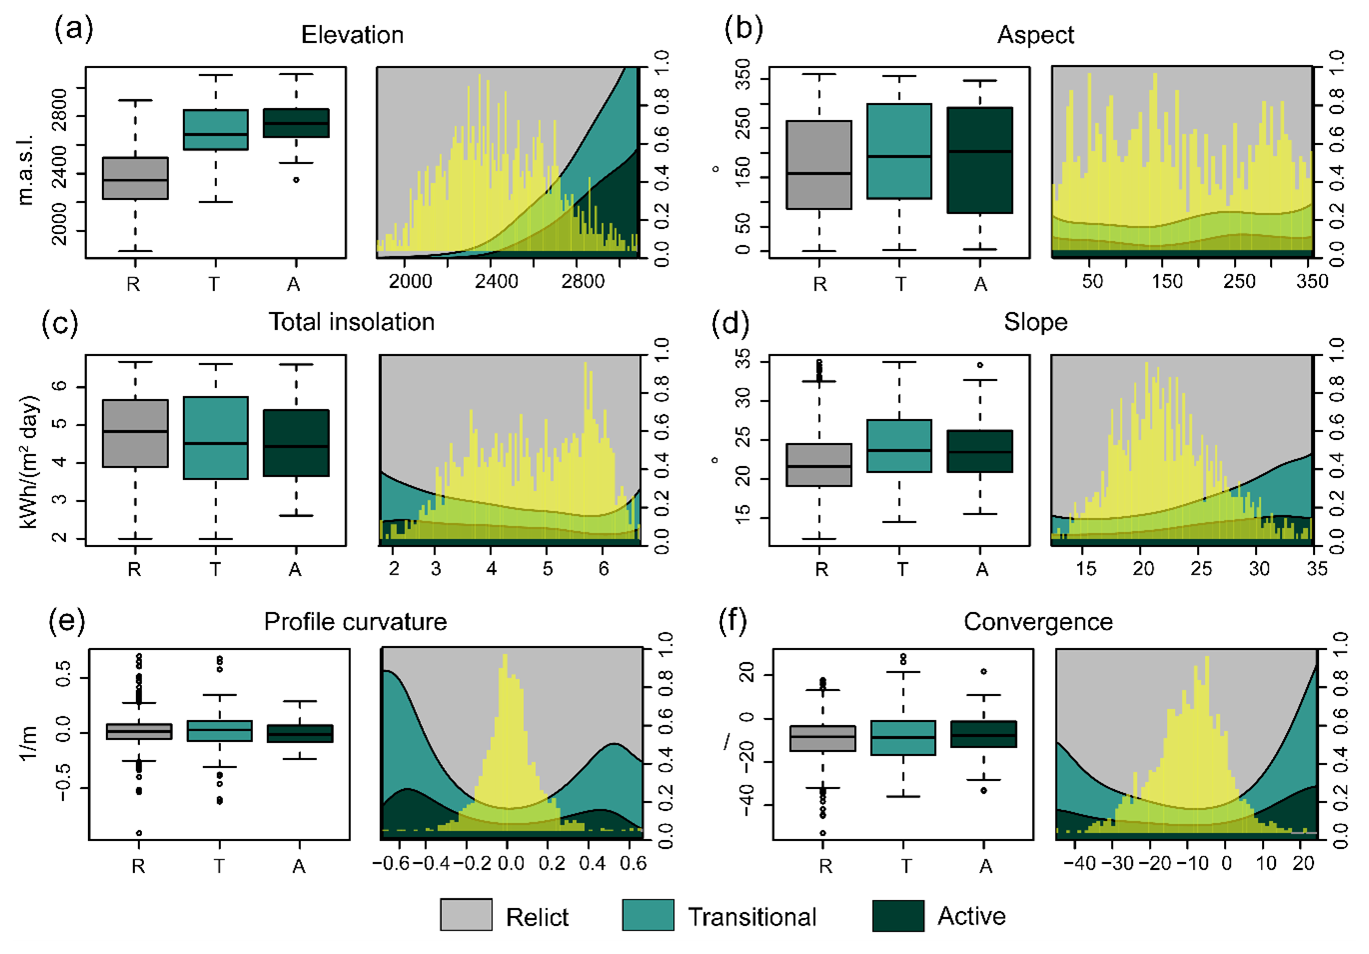
Figure 6Morphometric variables that were not retained in the analysis due to their smaller discriminant capacity between activity classes: (a) elevation; (b) aspect, computed as mean direction towards north; (c) total insolation coming from the combined contribution of direct and diffuse insolation; (d) slope angles; (e) profile curvature, where positive values indicate a concave structure of the landform and negative values indicate convex shapes; and (f) convergence, where positive values indicate divergent areas and negative values indicate convergent areas.
4.2 Multiclass GAM
After the above steps, we regarded the eight selected variables (Fig. 5) as predictor variables in a multinomial response variable GAM which included smooth terms for specific variables and tensor product smooth interactions between pairs of variables, all using thin-plate regression splines with a smoothness parameter of 4. The decision to incorporate tensor product interactions, specifically between variables such as mean coherence and coherence Δ, along with variance of coherence and variance of velocity, was driven by considering that diverse values of coherence might also be reflected in higher variations in coherence between the inside and outside of the landform. Similarly, variations in variance of coherence may be associated with variations in variance of vLOS as a consequence of increased surface deformations and terrain alterations. These interactions aim to capture the potential interplay and mutual influence between these variables, acknowledging that their joint effects on the response variable may not be adequately captured by single smooth terms.
In addition, considering the interaction between these terms also led to an improvement in model performance, as indicated by lower Akaike information criterion (AIC; Akaike, 1974) values (AIC=1264 considering tensor product interactions, AIC=1271 considering single smooth terms).
For the feature effect method, we adopted an accumulated local effect (ALE; Apley and Zhu, 2020) representation to inspect the effect of changes in the value of each predictor variable on the model's predictions.
The value of the ALE can be interpreted as the main effect of the feature at a certain value compared to the average prediction of the data. In Fig. 7, it is evident that the mean coherence and the SCD values (Fig. 7a and d, respectively) are the major control factors in distinguishing the transitional, active, and relict classes. For the active class, the ALE plot exhibited a descending trend as coherence increased. Notably, higher coherence values are associated with lower predicted responses, suggesting a negative impact or a diminishing effect on outcomes within the active class as coherence increased. On the contrary, relict and transitional classes initially displayed negative y values for low coherence, indicating that lower coherence is associated with lower predicted responses. However, as coherence increased, the effect transitioned to positive y values, resulting in an overall ascending trend. This observed pattern suggests that higher coherence values are associated with higher predicted responses for the transitional and relict classes. An opposite trend is found for SCD (Fig. 7d), which shows how, over a certain number of days, there is a positive effect of snow cover duration on active and transitional rock glaciers, while relict rock glaciers are influenced negatively. There are slight differences in the LST (Fig. 7f) and velocity, which can also be correlated to a different capability in predicting the activity classes. LST values around 5 °C are more representative of conditions proper of active and transitional rock glaciers. This is probably due to the presence of internal permafrost and the occupied topographic area (Fig. 6a). Higher temperatures, on the contrary, correspond to an increase in predictability of relict classes.
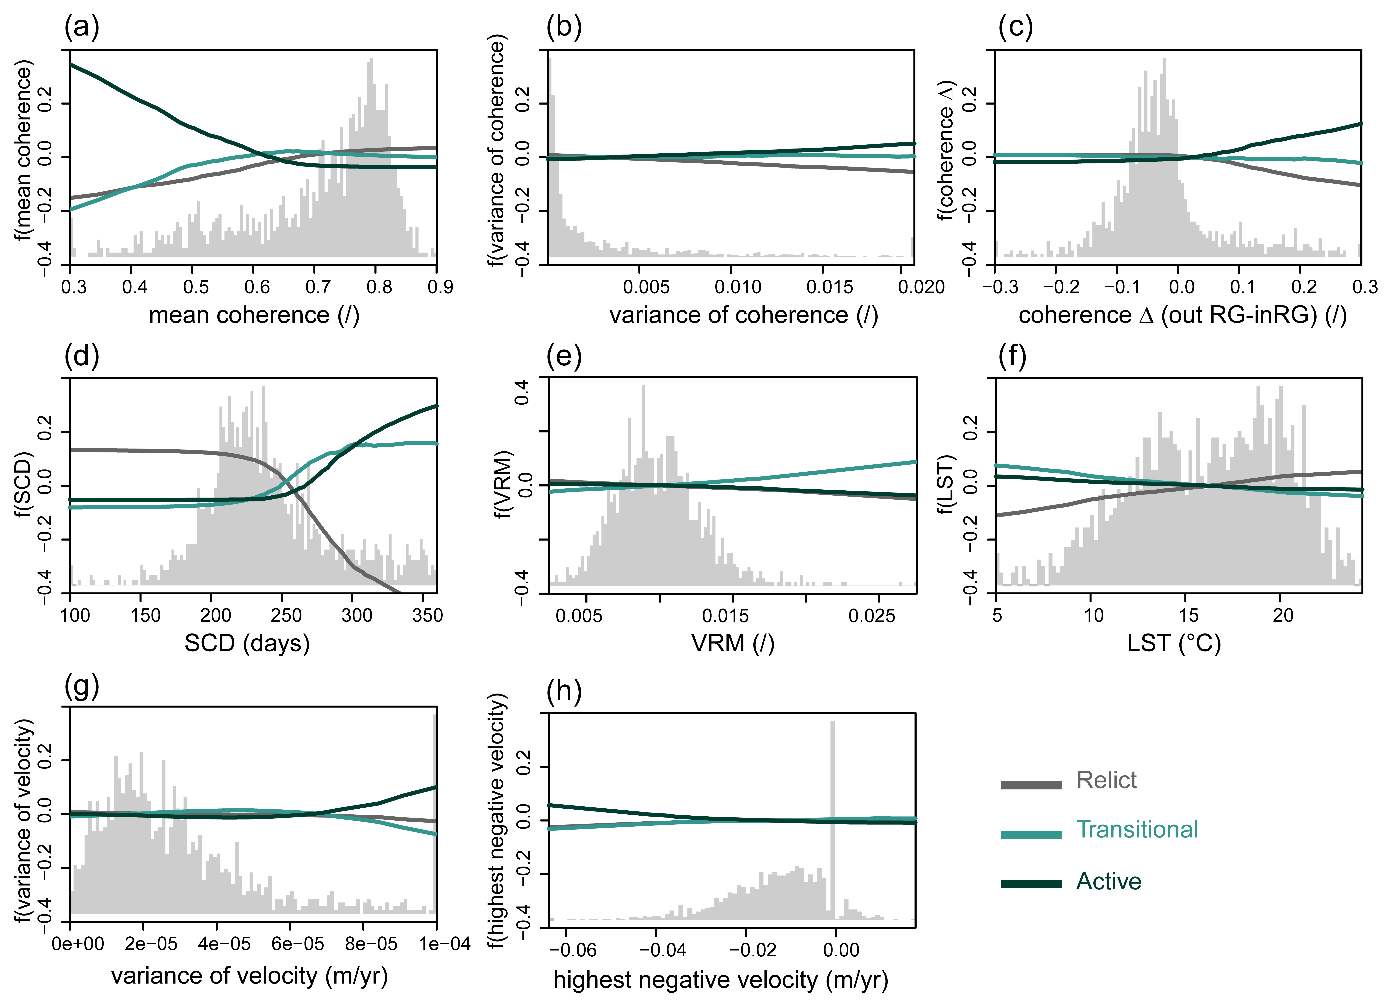
Figure 7ALE plot for predictor variables. Each plot shows how the predicted outcome varies with changes in individual predictor variables while holding other variables constant. Movement of the line indicates shifts in predicted probability for a class as the predictor variable changes: steeper slopes denote greater influence of the predictor variable on the predicted probability. The x axis represents the range of values of each variable, and the y axis refers to the main effect of the feature compared to the average prediction of the data.
4.3 Fitting performance evaluation and model extension
We used the receiver operating characteristic (ROC) and, in particular, the area under the curve (AUC) metric to evaluate the performance of our classification model across different thresholds. In the case of multiclass classification, a notion of true positive rate (TPR) and false positive rate (FPR) is obtained after binarizing the output. This can be done according two different schemes: (i) the one-vs.-rest (OVR) scheme, which compares each class against all the others (assumed as one), and (ii) the one-vs.-one (OVO) scheme, which compares every unique pairwise combination of classes.
The evaluation of our multiclass classification model yielded an AUC of 0.87 in the one-vs.-one (OVO) scenario and 0.95 in the one-vs.-rest (OVR) scenario (Fig. 8). These AUC values signify a strong overall performance in distinguishing between the three rock glacier classes, further supporting the effectiveness of the GAM in capturing the relationships within the data. The lower AUC value for transitional class vs. active class and transitional class vs. relict class might indicate that the model faces challenges in discriminating between these classes, possibly due to the disparity in class frequencies (higher number of relict forms vs. active and transitional ones) or a higher uncertainty associated with the identification of transitional landforms. These AUC values signify the model's consistent ability to distinguish between individual classes when compared to the rest and the effectiveness of discriminating one class against the collective set of other classes. The metrics, surpassing the 0.5 baseline, underscore the model's efficacy in capturing relationships within the dataset, suggesting its potential utility for accurate classification across diverse categories.
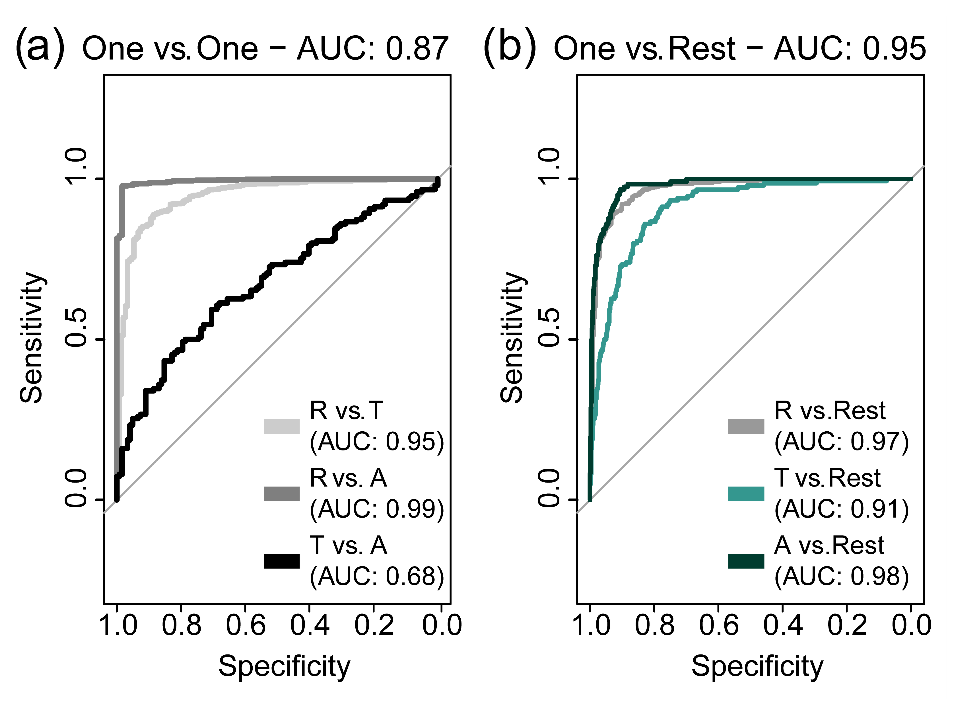
Figure 8Multiclass model performance evaluated for each class as (a) one vs. one and (b) one vs. rest.
Once the predictivity capability of the model was evaluated, we applied it to the entire regional dataset, also considering the n. d. landforms (Table 1) to predict the most probable class. The model's performance was evaluated by assessing the match between predicted and true classes and by measuring the proximity to the nearest class in terms of probability.
The robustness and discriminative performance of the classification model were assessed through repeated k-fold cross-validation (Fig. 9a). The cross-validation approach, employing 2-fold, 3-fold, 5-fold, and 10-fold splits, was implemented to systematically evaluate the model's generalization across various train-to-test ratios. The performance of the model was quantified using the AUROC. The resulting boxplot visually depicts the distribution of AUROCs across different cross-validation scenarios, offering insights into the model's stability and discriminative prowess.
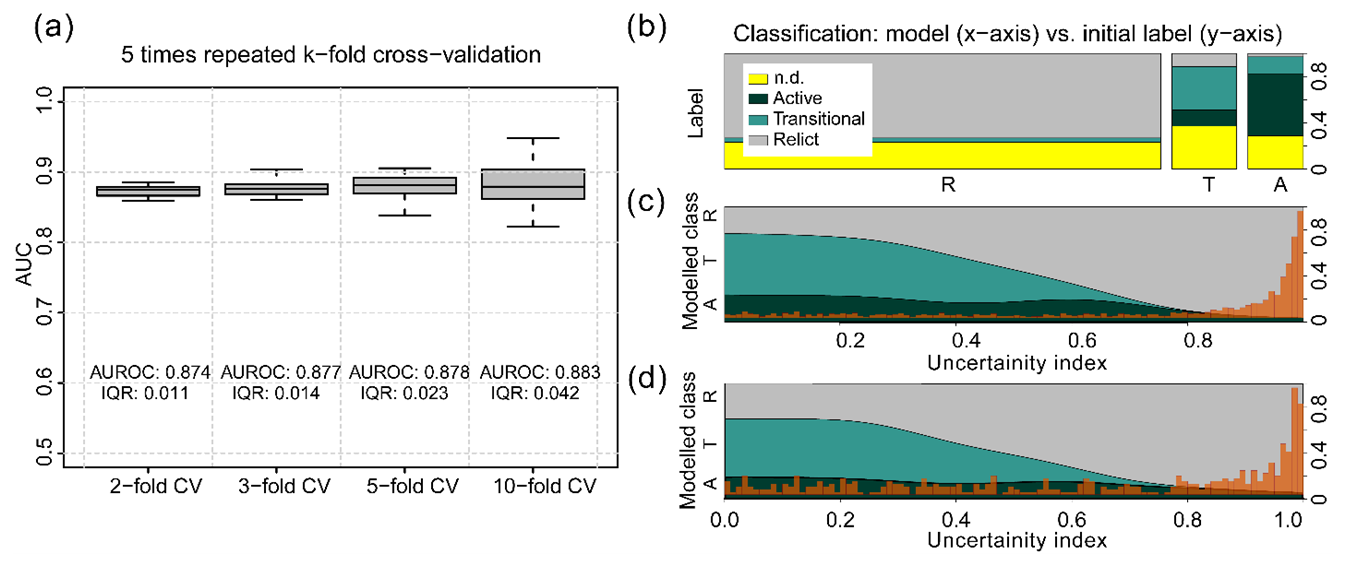
Figure 9Model performance and fractional breakdown of the obtained activity classes: (a) boxplot showcasing the AUC metric for each k-fold cross-validation, (b) spinogram illustrating the distribution of classified rock glaciers based on both our model and the initial classification (R=relict; T=transitional; A=active), (c) conditional density plot for uncertainty values over all the observations, (d) conditional density plot of uncertainty values only over not determined (n. d.) features. Red histograms indicate the distribution of uncertainty index values for the plotted observations (all the observations are in Fig. 8c; only the n. d. observations are in Fig. 8d).
A total of 1716 rock glaciers over 1779 were classified, and 63 could not be classified due to the lack of data, such as the invalid velocity pixels, which were excluded for coherence or topographic effects. The spine plot in Fig. 9b illustrates the correspondence between predicted and initial classes, with each spine representing a predicted class and the height of its segments indicating the proportion of observations assigned to each initial class within that prediction. The conditional density plot (Fig. 9c and d) further delves into model behaviour by showcasing the distribution of predicted classes across varying degrees of uncertainty, depicted along the x axis as the uncertainty index. Figure 9c depicts the distribution of uncertainty in the complete dataset, while Fig. 9d only represents the uncertainty distribution in the n. d. cases. Values close to 1 point out a higher confidence level, while lower values indicate a higher uncertainty in the classification. Being the most abundant ones, the relict features are characterized by a high confidence level, whereas this level decreases considerably for the transitional class, which shows the highest uncertainty in the prediction.
Upon reclassification, approximately 67 % of the initially proposed classifications remained unchanged; i.e. the rock glacier classification fitted the Bertone and PAB label, as reported in Table 1. Conversely, approximately 32 % of the landforms were reclassified into different categories. The spatial distribution of newly attributed activity classes and the agreement/non-agreement among the initial classification label is shown in Fig. 10a, whereas, in Fig. 10b, the regional distribution of the rock glaciers, adopting the new classification, is shown. With respect to other methods, our model additionally offers estimations of predicted probabilities for each class (Fig. 10c), with relict forms exhibiting the highest level of confidence (indicated with different border colour lines in the figure). With respect to the other two categories, this increased confidence of the relict (Fig. 10d) is partly attributed to the great diversity in the number of rock glaciers in each class. The relict class shows the highest level of confidence (>0.8), probably due to the greater abundance (1345) with respect to transitional and active. The active class (formed by 171 rock glaciers) shows an intermediate confidence interval in our dataset, whereas the transitional (formed by 200 features) exhibits the lowest confidence level (<0.4), primarily due to the inherent mismatch between their geomorphological parameters and coherence-based attributes, as evident in Table 1.
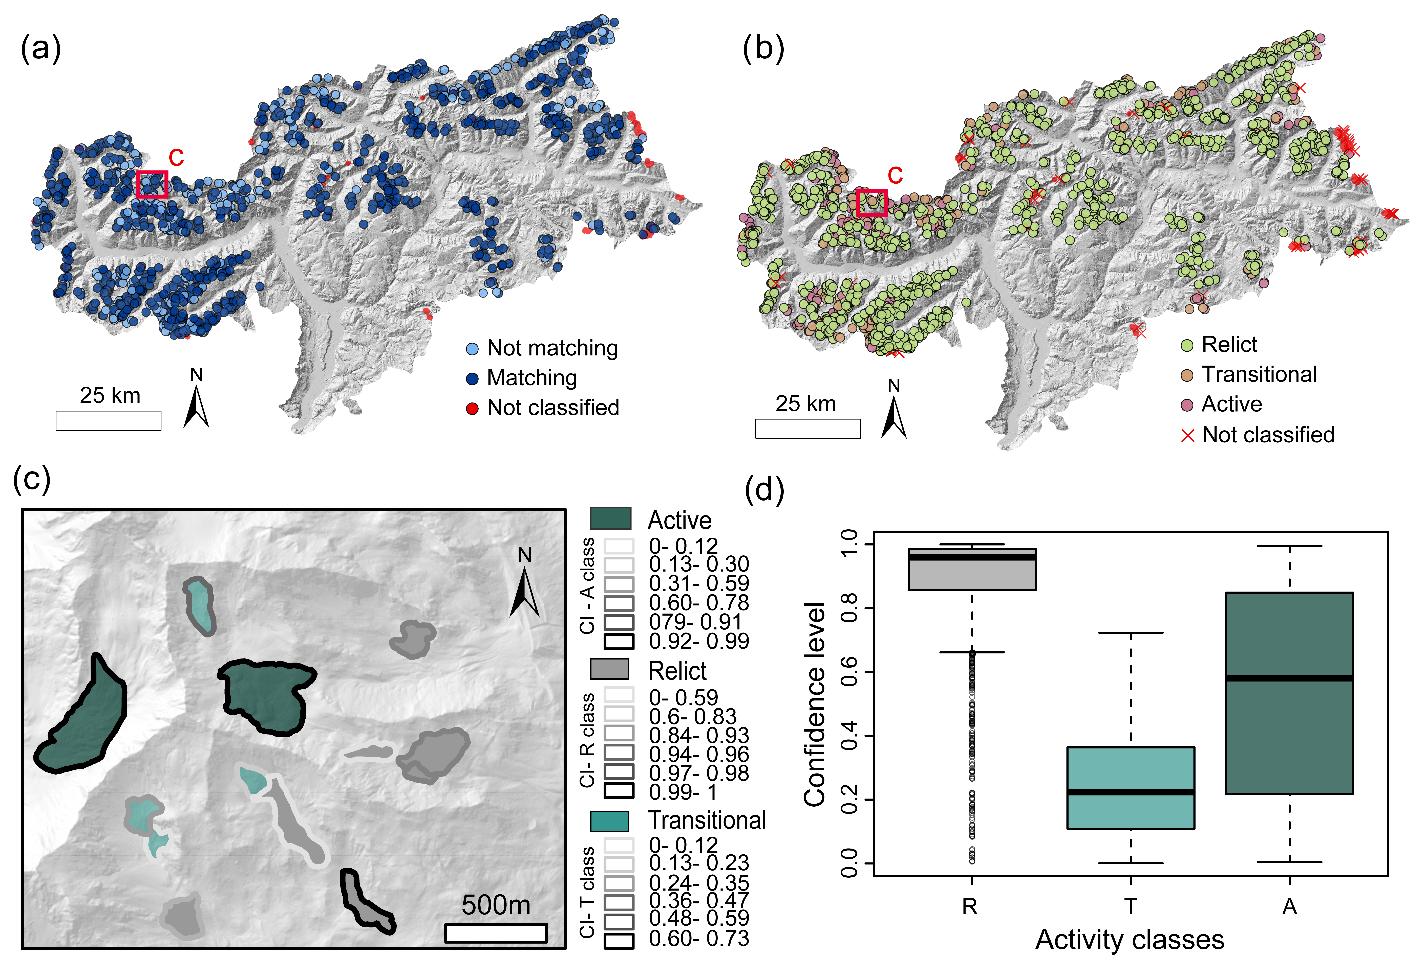
Figure 10Model classification outputs. (a) Distinction between the matching and non-matching activity classes between the initial label and the new one. (b) New rock glacier classes. (c) Example of the attributes associated to some rock glaciers in the area identified within the red square. The colours of the borders correspond to the confidence interval (CI) for each feature in the activity classes. Values close to 1 point out a higher confidence in the prediction, while lower values point out a higher uncertainty in the prediction. (d) Distribution of classification uncertainty in each class.
5.1 Classification approaches
The growing interest in periglacial landforms, particularly rock glaciers within alpine mountain systems, emphasizes the importance of understanding their dynamics in the context of climate change and its far-reaching implications. As climate change effects intensify, with temperature fluctuations and alterations in precipitation patterns, comprehensively quantification of the activity and deformation of these landforms becomes increasingly crucial, since it provides knowledge of ongoing changes in the high mountain cryosphere (Kääb et al., 2007).
Various approaches exist for assessing the activity of landforms at a broad scale. These include (i) a morphological method, which involves visually inspecting orthophotos, satellite images, or conducting field surveys to identify diagnostic features associated with permafrost deformation, such as furrows, ridges, steep fronts, and lateral margins (Scotti et al., 2013); (ii) an interferometric coherence method, as utilized by Bertone et al. (2019), which relies solely on kinematic analysis to differentiate between moving and non-moving landforms based on coherence values; and (iii) a velocity method, typically derived from DInSAR data, particularly for regional-scale investigations (Kääb et al., 2021; Strozzi et al., 2020; Zhang et al.,2021).
While each of these approaches has demonstrated effectiveness in defining the activity state of rock glaciers, they also possess significant limitations when considered alone. The accuracy of geomorphic-based classification is heavily dependent on image quality and operator expertise, leading to subjective mapping outcomes. Conversely, InSAR-based methods encounter intrinsic limitations inherent to the technique itself, particularly evident in complex environments such as the high alpine terrain (Liu et al., 2013), as further discussed in the subsection on DInSAR limitations.
Commonly, these techniques are integrated by validating findings from one method with evidence from another (Bertone et al., 2024), for instance, visually inspecting the presence of morphostructures and displacements related to features with DInSAR surface patterns (Agliardi et al., 2024).
In our study, we do not simply compare the results gathered from the interferometric approach and morphological and climatic ones, but we jointly exploit their descriptive potential to develop a comprehensive statistical model for categorizing mapped landforms into the three activity classes proposed by RGIK (2023): active, transitional, and relict.
We processed both geomorphological and climatic maps (Table 2), incorporating data from in situ measurements obtained from weather stations and from remote sensing products such as MODIS and Landsat. Through exploratory data analysis, we then selected variables that proved to have a higher discriminatory power in classifying rock glaciers across the three activity classes.
In delineating the activity of rock glaciers, we found that three variables, namely snow cover duration (SCD), vector roughness measure (VRM), and land surface temperature (LST), hold greater significance, with higher quartile distinction between the boxplots of each activity class or with p values <0.1 as smooth terms in the GAM, compared to traditional topographic factors such as slope, aspect, and curvature.
SCD, for instance, plays a crucial role in regulating the energy balance of the land surface, thereby directly influencing melting and refreezing rates within rock glaciers and thus also controlling the displacement patterns. This result is also supported by previous studies which highlighted the relevance of the snow cover in determining permafrost occurrence at a local scale (Apaloo et al., 2012) and at the regional scale (Marcer et al., 2017), influencing rock glacier activity distribution by altering the ground thermal regime.
Similarly, the VRM, associated to velocity variations, offers valuable insights into surface roughness variations, which directly reflects the flow dynamics within rock glaciers. These two variations manifest as the formation of furrows and ridges, resulting from compressive and tensile stresses associated with different flow velocities and internal deformation interactions with the topography. Additionally, LST serves as a key indicator of heat exchange processes, offering valuable information on areas potentially hosting permafrost. Despite not being a direct measure of in situ land surface temperature, LST from Landsat proves to be reliable in studying the spatial variability in surface temperature in complex topography (Gök et al., 2024). Here, its application to the periglacial environment proved to be effective in discriminating areas with lower temperatures influenced by a combination of factors, namely altitude, exposition, and ground conditions, and, as a consequence, was potentially affected by permafrost conditions. Therefore, using LST as a descriptive variable is acceptable, even though it does not directly correspond to the temperature of the deeper ground surface.
Although not immediately evident, the relatively minor influence of the other morphometric indexes (i.e. slope, aspect, curvature) likely stems from their primary role as predisposing factors to the initiation of rock glaciers within the study area, rather than exerting significant control over their ongoing activity.
For instance, slope should play an important role in controlling surface velocities, which can be described through a creep law by the joint interaction of slope angle and rock glacier thickness (Cicoira et al., 2020; Kaab et al., 2023). However, our findings do not outline such a clear dependency between velocity and steepness, as also reported in Buchelt et al. (2023).
In addition, considering the aspect alone, we could not find a meaningful link with the activity rate. Bertone et al. (2024) obtained similar results over a sub-portion of our same area of study, thus confirming that using the aspect as a topographic proxy for inferring the permafrost content and the activity class may be problematic.
Therefore, to establish the true impact of changes in these variables on activity classes, local-scale detailed analyses should be conducted. It is crucial to explore their local influence in site-specific cases, as local conditions, such as lithology, permafrost distribution, and local changes in slope, can significantly influence the activity of rock glaciers. These aspects may modulate factors like ice content, ground temperature, and frictional behaviour, thereby shaping the dynamics of rock glacier movement and activity patterns (Wood et al., 2025).
Additional consideration should be given to the precipitation values, which did not display a clear correlation between mean summer and winter values and activity classes at the regional scale. Despite precipitation events being likely contributors to short-term and seasonal variations in the velocity of rock glaciers (Kenner and Magnusson, 2017; Kenner et al., 2020), when analysed at a broader regional scale, further investigation is required to catch the quantitative relationships between their class of activity and precipitation levels (Zhang et al., 2023). This is due to local factors that may exert a more significant influence on controlling rock glacier activity than broader precipitation patterns alone. Precipitation cannot be regarded as a singular influencing factor; rather, it strongly interacts with other local conditions (temperature, exposition, etc.) in regulating the activity and evolution of periglacial features.
To incorporate these variables into our analysis, alongside DInSAR-derived parameters, we utilized a multiclass GAM classifier. The model addressed gaps in the morphological and DInSAR-based techniques, enabling the classification of a greater number of landforms that were previously undefined in one or both inventories created by PAB and Bertone. Figure 11a visually depicts these changes, illustrating the number of features that changed classes (arrows) and those that remained within the same category (vertices). A ternary graph (Fig. 11b) represents the associated probability of the rock glaciers to fall in each class. As evident from the graph, the direct class shift from active to relict (and vice versa) is a rarely frequent process (only seven cases), and an intermediate transition passage into transitional class is more frequent and evident, as highlighted by the curve trend. The observed reclassification shows that there is a common trend that transforms active into relict, shifting previously through a transitional phase, highlighting the dynamic response of rock glaciers to environmental (fluctuations in air temperature and changes in precipitation) and geomorphological (slope orientation, ice content, debris cover) factors as described in Barsch (1993). The transitional phase serves as a critical buffer, enabling gradual adjustments to these changing environmental drivers and facilitating smoother transitions to the relict state. This dynamic interplay is further highlighted by the complex interactions between ice presence, debris material (which plays a key role both as surface insulation in the active layer and in controlling deformation within the rock glacier body), permafrost content, and external factors such as temperature and precipitation. These interactions often lead not to linear responses, but rather to more gradual, transitional processes (Lilleøren and Etzelmüller, 2011). In our case, the transition of rock glaciers from active to relict classes is also supported by velocity changes, with a decreasing trend in detected velocities when processing from active to relict states (Fig. 11b).
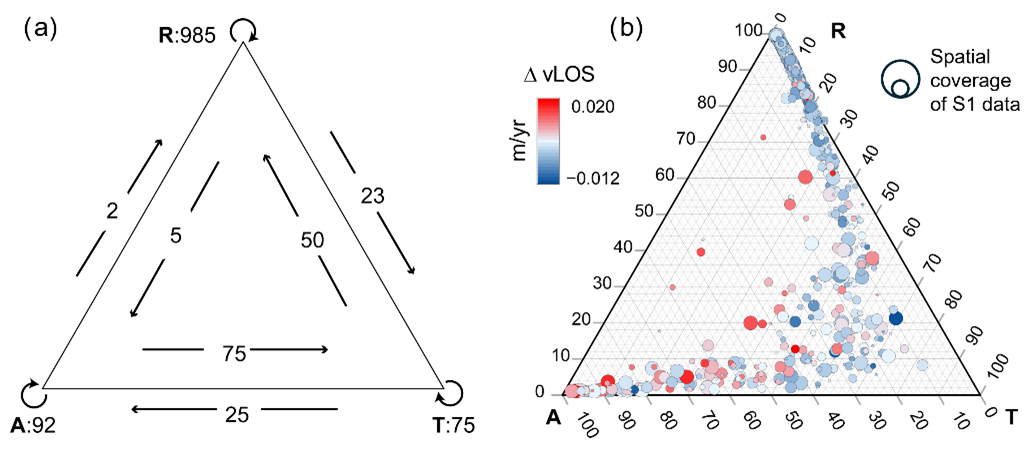
Figure 11Distribution of rock glaciers according to the activity class: (a) number of rock glaciers retaining their original class after reclassification (vertices of the triangle) and reclassified into different categories (arrows on the sides); (b) distribution of reclassified data based on their probability of belonging to each class. The size of each circle is related to the spatial cover of SAE data over each landform. Higher coverage reflects as larger circles and vice versa.
This phenomenon is particularly pronounced when considering the velocity delta between the rock glaciers and their surrounding areas not involved in the creeping process. As rock glaciers evolve towards an active state, the differential velocity between the rock glacier and its surroundings increases, indicating heightened activity and movement within the landform. This observation underscores the dynamic nature of rock glaciers and highlights the significance of velocity changes in tracking their evolution and behaviour over time.
Considering the integration of DInSAR and environmental features, a specific class may undergo reclassification when alternative or integrated approaches are utilized. This variability underscores the importance of considering multiple factors and methodologies in landform classification, especially in situations where input variables are incomplete or uncertain. Moreover, relying solely on a single classification approach may be misleading, as factors such as inaccurate morphological mapping or the inability to recognize subtle features can compromise the accuracy of the classification.
Figure 12 shows some examples regarding the different classification among the three approaches (Fig. 12j: PAB, Bertone, and our new approach). The rock glacier in Fig. 12a–c, even if it shows the presence of swollen furrows and lobes, was classified as relict by the PAB. In Bertone and in our classification, this rock glacier is identified as active because both the clear velocity InSAR signal and the presence of distinct morphological features indicate surface displacement. The opposite situation happens when considering rock glacier IV (Fig. 12d–f). This rock glacier is active for the PAB, while Bertone et al. (2019) classify it as F and we classify it as transitional. Even if this rock glacier has typical superficial structures dictated by downslope displacements, the results derived from the coherence approach (created by Bertone) and the velocity data (from our approach) indicate that these morphological features are presumably “palaeo” structures, i.e. nowadays stable and therefore evidence of a direction flow happened in the past. Relying exclusively on a single remote sensing approach that is based solely on coherence may prove inadequate for detecting the slow movements of rock glaciers. This is especially true when these movements do not cause noticeable changes in surface characteristics over the specified temporal baseline. Furthermore, movement may occur primarily due to vertical deformation caused by ice melting over gentle slopes, where shear movement does not occur. In such instances, the absence of discernible flow structures can offer valuable indications for accurately characterizing the activity state of the rock glacier (Fig. 12g–i, rock glacier VII). Other factors, such as thermal variations or vegetation cover, may also influence activity patterns, highlighting the need for a comprehensive and diverse approach to classification to ensure accurate representation of landscape dynamics.
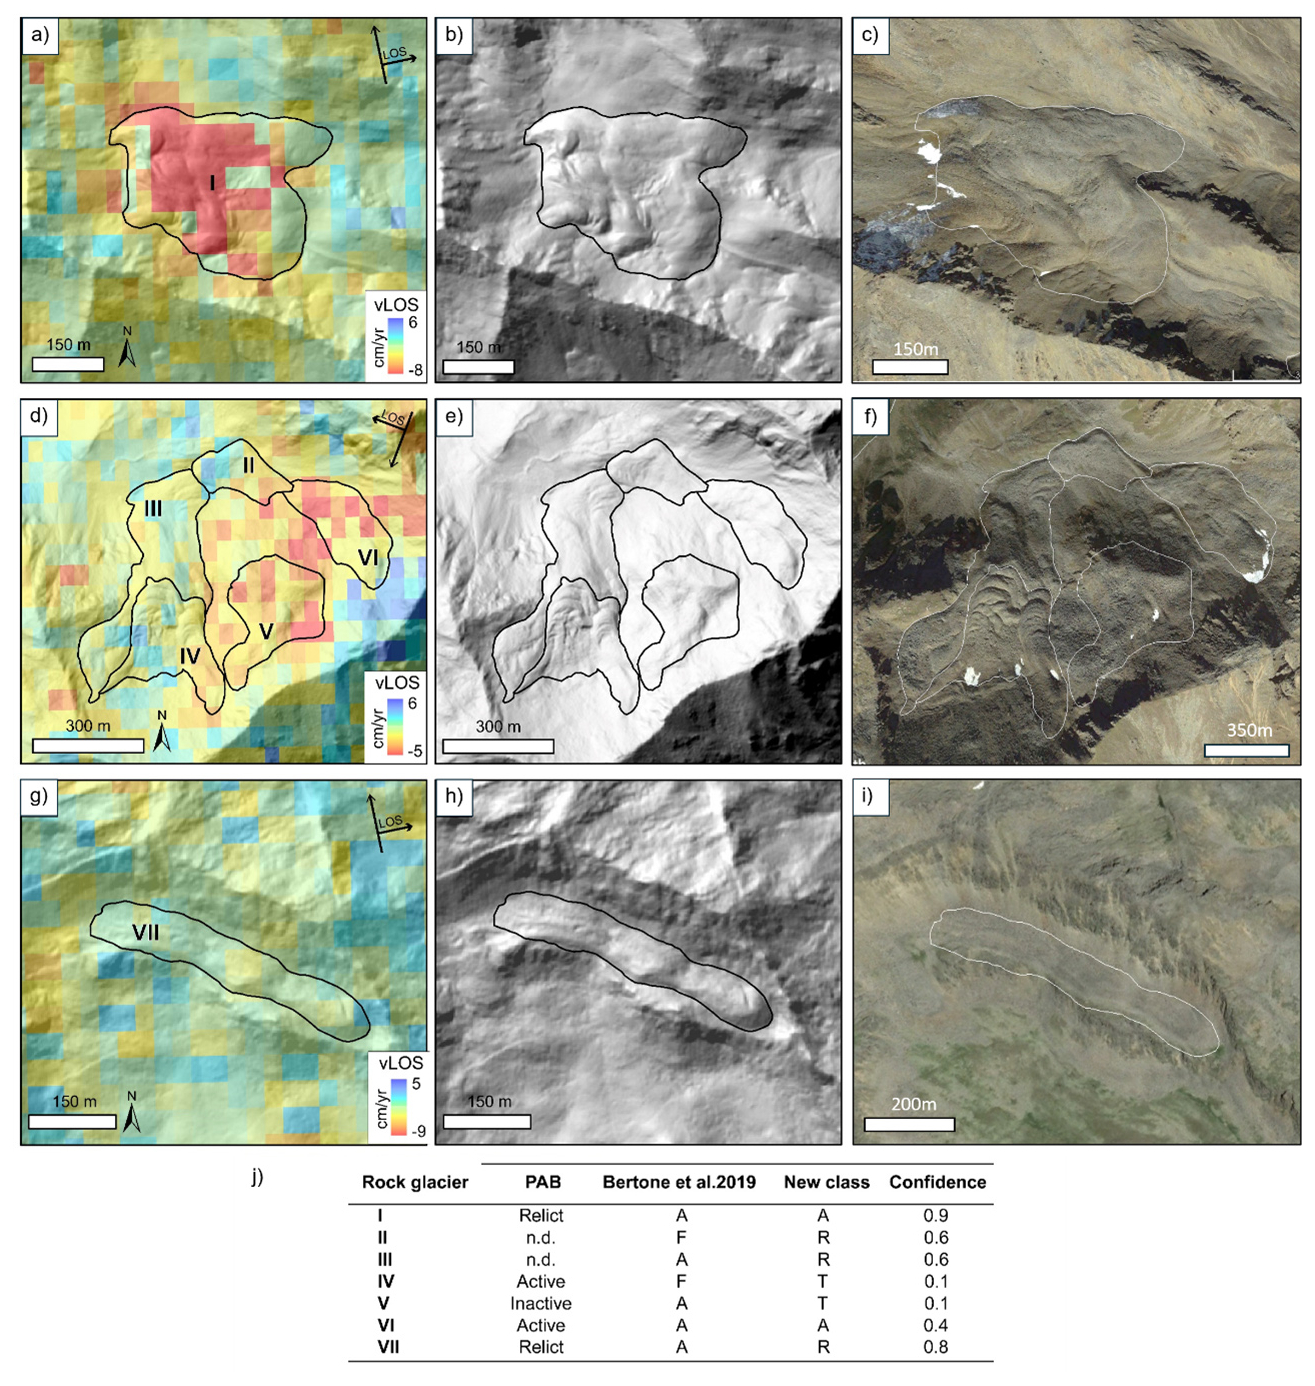
Figure 12Examples of rock glaciers with different activity labels. Panels (a), (d), and (g) report DInSAR velocity patterns over the selected features; panels (b), (e), and (h) show the surface morphology through hillshade maps; panels (c), (f), and (i) are images taken from Google Earth (© Google Earth 2025) showing the surface conditions of the selected landforms. (j) Summary table with the original activity label for each dataset, the new class, and the confidence level. A=active, R=relict, T=transitional.
5.2 DInSAR limitations
Our results suggest that DInSAR proxies, especially the coherence statistics (Figs. 5 and 7), as also demonstrated by Bertone et al. (2019), effectively discriminate the active class from the relict and inactive ones. Low coherence indicates a diminished similarity between SAR images within the interferometric pair, typically resulting from variations in surface scattering properties, wherein displacement emerges as a primary contributor. Conversely, high coherence values reflect stability in target properties, signifying minimal disturbances affecting the surface of the landform. This stability results in reduced deformation and displacement rates.
Velocity from DInSAR analysis still displays a discriminative effect, even if less sharp than coherence. This can be attributed to the steps of the processing and filtering techniques used at a regional level, which introduce more disturbances and might make the final velocity estimation less accurate compared to coherence. Following the specifics proposed by the IPA group (RGIK, 2023), the identification of moving areas is in fact based on the manual delineation and classification polygons, manually drawn around InSAR pattern, usually in wrapped interferograms for a better visualization of fringe pattern (Bertone et al., 2022; RGIK, 2023).
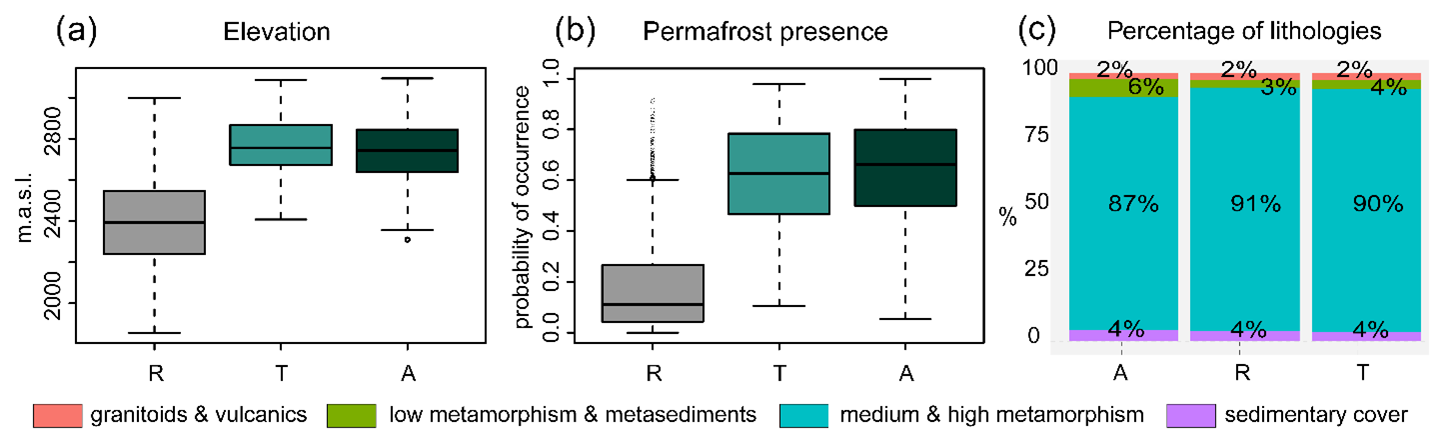
Figure 13Distribution of elevation (a), permafrost presence (b), and percentage of lithologies (c) in the three activity classes: A (active), T (transitional), and R (relict). The lithology names indicated at the bottom of the figure refer only to panel (c).
Given our objective to classify all mapped landforms without delving into the internal activity of individual lobes or sectors at this stage, we opted to treat entire rock glacier polygons as moving areas and subsequently analyse their internal velocity patterns. To speed up these analyses and facilitate application at the regional scale, we employed interferometric synthetic aperture radar analysis utilizing Sentinel-1 data over the entire AOI. The analysis leveraged the GAMMA procedure implemented within the HyP3 plugin on OpenSARlab, a service developed by ASF in conjunction with the MintPy package (Yunjun et al., 2019). To enhance result reliability, we iteratively repeated the time series inversion on smaller subsets of the interferometric stack. This iterative approach facilitated the selection of reference points in closer proximity to the landforms within the AOI, ensuring thorough consideration of topographic and atmospheric conditions specific to the selected area. Despite the efficiency demonstrated by such a large-scale classification and velocity analysis approach, it is essential to acknowledge the inherent limitations associated with InSAR measurements. A significant source of uncertainty in extracting LOS velocities arises from the distance between the reference point used in the inversion and the actual landforms. Topographic variations inherently influence error propagation, especially impacting velocity measurements as the distance from the reference point increases, particularly in regions characterized by significant elevation relief. In addition, while the mean annual vLOS provides a valuable first-order approximation, we also have to be reminded that it does not fully capture the 3D movement across all areas of the landform, particularly in features where multiple lobes overlap and the direction of movement diverges from the satellite vLOS. Despite this limitation, we retain the mean annual vLOS as a reference measure within this study, recognizing its utility for large-scale classification and initial assessments of rock glacier kinematics. Previous studies (e.g. Brencher et al., 2021) have applied various methods, such as reprojecting LOS measurements along the maximum slope direction or integrating both ascending and descending geometries, to extract vertical and east–west movement components. However, in our approach, we chose to utilize the vLOS while taking into account the reliability index provided by the C factor (Notti et al., 2014) associated with each rock glacier. This decision was made to mitigate the introduction of additional biases and assumptions that may arise from geometrical reprojections, while always considering the C factor to obtain valuable insights into the satellite's favourable orientation relative to the landform.
Another potential factor that may adversely affect the measured vLOS displacement is attributable to the CNN-APS method (Brencher et al., 2023). Since CNN methods operate directly on the data, they have the capability to filter out real portions of displacement signals rather than simply blurring them, resulting in a reduction in the displacement associated with each feature. Consequently, while the considered vLOS provides descriptive information regarding the dynamics of each feature, this filtering effect may need to be considered when compared to the actual displacement rate.
Active phenomena in fact show displacement ranges in the order of cm yr−1, while knowledge of some case studies from previous works suggests higher displacement rates exceeding tens of cm yr−1. However, these are detailed studies at specific sites (Kofler et al., 2021; Bertone et al., 2023), where more refined DInSAR approaches, with higher resolution and control on the area investigated, have been applied to overcome the inevitable biases associated with a regional-scale problem.
Despite the general underestimation of the measured signal, related to intrinsic limitations of the SBAS approach (Pepin and Zebker, 2021) and post-processing steps, the distinction between active and relict features according to our model results is effective, as proved by the high AUC and its application to predicting activity class for undefined features providing good results (Fig. 8).
5.3 Geomorphological factors and related rock glacier spatial distribution
After the classification process was completed, a final evaluation of the classification plausibility was conducted, integrating elevation and permafrost indicators, which were initially excluded as predictor variables. This supplementary analysis confirms that the identified patterns align with established knowledge in periglacial environments. Active and transitional rock glaciers are typically situated at higher elevations (generally above 2600 m a.s.l.), while relict classes are more commonly found at lower elevations (between approximately 2200–2500 m a.s.l.), which are consistent with widespread observations in periglacial landscapes (Fig. 13a). Additionally, an assessment of permafrost occurrence probabilities (Fig. 13b) within the reclassified features unveiled a significant correspondence between higher probabilities and activity classes. In fact, the relict class is characterized by the lowest elevation and lower permafrost probability with respect to the transitional and active classes, with the highest elevation and more probability of preserve permafrost presence nowadays. This underscores the influential role of permafrost dynamics in shaping rock glacier activity patterns. Furthermore, the impact of lithology on controlling rock glaciers' activity is often minimal or negligible compared to the previous two factors (Fig. 13c). Studies have demonstrated that lithology alone does not exert significant control over rock glaciers' activity (Kääb et al., 2005).
Given that rock glaciers primarily consist of unconsolidated debris, their movement is predominantly driven by internal deformation processes rather than lithological properties (Haeberli et al., 2006). Additionally, the insulating effect of debris cover can mitigate thermal variations in the substrate, diminishing the influence of lithological disparities on permafrost conditions and rock glacier dynamics. Therefore, while lithology may play a minor role in modulating rock glacier activity in specific contexts, its impact is generally overshadowed by other factors, such as topography, climate, and permafrost distribution. Moreover, the need to aggregate lithologies into macro-classes for regional-scale studies limits the detailed examination of their effects on rock glacier activity, highlighting the challenge of incorporating fine-scale geological variability into broader analyses.
This study introduces an updated classification for the state of activity of the rock glaciers in South Tyrol (Italy). The main strength of our comprehensive approach lies in the use of replicable routines (i.e. HyP3-MintPy tools) and multivariate statistical methods. This workflow can be adjusted and modified (for example, by selecting known stable reference points if possible, considering different snow-free months, and adopting a different atmospheric correction) and successively applied to other areas, allowing one to partially fill the gaps of the traditional techniques, morphological and dynamic classifications. Through the integration of regional-scale spaceborne DInSAR processing with both geomorphological and climatic descriptors, we have unified the two primary classification methods of activity of periglacial features, gathering a higher-classification spatial coverage for the mapped rock glaciers and a more robust distinction between active, inactive, and transitional features. The integration of the kinematic information with environmental variables was accomplished through a multiclass GAM. This model effectively leveraged both linear and non-linear relationships between features, providing a statistical definition of the key variables influencing the activity classification of rock glaciers at the regional scale.
The achieved results underscore a predominance of relict features (1345 landforms mapped in total), in contrast to a significantly smaller number of active ones (only 171). Looking at the distribution of these three classes (active, transitional, and relict), it was found that a transition state from active to relict rock glaciers is not a direct process. Instead, an intermediate transition phase between active and relict landforms seems to represent a common feature. At a regional scale, this transition is likely controlled by local factors that not only influence the activity state and the evolution of rock glaciers but also affect the velocity phase of this transition process, allowing changes from one more active class to the relict one. These local settings, characterized by the dynamic and complex interplay of factors such as slope, lithology, and climate, shape the dynamics of rock glaciers, leading to varying rates of progression between different states of activity.
The code developed for this study is not publicly available; inquiries can be directed to the authors.
The datasets generated and analysed during the current study are not publicly available due to third-party restrictions and ongoing related analyses. However, the data can be made available from the corresponding authors upon reasonable request.
The supplement related to this article is available online at https://doi.org/10.5194/tc-19-3493-2025-supplement.
CC and StS designed the experiments and carried them out. CC and GC performed DInSAR processing, and SS built the GAM. FB and VM contributed in the collection of morphological datasets and analyses. CC prepared the article with contributions from all co-authors.
The contact author has declared that none of the authors has any competing interests.
Publisher's note: Copernicus Publications remains neutral with regard to jurisdictional claims made in the text, published maps, institutional affiliations, or any other geographical representation in this paper. While Copernicus Publications makes every effort to include appropriate place names, the final responsibility lies with the authors.
This study was funded by the European Union – NextGenerationEU, in the framework of the consortium iNEST – Interconnected Nord-Est Innovation Ecosystem (PNRR, Missione 4 Componente 2, Investimento 1.5 D.D. 1058 23/06/2022, ECS_00000043 – Spoke1, RT1, CUP I43C22000250006). The views and opinions expressed are solely those of the authors and do not necessarily reflect those of the European Union, nor can the European Union be held responsible for them.
This paper was edited by Tobias Bolch and reviewed by two anonymous referees.
Agliardi, F., Crippa, C., Codara, D., and Franzosi, F.: Rapid regional assessment of rock glacier activity based on DInSAR wrapped phase signal, EGUsphere [preprint], https://doi.org/10.5194/egusphere-2024-1589, 2024.
Akaike, H.: A new look at the statistical model identification, IEEE T. Automat. Contr., 19, 716–723, https://doi.org/10.1109/TAC.1974.1100705, 1974.
Apaloo, J., Brenning, A., and Bodin, X.: Interactions between seasonal snow cover, ground surface temperature and topography (Andes of Santiago, Chile, 33.5° S), Permafrost Periglac., 23, 277–291, https://doi.org/10.1002/ppp.1753, 2012.
Apley, D. W. and Zhu, J.: Visualizing the effects of predictor variables in black box supervised learning models, J. R. Stat. Soc. B, 82, 1059–1086, https://doi.org/10.1111/rssb.12377, 2020.
Arenson, L. U. and Jakob, M.: Permafrost-related geohazards and infrastructure construction in mountainous environments, Oxf. Res. Encycl. Nat. Hazard Sci., 30, https://doi.org/10.1093/acrefore/9780199389407.013.292, 2017.
Barsch, D.: Periglacial geomorphology in the 21st century., In Geomorphology: The Research Frontier and Beyond, Elsevier, 141-163, https://doi.org/10.1016/B978-0-444-89971-2.50011-0, 1993.
Bearzot, F., Colombo, N., Cremonese, E., Morra Di Cella, U., Drigo, E., Caschetto, M., Basiricò, S., Crosta, G. B., Frattini, P., Freppaz, M., Pogliotti, P., Salerno, F., Brunier, A., and Rossini, M.: Hydrological, thermal and chemical influence of an intact rock glacier discharge on mountain stream water, Sci. Total Environ., 876, 162777, https://doi.org/10.1016/j.scitotenv.2023.162777, 2023.
Bender, E., Lehning, M., and Fiddes, J.: Changes in climatology, snow cover, and ground temperatures at high alpine locations, Front. Earth Sci., 8, 100, https://doi.org/10.3389/feart.2020.00100, 2020.
Bertone, A., Zucca, F., Marin, C., Notarnicola, C., Cuozzo, G., Krainer, K., Mair, V., Riccardi, P., Callegari, M., and Seppi, R.: An unsupervised method to detect rock glacier activity by using Sentinel-1 SAR interferometric coherence: a regional-scale study in the Eastern European Alps, Remote Sens.-Basel, 11, 1711, https://doi.org/10.3390/rs11141711, 2019.
Bertone, A., Barboux, C., Bodin, X., Bolch, T., Brardinoni, F., Caduff, R., Christiansen, H. H., Darrow, M. M., Delaloye, R., Etzelmüller, B., Humlum, O., Lambiel, C., Lilleøren, K. S., Mair, V., Pellegrinon, G., Rouyet, L., Ruiz, L., and Strozzi, T.: Incorporating InSAR kinematics into rock glacier inventories: insights from 11 regions worldwide, The Cryosphere, 16, 2769–2792, https://doi.org/10.5194/tc-16-2769-2022, 2022.
Bertone, A., Seppi, R., Callegari, M., Cuozzo, G., Dematteis, N., Krainer, K., Marin, C., Notarnicola, C., and Zucca, F.: Unprecedented observation of hourly rock glacier velocity with ground-based SAR, Geophys. Res. Lett., 50, e2023GL102796, https://doi.org/10.1029/2023GL102796, 2023.
Bertone, A., Jones, N., Mair, V., Scotti, R., Strozzi, T., and Brardinoni, F.: A climate-driven, altitudinal transition in rock glacier dynamics detected through integration of geomorphological mapping and synthetic aperture radar interferometry (InSAR)-based kinematics, The Cryosphere, 18, 2335–2356, https://doi.org/10.5194/tc-18-2335-2024, 2024.
Bodin, X., Thibert, E., Fabre, D., Ribolini, A., Schoeneich, P., Francou, B., Reynaud, L., and Fort, M.: Two decades of responses (1986–2006) to climate by the Laurichard rock glacier, French Alps, Permafrost Periglac., 20, 331–344, https://doi.org/10.1002/ppp.665, 2009.
Boeckli, L., Brenning, A., Gruber, S., and Noetzli, J.: Permafrost distribution in the European Alps: calculation and evaluation of an index map and summary statistics, The Cryosphere, 6, 807–820, https://doi.org/10.5194/tc-6-807-2012, 2012.
Brencher, G., Handwerger, A. L., and Munroe, J. S.: InSAR-based characterization of rock glacier movement in the Uinta Mountains, Utah, USA, The Cryosphere, 15, 4823–4844, https://doi.org/10.5194/tc-15-4823-2021, 2021.
Brencher, G., Henderson, S., and Shean, D.: Removing Atmospheric Noise from InSAR Interferograms in Mountainous Regions with a Convolutional Neural Network, Authorea [preprint], https://doi.org/10.36227/techrxiv.22626748.v1, 2023.
Brenning, A. and Azócar, G. F.: Statistical analysis of topographic and climatic controls and multispectral signatures of rock glaciers in the dry Andes, Chile (27–33° S), Permafrost Periglac., 21(1), 54–66, https://doi.org/10.1002/ppp.670, 2010.
Brenning, A., Grasser, M., and Friend, D. A.: Statistical estimation and generalized additive modelling of rock glacier distribution in the San Juan Mountains, Colorado, United States, J. Geophys. Res.-Earth, Volume 112, Issue F2, https://doi.org/10.1029/2006JF000528, 2007.
Brighenti, S., Tolotti, M., Bruno, M. C., Engel, M., Wharton, G., Cerasino, L., Mair, V., and Bertoldi, W.: After the peak water: the increasing influence of rock glaciers on alpine river system, Hydrol. Process., 33, 2804–2823, https://doi.org/10.1002/hyp.13533, 2019.
Buchelt, S., Blöthe, J. H., Kuenzer, C., Schmitt, A., Ullmann, T., Philipp, M., and Kneisel, C.: Deciphering small-scale seasonal surface dynamics of rock glaciers in the Central European Alps using DInSAR time series, Remote Sens.-Basel, 15, 2982, https://doi.org/10.3390/rs15122982, 2023.
Carturan, L., De Blasi, F., Dinale, R., Dragà, G., Gabrielli, P., Mair, V., Seppi, R., Tonidandel, D., Zanoner, T., Zendrini, T. L., and Dalla Fontana, G.: Modern air, englacial and permafrost temperatures at high altitude on Mt Ortles (3905 m a.s.l.), in the eastern European Alps, Earth Syst. Sci. Data, 15, 4661–4688, https://doi.org/10.5194/essd-15-4661-2023, 2023.
Cicoira, A., Beutel, J., Faillettaz, J., Gärtner-Roer, I., and Vieli, A.: Resolving the influence of temperature forcing through heat conduction on rock glacier dynamics: a numerical modelling approach, The Cryosphere, 13, 927–942, https://doi.org/10.5194/tc-13-927-2019, 2019.
Cicoira, A., Marcer, M., Gärtner‐Roer, I., Bodin, X., Arenson, L. U., and Vieli, A.: A general theory of rock glacier creep based on in-situ and remote sensing observations, Permafrost Periglac, 32, 139–153, https://doi.org/10.1002/ppp.2090, 2020.
Crespi, A., Matiu, M., Bertoldi, G., Petitta, M., and Zebisch, M.: A high-resolution gridded dataset of daily temperature and precipitation records (1980–2018) for Trentino-South Tyrol (north-eastern Italian Alps), Earth Syst. Sci. Data, 13, 2801–2818, https://doi.org/10.5194/essd-13-2801-2021, 2021.
Ermida, S. L., Soares, P., Mantas, V., Göttsche, F. M., and Trigo, I. F.: Google earth engine open-source code for land surface temperature estimation from the Landsat series, Remote Sens.-Basel, 12, 1471, https://doi.org/10.3390/rs12091471, 2020.
Frauenfelder, R. and Kääb, A.: Towards a paleoclimatic model of rock-glacier formation in the Swiss Alps, Ann. Glaciol., 31, 281–286, https://doi.org/10.3189/172756400781820264, 2000.
Galve, J. M., Sánchez, J. M., García-Santos, V., González-Piqueras, J., Calera, A., and Villodre, J.: Assessment of land surface temperature estimates from Landsat 8-TIRS in a high-contrast semiarid agroecosystem. Algorithms intercomparison, Remote Sens.-Basel, 14, 1843, https://doi.org/10.3390/rs14081843, 2022.
Gök, D. T., Scherler, D., and Wulf, H.: Land surface temperature trends derived from Landsat imagery in the Swiss Alps, EGUsphere [preprint], https://doi.org/10.5194/egusphere-2024-1228, 2024.
Gruber, S. and Haeberli, W.: Permafrost in steep bedrock slopes and its temperature-related destabilization following climate change, J. Geophys. Res., 112, F02S18, https://doi.org/10.1029/2006JF000547, 2007.
Haeberli, W.: Modern research perspective relating to permafrost creep and rock glaciers: a discussion, Permafrost Periglac., 11, 290–293, https://doi.org/10.1002/1099-1530(200012)11:4<290::AID-PPP372>3.0.CO;2-0, 2000.
Haeberli, W., Hallet, B., Arenson, L., Elconin, R., Humlum, O., Kääb, A., Kaufmann, V., Ladanyi, B., Matsuoka, N., Springman, S., Vonder, and Mühll, D.: Permafrost creep and rock glacier dynamics, Permafrost Periglac., 17, 189–214, https://doi.org/10.1002/ppp.561, 2006.
Hao, L., Herrera-Avellanosa, D., Del Pero, C., and Troi, A.: Categorization of South Tyrolean built heritage with consideration of the impact of climate, Climate, 7, 139, https://doi.org/10.3390/cli7120139, 2019.
Hassan, J., Chen, X., Muhammad, S., and Bazai, N. A.: Rock glacier inventory, permafrost probability distribution modelling and associated hazards in the Hunza River Basin, Western Karakoram, Pakistan, Sci. Total Environ., 782, 146833, https://doi.org/10.1016/j.scitotenv.2021.146833, 2021.
Janke, J. R. and Bolch, T.: Rock Glaciers, in: Treatise on Geomorphology, 2nd edn., edited by: Shroder, J. F., Academic Press, Oxford, 75–118, https://doi.org/10.1016/B978-0-12-818234-5.00187-5, 2022.
Kääb, A., Frauenfelder, R., and Roer, I.: On the response of rockglacier creep to surface temperature increase, Global Planet. Change, 56, 172–187, https://doi.org/10.1016/j.gloplacha.2006.07.005, 2007.
Kääb, A., Strozzi, T., Bolch, T., Caduff, R., Trefall, H., Stoffel, M., and Kokarev, A.: Inventory and changes of rock glacier creep speeds in Ile Alatau and Kungöy Ala-Too, northern Tien Shan, since the 1950s, The Cryosphere, 15, 927–949, https://doi.org/10.5194/tc-15-927-2021, 2021.
Kääb, A., Kaufmann, V., Ladstädter, R., and Eiken, T.: Rock glacier dynamics: implications from high-resolution measurements of surface velocity fields, in: Permafrost. Proceedings of the 8th International Conference on Permafrost, edited by Phillips, M., Springman, S. M., and Arenson, L. U., 21–25 July 2003, Zurich, Switzerland, 501–506, ISBN 90-5809-582-7, 2003.
Kellerer-Pirklbauer, A., Bodin, X., Delaloye, R., Lambiel, C., Gärtner-Roer, I., Bonnefoy-Demongeot, M., Carturan, L., Damm, B., Eulenstein, J., Fischer, A., Hartl, L., Ikeda, A., Kaufmann, V., Krainer, K., Matsuoka, N., Di Morra Cella, U., Noetzli, J., Seppi, R., Scapozza, C., Schoeneich, P., Stocker-Waldhuber, M., Thibert, E., and Zumiani, M.: Acceleration and interannual variability of creep rates in mountain permafrost landforms (rock glacier velocities) in the European Alps in 1995–2022, Environ. Res. Lett., 19, 34022, https://doi.org/10.1088/1748-9326/ad25a4, 2024.
Kenner, R. and Magnusson, J.: Estimating the effect of different influencing factors on rock glacier development in two regions in the Swiss Alps, Permafrost Periglac., 28, 195–208, https://doi.org/10.1002/ppp.1910, 2017.
Kenner, R., Pruessner, L., Beutel, J., Limpach, P., and Phillips, M.: How rock glacier hydrology, deformation velocities and ground temperatures interact: Examples from the Swiss Alps. Permafrost and Periglacial Processes, 31, 3–14, https://doi.org/10.1002/ppp.2023, 2020.
Knight, J., Harrison, S., and Jones, D. B.: Rock glaciers and the geomorphological evolution of deglacierizing mountains, Geomorphology, 324, 14–24, https://doi.org/10.1016/j.geomorph.2018.09.020, 2019.
Kofler, C., Mair, V., Gruber, S., Todisco, M. C., Nettleton, I., Steger, S., Schneiderbauer, S., and Comiti, F.: When do rock glacier fronts fail? Insights from two case studies in South Tyrol (Italian Alps), Earth Surf. Proc. Land., 46, 1311–1327, https://doi.org/10.1002/esp.5099, 2021.
Krainer, K. and Mostler, W.: Reichenkar Rock Glacier: a glacier derived debris-ice system in the western Stubai Alps, Austria, Permafrost Periglac., 11, 267–275, https://doi.org/10.1002/1099-1530(200007/09)11:3<267::AID-PPP350>3.0.CO;2-E, 2000.
Liu, L., Millar, C. I., Westfall, R. D., and Zebker, H. A.: Surface motion of active rock glaciers in the Sierra Nevada, California, USA: inventory and a case study using InSAR, The Cryosphere, 7, 1109–1119, https://doi.org/10.5194/tc-7-1109-2013, 2013.
Lilleøren, K. S., and Etzelmüller, B.: A regional inventory of rock glaciers and ice‐cored moraines in Norway. Geografiska Annaler: Series A, Physical Geography, 93, 175–191, https://doi.org/10.1111/j.1468-0459.2011.00430.x, 2011.
Malakar, N. K., Hulley, G. C., Hook, S. J., Laraby, K., Cook, M., and Schott, J. R.: An operational land surface temperature product for Landsat thermal data: Methodology and validation, IEEE T. Geosci. Remote, 56, 5717–5735, https://doi.org/10.1109/TGRS.2018.2824828, 2018.
Marcer, M., Bodin, X., Brenning, A., Schoeneich, P., Charvet, R., and Gottardi, F.: Permafrost favourability index: spatial modelling in the French Alps using a rock glacier inventory, Front. Earth Sci., 5, 105, https://doi.org/10.3389/feart.2017.00105, 2017.
Marcer, M., Serrano, C., Brenning, A., Bodin, X., Goetz, J., and Schoeneich, P.: Evaluating the destabilization susceptibility of active rock glaciers in the French Alps, The Cryosphere, 13, 141–155, https://doi.org/10.5194/tc-13-141-2019, 2019.
Monnier, S., Camerlynck, C., Rejiba, F., Kinnard, C., and Galibert, P.-Y.: Evidencing a large body of ice in a rock glacier, Vanoise Massif, Northern French Alps, Geogr. Ann. A, 95, 109–123, https://doi.org/10.1111/geoa.12004, 2013.
Miska, L. and Jan, H.: Evaluation of current statistical approaches for predictive geomorphological mapping, Geomorphology, 67, 299–315, https://doi.org/10.1016/j.geomorph.2004.10.006, 2005.
Notarnicola, C.: Hotspots of snow cover changes in global mountain regions over 2000–2018. Remote Sens Environ, 243, 111781, https://doi.org/10.1016/j.rse.2020.111781, 2020.
Notarnicola, C., Duguay, M., Moelg, N., Schellenberger, T., Tetzlaff, A., Monsorno, R., Costa, A., Steurer, C., and Zebisch, M.: Snow cover maps from MODIS images at 250 m resolution, Part 1: Algorithm description, Remote Sens.-Basel, 5, 110–126, https://doi.org/10.3390/rs5010110, 2013.
Notti, D., Herrera, G., Bianchini, S., Meisina, C., García-Davalillo, J. C., and Zucca, F.: A methodology for improving landslide PSI data analysis, Int. J. Remote Sens., 35, 2186–2214, https://doi.org/10.1080/01431161.2014.889864, 2014.
Parastatidis, D., Mitraka, Z., Chrysoulakis, N., and Abrams, M.: Online global land surface temperature estimation from Landsat, Remote Sens.-Basel, 9, 1208, https://doi.org/10.3390/rs9121208, 2017.
Pepin, K. and Zebker, H.: Aliasing in InSAR and SBAS time series, in: 2021 IEEE International Geoscience and Remote Sensing Symposium IGARSS, Virtual Conference, 12–16 July 2021, 2663–2666, IEEE, https://doi.org/10.1109/IGARSS47720.2021.9555161, 2021.
Pruessner, L., Huss, M., and Farinotti, D.: Temperature evolution and runoff contribution of three rock glaciers in Switzerland under future climate forcing, Permafrost Periglac., 33, 193–335, https://doi.org/10.1002/ppp.2149, 2021.
RGIK: Guidelines for inventorying rock glaciers: baseline and practical concepts (version 1.0), IPA Action Group Rock glacier inventories and kinematics, 25 pp., https://doi.org/10.51363/unifr.srr.2023.002, 2023.
Rudy, A. C., Lamoureux, S. F., Treitz, P., Ewijk, K. V., Bonnaventure, P. P., and Budkewitsch, P.: Terrain controls and landscape-scale susceptibility modelling of active-layer detachments, Sabine Peninsula, Melville Island, Nunavut, Permafrost Periglac., 28, 79–91, https://doi.org/10.1002/ppp.1900, 2017.
Scotti, R., Brardinoni, F., Alberti, S., Frattini, P., and Crosta, G. B.: A regional inventory of rock glaciers and protalus ramparts in the central Italian Alps, Geomorphology, 186, 136–149, https://doi.org/10.1016/j.geomorph.2012.12.028, 2013.
Şerban, R., D., Bartkowiak, P., Castelli, M., and Bertoldi, G.: Ground surface temperature linked to remote sensing land surface temperature in mountain environments, EGU General Assembly 2023, Vienna, Austria, 24–28 April 2023, EGU23-5726, https://doi.org/10.5194/egusphere-egu23-5726, 2023.
Stingl V, Mair V. Einführung in die Geologie Südtirols:[aus Anlass des 32. Internationalen Geologischen Kongresses im Sommer 2004 in Florenz], Autonome Provinz Bozen-Südtirol, Amt f. Geologie u. Baustoffprüfung, 2005.
Strozzi, T., Caduff, R., Jones, N., Barboux, C., Delaloye, R., Bodin, X., Kääb, A., Mätzler, E., and Schrott, L.: Monitoring rock glacier kinematics with satellite synthetic aperture radar, Remote Sens.-Basel, 12, 559, https://doi.org/10.3390/rs12030559, 2020.
Sun, Z., Wan, H., Imbery, S., Lotz, T., and King, L.: Dynamics of land surface temperature in the Central Tien Shan Mountains, Mt. Res. Dev., 35, 328–337, https://doi.org/10.1659/MRD-JOURNAL-D-14-00001.1, 2015.
Thiessen, R., Bonnaventure, P. P., and Lapalme, C. M.: Rock glacier inventory and predictive modelling in the Mackenzie Mountains: predicting rock glacier likelihood with a generalized additive model, Arctic Science, 10, 653–672, https://doi.org/10.1139/as-2023-0065, 2024.
Wagner, T., Seelig, S., Krainer, K., and Winkler, W.: Storage-discharge characteristics of an active rock glacier catchment in the Innere Ölgrube, Austrian Alps, Hydrol. Process., 35, e14210, https://doi.org/10.1002/hyp.14210, 2021.
Whalley, W. B. and Palmer, C. F.: A glacial interpretation for the origin and formation of the Marinet Rock Glacier, Alpes Marittimes, France, Geogr. Ann. A, 80, 221–236, https://doi.org/10.1111/j.0435-3676.1998.00039.x, 1998.
Wood, E., Bolch, T., and Streeter, R.: Insights from feature tracking of optical satellite data for studying rock glacier kinematics in the Northern Tien Shan, Front. Earth Sci., 12, 1518390, https://doi.org/10.3389/feart.2024.1518390, 2025.
Wood, S. N.: On p-values for smooth components of an extended generalized additive model, Biometrika, 100, 221–228, https://doi.org/10.1093/biomet/ass048, 2013.
Yunjun, Z., Fattahi, H., and Amelung, F.: Small baseline InSAR time series analysis: Unwrapping error correction and noise reduction, Comput. Geosci., 133, 104331, https://doi.org/10.1016/j.cageo.2019.104331, 2019.
Zhang, X., Feng, M., Zhang, H., Wang, C., Tang, Y., Xu, J., Yan., D., and Wang, C.: Detecting rock glacier displacement in the central Himalayas using multi-temporal InSAR, Remote Sens.-Basel, 13, 4738, https://doi.org/10.3390/rs13234738, 2021.
Zhang, X., Feng, M., Xu, J., Yan, D., Wang, J., Zhou, X., Li, T., and Zhang, X.: Kinematic inventory of rock glaciers in the Nyainqêntanglha Range using the MT-InSAR method, Int. J. Digit. Earth, 16, 3923–3948, https://doi.org/10.1080/17538947.2023.2260778, 2023.