the Creative Commons Attribution 4.0 License.
the Creative Commons Attribution 4.0 License.
 | 04 Jan 2024
Impact of atmospheric rivers on Arctic sea ice variations
Linghan Li
Forest Cannon
Matthew R. Mazloff
Aneesh C. Subramanian
Anna M. Wilson
Fred Martin Ralph
Arctic sea ice has been declining rapidly in recent decades. We investigate how the poleward transport of moisture and heat from lower latitudes through atmospheric rivers (ARs) influences Arctic sea ice variations. We use hourly ERA5 (fifth-generation European Reanalysis) data for 1981–2020 at 0.25∘ × 0.25∘ resolution to examine the meteorological conditions and sea ice changes associated with ARs in the Arctic. In the years 2012 and 2020, which had an extremely low summer Arctic sea ice extent, we show that the individual AR events associated with large cyclones initiate a rapid sea ice decrease through turbulent heat fluxes and winds. We carry out further statistical analysis of the meteorological conditions and sea ice variations for 1981–2020 over the entire Arctic Ocean. We find that on weather timescales the atmospheric moisture content anticorrelates significantly with the sea ice concentration tendency almost everywhere in the Arctic Ocean, while the dynamic sea ice motion driven by northward winds further reduces the sea ice concentration.
- Article
(8113 KB) - Full-text XML
- BibTeX
- EndNote


Atmospheric rivers (ARs) are long, narrow and transient corridors of strong horizontal water vapor transport as defined in the Glossary of Meteorology (American Meteorological Society, 2017). ARs are an important form of extreme horizontal water vapor transport on weather and synoptic scales. ARs account for 90 % of the poleward water vapor transport at midlatitudes (Zhu and Newell, 1998). The poleward water vapor transport by ARs plays a critical role in the atmospheric moisture content and precipitation variations at high latitudes (e.g., Nash et al., 2018).
The Arctic has experienced rapid sea ice decrease especially in the summer in recent decades. This decrease has been quantified using satellite observations since 1979, with the record low summer sea ice minimum occurring in 2012 (Parkinson and Comiso, 2013). Rapid Arctic sea ice loss leads to global climate change and weather extremes, such as the increasing occurrence of ARs near the North American west coast (Ma et al., 2021). The imminence of the seasonally sea-ice-free Arctic Ocean in the coming few decades (Peng et al., 2020; Notz and SIMIP Community, 2020; Guarino et al., 2020) has important implications for marine ecosystems, shipping, resources and conservation.
Many processes and feedbacks contribute to the sea ice variations in the Arctic across different temporal and spatial scales. Previous studies show that poleward atmospheric energy transport is a key factor driving Arctic sea ice variations (e.g., Olonscheck et al., 2019; Hofsteenge et al., 2022). In particular, moisture transport into the Arctic influences the surface energy budget by strengthening downward longwave radiation and sensible heat flux, especially in winter (Doyle et al., 2011; Mortin et al., 2016; Woods and Caballero, 2016; Johansson et al., 2017; Woods et al., 2017; Hegyi et al., 2018; Olonscheck et al., 2019; Ali and Pithan, 2020; Wang et al., 2020; Fearon et al., 2020). Those studies are mostly on large spatial scales such as considering zonal mean moisture transport (e.g., Papritz et al., 2022; Hofsteenge et al., 2022) and total Arctic sea ice loss (e.g., Wernli and Papritz, 2018) and over long timescales such as interannual variability (e.g., Olonscheck et al., 2019) and trends (e.g., Woods and Caballero, 2016). ARs are one form of extreme moisture transport on weather and synoptic scales at low levels. However, the direct impact of ARs, through both thermodynamic and dynamic processes, on Arctic sea ice variations at high temporal and spatial resolutions still needs better understanding (Hegyi et al., 2018; Wang et al., 2020; Papritz et al., 2022).
ARs transport moisture and heat from lower latitudes into the Arctic with considerable potential to drive sea ice reduction (e.g., Baggett et al., 2016; Hegyi et al., 2018; Vázquez et al., 2018; Wang et al., 2020; Papritz et al., 2022). Though the upstream moisture source and transport pathways of ARs reaching the Arctic have been examined (Vázquez et al., 2019; Harrington et al., 2021; Papritz et al., 2022), the downstream interaction between ARs and sea ice requires further investigation. As low-level jets associated with ARs come in close contact with the sea ice surface near sea ice margins, they can have direct impacts on sea ice through intense surface energy, momentum and mass exchanges between the atmosphere and ice–ocean (Hegyi et al., 2018; Wang et al., 2020). Furthermore, the warm and moist air masses brought by ARs are forced upward by cold air to form precipitation and clouds, with the associated latent heat released into the upper air (e.g., Komatsu et al., 2018).
This study investigates the relative contribution of surface heat flux components and the relative importance of thermodynamic and dynamic processes in sea ice changes associated with Arctic ARs. One novel aspect of this study reveals the important roles of turbulent heat fluxes under ARs and the wind effect of the ARs on sea ice on weather timescales. Another novel aspect of this study is the method of extraction of high-frequency signals representing extreme weather events such as ARs, without the mean seasonal cycle or interannual variability and trends. Furthermore, we find that the covariation between ARs and sea ice holds for the whole Arctic Ocean through the entire seasonal cycle. This comprehensive analysis provides a better understanding of the physical processes governing the interactions between ARs and sea ice with implications for short-term sea ice prediction.
The goal of this study is to explore how ARs contribute to the Arctic sea ice variations. We examine sea ice changes in relation to AR forcing by thermodynamic surface heat fluxes and dynamic winds. Firstly, we show two case studies to examine physical processes through spatial pattern and time series analysis. Secondly, we carry out statistical analysis for 1981–2020 over the entire Arctic Ocean.
ERA5 (fifth-generation European Reanalysis) is the most recent atmospheric reanalysis from ECMWF, with data assimilation Integrated Forecast System (IFS) cycle Cy41r2 with 4D-Var (Hersbach et al., 2020). ERA5 uses boundary conditions of sea ice concentration and sea surface temperature based on satellite observations (HadISST.2 before 1979, OSI SAF (409a) for 1979–August 2007, OSI SAF operational from September 2007 onwards). ERA5 has high temporal (hourly) and spatial (∼ 31 km horizontally and 137 model levels vertically) resolutions, which makes it suitable for studying extreme weather events such as ARs. Its long and consistent records are also appropriate for studying climate change and variability.
Atmospheric ERA5 over Arctic sea ice has been evaluated with in situ observations (Graham et al., 2019; Batrak et al., 2019; Renfrew et al., 2020). ERA5 accurately represents integrated water vapor (IWV) and downward longwave radiation. The correlations between ERA5 and in situ observations are high for meteorological variables such as IWV, 2 m temperature, 10 m wind speed and sea level pressure (Graham et al., 2019). ERA5 noticeably improves the estimate of the Arctic energy budget in terms of closure (Mayer et al., 2019). However, ERA5 has a warm bias near the Arctic sea ice surface, which is large in winter and small in summer (Graham et al., 2019; Batrak et al., 2019).
We use hourly ERA5 data for 1981–2020 at 0.25∘ × 0.25∘ resolution in the Arctic. First of all, we study two AR events associated with cyclones during the summertime of 2012 and 2020, which are periods of record low Arctic sea ice extent. We examine spatial patterns and time series of meteorological conditions, surface energy budget and sea ice variations related to the AR events. Furthermore, for each grid box of the entire Arctic Ocean, we investigate the statistical relationship between anomalous meteorological conditions and sea ice variations on weather timescales from 1981–2020. We extract high-frequency variations from weather timescales and identify extreme moisture anomalies as approximate ARs, which are validated by Guan and Waliser's AR catalog version 3 using 6-hourly 0.625∘ × 0.5∘ Modern-Era Retrospective Analysis for Research and Applications, Version 2 (MERRA-2) reanalysis data from 1980–2020 (Guan and Waliser, 2019).
3.1 Two case studies in 2012 and 2020
Atmospheric rivers transport moisture and heat from lower latitudes into the Arctic at low levels on weather timescales. Those extreme episodic events of water vapor transport can have a large impact on Arctic sea ice variations, with important implications for short-term sea ice prediction. Here we show two examples of AR events, occurring in the summertime of 2012 and 2020 in the western Arctic Ocean, associated with rapid sea ice changes through turbulent heat fluxes, longwave radiation and winds. These case studies of AR events reveal important physical processes and give context to the statistical analysis shown later.
3.1.1 The atmospheric river event of August 2012
In September 2012 the Arctic sea ice extent reached the lowest level in the satellite record (Parkinson and Comiso, 2013). This was preceded by a severe Arctic cyclone from 5–12 August 2012, one with the lowest central pressure (966 hPa) in August since 1979 (Simmonds and Rudeva, 2012). On 5 August 2012, when the cyclone first reached the Arctic Ocean, an associated AR arrived in the western Arctic Ocean.
The sea ice concentration decreased substantially in the Chukchi Sea and the East Siberian Sea from 4–6 August 2012 (Fig. 1a). The AR entered the western Arctic from Siberia on 4 August 2012; reached its highest intensity on 5 August 2012, with integrated water vapor transport (IVT) values exceeding 250 kg m−1 s−1 (maximum in the core around 500 kg m−1 s−1); and was still present in the Arctic Ocean on 6 August 2012 (exceeding 250 kg m−1 s−1) (Fig. 1b). Concurrently, strong northeastward surface winds (inferred from sea level pressure from geostrophic balance) beneath the AR core pushed sea ice away from the sea ice edge toward the pole. This coincided with strong downward sensible and latent heat fluxes near the sea ice edge, which are driven by warm and moist air and high wind speed at low levels within the AR (Fig. 1c, d). The net longwave radiation (incoming longwave radiation minus outgoing longwave radiation) near the sea ice edge was also downward, but the magnitude is much weaker than turbulent heat fluxes (Fig. 1f). In contrast, net shortwave radiation (incoming shortwave radiation minus outgoing shortwave radiation) is reduced over sea ice (Fig. 1e). The radiation patterns, reduced net shortwave radiation and enhanced net longwave radiation, were consistent with the clouds and precipitation that formed when the AR arrived (not shown). This major event provides evidence that turbulent heat fluxes may be the dominant terms in the surface energy budget during an AR. This is in contrast to prior studies, which emphasize the dominance of downwelling longwave radiation related to water vapor and clouds (Doyle et al., 2011; Mortin et al., 2016; Woods and Caballero, 2016; Johansson et al., 2017; Woods et al., 2017; Hegyi et al., 2018; Wang et al., 2020). Some studies reveal an important role of surface sensible heat flux (e.g., Stern et al., 2020).
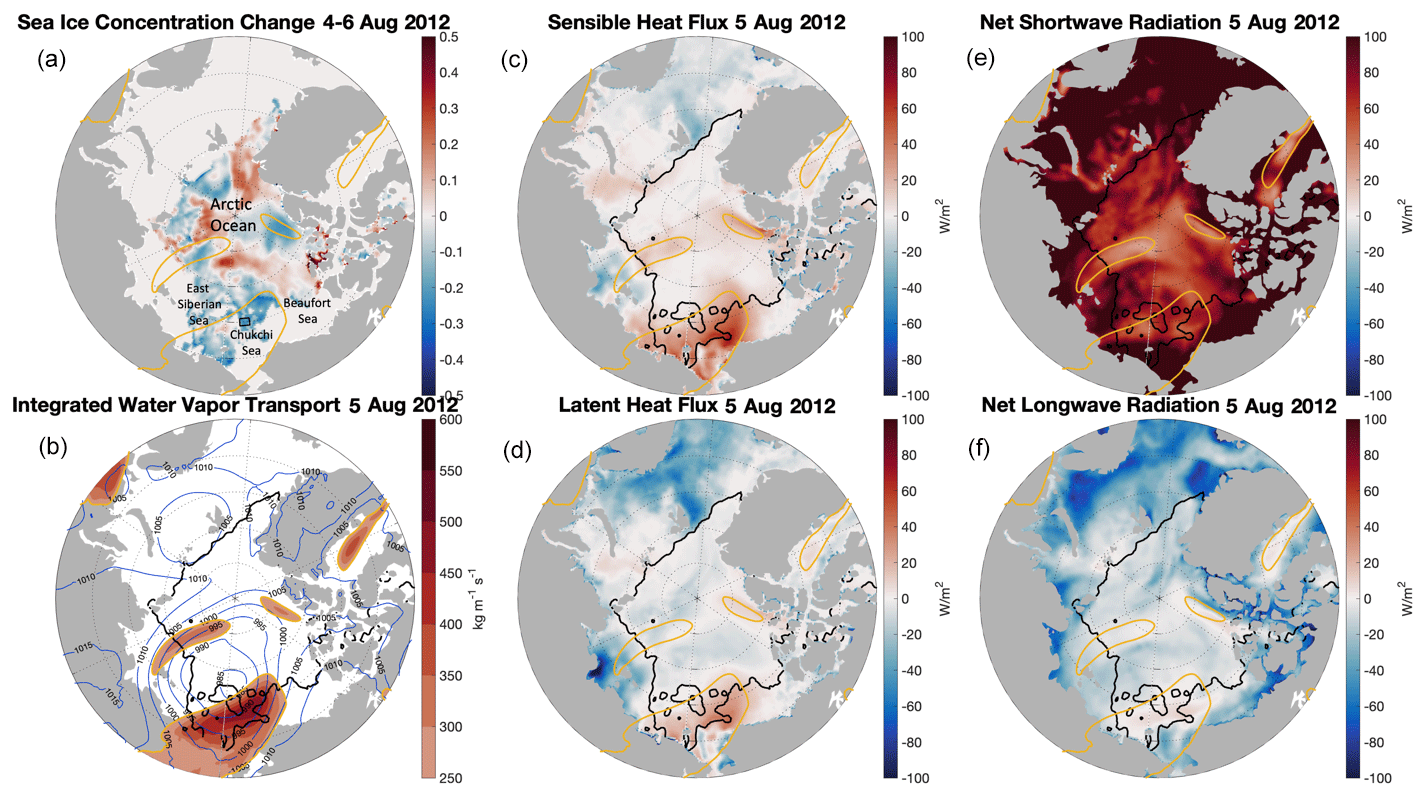
Figure 1(a) Sea ice concentration change from 4–6 August 2012 (sea ice concentration on 6 August 2012 minus sea ice concentration on 4 August 2012). Extent of atmospheric rivers (250 kg m−1 s−1 contour of integrated water vapor transport) on 5 August 2012 is represented as yellow lines (same as in b, c, d, e and f). The black box will be used in Fig. 3. (b) Magnitude of integrated water vapor transport on 5 August 2012. Sea ice edge (15 % contour of sea ice concentration) on 5 August 2012 is represented as black lines (same as in c, d, e and f). Sea level pressure on 5 August 2012 is represented as blue contours. (c) Sensible heat flux (positive downward) on 5 August 2012. (d) Latent heat flux (positive downward) on 5 August 2012. (e) Net shortwave radiation (positive downward) on 5 August 2012. (f) Net longwave radiation (positive downward) on 5 August 2012.
Figure 1 shows the original fields to demonstrate the magnitude of the event. However, the seasonal cycle can impact the interpretation of the event, as radiative and turbulent fluxes change their relative importance throughout the year. We therefore further investigate this event using anomalies (Fig. 2). An anomaly is defined as the difference between the original field and the daily 1981–2020 climatology for the case study here. Indeed, Fig. 2 removes the mean radiative component features and does not reveal the significantly large radiative anomalies collocated with anomalous IVT. As expected, shortwave radiation is reduced and longwave radiation is enhanced in regions of anomalous IVT, but the magnitudes are similar to anomalies found elsewhere in the region. The most significant anomalous flux component collocated with IVT is sensible heat flux. This positive flux anomaly is augmented by the additional anomalous heating from latent and longwave components. However, like shortwave anomalies, longwave anomalies associated with increased IVT are not as notable in the domain. In the Chukchi Sea substantial anomalies of the turbulent heat flux during the event collocated with IVT anomalies (Fig. 2), whereas significant radiative anomalies occurred throughout the domain – especially for the shortwave component.
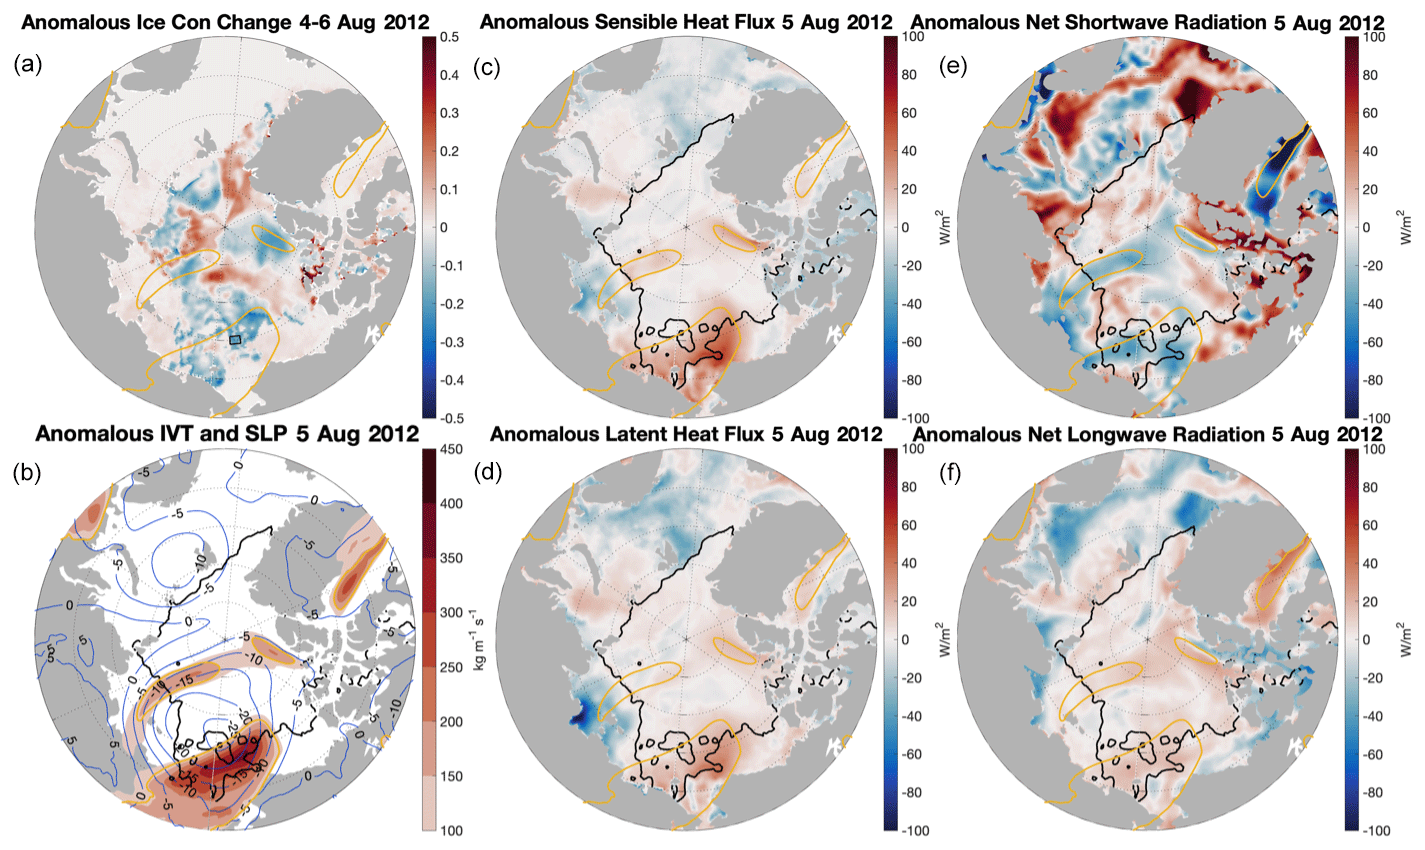
Figure 2Same as Fig. 1 but using anomalous fields (original fields minus climatologies) on 5 August (4–6 August for sea ice concentration change) from 1981–2020. Note that the sea ice edge in black lines and the extent of atmospheric rivers in yellow lines are based on the original fields. SLP: sea level pressure.
To study the total effect of the cyclone on sea ice, we examine time-integrated surface heat fluxes, time-integrated IVT and sea ice concentration changes through the life cycle of the cyclone (Appendix Fig. A1). During 5–12 August 2012, sea ice is substantially reduced over broad areas of the Chukchi Sea and the East Siberian Sea, corresponding with the strong time IVT there (maximum around 1.5 kg m−1 over 7 d). Strong sensible heating, weak latent heating, weak net longwave radiation cooling and weak net shortwave radiation heating are seen there. In the western Arctic Ocean, the cyclone extensively reduces sea ice over its life cycle, corresponding to the strong IVT, atmospheric warming (enhanced sensible and latent heat fluxes and longwave radiation) and sea ice advection driven by winds. Here we only consider the local atmospheric forcing of sea ice changes during the cyclone, though other processes such as ocean–ice heat flux are also important in sea ice melt during the cyclone (Zhang et al., 2013; Stern et al., 2020; Finocchio et al., 2020; Lukovich et al., 2021). Note that ARs initiate the cyclones and happen at the early stage of the life cycle of the cyclones, as shown in this case. While our study focuses on ARs and their effect on Arctic sea ice, the roles of cyclones and anticyclones in sea ice change are very complicated, and they vary between seasons and regions. For example, Wernli and Papritz (2018) show that enhanced sea ice melt during Arctic summer is related to polar anticyclones and extratropical cyclones; however, overall cyclones seem to have less effect on sea ice than long-wavelength atmospheric waves (Hofsteenge et al., 2022).
We examine hourly time series of surface heat fluxes and meteorological conditions and daily time series of sea ice concentration and sea surface temperature from 1–15 August 2012 for the area averaged over the black box (with an area of ∼ 100 000 km2) as Fig. 1a shows (Fig. 3). The location of the black box was chosen due to its proximity to the summer sea ice edge in the western Arctic Ocean. This study area was partially covered by sea ice before the arrival of the cyclone and became sea-ice-free after the cyclone. Sea ice concentration and sea surface temperature from ERA5 are based on daily satellite observations, while other variables from ERA5 are hourly in Fig. 3. The sea ice concentration drops abruptly when the AR arrives around 5 August 2012 (Fig. 3a). Correspondingly, large downward sensible and latent heat fluxes and moderate downward net longwave radiation into the ice and/or ocean occurred within 1 d, peaking at midnight with nearly zero net shortwave radiation on 5 August 2012 (Fig. 3b). The dominant latent and sensible heat fluxes were related to the high moisture and heat content associated with the AR, while high wind speed further enhanced turbulent heat fluxes. Over the black box, the 5 August 2012 AR event is categorized as an AR Cat 2 (Moderate) with a maximum IVT magnitude of 867 kg m−1 s−1 and a duration of 18 h (IVT > 250 kg m−1 s−1). The AR scale is defined in Ralph et al. (2019). We partition IVT further into moisture and wind components to separate it into the thermodynamic and dynamic components of AR. The specific humidity at 850 hPa peaks prominently on 5 August 2012 (Fig. 3c). The 850 hPa wind speed is the strongest at the same time as the largest specific humidity on 5 August and continues to be strong for the next 3 d (Fig. 3c). Wind direction is northward on 5 August 2012 and then turns eastward from 6–10 August 2012 (not shown). The near-surface conditions in humidity and wind are also examined and show similar results (not shown). In summary, simultaneous maxima in moisture and wind speed caused intense downward turbulent heat fluxes and subsequent rapid sea ice decrease as the AR arrived on 5 August 2012.
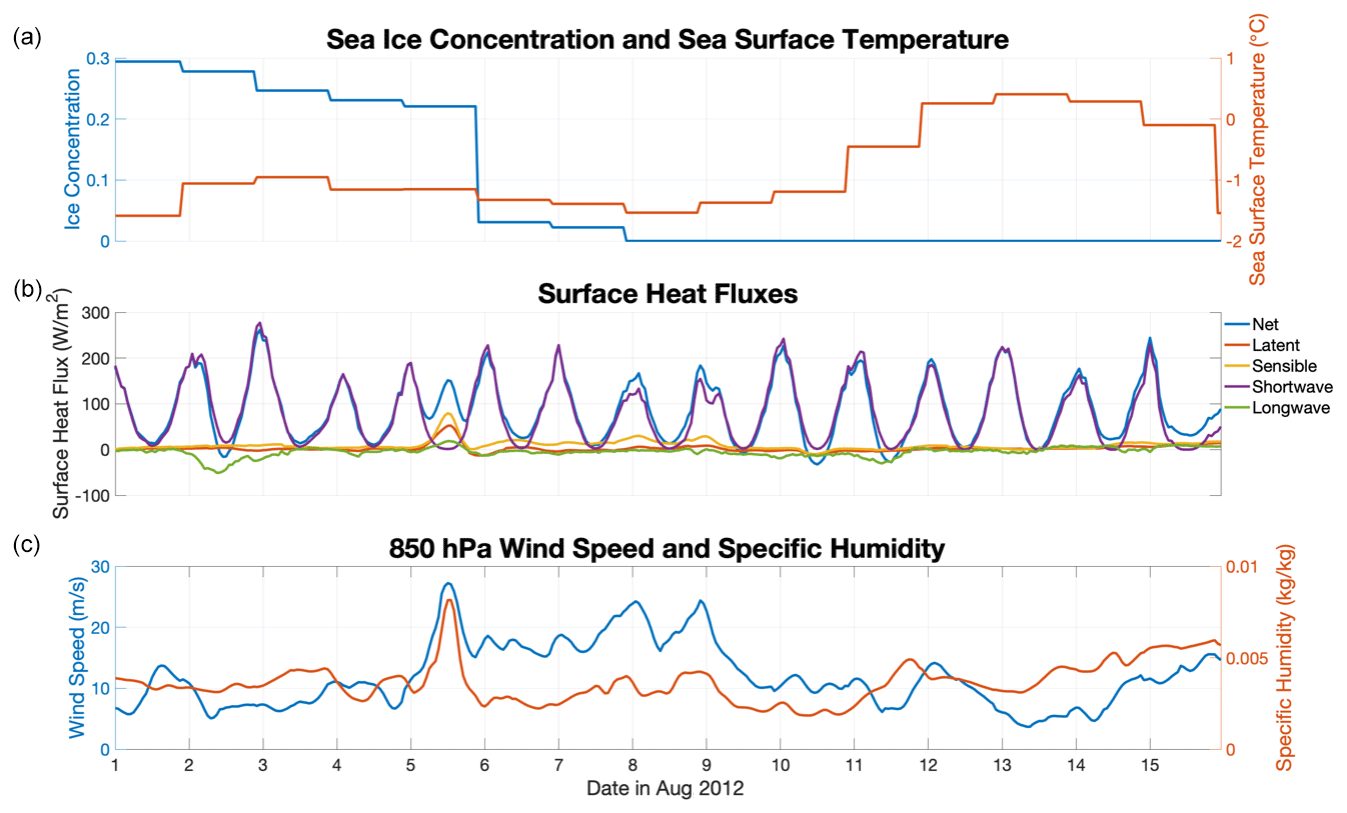
Figure 3(a) Daily sea ice concentration (blue) and sea surface temperature (red) from 1–15 August 2012 averaged over the black box in Fig. 1a. (b) Hourly latent heat flux (red), sensible heat flux (yellow), net shortwave radiation (purple), net longwave radiation (green) and net surface heat flux (blue) from 1–15 August 2012 averaged over the black box in Fig. 1a. (c) Hourly wind speed (blue) and specific humidity (red) at 850 hPa from 1–15 August 2012 averaged over the black box in Fig. 1a.
Sea surface temperature at this location decreased slightly after the AR during the first half of the cyclone and increased substantially near the end of the cyclone (Fig. 3a). The spatial pattern of sea surface temperature change during the life cycle of the cyclone revealed significant ocean warming in the newly formed open ocean which was covered by sea ice before the cyclone (Appendix Fig. A2). This ocean surface warming was related to strong air–sea interaction during the cyclone with shortwave radiation as the dominant term in surface heat fluxes. Wind-induced ocean mixing could also bring subsurface warm water upward during the cyclone (Zhang et al., 2013; Stern et al., 2020).
3.1.2 The atmospheric river event of July 2020
The second lowest summer sea ice extent in 2020 (based on the National Snow and Ice Data Center – NSIDC – sea ice index; Fetterer et al., 2017) is also investigated for its relation to AR forcing. The 2020 summer sea ice deficit occurred largely in the western Arctic Ocean (Liang et al., 2022). The reasons for the record low Arctic sea ice in 2020 involve several processes across different temporal and spatial scales. The Siberian heat wave associated with local atmospheric warming occurred from January–June 2020 (Overland and Wang, 2021) before the extremely low summer sea ice extent in the East Siberian Sea. The record low Arctic sea ice extent in July 2020 has also been attributed to the horizontal transport of heat and moisture from April–June 2020 (Liang et al., 2022). Here we show an example of the contribution of strong water vapor transport by ARs on weather timescales to rapid sea ice changes during the summer of 2020.
In the western Arctic Ocean, a large cyclone occurred from 25 July–2 August 2020, reaching its lowest central pressure (968 hPa) on 28 July 2020. A strong advection of heat and moisture (with a large gradient of temperature and moisture) from Siberia to the Arctic Ocean occurred on 26 July 2020 (not shown). An AR event with a maximum IVT around 600 kg m−1 s−1 in the core and strong northward winds happened near the sea ice edge on 27 July 2020 (Fig. 4b). Corresponding to the AR timing and location over sea ice, strong sensible and latent heat fluxes and net longwave radiation are directed from the atmosphere into the ice and/or ocean. Net shortwave radiation is reduced by clouds (Fig. 4c, d, e, f). Meanwhile, strong northeastward winds reduce sea ice concentration near the sea ice edge (Fig. 4a, b). The wind direction is northward before the AR and becomes eastward after the AR (not shown). This suggests wind-driven meridional water vapor transport at the early stage of the cyclone life cycle and intensified IVT as the AR propagates eastward along the coast later.
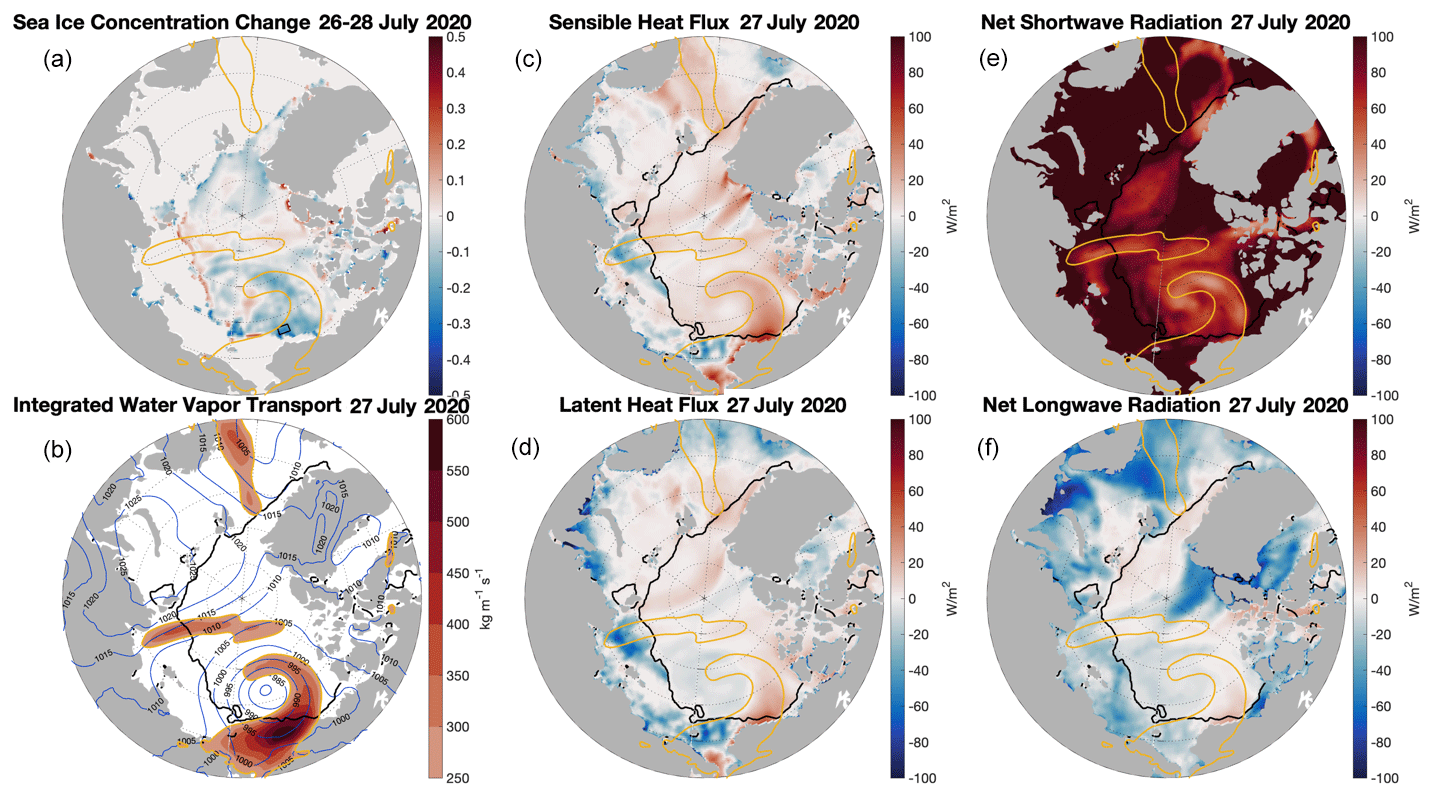
Figure 4(a) Sea ice concentration change from 26–28 July 2020 (sea ice concentration on 28 July 2020 minus sea ice concentration on 26 July 2020). Extent of atmospheric rivers (250 kg m−1 s−1 contour of integrated water vapor transport) on 27 July 2020 is represented as yellow lines (same as in b, c, d, e and f). (b) Magnitude of integrated water vapor transport on 27 July 2020. Sea ice edge (15 % contour of sea ice concentration) on 27 July 2020 is represented as black lines (same as in c, d, e and f). Sea level pressure on 27 July 2020 is represented as blue contours. (c) Sensible heat flux (positive downward) on 27 July 2020. (d) Latent heat flux (positive downward) on 27 July 2020. (e) Net shortwave radiation (positive downward) on 27 July 2020. (f) Net longwave radiation (positive downward) on 27 July 2020. Time is in UTC.
As in Fig. 2, we also investigate this event with respect to the difference from the daily 1981–2020 climatology. This highlights that the spatial extent of the anomalies of surface heat fluxes are collocated well with the anomalous IVT (Fig. 5). Like the event discussed earlier, the most striking anomalous fluxes are the turbulent fluxes. The sensible heat flux is greatest where the IVT is greatest, and the latent heat flux is negative over much of the domain; however, the latent heat flux is strongly positive over the locations of high anomalous IVT. The radiative fluxes show the influence of the IVT anomaly, but these flux anomalies are large in many parts of the domain.

Figure 5Same as Fig. 4 but using anomalous fields as departures from climatology on 27 July (26–28 July for sea ice concentration change) from 1981–2020. Note that sea ice edge in black lines and extent of atmospheric rivers in yellow lines are based on original fields.
Next, we examine the time series of sea ice concentration, sea surface temperature, surface heat fluxes and AR conditions during the life cycle of the cyclone area averaged over the black box (with an area ∼ 100 000 km2) as Fig. 4a shows (Fig. 6). We choose this study area in the Beaufort Sea because it experiences the most significant sea ice reduction during the life cycle of the cyclone (25 July–2 August 2020). At this location sea ice concentration decreases gradually from 72 % to 19 % in the 1 week throughout the cyclone, while the most rapid sea ice decrease happens immediately after the AR. Sea surface temperature increases immediately after the AR and persistently during the cyclone, indicating increasing ocean–ice heat flux for bottom and lateral sea ice melt. Culminating downward turbulent heat fluxes and weak downward net longwave radiation occur early on 27 July 2020 when the AR arrives. For this AR event on 27 July 2020, peaking moisture content, along with high wind speed, generates peaking downward turbulent heat fluxes. This AR event is categorized as AR Cat 1 (Weak) (Ralph et al., 2019) with a maximum IVT magnitude of 502 kg m−1 s−1 and a duration of 16 h (IVT > 250 kg m−1 s−1). The major difference between this case and the case in August 2012 is that in this case the sea ice concentration decreases gradually, lasting for a few days during the cyclone. This might be related to the ocean's role in the warming of the sea surface temperature and constant high wind speed during the cyclone.
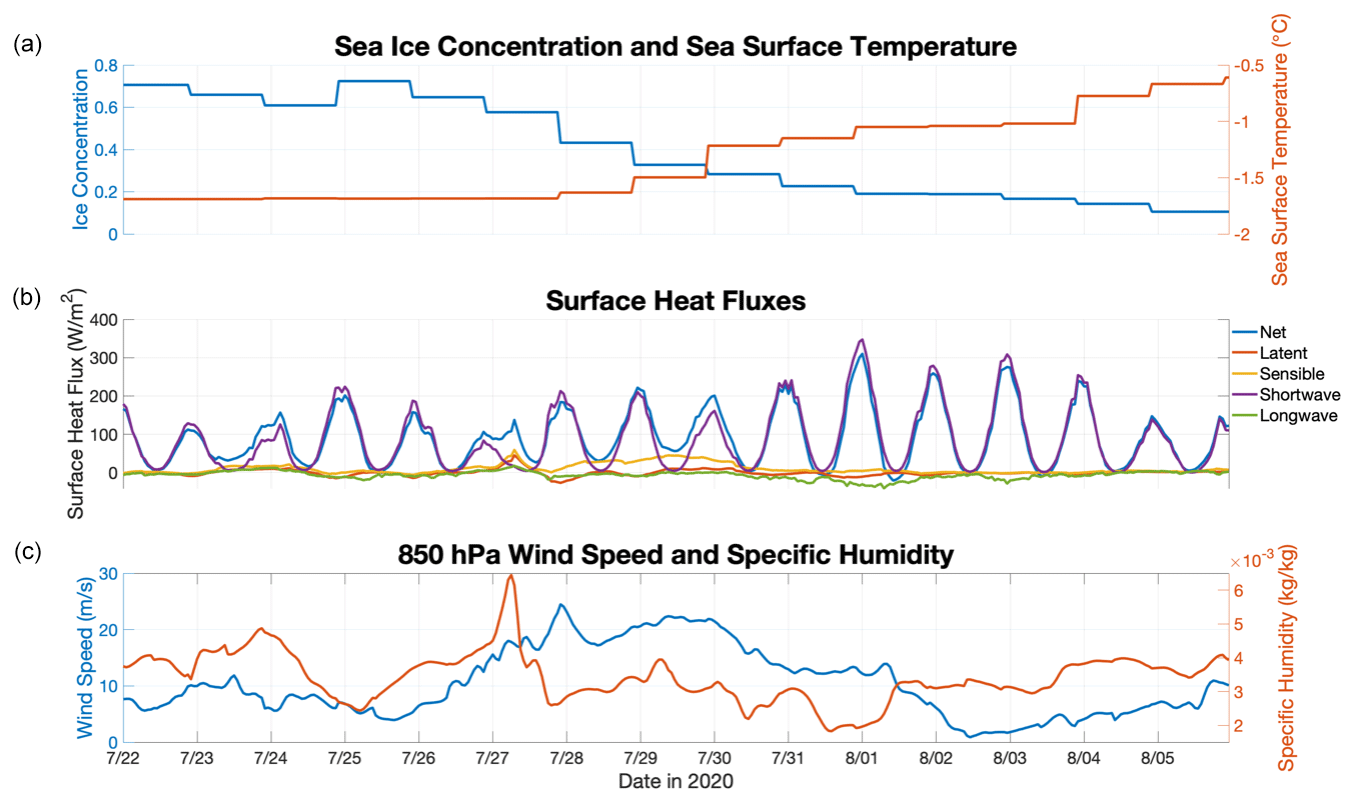
Figure 6(a) Hourly sea ice concentration (blue) and sea surface temperature (red) from 22 July–5 August 2020 averaged over the black box in Fig. 4a. (b) Hourly latent heat flux (red), sensible heat flux (yellow), net shortwave radiation (purple), net longwave radiation (green) and net surface heat flux (blue) from 22 July–5 August 2020 averaged over the black box in Fig. 4a. (c) Hourly wind speed (blue) and specific humidity (red) at 850 hPa from 22 July–5 August 2020 averaged over the black box in Fig. 4a.
In summary, for the years 2012 and 2020, which experienced record low summer sea ice extent in the Arctic Ocean since 1979, AR-related atmospheric water vapor transport from lower latitudes triggered rapid sea ice melt in the western Arctic Ocean through turbulent heat fluxes. Another extreme event with the third lowest summer Arctic sea ice minimum in 2007 has also been attributed to the atmospheric heat and moisture transport from the Pacific, with enhanced downwelling longwave radiation and turbulent fluxes (Graversen et al., 2011). Our results of the surface energy budget of sea ice are generally consistent with in situ observations (Tjernström et al., 2015, 2019) and coupled atmosphere–ocean–ice models (Stern et al., 2020) showing the dominant role of turbulent heat fluxes under ARs.
3.2 Statistical analysis of meteorological and sea ice variations for 1981–2020
The case studies in the previous section reveal linkages between AR-related atmospheric forcing and rapid sea ice changes. We extend these to a general study spanning 4 decades over the entire Arctic Ocean. We carry out statistical analyses to examine the relationships between meteorological conditions and sea ice changes in the Arctic Ocean by using ERA5 for 1981–2020. We explicitly separate the thermodynamic and dynamic effects of ARs on sea ice changes. We consider IWV, surface latent and sensible heat fluxes as thermodynamic variables; however, we consider near-surface northward wind as a dynamic variable. We consider the sea ice concentration tendency on a daily basis. ERA5 has a good performance of IWV (Graham et al., 2019), and sea ice concentration is based on daily satellite observations; therefore, it is reasonable to examine the relationship between IWV and the sea ice concentration tendency on a daily basis to study how ARs thermodynamically influence sea ice changes. In addition, we use northward wind as the driving force to approximately study ARs' dynamic effect on sea ice. When the partial sea ice cover with sea ice concentration is < 85 %, we consider it in free drift with small internal sea ice stress (Heorton et al., 2019). Sea ice velocity in free drift is strongly correlated with wind forcing, especially on weather timescales. We find that the sea ice concentration tendency has significant anticorrelation with IWV, northward wind and turbulent heat flux on weather timescales almost everywhere in the Arctic Ocean.
3.2.1 Seasonal variations in 2012 at one location in the Chukchi Sea
To put the AR event on 5 August 2012 in the context of longer timescales, we first extend the time series to the full calendar year of 2012 for the same study area as the black box in Fig. 1a. We examine the daily IWV, sea ice concentration tendency, latent heat flux, sensible heat flux and northward wind averaged over that study area for 2012 (Fig. 7). Since satellite-observed sea ice concentration is available at a daily resolution, we consider the daily mean IWV, latent and sensible heat fluxes and northward wind. The conditions of the extreme event on 5 August 2012 are marked with black circles (Fig. 7). For this extreme event, substantial sea ice concentration decrease corresponds to large atmospheric moisture content, strong latent and sensible heating from the atmosphere, and high northward wind. Note that those variables show dominant seasonal cycles and high-frequency fluctuations imposing on seasonal cycles. Those high-frequency variations on weather timescales are the focus of this study.
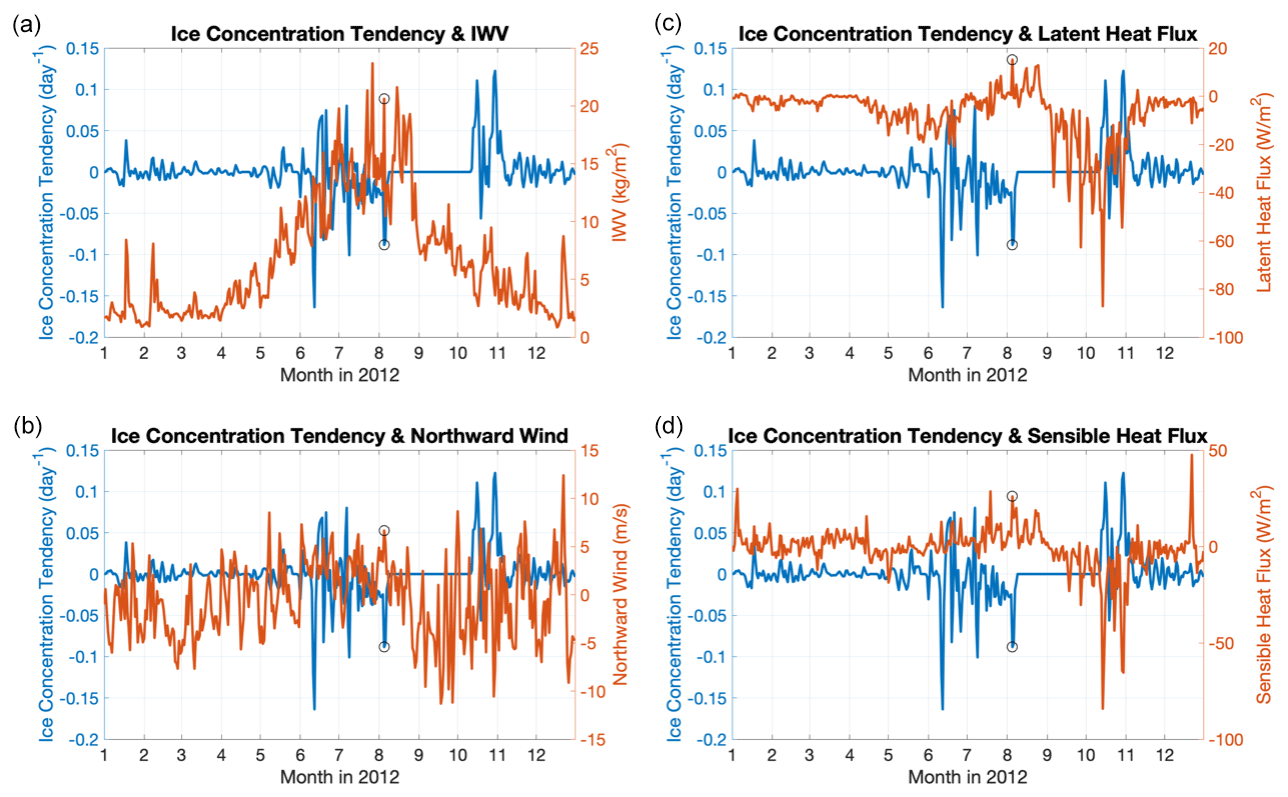
Figure 7(a) Variations in sea ice concentration tendency and IWV in 2012. (b) Variations in sea ice concentration tendency and northward wind in 2012. (c) Variations in sea ice concentration tendency and latent heat flux in 2012. (d) Variations in sea ice concentration tendency and sensible heat flux in 2012. All variables are averaged over the black box in Fig. 1a. The AR event on 5 August 2012 is marked with black circles.
3.2.2 Statistical analysis for 1981–2020 at one location in the Chukchi Sea
We expand our time series analysis to 4 decades from 1981–2020. We focus on variations on weather timescales in this study. We use a high-pass filter with a period < 30 d to remove time-varying seasonal cycles from the daily time series for 1981–2020. We define those high-frequency variations (period < 30 d) as anomalies in the statistical analysis here. We only consider time periods when the sea ice cover is partial (sea ice concentration between 15 % and 85 %). This is generally consistent with the definition of a marginal ice zone with a sea ice concentration between 15 % and 80 % (https://www.npolar.no/en/themes/the-marginal-ice-zone, last access: 10 October 2022). Also, sea ice is in free drift for a sea ice concentration of < 85 %. The reason for this choice is that the sea ice concentration can only change substantially in response to atmospheric forcing when the sea ice concentration is partial.
We find significant rank correlation between anomalies of the sea ice concentration tendency and IWV, northward wind, latent heat flux, and sensible heat flux from 1981–2020 (Fig. 8). The rank correlation between the sea ice concentration tendency anomalies and IWV, latent heat flux, sensible heat flux, and northward wind anomalies is −0.30, −0.28, −0.30, and −0.34, respectively, all with p values < 0.01 for Spearman's rho. The negative correlations are moderate but significant due to the large sample size (14 610). The AR event on 5 August 2012 (big red dot in Fig. 8a) stands out as an extreme event from 1981–2020.
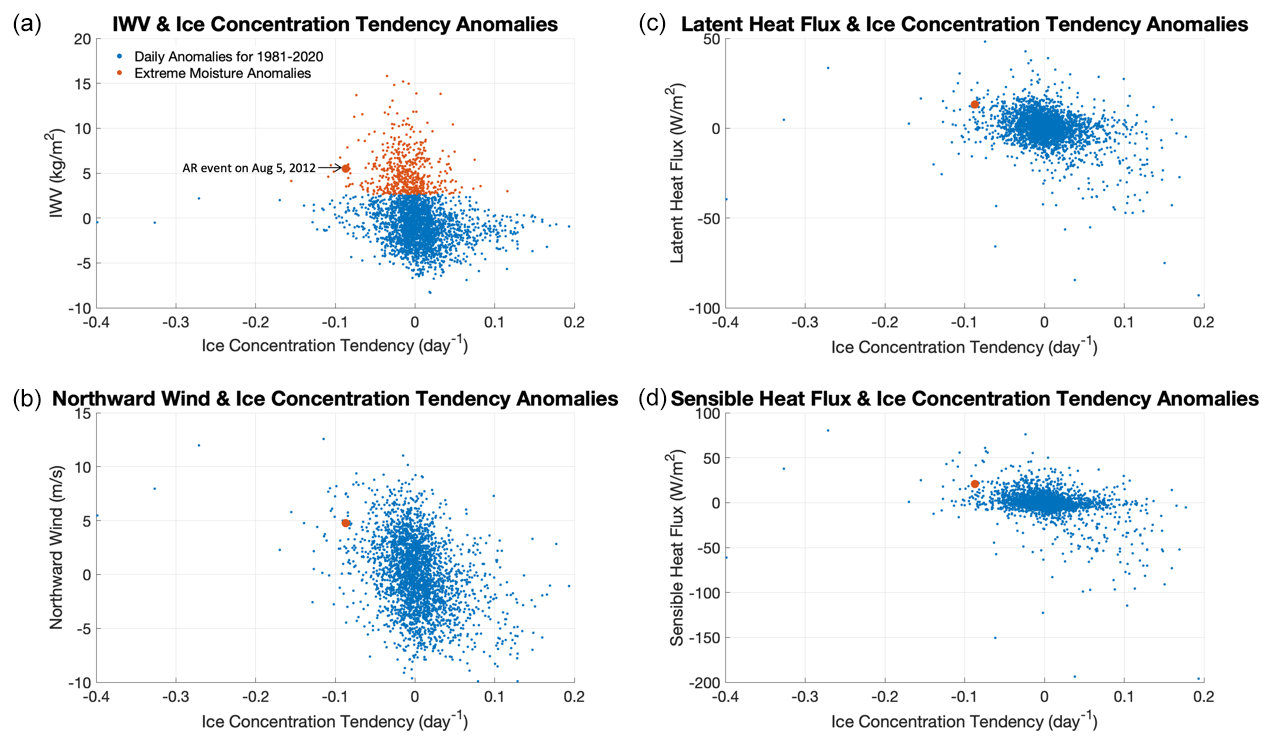
Figure 8Scatterplots at one location in the Chukchi Sea (black box in Fig. 1a) from daily time series for 1981–2020 when sea ice cover is partial. (a) Scatterplot of anomalies of IWV and sea ice concentration tendency (blue dots), with small red dots representing extreme IWV anomalies exceeding the 90th percentile. (b) Scatterplot of anomalies of northward wind and sea ice concentration tendency. (c) Scatterplot of anomalies of latent heat flux and sea ice concentration tendency. (d) Scatterplot of anomalies of sensible heat flux and sea ice concentration tendency. Big red dots in (a), (b), (c) and (d) represent the AR event on 5 August 2012.
Next, we identify all extreme moisture anomalies from ERA5 from 1981–2020 in this study area as proxies for AR events and validate them with a global AR catalog. We define extreme moisture anomalies as IWV anomalies exceeding the 90th percentile based on the daily time series from 1981–2020. We only consider extreme events over partially covered sea ice in this study. For this study area, we identify 553 extreme moisture anomalies with 20 % frequency when sea ice cover was partial from 1981–2020. The mean IWV anomalies of those extreme events are 5.21 kg m−2, and the mean sea ice concentration tendency anomalies of those extreme events are −1 % d−1. In Fig. 8a, the small red dots represent extreme moisture anomalies using ERA5 data, while the big red dot represents the AR event on 5 August 2012 (Figs. 1 and 3). We validate extreme moisture anomalies identified by our method with ARs identified by Guan and Waliser's AR catalog version 3 (Guan and Waliser, 2019). Among the extreme moisture anomalies exceeding the 90th percentile over a partial sea ice cover, 72 % have a corresponding AR identified from the catalog around the same date (±12 h) and at the same location. This ratio is 91 % for 2012. For large extreme events, these two methods agree very well. The consistency of the results from using methods based on IWV and IVT implies that extreme IWV anomalies in the Arctic are due to water vapor transport by ARs from lower latitudes. In summary, the consistency of ARs identified by the two methods confirms that it is reasonable to use extreme moisture anomalies to approximate ARs in our study, but our method of detecting daily extreme moisture anomalies is simple and efficient for the large datasets from ERA5. Additionally, our method of identifying extreme moisture anomalies is similar to the moist air intrusions defined in Papritz et al. (2022); however, we examine moisture evolution for each grid box accounting for spatial variations, while they consider zonal mean moisture transport (Papritz et al., 2022).
We examine composite meteorological and sea ice conditions further on dates with extreme IWV anomalies between 1981 and 2020, which were identified by using the ERA5 data in the same study area. As Fig. 9a shows, a prominent feature of IWV is the moisture intrusion on the sea ice cover over the Chukchi Sea. Simultaneously, a very strong northward wind pattern around the same region can transport water vapor from the Pacific to the Arctic, which is consistent with Baggett et al. (2016) and Horvath et al. (2021). Correspondingly, substantial sea ice loss occurs over a broad area where moisture reaches sea ice (Fig. 9b). Those extreme events mainly happen during the summer season when the sea ice cover is partial. We also examine composites on dates with extreme IWV anomalies and ARs from the AR catalog. The spatial patterns of IWV, sea level pressure and sea ice concentration tendency composites with ARs are consistent with composites with extreme moisture anomalies, but the magnitudes are stronger (Appendix Fig. A3).
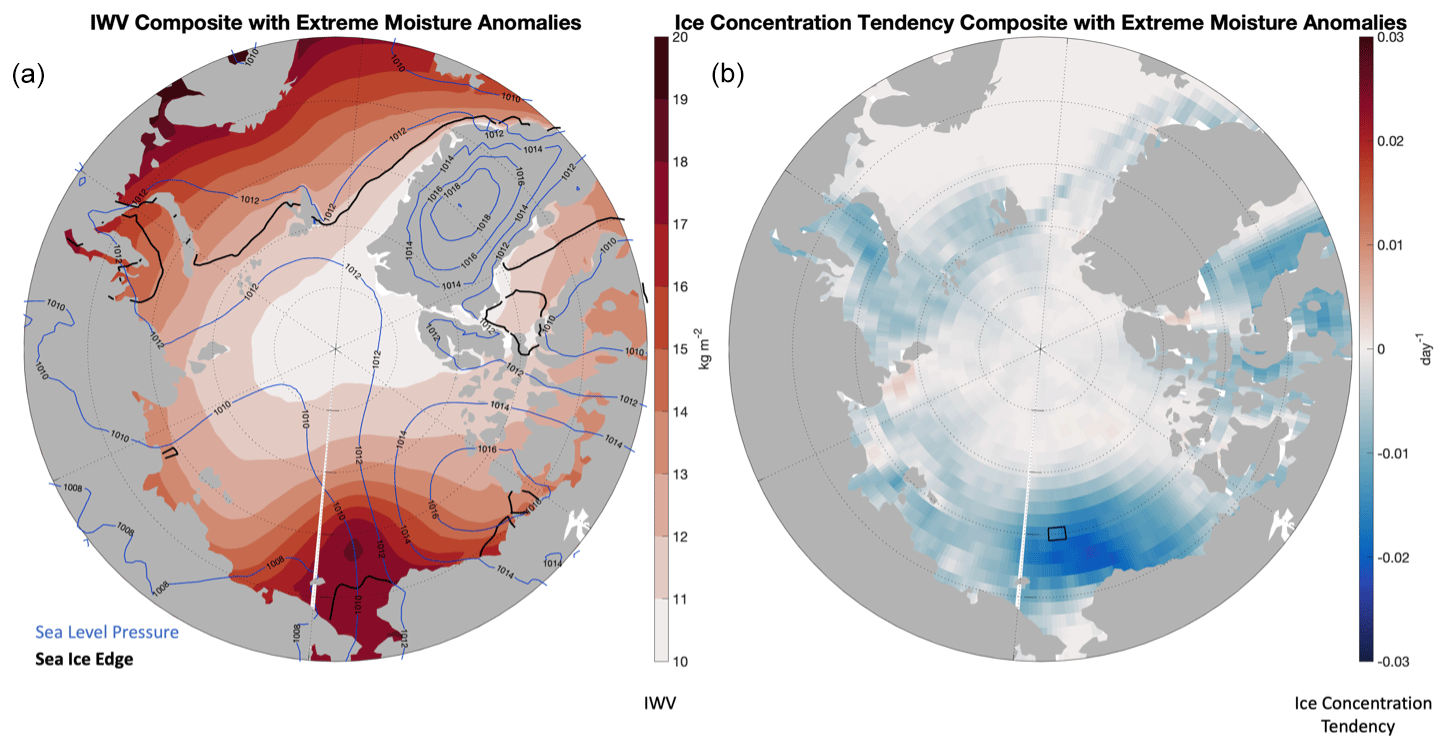
Figure 9(a) Composites of IWV, sea ice edge (black lines) and sea level pressure (blue contours). (b) Composite of sea ice concentration tendency when extreme IWV anomalies (> 90th percentile) from 1981–2020 occur over partial sea ice cover in the black box in the Chukchi Sea.
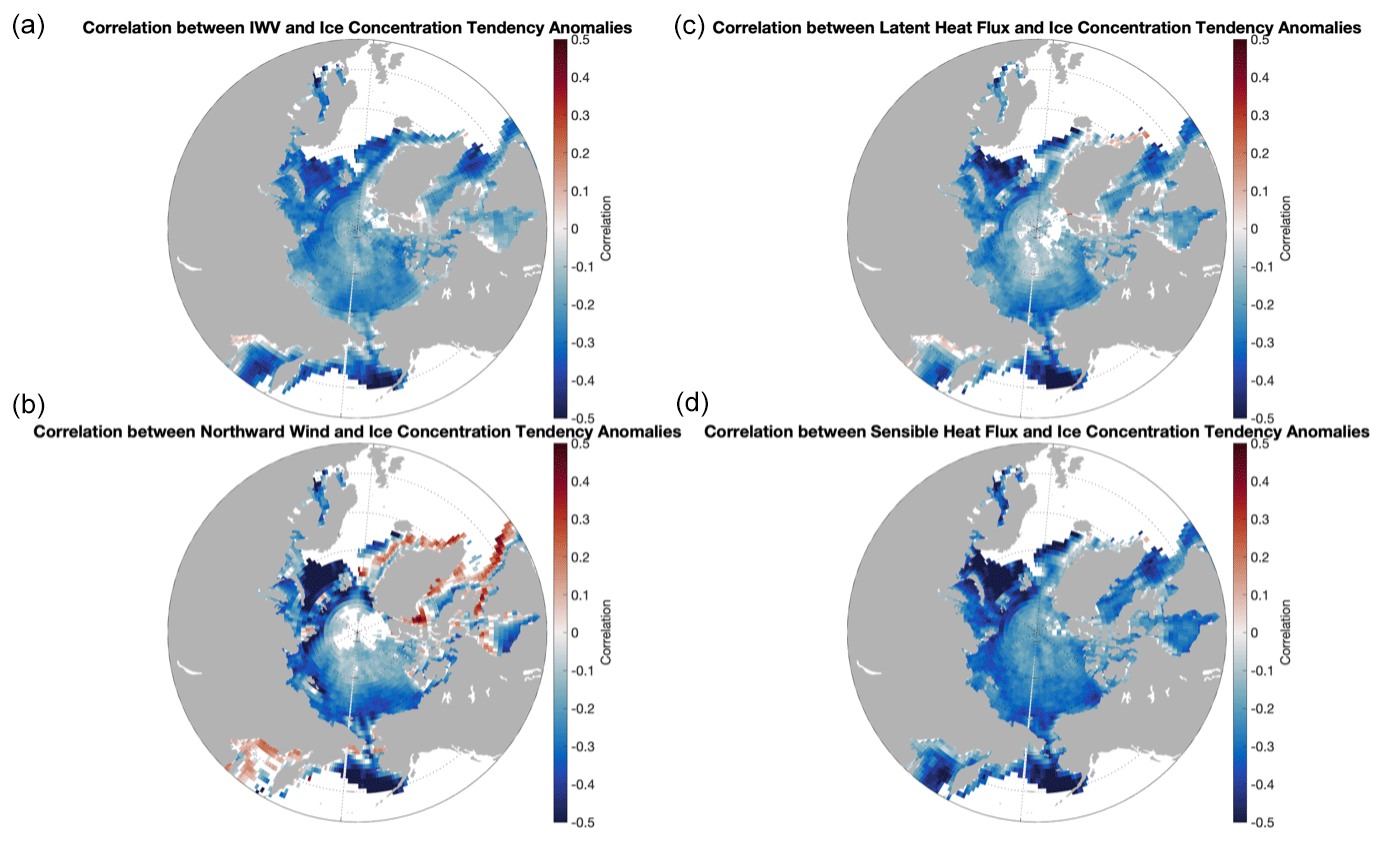
Figure 10(a) Rank correlation between anomalies of IWV and sea ice concentration tendency. Only significant correlations are plotted. (b) Rank correlation between anomalies of northward wind and sea ice concentration tendency. (c) Rank correlation between anomalies of latent heat flux and sea ice concentration tendency. (d) Rank correlation between anomalies of sensible heat flux and sea ice concentration tendency.
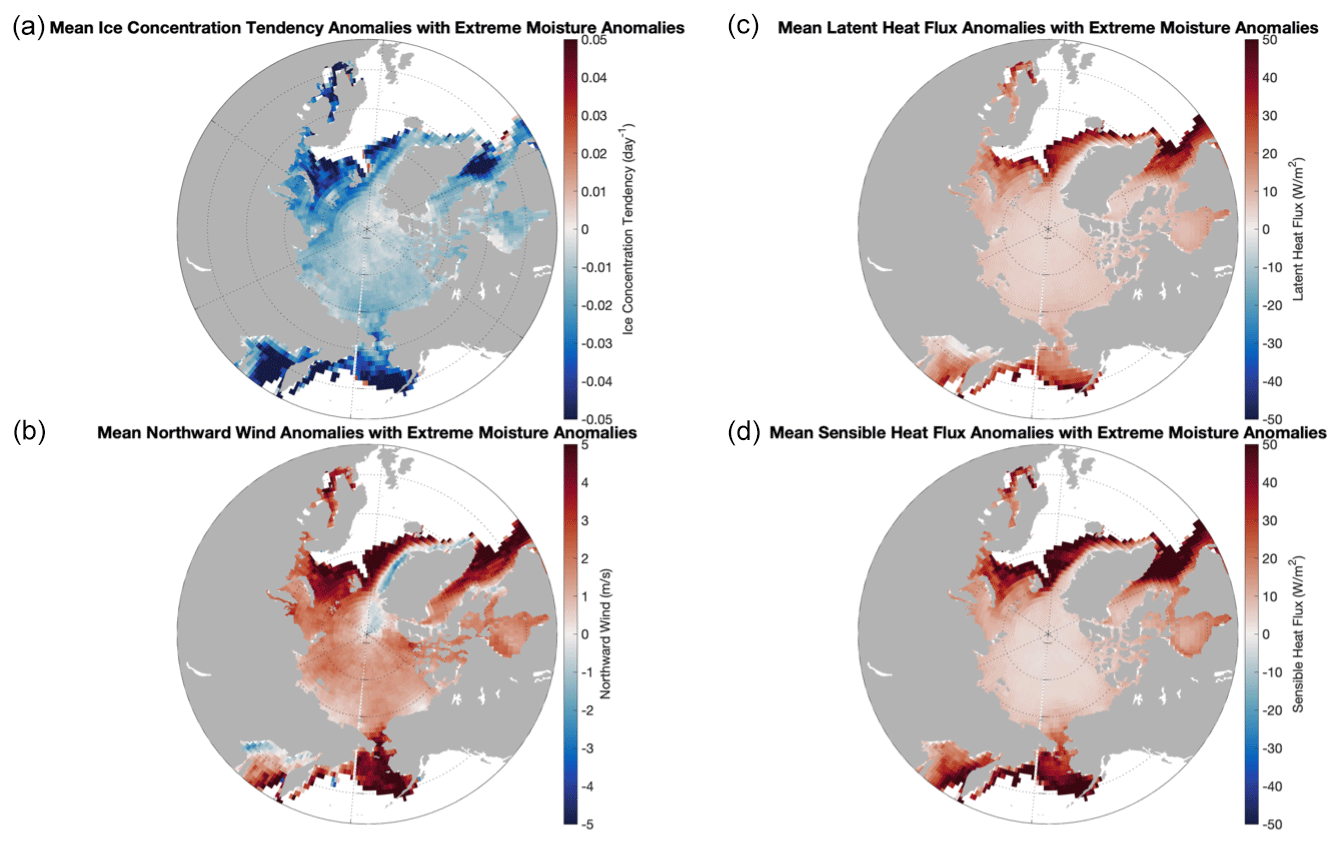
Figure 11(a) Mean sea ice concentration tendency anomalies with extreme moisture anomalies. (b) Mean northward wind anomalies with extreme moisture anomalies. (c) Mean latent heat flux anomalies with extreme moisture anomalies. (d) Mean sensible heat flux anomalies with extreme moisture anomalies.
3.2.3 Statistical analysis for 1981–2020 everywhere in the Arctic Ocean
We expand our analysis further from one location in the Chukchi Sea to all grid boxes in the Arctic Ocean on a daily basis from 1981–2020. We find that the anomalies of IWV and sea ice concentration tendency have significant anticorrelation almost everywhere when the sea ice cover is partial (Fig. 10). Correspondingly, the latent and sensible heat flux anomalies anticorrelate with the sea ice concentration tendency anomalies. Dynamically, northward wind anomalies have negative correlation with sea ice tendency anomalies for the majority of the Arctic Ocean and have a positive correlation with sea ice tendency anomalies near land margins, e.g., around Greenland. The synergy of the thermodynamical and dynamical components of atmospheric forcing indicates the importance of horizontal advection of heat and water vapor from lower latitudes through ARs in causing rapid sea ice changes. Note that only time periods with partial sea ice cover with a sea ice concentration between 15 % and 85 % are included in the analysis, which are different at different locations. The marginal ice zone advances and retreats across different seasons. Thus, we consider different seasons for different regions. For instance, correlations are during the summer season in the central Arctic, while correlations are during the winter season in the southeast Bering Sea.
Next, we examine the mean anomalous conditions when extreme moisture anomalies occur for each grid box in the Arctic Ocean (Fig. 11). We identify the dates with extreme moisture anomalies specific for each grid box and calculate the mean anomalies on those dates locally over that grid box. Note that extreme moisture anomalies are daily while AR events have varied durations, but mean anomalies with extreme moisture anomalies and AR events are the same. When extreme moisture anomalies (approximate AR events) happen over partial sea ice cover, mean sea ice concentration tendency anomalies are negative almost everywhere in the Arctic Ocean. Correspondingly, mean latent and sensible heat flux anomalies are positive. Mean northward wind anomalies are also positive (except at certain locations near land margins). It is noted that the strength of mean extreme moisture anomalies is similar over the entire Arctic Ocean (Appendix Fig. A4). However, sea ice response shows large spatial variations. The magnitudes of the sea ice concentration tendency anomalies are much larger in subarctic seas (e.g., the Bering Sea) than in the central Arctic, which indicates that the partial sea ice cover in subarctic seas is more sensitive to moisture forcing than in the central Arctic.
The poleward moisture transport from lower latitudes through ARs has large impacts on Arctic sea ice variations. ARs bring moist and warm air and strong winds into the Arctic. When ARs reach regions covered by sea ice they can trigger rapid and substantial sea ice loss on weather timescales. Sensible and latent heat fluxes are the dominant terms in the surface energy budget associated with ARs. These fluxes are enhanced by warm and moist air and strong winds associated with ARs. Due to the clouds and precipitation associated with ARs and large atmospheric water vapor content, net longwave radiation is enhanced moderately, and net shortwave radiation is reduced. Additionally, sea ice motion driven by strong near-surface winds under ARs further reduces the sea ice concentration near sea ice margins. Note that the relationship between ARs and sea ice change is similar and even stronger in the winter (not shown here), though the case studies that this paper show are in the summer.
An analysis over the entire Arctic Ocean shows that the sea ice concentration tendency has significant anticorrelation with IWV, northward wind and turbulent heat flux anomalies almost everywhere. This occurs throughout the year. The coherence over the entire Arctic Ocean of anticorrelation between anomalous moisture and winds as well as sea ice variations on weather timescales provides important implications for Arctic sea ice prediction. The documented anomalies and statistical relationships found in this work help explain the physics governing the observed sea ice variability associated with ARs. In particular, ARs are characterized by a low-level jet and this study demonstrates the important role that the associated winds play in driving sea ice motion and thus sea ice variability.
Our conclusions are generally consistent with the dominant role of atmospheric temperature in driving sea ice change mainly through advection at low levels (Li et al., 2014a; Li et al., 2014b; Olonscheck et al., 2019), though over different timescales. Our study shows that the near-surface atmospheric temperature and moisture-induced sensible and latent heat fluxes from ARs to sea ice are the most important terms in the surface energy budget on weather timescales (Olonscheck et al., 2019). The large impact of ARs on sea ice variations on weather timescales also suggests that ARs provide one mechanism of bottom-amplified warming with important implications for Arctic amplification (e.g., Woods and Caballero, 2016).
Though we have added novel analysis regarding the interaction between ARs and sea ice, there is still much to do. Our future work will examine the relative contribution of water vapor and heat transport as well as local warming and moistening to sea ice decline in the Arctic. In addition, the role of the ocean and ocean feedbacks should be examined, possibly using coupled atmosphere–ocean sea ice models. Remote sensing is challenging in the presence of ARs, but nevertheless future work could also aim to incorporate satellite-inferred sea ice velocity into the type of analysis presented here. Moreover, while we have shown that individual AR events can have large impacts on the Arctic sea ice variations in the short term, the integrated effect of ARs including its frequency and strength on the Arctic sea ice budget deserves further study. It is important to understand the extent to which the Arctic sea ice decline can be attributed to AR activity, possibly using climate models.
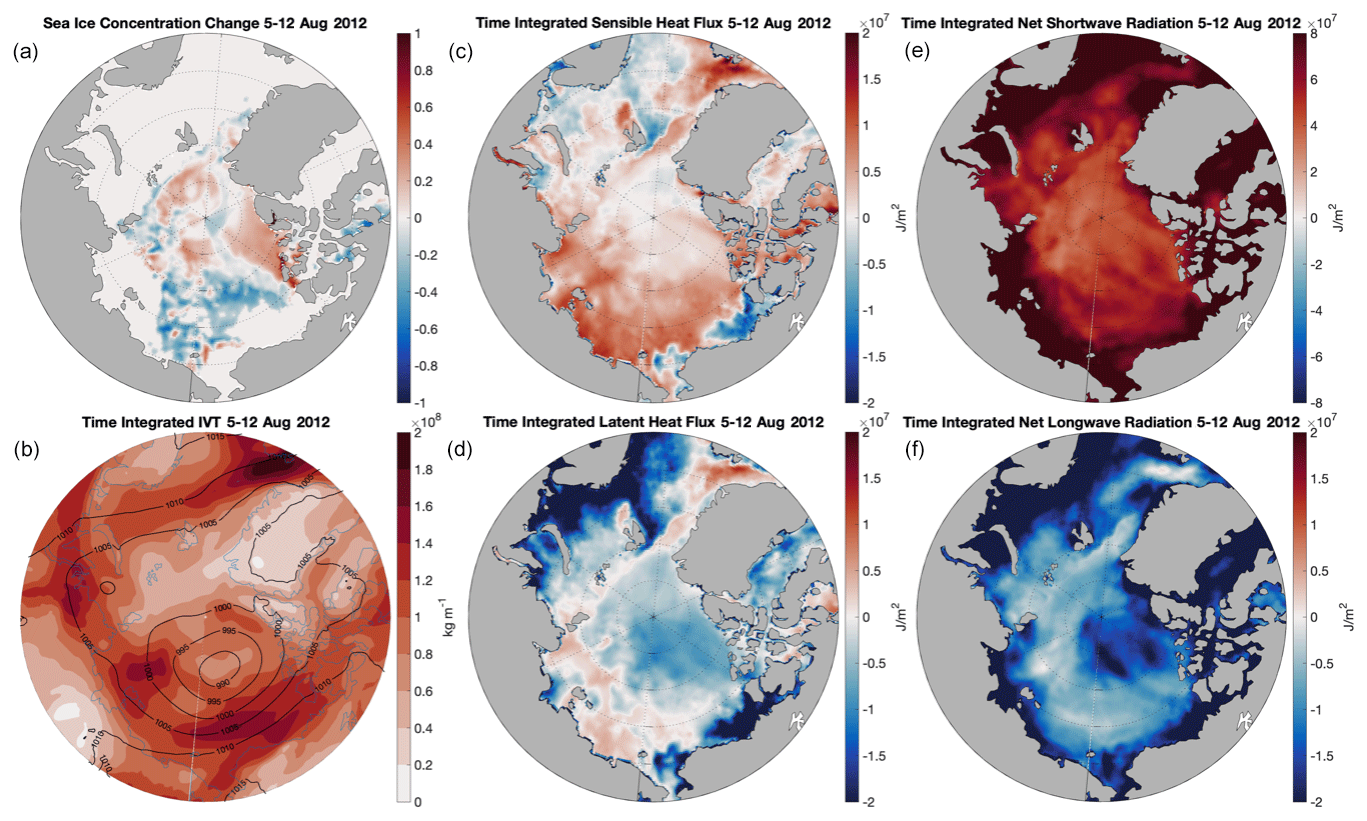
Figure A1(a) Sea ice concentration change from 5–12 August 2012, based on satellite observation. (b) Time-integrated magnitude of integrated water vapor transport from 5–12 August 2012. Time mean sea level pressure from 5–12 August 2012 is represented as black contours. (c) Time-integrated sensible heat flux (positive downward) from 5–12 August 2012. (d) Time-integrated latent heat flux (positive downward) from 5–12 August 2012. (e) Time-integrated net shortwave radiation (positive downward) from 5–12 August 2012. (f) Time-integrated net longwave radiation (positive downward) from 5–12 August 2012. Time is in UTC.
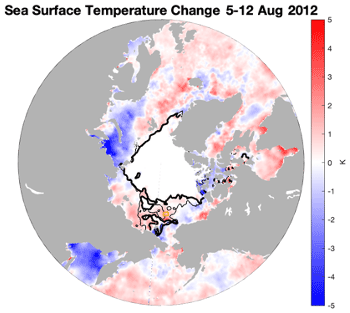
Figure A2Sea surface temperature change from 5–12 August 2012. Thin black lines represent sea ice edge (15 % contour of sea surface temperature) on 5 August 2012, and thick black lines represent sea ice edge on 12 August 2012. Time is in UTC.
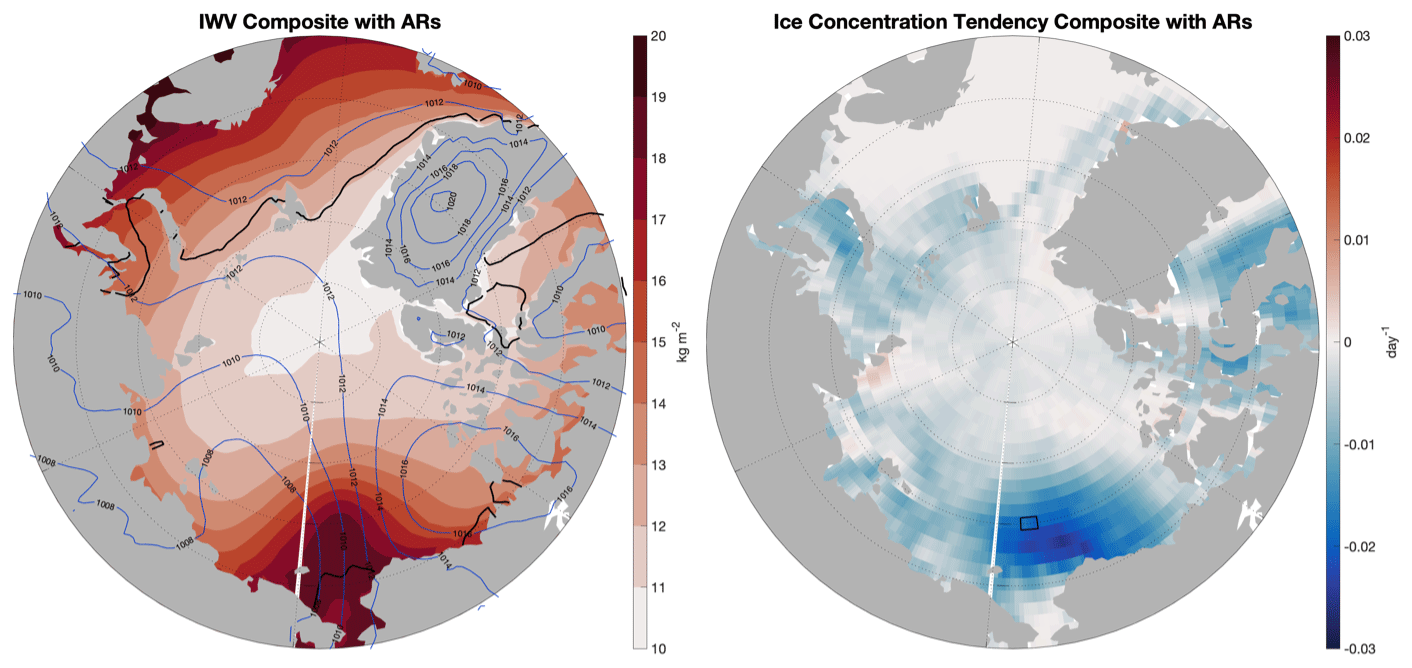
Figure A3Composites of IWV, sea ice edge (black lines), sea level pressure (blue contours) and sea ice concentration tendency with ARs from AR catalog among extreme IWV anomalies over partial sea ice cover in the black box in the Chukchi Sea.
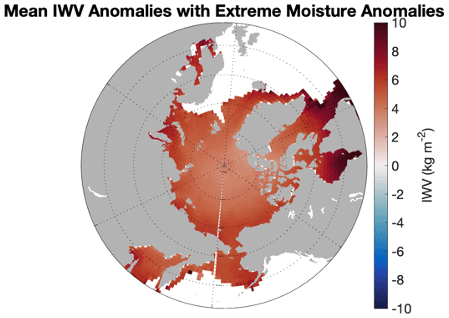
Figure A4Mean IWV anomalies with extreme moisture anomalies.
Data are available to the public on the ECMWF Climate Data Store website: https://cds.climate.copernicus.eu/cdsapp#!/home (Hersbach et al., 2020). Data used in this study include the following: ERA5 hourly data on single levels from 1940 to present at https://cds.climate.copernicus.eu/cdsapp#!/dataset/reanalysis-era5-single-levels?tab=form (Hersbach et al., 2022a) and ERA hourly data on pressure levels from 1940 to present https://cds.climate.copernicus.eu/cdsapp#!/dataset/reanalysis-era5-pressure-levels?tab=form (Hersbach et al., 2022b).
LL and FC conceptualized the study and designed the analysis. LL developed the codes and performed the analysis in discussion with all co-authors. LL prepared the paper with revisions from all co-authors. LL and MM went through the reviewing process and revised the paper accordingly with help from ACS and AMW.
The contact author has declared that none of the authors has any competing interests.
Publisher's note: Copernicus Publications remains neutral with regard to jurisdictional claims made in the text, published maps, institutional affiliations, or any other geographical representation in this paper. While Copernicus Publications makes every effort to include appropriate place names, the final responsibility lies with the authors.
We appreciate ECMWF for providing ERA5 atmospheric reanalysis data. We also thank the editor and reviewers for their contributions to the improvement of this work. Funding of this study is provided by the Center for Western Weather and Water Extremes, Scripps Institution of Oceanography, University of California San Diego, USA.
Aneesh C. Subramanian received support from the AR Program and NSF iHARP (no. 2118285) for this work. CW3E personnel were supported by the California Department of Water Resources Atmospheric River Program Phase III (grant 4600014294).
This paper was edited by Petra Heil and reviewed by Pengfei Zhang and three anonymous referees.
Ali, S. M. and Pithan, F.: Following moist intrusions into the Arctic using SHEBA observations in a Lagrangian perspective, Q. J. Roy. Meteor. Soc. 146, 3522–3533, 2020.
American Meteorological Society: Atmospheric river, Glossary of Meteorology, http://glossary.ametsoc.org/wiki/Atmospheric_river (last access: 8 March 2022), 2017.
Baggett, C., Lee, S., and Feldstein, S.: An Investigation of the Presence of Atmospheric Rivers over the North Pacific during Planetary-Scale Wave Life Cycles and Their Role in Arctic Warming, J. Atmos. Sci., 73, 4329–4347, 2016.
Batrak, Y. and Müller, M.: On the warm bias in atmospheric reanalyses induced by the missing snow over Arctic sea-ice, Nat. Commun., 10, 4170, https://doi.org/10.1038/s41467-019-11975-3, 2019.
Doyle, J. G., Lesins, G., Thackray, C. P., Perro, C., Nott, G. J., Duck, T. J., Damoah, R., and Drummond, J. R.: Water vapor intrusions into the High Arctic during winter, Geophys. Res. Lett., 38, L12806, https://doi.org/10.1029/2011GL047493, 2011.
Fearon, M. G., Doyle, J. D., Ryglicki, D. R., Finocchio, P. M., and Sprenger, M.: The role of cyclones in moisture transport into the Arctic, Geophys. Res. Lett., 48, e2020GL090353, https://doi.org/10.1029/2020GL090353, 2021.
Fetterer, F., Knowles, K., Meier, W. N., Savoie, M., and Windnagel, A. K.: updated daily. Sea Ice Index, Version 3, Arctic, Boulder, Colorado USA: National Snow and Ice Data Center [data set], https://doi.org/10.7265/N5K072F8, 2017.
Finocchio, P. M., Doyle, J. D., Stern, D. P., and Fearon, M. G.: Short-term impacts of Arctic summer cyclones on sea ice extent in the marginal ice zone, Geophys. Res. Lett., 47, e2020GL088338, https://doi.org/10.1029/2020GL088338, 2020.
Graham, R. M., Cohen, L., Ritzhaupt, N., Segger, B., Graversen, R. G., Rinke, A., Walden, V. P., Granskog, M. A., and Hudson, S. R.: Evaluation of Six Atmospheric Reanalyses over Arctic Sea Ice from Winter to Early Summer, J. Climate, 32, 4121–4143, 2019.
Graversen, R. G., Mauritsen, T., Drijfhout, S., Tjernström, M., and Mårtensson, S.: Warm winds from the Pacific caused extensive Arctic sea-ice melt in summer 2007, Clim. Dynam., 36, 2103–2112, https://doi.org/10.1007/s00382-010-0809-z, 2011.
Guan, B. and Waliser, D. E.: Tracking atmospheric rivers globally: Spatial distributions and temporal evolution of life cycle characteristics, J. Geophys. Res., 124 12523–12552, 2019.
Guarino, MV., Sime, L.C., Schröeder, D., Malmierca-Vallet, I., Rosenblum, E., Ringer, M., Ridley, J., Feltham, D., Bitz, C., Steig, E.J., Wolff, E., Stroeve, J., and Sellar, A.: Sea-ice-free Arctic during the Last Interglacial supports fast future loss, Nat. Clim. Change, 10, 928–932, https://doi.org/10.1038/s41558-020-0865-2, 2020.
Harrington, T. S., Zhu, J., and Skinner, C. B.: Terrestrial sources of summer arctic moisture and the implication for arctic temperature patterns, npj Clim. Atmos. Sci. 4, 25, https://doi.org/10.1038/s41612-021-00181-y, 2021.
Hegyi, B. M. and Taylor, P. C.: The unprecedented 2016–2017 Arctic sea ice growth season: The crucial role of atmospheric rivers and longwave fluxes, Geophys. Res. Lett., 45, 5204–5212, https://doi.org/10.1029/2017GL076717, 2018.
Hersbach, H., Bell, B., Berrisford, P, Hirahara, S., Horányi, A., Muñoz-Sabater, J., Nicolas, J., Peavey, C., Radu, R., Schepers, D., Simmons, A., Soci, C., Abdalla, S., Abellan, X., Balsamo, G., Bechtold, P., Biavati, G., Bidlot, J., Bonavita, M., De Chiara, G., Dahlgren, P., Dee, D., Diamantakis, M., Dragani, R., Fleming, J., Forbes, R., Fuentes, M., Geer, A., Haimberger, L., Healy, S., Hogan, R. J., Hólm, E., Janisková, M., Keeley, S., Laloyaux, P., Lopez, P., Lupu, C., Radnoti, G., de Rosnay, P., Rozum, I., Vamborg, F., Villaume, S., and Thépaut, J.-N.: The ERA5 global reanalysis, Q. J. Roy. Meteor. Soc., 146, 1999–2049, https://doi.org/10.1002/qj.3803, 2020.
Hersbach, H., Bell, B., Berrisford, P., Biavati, G., Horányi, A., Muñoz Sabater, J., Nicolas, J., Peubey, C., Radu, R., Rozum, I., Schepers, D., Simmons, A., Soci, C., Dee, D., and Thépaut, J-N.: ERA5 hourly data on single levels from 1940 to present, Copernicus Climate Change Service (C3S) Climate Data Store (CDS) [data set], https://doi.org/10.24381/cds.adbb2d47, 2022a.
Hersbach, H., Bell, B., Berrisford, P., Biavati, G., Horányi, A., Muñoz Sabater, J., Nicolas, J., Peubey, C., Radu, R., Rozum, I., Schepers, D., Simmons, A., Soci, C., Dee, D., and Thépaut, J.-N.: ERA5 hourly data on pressure levels from 1940 to present, Copernicus Climate Change Service (C3S) Climate Data Store (CDS) [data set], https://doi.org/10.24381/cds.bd0915c6, 2022b.
Heorton, H. D. B. S., Tsamados, M., Cole, S. T., Ferreira, A. M. G., Berbellini, A., Fox, M., and Armitage, T. W. K.: Retrievingsea ice drag coefficients and turningangles from in situ and satelliteobservations using an inversemodeling framework, J. Geophys. Res.-Oceans, 124, 6388–6413, https://doi.org/10.1029/2018JC01488, 2019.
Hofsteenge, M. G., Graversen, R. G., Rydsaa, J. H., and Rey, Z.: The impact of atmospheric Rossby waves and cyclones on the Arctic sea ice variability, Clim. Dynam., 59, 579–594, https://doi.org/10.1007/s00382-022-06145-z, 2022.
Horvath, S., Stroeve, J., Rajagopalan, B., and Jahn, A.: Arctic sea ice melt onset favored by an atmospheric pressure pattern reminiscent of the North American-Eurasian Arctic pattern, Clim. Dynam., 57, 1771–1787, https://doi.org/10.1007/s00382-021-05776-y, 2021.
Johansson, E., Devasthale, A., Tjernström, M., Ekman, A. M. L., and L'Ecuyer, T.: Response of the lower troposphere to moisture intrusions into the Arctic, Geophys. Res. Lett., 44, 2527– 2536, https://doi.org/10.1002/2017GL072687, 2017.
Komatsu, K. K., Alexeev, V. A., Repina, I. A., and Tachibana, Y.: Poleward upgliding Siberian atmospheric rivers over sea ice heat up Arctic upper air, Sci. Rep. 8, 2872, https://doi.org/10.1038/s41598-018-21159-6, 2018.
Li, L., McClean, J. L., Miller, A. J., Eisenman, I., Hendershott, M. C., and Papadopoulos, C. A.: Processes driving sea ice variability in the Bering Sea in an eddying ocean/sea ice model: mean seasonal cycle, Ocean Model., 84, 51–66, 2014a.
Li, L., Miller, A. J., McClean, J. L., Eisenman, I., and Hendershott, M. C.: Processes driving sea ice variability in the Bering Sea in an eddying ocean/sea ice model: anomalies from the mean seasonal cycle, Ocean Dynam., 64, 1693–1717, https://doi.org/10.1007/s10236-014-0769-7, 2014b.
Liang, Y., Bi, H., Huang, H., Lei, R., Liang, X., Cheng, B., and Wang, Y.: Contribution of warm and moist atmospheric flow to a record minimum July sea ice extent of the Arctic in 2020, The Cryosphere, 16, 1107–1123, https://doi.org/10.5194/tc-16-1107-2022, 2022.
Lukovich, J. V., Stroeve, J. C., Crawford, A., Hamilton, L., Tsamados, M., Heorton, H., and Massonnet, F.: Summer Extreme Cyclone Impacts on Arctic Sea Ice, J. Climate, 34, 4817–4834, 2021.
Ma, W., Chen, G., Peings, Y., and Alviz, N.: Atmospheric river response to Arctic sea ice loss in the Polar Amplification Model Intercomparison Project, Geophys. Res. Lett., 48, e2021GL094883, https://doi.org/10.1029/2021GL094883, 2021.
Mayer, M., Tietsche, S., Haimberger, L., Tsubouchi, T., Mayer, J., and Zuo, H.: An Improved Estimate of the Coupled Arctic Energy Budget, J. Climate, 32, 7915–7934, 2019.
Mortin, J., Svensson, G., Graversen, R. G., Kapsch, M.-L., Stroeve, J. C., and Boisvert, L. N.: Melt onset over Arctic sea ice controlled by atmospheric moisture transport, Geophys. Res. Lett., 43, 6636–6642, https://doi.org/10.1002/2016GL069330, 2016.
Nash, D., Waliser, D., Guan, B., Ye, H., and Ralph, F. M.: The role of atmospheric rivers in extratropical and polar hydroclimate, J. Geophys. Res.-Atmos., 123, 6804– 6821, https://doi.org/10.1029/2017JD028130, 2018.
Notz, D. and SIMIP Community: Arctic sea ice in CMIP6, Geophys. Res. Lett., 47, e2019GL086749, https://doi.org/10.1029/2019GL086749, 2020.
Olonscheck, D., Mauritsen, T., and Notz, D.: Arctic sea-ice variability is primarily driven by atmospheric temperature fluctuations, Nat. Geosci., 12, 430–434, https://doi.org/10.1038/s41561-019-0363-1, 2019.
Overland, J. E. and Wang, M.: The 2020 Siberian heat wave, Int. J. Climatol., 41 (Suppl. 1), E2341–E2346, https://doi.org/10.1002/joc.6850, 2021.
Papritz, L., Hauswirth, D., and Hartmuth, K.: Moisture origin, transport pathways, and driving processes of intense wintertime moisture transport into the Arctic, Weather Clim. Dynam., 3, 1–20, https://doi.org/10.5194/wcd-3-1-2022, 2022.
Parkinson, C. L. and Comiso, J. C.: On the 2012 record low Arctic sea ice cover: Combined impact of preconditioning and an August storm, Geophys. Res. Lett., 40, 1356– 1361, https://doi.org/10.1002/grl.50349, 2013.
Peng, G., Matthews, J. L., Wang, M., Vose, R., and Sun, L.: What Do Global Climate Models Tell Us about Future Arctic Sea Ice Coverage Changes?, Climate, 8, 15, https://doi.org/10.3390/cli8010015, 2020.
Ralph, F. M., Rutz, J. J., Cordeira, J. M., Dettinger, M., Anderson, M.. Reynolds, D., Schick, L. J., and Smallcomb, C.: A Scale to Characterize the Strength and Impacts of Atmospheric Rivers, B. Am. Meteorol. Soc., 100, 269–289, 2019.
Renfrew, I. A., Barrell, C., Elvidge, A. D., Brooke, J. K., Duscha, C., King, J. C., Kristiansen, J., Lachlan Cope, T., Moore, G. W. K., Pickart, R. S., Reuder, J., Sandu, I., Sergeev, D., Terpstra, A., Vague, K., and Weiss, A.: An evaluation of surface meteorology and fluxes over the Iceland and Greenland Seas in ERA5 reanalysis: The impact of sea ice distribution, Q. J. Roy. Meteor. Soc., https://doi.org/10.1002/qj.3941, 2020.
Simmonds, I. and Rudeva, I.: The great Arctic cyclone of August 2012, Geophys. Res. Lett., 39, L23709, https://doi.org/10.1029/2012GL054259, 2012.
Stern, D. P., Doyle, J. D., Barton, N. P., Finocchio, P. M., Komaromi, W. A., and Metzger, E. J.: The Impact of an Intense Cyclone on Short‐Term Sea Ice Loss in a Fully Coupled Atmosphere‐Ocean‐Ice Model, Geophys. Res. Lett., 47, e2019GL085580, https://doi.org/10.1029/2019GL085580, 2020.
Tjernström, M., Shupe, M. D., Brooks, I. M., Persson, P. O. G., Prytherch, J., Salisbury, D. J., Sedlar, J., Achtert, P., Brookes, B. J., Johnston, P. E., Sotiropoulou, G., and Wolfe, D.: Warm-air advection, air mass transformation and fog causes rapid ice melt, Geophys. Res. Lett., 42, 5594–5602, https://doi.org/10.1002/2015GL064373, 2015.
Tjernström, M., Shupe, M. D., Brooks, I. M., Achtert, P., Prytherch, J., and Sedlar, J.: Arctic Summer Airmass Transformation, Surface Inversions, and the Surface Energy Budget, J. Climate, 32, 769–789, 2019.
Vázquez, M., Algarra, I., Eiras-Barca, J., Ramos, A. M., Nieto, R., and Gimeno, L.: Atmospheric Rivers over the Arctic: Lagrangian Characterisation of Their Moisture Sources, Water, 11, 41, https://doi.org/10.3390/w11010041, 2019.
Wang, Z., Walsh, J., Szymborski, S., and Peng, M.: Rapid arctic sea ice loss on the synoptic time scale and related atmospheric circulation anomalies, J. Climate, 33, 1597–1617, 2020.
Wernli, H. and Papritz, L.: Role of polar anticyclones and mid-latitude cyclones for Arctic summertime sea-ice melting, Nat. Geosci., 11, 108–113, https://doi.org/10.1038/s41561-017-0041-0, 2018.
Woods, C. and Caballero, R.: The Role of Moist Intrusions in Winter Arctic Warming and Sea Ice Decline, J. Climate, 29, 4473–4485, 2016.
Woods, C., Caballero, R., and Svensson, G.: Representation of Arctic Moist Intrusions in CMIP5 Models and Implications for Winter Climate Biases, J. Climate, 30, 4083–4102, 2017.
Zhang, J., Lindsay, R., Schweiger, A., and Steele, M.: The impact of an intense summer cyclone on 2012 Arctic sea ice retreat, Geophys. Res. Lett., 40, 720–726, 2013.
Zhu, Y. and Newell, R. E.: A Proposed Algorithm for Moisture Fluxes from Atmospheric Rivers, Mon. Weather Rev., 126, 725–735, 1998.