the Creative Commons Attribution 4.0 License.
the Creative Commons Attribution 4.0 License.
 | 08 Dec 2021
Perspectives on future sea ice and navigability in the Arctic
Jinlei Chen
Shichang Kang
Wentao Du
Junming Guo
Min Xu
Yulan Zhang
Xinyue Zhong
Wei Zhang
Jizu Chen
The retreat of sea ice has been found to be very significant in the Arctic under global warming. It is projected to continue and will have great impacts on navigation. Perspectives on the changes in sea ice and navigability are crucial to the circulation pattern and future of the Arctic. In this investigation, the decadal changes in sea ice parameters were evaluated by the multi-model from the Coupled Model Inter-comparison Project Phase 6, and Arctic navigability was assessed under two shared socioeconomic pathways (SSPs) and two vessel classes with the Arctic transportation accessibility model. The sea ice extent shows a high possibility of decreasing along SSP5-8.5 under current emissions and climate change. The decadal rate of decreasing sea ice extent will increase in March but decrease in September until 2060, when the oldest ice will have completely disappeared and the sea ice will reach an irreversible tipping point. Sea ice thickness is expected to decrease and transit in certain parts, declining by −0.22 m per decade after September 2060. Both the sea ice concentration and volume will thoroughly decline at decreasing decadal rates, with a greater decrease in volume in March than in September. Open water ships will be able to cross the Northern Sea Route and Northwest Passage between August and October during the period from 2045 to 2055, with a maximum navigable percentage in September. The time for Polar Class 6 (PC6) ships will shift to October–December during the period from 2021 to 2030, with a maximum navigable percentage in October. In addition, the central passage will be open for PC6 ships between September and October during 2021–2030.
- Article
(6343 KB) - Full-text XML
- BibTeX
- EndNote


The Arctic has experienced significant warming since the 1970s (Connolly et al., 2017). Along with the increasing surface air temperature, Arctic communities have experienced unprecedented changes, such as reduction of sea ice extent and thickness, loss of the Greenland ice sheet, decrease in snow coverage, and thawing of permafrost (Biskaborn et al., 2019; Box et al., 2019; Brown et al., 2017; Loomis et al., 2019). The sea ice extent has declined at a rate of approximately 3.8 % per decade. In comparison, perennial ice had a higher proportion of loss of approximately 11.5 % per decade during the period from 1979 to 2012 (Comiso and Hall, 2014). The average ice thickness near the end of the melt season decreased by 2.0 m or 66 % between the pre-1990 submarine period (1958–1976) and the CryoSat-2 period (2011–2018) (Kwok, 2018). Continued declines in sea ice have been projected by the Coupled Model Inter-comparison Project Phase 5 in the Arctic through the end of the century (Meredith et al., 2019).
Sea ice reflects a significant fraction of the solar radiation because it has a high albedo. It also reduces the heat transfer between the ocean and the atmosphere as it acts as an insulator (Screen and Simmonds, 2010). With the retreat of sea ice, thermohaline circulation has changed (Jourdain et al., 2017), and global warming has intensified (Abe et al., 2016). However, climate change has led to prolonged open water conditions and large-scale Arctic shipping that will involve ice channels (Barnhart et al., 2015; Huang et al., 2020a). The Northern Sea Route (NSR) extends along the northern coast of Eurasia from Iceland to the Bering Strait, which shortens the transit distance by approximately 15 %–50 % relative to the southern routes through the Suez Canal (Buixadé Farré et al., 2014). It is navigable for approximately 3 months per year for ice-strengthened ships at the end of summer and the beginning of autumn (Yu et al., 2021). The end of shipping season for open water (OW) vessels has reached 24 October since 2010 (Chen et al., 2019). However, navigability is still affected by the ice regime, such as ice thickness and concentration, around the Severnaya Zemlya islands, the Novosibirsk islands, and the East Siberian Sea. The Northwest Passage (NWP) follows the northern coast of North America and crosses the Canadian Arctic archipelago. Compared to the traditional Panama Canal route from western Europe to the Far East, the NWP shortens the transit distance by 9000 km (Howell and Yackel, 2004). The shortest navigable period was up to 69 d during 2006–2015 (Liu et al., 2017), and the first time of its being completely free of ice was reported to occur in September 2007 (Cressey, 2007). Geographical and political factors also pose some challenges to the navigability of passages and choice of routes (Ryan et al., 2020). The straits along the NWP are at times narrow and shallow, which are easily clogged by free floating ice. NSR is greater than NWP in terms of geography, while it still has several choke points where ships must pass through shallow straits between islands and the Russian mainland (Ostreng et al., 2013). Apart from the geographical factor, the various organizations and groups formed between the surrounding Arctic nations, as well as the disputes and agreements, give impetuses for adopting the NSR. Russia has committed several large infrastructure projects to support the NSR, such as the Yamal-Nenets railway and emergency rescue centers (Serova and Serova, 2019). China, which is characterized as a near-Arctic state, also outlined the plans to build a Polar Silk Road by building infrastructure and conducting trial voyages (Tillman et al., 2019). For the development of socioeconomics and marine transportation, future projections of ice conditions and Arctic passages are increasingly important, for which climatic changes should be considered (Gascard et al., 2017). Smith and Stephenson (2013) investigated the potential of Arctic passages under representative concentration pathway (RCP) 4.5 and RCP 8.5 and found that OW ships and Polar Class 6 (PC6) ships (Table 1) will be able to cross NSR and NWP in September by the mid-century, respectively. The areas of the Arctic accessible to PC3, PC6, and OW ships would rise to 95 %, 78 %, and 49 %, respectively, of the circumpolar International Marine Organization Guidelines Boundary area by the late 21st century (Stephenson et al., 2013). Melia et al. (2017) suggested that the Arctic passages from Europe to Asia would be 10 d faster than conventional routes by the mid-century and 13 d faster by the late century. Recent research has shown that NSR might be accessible earlier for OW ships in September 2021–2025, and the navigable window would extend to August–October during 2026–2050 under shared socioeconomic pathways (SSPs) 2–4.5 (Chen et al., 2020). However, evaluating sea ice conditions and Arctic navigability by a single climate model, even one with a higher resolution, is insufficient.
This prospective study was designed to obtain further insight into the future changes in sea ice in the Arctic and the navigability of the Arctic during this century with up-to-date ensemble climate models in the Coupled Model Inter-comparison Project Phase 6 (CMIP6). To reduce uncertainties of a single high-resolution model and multi-model average, models were filtered by comparing the historical simulations and observations of sea ice extent, and the possible SSPs were investigated with the average of multiple models. The distributions of the linear trend of sea ice extent, concentration, and thickness were explored in three stages (2021–2040, 2041–2060, and 2061–2100). In addition, the changes in sea ice volume and age were analyzed. The accessibility of the Arctic and the navigable area were evaluated with the Arctic Transportation Accessibility Model (ATAM) from the Arctic Ice Regime Shipping System (AIRSS) for OW ships and PC6 ships under SSP2–45 and SSP5–85 in 2021–2030 and 2045–2055.
2.1 Data and model selection
The new scenario framework SSP in CMIP6 was designed to carry out research on climate change impacts and adaption by combining pathways of future radiative forcing and climate changes with socioeconomic development (O'Neill et al., 2014). SSP1 indicates a sustainable development, which proceeds at a reasonably high pace. Technological change is rapid, and inequalities are lessened and directed toward environmentally friendly processes. Unmitigated emissions are high in SSP3. It is due to a rapidly growing population, moderate economic growth, and slow technological change in the energy sector. SSP2 is an intermediate case between SSP1 and SSP3. SSP5 occurs in the absence of climate policies, energy demand is high, and most of this demand is met with carbon-based fuels.
Compared with CMIP5 models, the CMIP6 multi-model ensemble mean provides a more realistic estimate of the Arctic sea ice extent (SIMIP Community, 2020), but the biases of the models are still large (Shu et al., 2020). This study selected models by comparing the historical trend of Arctic sea ice extent in simulations with remote sensing observations during 1979–2012. The observation data come from the Sea Ice Index of the National Snow and Ice Data Center. The selected models are those that have a correlation coefficient between the original simulations and observations greater than 0.8 (0.7 for March). Five-point moving averages of the simulated and observed sea ice extent are displayed in Fig. 1. The models passing the test are CESM2, MPI-ESM1-2-HR, MPI-ESM1-2-LR, NorESM2-LM, NorESM2-MM, ACCESS-ESM1-5, AWI-CM-1-1-MR, and AWI-ESM-1-1-LR in September and CESM2, MPI-ESM1-2-LR, ACCESS-ESM1-5, AWI-CM-1-1-MR, INM-CM5-0, MPI-ESM-1-2-HAM, and AWI-ESM-1-1-LR in March. The mean of the selected models corresponds well with the observations, and the correlation coefficients are 0.884 and 0.817 in September and March, respectively. However, sea ice datasets in SSP1-2.6, SSP2-4.5, SSP3-7.0, and SSP5-8.5 after 2020 have not been released for CESM2, MPI-ESM-1-2-HAM, and AWI-ESM-1-1-LR until now. In addition, AWI-CM-1-1-MR was excluded from analyzing the navigability of the Arctic in the absence of sea ice concentration. The spatial resolution of monthly sea ice concentration and thickness was normalized to by bilinear interpolation. Variables in figures and tables were from the ensemble means of selected models.
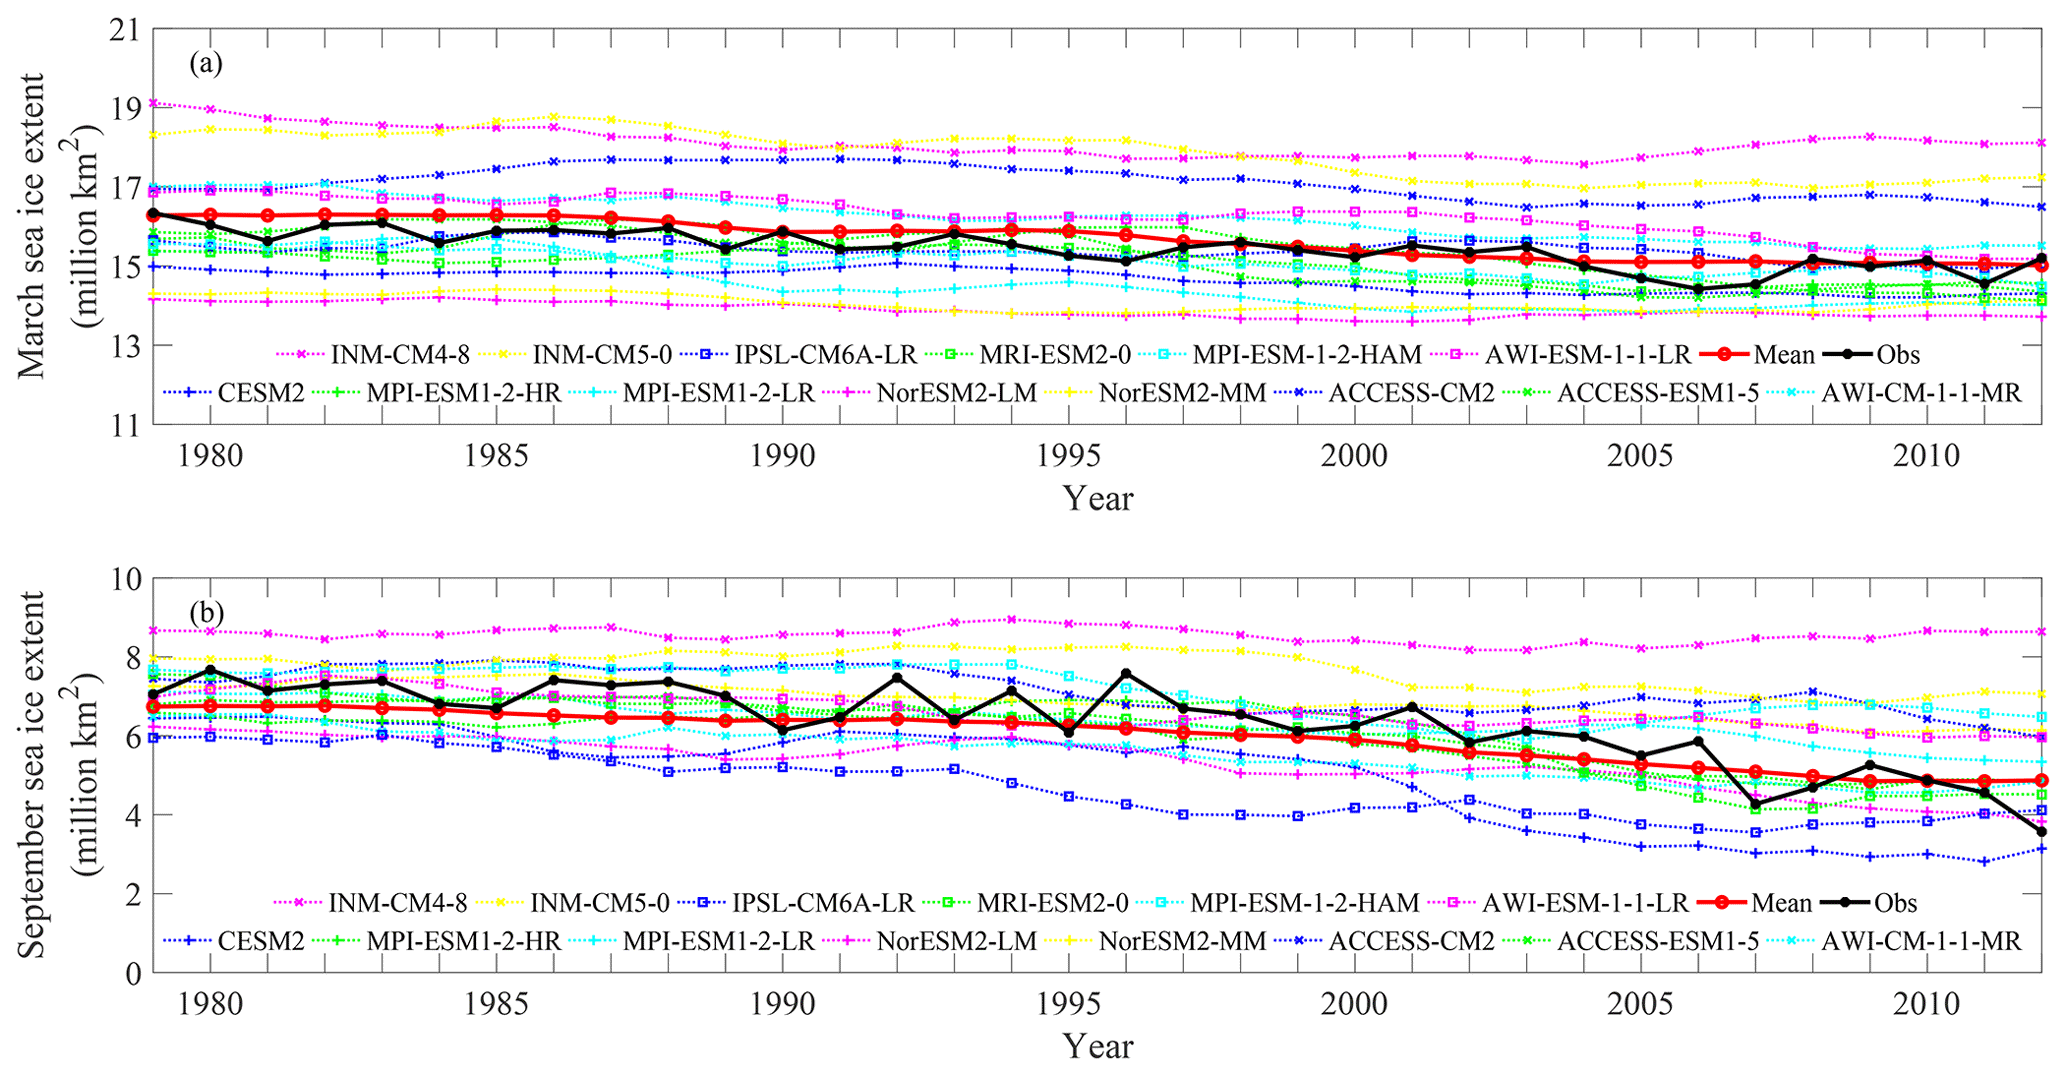
Figure 1The observations and five-point moving averages of sea ice extent in March and September during 1979–2012.
2.2 Accessibility evaluation
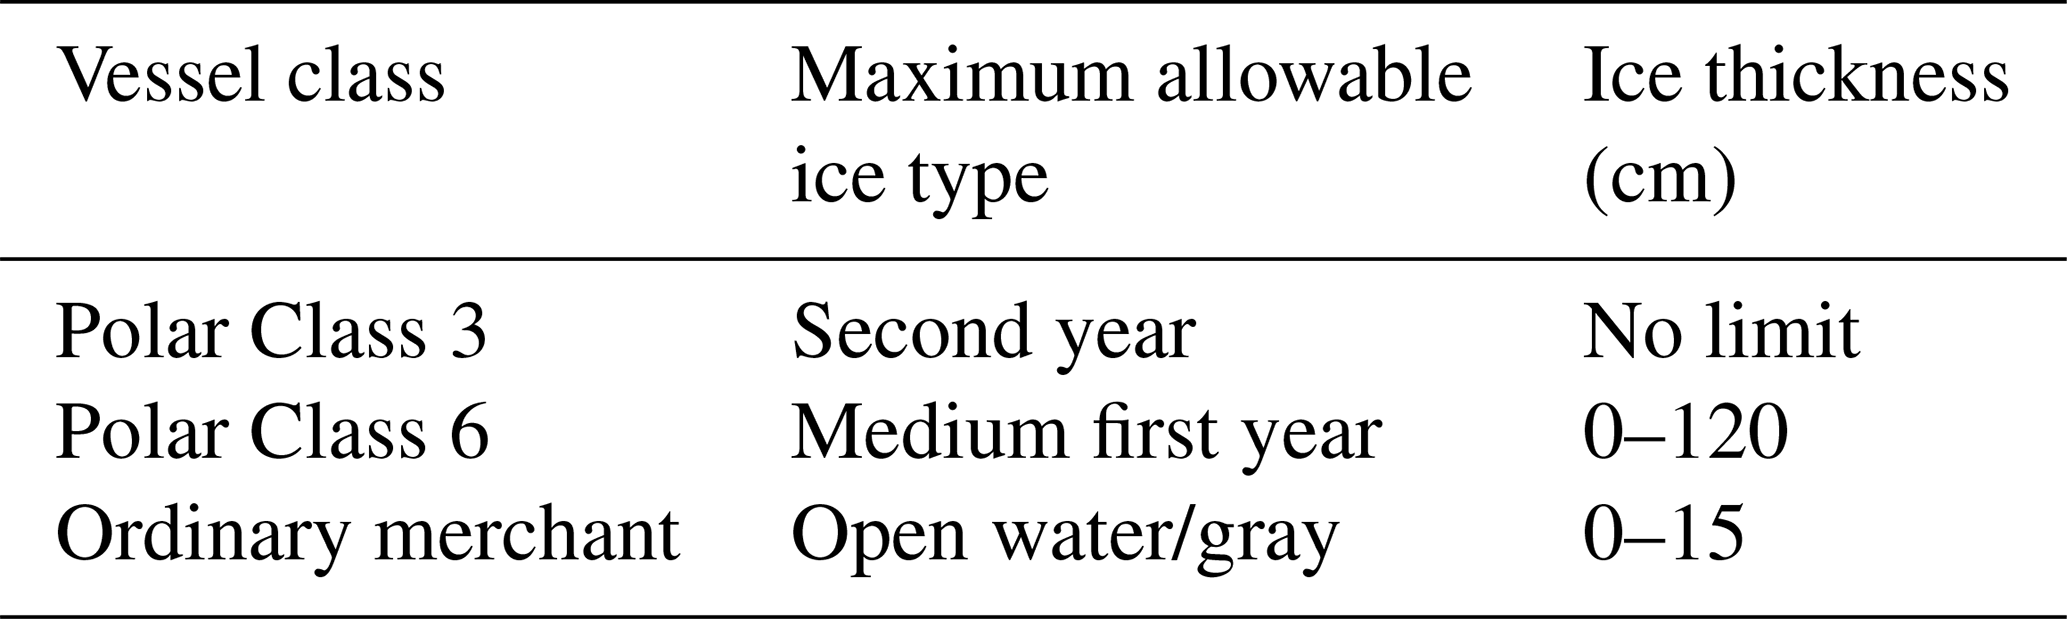
Safety and pollution are two of the opposite factors considered in developing regulatory transport standards. AIRSS was designed to minimize the risk of pollution in the Arctic due to damage to vessels by ice (Transport Canada, 1998). ATAM, developed by AIRSS, is commonly used to quantify the temporal and spatial accessibility in the Arctic, in which the ice number (IN) represents the ability of a ship to enter ice-covered water:
where Ca is the sea ice concentration in grid a. IMa is the ice multiplier. It indicates the severity of each ice type for the vessel and ranges from −4 to 2. Positive IM and IN represent less risk to the vessel and a safe region for navigation, respectively. Vessel class reflects the structural strength, displacement, and power of a ship to break ice. PC6 ships and OW ships are vessels with moderate ice strengthening and without ice strengthening, respectively (IMO, 2002). In this paper, the navigability of the Arctic for these two kinds of ships was investigated under SSP2-45 and SSP5-85. The corresponding IMs for the OW and PC6 ships are as follows (SIT signifies sea ice thickness):
3.1 Future changes in sea ice area and extent
The extent and area are the most reliable products of sea ice from satellite retrieval (Comiso, 2012; Notz, 2014). Therefore, the sea ice extent was taken as an indicator to evaluate models and future scenarios. As shown in Fig. 2, the observation trend was made with least square regression of sea ice extent from 1979 to 2019, in which sea ice might completely disappear in September after 2073. In addition to the classical pathways, such as SSP1-2.6, SSP2-4.5, and SSP5-8.5, CMIP6 provides a variety of new selections. However, SSP1-1.9, SSP4-34, and SSP4-6.0 were not discussed in the multi-scenario evaluation for the less common models. According to historical development and scenarios, sea ice will retreat in the future with a more significant decreasing trend in September. The difference between SSPs and observation trends is greater in March than in September, while both have large dispersions among pathways after 2050. Compared with others, SSP5-8.5 has the greatest correlation coefficients, which are 0.784 and 0.712 in September and March, respectively, with the observation trend; SSP2-4.5 comes second. This suggests that Arctic sea ice might be the worst scenario in the future under the current emission and climate change trends. The Arctic is regarded as “ice free” when the sea ice area is less than 1 million km2 (Lenton et al., 2019). The extrapolated observed time series suggests “ice free” will occur in September 2060, and ice will almost completely disappear under SSP2-4.5, SSP3-7.0, and SSP5-8.5 by the end of the century.
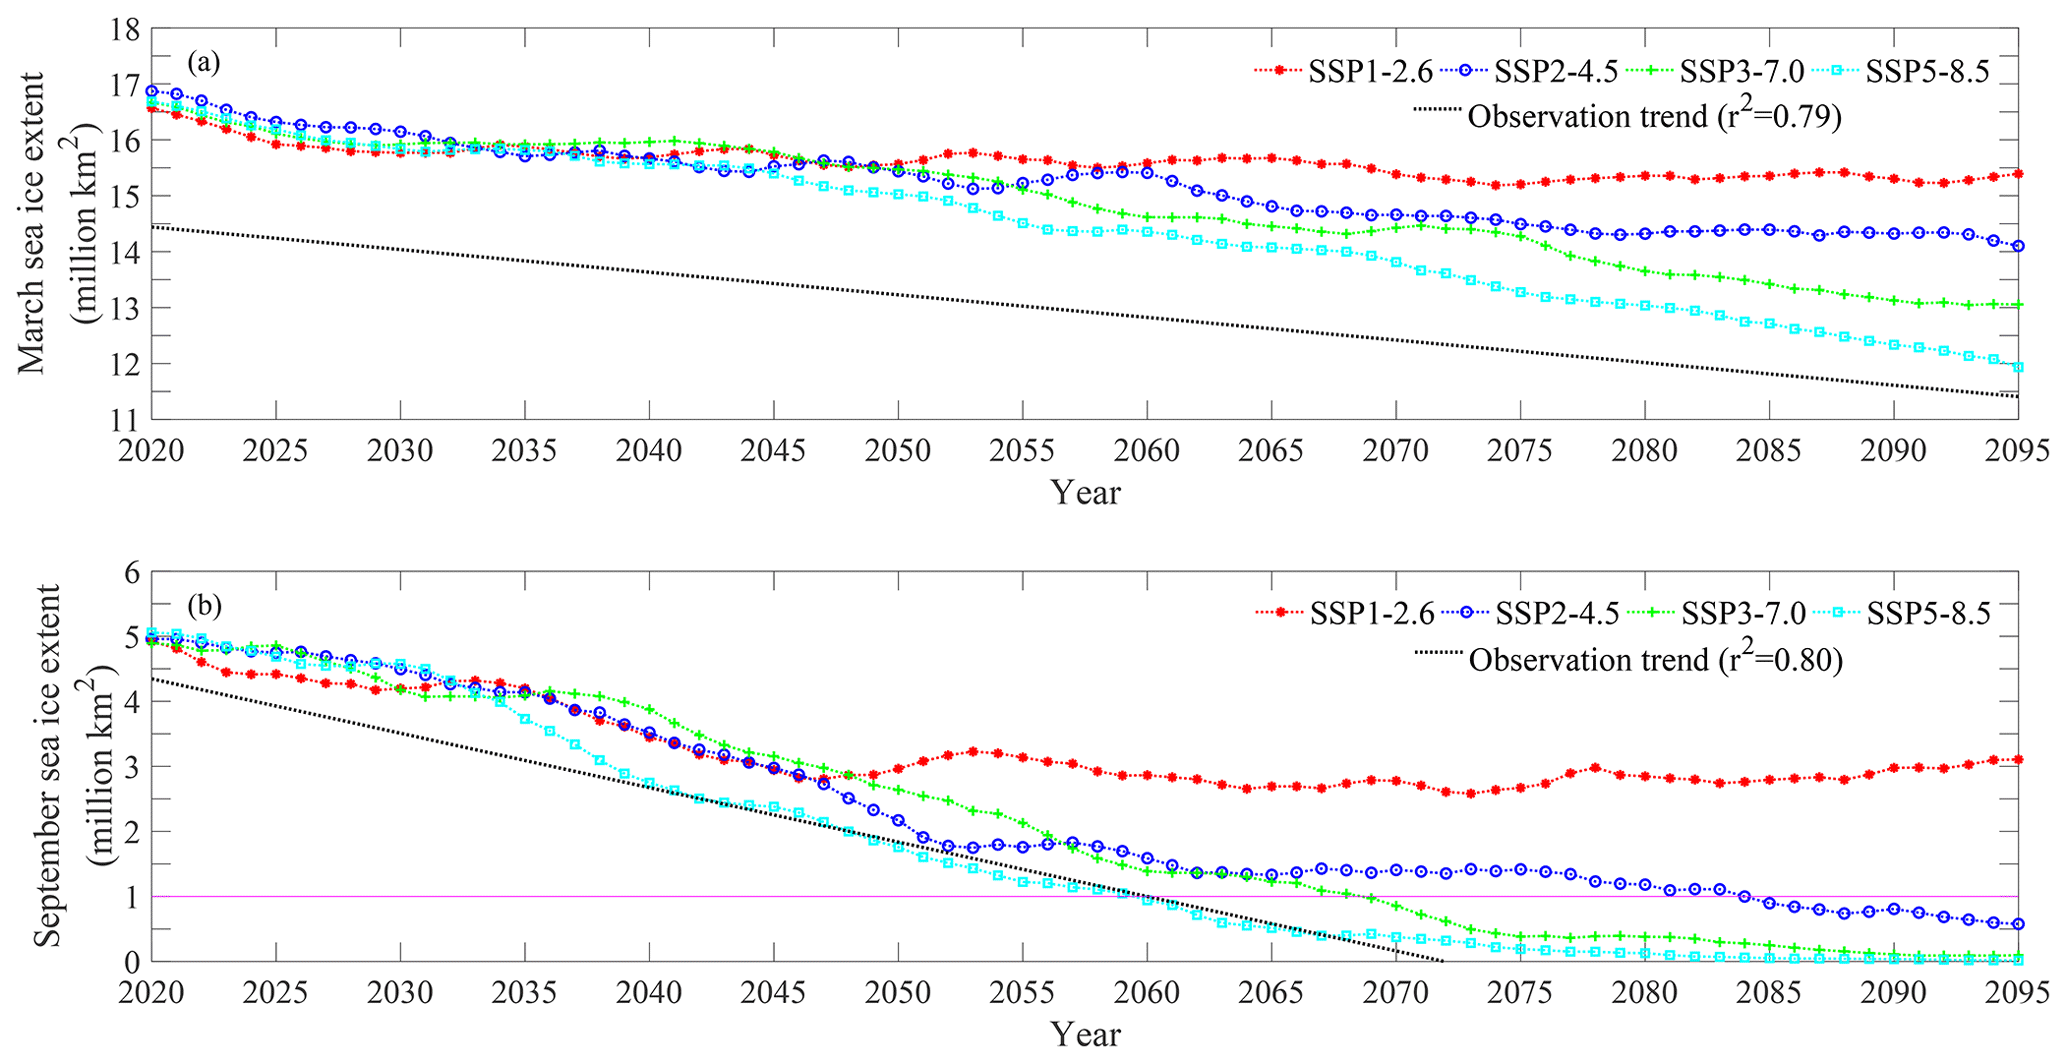
Figure 2Sea ice extent under multiple scenarios and observation trends in March and September.
“Ice free” was taken as one of the tipping points of climate change with significant irreversible effects (Lenton et al., 2019). Three stages were extracted for the changes in sea ice extent in Fig. 3. Decadal linear trends and probability distributions with an interval of 0.4 million km2 per decade were calculated to evaluate the decline in sea ice and the difference in models. Sea ice linear trends are less than zero in both March and September in 2021–2100, while the retreat will be more remarkable in September before 2060, especially during 2021–2040, after which the decline is mainly shown in March because the extent might be close to “ice free” in September. The dispersion of SSPs will increase in March over time, as will the absolute decadal trends of SSP3-7.0 and SSP5-8.5. However, it is aggregated in September, and the decadal variability in SSPs, especially SSP2-4.5 and SSP5-8.5, has a decreasing trend. Multi-model simulations mainly range from −0.8 to 0 million km2 per decade in March, in which the distributions of SSP5-8.5 are chiefly [−0.4, 0), [−0.8, −0.4), and [−0.8, −0.4) million km2 per decade during 2021–2040, 2041–2060, and 2061–2100, respectively. A relatively even distribution is shown in September before the mid-century, while it is concentrated in [−0.4, 0) in the late century. This indicates that the difference among models is still great in September before 2060, while the trends are consistent in 2061–2100.
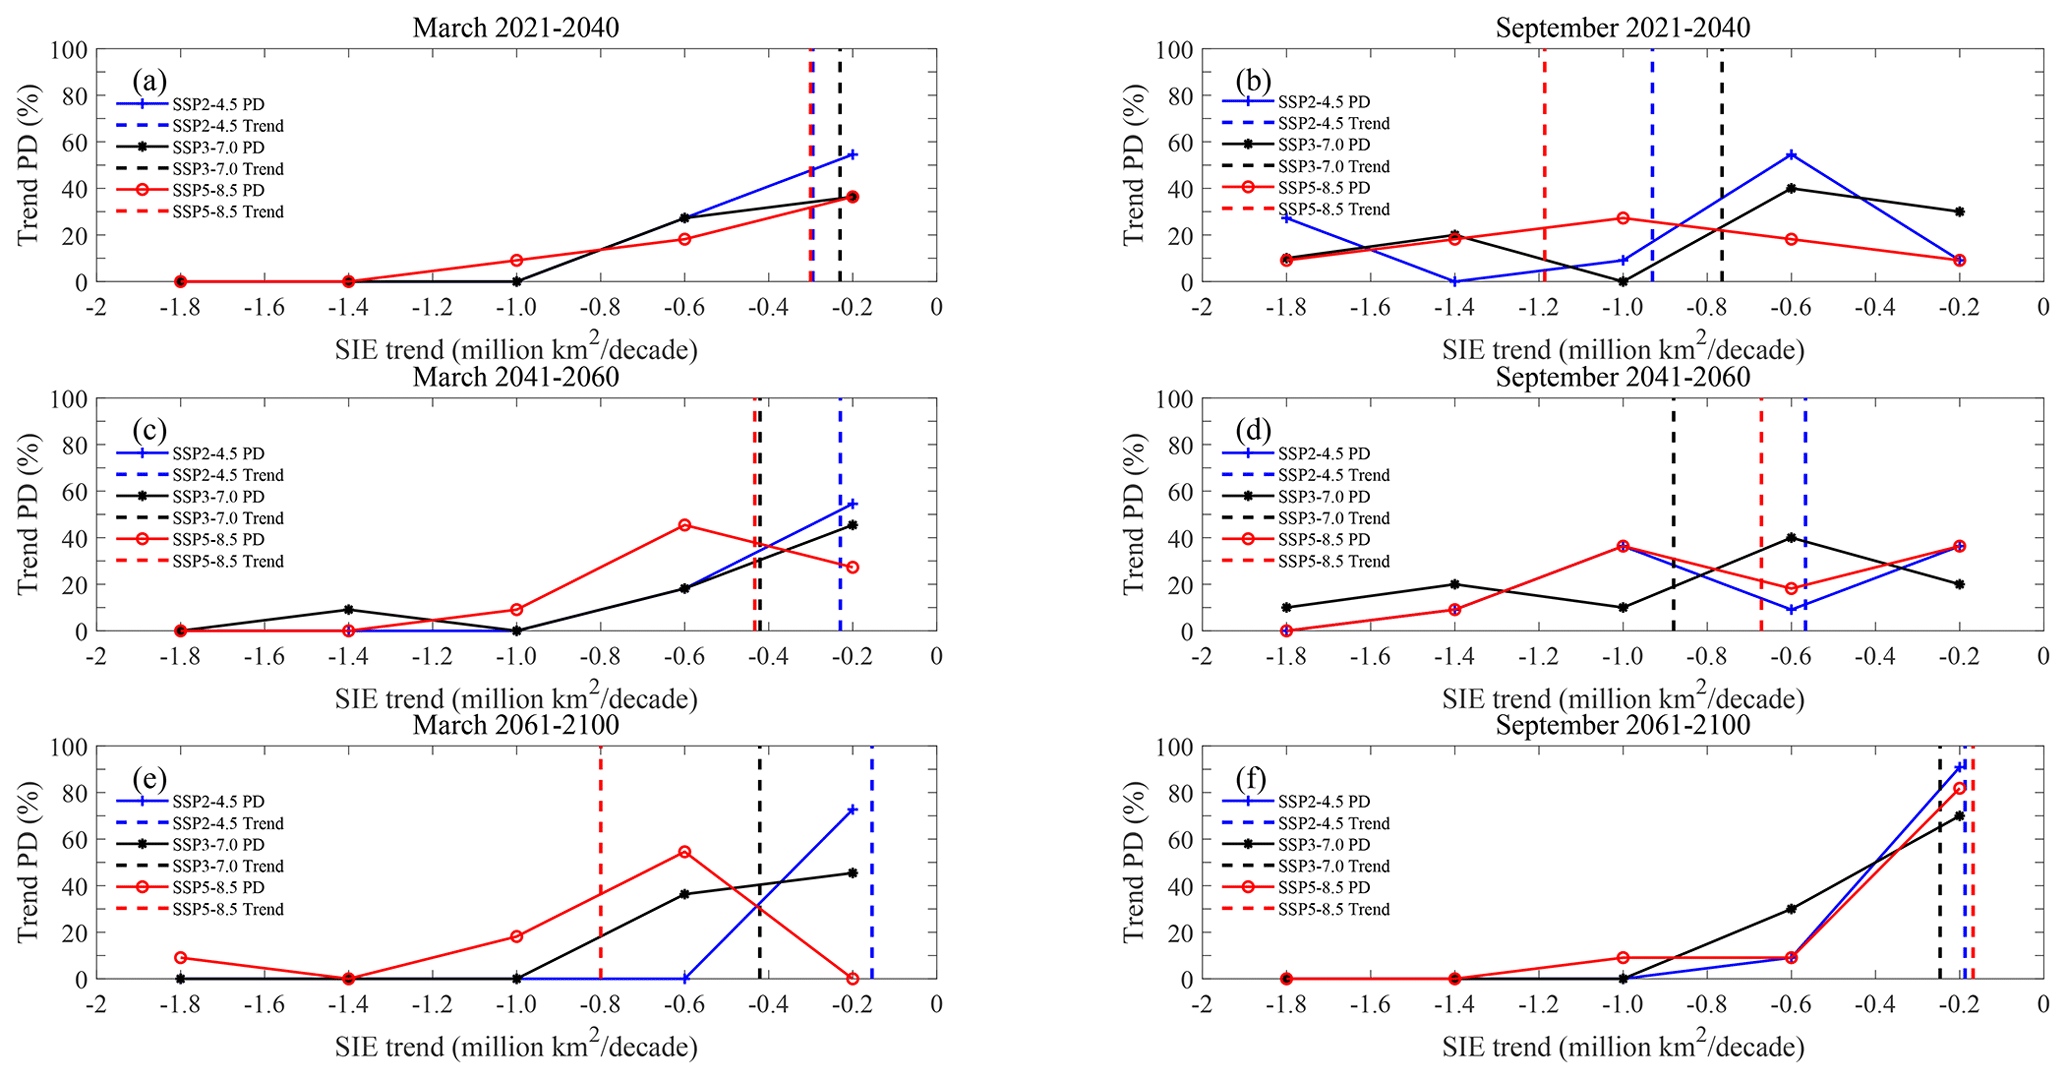
Figure 3Linear trends and probability distributions (PDs) of Arctic sea ice extent (SIE) in March and September.
3.2 Future changes in other sea ice parameters
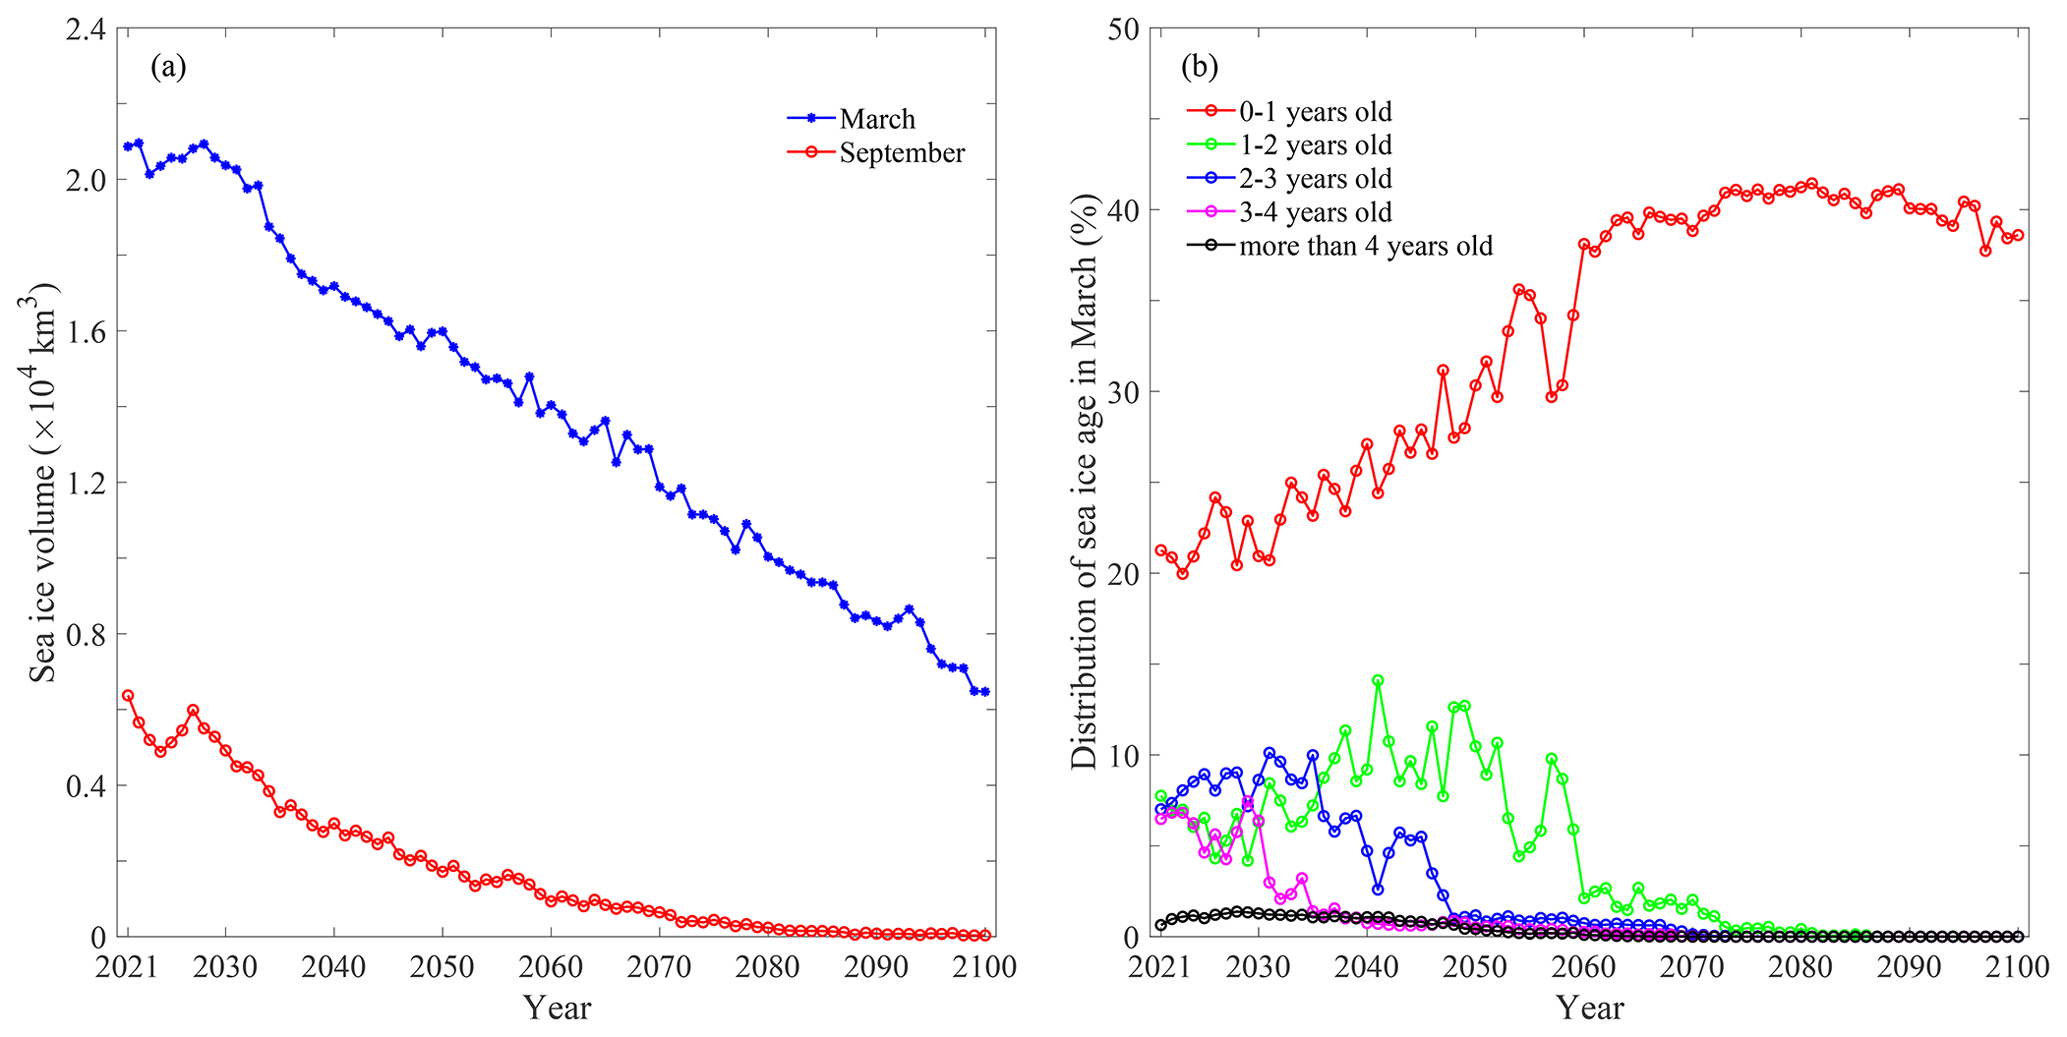
In addition to the extent and area, thickness, concentration, volume, and age are important indicators of changes in sea ice in the future. Figures 4 and 5 show the linear trends of ice thickness and concentration and the changes in sea ice volume and age, respectively, under SSP5-85 in 2021–2100. Ice thickness has a negative trend within the Arctic Archipelago, in coastal water, and in the sector to the north of the Arctic Archipelago and Greenland in September, while the other parts will slightly increase in the next 20 years. The trend is reversed in the Arctic Ocean, and the decreasing area near the shore will extend to the north in 2041–2060, after which almost all sea ice will be reduced with an average trend of −0.22 m per decade in the Arctic. Sea ice concentration will decrease throughout the rest of this century. The significant area is to the north of the Arctic Archipelago and Greenland and the Arctic Basin in September 2021–2040. The extent will shrink, and the decadal linear rate will decrease until the second half of the century, when the rate of decrease will be even and small in the Arctic. The average decadal rates of sea ice concentration are −12.39 %, −6.26 %, and −0.81 % in the three stages. Sea ice volume will decrease in both March and September 2021–2100. The rate of decrease is higher in March, and sea ice might completely disappear in September before 2090. Ice age is also a key descriptor of the state of sea ice cover. Compared to younger ice, older ice tends to be thicker and more resilient to changes in atmospheric and oceanic forcing (Richter-Menge et al., 2019). As displayed in Fig. 5, the oldest ice (>4 years old) currently comprises just a small fraction in March, and it might eventually disappear by approximately the mid-century. With the degeneration of older ice, the extent of the younger ice will increase over a period, such as 3- to 4-year-old ice in the next 10 years, 2- to 3-year-old ice before 2035, and 1- to 2-year-old ice before 2050, after which it will degrade into the next younger ice. First-year ice dominates the sea ice cover in the present and future. It increases mainly before 2060 and remains stable until 2090, after which it starts to decrease due to the lack of supplementation from degraded older ice.
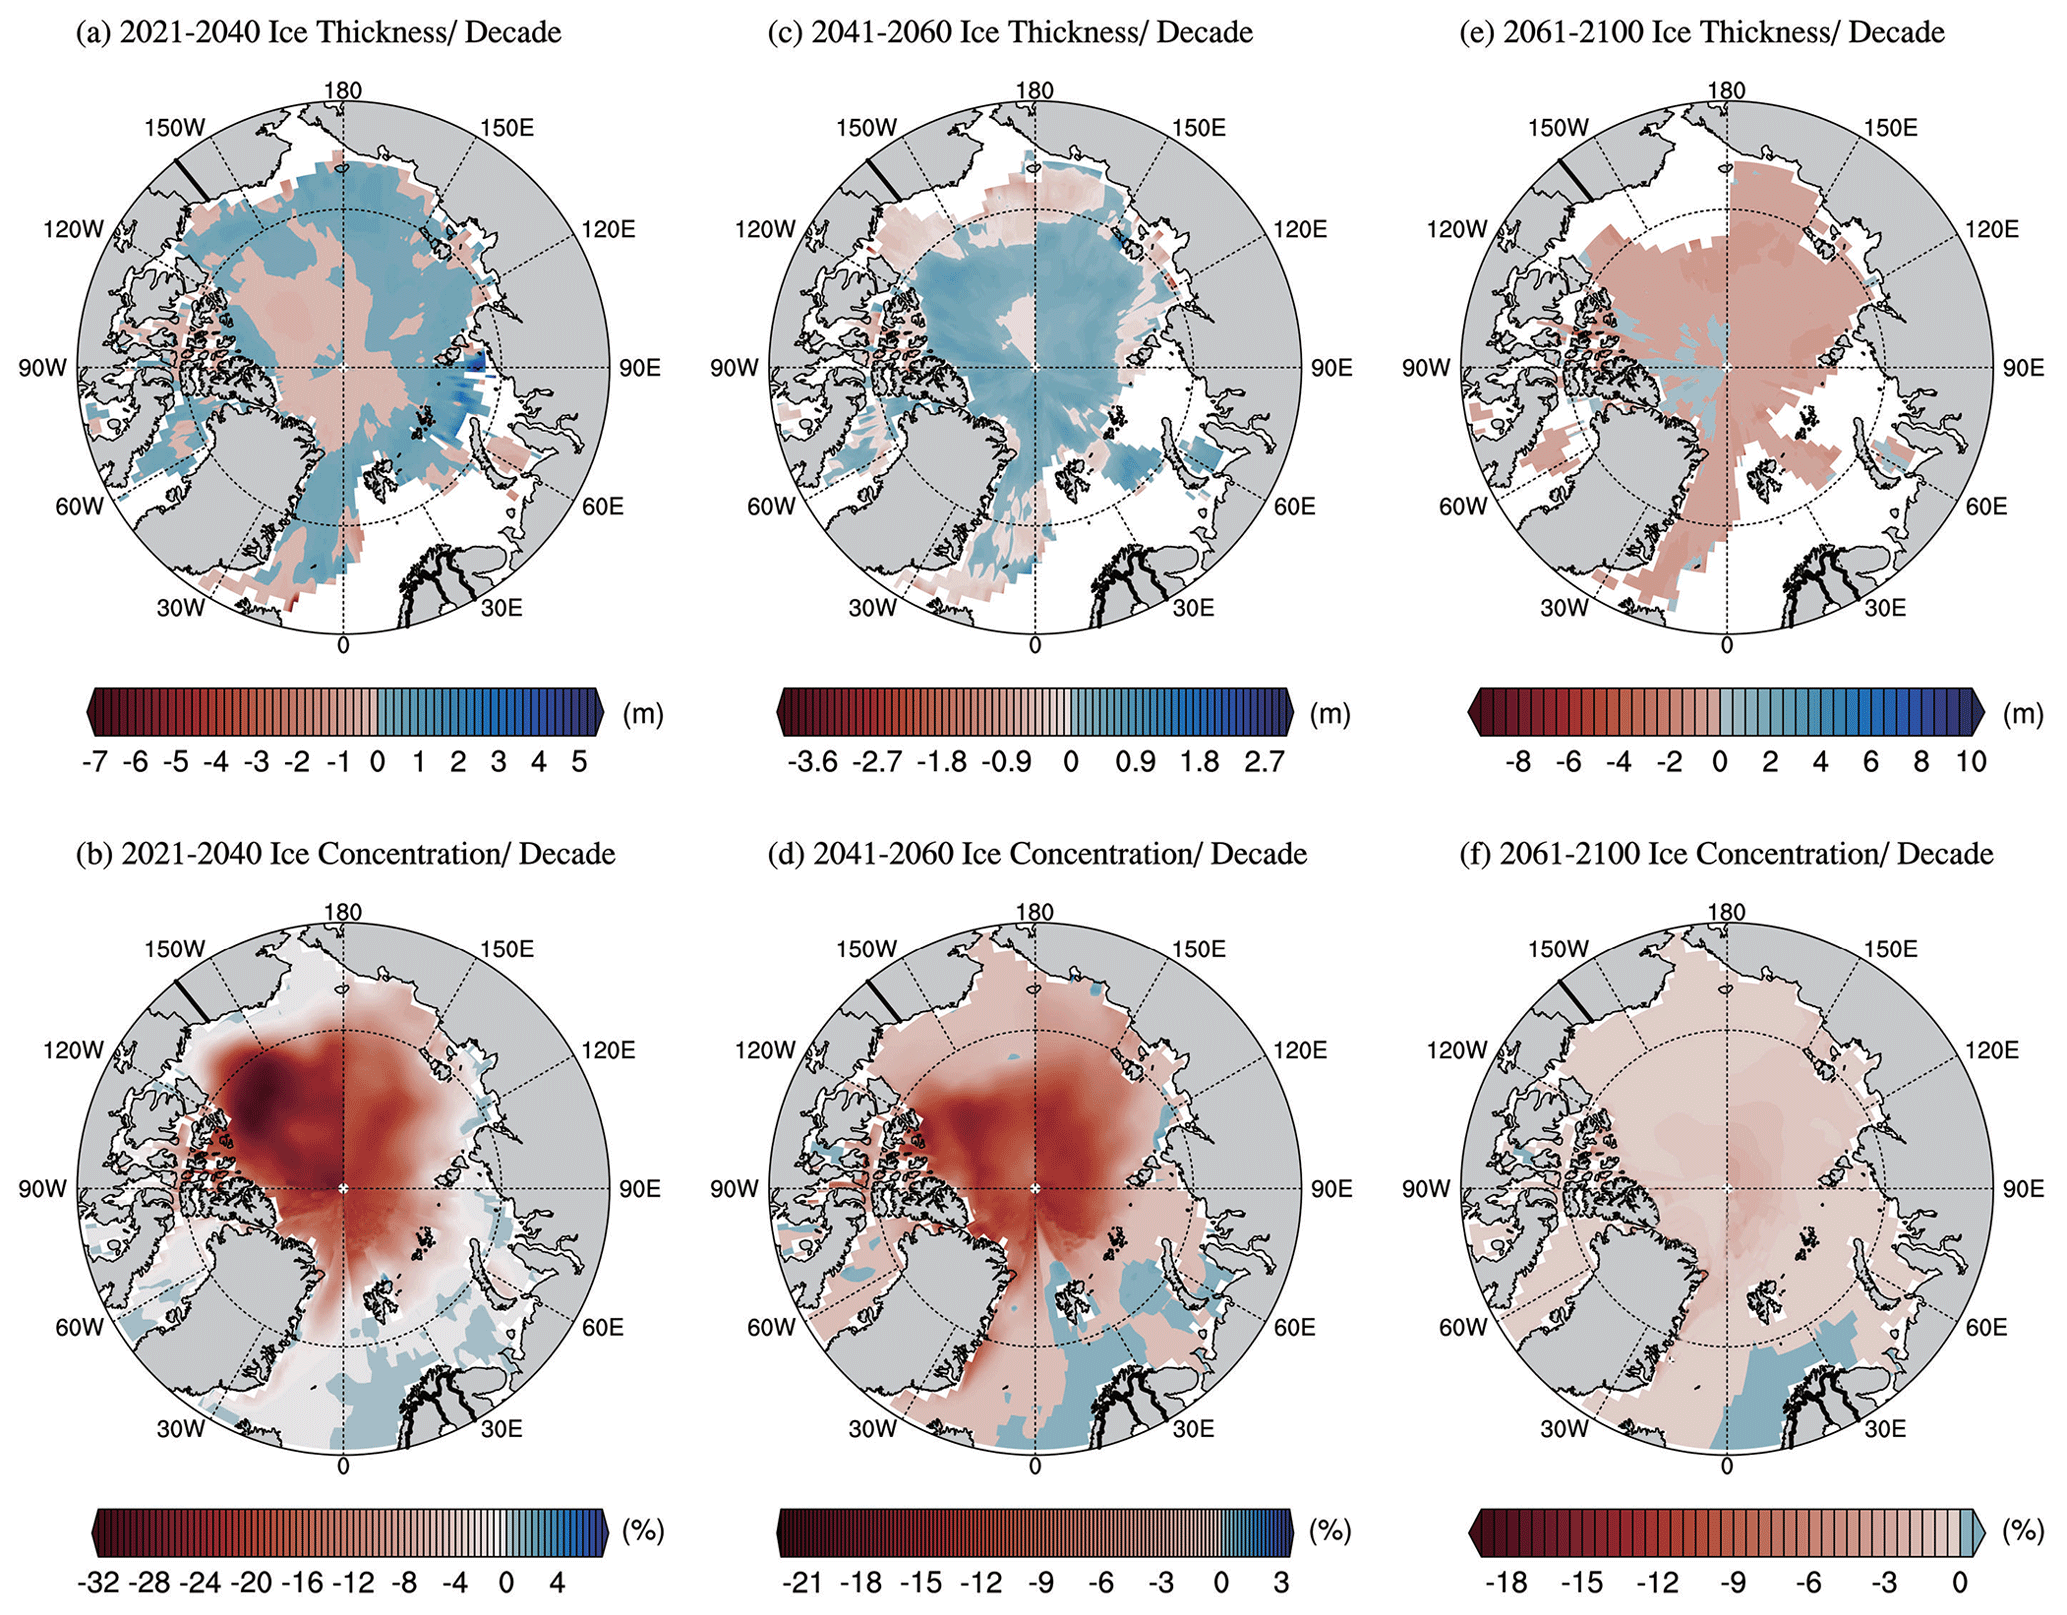
Figure 4Linear trends of sea ice thickness and concentration under SSP5-85 in September.
3.3 Future changes in arctic navigability
With the retreat of sea ice, the possibility for navigation is rising in the Arctic. The opening of passages will be profitable for ocean shipping companies (Chang et al., 2015). The most likely navigable window is in September. Figure 6 shows Arctic accessibility for the OW ships under SSP5-8.5 in September. Panel (a) indicates that the probability of crossing NSR and NWP is low in the next 10 years. The impassable areas for NSR are mainly in the East Siberian Sea and northwestern Laptev Sea, but nearshore waters might be navigable for vessels with shallow drafts. Four crucial straits, the Vilkitsky Strait, Shokalsky Strait, Dmitry Laptev Strait, and Sannikov Strait, are accessible for OW ships. NWP is impassable in the sectors west of Banks Island and Queen Elizabeth Island, as well as the M'Clure Strait, Viscount Melville Sound, Barrow Strait, and Lancaster Strait within the Parry Channel. All routes provided in the Arctic marine shipping assessment report (AMSA, 2009) are under restrictions for OW ships. By the mid-century, both NSR and NWP will open for OW ships under SSP5-8.5 in September.
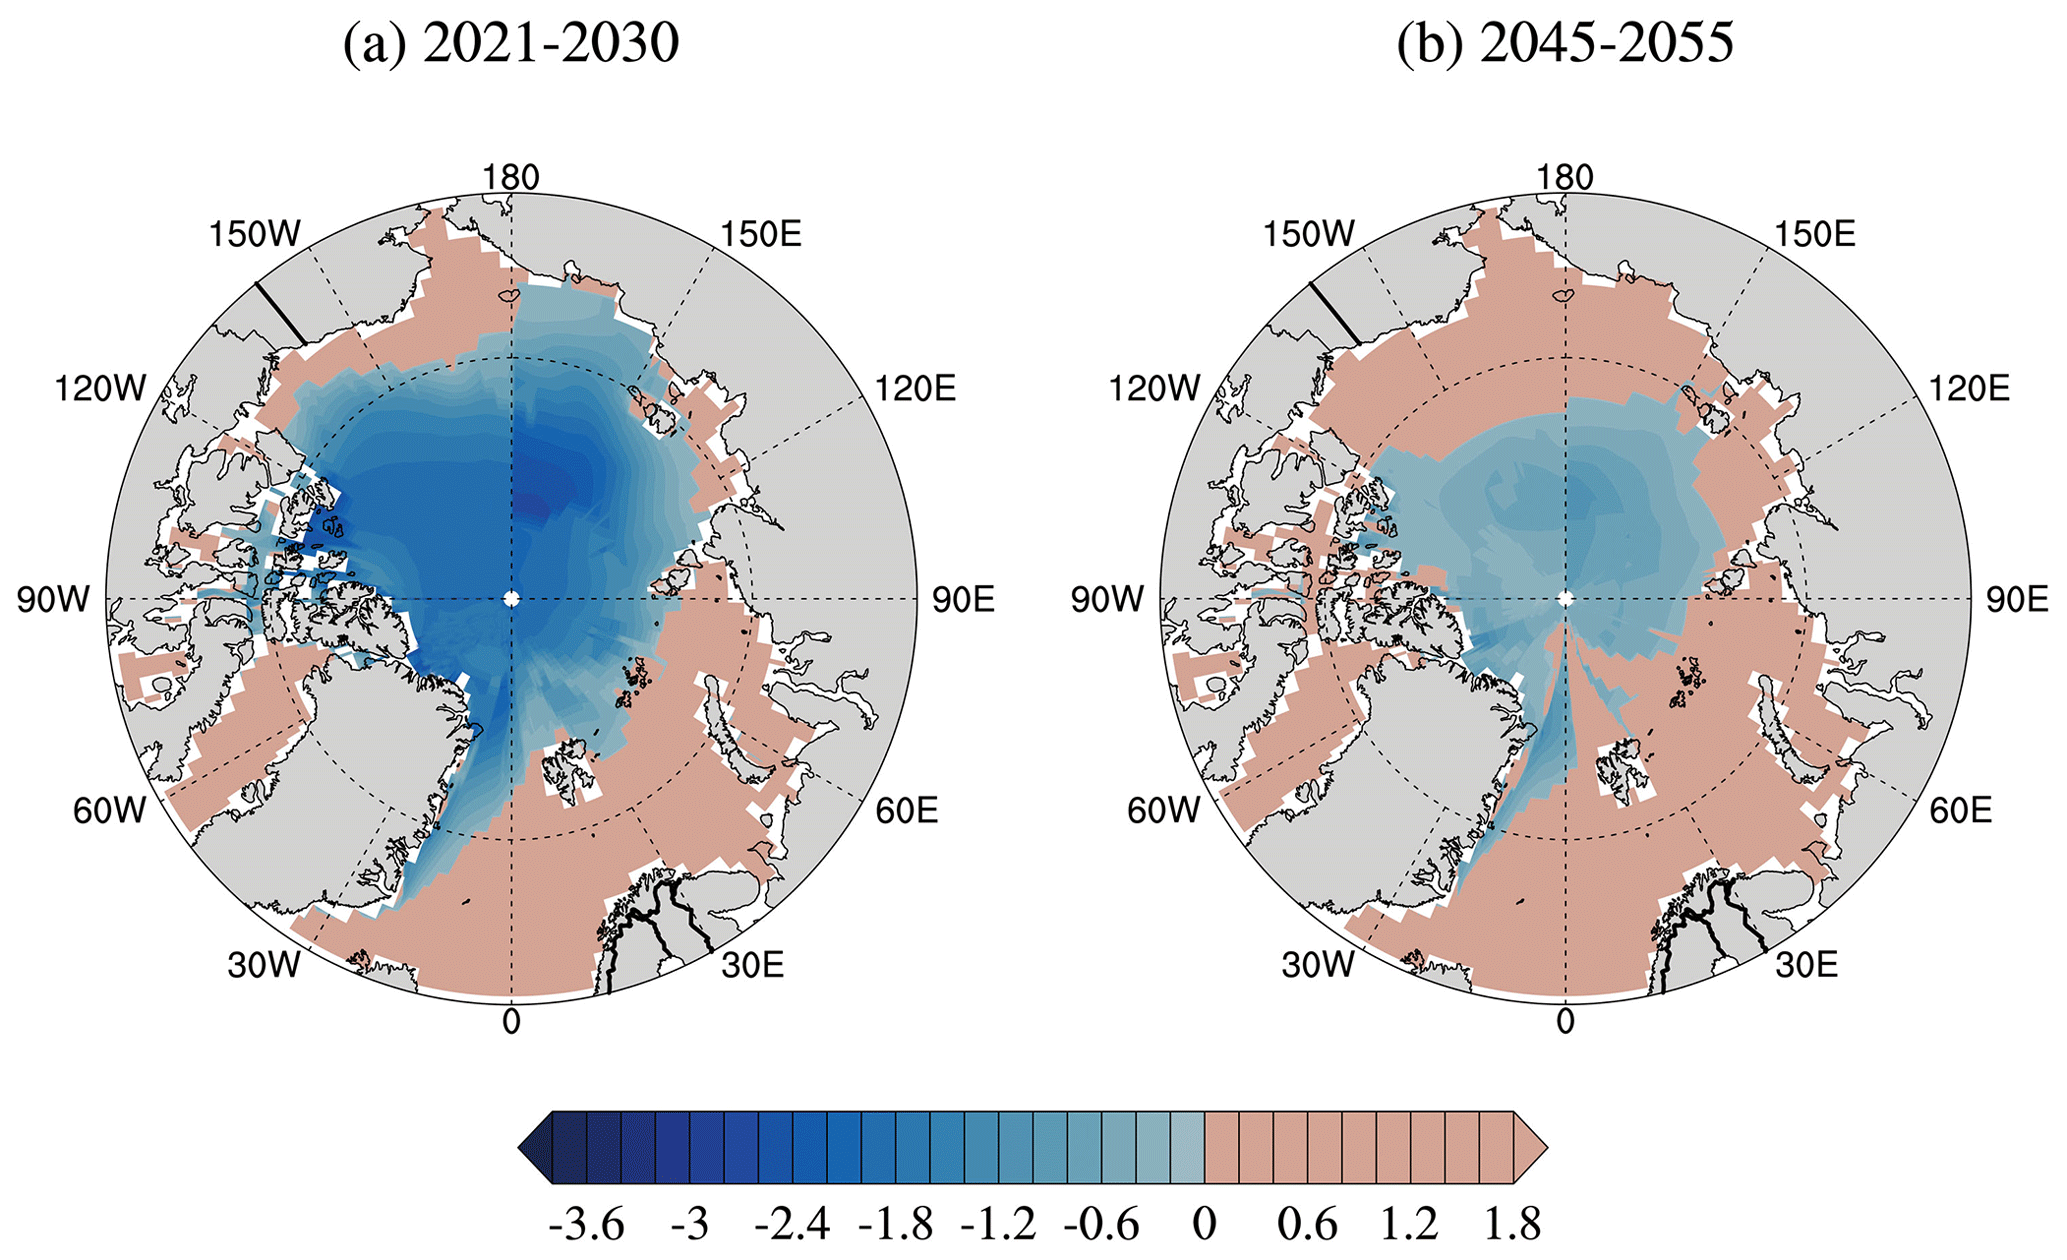
Figure 6INs for OW ships under SSP5-8.5 in September.
The opening of the Arctic passages mainly depends on the connectivity among grid cells, during which the overall navigable potential in a region can be measured by the percentage of accessible grid cells with total grid cells. Figure 7 displays the Arctic navigable grid cells for OW ships and PC6 ships under SSP2-4.5 and SSP5-8.5 in 2021–2030 and 2045–2055. It is the percentage of grid cells in which INs are greater than 0. The totally navigable percentage for OW ships is shown as a unimodal curve in both stages, with the peak in September and the valley in April and March. It is an irregular curve for PC6 ships with the minimum value in June. The maximum values are shown in October 2021–2030, while they will have a range in November and December by the mid-century. Actually, the Arctic would be navigable for PC6 ships from October to December. It is very strange that an abnormal decrease occurs in September in 2045–2055. The navigable grid cells within every 5∘ latitude from 65 to 90∘ N are plotted in Fig. 8 for further study. This indicates that the abnormal point results from the decrease within 80–90∘ N, but the reason is hard to explain. The navigable grid cells are mainly concentrated at 65–75∘ N for OW ships in the next 10 years, and they will extend to 80∘ N by the mid-century. The central passage might be accessible for PC6 ships in September and October, and the open window would be from October to January in 2045–2055. The routes of NSR and NWP are mainly distributed in 70–75∘ N. The possibility for OW ships crossing two passages is low until August–October 2045–2055, while it is high for PC6 ships during October–December 2021–2030, and the open window would extend to August–January in 2045–2055.
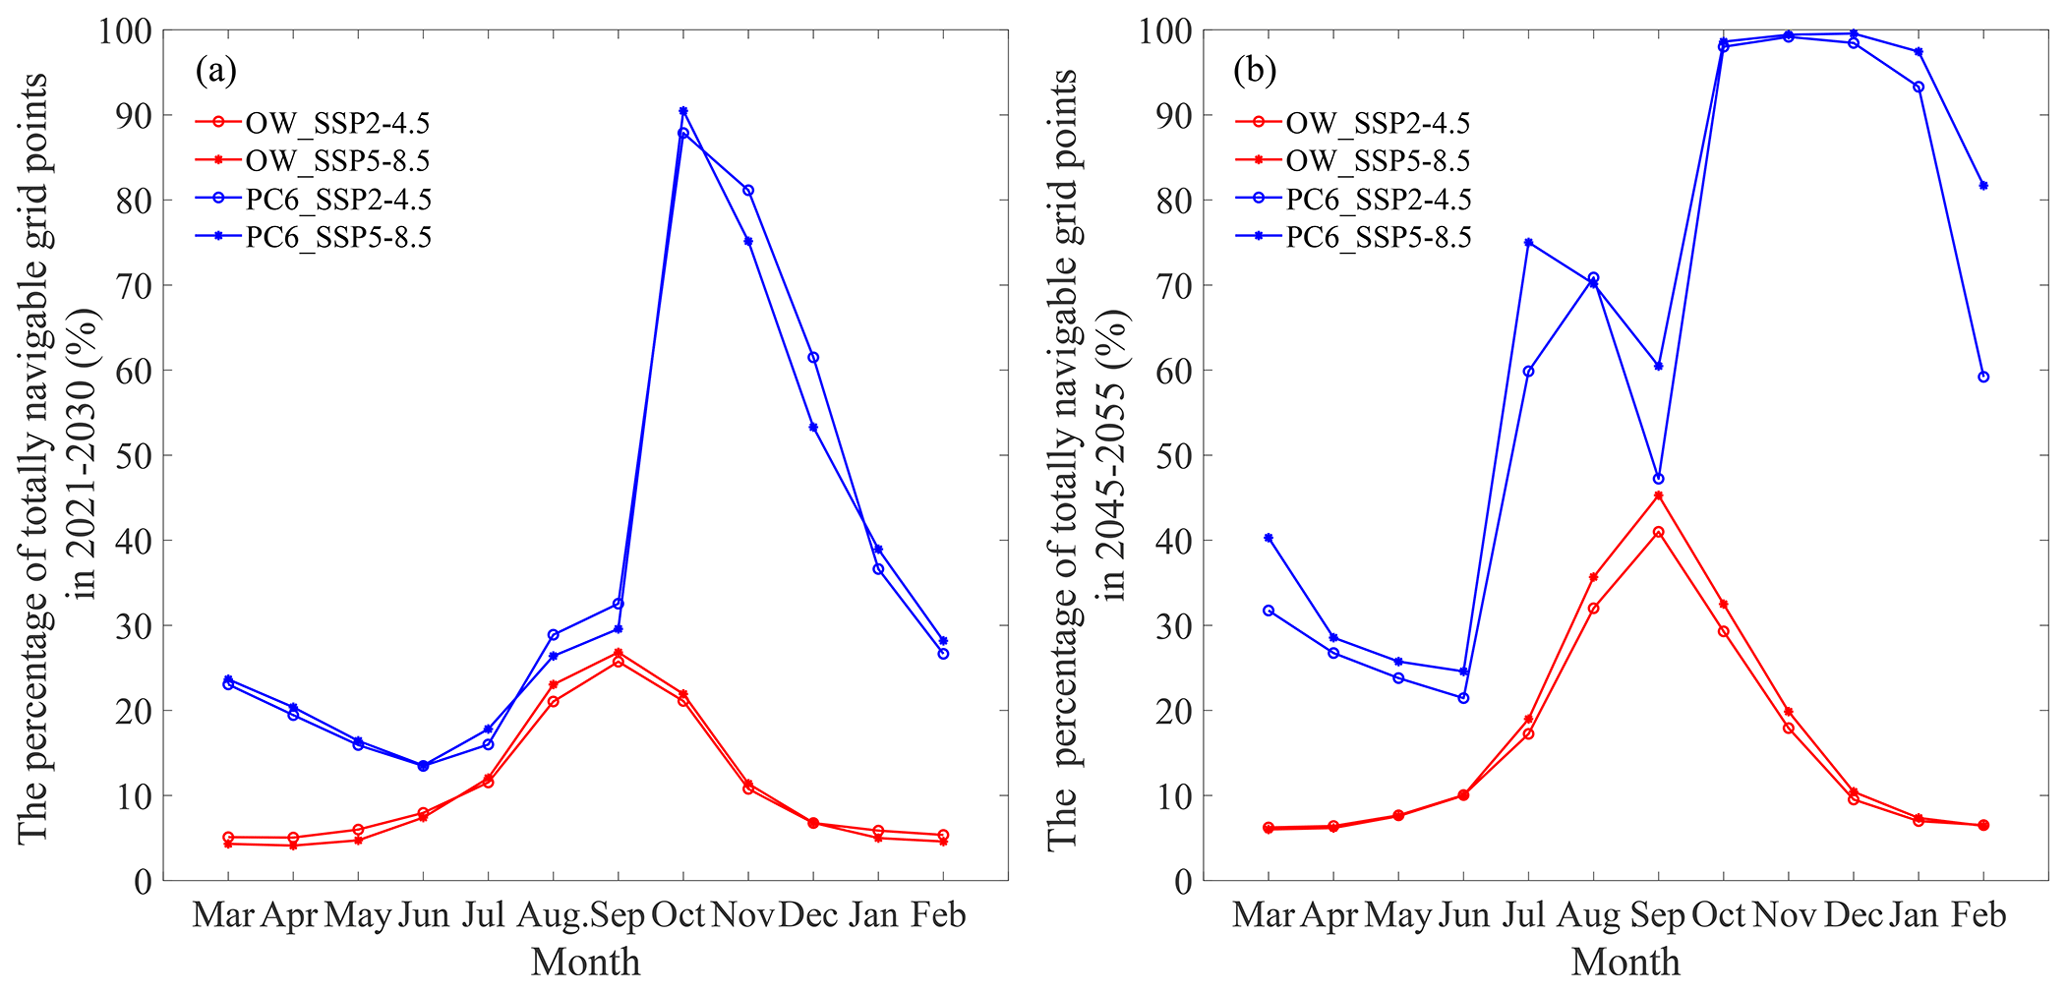
Figure 7The percentage of totally navigable grid cells for OW ships and PC6 ships under SSP2-4.5 and SSP5-8.5.
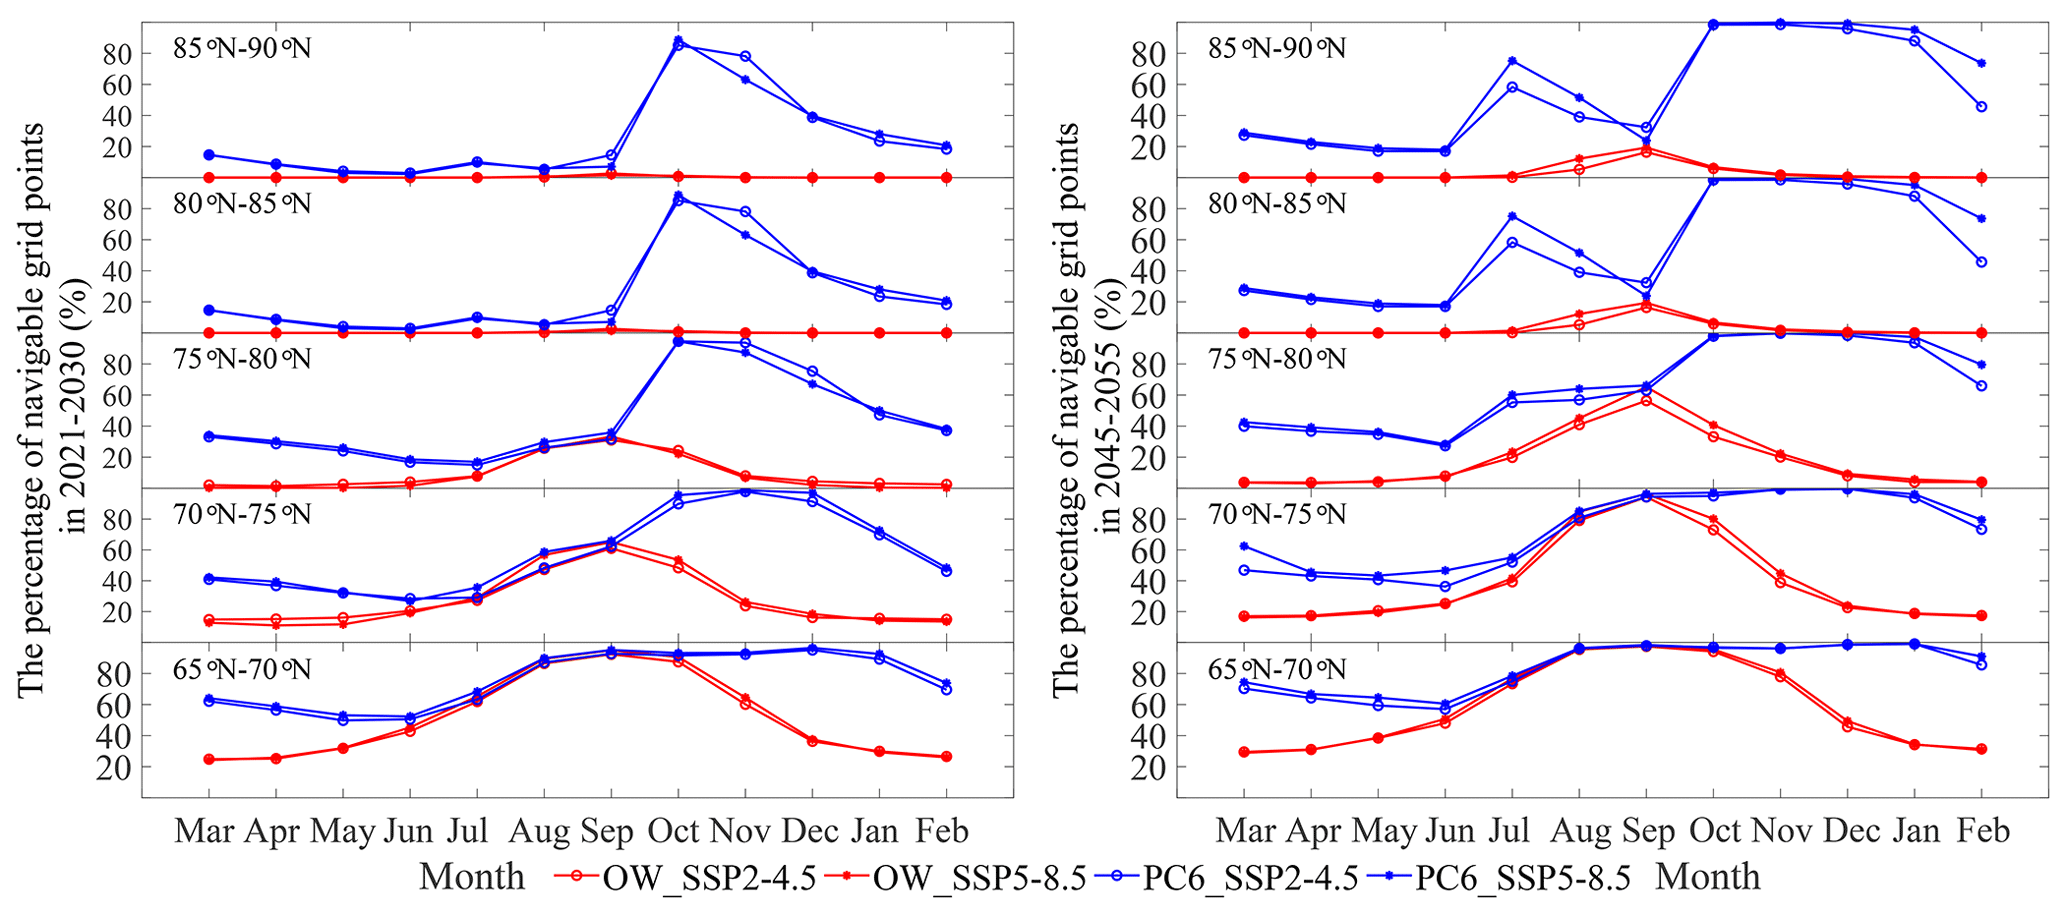
Figure 8The percentage of navigable grid cells for OW ships and PC6 ships under SSP2-4.5 and SSP5-8.5 within different latitudes.
The Arctic warming rate is more than double the global average, and it has had great impacts on the Arctic and globe (Cohen et al., 2020). This paper investigated the future changes in sea ice and navigability of passages in the Arctic under two kinds of shared socioeconomic pathways. It provides a vision of the earth's future and has great significance for navigation planning. The following results were found.
-
The changes in sea ice would occur along SSP5-8.5 with a higher possibility under the current trend. “Ice free” might appear in September 2060, and sea ice would completely disappear by the end of the century.
-
The retreat of sea ice is more significant in September before 2060, after which the decline is mainly shown in March. The decadal rate of sea ice extent will increase under SSP5-8.5 in March, while it will decrease in September.
-
The decrease in sea ice thickness will transit from the Arctic Ocean north of the Arctic Archipelago and Greenland to the seas along Russia and North America and will totally decline with an average decadal trend of −0.22 m in September after 2060. Sea ice concentration will thoroughly decline with decreasing decadal rates.
-
Sea ice volume will decrease at a higher decadal rate in March than in September. The oldest ice might eventually disappear by approximately the mid-century. First-year ice dominates the sea ice cover. It increases mainly before 2060 and remains stable until 2090, after which it starts to decrease.
-
The probability for OW ships crossing NSR and NWP is low in 2021–2030, while it is high in August–October 2045–2055, with maximum and minimum navigable grid cells in September and March, respectively.
-
The passages along the coast and crossing the Arctic might open for PC6 ships during October–December and September–October 2021–2030, respectively, with maximum navigable grid cells in October. The open window would extend to August–January and October–January in 2045–2055, respectively, and the maximum navigable grid cells have a range in November and December.
The navigable window for OW ships and PC6 ships along the NSR were investigated in our previous work (Chen et al., 2020), but it is insufficient to evaluate Arctic navigability by a single climate model, even with a high resolution. This study serves as a reference for future changes in sea ice and navigability in the Arctic, including NSR, NWP, and central passage. However, the uncertainty of the models might have affected the results and their reliability in this research. Approximated physical processes and unreal parameters in models are inevitable problems in the geosciences. Differences still existed even when the models were filtered by comparing the historical simulations with the observations of sea ice extent. The abnormal decrease in navigable area at high latitudes (80–90∘ N) in September might be an example. This is against conventional wisdom, but it could be true. The uncertainty of the models is expected to decrease in future prospective research. Different ice types do make a big difference to ship navigability. For example, for the same sea ice thickness (SIT) ⋅ sea ice concentration (SIC) (e.g., SIT ⋅ SIC = 0.3), pack ice (say SIT = 0.6 m thick and SIC = 50 %) has a high degree of freedom that level ice (say SIT = 0.3 m and SIC = 100 %) does not have. Thus, ships are easier to navigate in broken ice floes (Huang et al., 2020b). ATAM is unable to clearly distinguish ice types at first, and this might be a future direction. The percentage of the number of navigable cells (points) was used to measure the navigable potential in a region. However, the percentage of the navigable area makes a lot more sense because the area of the grid cells is not constant in space at a latitude–longitude grid even if it can be indicated by the percentage of navigable points which are uniformly distributed at each latitude to a certain extent. Equidistant projection could be used in the further research.
All the data used in this paper are available online. The simulations of sea ice can be accessed from the CMIP6 (https://esgf-node.llnl.gov/search/cmip6/, World Climate Research Programme, 2021). The observations of sea ice extent are available from the National Snow and Ice Data Center (https://doi.org/10.7265/N5K072F8, Fetterer et al., 2017).
JinC and SK developed the concept and investigated the methods of this paper. JinC and WD analyzed the data and wrote the original draft. JG, MX, YZ, XZ, WZ, and JizC reviewed and edited the manuscript.
The contact author has declared that neither they nor their co-authors have any competing interests.
Publisher's note: Copernicus Publications remains neutral with regard to jurisdictional claims in published maps and institutional affiliations.
We are thankful for the data from CMIP6 and NSIDC. Our cordial gratitude should be extended to the reviewers and the editors for their professional and pertinent comments on this paper.
This work was financially supported by the International Partnership Program of Chinese Academy of Sciences (grant no. 131B62KYSB20180003), the Key Research Program of Frontier Sciences, CAS (grant no. QYZDY-SSW-DQC021), the Frontier Science Key Project of CAS (grant no. QYZDJ-SSW-DQC039), the China National Key Research and Development Program (grant no. 2020YFA0608500), and the State Key Laboratory of Cryospheric Science (grant no. SKLCS-ZZ-2021).
This paper was edited by Yevgeny Aksenov and reviewed by Bjørn Åge Hjøllo, Hajime Yamaguchi, Luofeng Huang, and one anonymous referee.
Abe, M., Nozawa, T., Ogura, T., and Takata, K.: Effect of retreating sea ice on Arctic cloud cover in simulated recent global warming, Atmos. Chem. Phys., 16, 14343–14356, https://doi.org/10.5194/acp-16-14343-2016, 2016.
AMSA: Arctic marine shipping assessment 2009 report, Arctic Council, available at: https://digital.library.unt.edu/ark:/67531/metadc949512/m2/1/high_res_d/AMSA_2009_Report_2nd_print.pdf (last access: 2 December 2021), 2009.
Barnhart, K. R., Miller, C. R., Overeem, I., and Kay, J. E.: Mapping the future expansion of Arctic open water, Nat. Clim. Change, 6, 280–285, https://doi.org/10.1038/nclimate2848, 2015.
Biskaborn, B. K., Smith, S. L., Noetzli, J., Matthes, H., Vieira, G., and Streletskiy, D. A.: Permafrost is warming at a global scale, Nat. Commun., 10, 1–11, https://doi.org/10.1038/s41467-018-08240-4, 2019.
Box, J. E., Colgan, W. T., Christensen, T. R., Schmidt, N. M., Lund, M., and Parmentier, F.-J. W.: Key indicators of Arctic climate change: 1971–2017, Environ. Res. Lett., 14, 045010, https://doi.org/10.1088/1748-9326/aafc1b, 2019.
Brown, R., Vikhamar Schuler, D., Bulygina, O., Derksen, C., Luojus, K., and Mudryk, L.: Arctic terrestrial snow cover. Snow, Water, Ice and Permafrost in the Arctic (SWIPA) 2017, Arctic Monitoring and Assessment Programme (AMAP), Oslo, Norway, 25–64, 2017.
Buixadé Farré, A., Stephenson, S. R., Chen, L., Czub, M., Dai, Y., and Demchev, D.: Commercial Arctic shipping through the Northeast Passage: routes, resources, governance, technology, and infrastructure, Polar Geography, 37, 298–324, https://doi.org/10.1080/1088937x.2014.965769, 2014.
Chang, K. Y., He, S. S., Chou, C. C., Kao, S. L., and Chiou, A. S.: Route planning and cost analysis for travelling through the Arctic Northeast Passage using public 3D GIS, Int. J. Geogr. Inf. Sci., 29, 1375–1393, https://doi.org/10.1080/13658816.2015.1030672, 2015.
Chen, J. L., Kang, S. C., Chen, C. S., You, Q. L., Du, W. T., and Xu, M.: Changes in sea ice and future accessibility along the Arctic Northeast Passage, Global Planet. Change, 195, 103319, https://doi.org/10.1016/j.gloplacha.2020.103319, 2020.
Chen, S. Y., Cao, Y. F., Hui, F. M., and Cheng, X.: Observed spatial-temporal changes in the autumn navigability of the Arctic Northeast Route from 2010 to 2017, Chinese Sci. Bull., 64, 1515–1525, https://doi.org/10.1360/N972018-01083, 2019 (in Chinese).
Cohen, J., Zhang, X., Francis, J. A., Jung, T., Kwok, R., and Overland, J.: Divergent consensuses on Arctic amplification influence on midlatitude severe winter weather, Nat. Clim. Change, 10, 20–29, https://doi.org/10.1038/s41558-019-0662-y, 2020.
Comiso, J. C.: Large decadal decline of the Arctic multiyear ice cover, J. Climate, 25, 1176–1193, https://doi.org/10.1175/JCLI-D-11-00113.1, 2012.
Comiso, J. C. and Hall, D. K.: Climate trends in the Arctic as observed from space, Wires. Clim. Change, 5, 389–409, https://doi.org/10.1002/wcc.277, 2014.
Connolly, R., Connolly, M., and Soon, W.: Re-calibration of Arctic sea ice extent datasets using Arctic surface air temperature records, Hydrol. Sci. J., 62, 1317–1340, https://doi.org/10.1080/02626667.2017.1324974, 2017.
Cressey, D.: Arctic melt opens Northwest Passage, Nature, 449, 267–267, https://doi.org/10.1038/449267b, 2007.
Fetterer, F., Knowles, K., Meier, W. N., Savoie, M., and Windnagel, A. K.: 2017, updated daily, Sea Ice Index, Version 3, Boulder, Colorado USA, NSIDC: National Snow and Ice Data Center [data set], https://doi.org/10.7265/N5K072F8, 2017.
Gascard, J.-C., Riemann-Campe, K., Gerdes, R., Schyberg, H., Randriamampianina, R., and Karcher, M.: Future sea ice conditions and weather forecasts in the Arctic: Implications for Arctic shipping, Ambio, 46, 355–367, https://doi.org/10.1007/s13280-017-0951-5, 2017.
Howell, S. E. L. and Yackel, J. J.: A vessel transit assessment of sea ice variability in the Western Arctic, 1969–2002: implications for ship navigation, Can. J. Remote Sens., 30, 205–215, https://doi.org/10.5589/m03-062, 2004.
Huang, L. F., Li, M. H., Romu, T., Dolatshah, A., and Thomas, G.: Simulation of a ship operating in an open-water ice channel, Ships Offshore Struc., 16, 353–362, https://doi.org/10.1080/17445302.2020.1729595, 2020a.
Huang, L. F., Tuhkuri, J., Igrec, B., Li, M. H., Stagonas, D., Toffoli, A., Cardiff, P., and Thomas, G.: Ship resistance when operating in floating ice floes: a combined CFD&DEM approach, Mar. Struct., 74, 102817, https://doi.org/10.1016/j.marstruc.2020.102817, 2020b.
IMO: Guidelines for ships operating in Arctic ice-covered waters, London: International Maritime Organization, available at: https://www.gc.noaa.gov/documents/gcil_1056-MEPC-Circ399.pdf (last access: 2 December 2021), 2002.
Jourdain, N. C., Mathiot, P., Merino, N., Durand, G., Le Sommer, J., and Spence, P.: Ocean circulation and sea-ice thinning induced by melting ice shelves in the Amundsen Sea, J. Geophys. Res.-Oceans, 122, 2550–2573, https://doi.org/10.1002/2016jc012509, 2017.
Kwok, R.: Arctic sea ice thickness, volume, and multiyear ice coverage: losses and coupled variability (1958–2018), Environ. Res. Lett., 13, 105005, https://doi.org/10.1088/1748-9326/aae3ec, 2018.
Lenton, T., Rockström, J., Gaffney, O., Rahmstorf, S., Richardson, K., and Steffen, W.: Climate tipping points-too risky to bet against, Nature, 575, 592–595, https://doi.org/10.1038/d41586-019-03595-0, 2019.
Liu, X., Ma, L., Wang, J., Wang, Y., and Wang, L.: Navigable windows of the Northwest Passage, Polar Sci., 13, 91–99, https://doi.org/10.1016/j.polar.2017.02.001, 2017.
Loomis, B. D., Rachlin, K. E., and Luthcke, S. B. Improved Earth oblateness rate reveals increased ice sheet losses and mass-driven sea level rise, Geophys. Res. Lett., 46, 6910–6917, https://doi.org/10.1029/2019gl082929, 2019.
Melia, N., Haines, K., Hawkins, E., and Day, J. J.: Towards seasonal Arctic shipping route predictions, Environ. Res. Lett., 12, 084005, https://doi.org/10.1088/1748-9326/aa7a60, 2017.
Meredith, M. P., Sommerkorn, M., Cassotta, S., Derksen, C., Ekaykin, A. A., Hollowed, A., Kofinas, G., Mackintosh, A., Melbourne-Thomas, J., Mulbert, M., Ottersen, G., Pritchard, H., and Schuur Edward, A. G.: Chapter 3: Polar Regions. IPCC special report on the ocean and cryosphere in a changing climate, available at: https://www.ipcc.ch/site/assets/uploads/sites/3/2019/09/SROCC_SPM_HeadlineStatements.pdf (last access: 2 December 2021), 2019.
Notz, D.: Sea-ice extent and its trend provide limited metrics of model performance, The Cryosphere, 8, 229–243, https://doi.org/10.5194/tc-8-229-2014, 2014.
O'Neill, B. C., Kriegler, E., Riahi, K., Ebi, K. R., Hallegatte, S., and Carter, T. R.: A new scenario framework for climate change research: the concept of shared socioeconomic pathways, Clim. Change, 122, 387–400, https://doi.org/10.1007/s10584-013-0905-2, 2014.
Ostreng, W., Eger, K. M., Flistad, B., Jgensen-Dahl, A., Lothe, L., Mejlnder-Larsen, M., and Wergeland, T.: Shipping in Arctic waters: a comparison of the northeast, northwest and trans polar passages, Springer heidelberg, New York, https://doi.org/10.1007/978-3-642-16790-4, 2013.
Richter-Menge, J., Druckenmiller, M. L., and Jeffries, M.: Arctic Report Card 2019, available at: https://arctic.noaa.gov/Portals/7/ArcticReportCard/Documents/ArcticReportCard_full_report2019.pdf (last access: 1 December 2021), 2019.
Ryan, C., Thomas, G., and Stagonas, D.: Arctic Shipping Trends 2050, Mechanical engineering, University of London, https://doi.org/10.13140/RG.2.2.34680.67840, 2020.
Screen, J. A. and Simmonds, I.: Increasing fall-winter energy loss from the Arctic Ocean and its role in Arctic temperature amplification, Geophys. Res. Lett., 37, 16, https://doi.org/10.1029/2010gl044136, 2010.
Serova, N. A. and Serova, V. A.: Critical tendencies of the transport infrastructure development in the Russian Arctic, Arctic and North, 36, 42–56, https://doi.org/10.17238/issn2221-2698.2019.36.42, 2019.
Shu, Q., Wang, Q., Song, Z. Y., Qiao, F. L., Zhao, J. C., and Chun, M.: Assessment of sea ice extent in CMIP6 with comparison to observations and CMIP5, Geophys. Res. Lett., 47, e2020GL087965, https://doi.org/10.1029/2020GL087965, 2020.
SIMIP Community: Arctic sea ice in CMIP6, Geophys. Res. Lett., 4, e2019GL086749, https://doi.org/10.1029/2019GL086749, 2020.
Smith, L. C. and Stephenson, S. R.: New Trans-Arctic shipping routes navigable by midcentury, P. Nati. Acad. Sci. USA, 110, E1191–E1195, https://doi.org/10.1073/pnas.1214212110, 2013.
Stephenson, S. R., Smith, L. C., Brigham, L. W., and Agnew, J. A.: Projected 21st-century changes to Arctic marine access, Clima. Change, 118, 885–899, https://doi.org/10.1007/s10584-012-0685-0, 2013.
Tillman, H., Yang, J., and Nielsson, E. T.: The Polar Silk Road: China's New Frontier of International Cooperation, China Quarterly of International Strategic Studies, 04, 345–362, https://doi.org/10.1142/S2377740018500215, 2019.
Transport Canada: Arctic Ice Regime Shipping System (AIRSS) standard, TP 12259E, Government of Canada, Ottawa, available at: https://tc.canada.ca/en/marine-transportation/marine-safety/tp-12259e-arctic-ice-regime-shipping-system-airss-standard (last access: 1 December 2021), 1998.
World Climate Research Programme: CMIP6 project data, available at: https://esgf-node.llnl.gov/search/cmip6/, last access: 6 December 2021.
Yu, M., Lu, P., Li, Z. Y., Li, Z. J., Wang, Q. K., Cao, X. W., and Chen, X. D.: Sea ice conditions and navigability through the Northeast Passage in the past 40 years based on remote-sensing data, Int. J. Digit. Earth, 14, 555–574, https://doi.org/10.1080/17538947.2020.1860144, 2021.