the Creative Commons Attribution 4.0 License.
the Creative Commons Attribution 4.0 License.
 | 06 Jul 2021
Thaw-driven mass wasting couples slopes with downstream systems, and effects propagate through Arctic drainage networks
Steven V. Kokelj
Justin Kokoszka
Jurjen van der Sluijs
Ashley C. A. Rudy
Jon Tunnicliffe
Sarah Shakil
Suzanne E. Tank
Scott Zolkos
The intensification of thaw-driven mass wasting is transforming glacially conditioned permafrost terrain, coupling slopes with aquatic systems, and triggering a cascade of downstream effects. Within the context of recent, rapidly evolving climate controls on the geomorphology of permafrost terrain, we (A) quantify three-dimensional retrogressive thaw slump enlargement and describe the processes and thresholds coupling slopes to downstream systems, (B) investigate catchment-scale patterns of slope thermokarst impacts and the geomorphic implications, and (C) map the propagation of effects through hydrological networks draining permafrost terrain of northwestern Canada. Power-law relationships between retrogressive thaw slump area and volume (R2=0.90), as well as the thickness of permafrost thawed (R2=0.63), combined with the multi-decadal (1986–2018) increase in the areal extent of thaw slump disturbance, show a 2 order of magnitude increase in catchment-scale geomorphic activity and the coupling of slope and hydrological systems. Predominant effects are to first- and second-order streams where sediment delivery, often indicated by formation of recent debris tongue deposits, commonly exceeds the transport capacity of headwater streams by orders of magnitude, signaling centennial- to millennial-scale perturbation of downstream systems. Assessment of hydrological networks indicates that thaw-driven mass wasting directly affects over 5538 km of stream segments, 889 km of coastline, and 1379 lakes in the 994 860 km2 study area. Downstream propagation of slope thermokarst indicates a potential increase in the number of affected lakes by at least a factor of 4 (n>5692) and impacted stream length by a factor of 8 (>44 343 km), and it defines several major impact zones on lakes, deltas, and coastal areas. Prince of Wales Strait is the receiving marine environment for greatly increased sediment and geochemical fluxes from numerous slump-impacted hydrological networks draining Banks Island and Victoria Island. The Peel and Mackenzie rivers are globally significant conveyors of the slope thermokarst cascade, delivering effects to North America's largest Arctic delta and the Beaufort Sea. Climate-driven erosion of ice-rich slopes in permafrost-preserved glaciated terrain has triggered a time-transient cascade of downstream effects that signal the rejuvenation of post-glacial landscape evolution. Glacial legacy, ground-ice conditions, and continental drainage patterns dictate that terrestrial, freshwater, coastal, and marine environments of western Arctic Canada will be an interconnected hotspot of thaw-driven change through the coming millennia.
- Article
(13879 KB) - Full-text XML
-
Supplement
(6604 KB) - BibTeX
- EndNote


Climate-induced permafrost thaw will drive the geomorphic evolution of circumpolar ice-rich landscapes (Kokelj and Jorgenson, 2013) and terrestrial, freshwater, and coastal ecosystems (Vonk et al., 2019). Thawing of ice-rich, glacially conditioned permafrost terrain (Kokelj et al., 2017a) is rapidly mobilizing vast stores of previously frozen materials, reconfiguring slopes, and impacting downstream environments (Fig. 1) (Balser et al., 2014; Rudy et al., 2017a; Tank et al., 2020). These and other similar results highlight the need to quantify slope thermokarst intensification in a robust geomorphic framework, better understand the rapidly evolving linkages between thawing slopes and downstream environments, and predict the propagation of effects across watershed scales.
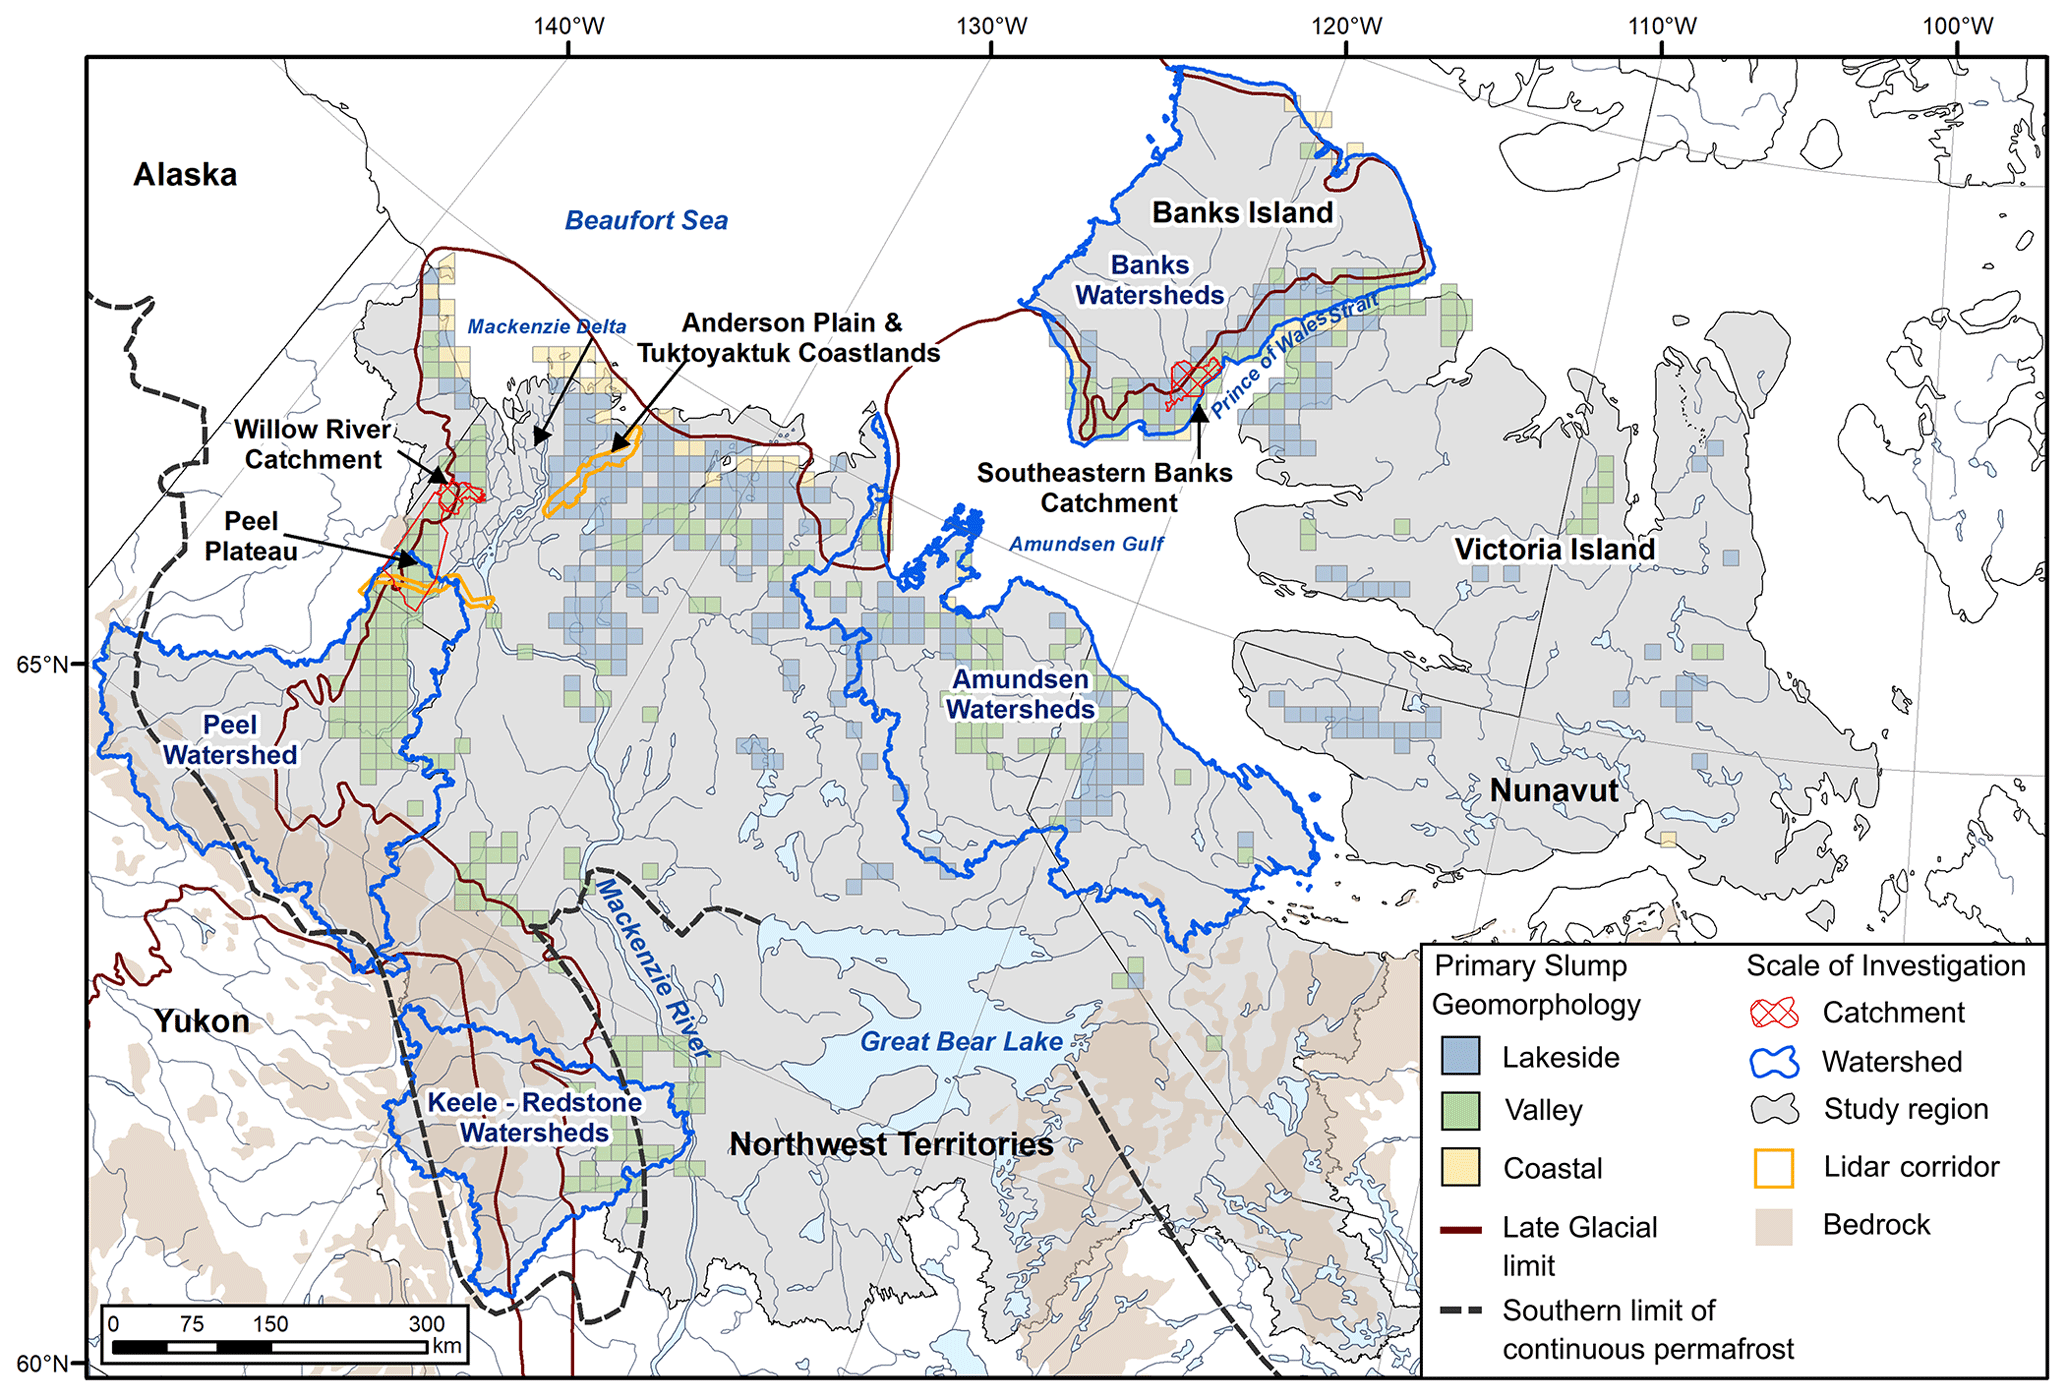
Figure 1Study region map showing the distribution and dominant geomorphic environments affected by thaw-driven mass wasting and the locations and scales of investigation constrained by the 994 860 km2 area of Arctic drainage from permafrost terrain of northwestern Canada. Fine-scale retrogressive thaw slump mapping utilizing high-resolution UAV and lidar terrain models is indicated by the orange corridors (Peel Plateau, Tuktoyaktuk Coastlands, and Anderson Plain). Small- to medium-scale catchments including Willow River, Peel Plateau, and southeastern Banks Island areas are indicated by red polygons. Focal watersheds are outlined in blue, and the Arctic drainage study area is shaded in grey. The disturbance data on the map are adapted from Segal et al. (2016a) and Kokelj et al. (2017a). The late glacial limit is from Dyke and Prest (1987), bedrock geology is from Fulton (1995), and the permafrost boundary is from Brown et al. (1997). The Willow River catchment is part of a sub-sub-drainage, and the watershed and study area boundaries are composites of several sub-sub-drainage areas (Methods S1–S3 in the Supplement) from the National Hydro Network (NHN) geodatabase (Natural Resources Canada, 2016). The base map is from ESRI ArcGIS Online.
The nature of permafrost thaw and downstream consequences will define trajectories of environmental change in Arctic terrestrial and aquatic systems. The study of thawing slopes and shorelines (Lacelle et al., 2010; Ramage et al., 2017; West and Plug, 2008), and characterization of permafrost physical and geochemical properties (Lacelle et al., 2019), informs the projection of downstream cumulative effects and implications for carbon and contaminant mobilization (Littlefair et al., 2017; Ramage et al., 2018; St. Pierre et al., 2018; Tank et al., 2020). Recent, rapid increases in the areal extent of upland thermokarst (Lewkowicz and Way, 2019; Segal et al., 2016b; Ward-Jones et al., 2019) and shifts in hydrological, sedimentary, and geochemical regimes (Abbott et al., 2015; Kokelj et al., 2013; Malone et al., 2013; Littlefair et al., 2017; Rudy et al., 2017a) can be linked with significant aquatic ecosystem impacts (Chin et al., 2016; Houben et al., 2016; Levenstein et al., 2018; Thienpont et al., 2013). The processes and feedbacks driving the evolution of thawing slopes (Kokelj et al., 2015; Zwieback et al., 2018) have received less attention. Thaw-driven landslide effects on permafrost catchments have been investigated through nested watershed studies (Beel et al., 2018; Bowden et al., 2008; Shakil et al., 2020a; Zolkos et al., 2020), and the cascade of effects have been inferred through geochemical trend analyses of large Arctic rivers (Tank et al., 2016; Zolkos et al., 2018). The broad-scale distribution of slope thermokarst determined through empirical (Kokelj et al., 2017a), remote sensing (Brooker et al., 2014; Nitze et al., 2018), GIS mapping (Olefeldt et al., 2016), and modeling approaches (Rudy et al., 2017b) has typically not been designed to elucidate physical processes, downstream connectivity, and attendant effects. Despite the growing geomorphic and geochemical influence of thaw-driven mass wasting on terrestrial, aquatic, and marine systems (Vonk et al., 2019) and the potential for rapid carbon release (Turetsky et al., 2020), fundamental knowledge gaps persist in our understanding of climate-driven amplification of slope thermokarst, the evolution of downstream linkages, and the cascade of consequences.
Retrogressive thaw slumps, complex thaw-flow slides, and shallow and deep translational failures are amongst the most dynamic forms of slope thermokarst (Aylsworth et al., 2000; Kokelj et al., 2015; Rudy et al., 2017b). Anticipating the cumulative effects of thaw-driven mass wasting on permafrost landscapes and downstream environments requires better knowledge of processes and the evolution of connectivity across a range of spatial scales. First, exploring the implications of thaw-driven mass wasting requires determining the relationships between the disturbance area, volume, and thickness of permafrost thawed so that changes in landslide count or areal extent (Lantz and Kokelj, 2008; Lewkowicz and Way, 2019; Ward-Jones et al., 2019) can be considered in a more robust physical framework (van der Sluijs et al., 2018). To advance understanding of processes and feedbacks driving the evolution of slope thermokarst and hillslope–channel coupling, conventional satellite- and airborne-derived planform terrain assessments should be quantified with high-resolution 3D survey techniques. Secondly, analyzing thermokarst mass-wasting effects within a hydrological network context is required to understand slope-to-stream linkages and downstream connectivity (Wohl, 2017), as well as to provide a platform for description and modeling of watershed effects. Finally, considering the distribution of thermokarst mass-wasting processes and trajectories of change within an appropriate theoretical or geomorphic context (Ballantyne, 2002) will support the explanation of the spatial patterns, rates, and magnitudes of geomorphic change (Kokelj et al., 2017a) as well as geochemical effects (Lacelle et al., 2019; Tank et al., 2020) and contextualize conceptually and physically based models (Turetsky et al., 2020).
The goals of this study are to better understand (A) the geomorphic changes that result from thaw-driven mass wasting and the evolution of slope-to-stream coupling, (B) the spatial distribution of catchment effects, and (C) their propagation across watershed scales. Here we present a suite of spatially nested case studies bounded by Arctic drainage from permafrost terrain of northwestern Canada (Fig. 1). The study area is predominantly in the zone of continuous permafrost; however, we also include the Great Bear River drainage and a few other Mackenzie River tributaries that drain northern margins of the extensive discontinuous permafrost zone. This 106 km2 study region contains a wide range of climate and permafrost temperature regimes (Smith et al., 2010), ground-ice conditions (O'Neill et al., 2019), biophysical gradients (Lantz et al., 2010), and geological environments, including unglaciated and glaciated terrain (Dyke and Prest, 1987; Dyke et al., 2003). The latter is of central relevance to the study design, in particular where permafrost has maintained ice-marginal moraine, glaciolacustrine, glaciofluvial, and glaciomarine deposits in a quasi-stable state, preserving relict ground ice (Lakeman and England, 2012; Mackay, 1971; Murton et al., 2005; Pollard, 2000) and constraining slope evolution through a cooling Holocene climate (Porter et al., 2019). Today, these environments host large areas affected by intense thaw-driven geomorphic change (Fig. 1) where landslides, predominantly in the form of retrogressive thaw slumps, or retrogressive thaw-flow slides, are mobilizing slope materials, transforming landscapes (Kokelj et al., 2015), and triggering an array of downstream effects (Chipman et al., 2016; Rudy et al., 2017a; Zolkos et al., 2018). The fine-scale investigations in this research focused on retrogressive thaw slumping because it is a primary mode of thaw-driven slope failure in the study region (Segal et al., 2016b), and it can modify slopes affected by other landslide types. Broad-scale mapping to address the propagation of effects across watershed scales (goal C) considered multiple slope failure modes (retrogressive thaw slumps, shallow and deep translational slides), so we utilize more inclusive terminology such as slope thermokarst, thaw-driven landslides, or mass wasting when discussing these results.
To quantify the enlargement of retrogressive thaw slumps, assess allometric relationships (i.e., area and volume) (see Bull, 1964), and explore thresholds that govern slope-to-stream connectivity (goal A), we analyzed fine-scale topographic data derived from lidar for a large population of thaw slumps from across the Peel Plateau (Kokelj et al., 2017c) and a second population within the Anderson Plain and Tuktoyaktuk Coastlands areas (Rampton, 1988), as well as data from repeat unmanned aerial vehicle (UAV) terrain surveys of individual disturbances on the Peel Plateau (Fig. 1, Table S1). To investigate thermokarst mass-wasting effects on catchments (goal B), we combined thaw slump mapping with empirical models to estimate disturbance volume, visualize the patterns and intensity of impacts across a fluvial network, and derive first-order estimates of slope denudation for a medium-sized catchment (Willow River, 103 km2) in the Mackenzie Delta region (Fig. 1, Table S1). Detailed investigations of the distribution of thermokarst mass wasting within a fluvial network were extended to a range of catchments for the northern Peel Plateau (3520 km2) and southeastern Banks Island (1220 km2), and patterns of fluvial–geomorphic effects were explored by contrasting stream sediment fluxes across catchment scales and disturbance status. To assess the potential propagation of watershed-scale slope thermokarst effects (104 to 105 km2) (goal C), disturbance distribution was analyzed within a Strahler-order framework for composite drainage areas characterized by contrasting terrain and permafrost conditions that we defined for this study as the Banks Island, Amundsen Gulf, Peel River, and Keele–Redstone watersheds (Fig. 1, Table S1). Finally, thaw-driven mass-wasting effects on stream, lake, and coastal environments were integrated through a flow accumulation analysis to map the potential cascade of effects through hydrological networks of northwestern Canada (Fig. 1). Through this multi-scale study, we link the intensification of thaw-driven slope processes with the coupling of downstream systems and map the propagation of effects through hydrological networks, showing the interconnected nature of slope thermokarst hotspots and the patterns of emerging sedimentary and geochemical regimes that will define major Arctic change through the coming millennia.
2.1 Study area
This broadest scale of inquiry is defined as the Arctic drainage networks of northwestern Canada, primarily from continuous permafrost and the northern limits of extensive discontinuous permafrost terrain (Fig. 1). The 994 860 km2 Arctic drainage area of northwestern Canada is comprised of 68 sub-sub-drainage areas from the National Hydro Network geodatabase (Method S2) (Natural Resources Canada, 2016). This study area is characterized by a diversity of permafrost, geological, climate, and ecosystem conditions (Fig. 1). The Mackenzie and Peel River systems drain the south-central and western parts of the study area. Several small hydrological systems characterize the Yukon Coastal Plain, whereas medium to large northward-flowing rivers drain tundra of the interior platform and shield terrain northeast of the Mackenzie Basin. Abundant small- to medium-sized streams comprise the tundra watersheds of Banks Island and Victoria Island.
The study area is characterized by forested and alpine tundra in the southern and western regions where mean annual temperatures at the top of the permafrost (TTOP) in undisturbed terrain range from above −1 to about −3 ∘C (Smith et al., 2010; O'Neill et al., 2015), a northward transition to low Arctic tundra where permafrost is typically greater than 100 m in thickness with mean annual TTOP below −4 ∘C (Kokelj et al., 2017b), and Arctic tundra of Banks Island and Victoria Island where frozen ground is hundreds of meters thick and mean annual TTOP is typically below −10 ∘C (Smith et al., 2010). Abundant ice-rich terrain in the region is indicated by the widespread occurrence of segregated, wedge, and relict ground ice (O'Neill et al., 2019, and references within). The distribution and abundance of these main ground-ice types are associated with the legacy of glaciation, distribution of fine-grained frost-susceptible sediments, and a cold Holocene climate. The spatial distribution of retrogressive thaw slumps confirms the abundance of ice-rich terrain and thaw-sensitive slopes as well as the broad-scale association with ice-marginal, permafrost-preserved glacial terrain (Fig. 1) (Kokelj et al., 2017a). The unglaciated western margins of the study region are mountainous, and permafrost is generally ice-poor. Numerous high-energy streams and rivers draining the cordillera have incised unconsolidated, ice-rich glacial deposits along their course to the Mackenzie or Peel River. These thick deposits of fine-grained tills and other glacial materials, derived primarily from sedimentary bedrock, define the western margins of the Laurentide glacial limits and contrast with the eastern part of the study region characterized by shield bedrock veneered by patches of glacial materials derived from Precambrian rock (Dyke and Prest, 1987). The predominant form of slope thermokarst mass wasting across the region is retrogressive thaw slumps (Kokelj et al., 2017a), with shallow and deep-seated landslides having local importance that increases southward, particularly in areas of greater relief (Aylsworth et al., 2000). To examine the processes driving the intensification of thaw-driven mass wasting and the patterns of effects across hydrological networks, we applied multiple methods involving field study and mapping at slope, catchment, and watershed scales described in the following sections and summarized in Table S1.
2.2 Fine-scale topographic data to explore hillslope–channel coupling
To describe processes of retrogressive thaw slump development and slope-to-stream connectivity, terrain surveys by airborne lidar from fixed-wing aircraft and structure-from-motion (SfM) photogrammetry from UAVs were used to derive a sequence of digital terrain models (DTMs) (van der Sluijs et al., 2018) covering an 8-year span from 2011 to 2018. These surveys comprised a series of DTMs enabling total and annual volumes of material displaced by thaw-driven mass wasting to be estimated by (1) calculating differenced DTMs (DOD), (2) determining uncertainties and masking DODs based on minimum levels of change detection thresholds, and (3) summarizing the values for the scar zone (erosion) and debris tongue (deposition). Full data acquisition and processing methods are provided in van der Sluijs et al. (2018). Survey metadata are provided in Table S2.
Overlapping UAV photos were acquired from a size continuum of slumps on the Peel Plateau (Figs. 1 and S1) between 2015 and 2018, along with ground control data acquired through differential Global Navigation Satellite System (GNSS) surveys. Aerial photo datasets were processed into georeferenced color orthomosaics and point clouds using SfM software packages (Smith et al., 2016). Noise-filtered and ground-classified point clouds were rasterized in 0.5 m spatial resolution bare-earth DTMs and resampled bilinearly to 1 m spatial resolution for spatial consistency with lidar models. The lidar data with an average point density of 1.7 m−2 were collected on 25–28 August 2011 by vendor McElhanney Consulting Services Ltd. (Vancouver, BC, Canada) along two study corridors (Fig. 1). The first is a 162 km long, 6 to 9 km wide portion of the Dempster Highway across the Peel Plateau comprising an area of 1032 km2 (O'Neill et al., 2015; Kokelj et al., 2017c). The second corridor is a 9 to 19 km wide and 139 km long area (1478 km2) comprising the Inuvik-to-Tuktoyaktuk Highway corridor, which crosses the Anderson Plain and Tuktoyaktuk Coastlands (Rampton, 1988). Following initial processing by the vendor, a baseline 1 m lidar DTM was created in ESRI ArcGIS 10.4.1 (“LAS Dataset to Raster” tool) using mean ground-point elevations and Delaunay triangulation with linear interpolation to fill data voids. Vertical datum differences between the lidar and UAV surveys were corrected to ensure data compatibility.
To explore the associations between thaw slump enlargement and slope-to-stream coupling, we quantified the volumes of slump erosional concavities and debris tongue deposits for a size–age continuum exemplified in five disturbances in the Peel Plateau region where DTM data were derived from 2018 UAV surveys (Fig. S1, Table S2). Notably, geomorphic activity at one of the thaw slumps (CB) had accelerated significantly throughout the monitoring record (2011–2018). The 2011 lidar DTM provided a topographic baseline that could be used to reconstruct pre-disturbance terrain surfaces so that volumetric changes associated with thaw-driven subsidence, slope erosion, and downstream deposition could be estimated. The pre-disturbance surfaces were manually reconstructed using lidar-derived 2 m contours aided by historical aerial photographs and the circa 1970 Canadian Digital Elevation Model (CDEM) (Natural Resources Canada, 2015) following van der Sluijs et al. (2018). Pre-disturbance valley morphology required valley-bottom elevations to be constrained, so undisturbed stream elevations were sampled at 10 m intervals along transects that extended up to 200 m beyond the upper and lower limits of the debris tongue deposits. Fitted polynomial curves were used to model pre-disturbance valley bottoms, constraining contour line reconstructions, which were interpolated to a 1 m DTM using the ArcGIS 10.4.1 “Topo-to-Raster” tool. Total scar zone and debris tongue volumes were estimated, and DODs provided a volumetric estimate of the year-to-year changes.
2.3 Regional-scale data acquisition and processing
To explore relationships between planform retrogressive thaw slump scar area and volume, we digitized scar areas and estimated the volume and depth of the disturbance concavities for a subsample of 71 thaw slumps from the 2011 lidar corridors described in Sect. 2.2 and shown in Fig. 1. Features were digitized by J. van der Sluijs and reviewed for accuracy and consistency by SV Kokelj (Table S1). Utilizing lidar hill-shaded DTMs and airborne optical imagery (2011/12), all active or recently active scar and debris tongue areas determined by a distinct scarp and bare or sparsely vegetated scar area were digitized at a 1:2000 scale. Each polygon defined either a scar zone where the debris tongue was indistinguishable or a scar-only area where a debris tongue could be identified as a geomorphic feature distinct from the active scar zone. Slumps were designated as being associated with fluvial, lacustrine, or coastal systems, with an assigned integer to indicate the downstream connectivity; 0 is no connection with the downstream environment, 1 is connection between the bare scar area and downstream environment, and 2 indicates evidence of downstream deposition, which is expressed as a debris tongue in a valley bottom or a sediment lobe protruding into an adjacent lake or coastline.
For developing regional-scale thaw slump DTMs and DODs, we followed the general procedures described in Sect. 2.2, with some adaptations to streamline processing of a large sample population. Firstly, only “classic” cuspate or bowl-shaped thaw slump forms were assessed: more complex elongated and polycyclic features, common along shorelines, introduced greater uncertainty in the process of automated pre-disturbance terrain reconstruction. Several parameter adjustments in the ArcGIS LAS “Dataset to Raster” tool were implemented to minimize vegetation influences. Rather than linearly triangulating the mean elevation of ground-classified points, minimums were binned into a 1 m grid to better represent ground elevation in (re-)vegetated terrain (Gould et al., 2013; Meng et al., 2010). Reconstructing pre-disturbance slump topography was automated by removing all points in the slump scar and interpolating the pre-disturbance surface with points adjacent to the scar. Natural neighbor void-filling interpolation was applied as a balance between accuracy and shape reliability across a range of natural environments (Bater and Coops 2009; Boreggio et al., 2018). The 2011 lidar and derived pre-disturbance DTMs were differenced into a DOD, and results were summarized with the ArcGIS “Zonal Statistics” tool.
2.4 Catchment-scale mapping and analyses of sediment flux
To examine the patterns of thaw slump occurrence within a drainage network, slope-to-stream connectivity, and changes through time, we investigated the 806 km2 Willow River catchment on Peel Plateau because it straddles the late Wisconsinan glacial limit, and much of the fluvially incised basin is intensely affected by thaw slumping (Fig. 1) (Lacelle et al., 2010). To examine temporal change, we created digitized inventories of active thaw slumps from the Willow River catchment utilizing cloud-free Landsat imagery from 1986, 2002, and 2018 (Table S1) (Rudy and Kokelj, 2020). To further explore catchment-scale patterns of slope disturbances over multiple watersheds in different regions and potential changes in these patterns through time, we used 2016/17 Sentinel-2 imagery to reassess the 2005–2010 slump mapping determined using SPOT 4/5 satellite imagery (Segal et al., 2016c, d) for a 3520 km2 area of the northern Peel Plateau and 1220 km2 of southeastern Banks Island (Fig. 1) (Rudy et al., 2020). To assess the distribution of thaw slumps within a catchment framework, we used the CDEM and applied the Tau-DEM (v.5.3) “Fill”, “D8”, and “Flow Accumulation” algorithms (http://hydrology.usu.edu/taudem/, last access: 10 September 2020) (Tarboton, 1997) to trace the drainage networks and determine the upstream contributing area for each thaw slump.
Sediment fluxes for Peel Plateau streams draining glaciated and unglaciated terrain were calculated to assess the effects of catchment size and thermokarst disturbance (Shakil et al., 2020b). Instantaneous total suspended solid (TSS) fluxes () were compiled from sampling during the summer flow period (July–September) for 2010 and 2015–2017. Sampling procedures and catchment delineations are elaborated in Chin et al. (2016) and Shakil et al. (2020a). Historical TSS yields also constrained to 1 July–14 September were obtained for the Peel River at Fort McPherson (Water Survey of Canada, station 10MC002) by pairing TSS spot sampling with discharge and normalizing to a 70 600 km2 watershed area.
2.5 The influence of thaw-driven mass wasting on drainage from permafrost terrain of northwestern Canada
Here we summarize methods to identify individual segments of the hydrological network affected by active thaw-driven mass wasting and the framework to map the propagation pathways of effects through watersheds for Arctic drainage from permafrost terrain of northwestern Canada (Fig. 1). Geoprocessing steps are Methods S1–S3, and the mapping procedure and raw data are in Kokoszka and Kokelj (2021). In summary, we used georeferenced, 10 m resolution SPOT 4/5 (2005–2010) (NWT Centre for Geomatics, 2013) and Sentinel-2 (2016/17) orthomosaics to identify hydrological segments affected by mass-wasting features for individual stream network, lake, and coastline segments from the 1:50 000 National Hydro Network (NHN) dataset (Natural Resources Canada, 2016) using ArcMap 10.6. The Arctic drainage study area contains 68 NHN work units (sub-sub-catchments). The NHN primary directed network linear flow (PDNLF) shapefiles include primary (main route) stream segments and polylines through lakes, and the NHN waterbody and littoral shapefiles represent lakes and coastlines, respectively. This dataset was combined to define the entire NHN hydrological network for the 994 860 km2 drainage area (Fig. 1).
A 7.5×7.5 km grid system guided the systematic inventory of thermokarst-affected hydrological segments in each of the 68 NHN work units (Kokoszka and Kokelj, 2021). NHN hydrological features were designated as “directly affected” where one or more active slope thermokarst disturbances were in contact with or exhibited clear drainage towards the hydrological feature. PDNLF features directly influenced by thaw-driven mass wasting were assigned a numeric value of 1. To enable propagation of effects from lakes, PDNLF features at the lake outflow within directly affected lakes were also assigned a numeric value of 1. Unaffected PDNLF features were assigned a numeric value 0 to indicate no thermokarst effect. All mapping was reviewed for accuracy and consistency (Kokoszka and Kokelj, 2021).
The potential for downstream propagation of slope thermokarst effects was determined by generating a network for each of the 68 work units using RivEX 10.25 (Hornby, 2017). A river network was constructed for each PDNLF dataset based on the topology of the original NHN data, with the digitized direction corresponding to the flow direction. PDNLF features directly affected by one or more slope thermokarst features were assigned a value of 1 as indicated above. The “Accumulate Attribute” tool in RivEX 10.25 was used to sum the number of all upstream slope-thermokarst-affected segments and tabulate this for each work unit. One 800 km2 catchment (Willow River; see Fig. 1), which is part of an NHN work unit and comprises a small subset of the total stream network, was subjected to additional analysis since detailed retrogressive thaw slump mapping (Rudy and Kokelj, 2020) was available. The total area of mapped thaw slumps and slides for each hydrological segment was summed and accumulated downstream to portray catchment-scale variation in the intensity of disturbance effects (Method S1).
For the broad- and fine-scale analyses, the accumulated count of impacted stream segments was used to identify the longitudinal trace of mass-wasting effects within each work unit (Method S2). Stream features with an accumulation value>0 represented the potential propagation pathway of effects through the network. Propagation of effects across watershed scales involved transferring accumulation values from upstream to downstream work units. Hydrological features that were influenced by the downstream propagation of slope thermokarst effects were identified as indirectly affected PDNLF features with an accumulation value>0 and a numeric value of 0. PDNLF features contained within lakes with an accumulation value>0 indicated indirectly affected lakes, although these lakes could also be identified as directly affected if the shoreline hosted slope thermokarst features. Coastal segments adjacent to accumulated PDNLF features where streams discharge to the ocean were identified as indirectly affected coastline. After all work units were processed, the data were merged to produce a downstream trace with upstream accumulation values for the entire 994 860 km2 drainage area.
To summarize information on the distribution of watershed effects, Strahler order was computed (Method S3) for the four major watershed-scale study areas of Banks Island (70 794 km2), Amundsen Gulf (90 288 km2), Peel River (76 506 km2), and Keele–Redstone (39 957 km2) (Fig. 1). For each of the major watersheds, the respective work units (sub-sub-drainage areas) and PDNLF shapefiles were merged, and the “Strahler Order” tool in RivEX 10.25 was used to compute Strahler order for each PDNLF polyline. For each major watershed study area, directly and indirectly affected streams and lakes were summarized by Strahler order.
We summarized the total length of thermokarst-affected stream networks and the coastal margins, as well as the total number of thermokarst-affected lakes, including lakes influenced by the downstream propagation of disturbance effects. Mid-points of the directly affected stream, lake, and coastal segments were synthesized in ArcGIS to create a kernel density map. The routing of thermokarst effects was portrayed through the downstream trace and accumulation values at the coastline to provide a relative estimate of the magnitude of upstream effects. This current method does not account for variation in transport gradients, catchment sinks, or intensity of each disturbance, and it therefore represents a semi-quantitative, time-transient snapshot of thaw-driven mass-wasting effects on drainage from permafrost terrain of northwestern Canada.
2.6 Statistical analyses
The software package SPSS Statistics 21 (IBM) was used for data exploration, deriving summary statistics, testing inferential qualities, and regression analyses for all lidar and UAV-derived datasets presented in this study. All summary statistics are provided in tabular format in the body of the paper or in the Supplement. Thaw slump area, volume, and maximum depth of disturbance concavity did not meet assumptions of normality and were logarithmically transformed prior to performing t tests to assess differences in slump size metrics between physiographic regions, as well as a one-way analysis of variance (ANOVA) and a Tukey's honest significant difference (HSD) post hoc test to assess differences across categories describing downstream connectivity. Regression analyses between thaw slump area and disturbance volume and between thaw slump area and maximum concavity depth were also performed on the logarithmically transformed datasets. Regression diagnostics included testing the normality of residuals and Cook's distance to test for the presence of unduly influential points. Additional statistical analyses assessing thaw-driven landslides in the Willow River catchment and potential changes through time were performed in RStudio (Version 1.1.463) using the “stats” and “FSA” packages (R Core Team, 2017). In this case study, nonparametric statistical testing (Kruskal–Wallis and Dunn's post hoc tests) was implemented to assess potential differences in slump size indices between three different time periods.
Here we document (A) the rapid evolution of thaw-driven mass wasting and slope-to-stream coupling, (B) the spatial patterns of thermokarst effects within catchments, and (C) their propagation through hydrological networks and across watershed scales. The first three subsections focus on slope-scale processes with an emphasis on the thresholds that have transformed connectivity between thaw-driven mass wasting and downstream systems (Sect. 3.1 and 3.2), as well as the scaling of thaw slump dimensions associated with areal enlargement (Sect. 3.3). The fourth and fifth subsections (Sect. 3.4 and 3.5) focus on quantifying the changing patterns and magnitudes of thermokarst and the potential downstream effects within hydrological networks up to the medium catchment (104 km2) scale. The final subsection (Sect. 3.6) provides flow accumulation analysis results that explore patterns and project the routing of thermokarst mass-wasting effects through Arctic drainage networks from permafrost terrain of northwestern Canada.
3.1 Retrogressive thaw slump intensification transforms slope-to-stream connectivity
To investigate geomorphic change associated with thaw slump enlargement and the evolution of linkages between thawing slopes and downslope environments, we used UAV-derived elevation data from 2018 to quantify thaw slump scar and down-valley debris tongue volumes for a size and age disturbance continuum on the Peel Plateau (Tables 1 and S2; Figs. 2 and S1). The smallest slump (slump D1), which was about a decade old, had an area of 2.8×10³ m2, a displaced volume of 4.6×10³ m3, and no debris tongue accumulation (Table 1; Fig. 2a and g). The second-largest feature (slump CB), which initiated around 2002–2004, had accelerated growth through our monitoring period, displaced 1.36×10⁵ m3, and formed a debris tongue that comprised about 16 % of the scar concavity volume (Table 1; Figs. 2b and g and 3). Over 2 decades, two larger slumps, FM3 and Husky, displaced 5.0×10⁵ and 6.9×10⁵ m3 of material, producing debris tongues of 1.5×10⁵ and 3.7×10⁵ m3, respectively (Table 1). The valley fills exceed 15 m thickness and approach 1000 m in length (Fig. 2g), comprising about 30 % (FM3) and 50 % (Husky) of the estimated scar cavity volumes (Table 1). At Husky slump, the debris tongue raised the base level of the trunk stream, elevating and laterally displacing the stream channel against the side of the valley and causing slope erosion and secondary slump initiation (Fig. 2c). Growth of the Husky slump led to breaching and rapid lake drainage in 2015, which flushed scar colluvium down the valley (Video S1).
Table 1Scar and debris tongue areas and volumes (sediment erosion and thaw subsidence vs. deposition) as well as debris tongue age for a retrogressive thaw slump size–age continuum from September 2018 field observations.

Note: terrain models and delineations of these disturbances are shown in Fig. S1. n/a: not applicable.
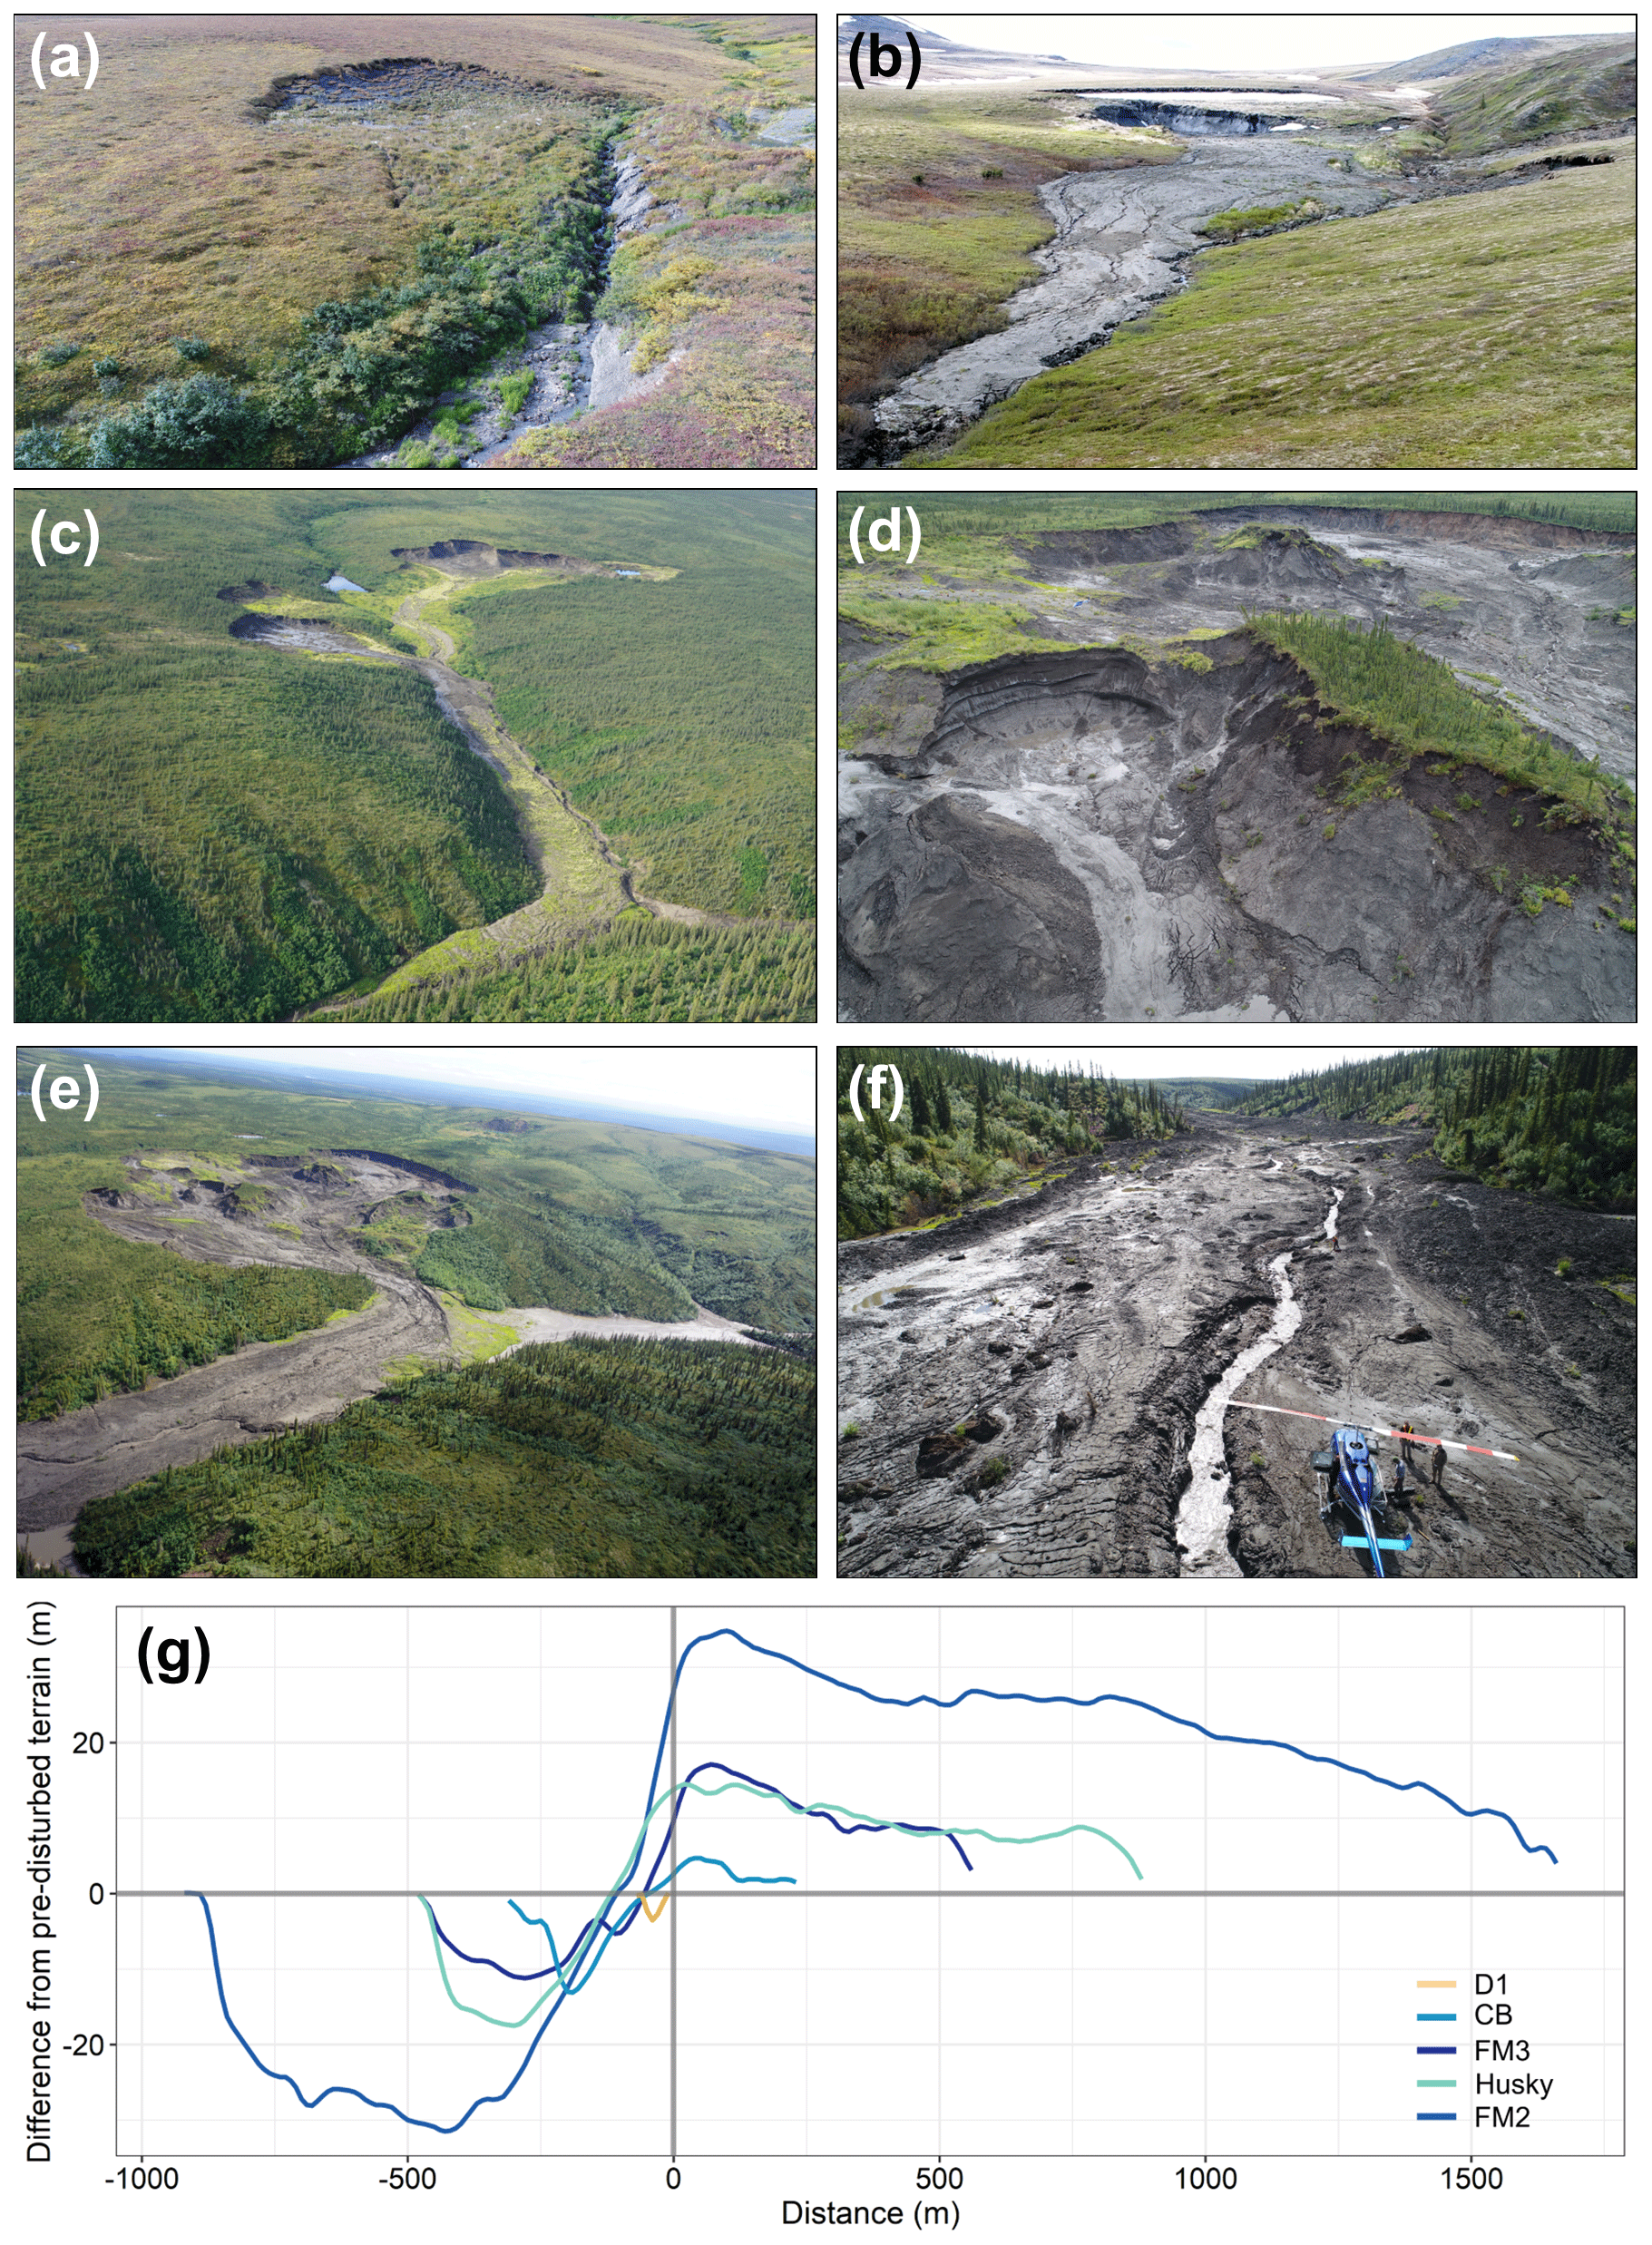
Figure 2Examples of retrogressive thaw slumps and debris tongue deposits (a–f) as well as the elevation-normalized scar zone and debris tongue profiles for a size and age disturbance continuum on (g) Peel Plateau, Northwest Territories, Canada. (a) A small, shallow slope-side thaw slump (D1) with a vegetated lower slope and active headwall. (b) Oblique photograph of CB in June 2019 showing a debris tongue in the foreground, secondary slumps on the right side of the valley, a large polycyclic (secondary) headwall in the central scar zone, and a small upper (primary) headwall in the background. (c) Husky thaw slump scar and debris tongue, secondary slumps on the left, a small debris-dam lake, and a slump-drained lake and residual pond to the right of the upper slump. (d–f) FM2 mega slump and debris tongue. (d) FM2 headwall showing banded relict massive ice and relatively thaw-stable organic deposits and eroded glaciofluvial deposits in the upper right (background). (e) FM2 thaw slump scar area and chute where sediment enters the valley to form the debris tongue and a debris-dam lake. (f) The debris tongue surface and the stream channel, which has started to incise the deposit. (g) Elevation-normalized retrogressive thaw slump scar (− values) and debris tongue (+ values) topographic profiles. Profiles are differenced from the pre-disturbed terrain surface. Scar zone transects are from the slump headwall to the intersection with the stream channel, and downstream transects extend to the end of the debris tongue. Retrogressive thaw slumps and transects are shown in Fig. S1.
In 2018, the area of slump FM2 was an order of magnitude larger than the other disturbances and had been a site of recurrent erosion for over half a century (Lacelle et al., 2015). About 30 % of the scar cavity volume (6.0×10⁶ m3) has been accounted for in the valley fill (Table 1; Fig. 2d–g), consistent with excess ice content estimates of 50 % to 70 %. Increasing thaw-driven sediment flows, coincident with the regional increase in the frequency and magnitude of thaw slumps in the late 1990s (Kokelj et al., 2015), enlarged the debris tongue to about 2 km in length and up to 35 m thickness by 2018 (Figs. 2d–g and S1) (van der Sluijs et al., 2018). By filling the trunk valley, these very large deposits flatten the upstream energy profile and create depositional environments such as the debris-dam lake at FM2 (Fig. 2e), which has infilled with sediment supplied from erosion of the FM3 debris tongue situated about 1 km upstream. Fluvial incision of the FM2 debris tongue (Fig. 2f) and diversion of the stream channel against the valley side by the accumulation of colluvial deposits are causing high rates of erosion. The persistence of these thick deposits demonstrates that sediment supply exceeds transport capacity of headwater streams by several orders of magnitude.
3.2 The thaw-driven evolution of slope-to-stream connectivity
The abrupt transition of shallow valley-side thaw slumps to larger, more dynamic failures that exhibit downstream connectivity is transforming the geomorphology of ice-rich glaciated permafrost environments. These dynamics were captured through lidar and multi-year UAV observations from Peel Plateau (Fig. 3). Thaw slump CB was initiated by stream erosion around 2002–2004 and gradually back-wasted up an 8 to 12∘ slope to form a 25 900 m2 disturbance by 2011 comprised of a shallow scar zone (mean depth=2.2 m, SD=2.1 m) with an upper zone of mud slurry and a lower, vegetated accumulation zone (Fig. 3a). The headwall, up to 7.0 m high, exposed the active layer underlain by the early Holocene paleo-active layer and Pleistocene age icy permafrost at depth (Lacelle et al., 2019). In 2015 the scar area had increased to 33 370 m2 (+29 %), but maximum headwall height (5.8 m) and mean concavity depth (1.9 m; SD=1.9 m) decreased as thawed materials accumulated in the scar zone (Fig. 3b and e). Over the first decade of slump growth material redistribution was constrained largely to the slope system, and top-down thaw of ice-rich permafrost within areas of the lower scar zone is suggested by continued subsidence (Fig. 3b). A major episode of mass wasting that initiated in summer 2017 evacuated the materials accumulated within the slump scar zone to form a 2.2×10⁴ m3 debris tongue comprised of colluvium transported up to 200 m down the valley and a ∼12.5 m high headwall in the central scar zone concavity. This large lower headwall observed in fall 2018 exposed about a meter of colluvium overlying icy sediments that extended to a depth of at least 14 m below the pre-disturbance surface (Figs. 2b and 3c–e). Gradual retreat of the upper headwall from 2015 to 2018 increased the scar footprint by less than 10 %, but evacuation of colluvium in 2017/18 more than doubled the mean depth and total volume of the scar cavity (Fig. 3). Thaw-driven, rainfall-enhanced remobilization of scar zone colluvium coupled the slope and stream valley by transporting large volumes of erodible substrate into the channel. Evacuation of materials from the scar zone exposed a large secondary headwall, strengthening feedbacks that drive slump proliferation (Kokelj et al., 2015).
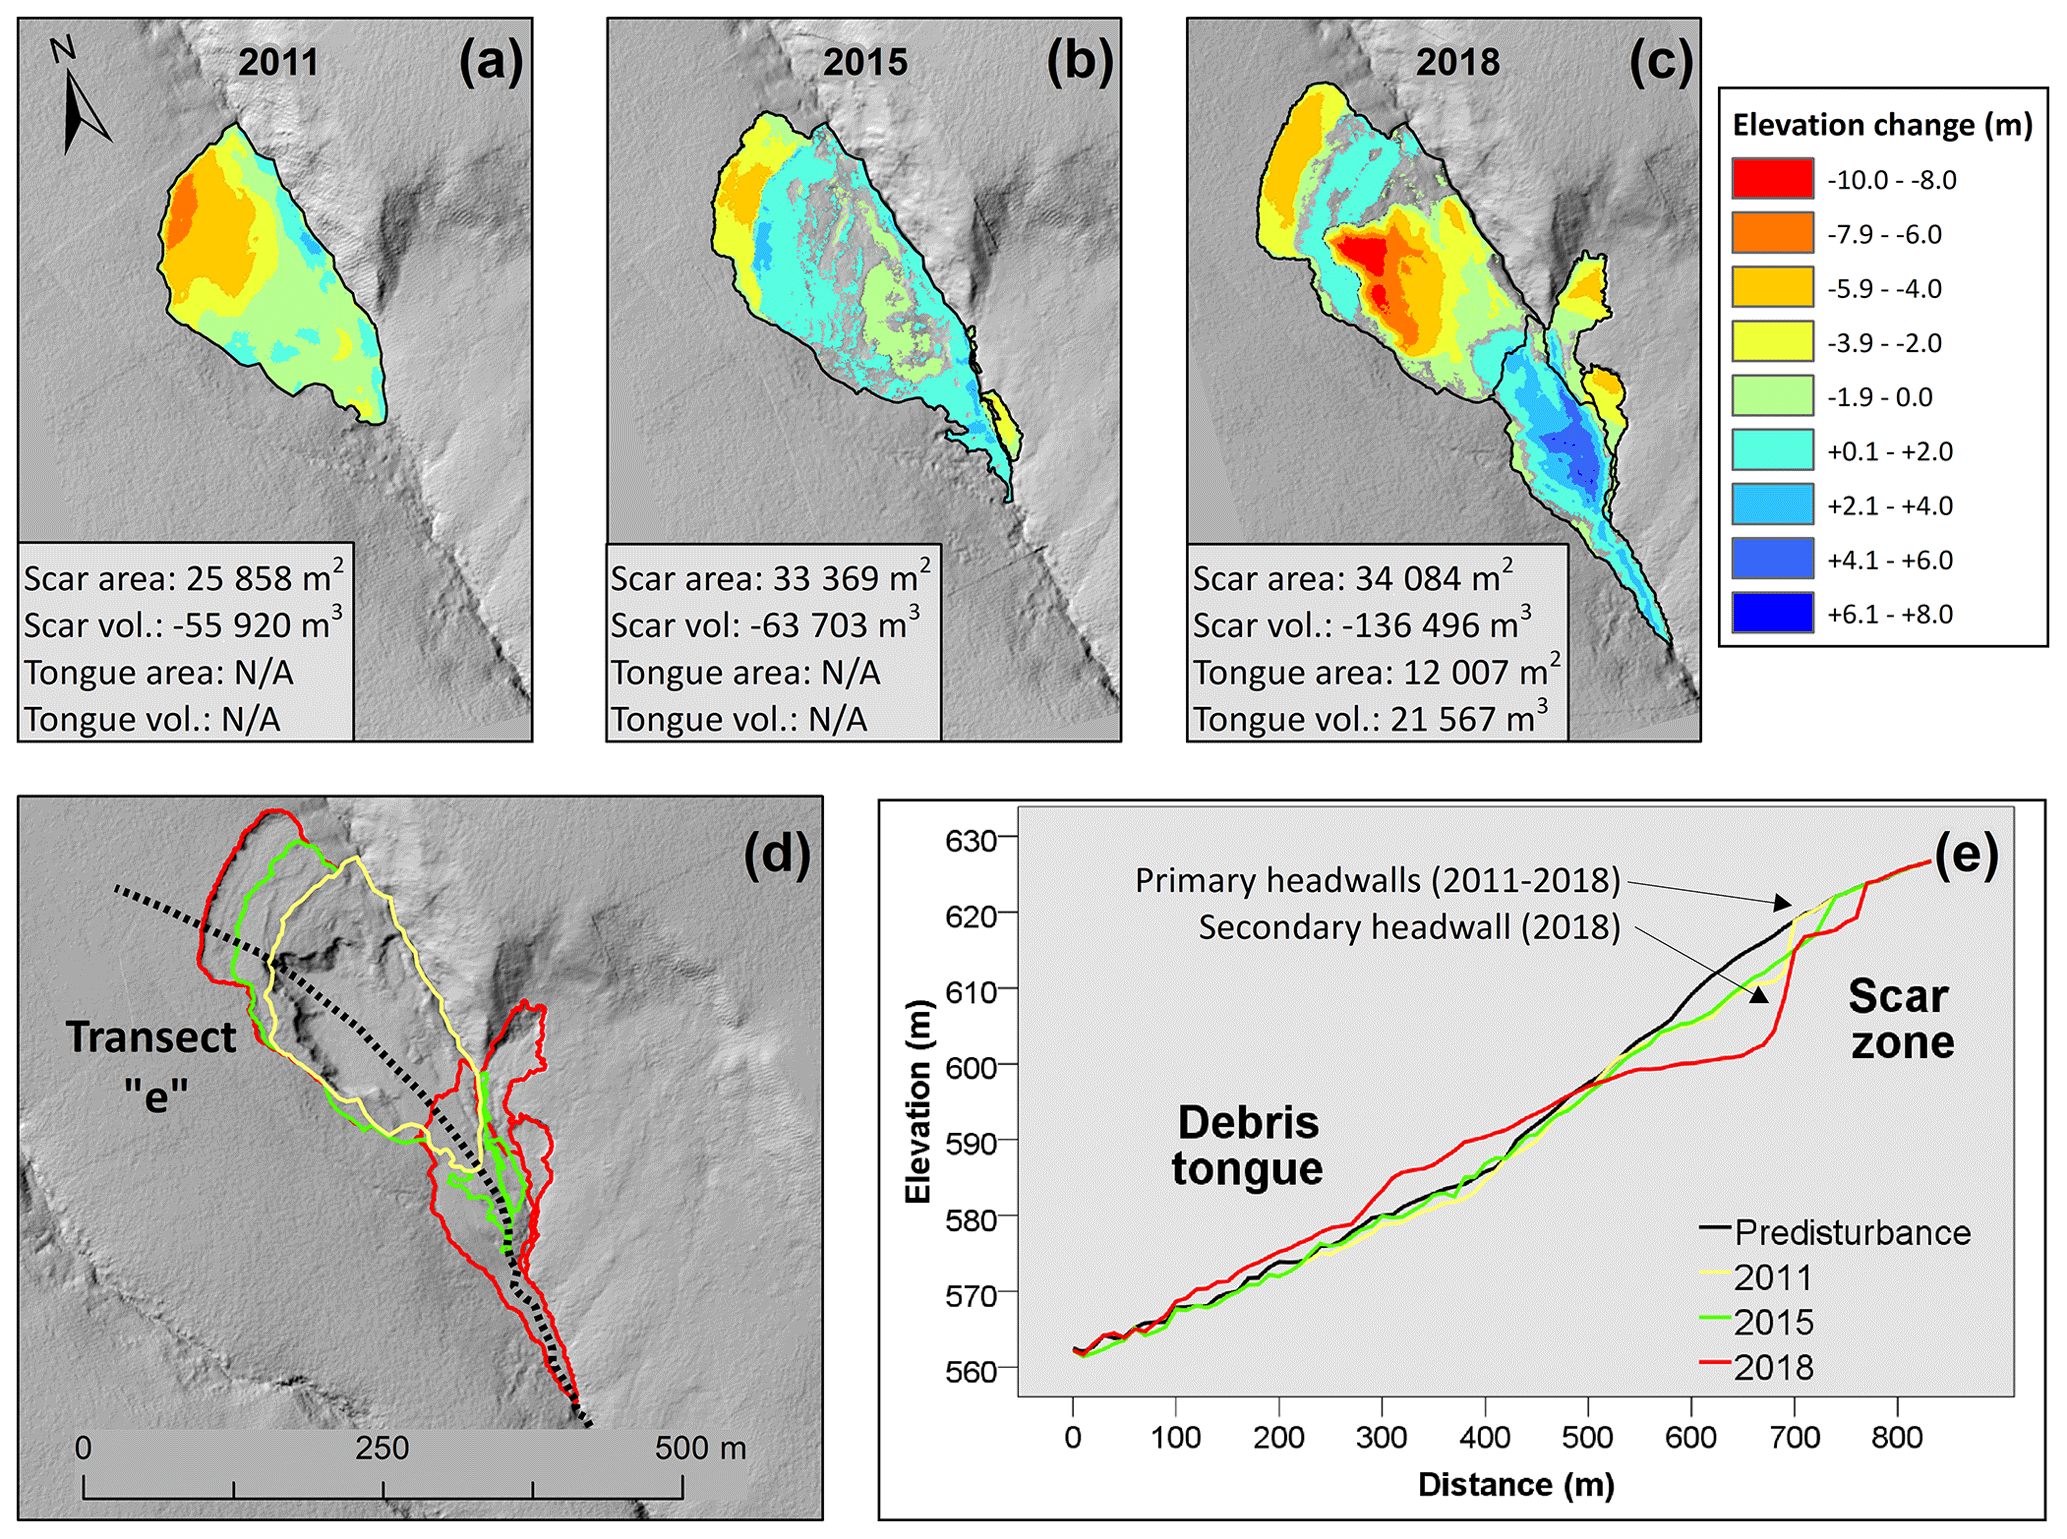
Figure 3Retrogressive thaw slump growth (slump CB), material displacement, and evolution of downstream connectivity from 2011 to 2018 on Peel Plateau, Northwest Territories, Canada. (a) 2011 difference from the reconstructed pre-disturbance terrain surface. (b) 2015 terrain differenced from the 2011 terrain. (c) 2018 terrain differenced from the 2015 terrain, showing polycyclic behavior including thaw-driven evacuation of scar materials and development of a prominent lower “secondary” headwall and scar concavity. Thaw slump and debris tongue area and volumes are calculated relative to estimated pre-disturbance surface. (d) The evolution of the thaw slump footprint from 2011 to 2018 and the topographic transect in (e) showing elevation profiles through the slump and along the valley for pre-disturbed terrain in 2011, 2015, and 2018. The hillshade in (d) is the 2018 UAV survey integrated with the surrounding 2011 regional lidar data.
3.3 Quantifying retrogressive thaw slump enlargement and downstream connectivity across the subarctic to low Arctic transition
Retrogressive thaw slump area, volume, and maximum concavity depth derived from the 2011 lidar study area (Sect. 2.3, Table S1) were compiled to investigate relationships between geomorphology and downstream connectivity for the fluvially incised Peel Plateau and lake-rich Tuktoyaktuk Coastlands and Anderson Plain (Fig. 1). Within the two lidar corridors, the digitized scar areas ranged from 242 to 253 900 m2 with a median of 3323 m2. Volume displacement ranged from 130 to 3 653 400 m3 with a median of 3859 m3, and the maximum difference between estimated pre-disturbance surface elevation and disturbed scar surface elevation (referred to as maximum concavity depth) ranged from −1.5 to −28.0 m with a median of −3.4 m for the sampled population (Table S3). The accumulation of thawed colluvium on the lower slope of smaller slope-side disturbances can produce lobes that manifest as positive relief features (Fig. 3a and b). The larger disturbances were characterized by entirely negative relief relative to the pre-disturbance terrain. The slump size metrics are distributed across 3–4 orders of magnitude in scale, indicating the geomorphic significance of the larger features. T tests on log-transformed data indicated that the mean of all slump size metrics (area, volume, and maximum concavity depth) for the higher-relief, fluvially incised Peel Plateau was significantly greater (P<0.02) than in the rolling, lake-rich terrain of the Anderson Plain and Tuktoyaktuk Coastlands.
Retrogressive thaw slump populations were grouped by their connectivity with the downstream environment. One-way ANOVA indicated significant differences in the means amongst downstream connectivity groups for slump area (; P<0.001), concavity volume (; P<0.001), and maximum concavity depth (; P<0.001) (Fig. S2). Tukey's HSD post hoc test indicated significant differences amongst all connectivity groups with disturbance area (P<0.02), volume (P<0.005), and maximum concavity depth (P<0.017), demonstrating that downstream connectivity increases with slump size. This pattern supports Sects. 3.1 and 3.2 and indicates that disturbance enlargement is linked to the coupling of slopes and downstream systems.
To further explore the slope-scale geomorphic implications of retrogressive thaw slump enlargement, we examined the relationships between slump scar area and volume and between scar area and maximum concavity depth. A linear model fit through the logarithmically transformed disturbance area and volume data (Fig. 4a) reveals a power-law relationship (R2=0.90; F=641.9; N=71; P<0.0001).
The model coefficients are comparable with those describing area–volume relationships of landslide populations for studies from temperate environments across a range of failure mechanisms, material properties, and geological settings (Klar et al., 2011). Figure 4b shows the power-law relationship (R2=0.63; F=116.2; N=71; P<0.0001) between slump scar area and maximum concavity depth described by
where the depth of permafrost thawed generally increases as thaw slumps enlarge. Residual scatter in both of these relationships reflects inherent differences in landscape, soil properties, geomorphic setting, and the stage of retrogressive thaw slump development (Figs. 2 and 3). However, the relationships indicate that slump area can be used to estimate the volume and thicknesses of permafrost thawed, improving our ability to quantify the role of thermokarst mass wasting in landscape evolution. Further investigations are required to determine whether these relationships will vary with landscape, material properties, and failure mechanisms.
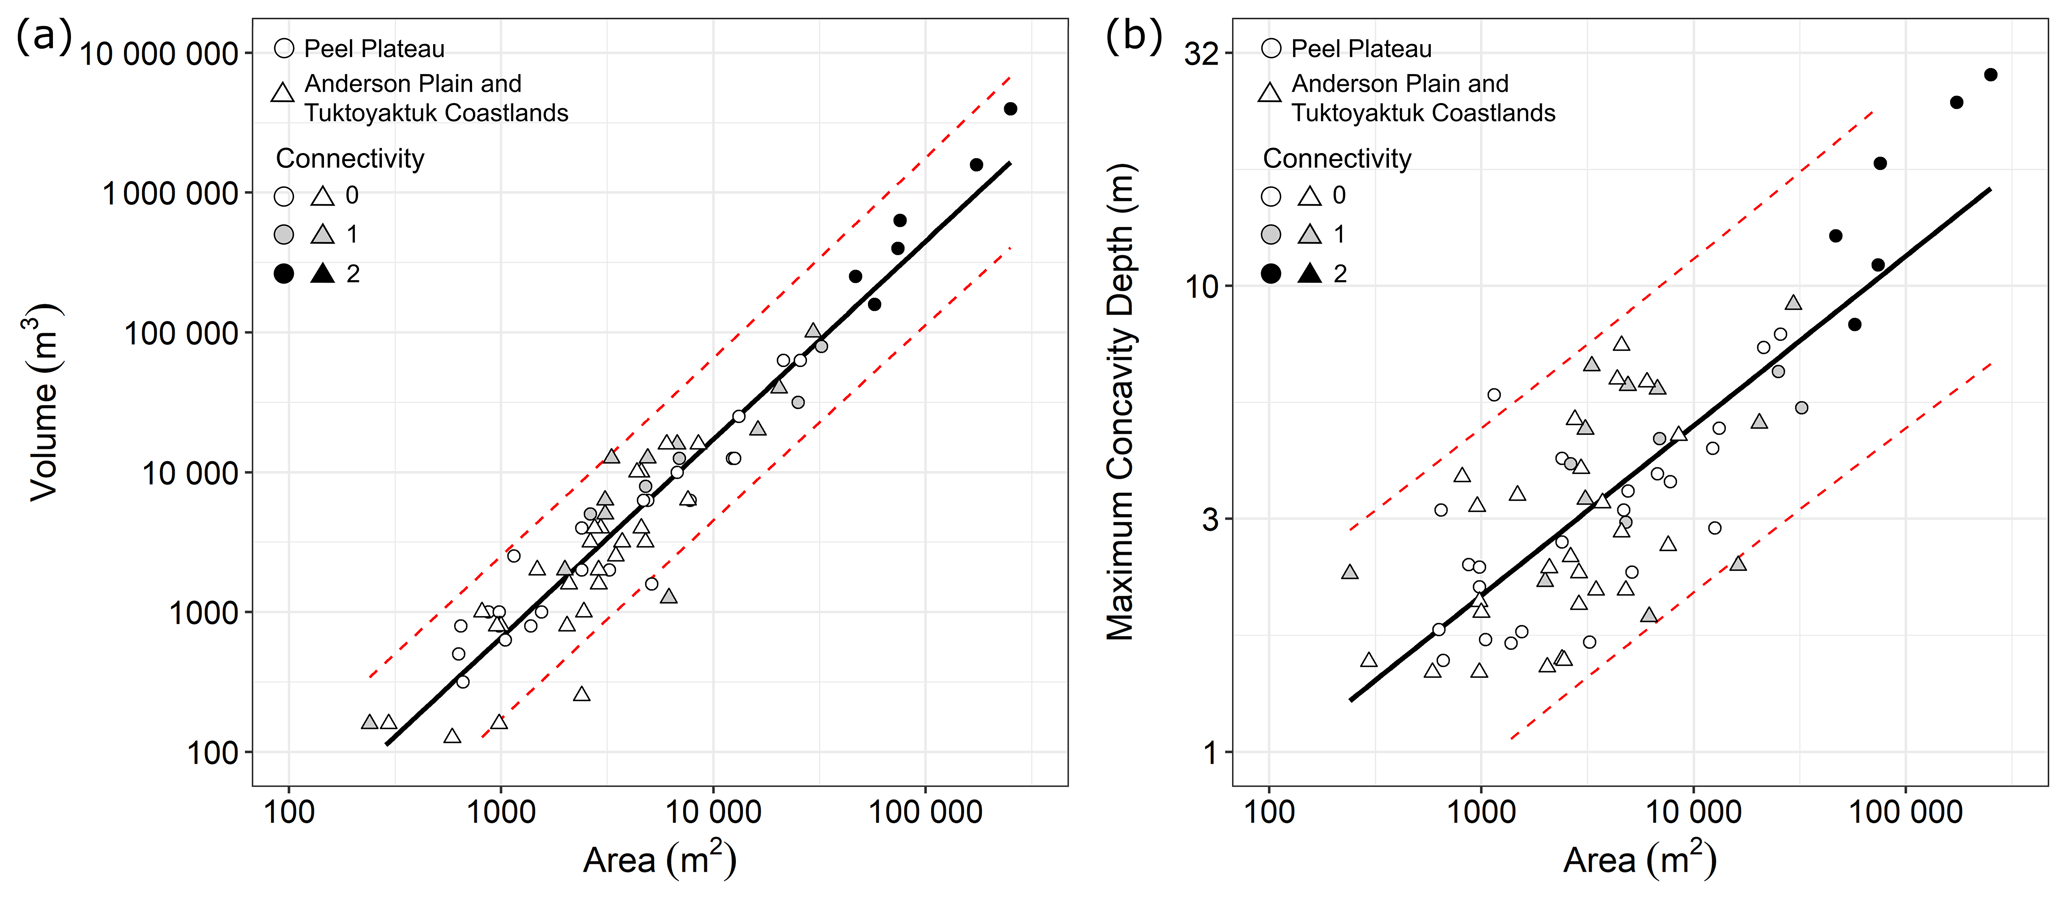
Figure 4Relationships between (a) retrogressive thaw slump scar area and volume (R2=0.90; F=641.9; N=71; P<0.0001) and between (b) retrogressive thaw slump scar area and maximum depth of concavity (R2=0.63; F=116.2; N=71; P<0.0001) for disturbances in the fluvially incised Peel Plateau and the lake-dominated Anderson Plain and Tuktoyaktuk Coastlands. Connectivity between the slope and downstream environment is categorized as follows: 0, no connectivity; 1, physical connection between the bare scar and downstream environment; and 2, evidence of downstream deposition of materials into the valley, stream channel, or lake. The red dashed lines show the 95 % confidence limit. Regression diagnostics indicate that residuals are normally distributed, and there are no unduly influential points.
3.4 Analysis of catchment-scale slope thermokarst effects, Willow River
Thaw-driven mass wasting and slope denudation for 1986–2018 were quantified for the 806 km2 Willow River catchment (Fig. 1). The fluvially incised stream network drains ice-rich glacial tills and unglaciated scree slopes of the Richardson Mountains into the Mackenzie Delta. Retrogressive thaw slumps are the dominant mode of slope failure; however, extensive field observations confirm that shallow landslides and a few large translational failures also occur (Fig. S3) (Lacelle et al., 2010). Bare or sparsely vegetated thaw slump scar and debris tongues mapped using Landsat imagery (Rudy and Kokelj, 2020) indicated a 4-fold increase in the number of active thaw slumps from 1986 to 2002 and another 2.5-fold increase by 2018 (Fig. 5a). These results contrast with an earlier assessment by Lacelle et al. (2010), in part due to a larger catchment area in this study, different timescales, and the nature of the imagery utilized. We employed the empirical models (Fig. 4) to convert digitized slump scar areas to estimates of slump volume and maximum concavity depth for the three time periods. Cumulative disturbance area and volume showed 34- and 80-fold increases, respectively, over the intervals of record (Fig. 5b and c). The median area of active thaw slump populations for 1986, 2002, and 2018 was 4510, 5680, and 8290 m2, respectively (Fig. 5d, Table S4). Comparison with mean values for the same time periods of 5000, 9770, and 17 910 m2 (Table S4) highlights the increasingly skewed nature of the population distributions as disturbances enlarge (Kokelj et al., 2015). Approximated mean slump volumes and maximum concavity depths of active thaw slumps increased over time and were respectively 6900 m3 and 3.6 m in 1986, 19 690 m3 and 4.1 m in 2002, and 59 030 m3 and 5.1 m by 2018 (Table S4). The volumes of the largest disturbances have increased by 2 orders of magnitude, and there has been at least a 3-fold increase in maximum concavity depth (Fig. 5), although the models appear to provide conservative high-end estimates of both parameters (Fig. 4). Kruskal–Wallis rank sum tests indicated significant differences in slump size indices amongst the different time periods (χ2(2)=22.825; P<0.0001). Dunn's post hoc testing showed no significant increases in disturbance area, volume, or maximum concavity depth from 1986 to 2002; however, increases in the population medians were significant for all size-related indices from the first two time periods to 2018 (Fig. 5d–f; Table S5), suggesting a period of slump initiation followed by accelerated enlargement from about 2002 to 2018. During the 2002–2018 period, development of numerous debris tongue deposits indicates major strengthening of slope-to-stream connectivity (Fig. 5a). The catchment-wide cumulative slump volume estimates of 0.15×10⁶ m3 in 1986, 1.43×10⁶ m3 in 2002, and 11.70×10⁶ m3 in 2018 reveal a nonlinear increase in thaw-driven geomorphic activity across 2 orders of magnitude over 3 decades (Fig. 5c).
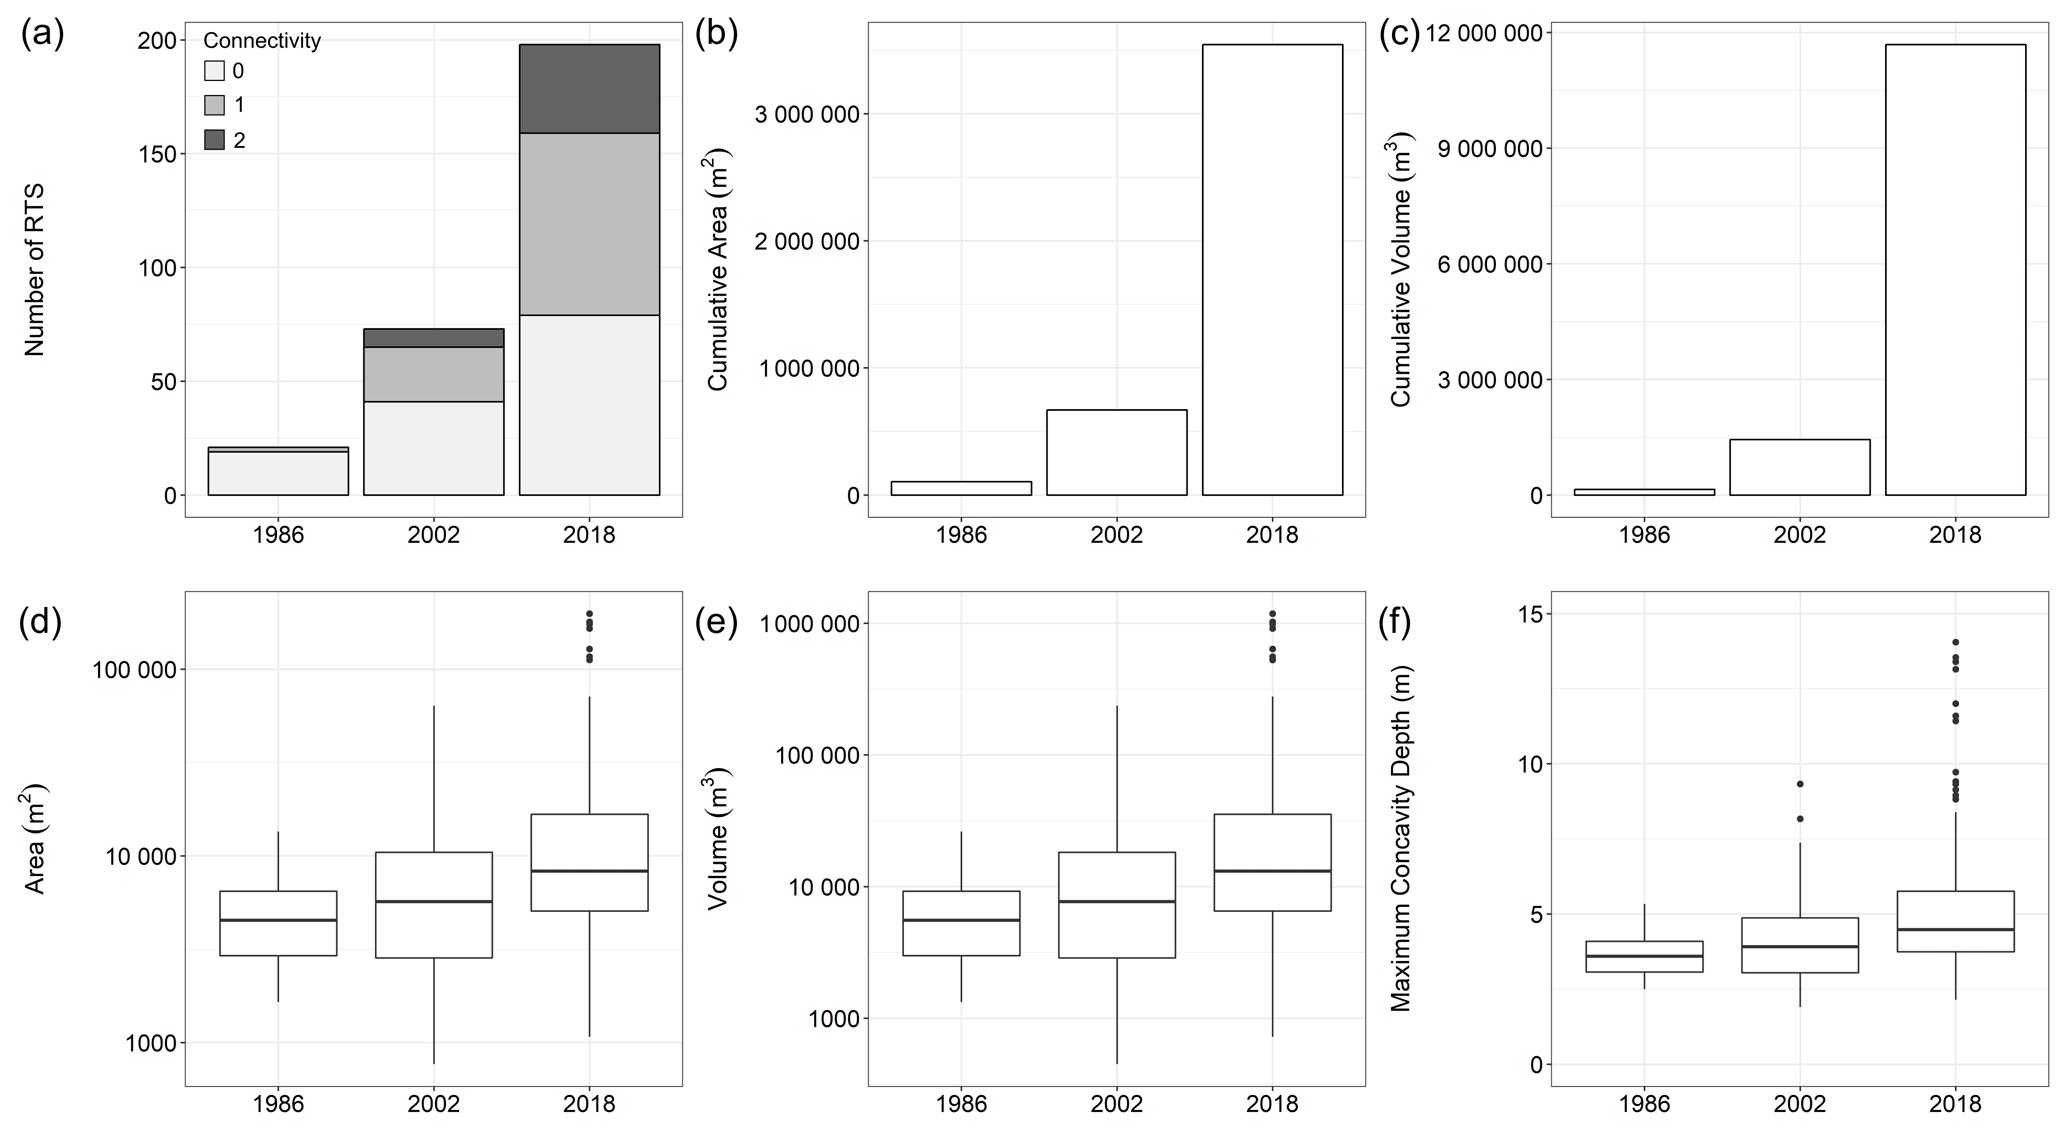
Figure 5Thaw-driven geomorphic disturbances in the Willow River catchment for 1986, 2002, and 2018. Bar graphs show (a) retrogressive thaw slump (RTS) counts and connectivity between the slope and downstream environments categorized as 0 for no connectivity, 1 for a physical connection between the bare scar area and downstream environment, and 2 for evidence of downstream deposition of materials into the valley, stream channel, or lake. (b) Cumulative slump area and (c) estimated cumulative slump volume. Box-and-whisker plots showing medians, 25 % and 75 % quantiles, minimum and maximum values, and outliers for (d) thaw slump area, (e) approximated volumes, and (f) maximum concavity depths. Note the logarithmic scale in (d) and (e). Thaw slump volume and maximum concavity depths are estimated using relationships described in Sect. 3.3 and Fig. 4. The spatial dataset is available in Rudy and Kokelj (2020).
A significant proportion of volume loss from slopes can be attributed to ground-ice melt and water loss, and a large portion of the mobilized slope materials is placed into transient storage in valley bottoms (Fig. 2). To translate the significant increases in thaw-driven geomorphic activity into values that can be compared with surface denudation rates of catchments in other regions, we normalized the combined subsidence and erosional volume losses by catchment area and differenced with the preceding time interval. These calculations indicate that for Willow River watershed, the thaw slump component of surface lowering or volumetric loss amounts to 0.1 mm yr−1 or mobilization rates of 100 for 1986–2002 and 0.79 mm yr−1 or 794 for 2002–2018. In a relatively quiescent landscape that is frozen for almost two-thirds of the year, this represents a dramatic change in the geomorphology and sediment delivery regime from thawing slopes to the stream systems.
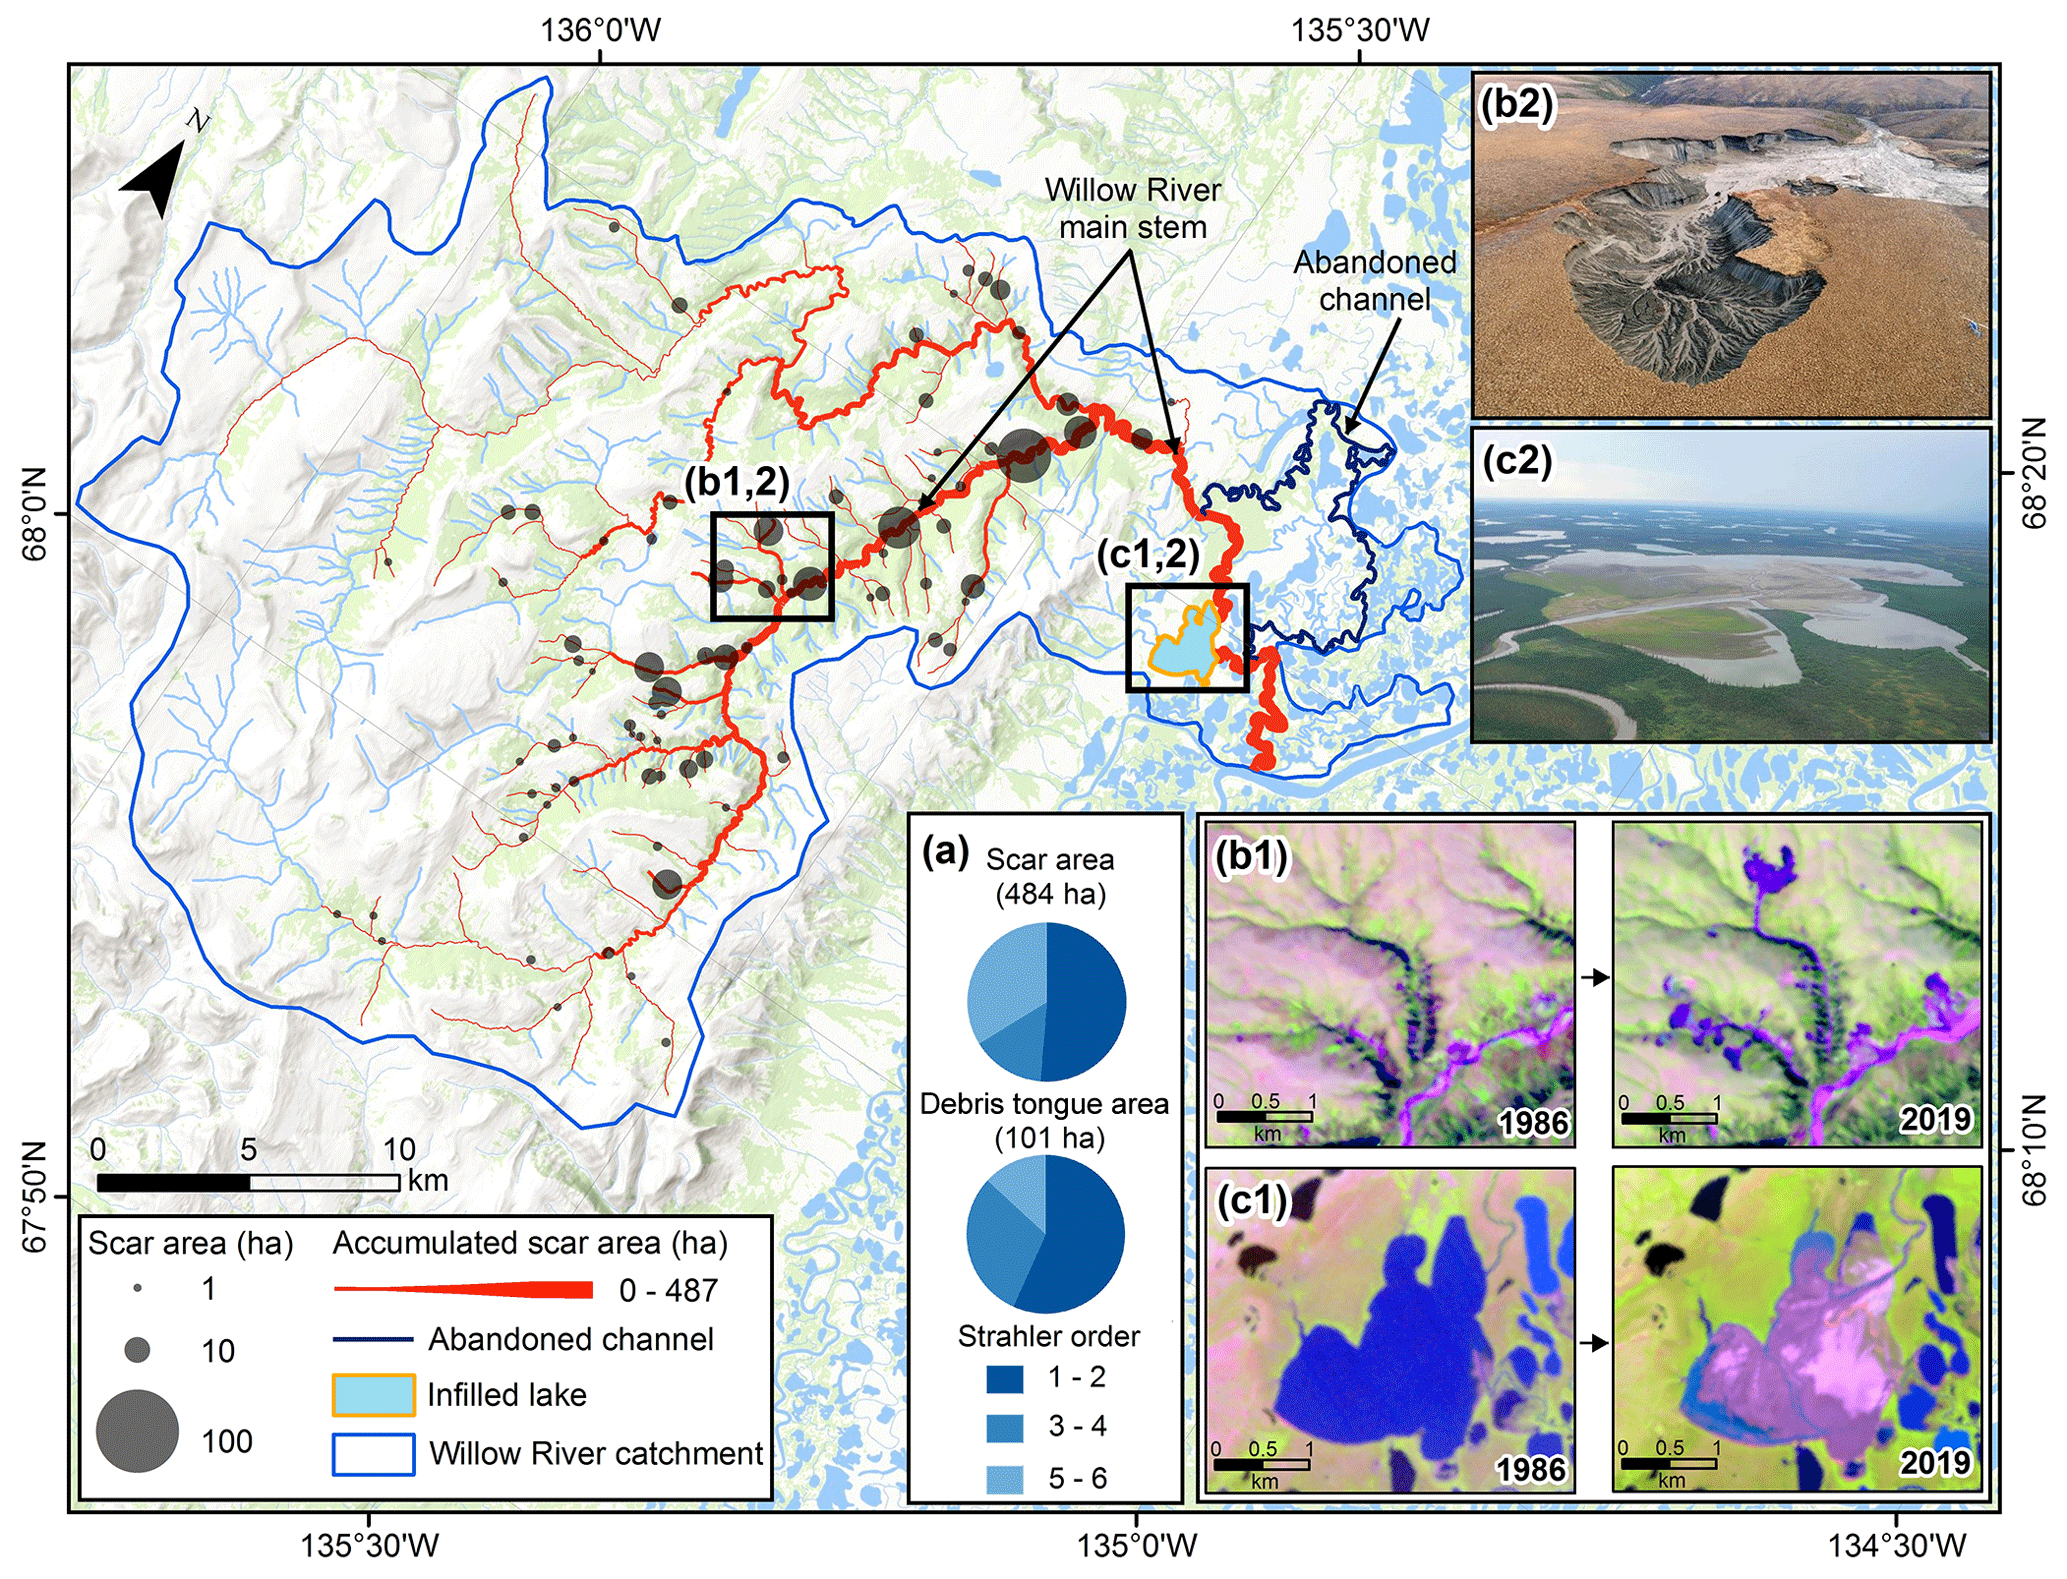
Figure 6The main map shows thaw-driven landslide impacts on the fluvial network of the Willow River (Mackenzie Delta) area. Red lines along the drainage network highlight impacted stream segments, weighted by cumulative landslide scar area (ha), and the downstream accumulation of impacts through the fluvial system. The grey proportional circles indicate the total landslide scar area>1 ha per affected stream segment, including retrogressive thaw slumps as well as shallow and deep translational slides. The abandoned channel is shown in dark blue. Boxes on the map labeled (b1, b2) and (c1, c2) indicate inset imagery and photographs. (a) The scar and debris tongue area-weighted distribution of landslide impacts by Strahler order within the Willow River fluvial network. (b1) Landsat images (7 July 1986 and 27 July 2019) indicating increases in thaw-driven landslide erosion since the late 1990s and (b2) corresponding oblique aerial photograph of the largest thaw slump within the Landsat plate. (c1) Landsat images for the same dates show the lake before and after infilling and delta development where Willow River rerouted in 2007–08 into Willow Lake. (c2) Oblique photograph of the alluvial deposit. Landsat images are false color composites of multispectral bands; R is shortwave infrared, G is near infrared, and B is green. The base map is from ESRI ArcGIS Online.
The major intensification of thaw-driven mass wasting in the Willow River catchment predominantly occurs on the uppermost slopes in the drainage networks, mainly affecting first- and second-order streams (Fig. 6). The exposure of several kilometers of slump headwall confirms that the low-order stream networks are incising ice-rich glaciated terrain and that the majority of materials mobilized by the largest disturbances comprise Pleistocene sediments and relict ground ice (Fig. 6; Video S2). Steeply incised valley sides of fourth- and fifth-order channel segments which occupy the broader valley of the Willow River main stem are also affected by a number of large, deep-seated translational failure complexes (Figs. 6 and S3) that can exhibit bedrock control and thaw-driven flows. The incised valleys are susceptible to shallow landslides, and although they transfer comparatively modest amounts of sediment to the stream network, they contribute to thaw slump initiation by exposing ground ice on the upper slopes. Our mapping of the Willow River catchment indicates that 116 km of the 861 km stream segment length was directly affected by thermokarst mass-wasting features, with downstream accumulation increasing the length of the affected network by 246 km to 42 % of the entire stream network. The downstream translation of sediments mobilized by thaw-driven mass wasting (Figs. 5 and 6) through the Willow River fluvial network is indicated by the rerouting of the outflow channel to the Mackenzie Delta in 2007/08, leading to the rapid infilling of a 3.4 km2 lake over the span of a decade (Fig. 6c1 and c2; Video S3).
3.5 Catchment-scale patterns of thaw-driven mass-wasting effects and sediment flux across catchment scales
The patterns of slope thermokarst distribution and intensification were assessed across catchment scales for a 3520 km2 area on Peel Plateau and a contrasting 1220 km2 area on southeastern Banks Island (Fig. 1). The distribution of slope disturbance determined from SPOT 4/5 2005–2010 and 2016/17 Sentinel-2 imagery on Peel Plateau shows increasing frequency across all size classes (Fig. 7a). This pattern reflects initiation of new disturbances and thaw-driven enlargement of existing slope failures. On southeastern Banks Island, overall slope disturbance density was greater, but the relative increase over the past decade was lower than for Peel Plateau. A distinct shift towards larger thaw slumps on Banks Island suggests disturbance growth and coalescence (Fig. 7b). Figure 7c provides a cumulative summary of the points at which the river network is being impacted by thaw-driven mass wasting. Evidently, thaw slumps and slides tend to impact the channel at 1–100 km2 catchment scales, consistent with patterns observed for Willow River (Fig. 6a). The temporal shift from 2005–2010 to 2016/17 towards a relative increase in direct effects to larger channels in the Peel Plateau region reflects the greater watershed sizes and thus more available downstream terrain for new disturbance impacts (Fig. 7c). Some of the main Peel River tributaries are becoming increasingly affected by large slope thermokarst failures and shallow slides similar to those observed in the Willow River catchment (Figs. 6 and S3). On Banks Island, the smaller fluvial networks were already highly impacted by thaw slumping in 2005 (Segal et al., 2016b, Lewkowicz and Way, 2019), leaving less available terrain for expansion of direct network impacts, as indicated by smaller increases in slump incidence (Fig. 7b) and a static pattern in the distribution of catchment disturbances between the two time periods (Fig. 7c). Figure 7d reinforces the fact that the geomorphic and geochemical impacts on headwater streams tend to be more intense than direct impacts on larger systems because the size of the disturbance relative to the watershed area will be far greater. Further downstream, the overall impacts from individual disturbances and cumulative effects will be proportionately less given the much larger upstream catchment area and greater stream transport capacity relative to sedimentary or geochemical yields from the disturbance.

Figure 7The patterns of retrogressive thaw slump intensification in fluvial networks for 2005–2010 and 2016/17 in the Peel Plateau (3520 km2) and eastern Banks Island (1220 km2) regions. (a, b) Size distribution of thaw slumps for the two time periods; white indicates 2005–2010, black indicates 2016/17, and shading shows overlap between 2005–2010 and 2016/17 distributions. (c) Cumulative count of thaw slumps plotted against upstream catchment area. (d) The ratio of disturbance area to upstream catchment area plotted against upstream catchment area. (e) July–September instantaneous total suspended solid flux rates for streams of the Peel watershed and adjacent areas.
There is a notable dearth of river sediment monitoring over the vast thermokarst-sensitive regions of northwestern Canada. A compilation of available grab samples of stream total suspended solid concentrations coinciding with discharge measurements within and adjacent to Peel River basin for catchments from 10−1 to 104 km2 indicates a negative trend in specific low-flow fluxes with catchment area (Shakil et al., 2020b). Estimates of low-flow TSS fluxes for small catchments affected by thaw-driven mass wasting are up to 2 orders of magnitude greater than for larger watersheds and several orders of magnitude greater than for undisturbed and unglaciated catchments (Fig. 7e).
3.6 Thaw-driven mass-wasting effects propagate through hydrological networks to the ocean
Here we project the potential cascade of slope thermokarst effects through Arctic drainage networks from permafrost terrain of northwestern Canada (Fig. 8). The summary of active permafrost landslides by Strahler stream order for Banks Island (70 794 km2), Amundsen Gulf (90 288 km2), Peel River (76 506 km2), and Keele–Redstone (39 957 km2) watersheds indicates that the greatest abundance and highest density of directly affected stream segments were on Banks Island ( km2) and the lowest were in the Amundsen Gulf ( km2). However, major thermokarst hotspots associated with ice-rich moraine as well as glaciofluvial and glaciolacustrine materials occur within all four watersheds where slope disturbance densities are an order of magnitude greater than the watershed average. About 71 % of direct thaw-driven mass-wasting effects on streams and over 81 % of direct effects on lakes occur within first- and second-order hydrological segments (Fig. 8a), corroborating catchment-scale patterns (Figs. 6 and 7) and indicating that thousands of small streams and hundreds of lakes across northwestern Canada are directly affected by slope thermokarst disturbances (Fig. 8b). The main impacts of thaw-driven mass wasting on hydrological networks are concentrated in well-defined geographical areas, with large regions free of major slope thermokarst. For Banks Island and the Peel and Keele–Redstone watersheds, low disturbance densities occur west of the late Wisconsinan ice limit. Thaw-driven landslides were sparse in unglaciated cordilleran areas and the glaciated Precambrian Shield with patchy till veneer. Low disturbance density also characterizes the Taiga Plains of central Mackenzie Valley; however, some valleys incised in tills and glaciolacustrine deposits are prone to thaw-related failures, including the Mackenzie River main stem (Figs. 8 and S4iii).
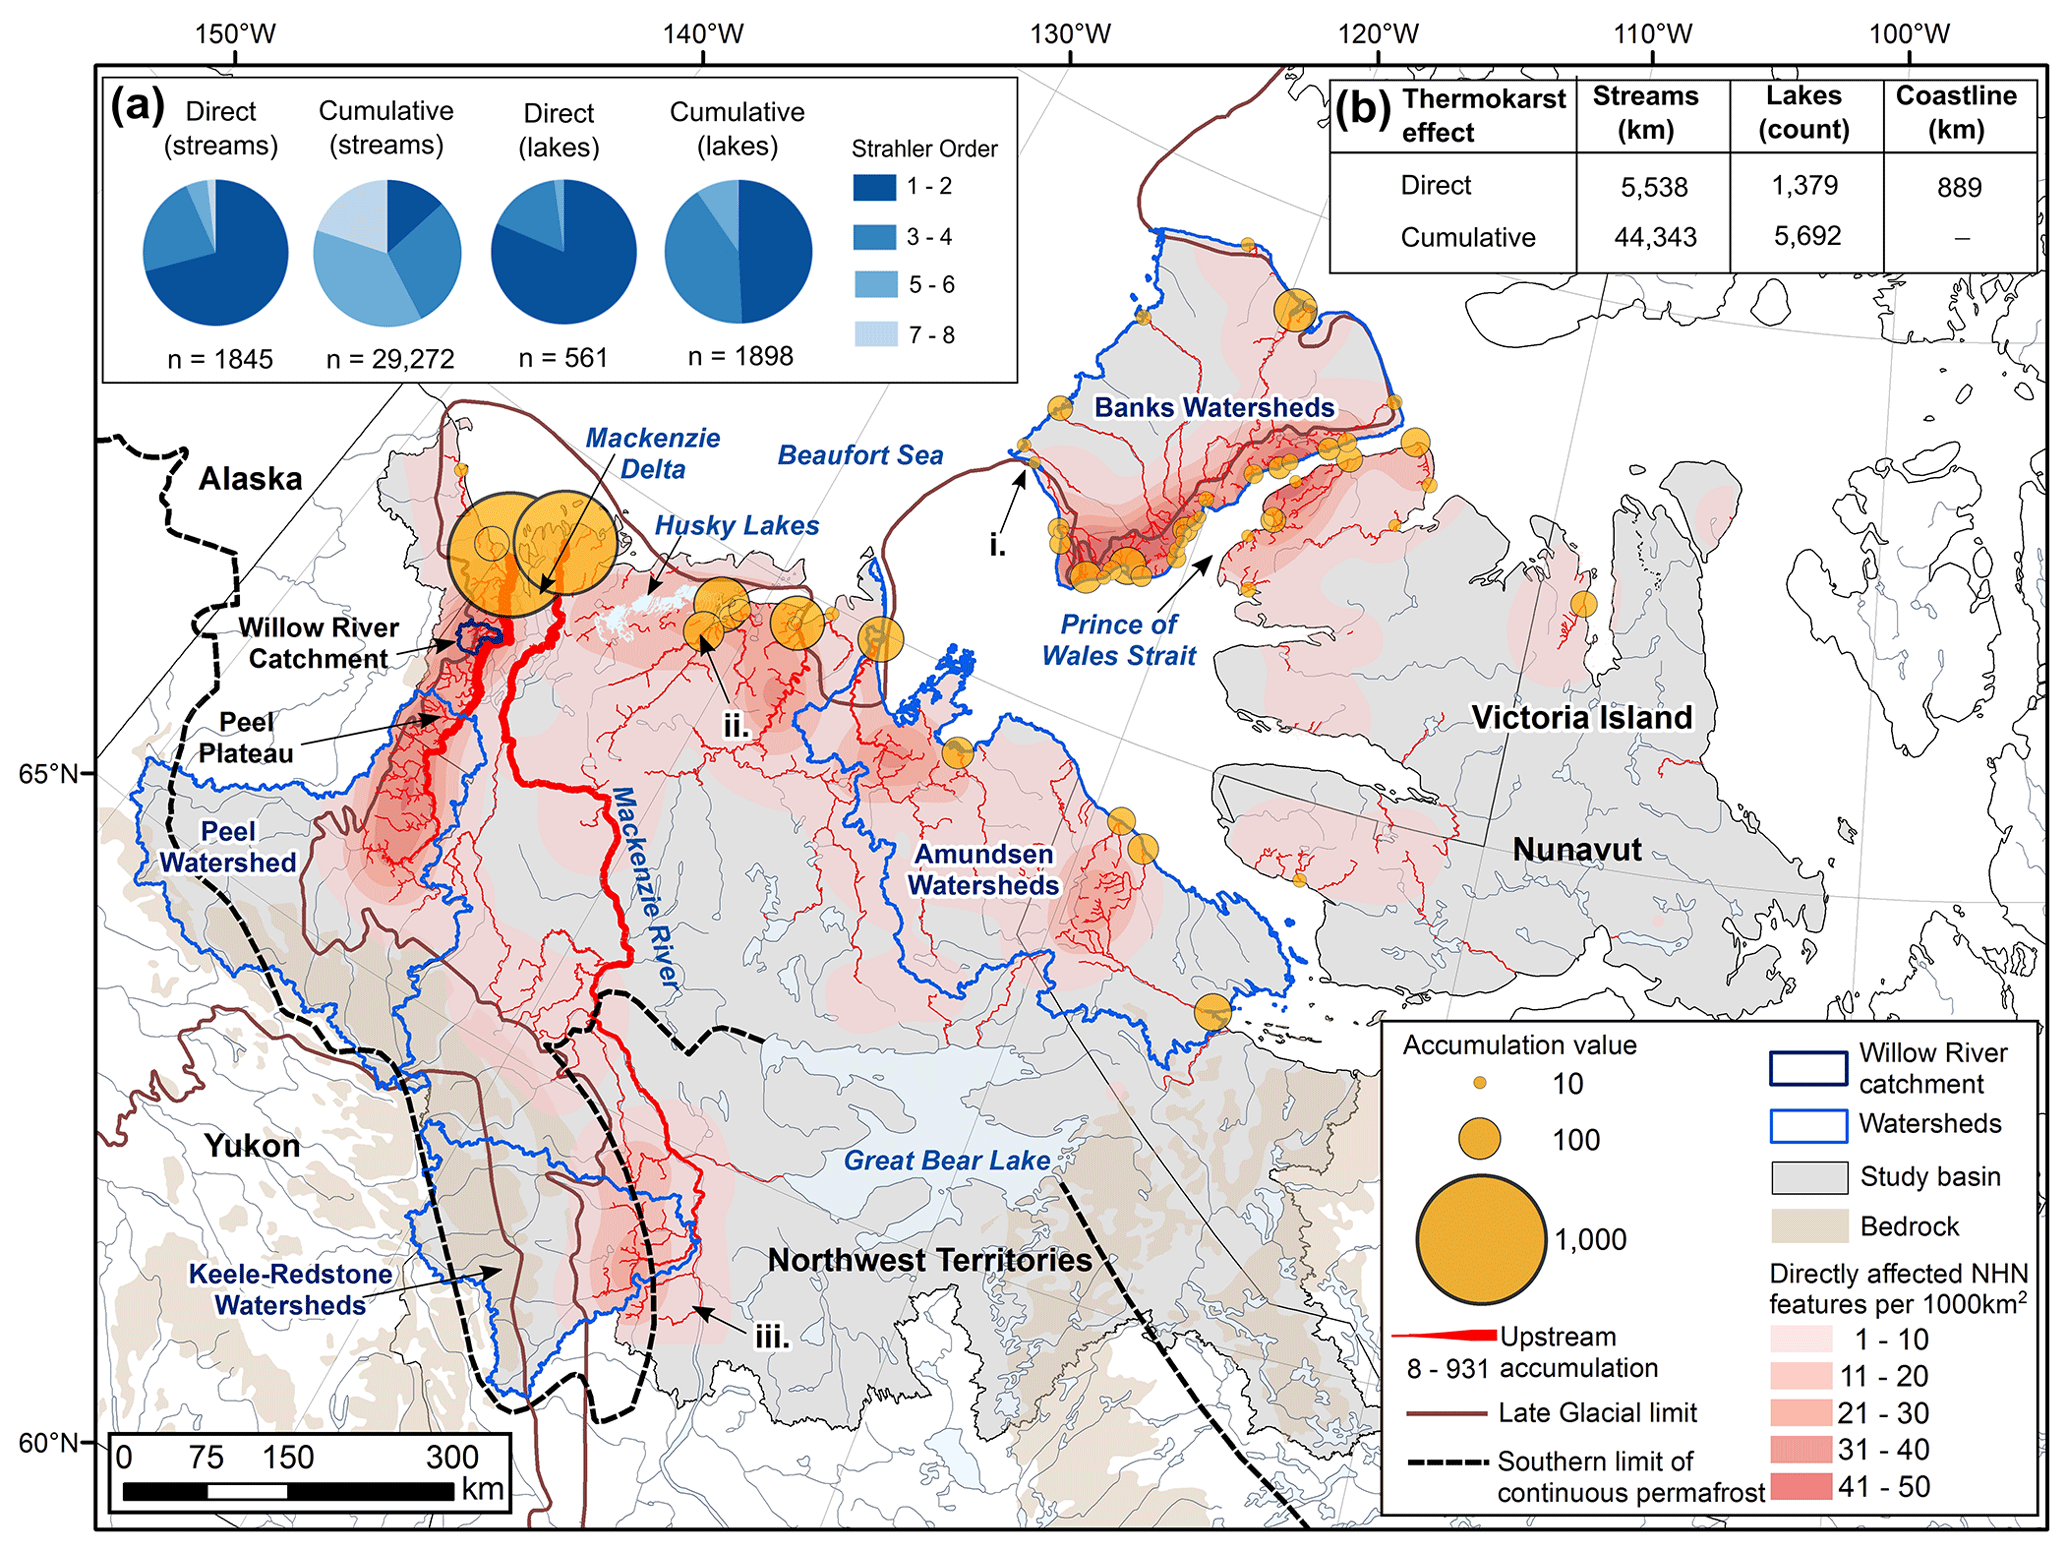
Figure 8Thaw-driven landslide density and downstream accumulation of effects through Arctic drainage from permafrost terrain of northwestern Canada. The heat map depicts all directly affected stream, lake, and coastal National Hydro Network (NHN) segments mapped. All upstream accumulation values shown within the fluvial network are >2 and at the coast are >10. Accumulated effect contributions of the Mackenzie and Peel rivers to the Beaufort Sea are routed separately for comparison. (a) Counts of direct and accumulated thaw-driven mass-wasting effects on fluvial systems partitioned by Strahler order and hydrological feature type for the four major watersheds outlined in blue. (b) Table showing the lengths of directly affected hydrological network and accumulated effects, counts of directly and indirectly affected lakes, and total directly affected coastline for western Arctic drainage from permafrost terrain. Remote sensing examples of thaw-driven downstream sedimentation provided in Fig. S4 for (i) Sachs River and Fish Lake, (ii) Miner River inflow to the Husky Lakes estuary, and (iii) massive deep-seated permafrost failure on Johnson River. The late glacial limit is from Dyke and Prest (1987), bedrock geology is from Fulton (1995), the permafrost boundary is from Brown et al. (1997), and the National Hydro Network (NHN) base data are from Natural Resources Canada (2016). The base map is from ESRI ArcGIS Online.
As a broad summary, thaw-driven mass wasting directly affects over 5538 km of stream segment length, 1379 lakes, and about 889 km of coastline in the Arctic drainage area of northwestern Canada (Fig. 8b). Approximately 44 343 km of stream network and over 5692 lakes are susceptible to indirect effects, reflecting 8.0-fold (streams) and 4.1-fold (lakes) increases over the extents of direct hydrological effects. The much greater extents of downstream effects (Fig. 8a) occur because thermokarst mass wasting predominantly impacts low-order streams, often in headwaters of the hydrological network. A high density of thaw slumps affecting small streams that drain eastern Banks Island and northwestern Victoria Island indicate major propagation of sedimentary and geochemical effects directly to the coastal zones of the Prince of Wales Strait (Fig. 8). North-northeast of the Mackenzie Basin, several major Arctic river catchments have areas of high landslide density with the potential to propagate downstream effects. Ice-rich glacial deposits of Anderson Plain and Tuktoyaktuk Coastlands surround the Husky Lakes estuary, which is influenced by shoreline slumping, discharge from numerous small slump-affected, lake-dominated catchments, and a few slump-affected northward-flowing rivers, indicating a regional hotspot of accumulated effects (Figs. 8 and S4ii). Coastal slumping along the Yukon North Slope and uplands east of Mackenzie Delta, in conjunction with lakeside slumps, comprises the majority of mass-wasting processes in these areas, whereas fluvial transfer from inland impacts on the coast is limited. High densities of thermokarst mass wasting affect numerous fluvially incised networks draining ice-rich glaciated landscapes of the lower Mackenzie and Peel River basins, so these two major rivers propagate the greatest magnitude of thaw-driven sedimentary and geochemical effects to the Mackenzie Delta and Beaufort Sea (Fig. 8).
4.1 Thresholds and connectivity between slopes and downstream environments
Results indicate that intensification of thaw-driven mass wasting is altering the Holocene-scale regime of sediment production, mobilization, and delivery in glacially conditioned permafrost landscapes of northwestern Canada (Figs. 2, 3, 6, 7e, and S4). Hillslope–channel coupling is increasing as slope thermokarst disturbances evolve into multi-decadal, thaw-driven conveyors of fine-grained sediment and solutes to downstream environments. Slope morphology and sediment yields in unaffected catchments and the absence of relict valley fills suggest that over the past millennia, material redistribution associated with most slope failures was restricted to the slope system (Figs. 2a and 3a–b). Exceedance of critical thresholds controlling sediment detachment from hillslopes driven by interdependent factors of warming, precipitation, permafrost thaw, and soil saturation (Lewkowicz and Way, 2019; Segal et al., 2016b; Ward-Jones et al., 2019) has instigated processes and feedbacks (Figs. 2 and 3) (Kokelj et al., 2015) that rapidly mobilize materials and couple slopes with hydrological systems across many glacially conditioned permafrost environments (Figs. 5–8). The nonlinear growth of disturbances, strengthening of downstream connectivity (Figs. 2–4), and predominant impacts on low-order streams (Figs. 7c–e and 8a) emphasize the fact that increasing disturbance size is having a disproportionate effect on the magnitude and duration of downstream effects.
Recent thaw-driven mobilization of slope materials has increased storage in valley bottoms by several orders of magnitude, forming large valley fills (Figs. 2 and 3); together with the steepening and lateral displacement of channels, this supply of stored materials will amplify fluvial sediment transport for decades to centuries. Slope-to-channel coupling is particularly enhanced in steeply incised and confined valleys so that environments like the Peel Plateau have emerged as hotspots of geomorphic change and downstream effects (Figs. 6 and 8) (Kokelj et al., 2013; Zolkos et al., 2018). The transition from the long-term “supply-limited” norm of Holocene permafrost geomorphic systems (sensu Carson and Kirkby, 1972; Howard, 1994) is striking. The change is emphasized by the unprecedented climate-driven sediment mobilization from long-frozen slopes rapidly overloading a network of newly “under-fit” streams (Figs. 2, 3, and 6). Enhanced slope–channel coupling is evident across the study region; however, the downstream conveyance of sediment and geochemical effects will vary (Shakil et al., 2020a) because the connectivity of slope and hydrological systems is inherently sensitive to substrate and geochemical properties, network configuration, stream power, physiography, permafrost conditions, and climate drivers. While it is difficult to translate thousands of discrete and dynamic slope disturbances into coherent estimates of river impacts at the basin scale, this is a central challenge facing periglacial geomorphologists, biogeochemists, and aquatic ecologists in the Anthropocene.
4.2 Nonlinear disturbance trajectories
The thickness of materials mobilized by thaw-driven mass wasting is associated with disturbance volume, and both parameters relate to thaw slump area via power-law relationships (Sect. 3.3; Fig. 4). The area–volume model we derived has coefficients closely comparable to landslide populations in temperate environments (Klar et al., 2011). These relationships are complex because permafrost, geomorphic, and climatic factors influence the growth trajectories of thaw-driven slope disturbances (Figs. 2 and 3), producing diverse and dynamic morphologies over different terrains. Regardless, these relationships provide a first empirical basis for estimating thaw-driven denudation as a function of disturbance area (Figs. 4 and 5) and should enable better approximation of the geomorphic, sedimentary, geochemical, and carbon consequences of intensifying slope disturbance regimes. Further studies are required to determine the potential variability in area–volume relationships with landscape type, thaw slump development stage, material properties, and different failure modes.
Rapid increases in the area of thaw-driven slope disturbances have a major influence on terrain evolution as well as downslope sediment and geochemical mobilization. The increasing prominence of larger and proportionately deeper disturbances indicates greater volumetric permafrost thaw and sediment mobilization than would occur for the equivalent combined surface area of numerous small slumps (Fig. 4; Table 1). This also suggests that a greater range of material types are likely to be thawed and entrained (Fig. 2). In glacial deposits, materials excavated from deeper in the soil stratum have lower organic matter contents and are unlikely to have been subject to thaw-induced geochemical changes that characterize the active layer and near-surface permafrost (Lacelle et al., 2019). Enlargement and accelerated back wasting of the slump headwall, coalescence of thaw slumps, and polycyclic behavior (Figs. 2 and 3) increase the production of saturated substrate and the probability of material evacuation from the scar zone. As the magnitude of thaw-driven slides increases, there is also greater potential for bedrock or, in discontinuous permafrost regions, unfrozen materials to be exposed, expanding the range of geomorphic and geochemical effects and increasing linkages between surface and subsurface flow paths (Walvoord and Kurylyk, 2016).
The intensification of thaw-driven mass wasting is inextricably linked with the strengthening of downstream connectivity (Figs. 2–4, S2; Tables 1 and S4). For example, as retrogressive thaw slumps enlarge, greater volumes of material that vary laterally and stratigraphically are mobilized, mixed as a saturated slurry, and transported by a suite of mass-wasting processes to form colluvial deposits that can veneer slopes, accumulate in downstream environments, or enter larger river channels, as well as lacustrine or coastal environments (Figs. 2, 3, S1, S3, and S4) (Kokelj et al., 2015; Houben et al., 2016; Ramage et al., 2018). Debris tongue development in small streams also commonly blocks drainage and has caused lakes and ponds to form at hundreds of locations (Figs. 2 and S4). The rapid intensification of thaw-driven mass wasting combined with variation in the type of landscapes being impacted as well as the nature and magnitude of material mobilized has a range of geomorphic, biogeochemical, and ecosystem implications that require study (Tank et al., 2020; Vonk et al., 2019) so that the consequences can be predicted in an informed manner.
4.3 The river network: transfer of thermokarst erosional materials from source to sink
This spatially nested study provides several insights on the evolving nature of slope thermokarst and the effects on hydrological networks. Firstly, acceleration of thaw-driven mass wasting is affecting thousands of first- and second-order lakes and streams in glacially conditioned permafrost landscapes (Fig. 8). Major sedimentary, geochemical, and ecosystem impacts upon low-order stream networks have been abrupt because the magnitude of disturbance and enhancement of downstream connectivity facilitate propagation through small systems with an inherently limited capacity to absorb disturbance (Fig. 7c and d). Thaw-driven mass wasting can entirely change the character of the stream reach (Figs. 2, 3, and S4), the sediment and geochemical fluxes (Fig. 7e) (Kokelj et al., 2013; Shakil et al., 2020a), and the associated habitat potential (Chin et al., 2016). Secondly, the thaw-mobilized sediment and geochemical loads conveyed through the hydrological networks are directly impacting or accumulating in thousands of low-order lakes in glacially conditioned environments (Fig. 8) that are also inherently predisposed to abrupt limnological responses (Houben et al., 2016; Kokelj et al., 2009). Thirdly, slope thermokarst predominantly occurs at the 10−1 to 102 km2 catchment scales on which the geomorphic impacts are prolific (Figs. 5–7). By tracking changes in the size and distribution of thaw slump features within the Willow River study catchment, we estimated a 2 order of magnitude increase in thaw-driven mass wasting from 1986 to 2018 (Fig. 5a–c). By integrating sediment and ground-ice loss, we estimated about an order of magnitude increase in the contribution to catchment-scale denudation from 0.1 (1986–2002) to 0.8 mm yr−1 for the 2002–2018 period (Figs. 5 and 6). Fourthly, fluvial networks integrate a time-transient cascade of watershed effects, indicating that water quality, aquatic ecosystems, and fish habitat will be affected across increasingly larger river systems and coastal environments in the study domain (Fig. 8). Hillslopes along higher-order channels are also subject to the direct effects of thaw-driven landslides, resulting in cumulative sedimentary and geochemical effects on larger systems (Figs. 6, S3, and S4). Unequivocal evidence that thermokarst-derived sediments, in addition to geochemical effects, are propagating through fluvial networks is provided by channel rerouting and rapid infilling of a large lake where the Willow River discharges to Mackenzie Delta (Fig. 6; Video S3) and by the increases in turbidity of numerous downstream lake, delta, estuary, and coastal environments (Fig. S4), which coincide with our predicted areas of downstream accumulated effects (Fig. 8).
4.4 Hydrological connectivity defines a significant global change hotspot
The significance of thaw-driven mass wasting is magnified by the propagation of sedimentary and geochemical effects to freshwater systems and the marine environment (Ramage et al., 2018; Rudy et al., 2017a; Vonk et al., 2019). While we have not simulated dynamic routing of sediment across the 994 860 km2 study area, our nested design demonstrates evolving linkages between slope thermokarst and hydrological systems (Figs. 2–8). Rapid proliferation of numerous major point-source disturbances amplifies the potential of downstream cumulative effects as mobilized sediments, solutes, and carbon transit a sequence of storage reservoirs and reinforce a thermokarst signal that is projected to cascade across increasing watershed scales to marine environments through the coming century. Although this broad-scale analysis (Fig. 8) neglects relative disturbance intensity, geomorphic and biogeochemical sinks, the variation in slope–downstream connectivity, and transport gradients, it provides a spatially explicit framework for exploring the distribution and propagation of thermokarst effects through hydrological networks. Identification of thaw-driven sediment and solute source areas, and the primary hydrological networks that convey slope thermokarst effects to coastal environments, emphasizes the interconnected nature of this globally significant thermokarst hotspot (Fig. 8) and could guide future scientific investigations in the study region.
4.5 Glacial legacy controls intensity of thaw-driven mass wasting and impacts on fluvial networks
Glacial legacy, geomorphic setting, and climate history combine to determine the distribution and intensity of thaw-driven mass wasting and the nature and routing of downstream effects across permafrost terrain of northwestern Canada (Figs. 1 and 8) (Kokelj et al., 2017a). A cooling trend through the Holocene (Porter et al., 2019) preserved ground ice and maintained moraine, glaciofluvial, glaciolacustrine, and glaciomarine deposits in a quasi-stable state, though climate-driven episodes of permafrost thaw, most notably in the early Holocene, have left their imprint in the form of ancient landslide scars, thaw lakes, colluvial deposits, and a regional thaw unconformity (Burn, 1997; Lacelle et al., 2019; Mann et al., 2010; Murton, 2001). The millennia of cold-climate constraints on slope evolution and fluvial network development are made apparent by the abundance of steeply incised or solifluction-smoothed valley slopes underlain by ice-rich permafrost and now juxtaposed with adjacent, increasingly large climate-driven mass-wasting features that are mobilizing large volumes of materials that far exceed the transport capacity of low-order streams (Figs. 2, 3, 5, 6, S3, and S4). In continuous permafrost regions, climate-driven rejuvenation of post-glacial permafrost slope evolution is driven primarily by top-down thawing, causing shallow sliding and thaw slump development (Figs. 1–3) (Lewkowicz and Way, 2019; Segal et al., 2016b; Ward-Jones et al., 2019). However, ground warming and a loss of soil strength at depth have also led to increasing frequency and magnitude of deep-seated rotational and translational slope failures in low and subarctic environments (Figs. S3 and S4iii) (Aylsworth et al., 2000). The intensification of precipitation regimes throughout parts of the study area has increased thermo-erosion, shallow landsliding, and downslope sediment transfer in active thaw slumps so that thawing slopes are increasingly pushed toward an unstable state (Fig. 2) (Kokelj et al., 2015). Furthermore, ecosystem disturbances such as forest fires are expected to occur more frequently in the region with climate change (Wotton et al., 2010), compound effects of warming on permafrost (Holloway et al., 2020), and trigger an array of slope mass-wasting processes in areas already predisposed to slope instability (Fig. 8). The present intensification of thaw-driven mass wasting and increasing sedimentary and geochemical fluxes could be counteracted by feedbacks such as climate cooling, exhaustion of sediment supply and progressive loss of ground ice from the most sensitive slopes, and gradual thaw-driven decrease in slope gradients; however, these processes are most relevant at centennial timescales or greater.
The most intensive slope thermokarst activity in North America, and perhaps across the circumpolar Arctic, has been associated with western margins and recessional positions of the Laurentide ice sheet (Figs. 1 and 8) (Kokelj et al., 2017a) where preservation of relict segregated and glacier ice (Lacelle et al., 2010; Lakeman and England, 2012; Mackay, 1971; Murton et al., 2005) as well as aggradation of Holocene ground ice (Burn, 1997; Holland et al., 2020) is hosted within thick glacial deposits. These ice-rich glacial materials are derived largely from Paleozoic and Cretaceous sedimentary rocks, and the majority of the deposits include fine-grained, solute-rich materials easily mobilized by thaw-driven slope failure and fluvial processes (Figs. 2, 3, 6, and S4). These environments stand in contrast to the relatively stable slopes of glaciated terrain in shield-dominated landscapes in southeastern portions of this study region. Areas of uplifted and incised glaciomarine deposits also fit within the framework of permafrost-preserved glacially conditioned landscapes, and although many are outside our study domain, significant terrain, sedimentary, and geochemical responses to thawing slopes have been documented there (Kokelj and Lewkowicz, 1999; Ward-Jones et al., 2019).
The rapid intensification of thaw-driven mass wasting and the patterns of impacts across fluvial networks of northwestern Canada indicate a deglaciation-phase response pattern (Figs. 2 and 6–8), which reflects a typically abrupt period of geomorphic transition (Ballantyne, 2002) that in permafrost regions has experienced a long-term climatic hiatus through a cooling Holocene. While more data are needed to describe the full spectrum of annual fluvial sediment yield across catchment scales in thermokarst-affected landscapes, there is a consistent pattern of much higher fluxes in headwater systems, the site of “primary” glacial sediment stores (sensu Ballantyne, 2002). This pattern in thermokarst-affected permafrost regions contrasts with that found in temperate British Columbia's post-glacial river systems, where primary glacial sediment stores have been exhausted: those materials have cascaded through fluvial networks over millennia and are now reworked and transported by larger rivers (>1000 km2; Church and Slaymaker, 1989). In glacially conditioned permafrost landscapes, climate-driven thaw of glacial sediment stores is overwhelming the transport capacity of low-order streams, leading to valley filling, upstream pond and lake formation, and river aggradation that will reinforce this early-stage paraglacial signal for centuries to come. The prospect that climate change is rejuvenating the sequence of post-glacial landscape evolution points to the massive potential for thermokarst-driven geomorphic change of ice-rich slopes as well as the centennial- to millennial-scale perturbation of downstream fluvial systems (i.e., Church and Slaymaker, 1989) and the receiving lacustrine, deltaic, and coastal environments in several Arctic regions (Kokelj et al., 2017a).
Nonlinear intensification of thaw-driven mass wasting is transforming permafrost-preserved glacial landscapes and downstream connectivity, triggering a cascade of effects that are propagating through Arctic hydrological networks. In the most intensely impacted watersheds, 100-fold increases in thaw-driven geomorphic activity have been quantified over a 3-decade period. Power-law relationships between thaw slump area and volume emphasize the nonlinear influence of increasing disturbance area on landscape morphology, slope-to-stream connectivity, and downstream effects. The disequilibrium imposed by thaw-driven release of glacial sediment stores from the headwater slopes (first- and second-order streams) reflects a tipping point within these permafrost land systems and signals decadal- to millennial-scale perturbation of downstream hydrological networks.
We estimate that thaw-driven mass wasting directly affects approximately 5540 km of stream segments, 1380 lakes, and 900 km of coastline across the 994 860 km2 Arctic drainage area from permafrost terrain of northwestern Canada. The propagation of thermokarst effects through fluvial networks has the potential to increase the number of affected lakes by at least a factor of 4.0 and the length of the impacted fluvial network by a factor of 8.0. Projection of accumulated slope thermokarst effects indicates that there are numerous susceptible lake, delta, estuary, and coastal environments throughout the study region. Major thaw-driven geomorphic activity is concentrated along ice-rich moraine systems that define coastal regions of Banks and Victoria islands bounding Prince of Wales Strait, where numerous small, intensely affected fluvial systems transfer thermokarst-derived sediments and solutes short distances to the coastal environment. In contrast, the thaw-driven sediment and solute loads conveyed by hundreds of upland streams draining glaciated, ice-marginal landscapes of the lower Peel and Mackenzie watersheds are routed into the two major rivers and indicate a centennial- to millennial-scale cascade of thermokarst effects to the Mackenzie Delta and the Beaufort Sea. The varying intensity of thaw-driven slope disturbances and the propagation of sedimentary and biogeochemical effects (i.e., dissolved vs. particulate; carbon vs. nutrients vs. major ions) across hydrological networks of varying configuration (e.g., channel slope, lake density, size) will define the evolution of downstream geomorphic, ecological, and biogeochemical systems over the coming centuries.
Glacially conditioned permafrost terrain exhibits exceptionally strong climate–geomorphic linkages and massive potential for thaw-driven geomorphic transformation. Intensifying slope thermokarst effects are propagated through hydrological networks, amplifying the extent, magnitude, and duration of impacts related to permafrost thaw. By placing thaw-driven geomorphic phenomena in a geological and hydrological framework, spatial patterns and trajectories of landscape change, as well as environmental consequences, can be contextualized and predicted in an informed manner. Glacial legacy, rejuvenation of post-glacial permafrost landscape evolution, and patterns of continental drainage dictate that western Arctic Canada will be an interconnected thermokarst hotspot of global significance through the coming millennia.
Datasets used in this publication and sources are summarized in Table S1. Framework and geoprocessing steps for developing flow accumulation analysis are available in the Supplement.
The supplement related to this article is available online at: https://doi.org/10.5194/tc-15-3059-2021-supplement.
SVK and JT developed the paper concept. All authors contributed to field data collection and analysis of data as well as refinement of the paper scope. JV processed the UAV and lidar and developed statistical analyses for the datasets with input from SVK and JT. JK and SVK developed the flow network analysis with input from JT and AR. AR, JV, and JK produced final figures. SVK drafted and revised the paper with input from all authors.
The authors declare that they have no conflict of interest.
Publisher's note: Copernicus Publications remains neutral with regard to jurisdictional claims in published maps and institutional affiliations.
This research has been supported by the Government of Northwest Territories. Guidance and support from the Tetl'it and Ehdiitat Renewable Resource Councils, the Inuvik, Tuktoyaktuk, and Sachs Harbour Hunters and Trappers Committees, the Inuvialuit Joint Secretariat, the Inuvialuit Land Administration, the Aurora Research Institute, and the NWT Centre for Geomatics has been critical to the success of this research program. Field assistance from Christine Firth, Steven Tetlichi, Alice Wilson, and Billy Wilson, as well as logistical coordination from Joel McAlister, Georgina Neyendo, and Eugene Pascale are gratefully acknowledged. We would also like to acknowledge reporting of major landslide incidents by Donald Arey, Douglas Esagok, Connor Gould, and Eric McLeod. Photographs in Fig. 2 were provided courtesy of Rob Fraser, Canada Centre for Remote Sensing. This research has benefited from ongoing discussions with Chris Burn, Douglas Esagok, Rob Fraser, Denis Lacelle, Trevor Lantz, Steven Tetlichi, and Stephen Wolfe. Thoughtful and detailed comments by Stephan Gruber, Julian Murton, Ingmar Nitze, and the handling editor Peter Morse have improved this paper. This is NWT Geological Survey contribution 0138.
This research has been supported by the Natural Science and Engineering Research Council of Canada (Discovery Grant 430696, Suzanne E. Tank), the Northwest Territories Cumulative Impact Monitoring Program, Government of Northwest Territories (grant nos. 164 and 186, Steven V. Kokelj), and the Polar Continental Shelf Program, Natural Resources Canada (projects 313-18, 316-19, 318-20, and 320-20 to Steven V. Kokelj and projects 631-15, 617-16, and 617-17 to Suzanne E. Tank).
This paper was edited by Peter Morse and reviewed by Julian Murton and Ingmar Nitze.
Abbott, B. W., Jones, J. B., Godsey, S. E., Larouche, J. R., and Bowden, W. B.: Patterns and persistence of hydrologic carbon and nutrient export from collapsing upland permafrost, Biogeosciences, 12, 3725–3740, https://doi.org/10.5194/bg-12-3725-2015, 2015.
Aylsworth, J. M., Duk-Rodkin, A., Robertson, T., and Traynor, J. A.: Landslides of the Mackenzie Valley and adjacent mountainous and coastal regions, in: The Physical Environment of the Mackenzie Valley: A Baseline for the Assessment of Environmental Change, edited by: Dyke, L. D. and Brooks, G. R., Geological Survey of Canada Bulletin, 547, 167–176, https://doi.org/10.4095/211888, 2000.
Ballantyne, C. K.: Paraglacial geomorphology, Quaternary Sci. Rev. 21, 1935–2017, https://doi.org/10.1016/S0277-3791(02)00005-7, 2002.
Balser, A. W., Jones, J. B., and Gens, R.: Timing of retrogressive thaw slump initiation in the Noatak Basin, northwest Alaska, USA, J. Geophys. Res.-Earth, 119, 1106–1120, https://doi.org/10.1002/2013JF002889, 2014.
Bater, C. W. and Coops, N. C.: Evaluating error associated with lidar-derived DEM interpolation, Comput. Geosci., 35, 289–300, https://doi.org/10.1016/j.cageo.2008.09.001, 2009.
Beel, C. R., Lamoureux, S. F., and Orwin, J. F.: Fluvial response to a period of hydrometeorological change and landscape disturbance in the Canadian High Arctic, Geophys. Res. Lett., 45, 10446–10455, https://doi.org/10.1029/2018GL079660, 2018.
Boreggio, M., Bernard, M., and Gregoretti, C.: Evaluating the Differences of Gridding Techniques for Digital Elevation Models Generation and Their Influence on the Modeling of Stony Debris Flows Routing: A Case Study From Rovina di Cancia Basin (North-Eastern Italian Alps), Front. Earth Sci., 6, 89, https://doi.org/10.3389/feart.2018.00089, 2018.
Bowden, W. B., Gooseff, M. N., Balser, A., Green, A., Peterson, B. J., and Bradford, J.: Sediment and nutrient delivery from thermokarst features in the foothills of the North Slope, Alaska: Potential impacts on headwater stream ecosystems, J. Geophys. Res.-Earth, 113, G02026, https://doi.org/10.1029/2007JG000470, 2008.
Brooker, A., Fraser, R. H., Olthof, I., Kokelj, S. V., and Lacelle, D.: Mapping the activity and evolution of retrogressive thaw slumps by tasselled cap trend analysis of a Landsat satellite image stack, Permafrost Periglac., 25, 243–256, https://doi.org/10.1002/ppp.1819, 2014.
Brown, J., Ferrians, O. J., Heginbottom, J. A., and Melnikov, E. S. (Eds.): Circum-Arctic map of permafrost and ground-ice conditions, US Geological Survey in Cooperation with the Circum-Pacific Council for Energy and Mineral Resources, Washington, D.C., Circum-Pacific Map Series CP-45, scale 1:10 000 000, 1 sheet, revised 2001, https://doi.org/10.3133/cp45, 1997.
Bull, W. B.: Geomorphology of segmented alluvial fans in western Fresno County, California, USGS Prof Paper 352E, US Government Printing Office, Washington, https://doi.org/10.3133/pp352E, 1964.
Burn, C. R.: Cryostratigraphy, paleogeography, and climate change during the early Holocene warm interval, western Arctic coast, Canada, Can. J. Earth Sci., 34, 912–925, https://doi.org/10.1139/e17-076, 1997.
Carson, M. A. and Kirkby, M. J.: Hillslope Form and Process, Cambridge University Press, New York, 476 pp, https://doi.org/10.1017/S0016756800000546, 1972.
Chin, K. S., Lento, J., Culp, J. M., Lacelle, D., and Kokelj, S. V.: Permafrost thaw and intense thermokarst activity decreases abundance of stream benthic macroinvertebrates, Glob. Change Biol., 22, 2715–2728, https://doi.org/10.1111/gcb.13225, 2016.
Chipman, M. L., Kling, G. W., Lundstrom, C. C., and Hu, F. S.: Multiple thermo-erosional episodes during the past six millennia: Implications for the response of Arctic permafrost to climate change, Geology, 44, 439–442, https://doi.org/10.1130/G37693.1, 2016.
Church, M. and Slaymaker, O.: Disequilibrium of Holocene sediment yield in glaciated British Columbia, Nature, 337, 452–454, https://doi.org/10.1038/337452a0, 1989.
Dyke, A. S. and Prest, V. K.: Late Wisconsinan and Holocene History of the Laurentide Ice Sheet, Géogr. Phys. Quaternaire, 41, 237–263, https://doi.org/10.7202/032681ar, 1987.
Dyke, A. S., Moore, A., and Robertson, L.: Deglaciation of North America, Geological Survey of Canada, Ottawa, ON, Canada, Open File 1574, https://doi.org/10.4095/214399, 2003.
Fulton, R. J. (compiler): Surficial Materials of Canada – Map 1880A Government of Canada, Natural Resources Canada, Geological Survey of Canada, Terrain Sciences Division Scale, 1:5 000 000, https://doi.org/10.4095/205040, 1995.
Gould, S. B., Glenn, N. F., Sankey, T. T., and McNamara, J. P.: Influence of a Dense, Low-height Shrub Species on the Accuracy of a Lidar-derived DEM, Photogr. Eng. Rem. S., 5, 421–431, https://doi.org/10.14358/PERS.79.5.421, 2013.
Holland, K. M., Porter, T. J., Froese, D. G., Kokelj, S. V., and Buchanan, C.: Ice-wedge evidence of Holocene winter warming in the Canadian Arctic, Geophys. Res. Lett., 47, e2020GL087942, https://doi.org/10.1029/2020GL087942, 2020.
Holloway, J. E., Lewkowicz, A. G., Douglas, T. A., Li, X., Turetsky, M. R., Baltzer, J. L., and Jin, H.: Impact of wildfire on permafrost landscapes: A review of recent advances and future prospects, Permafrost Periglac., 31, 371–382, https://doi.org/10.1002/ppp.2048, 2020.
Hornby, D. D.: RivEX (Version 10.25) [Software], available from http://www.rivex.co.uk (last access: 28 April 2021), 2017.
Houben, A. J., French, T. D., Kokelj, S. V., Wang, X., Smol, J. P., and Blais, J. M.: The impacts of permafrost thaw slump events on limnological variables in upland tundra lakes, Mackenzie Delta region, Fundam. Appl. Limnol., 189, 11–35, https://doi.org/10.1127/fal/2016/0921, 2016.
Howard, A. D.: A detachment-limited model of drainage basin evolution, Water Resour. Res., 30, 2261–2285, https://doi.org/10.1029/94WR00757, 1994.
Klar, A. Aharonov, E. Kalderon-Asael, B., and Katz, O.: Analytical and observational relations between landslide volume and surface area, J. Geophys. Res., 116, F02001, https://doi.org/10.1029/2009JF001604, 2011.
Kokelj, S. V. and Jorgenson, M. T.: Advances in Thermokarst Research, Permafrost Periglac., 24, 108–119, https://doi.org/10.1002/ppp.1779, 2013.
Kokelj, S. V. and Lewkowicz, A. G.: Salinization of permafrost terrain due to natural geomorphic disturbance, Fosheim Peninsula, Ellesmere Island, Arctic, 52, 372–385, https://doi.org/10.14430/arctic942, 1999.
Kokelj, S. V., Zajdlik, B., and Thompson, M. S.: The impacts of thawing permafrost on the chemistry of lakes across the subarctic boreal tundra transition, Mackenzie Delta region, Canada, Permafrost Periglac., 20, 185–199, https://doi.org/10.1002/ppp.641, 2009.
Kokelj, S. V., Lacelle, D., Lantz, T. C., Tunnicliffe, J., Malone, L., Clark, I. D., and Chin, K. S.: Thawing of massive ground ice in mega slumps drives increases in stream sediment and solute flux across a range of watershed scales, J. Geophys. Res.-Earth. 118, 681–692, https://doi.org/10.1002/jgrf.20063, 2013.
Kokelj, S. V., Tunnicliffe, J., Lacelle, D., Lantz, T. C., Chin, K. S., and Fraser, R.: Increased precipitation drives mega slump development and destabilization of ice-rich permafrost terrain, northwestern Canada, Global Planet. Change, 129, 56–68, https://doi.org/10.1016/j.gloplacha.2015.02.008, 2015.
Kokelj, S. V., Lantz, T. C., Tunnicliffe, J., Segal, R., and Lacelle, D.: Climate-driven thaw of permafrost preserved glacial landscapes, northwestern Canada, Geology, 45, 371–374, https://doi.org/10.1130/G38626.1, 2017a.
Kokelj, S. V, Palmer, M. J., Lantz, T. C., and Burn, C. R.: Ground Temperatures and Permafrost Warming from Forest to Tundra, Tuktoyaktuk Coastlands and Anderson Plain, NWT, Canada, Permafrost Periglac. 28, 543–551, https://doi.org/10.1002/ppp.1934, 2017b.
Kokelj, S. V., Tunnicliffe, J. F., and Lacelle, D.: The Peel Plateau of Northwestern Canada: An Ice-Rich Hummocky Moraine Landscape in Transition, in: Landscapes and Landforms of Western Canada, edited by: Slaymaker, O., Springer International Publishing, Switzerland, 109–122, https://doi.org/10.1007/978-3-319-44595-3_7, 2017c.
Kokoszka, J. and Kokelj, S. V.: Broad-scale mapping of hydrological features affected by slope-thermokarst from Arctic drainage, northwestern Canada: Methods and Data, Northwest Territories Geological Survey, Yellowknife, NT, Canada, NWT Open Report, 2020-013, 9 pp., appendices, and digital data, https://doi.org/10.46887/2020-013, 2021.
Lacelle, D., Bjornson, J., and Lauriol, B.: Climatic and geomorphic factors affecting contemporary (1950–2004) activity of retrogressive thaw slumps on the Aklavik Plateau, Richardson Mountains, NWT, Canada, Permafrost Periglac., 21, 1–15, https://doi.org/10.1002/ppp.666, 2010.
Lacelle, D., Brooker, A., Fraser, R. H., and Kokelj, S. V.: Geomorphology Distribution and growth of thaw slumps in the Richardson Mountains – Peel Plateau region, northwestern Canada. Geomorphology, 235, 40–51, https://doi.org/10.1016/j.geomorph.2015.01.024, 2015.
Lacelle, D., Fontaine, M., Pellerin, A., Kokelj, S. V., and Clark, I. D.: Legacy of Holocene Landscape Changes on Soil Biogeochemistry: A Perspective From Paleo-Active Layers in Northwestern Canada, J. Geophys. Res.-Biogeo., 124, 2662–2679, https://doi.org/10.1029/2018JG004916, 2019.
Lakeman, T. R. and England, J. H.: Paleoglaciological insights from the age and morphology of the Jesse moraine belt, western Canadian Arctic, Quaternary Sci. Rev., 47, 82–100, https://doi.org/10.1016/j.quascirev.2012.04.018, 2012.
Lantz, T. C. and Kokelj, S. V.: Increasing rates of retrogressive thaw slump activity in the Mackenzie Delta region, N. W. T., Canada, Geophys. Res. Lett., 35, L06502, https://doi.org/10.1029/2007GL032433, 2008.
Lantz, T. C., Gergel, S. E., and Kokelj, S. V.: Spatial heterogeneity in the shrub tundra ecotone in the Mackenzie Delta region, Northwest Territories: Implications for Arctic environmental change, Ecosystems, 13, 194–204, https://doi.org/10.1007/s10021-009-9310-0, 2010.
Levenstein, B., Culp, J. M., and Lento, J.: Sediment inputs from retrogressive thaw slumps drive algal biomass accumulation but not decomposition in Arctic streams, NWT, Freshwater Biol., 63, 1300–1315, https://doi.org/10.1111/fwb.13158, 2018.
Lewkowicz, A. G. and Way, R. G.: Extremes of summer climate trigger thousands of thermokarst landslides in a High Arctic environment, Nat. Commun., 10, 1329, https://doi.org/10.1038/s41467-019-09314-7, 2019.
Littlefair, C. A., Tank, S. E., and Kokelj, S. V.: Retrogressive thaw slumps temper dissolved organic carbon delivery to streams of the Peel Plateau, NWT, Canada, Biogeosciences, 14, 5487–5505, https://doi.org/10.5194/bg-14-5487-2017, 2017.
Mackay, J. R.: The origin of massive icy beds in permafrost, western Arctic coast, Canada, Can. J. Earth Sci., 8, 397–422, https://doi.org/10.1139/e71-043, 1971.
Mann, D., Groves, H. P., Reanier, R. E., and Kunz, M. L.: Floodplains, permafrost, cottonwood trees and peat: What happened the last time climate warmed suddenly in arctic Alaska?, Quaternary Sci. Rev. 29, 3812–3830, https://doi.org/10.1016/j.quascirev.2010.09.002, 2010.
Malone, L., Lacelle, D., Kokelj, S., and Clark, I. D.: Impacts of hillslope thaw slumps on the geochemistry of permafrost catchments (Stony Creek watershed, NWT, Canada), Chem Geol., 356, 38–49, https://doi.org/10.1016/j.chemgeo.2013.07.010, 2013.
Meng, X., Currit, N., and Zhao, K.: Ground Filtering Algorithms for Airborne LiDAR Data: A Review of Critical Issues, Remote Sens., 2, 833–860, https://doi.org/10.3390/rs2030833, 2010.
Murton, J.: Thermokarst sediments and sedimentary structures, Tuktoyaktuk Coastlands, western Arctic Canada, Global Planet. Change, 28, 175–192, https://doi.org/10.1016/S0921-8181(00)00072-2, 2001.
Murton, J. B., Whiteman, C. A., Waller, R. I., Pollard, W. H., Clark, I. D., and Dallimore, S. R.: Basal ice facies and supraglacial melt-out till of the Laurentide Ice Sheet, Tuktoyaktuk Coast- lands, western Arctic Canada, Quaternary Sci. Rev., 24, 681–708, https://doi.org/10.1016/j.quascirev.2004.06.008, 2005.
Natural Resources Canada.: Canada digital elevation data [dataset], Ottawa, ON, Canada, Natural Resources Canada, https://open.canada.ca/data/en/dataset/7f245e4d-76c2-4caa-951a-45d1d2051333, 2015.
Natural Resources Canada.: National Hydro Network – NHN – GeoBase Series [dataset], Ottawa, ON, Canada, Natural Resources Canada, https://open.canada.ca/data/en/dataset/a4b190fe-e090-4e6d-881e-b87956c07977, 2016.
Nitze, I., Grosse, G., Jones, B. M., Romanovsky, V. E., and Boike, J.: Remote sensing quantifies widespread abundance of permafrost region disturbances across the Arctic and Subarctic, Nat. Commun., 9, 5423, https://doi.org/10.1038/s41467-018-07663-3, 2018.
Northwest Territories Centre for Geomatics: Northwest Territories SPOT Mosaic Web Map Service (WMS) derived from Government of Canada Orthoimages 2005–2010 [dataset], Government of the Northwest Territories, available at: https://open.canada.ca/data/en/dataset/d799c202-603d-4e5c-b1eb-d058803f80f9 (last access: 28 April 2021), 2013.
Olefeldt, D., Goswami, S., Grosse, G., Hayes, D., Hugelius, G., Kuhry, P., McGuire, A. D., Romanovsky, V. E., Sannel, A. B. K., Schuur, E. A. G., and Turetsky, M. R.: Circumpolar distribution and carbon storage of thermokarst landscapes, Nat. Commun., 7, 13043, https://doi.org/10.1038/ncomms13043, 2016.
O'Neill, H. B., Burn, C. R., Kokelj, S. V., and Lantz, T. C.: “Warm” tundra: Atmospheric and near-surface ground temperature inversions across an alpine treeline in continuous permafrost, western Arctic, Canada, Permafrost Periglac., 26, 103–118, https://doi.org/10.1002/ppp.1838, 2015.
O'Neill, H. B., Wolfe, S. A., and Duchesne, C.: New ground ice maps for Canada using a paleogeographic modelling approach, The Cryosphere, 13, 753–773, https://doi.org/10.5194/tc-13-753-2019, 2019.
Pollard, W. H.: Distribution and characterization of ground ice on Fosheim Peninsula, Ellesmere Island, Nunavut, in: Environmental response to climate change in the Canadian High Arctic, edited by: Garneau, M. and Alt, B. T., Geological Survey of Canada, Ottawa, ON, Canada, Bulletin 529, 207–233, https://doi.org/10.4095/211959, 2000.
Porter, T. J., Schoenemann, S. W., Davies, L. J., Steig, E. J., Bandara, S., and Froese, D. G.: Recent summer warming in northwestern Canada exceeds the Holocene thermal maximum, Nat. Commun., 10, 1631, https://doi.org/10.1038/s41467-019-09622-y, 2019.
Rampton, V. N.: Quaternary Geology of the Tuktoyaktuk Coastlands, Northwest Territories, Geological Survey of Canada, Ottawa, ON, Canada, Memoir 423, 126937 https://doi.org/10.4095/126937, 1988.
Ramage, J. L., Irrgang, A. M., Herzschuh, U., Morgenstern, A., Couture, N., and Lantuit, H.: Terrain controls on the occurrence of coastal retrogressive thaw slumps along the Yukon coast, Canada, J. Geophys. Res.-Earth, 122, 1619–1634, https://doi.org/10.1002/2017JF004231, 2017.
Ramage, J. L., Irrgang, A. M., Morgenstern, A., and Lantuit, H.: Increasing coastal slump activity impacts the release of sediment and organic carbon into the Arctic Ocean, Biogeosciences, 15, 1483–1495, https://doi.org/10.5194/bg-15-1483-2018, 2018.
R Core Team: R: A language and environment for statistical computing (version 3.4.1), Vienna, Austria: R Foundation for Statistical Computing, http://www.R-project.org (last access: 14 September 2020), 2017.
Rudy, A. C. A. and Kokelj, S. V.: Inventory of retrogressive thaw slumps in the Willow River watershed, mapped using 1986, 2002, and 2018 Landsat imagery, Northwest Territories Geological Survey, Yellowknife, NT, Canada, NWT Open Report 2020-011, 4 pp. and digital data, https://doi.org/10.46887/2020-011, 2020.
Rudy, A. C. A., Lamoureux, S. F., Kokelj, S. V., Smith, I. R., and England, J. H.: Accelerating Thermokarst Transforms Ice-Cored Terrain Triggering a Downstream Cascade to the Ocean, Geophys. Res. Lett., 44, 11080–11087, https://doi.org/10.1002/2017GL074912, 2017a.
Rudy, A. C. A., Lamoureux, S. F., Treitz, P., Ewijk, K. V., Bonnaventure, P. P., and Budkewitsch, P.: Terrain Controls and Landscape-Scale Susceptibility Modelling of Active-Layer Detachments, Sabine Peninsula, Melville Island, Nunavut, Permafrost Periglac., 28, 79–91, https://doi.org/10.1002/ppp.1900, 2017b.
Rudy, A. C. A., Kokelj, S. V., and Kokozska, J.: Inventory of retrogressive thaw slumps on the Peel Plateau and on southeastern Banks Island, Northwest Territories using 2017 Sentinel imagery, Northwest Territories Geological Survey, Yellowknife, NT, Canada, NWT Open Report 2020-012, 5 pp. and digital data, https://doi.org/10.46887/2020-012, 2020.
Segal, R. A., Kokelj, S. V., Lantz, T. C., Durkee, K., Gervais, S., Mahon, E., Snijders, M., Buysse, J., and Schwarz, S.: Broad-scale mapping of terrain impacted by retrogressive thaw slumping in Northwestern Canada, Northwest Territories Geological Survey, Yellowknife, NT, Canada, NWT Open Report 2016-008, 17 pp., https://doi.org/10.46887/2016-008, 2016a.
Segal, R. A., Lantz, T. C., and Kokelj, S. V.: Acceleration of thaw slump activity in glaciated landscapes of the Western Canadian Arctic, Environ. Res. Lett., 11, 034025, https://doi.org/10.1088/1748-9326/11/3/034025, 2016b.
Segal, R. A., Lantz, T. C., and Kokelj, S. V.: Inventory of active retrogressive thaw slumps on eastern Banks Island, Northwest Territories, Northwest Territories Geological Survey, Yellowknife, NT, Canada, NWT Open Report 2015-021, 8 pp., https://doi.org/10.46887/2015-021, 2016c.
Segal, R. A., Lantz, T. C., and Kokelj, S. V.: Inventory of active retrogressive thaw slumps in the Peel Plateau, Northwest Territories, Northwest Territories Geological Survey, Yellowknife, NT, Canada, NWT Open Report 2015-020, 8 pp., https://doi.org/10.46887/2015-020, 2016d.
Shakil, S., Tank, S. E., Kokelj, S. V., Vonk, J. E., and Zolkos, S.: Particulate dominance of organic carbon mobilization from thaw slumps on the Peel Plateau, NT: Quantification and implications for stream systems and permafrost carbon release, Environ. Res. Lett., 15, 114019, https://doi.org/10.1088/1748-9326/abac36, 2020a.
Shakil, S., Zolkos, S., Chin, K., and Tank, S.: Total suspended solids data from streams draining permafrost thaw slumps on the Peel Plateau, Northwest Territories, Waterloo, Canada: Canadian Cryospheric Information Network (CCIN), Polar Data Catalogue, https://doi.org/10.21963/13181, 2020b.
Smith, M. W., Carrivick, J. L., and Quincey, D. J.: Structure from motion photogrammetry in physical geography, Progress in Physical Geography: Earth and Environment, 40, 247–275, https://doi.org/10.1177/0309133315615805, 2016.
Smith, S. L., Romanovsky, V. E., Lewkowicz, A. G., Burn, C. R., Allard, M., Clow, G. D., Yoshikawa, K., and Throop, J.: Thermal state of permafrost in North America: a contribution to the international polar year, Permafrost Periglac., 21, 117–135, https://doi.org/10.1002/ppp.690, 2010.
St. Pierre, K. A., Zolkos, S., Shakil, S., Tank, S. E., St. Louis, V. L., and Kokelj, S. V.: Unprecedented increases in total and methyl mercury concentrations downstream of retrogressive thaw slumps in the western Canadian Arctic, Environ. Sci. Technol., 52, 14099–14109, https://doi.org/10.1021/acs.est.8b05348, 2018.
Tank, S. E., Striegl, R. G., McClelland, J. W., and Kokelj, S. V.: Multi-decadal increases in dissolved organic carbon and alkalinity flux from the Mackenzie drainage basin to the Arctic Ocean, Environ. Res. Lett., 11, 054015, https://doi.org/10.1088/1748-9326/11/5/054015, 2016.
Tank, S. E., Vonk, J. E., Walvoord, M. A., McClelland, J. W., Laurion, I., and Abbott, B. W.: Landscape matters: Predicting the biogeochemical effects of permafrost thaw on aquatic networks with a state factor approach, Permafrost Periglac., 31, 358–370, https://doi.org/10.1002/ppp.2057, 2020.
Tarboton, D. G.: A new method for the determination of flow directions and contributing areas in grid digital elevation models, Water Resour. Res., 33, 309–319, https://doi.org/10.1029/96WR03137, 1997.
Thienpont, J. R., Rühland, K. M., Pisaric, M. F. J., Kokelj, S. V., Kimpe, L. E., Blais, J. M., and Smol, J. P.: Biological responses to permafrost thaw slumping in Canadian Arctic lakes, Freshwater Biol., 58, 337–353, https://doi.org/10.1111/Fwb.12061, 2013.
Turetsky, M. R., Abbott, B. W., Jones, M. C., Walter Anthony, K., Olefeldt, D., Schuur, E. A. G., Grosse, G., Kuhry, P., Hugelius, G., Koven, C., Lawrence, D. M., Gibson, C., Sannel, A. B. K., and McGuire, A. D.: Carbon release through abrupt permafrost thaw, Nat. Geosci., 13, 138–143, https://doi.org/10.1038/s41561-019-0526-0, 2020.
van der Sluijs, J., Kokelj, S., Fraser, R., Tunnicliffe, J., and Lacelle, D.: Permafrost Terrain Dynamics and Infrastructure Impacts Revealed by UAV Photogrammetry and Thermal Imaging, Remote Sens., 10, 1734, https://doi.org/10.3390/rs10111734, 2018.
Vonk, J. E., Tank, S. E., and Walvoord, M. A.: Integrating hydrology and biogeochemistry across frozen landscapes, Nat. Commun., 10, 5377, https://doi.org/10.1038/s41467-019-13361-5, 2019.
Walvoord, M. A. and Kurylyk, B. L.: Hydrological impacts of thawing permafrost-A review, Vadose Zone J., 15, 1–20, https://doi.org/10.2136/vzj2016.01.0010, 2016.
Ward-Jones, M. K. W., Pollard, W. H., and Jones, B. M.: Rapid initialization of retrogressive thaw slumps in the Canadian high Arctic and their response to climate and terrain factors, Environ. Res. Lett., 14, 055006, https://doi.org/10.1088/1748-9326/ab12fd, 2019.
West, J. J. and Plug, L. J.: Time-dependent morphology of thaw lakes and taliks in deep and shallow ground ice, J. Geophys. Res.-Earth, 113, F01009, https://doi.org/10.1029/2006JF000696, 2008.
Wohl, E: Connectivity in rivers, Prog. Phys. Geog., 41, 345–362, https://doi.org/10.1177/0309133317714972, 2017.
Wotton, B. M., Nock, C. A., and Flannigan, M. D.: Forest fire occurrence and climate change in Canada, Int. J. Wildland Fire, 19, 253–271, https://doi.org/10.1071/WF09002, 2010.
Zolkos, S., Tank, S. E., and Kokelj, S. V.: Mineral Weathering and the Permafrost Carbon-Climate Feedback, Geophys. Res. Lett., 45, 9623–9632, https://doi.org/10.1029/2018GL078748, 2018.
Zolkos, S., Tank, S. E., Striegl, R. G., Kokelj, S. V., Kokoszka, J., Estop-Aragonés, C., and Olefeldt, D.: Thermokarst amplifies fluvial inorganic carbon cycling and export across watershed scales on the Peel Plateau, Canada, Biogeosciences, 17, 5163–5182, https://doi.org/10.5194/bg-17-5163-2020, 2020.
Zwieback, S., Kokelj, S. V., Günther, F., Boike, J., Grosse, G., and Hajnsek, I.: Sub-seasonal thaw slump mass wasting is not consistently energy limited at the landscape scale, The Cryosphere, 12, 549–564, https://doi.org/10.5194/tc-12-549-2018, 2018.