
the Creative Commons Attribution 4.0 License.
the Creative Commons Attribution 4.0 License.
 | 26 Oct 2026
Probability indication maps for avalanche runout for decision support in daily traffic rout risk management
Julia Glaus

Jan Kleinn
Lukas Stoffel
Pia Ruttner
Katreen Wikstrom Jones
Johan Gaume
Yves Bühler
In alpine regions, snow avalanches endanger infrastructure such as roads, ski slopes and buildings. While permanent protection measures minimize avalanche impact, local experts must implement additional safety measures such as road or ski slope closures during critical situations. To support this demanding decision-making process, we propose a framework that can be used on a daily basis to calculate avalanche probability indication maps of potential avalanche runout extents and intensities. The probability indication maps are generated by running multiple avalanche simulations, based on an ensemble of estimations of input parameters derived from weather station measurements and weather forecasts, to assess a range of possible scenarios, e.g. for fracture depth, maximum erosion depth and snow temperature. We aim to identify the minimum number of input parameters needed to meaningfully represent daily snowpack conditions. We focus on cold snow conditions that produce powder snow avalanches. To evaluate the quality of the proposed probability indication maps, we conduct a hindcast for four well-documented avalanche events around Davos, Switzerland, using meteorological station data from the day before the avalanches released, weather forecast and SNOWPACK simulations. For validation we compare the resulting predictions to the measured outlines of the avalanche cores. This study demonstrates how real-time weather and snowpack data can be utilized effectively to provide practitioners with an overview of the current avalanche situation to support their decision-making process. In the future, such approaches could be implemented into more data-based decision-making processes to better protect traffic infrastructure in high-risk avalanche hazard areas.
- Article
(15380 KB) - Full-text XML
-
Supplement
(3843 KB) - BibTeX
- EndNote


To ensure safe living and travel in mountain regions during the winter season, effective avalanche protection systems are essential (Rudolf-Miklau et al., 2015). However, continuously protecting infrastructure such as roads, railways, power lines, and ski runs is not feasible due to financial restrictions and the need to preserve the natural landscape (Nadim et al., 2006). In such cases, safety protocols define the operational procedures to evaluate avalanche danger and deciding whether traffic routes can remain open, have to be temporarily closed, and require active control measures, such as artificial avalanche releases. These safety protocols currently rely on avalanche forecasts, data from measurement networks, and expert knowledge (Rice et al., 2002; Bründl et al., 2018). However, climate-driven shifts to snowpack conditions and avalanche hazard, coupled with generational turnover among avalanche safety practitioners, are making experience-based decision-making in avalanche safety increasingly difficult to sustain (Kotlarski et al., 2023; Eckert et al., 2024; Mayer et al., 2023; Ortner et al., 2025). Meanwhile, advances in real-time monitoring, data integration and artificial intelligence–based approaches are transforming and providing growing support for operational decision-making (Farestveit et al., 2024; Turquet et al., 2024).
Avalanche hazard maps are a central tool in natural hazard management and form the basis for long-term planning and safety protocols. They provide a spatial representation of avalanche intensity, including impact pressure, velocity, flow height, and runout extent, thereby identifying areas that are repeatedly exposed to avalanches. Hazard maps are mainly intended for inhabited areas and not for all road sections. In Switzerland, avalanche hazard maps are traditionally based on discrete return periods (10, 30, 100 and 300 years) assigned to specific snow accumulation scenarios. Hazard maps are developed from historical event records and are increasingly complemented by numerical simulation tools for avalanche dynamics, such as RAMMS::Avalanche (Christen et al., 2010), SamosAT (Sampl, 2007), r.avaflow (Mergili et al., 2017), OpenFOAM (Rauter and Kowalski, 2024), MoT-Voellmy (Vicari and Issler, 2025), and ELBA (Keiler et al., 2006). A more complete list of depth-averaged tools is provided in the model intercomparison project in Wirbel et al. (2026). The calculated avalanche intensities depend on topography, snow and weather conditions, and vegetation cover (McClung and Schaerer, 2006). After the extreme avalanche winter of 1999 in Switzerland, the Swiss government strengthened its organizational risk management framework to better translate hazard information into operational measures, with a focus on the coordination and procedures of road closures (Bründl et al., 2004).
Beyond spatial hazard maps, several methods have been developed to systematize hazard assessment by explicitly integrating terrain, snowpack, and meteorological information. The Avalanche-Hazard Index (AHI) (Schaerer, 1989) and the Wilhelm method (Wilhelm, 1998) are widely used in the United States for systematic avalanche risk assessment. The AHI quantifies avalanche danger by integrating snowpack stability, terrain characteristics, and meteorological factors into a standardized hazard score. In contrast, the Wilhelm method relies more on qualitative field observations and records of past avalanche activity to classify slope-specific risk, thereby complementing the numerical framework of the AHI for the hazard map creation.
In many regions, particularly those with large and sparsely populated areas, traditional hazard mapping is constrained by the scarcity of comprehensive historical avalanche databases, motivating the increasing use of automated and model-based methods. A critical first step in adapting these approaches is to identify spatial and temporal hotspots; where and when avalanches are likely to occur. Hotspots can be identified using terrain based analysis models by Bühler et al. (2018) and Ganju and Dimri (2004) or by analysing historical event records (Pop et al., 2025). Bühler et al. (2022) developed an approach for large scale hazard indication modelling (LSHIM), consistent with the Swiss approach used for hazard mapping. In Norway, the region independent system NAtural hazard Knowledge System for INundation and avalanches (NAKSIN) has been developed to produce Avalanche Hazard Indication Maps (AHIMs). NAKSIN is automatically identifying potential release areas, estimating avalanche release probabilities from empirical relationships involving terrain, long-term climatic characteristics, and forest cover, and simulating avalanche runout using numerical flow models (Issler, 2023).
While automated hazard indication maps improve spatial coverage and objectivity, they still rely on discrete scenarios and simplified frequency assumptions. Early statistical approaches attempted to overcome these limitations by analysing avalanche occurrence and runout in a probabilistic framework. For example, Keylock et al. (1999) applied extreme value statistics and frequency–magnitude relationships to characterize avalanche size distributions and to estimate exceedance probabilities for different runout distances. Building on this line of research, Kleinn et al. (2024) reconsidered hazard mapping by moving away from the traditional use of return periods. Instead, probabilities are linked to each avalanche, depending on snow accumulation and exposition of the release zones, resulting in a wide range of possible avalanche release volumes. Return periods of avalanche intensity (flow height and pressure) in the runout region are derived from all simulated avalanches and their probabilities. By explicitly combining avalanche intensities with their associated probabilities, continuous intensity–frequency curves are obtained at any location, thereby replacing the discrete, scenario-based representation of hazard. Similarly, Oberndorfer et al. (2026) developed a probabilistic hazard mapping framework that transmits uncertainties in avalanche release volume through three-dimensional runout simulations to derive probability maps of impact and exceedance for exposed road sections. In addition, recent work by Rauter and Kowalski (2024) and by Aaron et al. (2022) has extended probabilistic mass-flow modelling by systematically propagating uncertainties within initial conditions and model parameters through ensemble-based, process-oriented simulations to derive spatially distributed runout and impact probabilities across complex terrain. Fischer et al. (2020) demonstrate a probabilistic back-calculation framework with r.avaflow, where uncertainties in observed avalanche data and model parameters are propagated into conditional runout probabilities.
Today, operational avalanche safety decisions are still taken very differently in various regions. A basic approach is to measure the new snow accumulation and empirically derived thresholds for the height of new snow (Stoffel, 2018). This approach has reduced avalanche-related fatalities (Chabot and Kaba, 2016). Sheng et al. (2022) describe a more advanced observation-based approach for a daily prediction of the potential avalanche runout area. They derived fracture depths from documented avalanche events and statistically analysed weak-layer measurements to estimate typical fracture depth. From the recurrence of these fracture depths, they obtained probability distributions, which they combined with numerical simulations to predict avalanche runout.
An operational forecasting system, integrating meteorological station data into numerical avalanche dynamics simulations, is currently implemented in the Central Andes. Developed for a mining region, where avalanche activity threatens a critical access road, the system is highly site-specific and tailored to local topographic and climatic conditions (Vera Valero et al., 2016). It applies RAMMS::Extended to simulate wet snow avalanche runout distances, differentiating between cold and warm flow regimes based on the mean snow temperature in the release zone, while fracture depths are estimated from SNOWPACK simulations at adjacent weather stations (Bartelt and Lehning, 2002; Valero et al., 2015).
Advancing towards operational daily forecasting, Mariani et al. (2024) present an approach that integrates automated identification of potential release areas (PRAs) with numerical snowpack modelling. The system employs an automatic PRA-detection algorithm and combines its outputs with SNOWPACK simulations to assess snow cover stability. Based on this integration, potential avalanche runout lengths are determined for a range of typical avalanche problem types.
The described studies demonstrate that integrating daily observations with numerical simulation tools can effectively enhance operational avalanche mitigation processes. Previous work investigated the required model complexity and sensitivity needed to accurately capture daily variations in avalanche runout distances.
Both, hazard mapping approaches and operational forecasting systems rely on numerical avalanche dynamic models to estimate potential runout distances. In hazard mapping, model input is typically derived from statistically evaluated snow heights based on long-term meteorological records, whereas operational applications increasingly use near-real-time measurements from meteorological stations. However, these observations are point measurements, often located in flat terrain, and cannot fully capture the spatial variability of snow conditions related to topographic parameters, such as elevation and aspect or terrain features causing variations in wind exposure within avalanche release areas (Bührle et al., 2023).
As a result, considerable uncertainty is inherently accepted in the specification of snow-related input parameters for avalanche simulations. Furthermore, numerical avalanche dynamics models introduce additional uncertainties related to model structure, parametrization, and simplifications of physical processes. To meaningfully interpret simulation results for decision-making, these sources of uncertainty need to be explicitly represented and carried on within the modelling framework.
In this study, we develop an automated workflow that integrates weather station data, weather forecast data, SNOWPACK simulations, avalanche dynamics simulation models, and visualization tools for cold powder avalanche conditions, aiming to improve traffic safety applications in high-risk avalanche hazard areas. The weather station and forecast data is used to derive potential fracture depths, snowpack characteristics, and the estimated snow conditions within the avalanche path. The probability of release for each potential release area is determined based on weak-layer stability outputs from SNOWPACK. To address uncertainties in the input data and model results, we implement a probabilistic framework that generates daily hazard indication maps across multiple meteorological and snow cover scenarios. Because the probabilistic framework relies on a limited ensemble of input scenarios derived from measurement stations, the resulting values should be interpreted as relative probability indicators rather than absolute probabilities. We therefore refer to the outputs as probability indication maps.
To test the proposed tool for creating a probability indication map, we required a study site with well-documented avalanche events against which the resulting probability indication maps could be evaluated. The site needs records of avalanche occurrences and road closures, mapped avalanche outlines and runout distances, and sufficient meteorological and snow-measurement data to drive snowpack simulations.
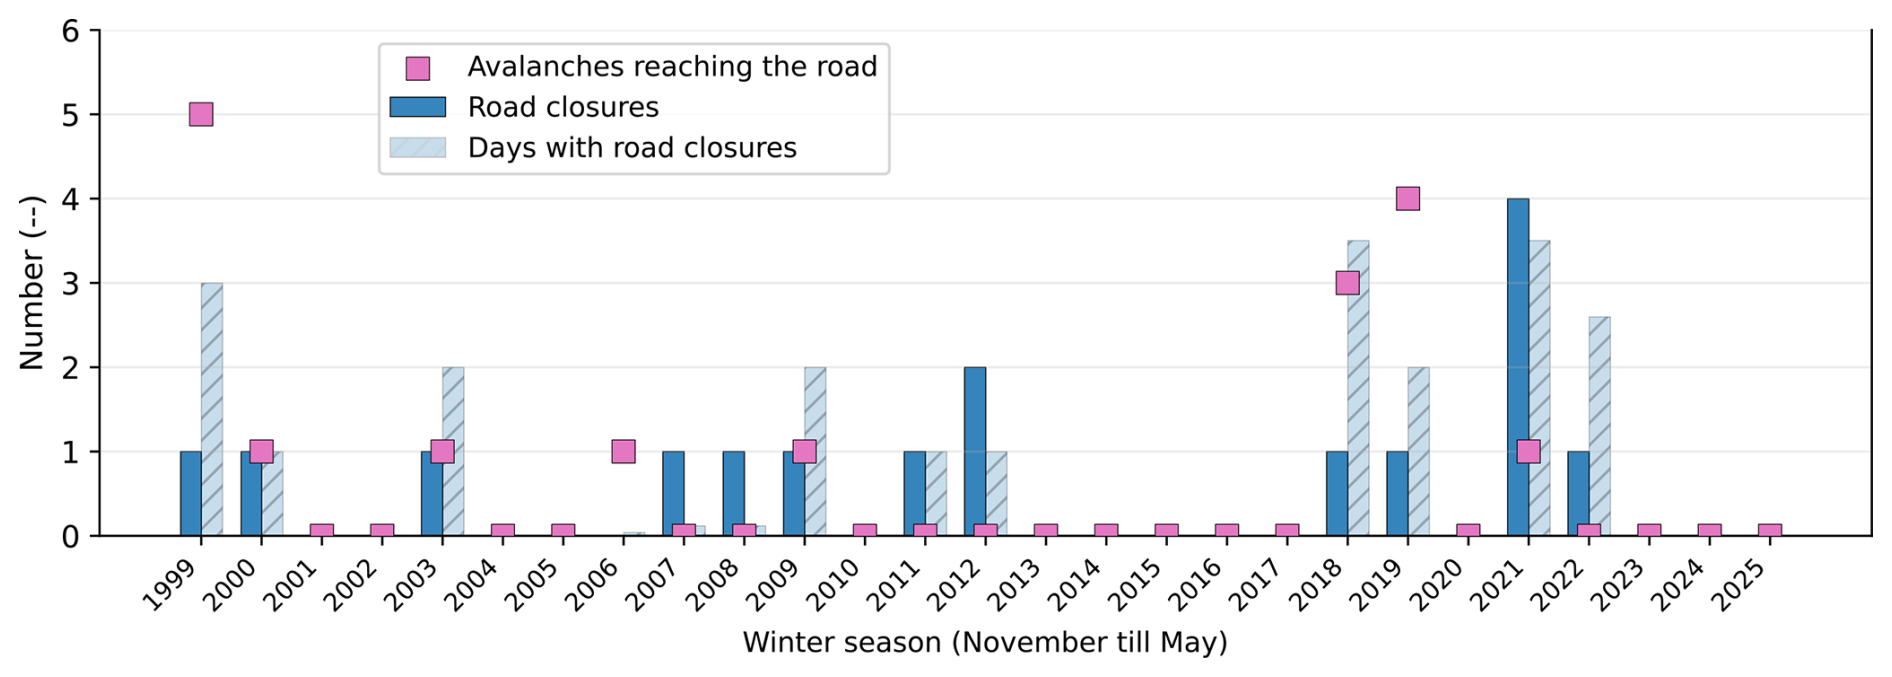
Figure 1Overview of documented avalanche activity and road closures along the Dischma Valley over the last 26 winter seasons (1999–2025). The analysis is qualitative, as the documentation of avalanche events strongly depends on the availability and quality of the underlying database, which has improved over time. The number of closure days is included to indicate the overall duration and therefore the relative significance of individual road-closure events.
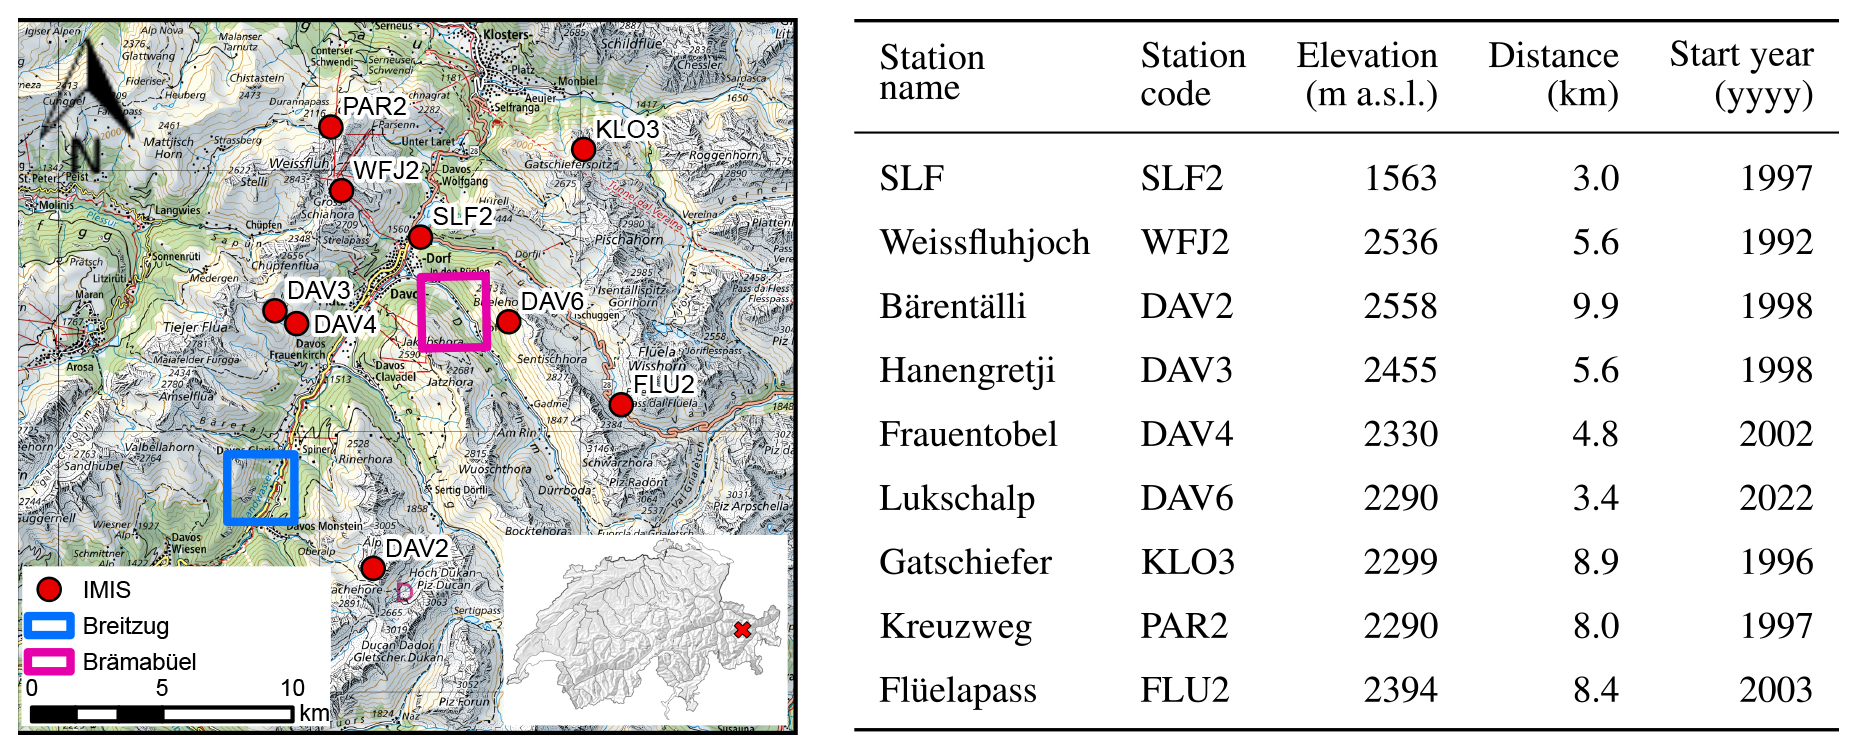
Figure 2Overview of the IMIS station distribution in the Davos region and the test regions. The table shows the horizontal distances from the stations to the release zone at Brämabüel (map source: Federal Office of Topography).
The Dischma road in the Davos region of Switzerland is used as the main study site, with a specific focus on the Brämabüel section, attributable to the availability of long-term documentation of avalanche activity and road closures (see Fig. 1). The area is characterized by a dense network of meteorological measurement stations called Interkantonales Mess- und Informationssystem (IMIS) as shown in Fig. 2. Additionally, two new stations independent of the IMIS network, were installed with low-cost LiDAR sensors in November 2023, close to the release zone of one of the avalanche paths. These stations measure the snow depth distribution on an hourly basis over an area of 14 500 m2 (Ruttner et al., 2025). Along the road, avalanche risk is managed through a combination of avalanche control measures and temporary closures. At the Brämabüel section, active avalanche control with explosives from a helicopter platform is used, whereas on the south-facing slope no mitigation measures are implemented and risk management relies solely on road closures.
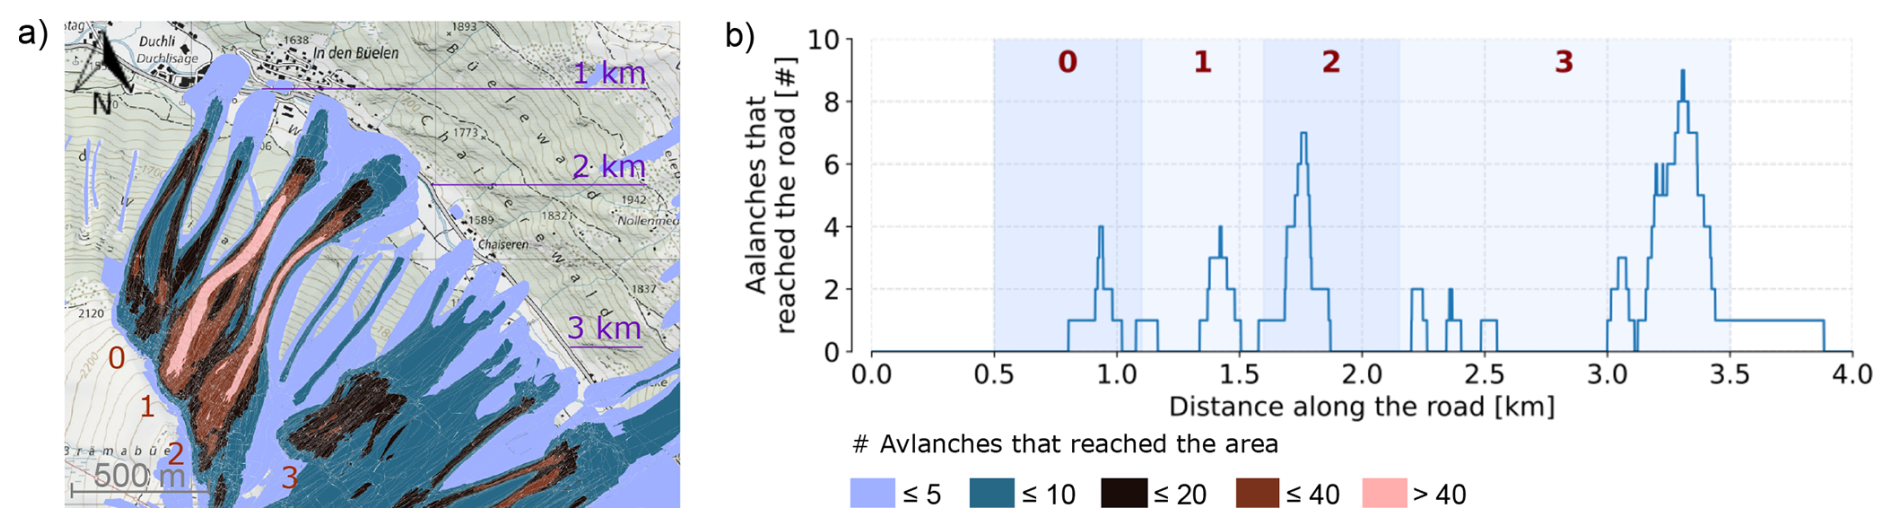
Figure 3Overview of the mapped avalanche activity affecting the Dischma road near Brämabüel between 1999 and 2025. (a) Number of observed avalanches reaching a pixel. (b) Number of observed avalanches intersecting the Dischma road, shown as distance along the road. The labels 0–3 indicate the main avalanche path sections, and the distance markers in panel (a) correspond to the distance axis in panel (b). Map source: Federal Office of Topography.
In Fig. 3, we show the mapped avalanches from the Davos avalanche database that occurred over the past 30 years at the Dischma road below the Brämabüel slope. There are four main avalanche paths marked as path 0, 1, 2 and 3. Avalanches originating from track 0 are excluded from the subsequent analysis because avalanche fences have been installed in this area in 1997.
Table 1Overview of the avalanche events used in this study with the time given in CET.
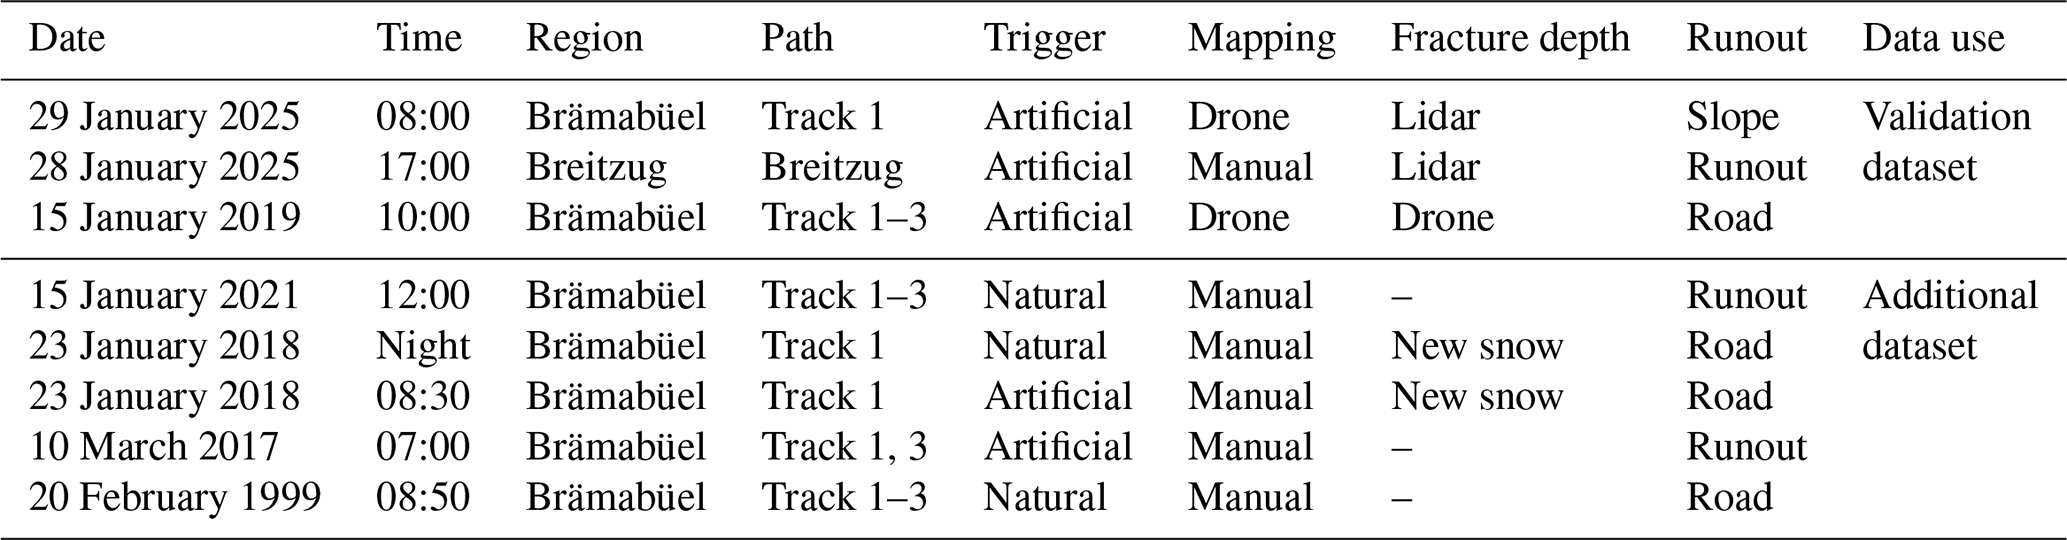
Due to limited data availability and the time required for detailed event reconstruction, we focus on two winter seasons with well-documented avalanche events. To test the framework beyond these seasons, we also include older events from the same region, although these cases provide fewer input data (see Table 1). We have runout information for all avalanches, but the available release information differs between events. For the validation events, we derive the average fracture depth in the release zone from lidar and drone measurements. For two older avalanches, reports indicate release within the new snow.
Figure 3a shows the number of observed avalanches reaching zones classified according to the total number of documented avalanches, while Fig. 3b displays the number of avalanches reaching the road measured from north to south of the road. It is clearly visible that most avalanches stop in the flatter runout zones (slope angle < 10°). A graphic of the slope steepness and avalanche paths is attached in the Appendix A1. Only 12 avalanches are documented as reaching the road section between Duchli and Chaiseren from 1999 to 2025. In Fig. 3, avalanche path 3 is influenced by the avalanche path descending from the opposing slope.
We validate our approach using historical avalanche events, where – at the time – fewer measurement stations were active. The first event we focus on occurred on 15 January 2019 at Brämabüel, a north-east-facing slope in the Dischma Valley. After the New Year in 2019, a continuous snowfall period began. Within 36 h, an increase in snow height of 0.56 m was measured at the flat-field site of the Weissfluhjoch (WFJ) station (see Fig. 5). The avalanche bulletins were issued twice daily, at 08:00 and 17:00 LT. From 11 January 2019 onwards, danger level 3 was forecast above 2000 m for all aspects due to new snow and wind-drifted snow. The danger level increased to 4 in the bulletin issued on 13 January 2019 at 17:00 LT, with medium-sized spontaneous avalanches expected and warnings that soft snow below weak layers could be easily eroded. By the evening bulletin of 14 January 2019, very large spontaneous avalanches were expected in nearby warning regions at danger level 5, while Brämabüel itself remained in a region forecast at danger level 4, close to the level-5 warning region. During avalanche control operations with helicopter three powder-snow avalanches (Track 1, 2, and 3) were artificially triggered, with estimated release volumes between 5000 and 10 000 m3. All three avalanches reached the road even if they had rather small release volumes, primarily due to substantial snow entrainment along their paths (Glaus et al., 2025).
The second and third validation events occurred on 28 and 29 January 2025. The first of these avalanches was released by a Wyssen tower at Breitzug (east- to south-east-facing slope) at approximately 17:00 CET on 28 January 2025. This was the first avalanche release at Breitzug during the winter season and the avalanche reached the river. The third avalanche was artificially triggered at Brämabüel on 29 January 2025 08:00 CET, approximately 9 km horizontal distance from Breitzug. There was little to no skiing activity on that slope prior to the release and no artificial avalanche releases in that season were performed, allowing the snowpack to develop largely under natural conditions. The avalanche remained relatively small and stopped well before reaching the base of the slope.
In order to assess the robustness of the proposed data flow under varying data availability, we compare recent data-rich avalanche events with historical cases for which information on weak layers and snowpack conditions is more limited. We consider four historical events from 1999, 2017, 2018, and 2021. The 1999 and 2018 events include avalanches that reached the road, whereas the 2017 and 2021 events stopped within the runout zone shortly before reaching the road (Fig. C1). These cases therefore provide a useful test set for evaluating whether the proposed workflow can distinguish between road-hitting and non-road-hitting avalanches under less complete input-data conditions.
The proposed framework aims to support daily avalanche runout predictions by coupling information on avalanche release conditions with avalanche dynamics. We only simulate dry slab avalanche releases. The occurrence of a slab avalanche requires sufficiently steep terrain, a weak-layer with a cohesive slab above, and a triggering mechanism. Snowpack stability is estimated using SNOWPACK, a physically based snow cover model (Bartelt and Lehning, 2002; Lehning et al., 2000; Lehning and Fierz, 2008), to constrain the likelihood, frequency, and characteristic size of potential releases. This release information is then used in combination with a numerical avalanche simulation tool to estimate runout distances.
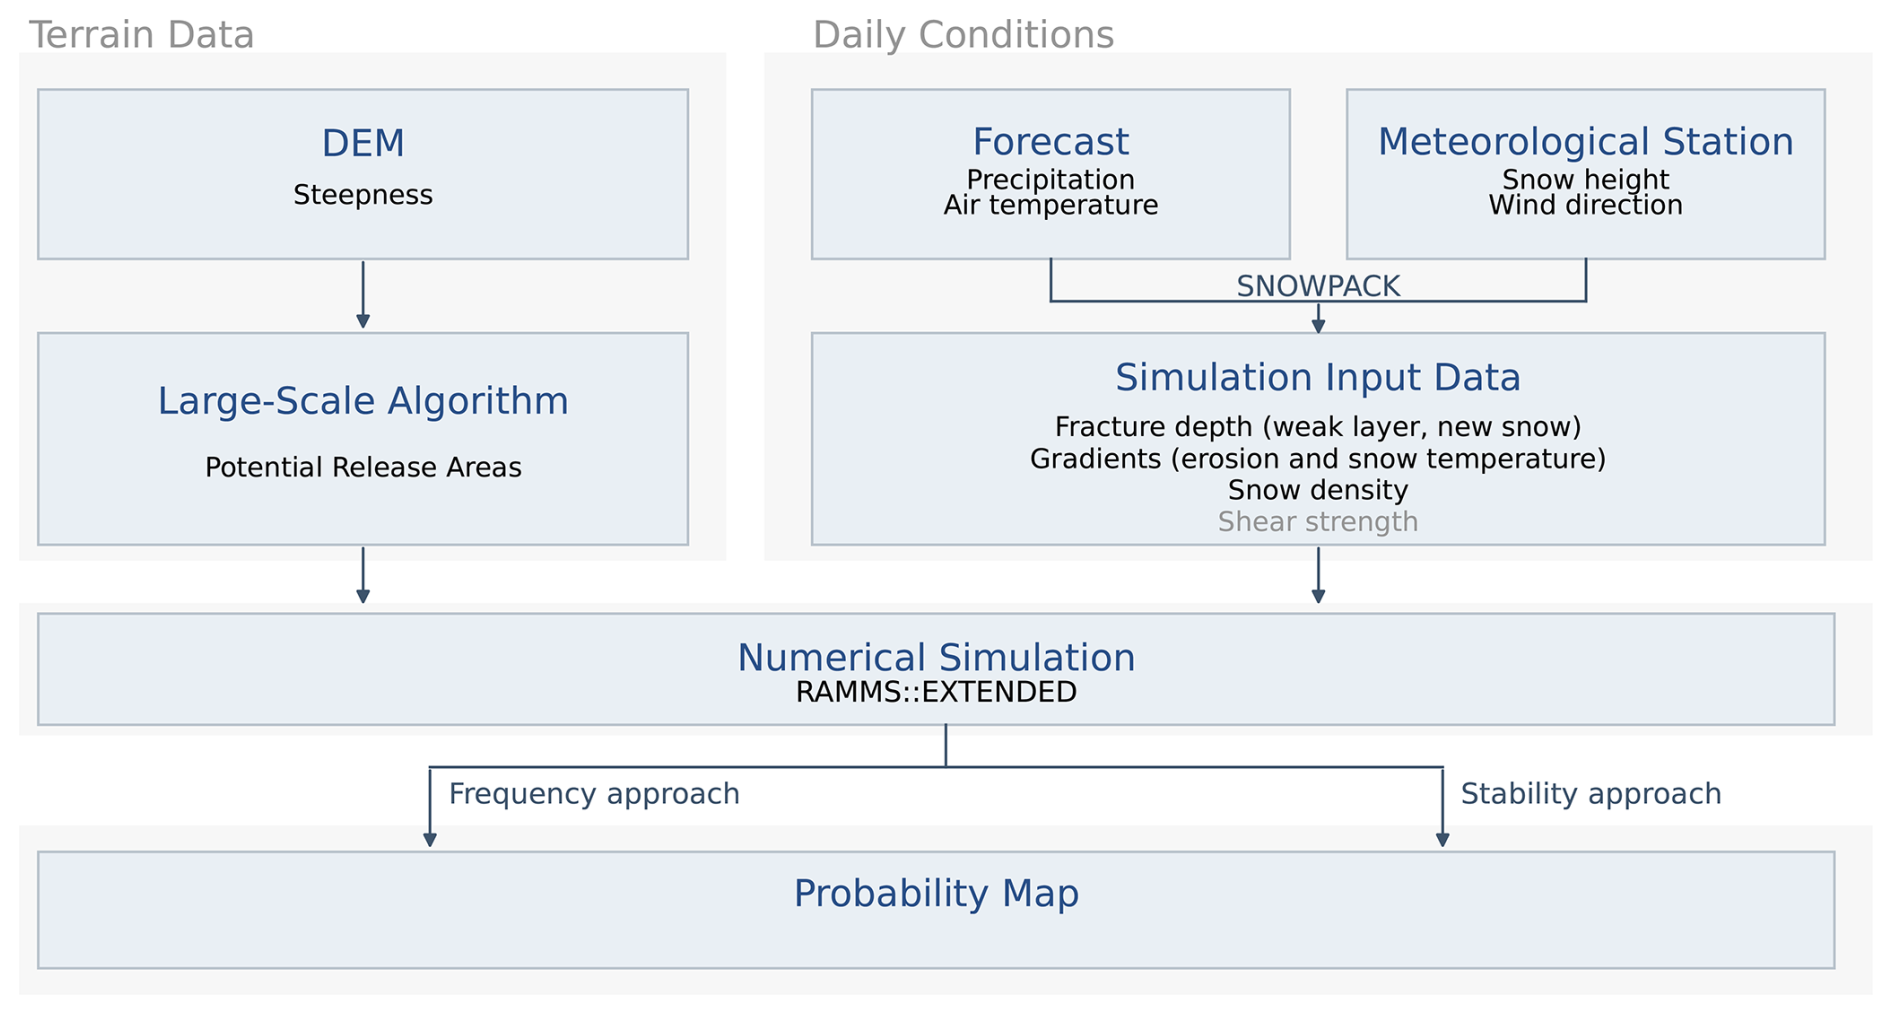
Figure 4Conceptual presentation of the data flow to produce a probability map. Greyed out are the parameters which are only needed for the stability approach. The detailed inputs used for the SNOWPACK simulations from the meteorological stations are described in Sect. S1 in the Supplement.
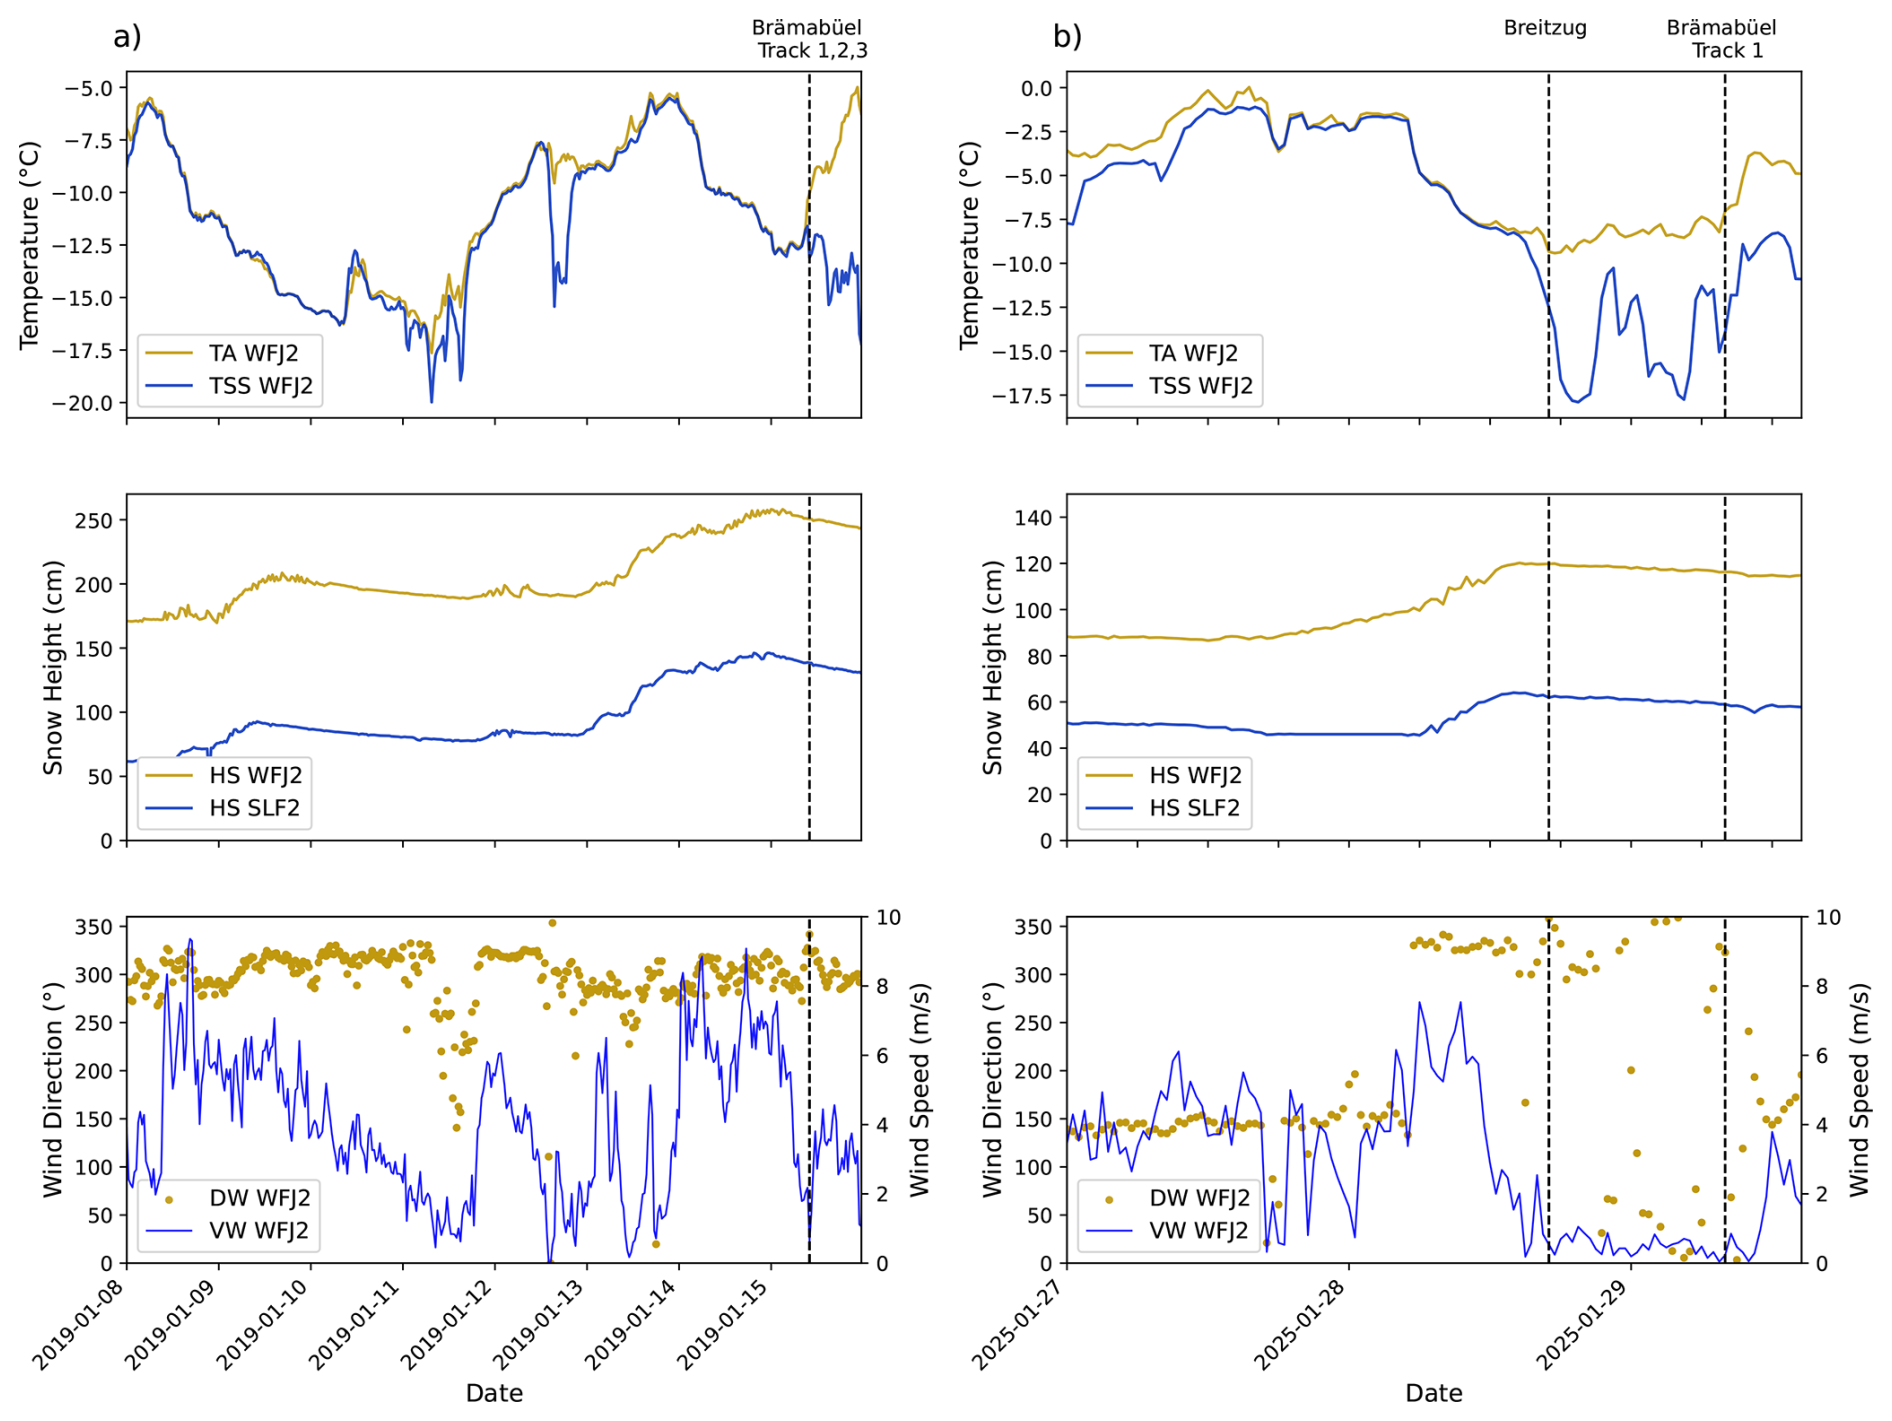
Figure 5Time series of meteorological observations recorded at the Weissfluhjoch (WFJ2) and Davos valley (SLF2) IMIS stations during the snowfall events preceding the evaluated avalanche releases. Shown are air temperature (TA), snow surface temperature (TSS), total snow height (HS), wind direction (DW), and wind speed (VW). The timing of avalanche release and name of the track is indicated by vertical bars. Columns (a) and (b) correspond to the snowfall periods in 2019 and 2025, respectively. Data source: IMIS.
Our operational workflow is shown in Fig. 4. The design of the workflow depends on the availability of input data and the local measurement infrastructure. In a first step, we present a configuration tailored to the Davos region as an example for a region where a large number of measurements are available. In a second step, we reduced the number of weather stations to show a more realistic picture of data availability for more data sparse regions.
Terrain information is derived from a digital elevation model (DEM) with a spatial resolution of 5 m. The potential release areas are identified using the automated algorithm by Bühler et al. (2018), which identifies release areas based on steepness, terrain shape, and surface roughness for small avalanches (volumes 5000–25 000 m3) and medium-sized avalanches (25 000–60 000 m3) (Bartelt and Christen, 2025). Larger release volumes are not considered, as such events are typically associated with very high avalanche danger levels, under which road closures are implemented as a precautionary measure.
Snowpack conditions are derived from SNOWPACK simulations based on meteorological observations from the available IMIS stations. Two release scenarios are considered throughout the study: release of newly accumulated fresh snow and release on the most unstable buried weak-layer. Potential fracture depths are derived from flat-field weather stations and adjusted for elevation differences using a snow-depth gradient inferred from valley and mountain stations. A correction accounting for slope inclination is applied to the conversion of flat-field measurements to release-zone conditions following Glaus et al. (2025).
For the release scenario of new snow, fracture depth corresponds to the depth of snow accumulated during the most recent snowfall period, including settling of the snowpack, with the weak-layer defining the interface between the old and the new snow. For the weak-layer release scenario, the most unstable weak-layer is identified using the method proposed by Mayer and Techel (2023). Snowpack stability is evaluated for a virtual slope with a reference slope angle of 38° and for the four main slope aspects. As e.g the Brämabüel release zone is oriented towards the northeast, weak-layer properties are estimated as the average of the north- and east-facing simulations.
The high temporal resolution measurements of the snow depth distribution in the Brämabüel release area reveals the substantial influence of snow redistribution by wind (Ruttner et al., 2025). Wind-induced snow redistribution is accounted for when wind speeds exceed a threshold of 7.5 m s−1 (Walter et al., 2020) and originate from directions that allow snow transport into the avalanche path. The amount of wind-drifted snow remains uncertain because existing approaches either neglect settling processes (Helbig et al., 2015) or operate at spatial resolutions which are too coarse to resolve local terrain effects (Quéno et al., 2024). We therefore apply additional snow loading of 0.25 and 0.5 m to account for moderate and strong wind drifts respectively.
Avalanche propagation is simulated for all potential release areas and fracture depth scenarios using RAMMS::Extended. The model explicitly accounts for erosion and entrainment along the avalanche path and allows the simulation of multiple flow regimes (Zhuang et al., 2023). Because entrainment strongly influences avalanche mass and runout distance (Issler et al., 2018; Li et al., 2021; Ligneau et al., 2025), we limit erosion depth to the fracture depth associated with each release scenario, accounting for the erosion of new snow or erosion of the snowpack above the weak-layer.
Meteorological forecast data are used to estimate precipitation (new snow) and the evolution of air temperature prior to avalanche release. For both events, we used data from numerical weather prediction models run by MeteoSwiss, which were based on COSMO for the 2019 event (Baldauf et al., 2011) and on ICON for the 2025 event (Zängl et al., 2015). Both models have a spatial resolution of around 1 km for a forecast lead time of 24 h. We apply the predicted precipitation and air temperature to estimate cooling or warming of the snowpack. Based on the predicted temperature evolution (warming, cooling, constant), we include an additional colder or warmer simulation scenario to account for uncertainty in snowpack temperature.
3.1 Release Probability
We present two approaches on how to calculate a probability indication map – the frequency approach and the stability approach. In both approaches, we assess the probability that a certain amount of snow loading occurs on a slope and interacts with a weak-layer which defines the fracture depth. The more refined stability approach further incorporates the stability of each single PRA.
For the subsequent avalanche simulations, an event is defined as the release of a single PRA at a given fracture depth derived as described above. Each simulated release volume is therefore characterized by one PRA and one fracture depth, with its thermal properties represented by the corresponding snow temperature class. All releases are assumed to occur naturally under the prescribed initial conditions.
3.1.1 Frequency Approach
In the frequency approach, we use input data from flat-field IMIS stations and weight all stations equally when deriving the predicted fracture depths. In this simplified implementation, all predicted fracture depths are assumed to occur with equal probability, independent of whether they originate from new snow or a buried weak layer.
The probability of fracture depth occurrence (PFH, freq), is estimated from the set of all predicted fracture depths obtained from all considered IMIS stations. We denote this set with , where h are the fracture depths and N is the total number of events. The fracture depths are grouped into discrete bins bk with a width of 0.1 m where k is the index of the bin according to the sensitivity analysis conducted by (Glaus et al., 2025). For each bin, the probability is defined as the relative frequency of observations within that bin:
where nk denotes the number of fracture depths falling into bin bk. By design, the probabilities sum to one, yielding a normalized distribution in which fracture depth classes that occur more frequently are assigned higher probabilities.
For each fracture depth class bk, avalanche simulations are performed to compute the corresponding runout. The simulation outputs are converted into binary hit indicators such that
The contribution of each fracture depth class to the spatial impact probability is then weighted by its occurrence probability PFH, freq(bk). The resulting hit probability at pixel x is obtained by summing the weighted contributions of all fracture depth classes,
yielding a spatially distributed probability of avalanche impact. For the avalanche core, the hit probability is calculated based on the maximum avalanche height per pixel, and for the cloud, the maximum powder pressure. The avalanche height is capped below 10 cm, and the powder cloud below 0.5 kPa.
3.1.2 Stability Approach
The impact of an avalanche at a given pixel requires (i) the occurrence of a release with a given fracture depth and stability index, and (ii) sufficient avalanche propagation to reach the pixel. In the stability approach, the natural stability index is used to weight the scenario probability associated with the corresponding fracture depth and potential release area. We therefore do not directly calculate the absolute release probability of an avalanche, but use the stability index as a relative weighting factor. In the following, these two components are combined at the level of individual release areas to derive a spatially distributed indication of hit probability for each pixel.
First, we calculate the set of fracture depths in the same way as in the frequency approach. To account for the stability of each PRA under the predicted snow load, we calculate the natural stability index Sn (Jamieson and Johnston, 2001), defined as the ratio between weak-layer shear strength τp and the applied shear stress of the slab. The natural stability index is given by
where ρ is the slab density, g the gravitational acceleration, D the fracture depth (slope normal), and α the mean slope angle of the release area. The parameters τp, ρ, and D are obtained from SNOWPACK simulations, while α is derived from the terrain model.
To convert Sn into a release probability, an error function (ERF) is fitted (described in Appendix B), assigning high release probability for Sn<1, a transition zone around Sn≈1.5, and low release probability for Sn≥2 (Monti et al., 2014). For each fracture-depth scenario hj and release area i, the corresponding stability-based release probability is calculated as
where denotes the normalized stability-to-probability mapping. In this way, release areas with lower stability indices receive higher release-probability weights.
The fracture depths are then grouped into K discrete bins bk of width 0.1 m, with k=1, …, K. For each bin bk and release area i, the bin-wise stability weight is obtained by summing the individual release probabilities of all fracture-depth scenarios falling within that bin and normalizing by the total number of fracture-depth scenarios,
Thus, wk,i represents the stability-weighted contribution of release area i for fracture-depth bin bk.
For each release area i and fracture-depth bin bk, simulation outputs are converted into binary hit indicators such that
If multiple simulations are available for the same (bk,i) combination, a pixel is considered hit if at least one simulation reaches the pixel. This binary indicator describes whether the runout from a given release area and fracture-depth bin affects pixel x, while the corresponding probability weight is provided by wk,i.
For a given pixel x, the hit probability is obtained by combining the weighted contributions of all combinations of release area and fracture depth. Assuming statistical independence between the individual scenarios, and with A being the total number of potential release areas, the hit probability is given by
This formulation represents the probability that at least one scenario reaches pixel x, while keeping the resulting probability bounded between 0 and 1.
Probability indication maps are calculated in a predictive mode based on the frequency approach for the data-rich validation events from 2019 and 2025. The 2019 event is used to assess how well the predicted impact probabilities reproduce observed avalanche release areas and runout distances. In 2025, two avalanches were artificially triggered within a 24 h prediction period, but on different slopes with different aspects and terrain characteristics. This allows for a targeted evaluation of whether the probability indication maps capture distinct avalanche responses under comparable meteorological conditions. The 2025 event at Breitzug is additionally recalculated based on the stability approach. We focus only on one example case for the stability approach due to the additional calculation and storage needs. To further evaluate the proposed framework, the analysis is extended to four additional historical avalanche events, with the primary aim of assessing whether the probability indication maps correctly indicate road impact in cases where SNOWPACK simulations were not available.
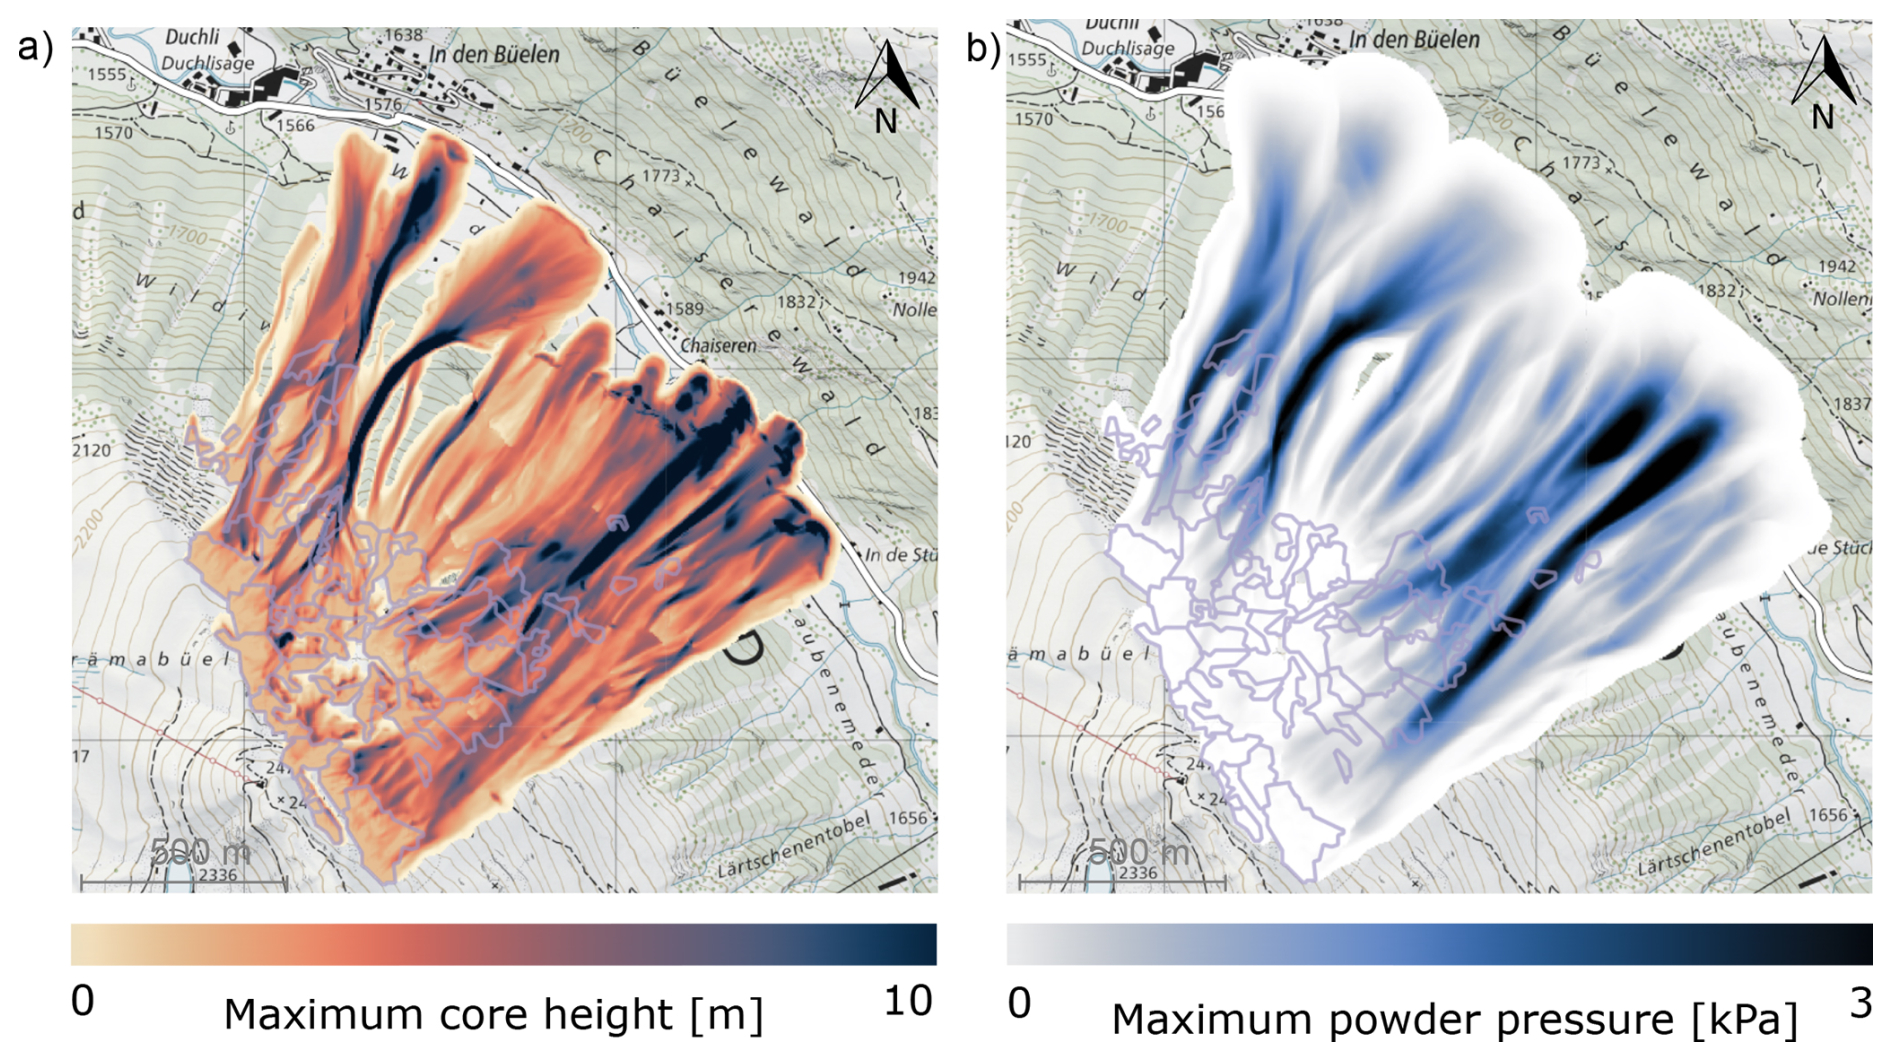
Figure 6Example of the calculation results of the maximum core height and powder pressure for medium-sized release zones with an expected new snow depth of 1.6 m in the flat field for the Brämabüel test site (map source: Federal Office of Topography).
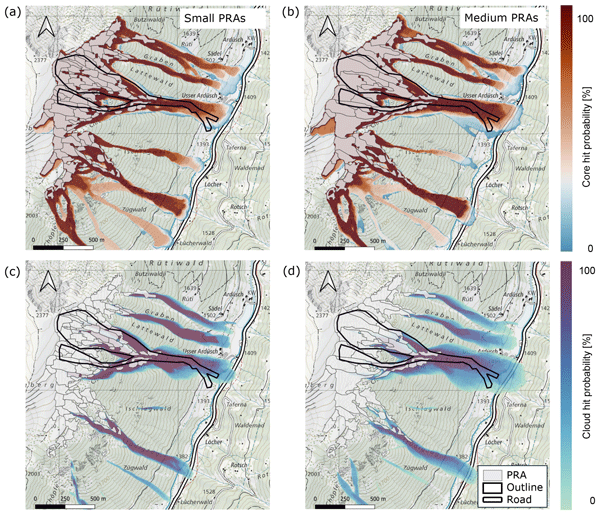
For the calculation of the probability indication maps, we performed one large-scale simulation for each predicted snow height at a station in the flat field. Each simulation represents a scenario in which all PRAs are triggered as independent avalanches. Figure 6 shows an example of the maximum core height across all scenarios and the maximum powder pressure for a flat-field snow height of 1.60 m at −8 °C in the Brämabüel region, assuming 96 medium-sized release zones.
4.1 Hindcast of the 2019 event
Figure 7 shows the calculated probability indication maps for the three avalanches that were released at the Brämabüel slope in 2019, considering small release zones on the left side and medium sized release zones on the right side. Combining the scenarios derived from the IMIS stations, weather forecast, and SNOWPACK simulations results in 72 different combinations of release height and release temperature. Together with the 96 potential release areas, this leads to 6912 individual avalanche simulations for the small release zones map and for the medium sized release zones to 3528 avalanches. The observed outline of the avalanche core and the release zone are shown in black. All three avalanches reached the road, and the associated powder clouds extended into the counter slope. The powder cloud impact appears spatially limited, as grid cells with cloud pressures below 0.5 kPa are omitted because such pressures are insufficient to harm a person. Furthermore, the terrain in the runout zones is relatively flat, leading to rapid deceleration of both the core and the cloud.
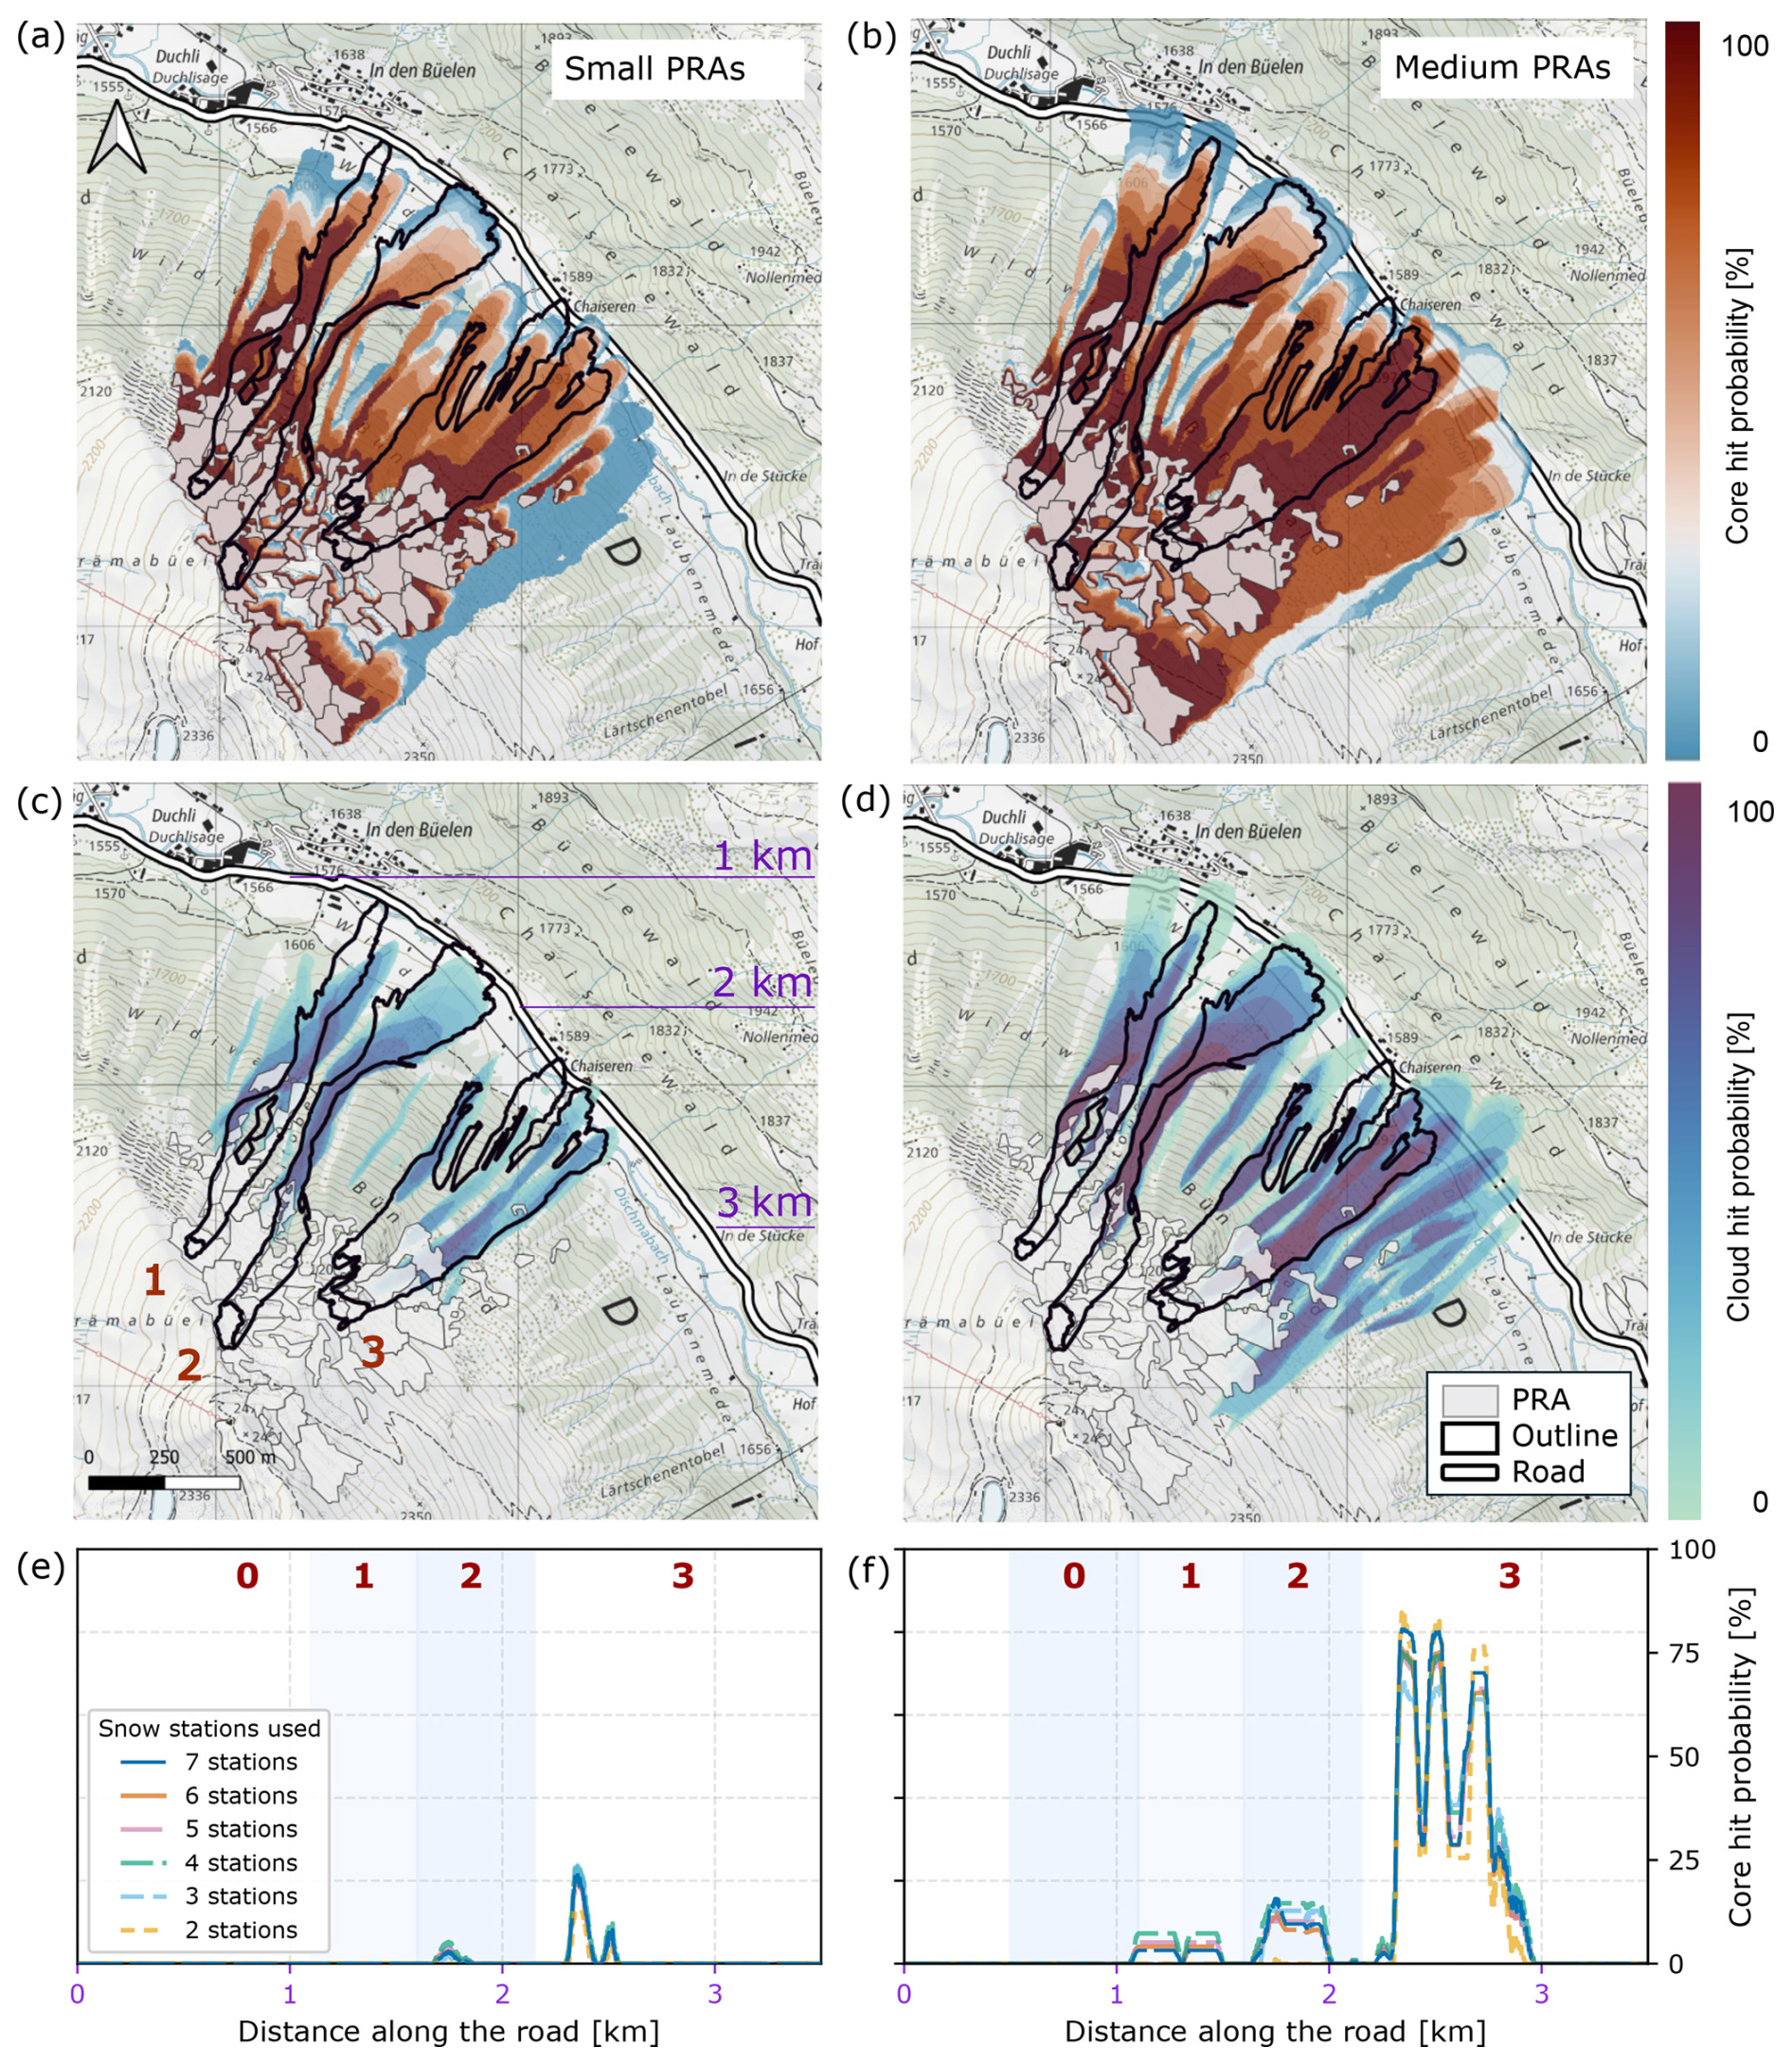
Figure 7Resulting probability indication maps for the Brämabüel test site based on the frequency approach for small (a, c, e) and medium (b, d, f) release zones based on snow measurements from selected IMIS stations in the Davos region and weather forecasts one day before the event (14 January 2019, 12:00 CET). Black outlines indicate the avalanche event of 15 January 2019. The bottom row shows the calculated hit intensities along the road , based on seven IMIS stations, with stations removed sequentially starting from the farthest one (map source: Federal Office of Topography).
The lower panels e and f of Fig. 7 present the corresponding hit probabilities along the road, plotted from north to south over a distance of 0 to 4 km. For small release zones, paths 2 and 3 show a low probability of reaching the road, with maximum values of approximately 20 %. In contrast, the medium release zone scenario indicates a substantially higher likelihood of hitting the road for all three tracks, with probabilities reaching up to 80 % for track 3. Overall, the spatial patterns of the higher probability values align well with the observed avalanche paths, indicating that the model captures both the road section and the relative extent of the avalanche runout.
The probability indication maps are based on measurements from all seven IMIS stations. To assess the sensitivity of the results to lower station availability, the road-aligned probability profiles were recomputed by successively removing stations according to their distance from the release area (Fig. 2). The resulting profiles show limited spread, indicating a low sensitivity to the number of applied input stations.
To quantify the sensitivity of the probability along the road to the number of input stations, deviations from the reference case (seven stations) were evaluated using the mean absolute error (MAE), and the maximum pointwise deviation. For six and five stations, the deviations remain very small, with MAE values below 10−3. When reducing the number of stations to four and three, errors increase but remain moderate.
4.2 Hindcast of the 2025 events
For the 2025 validation events, probability indication maps were issued on 28 January 2025 at 12:00 CET after a short snowfall, as shown in Fig. 5. Within the following 24 h prediction period, two avalanches were artificially triggered at different times and on slopes with differing aspects and terrain characteristics. These events provide the opportunity to examine how the framework produces the probability indication maps to contrasting avalanche outcomes under otherwise comparable meteorological conditions.
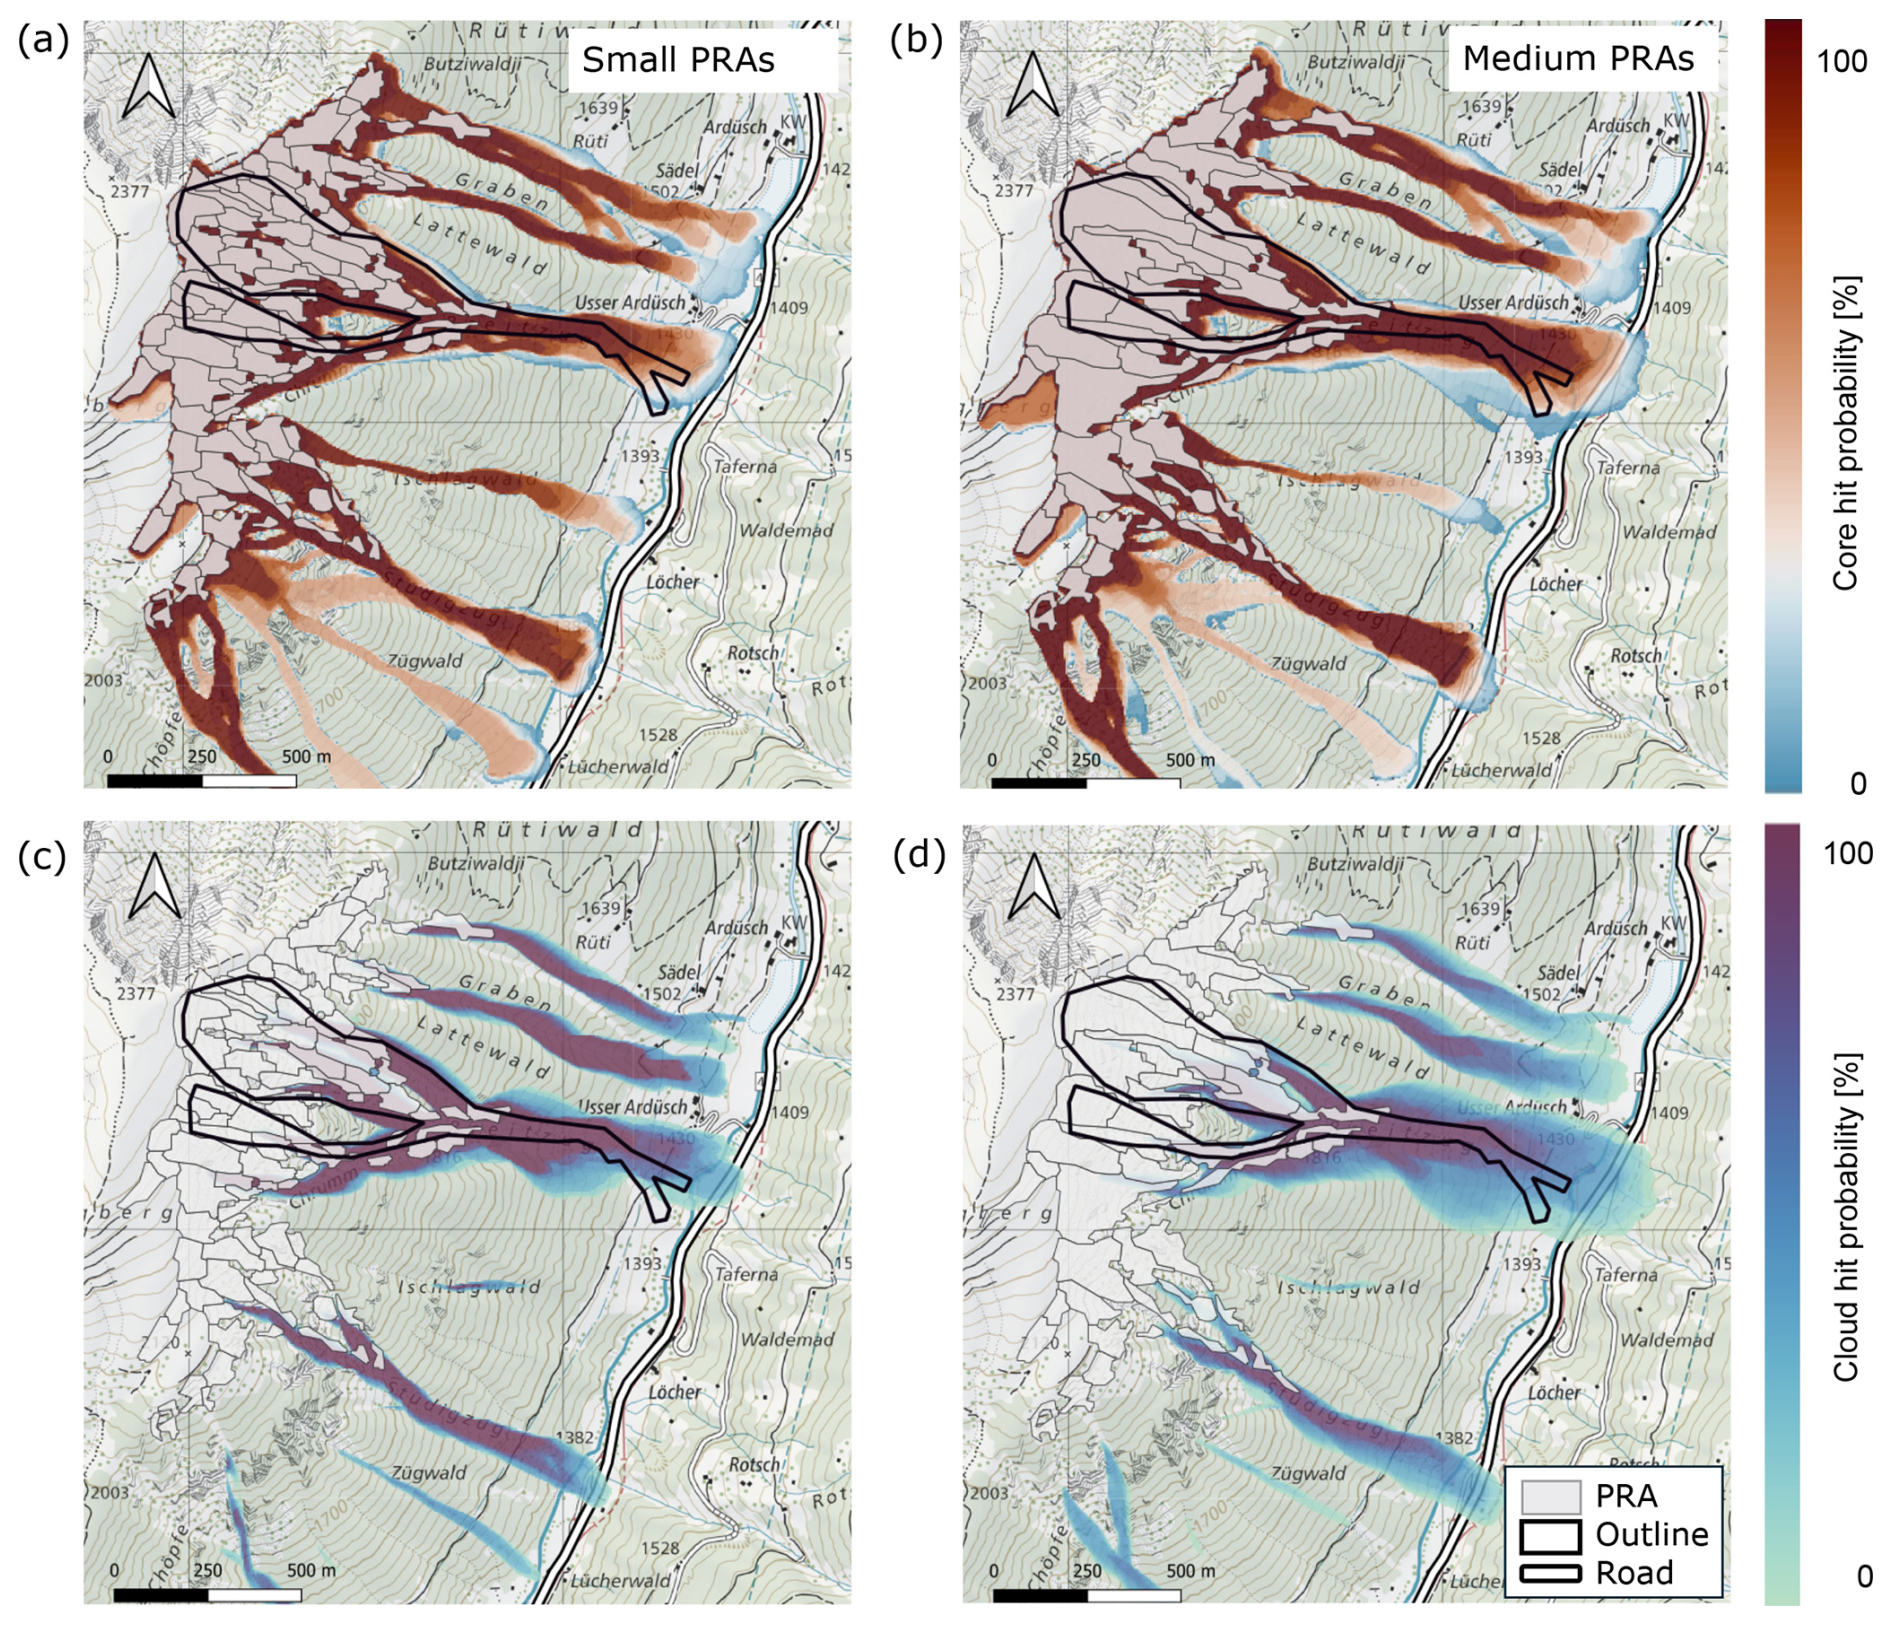
Figure 8Probability indication map at Breitzug based on the frequency approach issued on 28 January 2025 at 12:00 CET. The avalanche outlines (shown in black) correspond to the event triggered at approximately 17:00 CET on the same day by a Wyssen tower (map source: Federal Office of Topography).
The first avalanche was triggered at the Breitzug slope at approximately 17:00 CET on the same day and reached a river, which has a road section next to it that is protected by an avalanche shed. The corresponding probability indication map is shown in Fig. 8. The second avalanche was triggered at Brämabüel the following morning at around 07:00 CET, and remained rather small, as shown in Fig. 9. Although both cases are based on the same forecast cycle, the resulting probability indication maps differ due to variations in the predicted weak-layer characteristics, which are associated with different slope exposures.
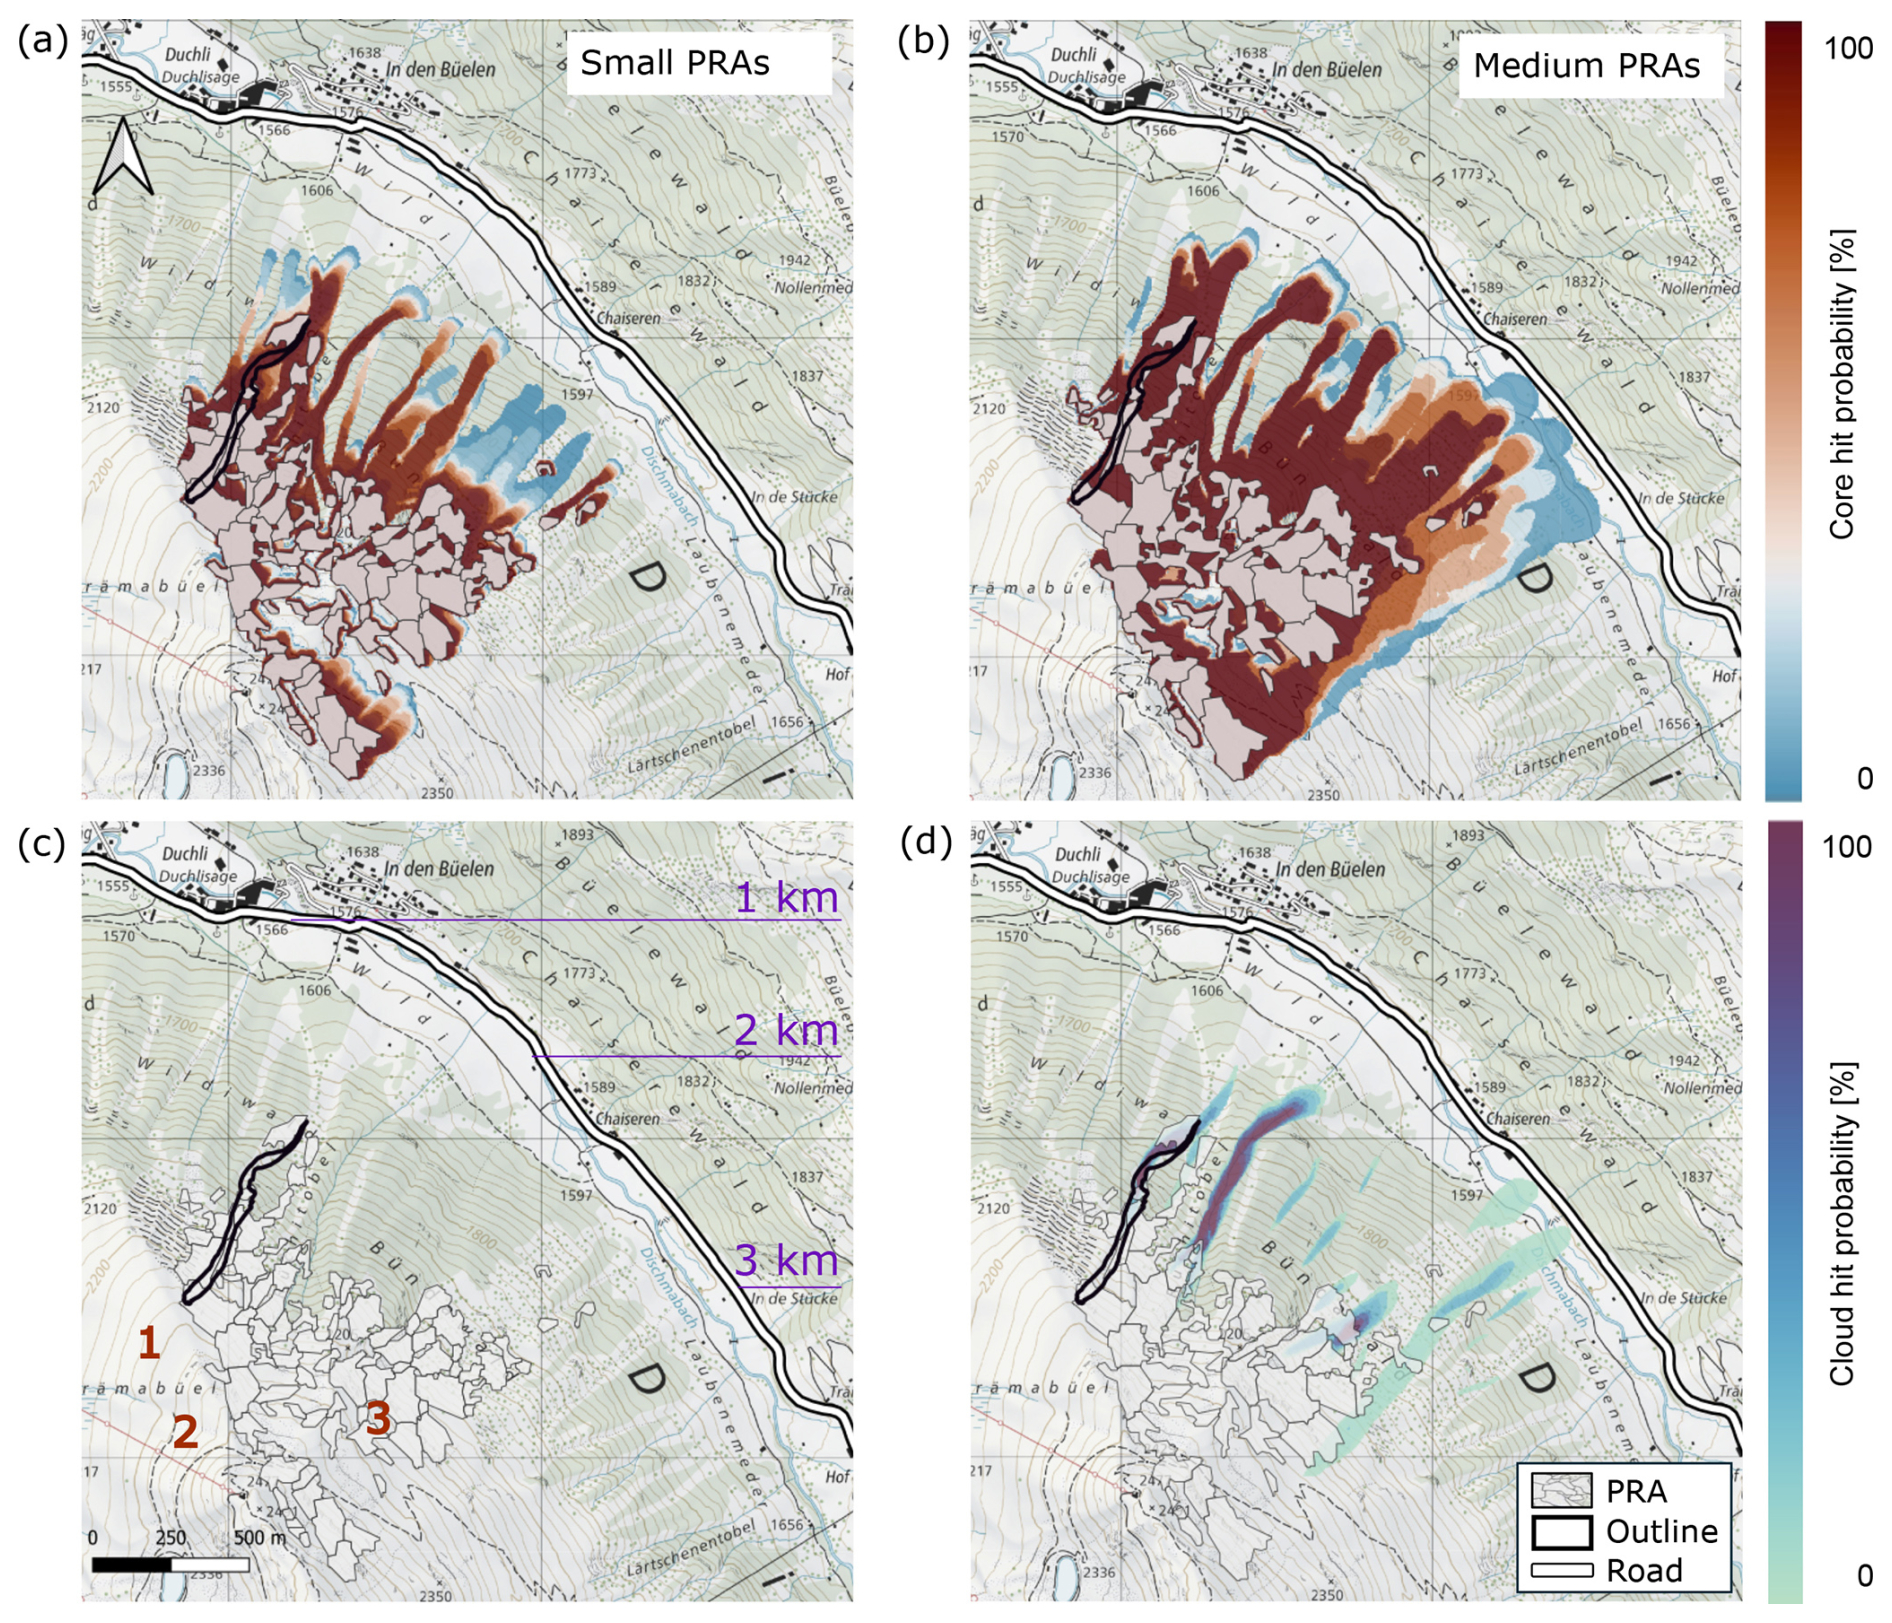
Figure 9Probability indication map for Brämabüel based on the frequency approach. It is calculated based on snow measurements at all IMIS stations in the region of Davos and the weather forecast of the day before the event on 28 January 2025 12:00 CET. In black, the avalanche outlines are marked for the event that occurred on the morning of 29 January 2025, at 08:00 CET. The avalanche paths 1, 2 and 3 are marked in panel (c) (map source: Federal Office of Topography).
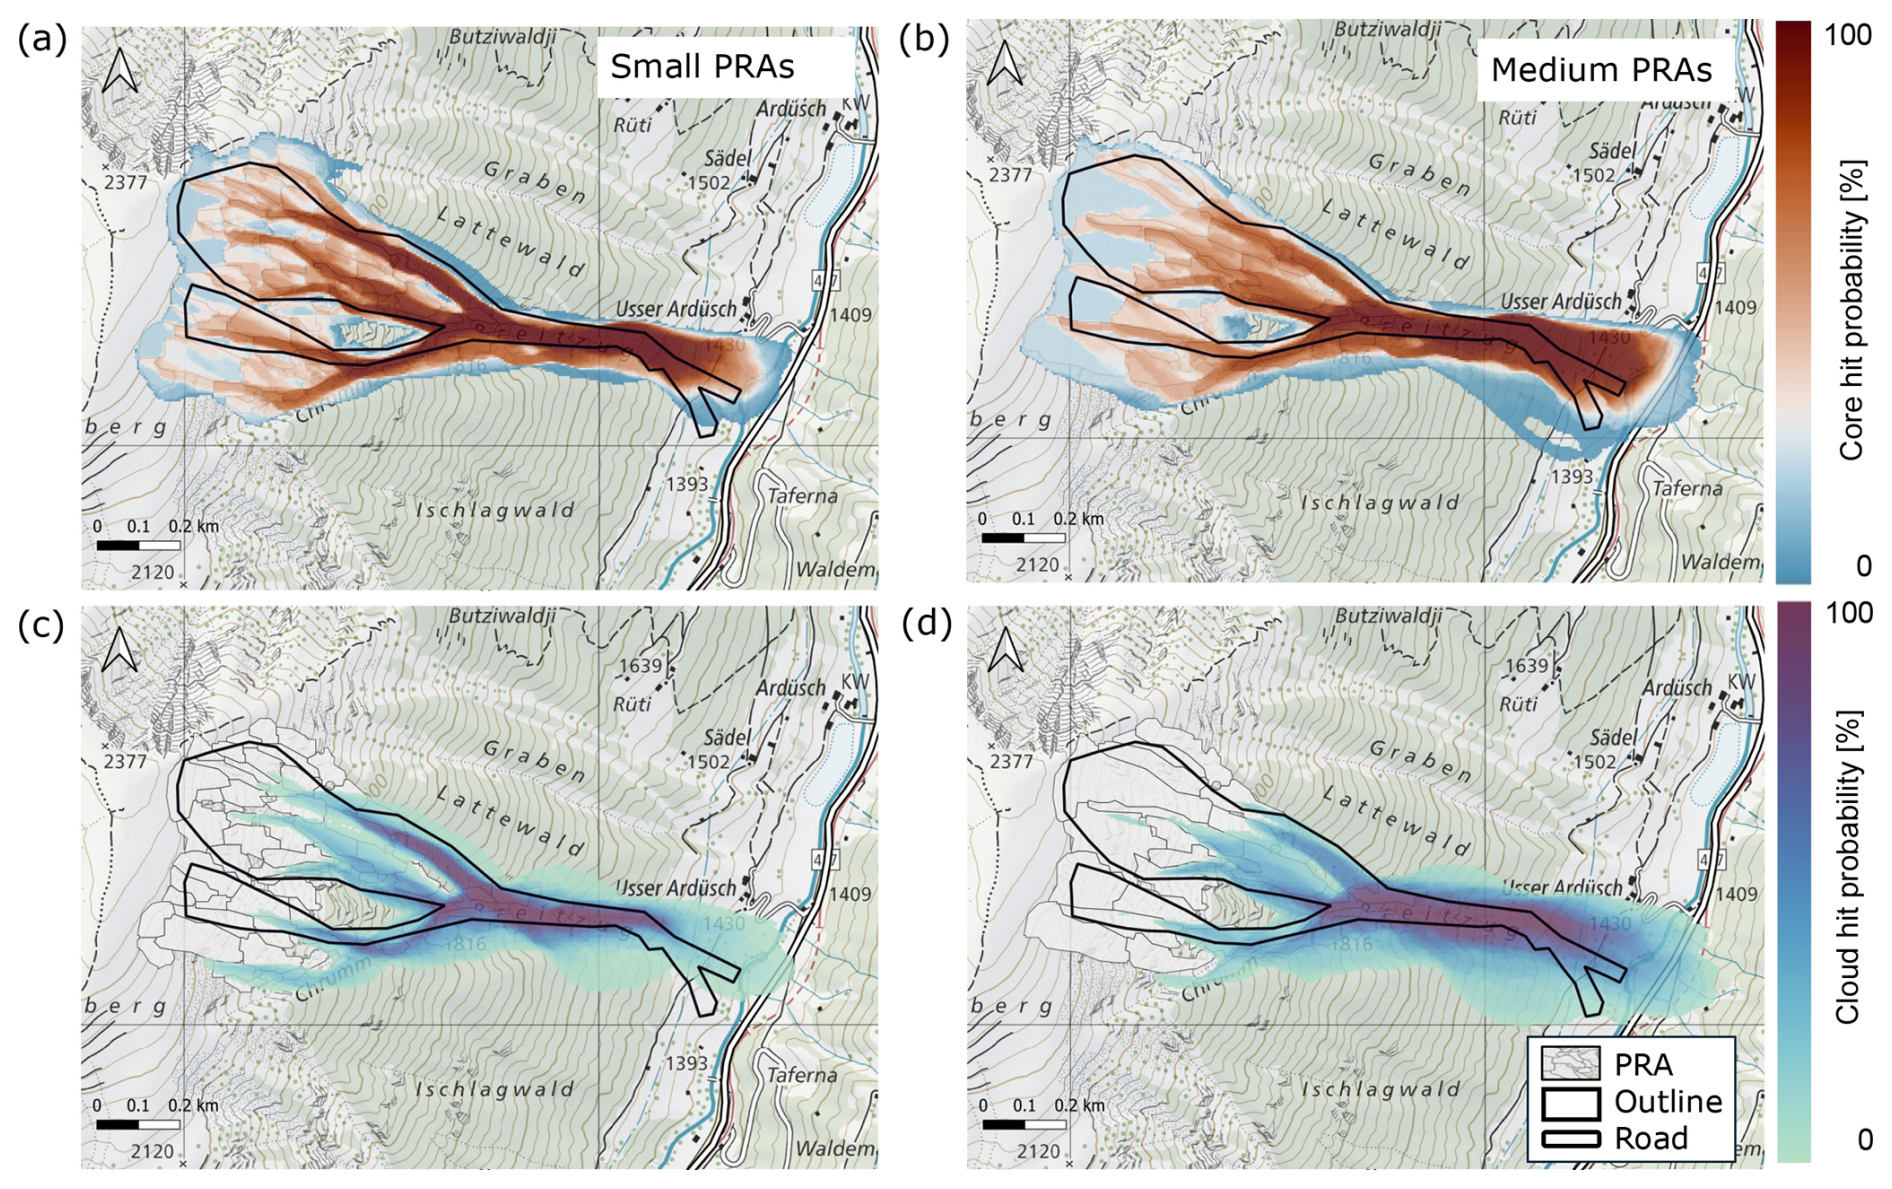
Figure 10Probability indication map at Breitzug based on the stability approach that includes the stability index and steepness of every single release zone. The PRAs are shown in the background to improve the visibility of the probability indication map in the upper part of the avalanche path (map source: Federal Office of Topography).
In the next step, we applied the stability approach to the Breitzug event as an example and conducted the same analysis (Fig. 10). Scenarios from steeper or less stable release areas receive higher weights, whereas those from flatter or more stable release areas receive lower weights. Overall, the predicted hit probability along the road below Breitzug changed little compared to the frequency-based result. In both approaches, small PRAs yield very low hit probabilities at the road, whereas medium PRAs produce low but non-zero probabilities. The frequency approach indicates an average hit probability of approximately 10 %–15 % along the affected road section for medium PRAs, while the stability-based approach yields a similar or slightly lower value of about 10 %. The main difference between the two approaches is therefore not a substantial change in the predicted road impact in this case, but a more nuanced spatial distribution of hit probability within the avalanche path.
4.3 Application to historical avalanche events
In addition to the recent validation events, the proposed data flow was applied to a set of historical avalanche events for which only limited input data were available. The historical cases comprise both road-hitting events in 1999 and 2018 and non-road-hitting events in 2017 and 2021. For these events, not all elements of the workflow could be reconstructed. Most notably, detailed SNOWPACK simulations, which are required for a robust identification of the governing weak-layers, are not possible to be reproduced. Probability indication maps were therefore computed using IMIS stations that were operational at the respective times and, where possible, supplemented by information from manual snow-pit observations.
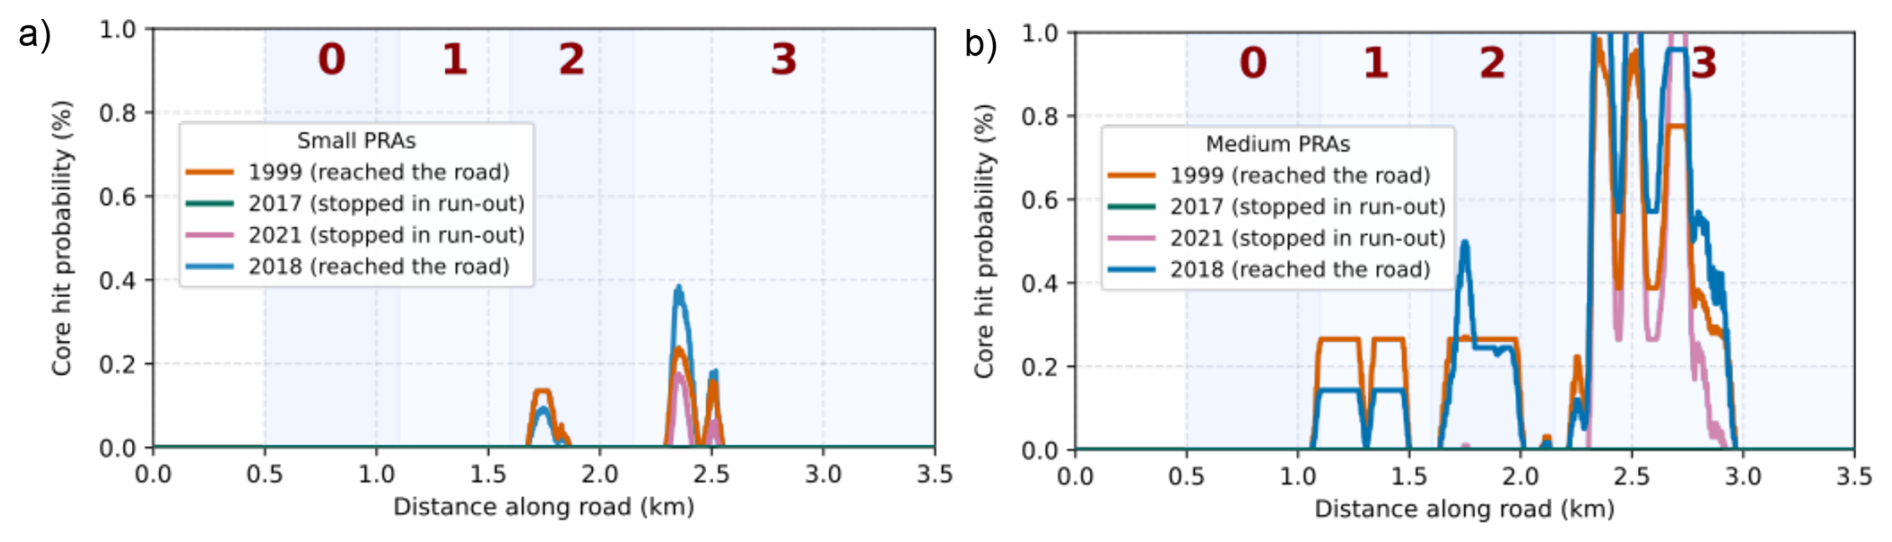
Figure 11Probability along the road below Brämabüel for small and medium release zones for the events in 1999, 2017, 2018 and 2021. For the events in 1999 and 2018, avalanche paths 1 and 2 reached the road, whereas in 2017 and 2021 the avalanches stopped within the flatter runout zone.
Avalanche probabilities along the road for small and medium release zones are shown in Fig. 11. For the extreme 1999 event, reports indicate that avalanches from tracks 1, 2, and 3 reached the road. Our calculations indicate that avalanches initiated in small release zones do not reach the road for track 1. The flow behaviour of that specific event is most likely related to potentially erratic information on the actual weak-layer involved and the associated erosion volume. For medium-sized release zones, and primarily for track 3, we obtained a higher probability of hits along the road. These findings emphasize the importance of accounting for all potential buried weak-layers in the snowpack to capture the full erosion potential, as opposed to only considering new precipitation amounts.
For the 2021 case, we obtained a road hit probability of around 18 % for track 3 and the simulated runout distance is slightly overestimated compared to the observed runout. Overall, the results indicate a systematic tendency for avalanche path 3 to propagate too far in the simulations, whereas avalanche paths 1 and 2 tend to be too short. These differences are likely related to topographic characteristics for which we are unable to model a realistic avalanche flow behaviour response. Avalanche paths 1 and 2 are more channelised and originate from steeper release zones, whereas avalanche path 3 is less confined and features substantial small-scale vegetation within the track. Such vegetation is not explicitly represented in the simulation tool, but in reality it is likely to increase the basal friction, which limits runout distances. Consistent with this interpretation, avalanche path 3 is observed less frequently to propagate fully down to the road in documented events as shown in Fig. 3.
Following the implementation of our framework for both recent and historical avalanche events, this section evaluates its ability to predict runout distances from daily snow and weather conditions. The discussion subsequently examines the sensitivity of the results to input data and the robustness of the probability calculations.
The Brämabüel slope offers a useful case for comparing the avalanche conditions and consequences in 2019 and 2025. In 2019, the Dischma road was closed for more than 2 days and the avalanches reached the road, while in 2025 the road was only briefly closed during artificial release, and the avalanche stopped partway down the slope. The contrasting outcomes align with the probability indication maps where some avalanche scenarios are expected to stop partway down the slope while others are likely to produce much longer runouts (see Figs. 7 and 9).
A limitation of this study is that the framework was evaluated using a limited number of avalanche events from one specific region, Davos. The selected cases primarily involve situations in which the avalanche tracks were snow-covered from the release area to the runout zone. These conditions may not hold in other cases, for example, in late-season conditions, where avalanches subsequently flow over snow-scarce or grass-covered slopes at lower elevations. Such conditions make snow-height information along the full elevation gradient essential, requiring representative input from both valley and mountain stations.
A general challenge in evaluating probability indication maps using documented avalanche events is that an observed runout confirms that a scenario was possible under the given conditions but does not directly provide information about its occurrence probability. To assign such a probability, the non-occurrence probability of comparable avalanches under similar conditions would also need to be known. This limitation is particularly relevant for organized measurement campaigns, where avalanches are artificially triggered to collect detailed measurements. The triggering method and explosive type may influence which weak layer is released and, therefore, the resulting fracture depth. Once the fracture depth and release area are defined, however, the subsequent runout is mainly governed by the released volume, terrain, snow cover conditions, and flow parameters. Artificially triggered avalanches can therefore be used to assess whether simulated runout scenarios are plausible, but they cannot directly validate the absolute probability of a natural release. The probability indication maps presented here should thus be interpreted primarily as conditional scenario maps that indicate which runout may result if a release occurs, rather than as direct estimates of the absolute probability of avalanche occurrence. However, we acknowledge that this may lead to a conservative interpretation.
The availability and quality of the input data can have a strong influence on the resulting probability indication maps. The maps are based on forecasted snow and weather conditions and therefore inherit uncertainties from meteorological predictions. Deviations between forecasted and actual conditions, or changes in the snowpack due to snowfall, wind redistribution, or temperature changes, can substantially reduce the representativeness of the maps. Consequently, probability indication maps should be regarded as time-dependent products valid only for the specific forecast window for which they are generated. The appropriate issuing time depends on the operational application. For example, a map may be useful before the onset of a forecasted snowfall event to support early road-closure decisions, or it may be updated during or after the event as new meteorological and snowpack information becomes available.
The spatial representativeness of snow and weather measurement stations strongly influences the model performance. Although a dense station network is available, most stations are located in flat terrain and may not adequately represent the prevailing conditions in steep avalanche release zones (Helbig et al., 2015; Helbig and van Herwijnen, 2017). Our analysis shows that simply increasing the number of measurement stations does not improve predictive skill. The calculations could also be run with a single weather station by setting the gradient of the erodible snowcover and snow temperature to zero, as illustrated in Fig. S1 of the Supplement. However, this would prevent the system from representing situations in which avalanches flow into lower-elevation areas with little or no erodible snow cover, or into zones with a warmer snowpack. The model performance improves when meteorological measurements at a station location are well correlated with the conditions within a specific avalanche path. In this respect, the DAV2 station, which is located in steeper terrain, shows a notably stronger correspondence with the Brämabüel avalanche slope. Snow temperature measurements are particularly sensitive to sensor placement and radiative effects, which impacts the transferability of the data to release areas and introduces additional uncertainty. Still, if we compare the predicted fracture depth with the snow depth distribution measurements from photogrammetric drone data for the Brämabüel cases 2019 and 2025, we had a high probability around the measured snow height.
The results of our framework implementation further reveal a strong sensitivity to several model input parameters. In particular, the definition and spatial extent of the release zones exert a major influence on the resulting probability indication maps. In the current implementation, release zones are derived using a return-period-based algorithm. While suitable for large-scale assessments, such static delineations are suboptimal for operational forecasting. Release zones should instead be dynamically adapted to prevailing snow and weather conditions (Meloche et al., 2025).
Moreover, the avalanche dynamics simulations are highly sensitive to the assumed snow temperature, a parameter that is difficult to infer reliably from valley-based observations. This sensitivity constitutes a key source of uncertainty in operational applications, where direct measurements in avalanche release areas are rarely available.
The presented dataflow is not limited to a specific avalanche dynamics model. However, applying it with another numerical simulation tool requires that the model is sufficiently sensitive to the snow-cover and flow regime represented in the input scenarios. In RAMMS::EXTENDED, the frictional behavior is dynamically calculated for different snow conditions, so we treat the friction parameterization as part of the calibrated model setup. If the workflow was applied with a model based on fixed Voellmy friction parameters, such as prescribed values of μ and ξ for cold snow, very cold snow, or highly erosive conditions, the uncertainty associated with these calibrated parameters would become more important. In such an application, μ and ξ should be included as additional uncertain input variables in the probabilistic calculation.
Accurate representation of forest cover and vegetation is also important to achieve realistic avalanche extents (Feistl et al., 2015), as these strongly influence avalanche flow behaviour. In the Brämabüel simulations, forest density was underestimated compared to the actual conditions, which allowed simulated avalanches to propagate into areas that are classified as non-affected in the official hazard map.
Interpretation of modelled results requires consideration of the avalanche history of individual tracks as it affects the potential amount of erodible snow (Sovilla et al., 2010). The Breitzug case, for instance, represents the first avalanche of the season and occurred on an undisturbed snowpack within a well-defined terrain bowl–conditions conducive to large avalanches. In contrast, the frequently skied Brämabüel slope experiences snowpack compaction from ski traffic, which disrupts weak-layer continuity and reduces the likelihood of large releases. These local effects are not explicitly represented in the current modelling framework, but strongly influence real-world avalanche behaviour.
We tested two approaches to weight the release scenarios: a frequency-based approach, in which storm-snow and old-snow releases are weighted equally, and a stability-based approach, in which the weighting depends on the natural stability index derived from SNOWPACK calculations. Overall, we get similar probability indication maps from these two approaches, but the map generated based on the stability approach shows a more differentiated picture of the runout distances. The frequency-based approach is intentionally simple and computationally efficient, as it requires only an aggregated avalanche overlap map for each scenario. This simplicity is advantageous for operational applications and avoids introducing additional uncertainty from simulated weak-layer stability. In contrast, the stability approach is more data-intensive because it requires storing individual avalanches and introduces an additional source of uncertainty by relying on weak-layer stability information simulated with SNOWPACK. Moreover, the stability approach is based on the natural stability index and therefore provides a more nuanced representation of spontaneous release conditions. For artificially triggered releases, however, this information is not directly transferable, since the released weak layer and fracture depth may depend on the applied release method. In such cases, the stability approach may yield a conservative probability indication map. Nevertheless, the stability approach may be advantageous in situations with a broad range of release-zone steepness, as it reduces the influence of comparatively flat release zones in the probability indication map. In practical applications where limited information on weak-layers is available – for example, when only a single snowpit provides indications of weak-layer properties – this weighting could be adjusted based on expert judgement. Alternatively, the stability of the weak-layer could be parametrized based on the shear strength as a function of fracture depth, following the formulation proposed by Bažant et al. (2003) and further refined by Gaume et al. (2014) and Meloche et al. (2024). This would allow the stability index to be estimated in a manner more aligned with the stability approach. With evolving research on the prediction of snowpack stability and release-zone size, additional statistical models could be coupled to the dataflow (Gaume et al., 2012).
This study presents a proof of concept for a model-driven framework that combines meteorological measurements, weather forecasts, snowpack simulations, and dynamic avalanche simulations to generate spatially explicit probability indication maps of avalanche runout. These maps are intended to support decision-making concerning traffic safety management and daily avalanche mitigation strategies in high risk avalanche hazard areas.
The results demonstrate that the framework can reliably distinguish between events in which avalanches reach the road and events in which they stop higher up on the slope. The analysis highlights the importance of the spatial relationship between weather stations and individual avalanche paths, as well as the potential for substantial uncertainties to propagate through our framework, from local measurements to dynamic avalanche simulations.
In this first implementation, snowpack stability was not explicitly included in the probability calculation. While integrating stability information from snowpack models or observations is a promising next step, caution is warranted, as additional modelling layers may further increase overall uncertainty and calibration traceability.
For practical implementation, such a framework would need to be evaluated and refined over several seasons in close interaction with practitioners, in order to characterize systematic model deficiencies, including potential over- or underestimation of runout distances, and to isolate the sources of error. In this context, data-driven and machine-learning approaches may offer additional opportunities to support pattern recognition and uncertainty assessment, provided that sufficient high-quality training data is available. We see considerable potential for this approach in regions where a single decision-maker must assess avalanche hazard over large areas within a short time frame, as the framework can provide a rapid overview of potential avalanche hot spots and it can highlight tracks that may not have been active in recent years. Future work should first test the workflow along the full road corridor and across different Alpine regions to assess its transferability under comparable climatic conditions, before adapting it to more data-sparse regions such as Alaska or the Himalayas.
In Fig. A1, the main avalanche paths for our case study slopes are shown. The Brämabüel avalanches originate in very steep terrain but have a flat runout before they reach the slope.
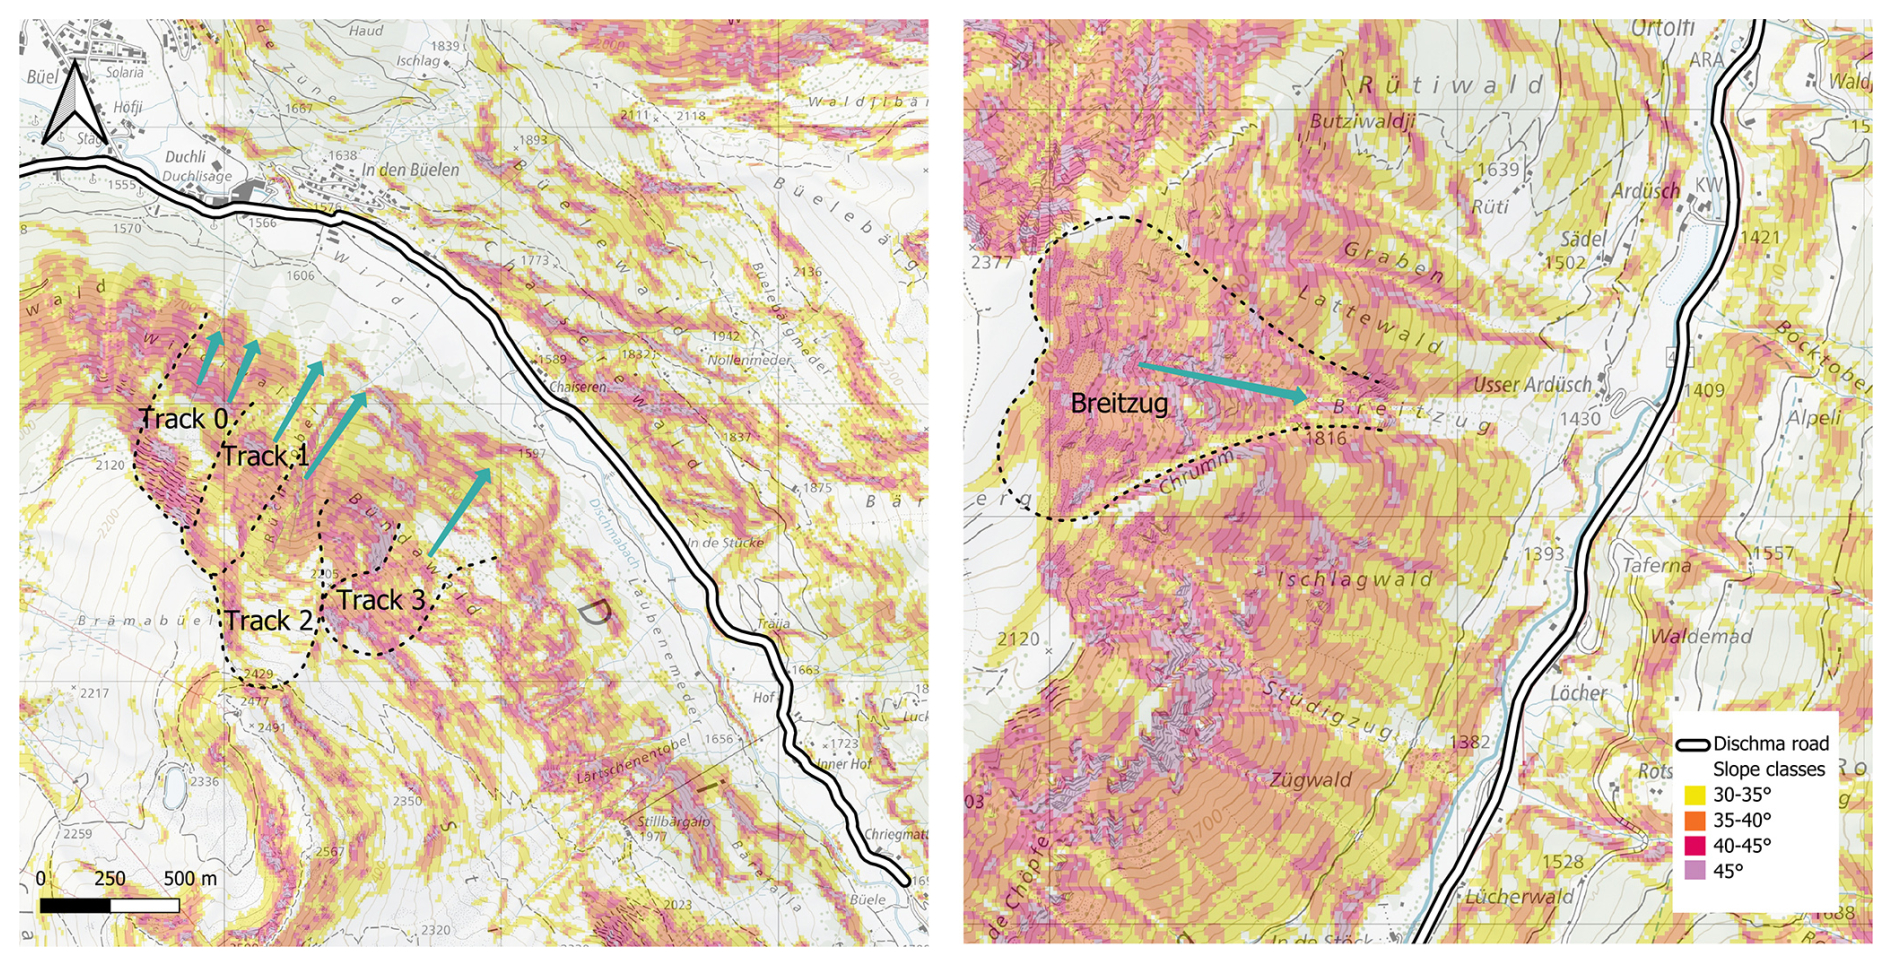
Figure A1Representation of the Brämabüel and Breitzug avalanche tracks with the slope steepness. For every avalanche track, the main flow direction is indicated by the turquoise arrows (map source: Federal Office of Topography).
The natural stability index Sn is converted into a release probability using an error function (ERF), which provides a smooth transition between unstable and stable conditions. The mapping is defined as
where S50 denotes the stability index corresponding to a release probability of 0.5 and σS controls the width of the transition zone. In this study, we use S50=1.5 and σS=0.25, resulting in a pronounced transition between unstable and stable conditions and a rapid decrease in release probability for Sn>2.
Figure B1 illustrates the resulting relationship between Sn and Prel.
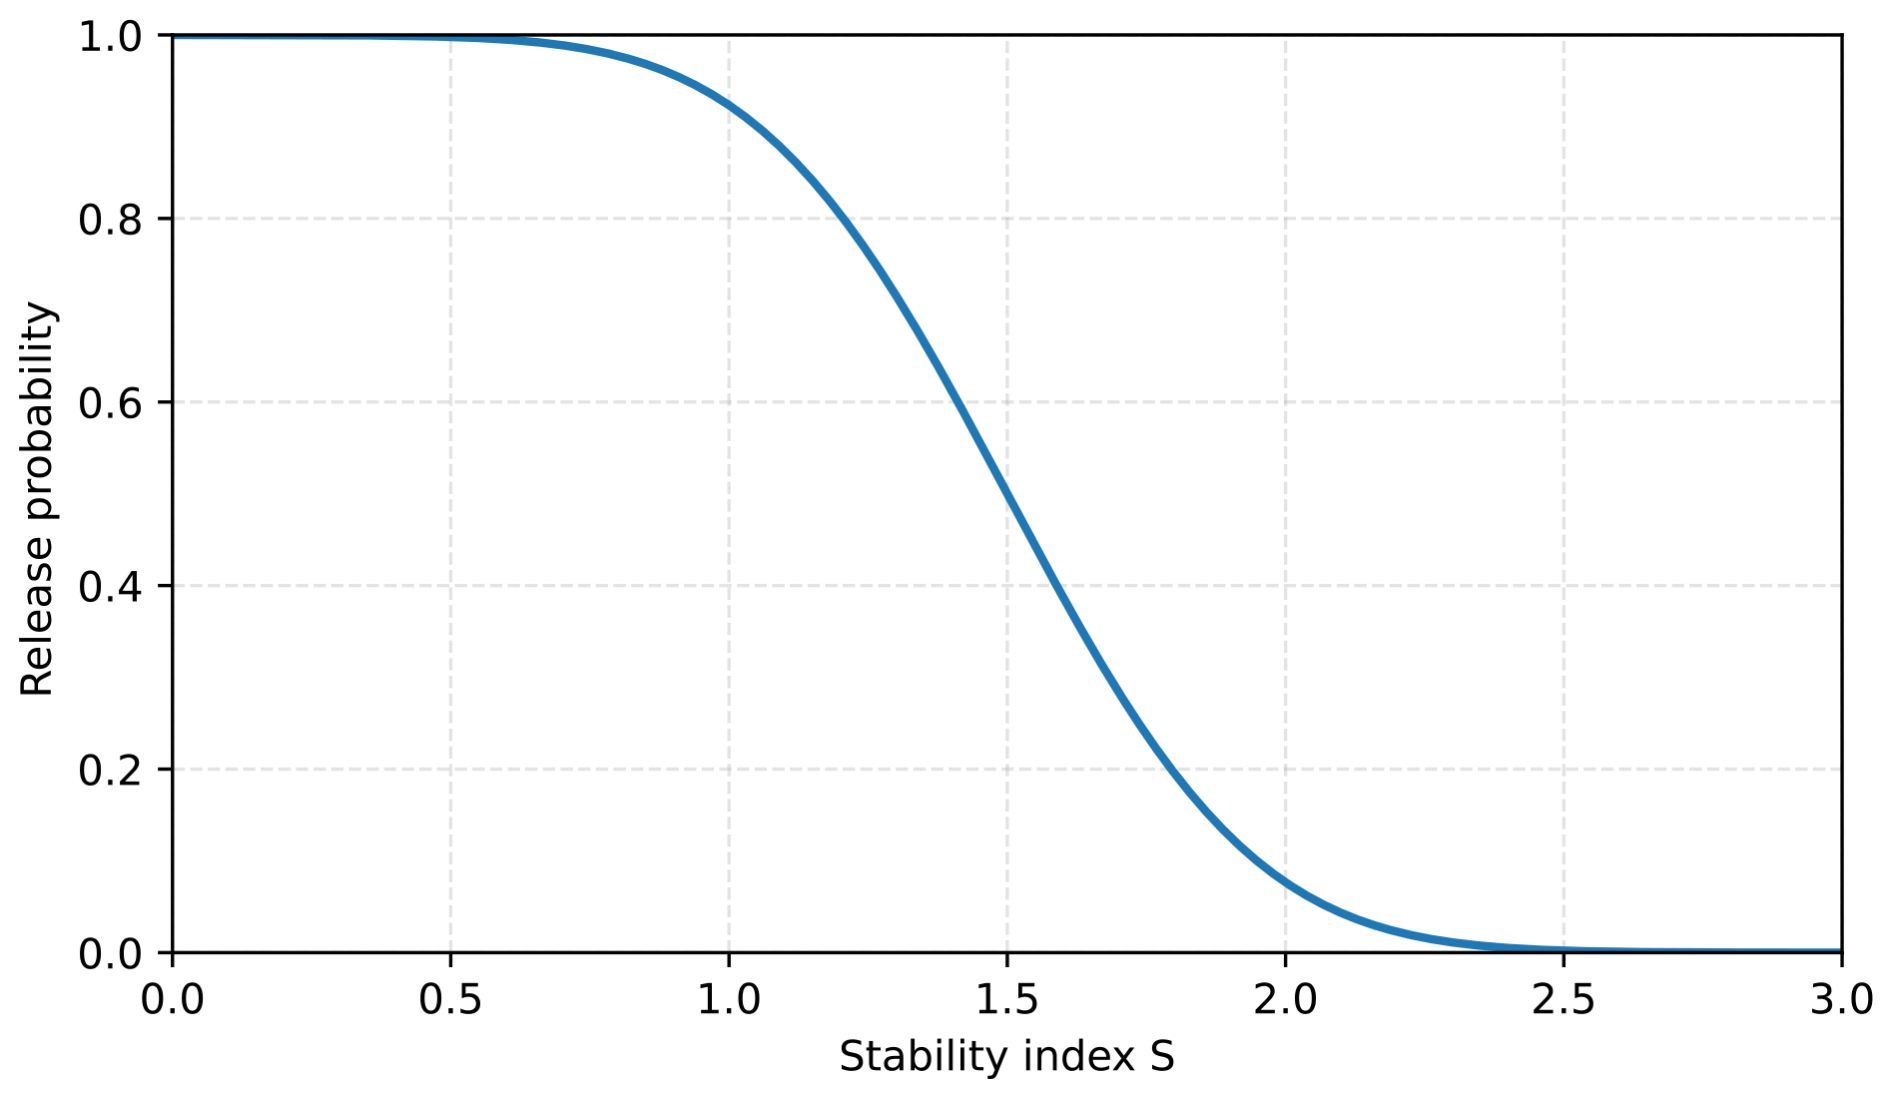
Figure B1Mapping between the natural stability index Sn and the release probability using the ERF function.
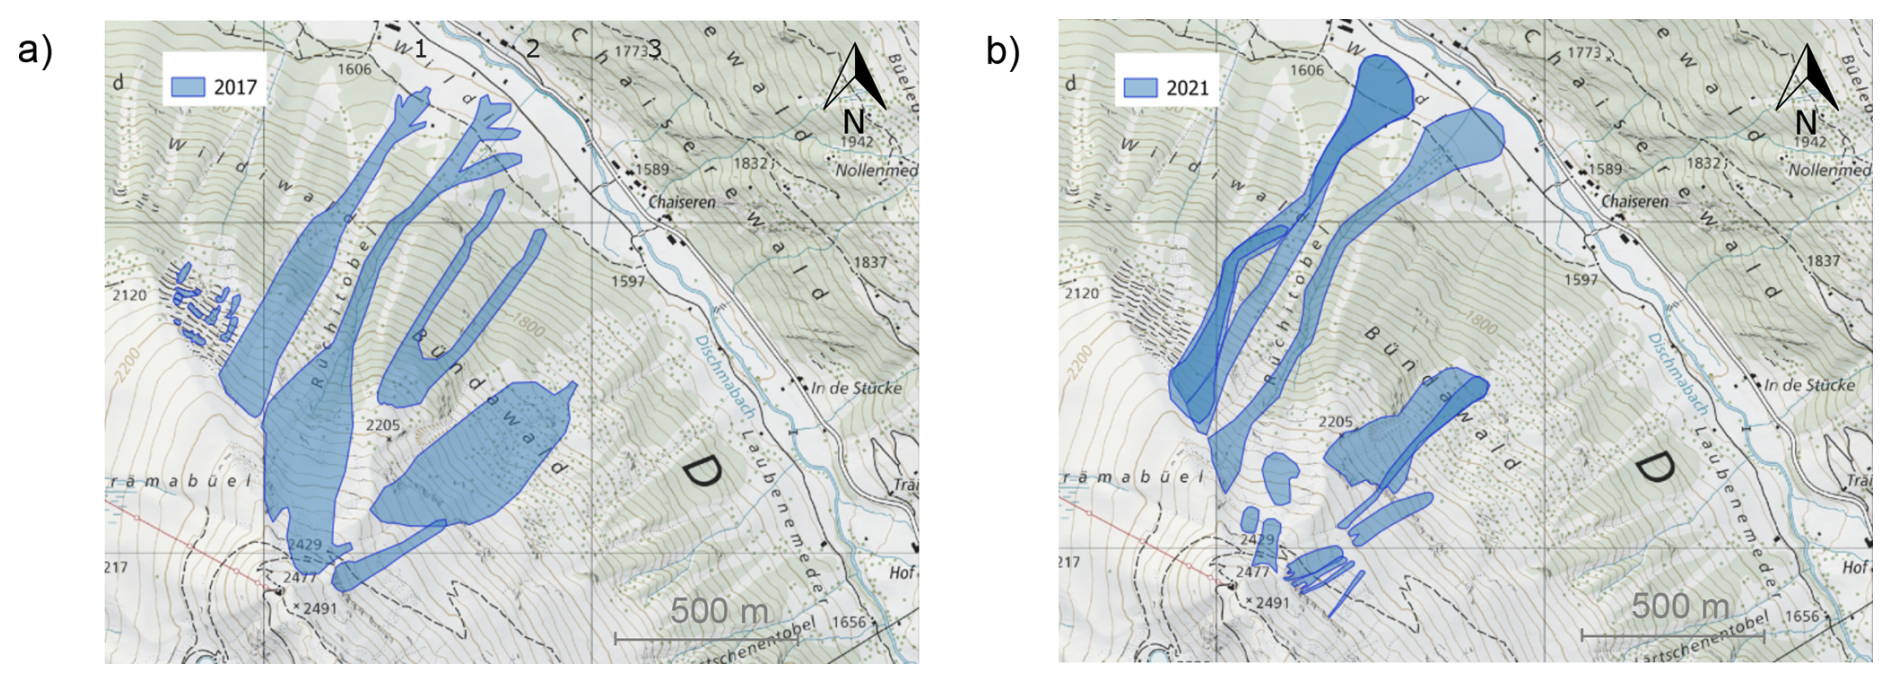
Figure C1Manually delineated avalanche outlines at Brämabüel for the events of 10 March 2017 (a) and 15 January 2021 (b). For both events, avalanche paths 1 and 2 propagated further downslope than avalanche path 3. For both events, additional avalanche activity is visible within the study area (map source: Federal Office of Topography).
The code used to generate the probability indication maps is available on Zenodo at https://doi.org/10.5281/zenodo.21992505 (Glaus, 2026).
Observed avalanche outlines for the Brämabühl events of January 2019 are publicly available at https://doi.org/10.5281/zenodo.15796702 (Glaus, 2025). Additional observational data used in this study are available from the corresponding author upon reasonable request.
The supplement related to this article is available online at https://doi.org/10.5194/tc-20-6087-2026-supplement.
JG, KWJ, JGau, and YB designed the study. JG performed the calculations and drafted the manuscript. JK and LS contributed to the data analysis and probability calculations. PR provided field measurements from the Brämabüel avalanche paths. All authors contributed to the interpretation of the results and approved the final manuscript.
The contact author has declared that none of the authors has any competing interests.
Publisher's note: Copernicus Publications remains neutral with regard to jurisdictional claims made in the text, published maps, institutional affiliations, or any other geographical representation in this paper. The authors bear the ultimate responsibility for providing appropriate place names. Views expressed in the text are those of the authors and do not necessarily reflect the views of the publisher.
We would like to extend our thanks to Mathias Bavay for providing the SNOWPACK simulations and to Marc Christen for valuable discussions and for setting up the latest version of RAMMS::EXTENDED for large-scale calculations. We also thank Tobias Jonas, Nander Wever, and Oliver Fuhrer (MeteoSwiss) for providing the forecast data. We are grateful to Christian Göhrig for his support with the IMIS station overview graphics. We further thank Frank Techel for his support in identifying weak layers from SNOWPACK. Furthermore, we are grateful to our colleagues at Wyssen, Walter Steinkogler, Matthias Pleyer, and Cesar Vera Valero, for their continuous practical feedback and for documenting the Breitzug avalanche. We also thank the anonymous reviewers for their constructive comments and suggestions, which helped improve the manuscript. We further acknowledge the use of generative AI tools for assistance in improving the grammar and writing style of the manuscript.
This research has been supported by the Schweizerischer Nationalfonds zur Förderung der Wissenschaftlichen Forschung (grant no. 207519).
This paper was edited by Alexandre Langlois and reviewed by three anonymous referees.
Aaron, J., McDougall, S., Kowalski, J., Mitchell, A., and Nolde, N.: Probabilistic prediction of rock avalanche runout using a numerical model, Landslides, 19, 2853–2869, https://doi.org/10.1007/s10346-022-01939-y, 2022. a
Baldauf, M., Seifert, A., Förstner, J., Majewski, D., Raschendorfer, M., and Reinhardt, T.: Operational convective-scale numerical weather prediction with the COSMO model: Description and sensitivities, Mon. Weather Rev., 139, 3887–3905, https://doi.org/10.1175/MWR-D-10-05013.1, 2011. a
Bartelt, P. and Christen, M.: Snow Avalanche Dynamics with RAMMS::Extended, Technical manual, WSL Institute for Snow and Avalanche Research SLF, Davos, Switzerland, https://ramms.ch/wp-content/uploads/RAMMS_EXT_Manual.pdf (last access: 20 October 2026), 2025. a
Bartelt, P. and Lehning, M.: A physical SNOWPACK model for the Swiss avalanche warning: Part I: numerical model, Cold Reg. Sci. Technol., 35, 123–145, https://doi.org/10.1016/S0165-232X(02)00074-5, 2002. a, b
Bažant, Z. P., Zi, G., and McClung, D.: Size effect law and fracture mechanics of the triggering of dry snow slab avalanches, J. Geophys. Res.-Sol. Ea., 108, https://doi.org/10.1029/2002JB001884, 2003. a
Bründl, M., Etter, H.-J., Steiniger, M., Klingler, Ch., Rhyner, J., and Ammann, W. J.: IFKIS - a basis for managing avalanche risk in settlements and on roads in Switzerland, Nat. Hazards Earth Syst. Sci., 4, 257–262, https://doi.org/10.5194/nhess-4-257-2004, 2004. a
Bründl, M., Stoffel, L., and Steinkogler, W.: Risk-oriented vs. hazard-oriented decision-making for opening and closing of traffic routes, in: Proceedings of the International Snow Science Workshop, Innsbruck, Austria, https://arc.lib.montana.edu/snow-science/item/2522 (last access: 20 October 2026), 2018. a
Bühler, Y., von Rickenbach, D., Stoffel, A., Margreth, S., Stoffel, L., and Christen, M.: Automated snow avalanche release area delineation – validation of existing algorithms and proposition of a new object-based approach for large-scale hazard indication mapping, Nat. Hazards Earth Syst. Sci., 18, 3235–3251, https://doi.org/10.5194/nhess-18-3235-2018, 2018. a, b
Bühler, Y., Bebi, P., Christen, M., Margreth, S., Stoffel, L., Stoffel, A., Marty, C., Schmucki, G., Caviezel, A., Kühne, R., Wohlwend, S., and Bartelt, P.: Automated avalanche hazard indication mapping on a statewide scale, Nat. Hazards Earth Syst. Sci., 22, 1825–1843, https://doi.org/10.5194/nhess-22-1825-2022, 2022. a
Bührle, L. J., Marty, M., Eberhard, L. A., Stoffel, A., Hafner, E. D., and Bühler, Y.: Spatially continuous snow depth mapping by aeroplane photogrammetry for annual peak of winter from 2017 to 2021 in open areas, The Cryosphere, 17, 3383–3408, https://doi.org/10.5194/tc-17-3383-2023, 2023. a
Chabot, D. and Kaba, A.: Avalanche forecasting in the Central Asian countries of Afghanistan, Pakistan, and Tajikistan, in: Proceedings of the International Snow Science Workshop, Breckenridge, CO, USA, 480–483, https://arc.lib.montana.edu/snow-science/item/2310 (last access: 20 October 2026), 2016. a
Christen, M., Kowalski, J., and Bartelt, P.: RAMMS: Numerical simulation of dense snow avalanches in three-dimensional terrain, Cold Reg. Sci. Technol., 63, 1–14, https://doi.org/10.1016/j.coldregions.2010.04.005, 2010. a
Eckert, N., Corona, C., Giacona, F., Gaume, J., Mayer, S., van Herwijnen, A., Hagenmuller, P., and Stoffel, M.: Climate change impacts on snow avalanche activity and related risks, Nat. Rev. Earth Environ., 5, 369–389, https://doi.org/10.1038/s43017-024-00540-2, 2024. a
Farestveit, N., Aronsen, V., Dahle, H., Eckerstofer, M., Grøndalen, G. S., Haaland, S. S., Humstad, T., Jacobsen, R., Kristofers, J., Kvalvågnes, J., Lofthus, J. B., Orset, K. I., Solbakken, E., and Tveit, J.: Technology for handling natural hazards in the Norwegian Public Roads Administration, in: Proceedings of the International Snow Science Workshop, Tromsø, Norway, 912–914, https://arc.lib.montana.edu/snow-science/objects/ISSW2024_P7.6.pdf (last access: 20 October 2026), 2024. a
Feistl, T., Bebi, P., Christen, M., Margreth, S., Diefenbach, L., and Bartelt, P.: Forest damage and snow avalanche flow regime, Nat. Hazards Earth Syst. Sci., 15, 1275–1288, https://doi.org/10.5194/nhess-15-1275-2015, 2015. a
Fischer, J.-T., Kofler, A., Huber, A., Fellin, W., Mergili, M., and Oberguggenberger, M.: Bayesian Inference in Snow Avalanche Simulation with r.avaflow, Geosciences, 10, 191, https://doi.org/10.3390/geosciences10050191, 2020. a
Ganju, A. and Dimri, A. P.: Prevention and Mitigation of Avalanche Disasters in Western Himalayan Region, Nat. Hazards, 31, 357–371, https://doi.org/10.1023/B:NHAZ.0000023357.37850.aa, 2004. a
Gaume, J., Chambon, G., Eckert, N., and Naaim, M.: Relative influence of mechanical and meteorological factors on avalanche release depth distributions: An application to French Alps, Geophys. Res. Lett., 39, https://doi.org/10.1029/2012GL051917, 2012. a
Gaume, J., Schweizer, J., van Herwijnen, A., Chambon, G., Reuter, B., Eckert, N., and Naaim, M.: Evaluation of slope stability with respect to snowpack spatial variability, J. Geophys. Res.-Earth, 119, 1783–1799, https://doi.org/10.1002/2014JF003193, 2014. a
Glaus, J.: Brämabühl_Avalanche_Jan2019_Dataset, Zenodo [data set], https://doi.org/10.5281/zenodo.15796702, 2025. a
Glaus, J.: JuliaGlaus/PIM_ProbabilityIndicationMap_Pipeline: Probability_Indication_Map (Version v1.0.0), Zenodo [code], https://doi.org/10.5281/zenodo.21992505, 2026. a
Glaus, J., Wikstrom Jones, K., Bartelt, P., Christen, M., Stoffel, L., Gaume, J., and Bühler, Y.: Simulation of cold-powder snow avalanches considering daily snowpack and weather situations, Nat. Hazards Earth Syst. Sci., 25, 2399–2419, https://doi.org/10.5194/nhess-25-2399-2025, 2025. a, b, c
Helbig, N. and van Herwijnen, A.: Subgrid parameterization for snow depth over mountainous terrain from flat field snow depth, Water Resour. Res., 53, 1444–1456, https://doi.org/10.1002/2016WR019872, 2017. a
Helbig, N., van Herwijnen, A., Magnusson, J., and Jonas, T.: Fractional snow-covered area parameterization over complex topography, Hydrol. Earth Syst. Sci., 19, 1339–1351, https://doi.org/10.5194/hess-19-1339-2015, 2015. a, b
Issler, D.: APALI – Avalanche probability along linear infrastructure, Technical note 20200431–01-TN, Norwegian Geotechnical Institute (NGI), Oslo, Norway, https://nva.sikt.no/registration/01993e522616-44fbfdde-3ea4-429a-9f44-a23008aa53cb (last access: 20 October 2026), 2023. a
Issler, D., Jenkins, J. T., and McElwaine, J. N.: Comments on avalanche flow models based on the concept of random kinetic energy, J. Glaciol., 64, 148–164, https://doi.org/10.1017/jog.2017.62, 2018. a
Jamieson, B. and Johnston, C. D.: Evaluation of the shear frame test for weak snowpack layers, Ann. Glaciol., 32, 59–69, https://doi.org/10.3189/172756401781819472, 2001. a
Keiler, M., Sailer, R., Jörg, P., Weber, C., Fuchs, S., Zischg, A., and Sauermoser, S.: Avalanche risk assessment – a multi-temporal approach, results from Galtür, Austria, Nat. Hazards Earth Syst. Sci., 6, 637–651, https://doi.org/10.5194/nhess-6-637-2006, 2006. a
Keylock, C. J., McClung, D. M., and Magnússon, M. M.: Avalanche risk mapping by simulation, J. Glaciol., 45, 303–314, https://doi.org/10.3189/002214399793377103, 1999. a
Kleinn, J., Bühler, Y., Glaus, J., Aller, D., Berger, C., Rinderer, M., Hählen, N., Peter, A., and Singeisen, C.: A probability-based modelling approach beyond a few selected return periods for comprehensive and robust hazard and risk assessment, in: Proceedings of the International Snow Science Workshop, Tromsø, Norway, 841–847, https://arc.lib.montana.edu/snow-science/objects/ISSW2024_O7.7.pdf (last access: 20 October 2026), 2024. a
Kotlarski, S., Gobiet, A., Morin, S., Olefs, M., Rajczak, J., and Samacoïts, R.: 21st Century alpine climate change, Clim. Dynam., 60, 65–86, https://doi.org/10.1007/s00382-022-06303-3, 2023. a
Lehning, M. and Fierz, C.: Assessment of snow transport in avalanche terrain, Cold Reg. Sci. Technol., 51, 240–252, https://doi.org/10.1016/j.coldregions.2007.05.012, 2008. a
Lehning, M., Doorschot, J., and Bartelt, P.: A snowdrift index based on SNOWPACK model calculations, Ann. Glaciol., 31, 382–386, https://doi.org/10.3189/172756400781819770, 2000. a
Li, X., Sovilla, B., Jiang, C., and Gaume, J.: Three-dimensional and real-scale modeling of flow regimes in dense snow avalanches, Landslides, 18, https://doi.org/10.1007/s10346-021-01692-8, 2021. a
Ligneau, C., Sovilla, B., and Gaume, J.: Mobility of cohesive granular flows over erodible beds: insights from discrete element simulations, Granular Matter, 27, 66, https://doi.org/10.1007/s10035-025-01524-9, 2025. a
Mariani, A., Dellarole, L., Villa, G., Borsotti, J., and Monti, F.: A new operational approach for the daily assessment of potential avalanche danger, in: Proceedings of the International Snow Science Workshop, Tromsø, Norway, 116–123, https://arc.lib.montana.edu/snow-science/objects/ISSW2024_P1.8.pdf (last access: 20 October 2026), 2024. a
Mayer, S. and Techel, F.: Data set for prediction of natural dry-snow avalanche activity and avalanche size using physics-based snowpack simulations, enviDat repository, https://doi.org/10.16904/envidat.425, 2023. a
Mayer, S., Techel, F., Schweizer, J., and van Herwijnen, A.: Prediction of natural dry-snow avalanche activity using physics-based snowpack simulations, Nat. Hazards Earth Syst. Sci., 23, 3445–3465, https://doi.org/10.5194/nhess-23-3445-2023, 2023. a
McClung, D. and Schaerer, P. A.: The Avalanche Handbook, The Mountaineers Books, ISBN 978-0-89886-809-8, 2006. a
Meloche, F., Guillet, L., Gauthier, F., Langlois, A., and Gaume, J.: Influence of slab depth spatial variability on skier-triggering probability and avalanche size, Ann. Glaciol., 65, e13, https://doi.org/10.1017/aog.2024.3, 2024. a
Meloche, F., Bobillier, G., Guillet, L., Gauthier, F., Langlois, A., and Gaume, J.: Modeling Crack Arrest in Snow Slab Avalanches – Toward Estimating Avalanche Release Sizes, J. Geophys. Res.-Earth, 130, https://doi.org/10.1029/2025JF008470, 2025. a
Mergili, M., Fischer, J.-T., Krenn, J., and Pudasaini, S. P.: r.avaflow v1, an advanced open-source computational framework for the propagation and interaction of two-phase mass flows, Geosci. Model Dev., 10, 553–569, https://doi.org/10.5194/gmd-10-553-2017, 2017. a
Monti, F., Schweizer, J., and Fierz, C.: Hardness estimation and weak layer detection in simulated snow stratigraphy, Cold Reg. Sci. Technol., 103, 82–90, https://doi.org/10.1016/j.coldregions.2014.03.009, 2014. a
Nadim, F., Kjekstad, O., Peduzzi, P., Herold, C., and Jaedicke, C.: Global landslide and avalanche hotspots, Landslides, 3, 159–173, https://doi.org/10.1007/s10346-006-0036-1, 2006. a
Oberndorfer, S., Fischer, J.-T., and Fuchs, S.: Quantifying the influence of avalanche release volume on runout probability: A case study of a mountain road section, Cold Reg. Sci. Technol., 242, 104734, https://doi.org/10.1016/j.coldregions.2025.104734, 2026. a
Ortner, G., Michel, A., Kropf, C., Bründl, M., and Bresch, D.: Assessing the impacts of climate change on snow avalanche-induced risk in alpine regions, Nat. Hazards, 121, 10877–10904, https://doi.org/10.1007/s11069-025-07229-9, 2025. a
Pop, O. T., Răchită, I. G., and Bodocan, V.: Timing and spatial extent of snow avalanches inferred from tree rings in Şureanu Mountains (Southern Carpathians, Romania), Nat. Hazards, 121, 16297–16315, https://doi.org/10.1007/s11069-025-07426-6, 2025. a
Quéno, L., Mott, R., Morin, P., Cluzet, B., Mazzotti, G., and Jonas, T.: Snow redistribution in an intermediate-complexity snow hydrology modelling framework, The Cryosphere, 18, 3533–3557, https://doi.org/10.5194/tc-18-3533-2024, 2024. a
Rauter, M. and Kowalski, J.: OpenFOAM-avalanche 2312: depth-integrated models beyond dense-flow avalanches, Geosci. Model Dev., 17, 6545–6569, https://doi.org/10.5194/gmd-17-6545-2024, 2024. a, b
Rice, R., Decker, R., Jensen, N., Patterson, R., Singer, S., Sullivan, C., and Wells, L.: Avalanche hazard reduction for transportation corridors using real-time detection and alarms, Cold Reg. Sci. Technol., 34, 31–42, https://doi.org/10.1016/S0165-232X(01)00051-9, 2002. a
Rudolf-Miklau, F., Sauermoser, S., and Mears, A. I.: The Technical Avalanche Protection Handbook, Wilhelm Ernst & Sohn, Berlin, Germany, ISBN 978-3-433-03034-9, https://doi.org/10.1002/9783433603840, 2015. a
Ruttner, P., Voordendag, A., Hartmann, T., Glaus, J., Wieser, A., and Bühler, Y.: Monitoring snow depth variations in an avalanche release area using low-cost lidar and optical sensors, Nat. Hazards Earth Syst. Sci., 25, 1315–1330, https://doi.org/10.5194/nhess-25-1315-2025, 2025. a, b
Sampl, P.: SAMOS-AT – Beschreibung der Modelltheorie und Numerik, Tech. rep., AVL List GmbH, Graz, Austria, https://doi.org/10.5281/zenodo.8007680, 2007. a
Schaerer, P.: The Avalanche-Hazard Index, Ann. Glaciol., 13, 241–247, https://doi.org/10.3189/S0260305500007977, 1989. a
Sheng, J., Mind'je, R., Zhang, X., Wang, Y., Zhou, H., and Li, L.: Implementation of an early warning for snowfall-triggered avalanche to road safety in the Tianshan Mountains, Cold Reg. Sci. Technol., 204, 103675, https://doi.org/10.1016/j.coldregions.2022.103675, 2022. a
Sovilla, B., McElwaine, J. N., Schaer, M., and Vallet, J.: Variation of Deposition Depth with Slope Angle in Snow Avalanches: Measurements from Vallée de La Sionne, J. Geophys. Res.-Earth, 115, 2009JF001390, https://doi.org/10.1029/2009JF001390, 2010. a
Stoffel, L.: Can scenario-based avalanche dynamics calculations help in the decision-making process for road closures?, in: Proceedings of the International Snow Science Workshop, Innsbruck, Austria, https://arc.lib.montana.edu/snow-science/objects/ISSW2018_P08.14.pdf (last access: 20 October 2026), 2018. a
Turquet, A., Wuestefeld, A., Svendsen, G. K., Nyhammer, F., Nilsen, E., Persson, A., and Refsum, V.: Avalanche monitoring using distributed acoustic sensing: A case study in Holmbuktura, Norway, in: Proceedings of the International Snow Science Workshop, Tromsø, Norway, 1005–1012, https://arc.lib.montana.edu/snow-science/item.php?id=3260 (last access: 20 October 2026), 2024. a
Valero, C. V., Jones, K. W., Bühler, Y., and Bartelt, P.: Release temperature, snow-cover entrainment and the thermal flow regime of snow avalanches, J. Glaciol., 61, 173–184, https://doi.org/10.3189/2015JoG14J117, 2015. a
Vera Valero, C., Wever, N., Bühler, Y., Stoffel, L., Margreth, S., and Bartelt, P.: Modelling wet snow avalanche runout to assess road safety at a high-altitude mine in the central Andes, Nat. Hazards Earth Syst. Sci., 16, 2303–2323, https://doi.org/10.5194/nhess-16-2303-2016, 2016. a
Vicari, H. and Issler, D.: MoT-PSA: A Two-Layer Depth-Averaged Model for Simulation of Powder Snow Avalanches on 3-D Terrain, Ann. Glaciol., 65, e16, https://doi.org/10.1017/aog.2024.10, 2025. a
Walter, B., Huwald, H., Gehring, J., Bühler, Y., and Lehning, M.: Radar measurements of blowing snow off a mountain ridge, The Cryosphere, 14, 1779–1794, https://doi.org/10.5194/tc-14-1779-2020, 2020. a
Wilhelm, C.: Quantitative risk analysis for evaluation of avalanche protection projects, Norwegian Geotechnical Institute, ISBN 978-82-546-0184-6, https://hdl.handle.net/11250/3082640 (last access: 20 October 2026), 1998. a
Wirbel, A., Oesterle, F., Chambon, G., Faug, T., Gaume, J., Glaus, J., Hergarten, S., Issler, D., Ito, Y., Martini, M., Mergili, M., Rauter, M., Robl, J., Rosatti, G., Tsunematsu, K., Tollinger, C., Vicari, H., Zugliani, D., and Fischer, J.-T.: ISeeSnow v1.0 – a pilot study for snow avalanche model intercomparison of thickness-integrated shallow flow approaches and beyond, EGUsphere [preprint], https://doi.org/10.5194/egusphere-2025-6053, 2026. a
Zängl, G., Reinert, D., Rípodas, P., and Baldauf, M.: The ICON (ICOsahedral non-hydrostatic) modelling framework of DWD and MPI-M: Description of the non-hydrostatic dynamical core, Q. J. Roy. Meteor. Soc., 141, 563–579, https://doi.org/10.1002/qj.2378, 2015. a
Zhuang, Y., Piazza, N., Xing, A., Christen, M., Bebi, P., Bottero, A., Stoffel, L., Glaus, J., and Bartelt, P.: Tree blow-down by snow avalanche air-blasts: Dynamic magnification effects and turbulence, Geophys. Res. Lett., 50, e2023GL105334, https://doi.org/10.1029/2023GL105334, 2023. a
- Abstract
- Introduction
- Test Site and Data
- Method
- Results
- Discussion
- Conclusion
- Appendix A: Test Cases
- Appendix B: Error Function Mapping of the Stability Index
- Appendix C: Avalanche Outlines
- Code availability
- Data availability
- Author contributions
- Competing interests
- Disclaimer
- Acknowledgements
- Financial support
- Review statement
- References
- Supplement