
the Creative Commons Attribution 4.0 License.
the Creative Commons Attribution 4.0 License.
 | 25 Sep 2026
Variability of internal snow properties over Antarctic late summer sea ice on different spatial scales

Danu Caus
Paul Keil
Christopher Kadow
Stefanie Arndt
Snow on Antarctic sea ice strongly affects thermodynamic processes, sea ice mass balance, and microwave remote sensing, yet its spatial variability and characteristic length scales remain poorly quantified. The aim of this study is to provide a spatially extensive, layer-resolved characterization of Antarctic late-summer snow on sea ice and, for the first time, to quantify the variability of snow properties and their horizontal correlation length scales on first-year (FYI) and multi-year ice (MYI). We use a unique combination of manual snow pit observations and more than 900 SnowMicroPen (SMP) profiles collected along meter-scale transects during three expeditions in the Weddell Sea between 2018 and 2021. Snow stratigraphy and microstructural classes were derived from SMP force data using a supervised one-dimensional convolutional neural network trained on manually classified SMP profiles. Across both sea-ice regimes, intrinsic properties of individual snow types, including density and specific surface area, were broadly similar. Differences between FYI and MYI instead arise from contrasting snowpack structure, snow type fractions, and spatial coherence, with MYI characterized by a higher prevalence of dense melt-freeze layers and enhanced vertical heterogeneity. Spatial autocorrelation analyses reveal pronounced scale-dependent variability, with snow properties on FYI decorrelating over short distances, while MYI exhibits substantially higher spatial coherence. Individual ice floes capture only about 50 % of the snow density variability characteristic of their respective ice regime, underscoring fundamental limits to the representativeness of point measurements. A hierarchy of variability emerges, in which snow type fractions and layer thickness dominate snowpack heterogeneity, while bulk snow density is comparatively homogeneous across spatial scales. These results demonstrate that Antarctic summer snow variability is governed primarily by stratigraphic composition and ice-regime-dependent snowpack evolution rather than bulk-integrated properties. These findings emphasize the need for spatially distributed observations and stratigraphy-aware parameterizations to improve the representation of snow on Antarctic sea ice in remote-sensing applications and sea ice and climate models. In particular, the relative consistency of specific surface area within snow types across ice regimes provides observational constraints that can be evaluated for future microwave-emission and radiative-transfer modeling studies.
- Article
(1783 KB) - Full-text XML
- BibTeX
- EndNote


Snow on sea ice fundamentally alters the thermodynamic and physical properties of the sea ice cover and governs exchange processes across the atmosphere-ice-ocean interfaces. In the Antarctic, where sea ice remains snow-covered year-round in most regions (Massom et al., 2001), snow plays an even more critical role: it promotes negative ice freeboard, which can lead to surface flooding and thereby facilitate the formation of snow-ice through refreezing of seawater-soaked snow layers (Tian et al., 2020). In addition, during summer, percolating internal snow meltwater can refreeze within the snowpack to form superimposed ice layers with dense melt-freeze clusters, modifying the snow-ice interface (Haas et al., 2001). Both seasonal snow transition processes, snow-ice formation and superimposed ice formation, are reflected in the meteoric ice fraction. In addition, seasonality is expressed in pronounced variations in density, thermal conductivity, water content, microstructure, and stratification, within the snowpack. Overall, the snowpack on sea ice is a complex and highly variable medium with important implications for the sea ice energy and mass budgets (Nicolaus et al., 2009).
However, the knowledge on these snowpack characteristics is largely limited to in-situ observations and mainly based on snow pits (Arndt and Paul, 2018; Toyota et al., 2011; Arndt, 2022a). Traditional snow pits are performed manually by digging a hole into the snow to expose the vertical snow structure. They provide comprehensive stratigraphic and microstructural information but are time-consuming, restricted to individual locations and observer-dependent (López-Moreno et al., 2020). Multiple snow pits can extend horizontal coverage, but are labor-intensive and rarely performed over larger spatial scales (Arndt and Paul, 2018), even though snow characteristics are highly variable on very small scales (Komarov et al., 2018; Arndt, 2022a). As a result, observational data on Antarctic snow is sparse and snow on Antarctic sea ice remains poorly characterized beyond local scales. An understanding of large-scale variability is missing, despite the importance of snow for Antarctic sea ice processes.
In remote sensing applications, the limited knowledge of snow properties and particularly its microstructure poses major challenges. Variations in density, grain size, layering, and the presence of refrozen internal melt layers as well as meteoric ice layers at the snow-ice interface strongly influence microwave emission and scattering processes (Royer et al., 2017). These effects introduce substantial uncertainties into microwave emission models and, consequently, into parameters derived from space-borne microwave observations, such as sea ice concentration and ice type (Durand et al., 2011; Tonboe et al., 2022). Radar altimetry, in particular, remains limited by the complex snow-ice interface, as scattering of commonly used Ku-Band radars frequently occurs within the snowpack rather than at the true snow-ice boundary, leading to substantial uncertainties of radar sea ice thickness estimates (Price et al., 2019). Uncertainties in remote sensing products of snow and sea ice, in turn, limit our ability to validate large scale sea ice and climate models (Bocquet et al., 2024; Lavergne et al., 2019).
Another major limitation is that most snow knowledge is derived from point-scale observations (meters) while models and satellite retrievals require information representative of much larger spatial scales (kilometers to basin-scale) (Sandven et al., 2023). Capturing the spatial variability of layer-resolved snow density and microstructure is thus fundamental for improving snow process understanding and advancing both modeling and remote sensing of Antarctic sea ice, bridging the gap between local-scale snow processes and large-scale system representation. Yet, comparable layer-resolved and snow type-specific datasets remain sparse in the Antarctic, both temporally and spatially, with few observations resolving microstructural layering, density gradients, or specific surface area (SSA).
To address the outlined issues, Arndt and Paul (2018) investigate the variability of winter snow properties on Antarctic sea ice based on traditional snow pits, revealing pronounced small‐scale heterogeneity. However, their analysis is confined to winter conditions and length scale correlations limited to local‐scale observations (up to 10 m). Arndt (2022a) further extends this work by examining bulk density distributions of summer snow using SnowMicroPenetrometer (SMP) profiles. The SMP offers an efficient approach to rapidly characterize snow structural properties, including density and SSA, through mechanical resistance profiles in sub-millimeter-scale vertical resolution and independent of the observer, and therefore, yields a substantially larger number of vertical profiles, offering a higher spatial coverage. Arndt (2022a) highlights regional differences in snow density but does not resolve snow stratigraphy or microstructural types, nor assess the spatial scales of variability. Beyond these studies, few datasets exist that combine detailed vertical snow structure with spatial context in the Antarctic. While these studies highlight differences between first-year ice (FYI) and multiyear ice (MYI) snowpacks, a systematic assessment of how internal snowpack microstructure varies between ice types as a result of contrasting surface morphology and accumulation–melt histories has not yet been conducted for Antarctic snow.
In contrast, studies from the Arctic demonstrate the potential of SMP measurements to bridge the gap between point-scale observations and spatially representative snow characterization. Using SMP profiles conducted along transect lines, King et al. (2020) quantify local‐scale heterogeneities and correlation length scales of snow characteristics, including snow type fractions of the vertical snow column. Macfarlane et al. (2023) emphasize that detailed knowledge of snow microstructure can improve the parameterization of thermal conductivity in models and that SMP‐based snow type classification offers a promising step toward this goal. However, snow microstructural properties such as grain or snow types are not directly measured by the SMP and must be inferred from characteristic features of the penetration signal. At the same time, manual interpretation and classification of snow layers from SMP penetration signals is highly time-consuming and not feasible for large datasets. Automated classification methods therefore provide a practical alternative.
To address this challenge, recent studies have demonstrated the capability of machine-learning approaches to automatically segment and classify snow types from SMP profiles (King et al., 2020; Kaltenborn et al., 2023). While these approaches significantly reduce the effort associated with manual signal classification and interpretation, Kaltenborn et al. (2023) show that classification performance and training effort depend strongly on the chosen algorithm. They show that artificial neural networks (ANN), especially Encoder-Decoder and Long-Short-Term-Memory (LSTM) models, achieve the best classification results, while also requiring the most algorithm training and parameter tuning effort. Among the ANNs, One-Dimensional Convolutional Neural Networks (1D-CNN), which are a modified Encoder-Decoder architecture, have been shown to efficiently classify one-dimensional sequential data with a rather simple network infrastructure, and to be stable with limited amounts of data (Kiranyaz et al., 2021). 1D-CNNs have therefore been used increasingly in the past years and shown to successfully segment and classify one-dimensional continuous signals such as seismic data series (Ross et al., 2018; Nakano and Sugiyama, 2022). Compared to the LSTM, which only considers data points from layers above a certain snow layer (i.e., past time steps), the convolutional kernel also incorporates data from lower snow layers for a prediction. While Kaltenborn et al. (2023) also provide an openly available algorithm and trained models, these were developed for Arctic snow conditions, and do not generalize well to Antarctic conditions/snow types.
Consequently, despite clear advances in automated snow characterization from SMP measurements, Antarctic sea ice still lacks spatially extensive, layer-resolved observations of snow structure and snow type variability. Bridging this gap requires adapting recent Arctic machine-learning approaches to Antarctic-specific snow conditions.
To address these observational and methodological gaps, the study presented here builds on recent Arctic advances in machine-learning-based SMP classification and adapts them to Antarctic sea ice using a unique, spatially extensive summer dataset. We provide a quantitative assessment of Antarctic summer snowpack properties on both FYI and MYI using a combination of snow pit observations and high-resolution SMP measurements. A supervised 1D-CNN classifier trained on snowpit-derived snow types is applied to more than 900 SMP profiles spanning transects of up to 60 m. This framework enables classification of snow structural layers and evaluation of key physical properties such as density and specific surface area by snow type. Through spatial autocorrelation analyses, we derive characteristic length scales of variability and assess differences in snow structure and variability between FYI and MYI. The results provide a process-based understanding of Antarctic snow organization across scales and establish an observational foundation for improving model parameterizations and the interpretation of remote-sensing data over snow-covered sea ice.
2.1 Sampled ice stations
The field measurements presented in this study were collected during three expeditions of the German research icebreaker RV Polarstern to the Weddell Sea in late austral summer, from January to March. In total, 28 ice stations were sampled (Fig. 1), including 9 ice stations conducted during expedition PS118 in the northwestern Weddell Sea in 2019 (Arndt et al., 2021), and 19 ice stations carried out in the southeastern Weddell Sea during expedition PS111 in 2018 (Arndt et al., 2018), and PS124 in 2021 (Haas et al., 2021).
By sampling different regions, contrasting sea ice regimes were investigated, encompassing a total of 19 first-year and 9 multi-year ice floes, with sampling sites selected based on accessibility and representativeness of the respective ice floe. At all ice stations, a comprehensive sea ice physics and biological program was carried out, comprising measurements of sea ice thickness and snow depth distributions across individual ice floes, extensive ice coring for subsequent analyses of internal sea ice structure and biogeochemical composition, vertical snow characterization, and, at selected stations, the deployment of autonomous ice-tethered platforms (Arndt et al., 2018, 2021; Haas et al., 2021). The presented study uses the snow pit, SnowMicroPen (SMP), snow depth and sea ice thickness observations (Table 1) described below.
The snow analysis program typically consisted of one to three manually characterized and sampled snow pits, which were co-located along the conducted SnowMicroPen (SMP) transect, for the respective connection of both measurement techniques.
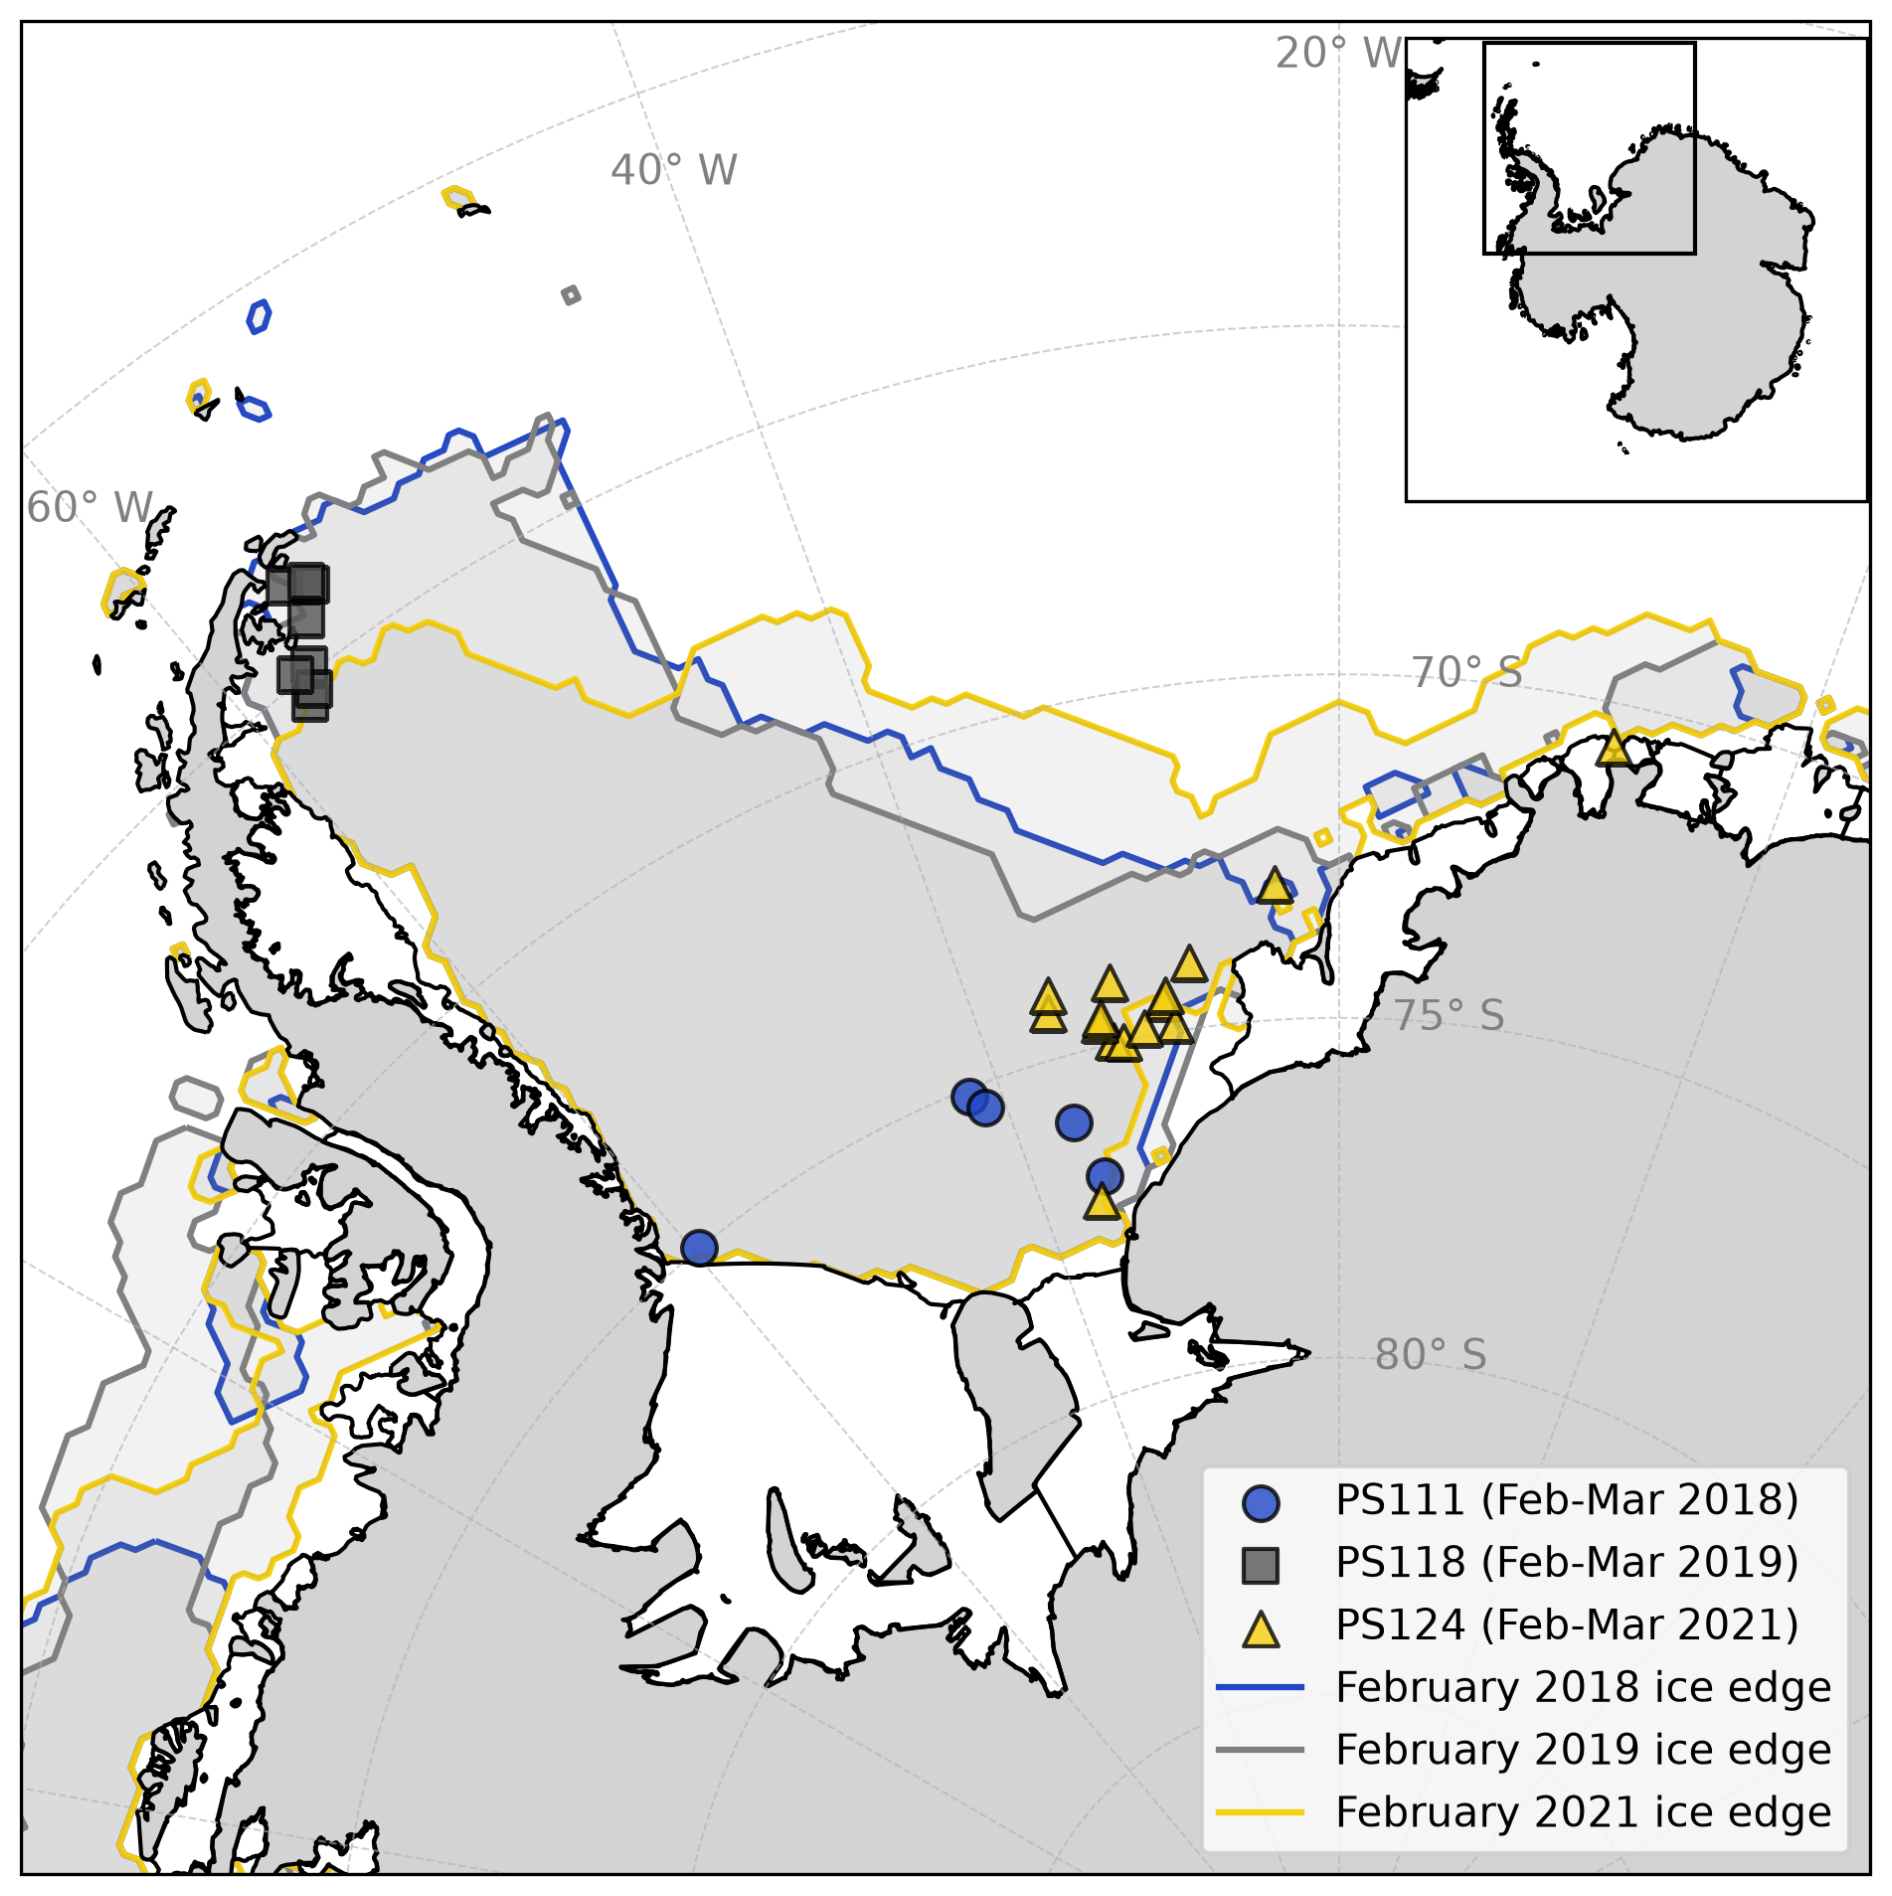
Figure 1Location of all sea ice stations presented in this study at which snow pit and SnowMicroPen (SMP) measurements were acquired and analysed. All stations were sampled in the late austral summer during the three RV Polarstern cruises PS111 in 2018 (blue circles), PS118 in 2019 (gray squares), and PS124 in 2021 (yellow triangles). The background sea ice extent for February 2018, 2019 and 2021 is based on EUMETSAT OSI SAF (2022, 2026), drawing the ice edge at a sea ice concentration threshold of less than 0.15.
Table 1Overview over the measurement sites and snow observations collected during the RV Polarstern expeditions PS111 (2018), PS118 (2019) and PS124 (2021) in the Weddell Sea, Antarctic. The number of samples ice floes is separated into First-Year-Ice (FYI) and Multi-Year-Ice (MYI). Mean snow depth and total sea ice thickness are given as mean ± standard deviation and are derived from MagnaProbe and GEM-2 measurements respectively, presented in Arndt et al. (2018, 2021); Haas et al. (2021). Also listed are the number of snow pit observations and SnowMicroPen (SMP) profiles collected during each campaign.

2.2 Snow pit measurements
During PS111, 12 snow pits were excavated at 5 different ice stations (Arndt, 2022c), during PS118, 18 snow pits were excavated on 9 floes (Arndt, 2021), while during PS124 an additional 20 snow pits were excavated on 14 floes (Arndt and Haas, 2022c). At each site, snow pits were excavated down to the snow-ice interface, while all measurements were conducted on the shaded, undisturbed working wall of the snow pit to minimize the influence of direct solar radiation and external disturbances.
All snow pit characterizations comprised a vertical analysis of internal stratigraphy as well as measurements of continuous snow temperature and density profiles. In addition, snow samples were collected for subsequent analyses of snow salinity and isotopic composition. Snow stratigraphy was recorded through visual inspection, assessment of finger hardness, and marking of layer boundaries, with a vertical resolution of approximately 0.5 cm. For each identified layer, snow grain characteristics were determined using an 8× magnifying glass and a millimeter-scale grid card, enabling classification of the dominant grain type and size.
Based on the identified stratigraphy and grain characteristics, each snow layer was classified following Fierz et al. (2009), with categories including typical snow grain shapes such as rounded (RC), faceted crystals (FC), depth hoar (DH), melt-freeze forms (MF), ice formations (IF), surface hoar (SH), new snow (NS), slush, and combinations thereof. Layers were further characterized according to Sommerfeld and LaChapelle (1970) using metamorphic classification stages ranging from 1-A (new precipitated particles) to IV-B (melt-freeze and pressure metamorphosed snow), providing insights into the dominant metamorphic processes within the snowpack. The hardness of each layer was determined manually from the snow pit wall by testing the penetration resistance using standard hand tests (fist, four fingers, one finger, pencil, and knife), following Fierz et al. (2009). All snow pits and layer classifications were done by the same observer, ensuring maximum comparability of the snow classification across the dataset.
Snow density was measured continuously from the air-snow interface downward toward the snow-ice interface, using a density cutter with a fixed volume of 100 mL and a height of 3 cm. Extracted snow samples were weighed using a spring scale. Density measurements were considered valid only when the cutter was properly filled. In some cases, hard ice layers near the snow-ice interface prevented density profiles from extending to the base of the snowpack.
2.3 SnowMicroPen (SMP) measurements
While manual snow pit measurements, in particular the retrieval of snow density and specific surface area (SSA), are time-consuming and provide only limited vertical resolution, additional measurements were conducted using the SnowMicroPen (SMP; generation 4; developed by Schneebeli and Johnson, 1998), a high-resolution penetrometer for resolving snow mechanical properties.
The SMP records penetration resistance as a function of depth by vertically driving a sensor tip into the snowpack at a constant speed of 20 mm s−1. It provides a vertical sampling resolution of approximately 4 µm, corresponding to about 250 force measurements per millimeter. The instrument has a force resolution of 0.01 N and a maximum force threshold of 41 N, beyond which measurements are automatically terminated, which occurred primarily on multi-year ice floes characterized by extensive basal melt-freeze layers. In addition, the total snow depth at every sampling point was measured using a standard snow depth probe.
To assess spatial variability, SMP profiles were collected along transects ranging from 5 to 64 m in length, with horizontal spacing between individual profiles of 0.5 to 2 m. For correlation length analysis, only transects with 10 profiles or more were considered. Out of those 26 longer transects, of which 17 transects were on FYI and 9 on MYI, 10 transects were between 60 and 64 m long, 10 transects between 36 and 50 m and 6 transects were 19–31 m long. Transects lengths were on average 49 m on FYI and 40 m on MYI. A total of 304 SMP profiles were acquired in the northwestern Weddell Sea (Arndt and Haas, 2022a) and 617 in the southeastern Weddell Sea (Arndt, 2022b; Arndt and Haas, 2022b). Co-located SMP measurements were conducted at 50 snow pit sites, where SMP profiles were acquired in close proximity to the snow pits, allowing a direct comparison between SMP-derived measurements and manually determined snow stratigraphy and density.
2.4 Processing of SMP force data
The retrieved SMP profiles represent the bonding strength between snow grains (Proksch et al., 2015; Calonne et al., 2020). With appropriate assumptions and calibration, penetration resistance data can be converted to snow density and SSA, following the approach of Calonne et al. (2020). This parametrization was selected because it yields density profiles consistent with the co-located snowpit density and stratigraphy observations, and provides both density and SSA, which are required for this study. Also, snow pit temperatures within our dataset ranged from 0 to −7 °C, with a mean of −3.3 °C and a mode of −1.7 °C, and therefore still fall within the temperature range relevant to the Calonne et al. (2020) parameterization. Although Arctic sea-ice specific SMP density coefficients have been proposed by King et al. (2020), no corresponding SSA retrieval is available. All SMP data processing was performed using the Python package snowmicropyn.
The bulk snow density of each profile was calculated as the weighted mean of the SMP-derived density values over the full snow depth. To quantify the variability of the analysed parameters, the relative standard deviation (RSD) was calculated as the ratio between the standard deviation (SD) and the mean value of each parameter.
For snow-type specific density and SSA, values were averaged over each contiguous classified snow layer. Probability density distributions, and statistical comparisons of snow-type density and SSA were calculated from the resulting layer-mean values. To test for differences in the mean values of the analysed parameters between FYI and MYI, Welch’s t-test was applied, which does not assume equal variances, with a significance threshold of p< 0.05.
2.5 Correlation length analysis
To investigate structural similarities in the snowpack at larger spatial scales and assess differences between the ice types, these characteristic length scales were quantified. The spatial autocorrelation of snow type composition was computed using Moran's I (Moran, 1950). Moran's I is computed as
where wij(h)=1 if falls within the distance bin h, and wij(h)=0 otherwise. Here, corresponds to the number of profile pairs within the bin. The variable x denotes the fractional contribution of a given snow type at locations i and j, separated by distance d. The equation was evaluated for all profile pairs separated by distance d, in increments of 1 m, and independently for each snow type. Distances between the profile pairs were calculated from the location of SMP profiles along transect lines measured with a tape measure. Because the number of transects and profile pairs decrease strongly for larger lag distances, we restrict the physical interpretation to lag distances of approx. 35 m. Values at greater distances are not interpreted as robust spatial signals.
To quantify the stratigraphic variability of the Antarctic snowpack, SMP profiles were segmented and classified by snow layer type using a combination of manual labeling and an automated One-Dimensional Convolutional Neural Network (1D-CNN) deep learning algorithm. Of the total 921 SMP profiles collected in this study, 155 were manually evaluated and labeled to provide the reference dataset. The remaining profiles were classified using the 1D-CNN, after training and fine-tuning the model to the specific characteristics of the Antarctic snowpack.
3.1 Manual classification and data pre-processing
Manual classification of the SMP profiles was based on characteristic features of the raw penetration force signal, including signal magnitude, frequency, gradient, and the overall signal shape. In an initial step, all SMP profiles co-located with the 50 snow pit sites were analysed to identify characteristic signal patterns associated with snow types determined from the corresponding snow pit observations, as suggested by Kaltenborn et al. (2023). In a second step, the resulting classification scheme was applied manually to a subset of SMP profiles. Here, a total of 155 profiles were segmented and classified, which were randomly selected from each campaign in proportion to the total number of profiles acquired per expedition (PS111: 37 of 202 profiles; PS118: 49 of 304 profiles, PS124: 69 of 415 profiles), ensuring a balanced representation across campaigns and regions. A final consistency check was then performed to ensure internal coherence of layer segmentation and snow type assignment.
The manually labeled dataset served as the training input for the automated classification algorithm. Pre-processing of the SMP profiles followed the approach of Kaltenborn et al. (2023) and their snowdragon framework. This included the detection of the snow surface and snow-ice interface using the snowmicropyn package, the replacement of negative force values with zeros, and the aggregation of the force signal into 1 mm depth bins. For each bin, the mean, variance, minimum, and maximum force were calculated, along with the same metrics calculated over a larger 4 mm rolling window. Additional derived features included distance from the snow surface and the first and second derivatives of the force signal. Furthermore, the parameters deflection at rupture in mm (δ), mean rupture force (f0), Element size (L), intensity of point process (λ), as well as the median force (Fm), calculated within a 4 mm context window, were derived using the Poisson shot noise model of Löwe and Van Herwijnen (2012). These are the same parameters used to derive density and SSA from the raw force signal. All 18 features were normalized prior to training using feature-wise Z-score normalization with the pre-computed training set statistics.
3.2 Automated learning and classification
To train the 1D-CNN only the most common snow layer classes were used: wind slab, rounded and faceted snow, depth hoar and melt-freeze forms. Despite their different snow evolution processes, rounded and faceted snow layers were combined into one single class, as the SMP penetration signal was very similar for both cases and was hard to distinguish during manual labeling. Any ambiguity in the labels then translates to an ambiguous algorithm.
Rare or weakly expressed layers, such as surface hoar or new snow were excluded. To address the imbalance between snow class occurrence, class weights inversely proportional to their frequency of occurrence were applied in the calculation of the Cross-Entropy loss function. Without weighting, the more frequent snow classes like rounded and faceted would contribute more strongly to the loss function, so that the model could achieve good overall performance while performing poorly on the less frequent classes.
The pre-computed features derived per 1 mm bin from the original SMP signal during the pre-processing were used as input features for training, while the manually identified snow type, i.e. the snow class label integer, served as a training target. We therefore set up the experiments as a supervised learning, multiclass problem, and used the weighted Cross-Entropy Loss function accounting for class imbalance to guide the optimization process. By separating each profile into 1 mm bins, a total of 7 713 408 training input data points were created, although this represents correlated bins within a limited number of 155 independent profiles.
Structurally, the network consists of four convolutional layers. Three of these are used to extract relevant feature channels along the snow profile, while the final (fourth) layer serves as a classification layer that projects the learned features into the corresponding snow classes. The rectified linear unit (ReLU) was used as the nonlinear operator. A kernel size of 5 was employed in the first layer to slide along the SMP profile’s depth axis and capture local correlations. The subsequent layers, using the same kernel size, were intended to capture information at a gradually more global scale, while still operating within the limits of a single SMP profile, since we do not concatenate SMPs together. The final classification layer is a 1 × 1 convolution, which operates exclusively across the extracted feature channels, as opposed to the SMP's depth axis. The output consisted of the four selected classes wind slab, rounded/faceted, depth hoar, and melt-freeze forms.
Each full SMP profile was treated as an independent sample and fed to the 1D-CNN. To evaluate the performance of the classifier during and after training, the manually labeled SMP profiles were divided into separate training, validation, and test subsets. A split of 80 % for training, 10 % for validation, and 10 % for testing was applied. The division was performed randomly at the profile ID level to preserve the internal coherence of each SMP measurement. This ensured that the full vertical structure of each profile remained intact, providing the necessary depth context for layer classification while preventing segments of the same profile from being distributed across different subsets. Uniform random splitting ensured that profiles from all three expeditions (PS111, PS118, PS124) were represented proportionally in each subset, preventing biases toward specific regional conditions. During training, model performance was evaluated using class-weighted accuracy, precision, recall, and F1-scores, as well as confusion matrices for the validation set.
After hyperparameter tuning and performance evaluation based on the initial 80 % 10 % 10 % split, the best-performing model checkpoint was further fine-tuned using an 80 % training and a 20 % validation split, where the former validation and test subsets were combined into a new larger validation set. This consolidated final model was subsequently applied to the remaining 766 unseen and unlabeled SMP profiles to infer the snow type at each 1 mm depth bin.
3.3 Verification and uncertainties of an automated classification
As the majority of the 921 SMP profiles were classified automatically, we evaluate whether the CNN predictions are sufficiently accurate and internally consistent to replace manual labeling for the remaining profiles. The objective is not to identify an optimal or universally transferable classification method, but to assess whether the automated classification is sufficiently reliable for the purposes of this study.
Classification performance was evaluated on independent validation and test subsets using class-weighted accuracy, precision, recall, F1-scores, and confusion matrices at the 1 mm bin level. The validation subset was used for hyperparameter tuning, while the labeled test subset remained completely unseen and served as an independent performance assessment. While the large number of bins provides robust statistics, bins are vertically correlated within 155 independent SMP profiles. Because rare or weakly expressed snow types, such as new snow, surface hoar, or thin ice lenses, were excluded from model training due to insufficient sample sizes, their occurrence in the full dataset may be locally misclassified as the most similar major snow type.
Table 2Normalized confusion matrix (per true label) for the classification of snow structure types for the validation and test datasets. Rows represent the manually assigned (true) classes and columns the classes predicted by the algorithm. Each cell contains the normalized fraction of samples for the respective true class (row-normalized). Values are shown as validation results (upper-right) and test results (lower-left). Diagonal elements indicate correct classifications, while off-diagonal elements represent misclassifications
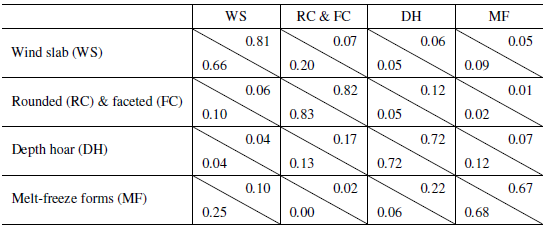
Table 2 shows the normalized confusion matrix for the validation and test datasets.
Wind-slab and rounded and faceted snow reach the highest true-positive rates during validation, with more than 80 % of samples correctly classified, while depth hoar and melt-freeze forms show slightly lower true-positive rates of around 70 %. During testing rounded and faceted, depth hoar and melt-freeze forms, achieved true-positive rates comparable to those observed during validation, indicating stable generalization performance.
When misclassified, Wind-slab samples are primarily misclassified as rounded and faceted snow (7 % and 20 % of the cases), indicating a tendency for false-positive Wind-slab predictions to originate from this class. depth hoar samples are most frequently confused with rounded and faceted snow (17 % and 13 % of the cases) and, to a lesser extent, with melt-freeze forms (7 % and 12 % of the cases), which can be attributed to overlap with neighboring metamorphic stages. melt-freeze forms show the most diverse misclassification behavior, with false positives arising mainly from Wind-slab (10 % and 25 % of the cases) and depth hoar samples (22 % and 6 % of the cases). In contrast, rounded and faceted snow receives relatively few false positives overall.
Most misclassifications therefore occur between snow types with similar microstructural characteristics or gradual metamorphic transitions, such as rounded and faceted snow and depth hoar, while misclassifications between structurally distinct snow types (e.g., rounded and faceted snow and melt-freeze forms) are comparatively rare. This indicates that classifier errors are largely confined to closely related snow classes.
Visual inspection of classified SMP profiles (Fig. 2) shows that most disagreements between manual and automated classification are concentrated at the boundaries between layers. These zones are characterized by vertical gradients in grain morphology and bonding strength, producing mixed penetration signal patterns. Such effects reflect both the non-discrete nature of snow stratigraphy. Consequently, uncertainties mainly affect the exact placement of layer interfaces, while the overall stratigraphic structure and dominant snow type organization are reproduced consistently. The occasional detection of thin layers not explicitly identified during manual labeling is physically plausible and reflects fine-scale variations in the penetration signal rather than systematic classification errors, and therefore has only a minor influence on the interpretation of layer-scale structural organization.
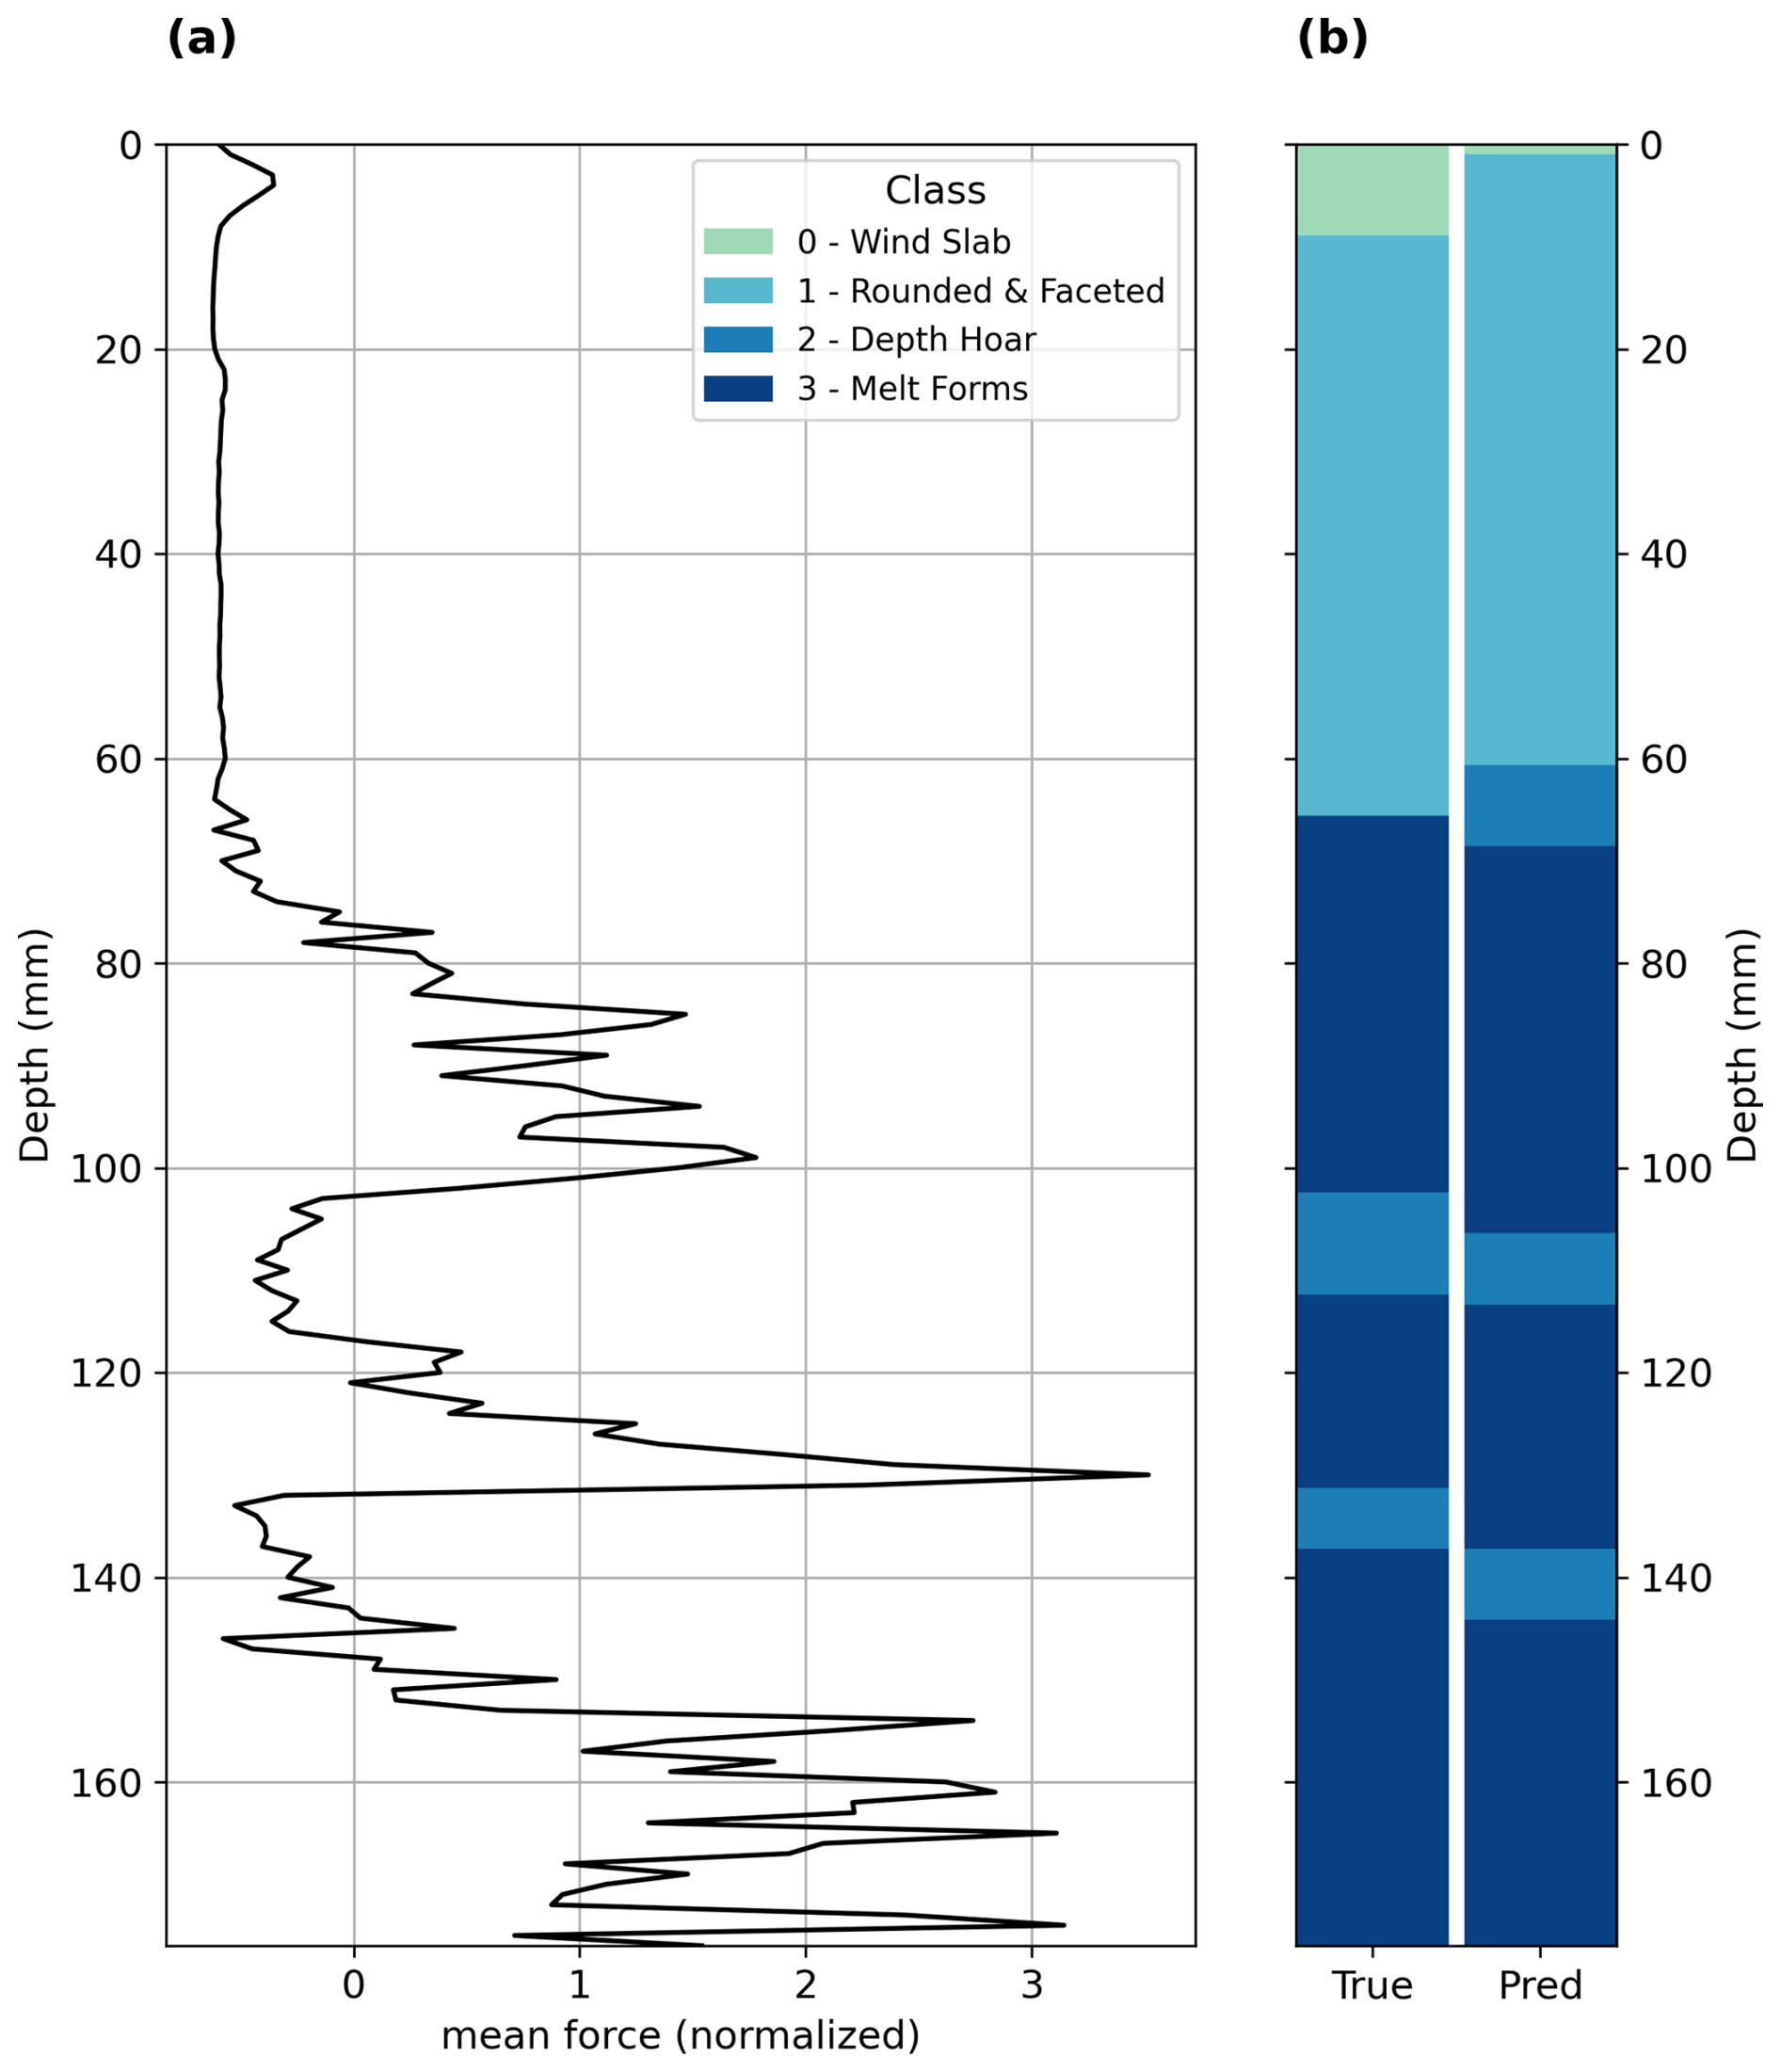
Figure 2Example SnowMicroPen (SMP) profile and corresponding snow type classification. The panels show (a) the mean penetration force averaged over 1 mm depth bins as a function of depth; (b) compares the manually assigned snow type classification (“True”) with the algorithm-predicted classification (“Pred”). Colors indicate the four snow classes used in the model: wind slab, rounded/faceted grains, depth hoar, and melt-freeze forms.
Uncertainty is also inherent in the manually assigned reference labels, particularly in transitional layers where expert interpretation of SMP signal characteristics is ambiguous. All manual labeling in this study was performed by a single operator, which minimizes inter-operator variability but does not eliminate subjectivity. Manual labeling by a single experienced operator provided a consistent interpretation across all profiles and avoided additional inter-operator variability. The remaining labeling uncertainty is closely linked to inherent ambiguity in the SMP signal and is expected to be greatest around transitions and where different snow classes produce similar responses. Since operator-dependent uncertainty arises primarily in these ambiguous intervals, the two sources cannot be considered fully independently. Repeated annotations by independent operators were not available, so their relative contributions could not be quantified, but such an inter-operator comparison would provide a useful direction for future work. Also, while manual stratigraphic analysis may distinguish multiple adjacent layers of the same snow type based on subtle variations in hardness or grain morphology, the automated classification tends to aggregate such clusters into single contiguous units. As a result, some fine-scale stratigraphic detail is smoothed in the automated profiles, and the reported model performance should be interpreted in the context of this intrinsic reference uncertainty.

Figure 3Probability density distribution of snow density for different snow classes derived from SMP profiles. Panels correspond to (a) wind slab, (b) rounded and faceted grains, (c) depth hoar, and (d) melt-freeze forms. For each class, the distributions are shown separately for manually classified samples used in model training (black) and samples not used during training that were automatically classified by the algorithm (grey). Numbers in the legends indicate the number of samples (n) in each subset. The similar distributions between training and non-training data suggest that the training dataset is representative of the overall data distribution.
Despite these limitations, the shape and mean values of snow density distributions by snow type are similar for manually and automatically labeled profiles (Fig. 3), indicating that the automated classification preserves the key physical characteristics relevant for subsequent analyses. Uncertainties are primarily concentrated in thin transitional layers and between physically similar snow classes, rather than in major structural units. Rare snow types excluded from training contribute only marginally to the overall snowpack structure and bulk physical properties and therefore do not materially affect the aggregated results.
Overall, the model performance is comparable to that reported by Kaltenborn et al. (2023) for Arctic datasets, with similar limitations related to transitional layers and class overlap. The consistency between predicted and manually assigned snow types demonstrates that the 1D-CNN captures the key characteristics of Antarctic snow stratigraphy and provides a reliable basis for extending snow type information to the full SMP dataset. The consequences of remaining misclassifications are discussed in Sect. 5.3.
Once the SMP profiles are classified by snow layer type, they provide an estimate of the snowpack composition, and thus facilitate layer density comparison as well as spatial analysis of conducted SMP transects.
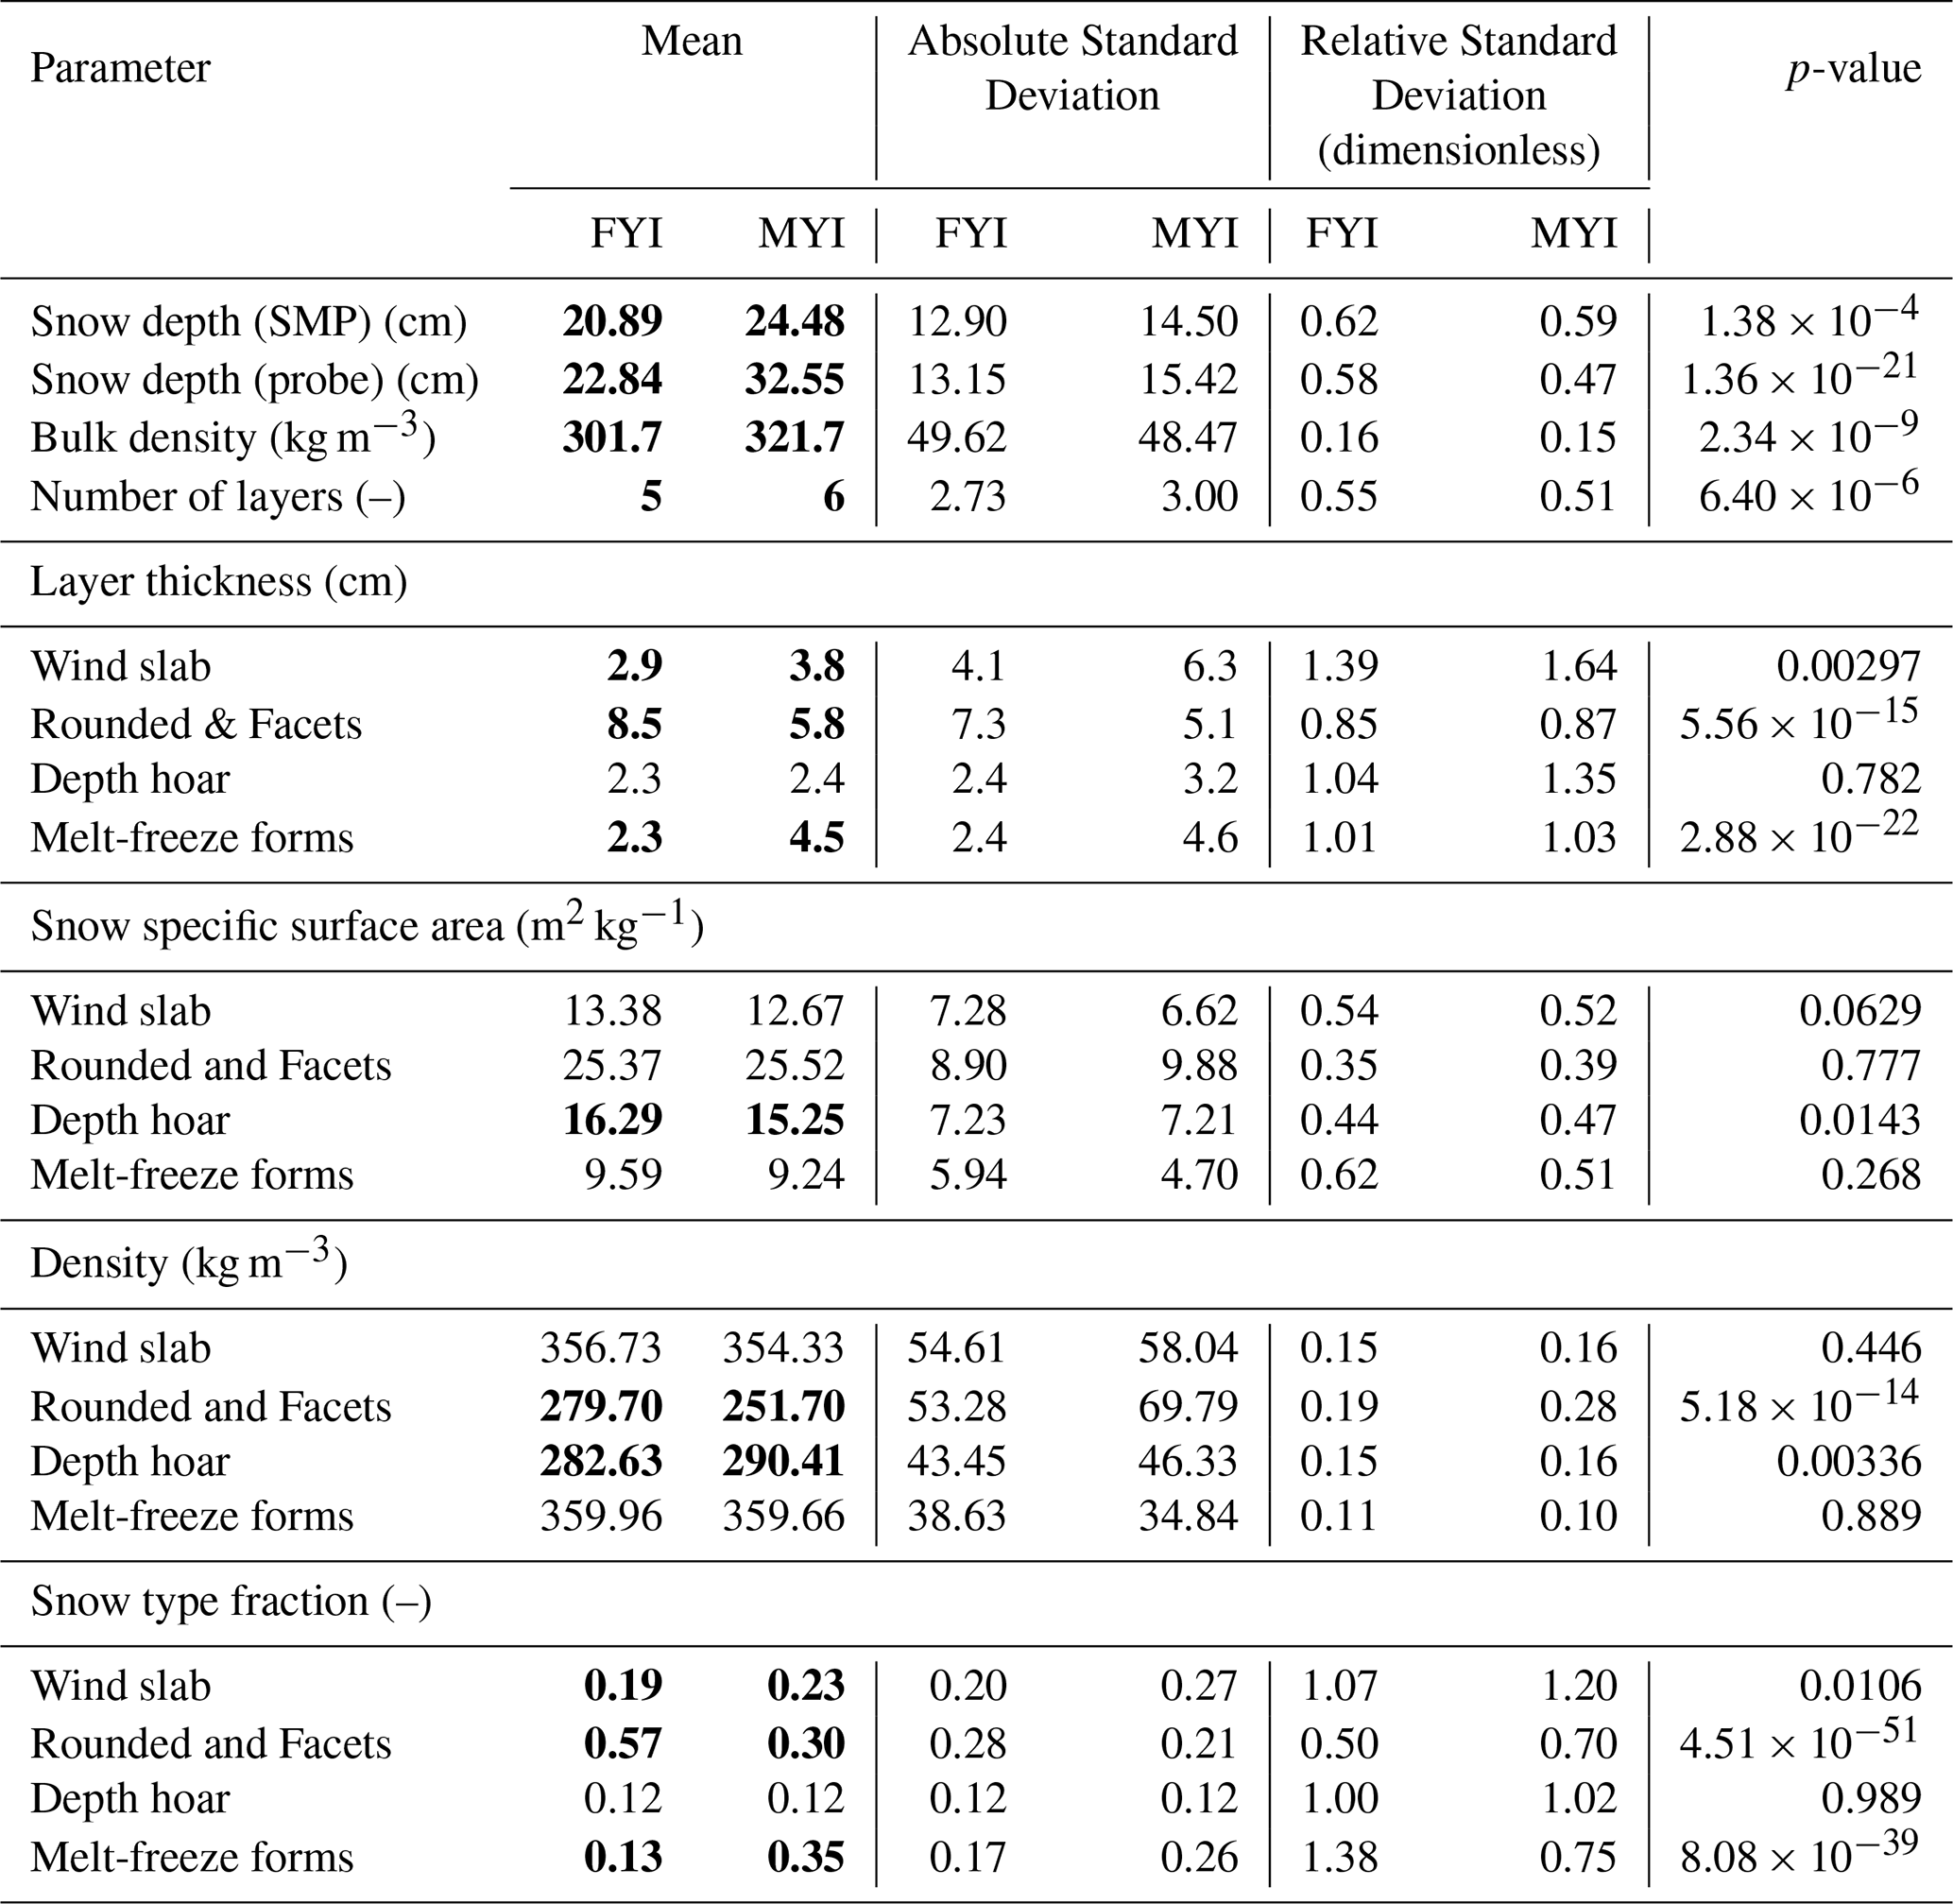
The results presented here are based on the full set of processed SMP data, including both manually labeled and automatically classified profiles, as described above, excluding the snow pit data. Although sampling took place during the austral summer, observed snowpack temperatures ranged from −7 to 0 °C with a mean temperature of −3.3 °C throughout all campaigns, indicating that the snowpack was not undergoing active surface melt at the time of measurement. For the analysis, the dataset is separated into first-year ice (FYI) and multi-year ice (MYI) classes, enabling a systematic comparison of mean snow properties and their variability between ice regimes. Under this classification, expeditions PS111 and PS124 contribute primarily to the FYI dataset, while expedition PS118 contributes to the MYI dataset (see Table 1). For each ice regime, mean values of the analysed snow properties and the corresponding absolute and relative standard deviations, and the results of the statistical comparison are summarized in Table 3.
Table 3Mean values, absolute standard deviation (SD) and relative standard deviation (RSD) of the analyzed snow properties for First-year ice (FYI) and Multi-year ice (MYI). Statistics are derived from the full set of snow observations obtained from SMP profiles and supporting measurements. The SD quantifies the variability of a given snow property across different ice regimes (FYI and MYI), while the RSD (SD divided by the mean) allows comparison of variability across different snow properties within each ice class. Parameters listed under layer thickness, snow specific surface area (SSA), density, and snow type fraction are reported separately for the four snow classes: wind slab, rounded and faceted grains, depth hoar, and melt-freeze forms. Layer density and SSA are calculated as means per classified layer. Distribution mean values that differ significantly between FYI and MYI according to Welch's t-test (p< 0.05) are shown in bold.
4.1 Snow layering
Inspecting the entire layer-classified SMP dataset allows for the analysis not only of common properties, such as mean snow thickness, but also the number of individual snow layers, layer specific thickness depending on both the snow and sea ice type as well as layer specific snow specific surface area.
The mean snow thickness derived from the SMP measurements was significantly lower on FYI (20.89 ± 12.90 cm) than on MYI (24.48 ± 14.50 cm; p< 0.001). Manual probe measurements yield likewise significantly lower depths FYI (22.84 ± 13.15 cm) than MYI (32.55 ± 15.42 cm; p< 0.001), yet consistently higher than the SMP-derived snow thickness. The difference between SMP- and probe-derived snow thickness values originates from hard basal melt-freeze layers, which usually prevented full penetration of the SMP.
On average, five stratigraphic layers are identified on FYI and six on MYI, with the numbers of layers being significantly higher on MYI (p< 0.001). Across most profiles, a wind-packed layer of rounded crystals is typically present at the surface. Depth hoar occurs commonly at the base of the snowpack and between melt-freeze layers. On MYI, basal melt-freeze layers are more frequent and thicker than on FYI and are often interleaved with depth hoar layers, indicating a more complex stratigraphic organization.
Mean layer thicknesses vary by snow type and the respective ice regime. Wind slab layers exhibit mean thicknesses of 2.9 ± 4.1 cm on FYI and 3.8 ± 6.3 cm (p= 0.003) on MYI. Layers composed of rounded and faceted crystals are significantly thicker on FYI (8.5 ± 7.3 cm) than on MYI (5.8 ± 5.1 cm; p< 0.001). Depth hoar layers do not differ significantly between FYI (2.3 ± 2.4 cm) and MYI (2.4 ± 3.2 cm; p= 0.782), whereas layers of melt-freeze forms are significantly thicker on MYI (4.5 ± 4.6 cm) than on FYI (2.3 ± 2.4 cm; p< 0.001).
The specific surface area (SSA) of snow quantifies the interfacial area between the ice crystals and the pore air enclosed within the snowpack and influences key physical snow properties such as radiative transfer and albedo. Investigating the SSA distribution, displayed in Fig. 4, shows that distributions are right-skewed across most snow types, while rounded and faceted snow layers exhibit a bimodal distribution on both FYI and MYI. At the layer scale, SSA distributions overlap strongly between FYI and MYI. No significant differences were found for wind slab, rounded and faceted snow, or melt-freeze forms (see Table 3). Only depth hoar exhibited a slightly, yet significantly, higher mean SSA on FYI (16.29 ± 7.23 m2 kg−1) than on MYI (15.25 ± 7.21 m2 kg−1; p= 0.014).

Figure 4Probability density distributions of the Snow Specific Surface Area (SSA) for different snow classes on first-year ice (FYI, black) and multi-year ice (MYI, grey). Panels show distributions for (a) wind slab, (b) rounded/faceted grains, (c) depth hoar, and (d) melt-freeze forms. SSA values are derived from SMP measurements, snow classes are obtained from the SMP-based classification, and SSA is calculated as a mean value for each individual snow layer. SSA differs significantly between ice regimes only for depth hoar, although the difference is small.
4.2 Snow densities
Across both FYI and MYI, snow density varies mostly with snow type, and the density distribution of grain types is rather consistent between ice regimes (Fig. 5). Wind slab and melt freeze-form layers exhibit the highest densities, whereas rounded and faceted snow and depth hoar form substantially less dense layers (see Table 3). Mean wind-slab and melt-freeze densities did not differ significantly between ice regimes. In contrast, rounded and faceted layers were significantly denser on FYI (279.7 ± 53.28 kg m−3) than on MYI (251.7 ± 69.79 kg m−3); p< 0.001). Depth-hoar layers were slightly but significantly denser on MYI (290.41 ± 46.33 kg m−3) than on FYI (282.63 ± 43.45 kg m−3); p= 0.003).
Despite the absence of a systematic increase in the density of all snow types, bulk snow densities exhibit a significant shift towards higher values on MYI, with mean bulk density values of 301.7 ± 49.6 kg m−3 on FYI and 321.7 ± 48.5 kg m−3 on MYI (p< 0.001).
Overall, wind-slab and melt-freeze densities are comparable between FYI and MYI, whereas rounded/faceted and depth-hoar densities differ between ice regimes. These differences occur in opposite directions and therefore do not represent a systematic densification of individual snow types on MYI. Yet, differences emerge at the distribution and bulk scale, indicating a more heterogeneous density structure on MYI.

Figure 5Probability density distributions of snow density for different snow classes on first-year ice (FYI, black) and multi-year ice (MYI, grey). Panel (a) shows the distribution of snow bulk density, while panels (b)–(e) show density distributions for individual snow types: (b) wind slab, (c) rounded and faceted grains, (d) depth hoar, and (e) melt-freeze forms. Snow density values are derived from SMP measurements, snow classes are obtained from the SMP-based classification, and snow density values calculated as mean values per individual snow layer. Bulk densities are calculated as the weighted mean along an entire SMP profile. Bulk densities are significantly higher on MYI. Layer-mean wind-slab and melt-freeze densities do not differ significantly between ice regimes, whereas rounded/faceted density is higher on FYI and depth-hoar density is slightly higher on MYI.
4.3 Snow type fractions
To estimate the relative occurrence of snow types on FYI and MYI, the relative fraction of each snow type within individual snow profiles is calculated, based on the classification of the penetrable snowpack. The resulting distributions, shown in Fig. 6, differ between the two ice types. The distribution of depth hoar fractions is similar for FYI and MYI, with no significant difference between the two ice regimes (p< 0.989).
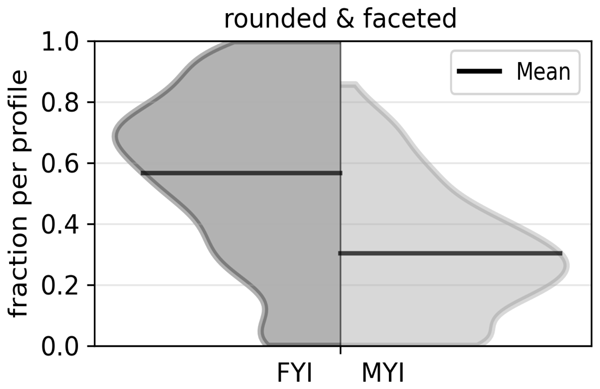
Rounded and faceted layer fractions show overall wide distributions, constituting substantially large fractions of the snowpack on both FYI and MYI, but are significantly larger on FYI (p< 0.001). Meanwhile, melt-freeze forms account for significantly greater fractions on MYI than on FYI (p< 0.001). Wind-slab fractions are only slightly, although significantly, higher on MYI (p< 0.011).
On average, FYI exhibits relative fractions of 0.19 for wind slab, 0.57 for rounded and faceted crystals, 0.12 for depth hoar, and 0.13 for melt–freeze forms. In contrast, MYI shows mean fractions of 0.23, 0.30, 0.12, and 0.35, respectively.

Figure 6Fractional snowpack composition for different snow classes on first-year ice (FYI, dark grey) and multi-year ice (MYI, light grey). Panels show the fraction of (a) wind slab, (b) rounded and faceted grains, (c) depth hoar, and (d) melt-freeze forms within individual snow profiles. The half-violin plots illustrate the distribution across all profiles, with black bars denoting mean fractions. Snow classes and snow type fractions are derived from the SMP–based classification.
4.4 Correlation Length
The stratigraphy derived from SMP transects exhibits strong variability within individual transects.
Therefore, the spatial autocorrelation of fractional snowpack composition is computed using Moran's I (see Sect. 2.5). The resulting autocorrelation is shown in Fig. 7. On FYI, autocorrelation values drop rapidly for all snow types within the first 15 m from between approximately 0.6 and 0.4 to 0.2 and remain low thereafter. In contrast, on MYI, snow type fractions exhibit relatively high spatial correlation, with Moran's I values ranging between approximately 0.6 and 0.8 for most snow types. After an initial decrease at short distances, correlations remain elevated with values around 0.4 over the first approximately 20 m. Depth hoar consistently shows the lowest autocorrelation, with values around I= 0.25.
As the number of profile pairs and transects decrease for larger lag distances, Moran's I values at lag distances larger than 35 m cannot be interpreted as robust signals.
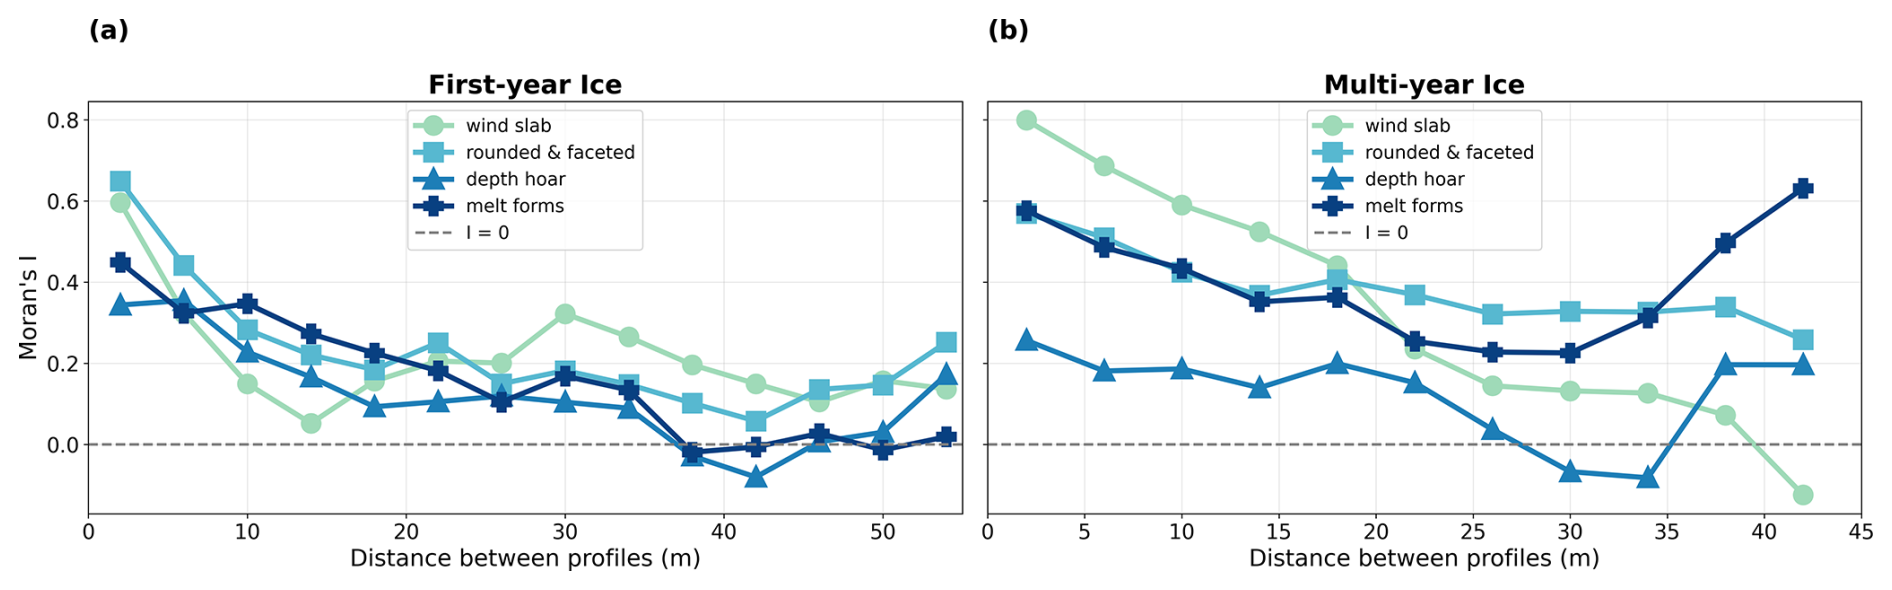
Figure 7Spatial autocorrelation of fractional snowpack composition for different snow classes. Moran’s I is calculated for the fractional occurrence of wind slab, rounded and faceted grains, depth hoar, and melt-freeze forms within individual snow profiles derived from SMP–based classifications. The results are shown separately for (a) FYI and (b) MYI. The x-axis represents the lag distance between pairs of SMP profiles along measurement transects. The dashed horizontal line indicates zero spatial autocorrelation. At larger lag distances, particularly for MYI beyond 45 m, too few profile pairs contribute to the estimate, leading to a shortened transect analysis.
4.5 Variability on floe-size vs. regional scales
To compare the variability on floe-size scale with the variability at the regional (ice-type) scale, the spread of the snow bulk density distributions is quantified both for individual ice floes and for the combined FYI and MYI datasets. For FYI, the variance of floe-wise bulk density distributions range from 495 to 2307 (kg m−3)2, with a mean of 1244 (kg m−3)2, whereas the variance of all pooled FYI distributions is 2463 (kg m−3)2. For MYI, floe-wise variances range from 444 (kg m−3)2 to 2484 (kg m−3)2, with a mean of 1148 (kg m−3)2, while the variance of the pooled MYI distributions is 2349 (kg m−3)2. Thus, floe-scale variance accounts for approximately half of the total within-class variance (50 % for FYI and 49 % for MYI).
To generalize this assessment beyond bulk density and quantify the variability across the full set of snow properties, both the absolute standard deviation (SD) and the relative standard deviation (RSD) are used. The SD enables comparisons of the variability in the same snow property between different snow and ice conditions, i.e., FYI and MYI, while the RSD facilitates comparison of the variability across different snow properties within each ice class. Table 3 summarizes the absolute and relative standard deviation of the full set of snow properties.
Across most properties, the SD on MYI is comparable or higher than on FYI, indicating similar or enhanced absolute variability on MYI. When comparing variability across different snow properties using the RSD, a clear hierarchy emerges that is consistent for both ice regimes. The highest relative variability is found for snow type fraction parameters, particularly wind slab, depth hoar, and melt-freeze forms, and for layer thickness. These parameters exhibit RSD values nearly twice as high as those of SSA and total snow depth. In contrast, lowest RSD values are found for density-derived properties such as bulk density and snow-layer density, indicating that bulk density is the most spatially homogeneous property, a favourable characteristic for large-scale snow-load estimates, as discussed further in Sect. 5.2.
Together, this variability hierarchy indicates that bulk-integrated snow properties are comparatively stable across spatial scales, whereas properties related to stratigraphic composition and layer geometry exhibit substantially stronger spatial variability within and between ice regimes.
5.1 Controls on Antarctic late-summer snowpack structure and properties
Our study shows that properties on Antarctic late-summer sea ice exhibit marked differences between first-year ice (FYI) and multi-year ice (MYI). These differences are most systematic in snow structure, stratigraphy and snow-type composition, whereas intrinsic properties of individual snow types such as density and specific surface area (SSA) are broadly, but not universally, comparable across ice regimes.
We find that, across ice regimes, the wind slabs and melt-freeze layers were dense and compact with mean densities around 355 and 360 kg m−3, while rounded/faceted and depth-hoar layers were looser and more porous with mean densities ranging from 252 to 290 kg m−3. Our mean SSA values for the different snow types, reported in Table 3, fall within ranges reported in previous work (Domine et al., 2007), supporting the plausibility of the SMP-based classification and inferred grain-size distributions. Wind-slab and melt-freeze densities did not differ significantly between FYI and MYI, and SSA was comparable for wind slab, rounded/faceted snow, and melt-freeze forms. In contrast, rounded/faceted layers were denser on FYI, while depth-hoar layers were slightly denser on MYI and had slightly higher SSA on FYI. These class-specific differences show that snow-type properties are not fully invariant between ice regimes. However, their opposing nature indicates that differences between FYI and MYI snowpacks do not arise from the snow itself, but from how it is subsequently modified through different metamorphism pathways within the snow column (Nicolaus et al., 2009).
Consistent with this interpretation, our results show that the strongest divergence between FYI and MYI snowpacks emerges within the internal stratigraphy below the wind-dominated surface layer and arises from contrasting thermodynamic and temporal boundary conditions rather than from intrinsic differences in snow properties. On FYI, the snowpack was generally thinner and more dominated by rounded and faceted crystals, reflecting a shorter residence time and fewer strong thaw events. Thinner ice promotes stronger conductive heat fluxes and persistent temperature gradients, favoring dry metamorphism and the formation of faceted and depth-hoar layers, as typical for FYI regimes. In contrast, MYI snowpacks exhibited greater stratigraphic complexity, consistent with repeated melt-freeze modification that produces hard basal layers interleaved with depth-hoar layers. The thicker ice and longer snow residence time on MYI increase the likelihood of repeated summer melt events, interrupting dry metamorphism and promoting meltwater percolation, refreezing, and the formation of dense melt-freeze layers and meteoric ice (Eicken et al., 1995; Haas et al., 2001; Tian et al., 2020). Consistently, the average number of layers was significantly higher for MYI (six) than on FYI (five). The enhanced stratigraphic complexity implies that MYI snowpacks retain a longer memory of past accumulation and metamorphic events, whereas FYI snowpacks are more frequently reset by surface flooding, deformation, and wind redistribution. Such a longer stratigraphic memory on older Antarctic sea ice has been reported previously for the spring-summer transition, when perennial snow covers exhibiting increased layering, higher density, and stronger vertical heterogeneity compared to first-year ice, reflecting repeated modification over multiple seasons (Nicolaus et al., 2009). Our results extend this finding by showing that such stratigraphic memory persists into the late summer to early autumn period, indicating that MYI snowpacks continue to integrate the imprint of repeated modification even late in the melt season. Physically, this prolonged stratigraphic memory enhances vertical heterogeneity in thermal and mechanical properties, with implications for heat transfer, permeability, and the response of the snowpack to subsequent melt or refreezing events. As a result, FYI and MYI snowpacks develop fundamentally different vertical snow organization despite broadly comparable intrinsic snow-type characteristics (Nicolaus et al., 2006).
Consistent with these stratigraphic differences, we found that the fraction of snow types differed substantially between ice regimes. On FYI, rounded and faceted snow dominated the profiles (57 %), whereas melt-freeze forms were relatively rare (12 %). In contrast, MYI snowpacks contained a much larger fraction of melt-freeze forms (35 %), while the proportion of rounded and faceted snow decreased to 30 %. The depth-hoar fraction did not differ between ice regimes, whereas wind slab accounted for a slightly but significantly larger fraction on MYI.
Because intrinsic density and SSA were similar for each snow type across ice regimes, bulk differences in snowpack properties in this study arise primarily from changes in snow-type fractions and stratigraphic composition. In particular, lower mean SSA and higher snow bulk density on MYI is not caused by denser individual layers, but by the nearly three-times greater prevalence and two-times higher thickness of low-SSA, dense melt-freeze layers (for details see Table 3). Similar mechanisms have been identified by Arndt (2022a), where differences in bulk snow density between seasonal and perennial regimes were attributed primarily to variations in snow-type fractions. For rounded and faceted layers in this study, particularly the SSA distribution shows a bimodal state on both FYI and MYI, as shown in Figs. 4 and 5, likely reflecting the coexistence of decomposing precipitation and older, more developed or melted facets. This is most likely caused by the joint class of both rounded and faceted crystals. Meanwhile, the broadening of the rounded and faceted density distribution on MYI reflects the repeated interruption of dry temperature-gradient metamorphism, which produces a wider range of snow micro-structures within individual profiles.
Finally, we note a hemispheric contrast, though a direct quantitative comparison is limited by the fact that King et al. (2020) sampled Arctic late winter snow, whereas our dataset represents Antarctic late summer. In their study, Arctic winter FYI showed higher bulk density than MYI, linked to a larger fraction of low-density depth hoar on MYI and pronounced surface heterogeneity. Our Antarctic snowpacks, by contrast, showed that by late summer, depth hoar is comparatively minor and MYI bulk density instead exceeds FYI, driven by the greater prevalence of dense melt-freeze layers near the base of the snowpack. Because the two datasets capture different stages of seasonal snowpack evolution, the contrasting patterns reflect a combination of seasonal and hemispheric differences in snowpack processes rather than ice-age effects alone. We therefore highlight that snowpack evolution and bulk properties are strongly shaped by both regional (climate) regime and season, underscoring that density and stratigraphy assumptions for one hemisphere and season cannot be directly transferred to another without accounting for these differences.
Overall, Antarctic late-summer snowpacks are governed by a hierarchy of processes: surface snow properties are primarily controlled by atmospheric forcing, in particular wind re-distribution and mechanical compaction; on FYI ice-thickness-controlled temperature-gradient metamorphism shapes internal layers; while on MYI melt-refreeze cycles dominate stratigraphic complexity. This process-based framework provides the physical basis for interpreting the contrasting spatial variability and characteristic length scales of snow properties on FYI and MYI, which are examined in the following section.
5.2 Scale-dependent variability of Antarctic snowpack properties
Our spatial autocorrelation analysis reveals that MYI snowpacks exhibit stronger spatial coherence of snow-type composition than FYI snowpacks. Moran’s I values on MYI remained high (approximately 0.6–0.8 for most layer types) and decreased only gradually with distance, whereas FYI snowpack correlations decayed rapidly over the first 20 m from 0.4–0.6 down to below 0.2 and stayed low thereafter. However, it needs to be kept in mind, that signals past 35 m cannot be considered statistically robust. Nevertheless, this contrast indicates fundamental differences in the lateral continuity of snowpack structure between ice regimes. On MYI, longer-term accumulation (longer than one season) and repeated metamorphic reworking tend to smooth small-scale surface roughness and preserve stratigraphic organization over larger distances, such that structural snow properties (layer composition and thickness) remain laterally continuous (Sturm et al., 1998). In contrast, FYI surfaces are younger and more dynamically restructured by deformation, wind redistribution, and episodic flooding, causing structural properties to respond strongly to local-scale processes and to vary substantially over short horizontal distances. Accordingly, snow properties decorrelate rapidly on FYI but remain spatially coherent on MYI, reflecting differences in surface stability and snowpack memory, with structural properties responding more strongly to small-scale processes than bulk-integrated properties (Arndt and Paul, 2018).
This behavior also contrasts with findings from the Arctic, where higher spatial correlations have been reported on FYI (rather constant between 0.2 and 0.6) than on MYI (decreasing from 0.2 to −0.2 over the first 20 m) (King et al., 2020). The opposing patterns are consistent with hemispheric differences in summer sea ice surface properties. Arctic MYI commonly exhibits strong surface heterogeneity associated with melt ponds, bare ice, and remnant snow, whereas Arctic FYI often displays smoother summer surface conditions (Andreas and Ackley, 1982). These hemispheric contrasts emphasize that spatial coherence of snow properties is strongly modulated by regional surface evolution rather than ice age alone.
For our Antarctic study, the rapid decorrelation of snow properties on FYI demonstrates that point measurements are representative only over very short distances, posing a substantial challenge for up-scaling to much larger footprints of remote-sensing instruments. Even on MYI, where spatial coherence is higher, local measurements capture only part of the variability characteristic of the ice regime, and therefore remain insufficient to fully represent regime-scale snow conditions.
Beyond the local-scale limitations, a second key scaling result concerns representativeness across floes. For both ice classes, the bulk density variance across all sampled floes is approximately twice the mean within-floe variance, indicating that individual floes capture only about half of the variability characteristic of their respective ice regime. Consequently, robust characterization of FYI and MYI snowpacks requires sampling across multiple floes rather than reliance on single-floe observations.
Taken together, these scaling results motivate a closer examination of which snow properties dominate variability across spatial scales. Our analysis of variability across spatial scales showed that stratigraphic properties dominate Antarctic snowpack heterogeneity, whereas bulk-integrated properties are comparatively homogeneous. Across both ice regimes, absolute variability is comparable or slightly higher on MYI than on FYI. This is consistent with the enhanced vertical and structural heterogeneity in MYI snowpacks that we found, and has also been reported in previous Antarctic winter studies (Arndt and Paul, 2018).
Within each regime, relative variability is highest for snow-type fractions and individual layer thicknesses, identifying layer composition and geometry as the primary contributors to snowpack heterogeneity. Intermediate variability is observed for SSA, snow depth, and number of layers. Density-based properties generally exhibit the lowest relative variability. Snow bulk density was among the most spatially homogeneous property, as well as wind slab, depth hoar and melt-freeze layer densities on both FYI and MYI. Rounded and faceted layer density was the main exception, particularly on MYI.
These systematic differences in variability indicate that Antarctic snowpack heterogeneity is governed primarily by stratigraphic organization rather than by bulk-integrated properties. As a result, bulk density can be estimated robustly from relatively limited sampling, whereas accurate characterization of snow-type composition and stratigraphy requires substantially higher spatial sampling density. This distinction is also relevant for remote-sensing applications: for first-order estimates of snow load or snow water equivalent, bulk density may be more robustly upscaled than layer thickness, snow-type fractions, or SSA. However, the comparatively low variability of bulk density does not imply that bulk representations are sufficient for all retrieval applications. Microwave emission and scattering are sensitive to the vertical distribution of density, SSA, and melt-freeze layers, so retrieval approaches that depend on radiative transfer or snow-ice interface detection still require information on stratigraphic structure (Durand et al., 2011; Royer et al., 2017; Tonboe et al., 2022). More fundamentally, representing Antarctic snow processes therefore requires resolving layer composition and geometry, rather than relying on spatially averaged bulk metrics alone (Arndt, 2022a).
Consequently, Antarctic snow variability is governed by meter-scale structural heterogeneity and ice-regime dependence rather than bulk properties. This implies that observational strategies, remote-sensing retrievals, and model parameterizations that depend on internal stratigraphy, as opposed to bulk-integrated quantities such as snow load, should move beyond uniform bulk representations toward approaches that explicitly account for ice-regime-dependent snow stratigraphy and its scale-dependent variability.
Overall, Antarctic snowpack variability is strongly scale dependent. Stratigraphic composition and snow-type fractions dominate variability over meter to tens-of-meter scales, while bulk density remains comparatively homogeneous. As a result, the representativeness of individual observations depends critically on ice regime and sampling scale. Given this pronounced sensitivity to fine-scale structure and sampling density, it is essential to assess how the limitations and uncertainties of the SMP measurements and our introduced machine-learning-based classification influence the characterization of snow variability, which is addressed in the following section.
5.3 Methodological limitations and uncertainties in resolving Antarctic snow variability
The interpretation of Antarctic snow variability derived from SMP measurements and machine-learning-based snow-type classification is subject to several methodological limitations. These primarily affect the absolute quantification of snow properties and the resolution of basal and fine-scale stratigraphy, with implications for interpreting variability across spatial scales.
First, the sampling design limits the attribution of differences specifically to a single ice-regime because ice-type is partly coupled to the sampling region. Most MYI floes were sampled during PS118 in the northwestern Weddell Sea, whereas most FYI floes were sampled during PS111 and PS124 in the southeastern Weddell Sea. The FYI-MYI contrasts therefore also reflect regional differences. However, because the southeastern Weddell Sea is typically dominated by FYI and the northerwestern Weddel Sea by MYI (Gupta et al., 2025), the coupling between ice regime and sampling region reflects, at least in part, the natural regional distribution of these ice types. The observed contrasts should therefore be interpreted as differences between the sampled FYI- and MYI-dominated environments rather than as region-independent effects of ice regime alone.
A technical key limitation is the inability of the SMP to penetrate very hard melt-freeze and ice layers. As a result, density and snowtype fraction estimates for melt-freeze layers are biased toward the penetrable fraction, and bulk snow density may be underestimated where thick, hard layers occur, predominantly on MYI. Because such layers often form near the snow-ice interface, basal stratigraphy may not be fully resolved, and stratigraphic complexity and bulk density on MYI should therefore be regarded as rather low estimates. From a physical perspective, this under-representation primarily affects properties and processes controlled by basal snow layers, including vertical heat transfer, permeability, and meltwater retention, which are strongly influenced by the presence and thickness of dense refrozen layers. SMP force signals are also sensitive to snow temperature, liquid water content, and salinity (Techel et al., 2008). Under summer conditions, wet or saline snow can reduce signal interpretability and increase uncertainty in inferred snow properties, particularly during melt or flooding events.
Additional uncertainty arises from the empirical parameterizations used to derive density and SSA from SMP force signals, for example SMP-derived SSA values are known to be systematically higher than those obtained from micro-computer tomography due to differences in the effective scale and definition of surface area captured (Calonne et al., 2020). Alternative parameterizations for retrieving density and/or SSA from SMP signals also exist (e.g., Proksch et al., 2015; King et al., 2020), calibrated on different snow populations, and these can yield systematically different absolute values. We selected the Calonne et al. (2020) approach based on its agreement with our co-located snow pit stratigraphy. Using an alternative parameterization would likely shift absolute density and SSA magnitudes, though relative contrasts between ice regimes and snow types, as well as spatial variability patterns, are expected to be less sensitive than the absolute values.
Uncertainty is further introduced by the machine-learning-based snow-type classification. Both the training labels for SMP data and the reference snow pit grain classifications are inherently observer-dependent. However, all classifications were performed consistently by a single observer, minimizing internal inconsistencies. Misclassification by the algorithm is most likely at transitions between snow types with overlapping properties, leading to higher uncertainty in snow-type-separated properties than in bulk snow properties. This uncertainty may contribute particularly to the variability of layer boundaries, layer thicknesses, and snow-type fractions. However, since the higher variability in layering is consistent with previous studies by Arndt and Paul (2018) and Sturm et al. (1998) based on snow pit observations, this methodological limitation mainly constrains the absolute estimate rather than the qualitative comparison between properties.
Importantly, potential misclassification does not alter the principal contrasts identified in this study, which are dominated by large-scale differences in snow-type fractions, stratigraphic organization, and spatial variability. Also, layer counts derived from SMP-based classification represent a lower bound on true stratigraphic complexity and tend to overestimate individual layer thickness, as multiple layers of the same snow class that would be resolved in manual snow pits cannot be distinguished by the automated approach.
While the 1D-CNN is an appropriate and parsimonious choice for SMP-based snow-type classification, future work with broader regional sampling and additional covariates could leverage sequence models (e.g., TCNs or transformer encoders) and probabilistic deep learning to better capture longer-range vertical context and provide calibrated classification uncertainty. With auxiliary inputs such as reanalysis forcing or co-located satellite observables, multi-modal fusion and semi-/self-supervised learning may reduce dependence on observer-labeled training data and facilitate transfer across regions, seasons, and instruments.
Finally, Antarctic MYI snow in summer is not strictly multi-year snow, as snow-ice formation and superimposed-ice processes continuously remove older basal layers. This reworking likely contributes to the broad similarity of most class-intrinsic snow properties between FYI and MYI, despite pronounced differences in stratigraphic complexity.
Overall, these methodological limitations mainly constrain absolute property estimates and the resolution of basal and fine-scale stratigraphy. However, the central conclusions regarding ice-regime-dependent snowpack structure, scale-dependent variability, and the dominant role of stratigraphic organization remain robust.
This study provides a spatially extensive, layer-resolved characterization of Antarctic late-summer snow on sea ice, combining, for the first time, snow pit observations with high-resolution SnowMicroPen measurements and machine-learning-based snow type classification. By explicitly distinguishing first-year ice and multi-year ice, the results demonstrate that differences in Antarctic snowpacks arise not from fundamentally different internal snow properties, but from contrasts in stratigraphic organization, snow type fractions, and their spatial variability. In particular, the persistence of stratigraphic memory on multi-year ice, expressed through enhanced layering and a higher prevalence of dense melt-freeze forms, emerges as a key control on snowpack structure and bulk properties during the summer-to-autumn transition. While snow grain-scale characteristics such as density and specific surface area are broadly comparable between first-year and multi-year ice, contrasts between ice regimes arise from differences in snow type fractions, layering, and the retention of stratigraphic memory, particularly on multi-year ice. This consistency suggests that snow-type-specific SSA values may be transferable across ice regimes, offering a basis for parameterizing snow-type-dependent inputs to microwave emission and radiative transfer models, even as bulk snowpack properties diverge structurally between FYI and MYI. At the same time, this transferability applies at the level of snow types rather than snowpacks as a whole. This highlights that Antarctic snow cannot be adequately represented by uniform bulk properties or sparse point observations. Instead, snow on Antarctic sea ice should be treated as a stratigraphically structured, ice-regime-dependent medium, with implications for sampling strategies and, pending dedicated forward-modeling studies for remote-sensing retrievals, and the representation of snow processes in sea ice models.
The current version of the 1D CNN SMP classifier is available on GitHub under an MIT license https://github.com/dariarctic/smp-classifier (last access: 31 August 2026) together with the data from PS111 as an example dataset (https://doi.org/10.1594/PANGAEA.945858, Arndt, 2022c). To run the code version used in this paper, please refer to v1.0.0 on GitHub. All field data are archived in PANGAEA: https://doi.org/10.1594/PANGAEA.929010 (Arndt, 2021), https://doi.org/10.1594/PANGAEA.945858 (Arndt, 2022c), https://doi.org/10.1594/PANGAEA.945857 (Arndt and Haas, 2022c) for snow pit stratigraphy and https://doi.org/10.1594/PANGAEA.945787 (Arndt, 2022b), https://doi.org/10.1594/PANGAEA.945791 (Arndt and Haas, 2022a) and https://doi.org/10.1594/PANGAEA.945875 (Arndt and Haas, 2022b) for SnowMicroPen data.
SA designed the sampling setup and collected the field measurements. DP developed the ML framework with the help of DC, PK and CK. DP performed the data analysis and visualized the results. DP wrote the manuscript draft. SA, CK, DC and PK reviewed and edited the manuscript. SA supervised the cryospheric part of the study. DC and CK supervised the ML part of the study.
The contact author has declared that none of the authors has any competing interests.
Publisher's note: Copernicus Publications remains neutral with regard to jurisdictional claims made in the text, published maps, institutional affiliations, or any other geographical representation in this paper. The authors bear the ultimate responsibility for providing appropriate place names. Views expressed in the text are those of the authors and do not necessarily reflect the views of the publisher.
We gratefully acknowledge the support of the cruise leaders, all involved scientists, the helicopter teams on board, and the captains and crews of R/V Polarstern during expedition PS111, PS118, and PS124 (grant no. AWI_PS111_00, AWI_PS118_11, AWI_PS124_08). We also thank Julia Kaltenborn for the technical support with the snowdragon framework and Amy Macfarlane for the fruitful discussions on manual SMP data classification. We thank Martin Schneebeli and a second, anonymous reviewer for their valuable input, which significantly improved the manuscript, as well as the Editor Nora Helbig.
This work was supported by the German Research Foundation (DFG) Emmy Noether Programme project SNOWflAke (project number 493362232); the DFG projects fAntasie (grant no. AR1236/3-1) and SnowCast (grant no. AR1236/1-1) within its priority program “Antarctic Research with comparative investigations in the Arctic ice areas” (grant no. SPP1158); by Helmholtz Association’s Initiative and Networking Fund through Helmholtz AI [grant number: ZT-I-PF-5-01]; the University of Hamburg; and the Alfred-Wegener-Institut, Helmholtz-Zentrum für Polar- und Meeresforschung. This work used resources of the Deutsches Klimarechenzentrum (DKRZ) granted by its Scientific Steering Committee (WLA) under project ID 1458.
The article processing charges for this open-access publication were covered by the Alfred-Wegener-Institut Helmholtz-Zentrum für Polar- und Meeresforschung.
This paper was edited by Nora Helbig and reviewed by Martin Schneebeli and one anonymous referee.
Andreas, E. L. and Ackley, S. F.: On the Differences in Ablation Seasons of Arctic and Antarctic Sea Ice, J. Atmos. Sci., 39, 440–447, https://doi.org/10.1175/1520-0469(1982)039<0440:OTDIAS>2.0.CO;2, 1982. a
Arndt, Stoll, N. A., Winkelmann, R., Huntemann, M, and Reese, R.: Chapter Sea Ice Physics in: The Expedition PS111 of the Research POLARSTERN to the Southern Weddell Sea in 2018, Tech. Rep., Alfred-Wegener-Institut, Helmholtz-Zentrum für Polar- und Meeresforschung, https://doi.org/10.2312/BzPM_0718_2018, 2018. a, b, c
Arndt, S.: Snow Stratigraphy Measurements at Ice Stations during POLARSTERN Cruise PS118, PANGAEA [data set], https://doi.org/10.1594/PANGAEA.929010, 2021. a, b
Arndt, S.: Sensitivity of Sea Ice Growth to Snow Properties in Opposing Regions of the Weddell Sea in Late Summer, Geophys. Res. Lett., 49, https://doi.org/10.1029/2022GL099653, 2022a. a, b, c, d, e, f
Arndt, S.: SnowMicroPen (SMP) Force Profiles Collected during RV POLARSTERN Cruise PS111, PANGAEA [data set], https://doi.org/10.1594/PANGAEA.945787, 2022b. a, b
Arndt, S.: Snow Stratigraphy Measurements at Ice Stations during RV POLARSTERN Cruise PS111, PANGAEA [data set], https://doi.org/10.1594/PANGAEA.945858, 2022c. a, b, c
Arndt, S. and Haas, C.: SnowMicroPen (SMP) Force Profiles Collected during RV POLARSTERN Cruise PS118, PANGAEA [data set], https://doi.org/10.1594/PANGAEA.945791, 2022a. a, b
Arndt, S. and Haas, C.: SnowMicroPen (SMP) Force Profiles Collected during RV POLARSTERN Cruise PS124, PANGAEA [data set], https://doi.org/10.1594/PANGAEA.945875, 2022b. a, b
Arndt, S. and Haas, C.: Snow Stratigraphy Measurements at Ice Stations during RV POLARSTERN Cruise PS124, PANGAEA [data set], https://doi.org/10.1594/PANGAEA.945857, 2022c. a, b
Arndt, S. and Paul, S.: Variability of Winter Snow Properties on Different Spatial Scales in the Weddell Sea, J. Geophys. Res.-Oceans, 123, 8862–8876, https://doi.org/10.1029/2018JC014447, 2018. a, b, c, d, e, f
Arndt, S., Haas, C., Meyer, H., Peeken, I., and Krumpen, T.: Recent observations of superimposed ice and snow ice on sea ice in the northwestern Weddell Sea, The Cryosphere, 15, 4165–4178, https://doi.org/10.5194/tc-15-4165-2021, 2021. a, b, c
Bocquet, M., Fleury, S., Rémy, F., and Piras, F.: Arctic and Antarctic Sea Ice Thickness and Volume Changes From Observations Between 1994 and 2023, J. Geophys. Res.-Oceans, 129, https://doi.org/10.1029/2023JC020848, 2024. a
Calonne, N., Richter, B., Löwe, H., Cetti, C., ter Schure, J., Van Herwijnen, A., Fierz, C., Jaggi, M., and Schneebeli, M.: The RHOSSA campaign: multi-resolution monitoring of the seasonal evolution of the structure and mechanical stability of an alpine snowpack, The Cryosphere, 14, 1829–1848, https://doi.org/10.5194/tc-14-1829-2020, 2020. a, b, c, d, e
Domine, F., Taillandier, A.-S., and Simpson, W. R.: A Parameterization of the Specific Surface Area of Seasonal Snow for Field Use and for Models of Snowpack Evolution, J. Geophys. Res.-Earth, 112, https://doi.org/10.1029/2006JF000512, 2007. a
Durand, M., Kim, E. J., Margulis, S. A., and Molotch, N. P.: A First-Order Characterization of Errors From Neglecting Stratigraphy in Forward and Inverse Passive Microwave Modeling of Snow, IEEE Geosci. Remote S., 8, 730–734, https://doi.org/10.1109/LGRS.2011.2105243, 2011. a, b
Eicken, H., Fischer, H., and Lemke, P.: Effects of the Snow Cover on Antarctic Sea Ice and Potential Modulation of Its Response to Climate Change, Ann. Glaciol., 21, 369–376, https://doi.org/10.3189/S0260305500016086, 1995. a
EUMETSAT OSI SAF: Global Sea Ice Concentration Climate Data Record v3.0 (AMSR) – Multimission, https://doi.org/10.15770/EUM_SAF_OSI_0015, 2022. a
EUMETSAT OSI SAF: AMSR2 Global Sea Ice Concentration Interim Climate Data Record Release 3 – GCOM, https://doi.org/10.15770/EUM_SAF_OSI_0024, 2026. a
Fierz, C., Armstrong, R., Durand, Y., Etchevers, P., Greene, E., Mcclung, D. M., Nishimura, K., Satyawali, P., and Sokratov, S.: The international classification for seasonal snow on the ground, Tech. rep., UNESCO-IHP, Paris, Paris, publication Title: IHPVII Technical Documents in Hydrology No. 83, IACS Contribution No. 1, 2009. a, b
Gupta, M., Regan, H., Koo, Y., Chua, S. M. T., Li, X., and Heil, P.: Inferring the seasonality of sea ice floes in the Weddell Sea using ICESat-2, The Cryosphere, 19, 1241–1257, https://doi.org/10.5194/tc-19-1241-2025, 2025. a
Haas, C., Thomas, D. N., and Bareiss, J.: Surface Properties and Processes of Perennial Antarctic Sea Ice in Summer, J. Glaciol., 47, 613–625, https://doi.org/10.3189/172756501781831864, 2001. a, b
Haas, C., Arndt, S., Peeken, I., Eggers, S. L., and Neudert, M: Chapter Sea Ice Geophysics and Biogeochemistry in: The Expedition PS124 of the Research Vessel POLARSTERN to the Weddell Sea in 2021, Berichte Zur Polar-und Meeresforschung – Reports on Polar and Marine Research, Tech. Rep., Alfred-Wegener-Institut, Helmholtz-Zentrum für Polar- und Meeresforschung, https://doi.org/10.48433/BzPM_0755_2021, 2021. a, b, c
Kaltenborn, J., Macfarlane, A. R., Clay, V., and Schneebeli, M.: Automatic snow type classification of snow micropenetrometer profiles with machine learning algorithms, Geosci. Model Dev., 16, 4521–4550, https://doi.org/10.5194/gmd-16-4521-2023, 2023. a, b, c, d, e, f
King, J., Howell, S., Brady, M., Toose, P., Derksen, C., Haas, C., and Beckers, J.: Local-scale variability of snow density on Arctic sea ice, The Cryosphere, 14, 4323–4339, https://doi.org/10.5194/tc-14-4323-2020, 2020. a, b, c, d, e, f
Kiranyaz, S., Avci, O., Abdeljaber, O., Ince, T., Gabbouj, M., and Inman, D. J.: 1D Convolutional Neural Networks and Applications: A Survey, Mech. Syst. Signal Pr., 151, 107398, https://doi.org/10.1016/j.ymssp.2020.107398, 2021. a
Komarov, A. Y., Seliverstov, Y. G., Grebennikov, P. B., and Sokratov, S. A.: Spatial Variability of Snow Water Equivalent – The Case Study from the Research Site in Khibiny Mountains, Russia, J. Hydrol. Hydromech., 67, 110–112, https://doi.org/10.2478/johh-2018-0016, 2018. a
Lavergne, T., Sørensen, A. M., Kern, S., Tonboe, R., Notz, D., Aaboe, S., Bell, L., Dybkjær, G., Eastwood, S., Gabarro, C., Heygster, G., Killie, M. A., Brandt Kreiner, M., Lavelle, J., Saldo, R., Sandven, S., and Pedersen, L. T.: Version 2 of the EUMETSAT OSI SAF and ESA CCI sea-ice concentration climate data records, The Cryosphere, 13, 49–78, https://doi.org/10.5194/tc-13-49-2019, 2019. a
López-Moreno, J. I., Leppänen, L., Luks, B., Holko, L., Picard, G., Sanmiguel-Vallelado, A., Alonso-González, E., Finger, D. C., Arslan, A. N., Gillemot, K., Sensoy, A., Sorman, A., Ertaş, M. C., Fassnacht, S. R., Fierz, C., and Marty, C.: Intercomparison of Measurements of Bulk Snow Density and Water Equivalent of Snow Cover with Snow Core Samplers: Instrumental Bias and Variability Induced by Observers, Hydrol. Process., 34, 3120–3133, https://doi.org/10.1002/hyp.13785, 2020. a
Löwe, H. and Van Herwijnen, A.: A Poisson Shot Noise Model for Micro-Penetration of Snow, Cold Reg. Sci. Technol., 70, 62–70, https://doi.org/10.1016/j.coldregions.2011.09.001, 2012. a
Macfarlane, A. R., Löwe, H., Gimenes, L., Wagner, D. N., Dadic, R., Ottersberg, R., Hämmerle, S., and Schneebeli, M.: Temporospatial variability of snow's thermal conductivity on Arctic sea ice, The Cryosphere, 17, 5417–5434, https://doi.org/10.5194/tc-17-5417-2023, 2023. a
Massom, R. A., Eicken, H., Hass, C., Jeffries, M. O., Drinkwater, M. R., Sturm, M., Worby, A. P., Wu, X., Lytle, V. I., Ushio, S., Morris, K., Reid, P. A., Warren, S. G., and Allison, I.: Snow on Antarctic Sea Ice, Rev. Geophys., 39, 413–445, https://doi.org/10.1029/2000RG000085, 2001. a
Moran, P. A. P.: Notes on Continuous Stochastic Phenomena, Oxford University Press on behalf of Biometrika Trust, Biometrika, Vol. 37, No. 1/2 (June 1950), 17–23, https://doi.org/10.2307/2332142, 1950. a
Nakano, M. and Sugiyama, D.: Discriminating Seismic Events Using 1D and 2D CNNs: Applications to Volcanic and Tectonic Datasets, Earth, Planets and Space, 74, 134, https://doi.org/10.1186/s40623-022-01696-1, 2022. a
Nicolaus, M., Haas, C., Bareiss, J., and Willmes, S.: A Model Study of Differences of Snow Thinning on Arctic and Antarctic First-Year Sea Ice during Spring and Summer, Ann. Glaciol., 44, 147–153, https://doi.org/10.3189/172756406781811312, 2006. a
Nicolaus, M., Haas, C., and Willmes, S.: Evolution of First-year and Second-year Snow Properties on Sea Ice in the Weddell Sea during Spring-summer Transition, J. Geophys. Res.-Atmos., 114, https://doi.org/10.1029/2008JD011227, 2009. a, b, c
Price, D., Soltanzadeh, I., Rack, W., and Dale, E.: Snow-driven uncertainty in CryoSat-2-derived Antarctic sea ice thickness – insights from McMurdo Sound, The Cryosphere, 13, 1409–1422, https://doi.org/10.5194/tc-13-1409-2019, 2019. a
Proksch, M., Löwe, H., and Schneebeli, M.: Density, Specific Surface Area, and Correlation Length of Snow Measured by High-Resolution Penetrometry, J. Geophys. Res.-Earth, 120, 346–362, https://doi.org/10.1002/2014JF003266, 2015. a, b
Ross, Z. E., Meier, M.-A., Hauksson, E., and Heaton, T. H.: Generalized Seismic Phase Detection with Deep Learning, B. Seismol. Soc. Am., 108, 2894–2901, https://doi.org/10.1785/0120180080, 2018. a
Royer, A., Roy, A., Montpetit, B., Saint-Jean-Rondeau, O., Picard, G., Brucker, L., and Langlois, A.: Comparison of Commonly-Used Microwave Radiative Transfer Models for Snow Remote Sensing, Remote Sens. Environ., 190, 247–259, https://doi.org/10.1016/j.rse.2016.12.020, 2017. a, b
Sandven, S., Spreen, G., Heygster, G., Girard-Ardhuin, F., Farrell, S. L., Dierking, W., and Allard, R. A.: Sea Ice Remote Sensing – Recent Developments in Methods and Climate Data Sets, Surv. Geophys., 44, 1653–1689, https://doi.org/10.1007/s10712-023-09781-0, 2023. a
Schneebeli, M. and Johnson, J. B.: A Constant-Speed Penetrometer for High-Resolution Snow Stratigraphy, Ann. Glaciol., 26, 107–111, https://doi.org/10.3189/1998AoG26-1-107-111, 1998. a
Sommerfeld, R. A. and LaChapelle, E.: The Classification of Snow Metamorphism, J. Glaciol., 9, 3–18, https://doi.org/10.3189/S0022143000026757, 1970. a
Sturm, M., Morris, K., and Massom, R.: The Winter Snow Cover of the West Antarctic Pack Ice: Its Spatial and Temporal Variability, in: Antarctic Sea Ice: Physical Processes, Interactions and Variability, American Geophysical Union (AGU), 1–18, ISBN: 978-1-118-66824-5, 1998. a, b
Techel, F., Pielmeier, C., and Schneebeli, M.: The first wetting of snow: micro-structural hardness measurements using a snow micro penetrometer, International Snow Science Workshop, https://arc.lib.montana.edu/snow-science/objects/P__8125.pdf (last access: 12 March 2026), 2008. a
Tian, L., Gao, Y., Weissling, B., and Ackley, S. F.: Snow-Ice Contribution to the Structure of Sea Ice in the Amundsen Sea, Antarctica, Ann. Glaciol., 61, 369–378, https://doi.org/10.1017/aog.2020.55, 2020. a, b
Tonboe, R. T., Nandan, V., Mäkynen, M., Pedersen, L. T., Kern, S., Lavergne, T., Øelund, J., Dybkjær, G., Saldo, R., and Huntemann, M.: Simulated Geophysical Noise in Sea Ice Concentration Estimates of Open Water and Snow-Covered Sea Ice, IEEE J. Sel. Top. Appl., 15, 1309–1326, https://doi.org/10.1109/JSTARS.2021.3134021, 2022. a, b
Toyota, T., Massom, R., Tateyama, K., Tamura, T., and Fraser, A.: Properties of Snow Overlying the Sea Ice off East Antarctica in Late Winter, 2007, Deep Sea Res.-Pt. II, 58, 1137–1148, https://doi.org/10.1016/j.dsr2.2010.12.002, 2011. a