
the Creative Commons Attribution 4.0 License.
the Creative Commons Attribution 4.0 License.
 | 23 Sep 2026
Polythermal conditions in small glaciers in the Swiss Alps

Mylène Jacquemart
Matthias Huss
Ilaria Santin
Gabriela Clara Racz
Christophe Ogier
Saskia Gindraux
Leo Hösli
Raphael Moser
James Irving
Mauro Fischer
Daniel Farinotti
Englacial temperature measurements in the Alps remain sparse and biased toward high-elevation accumulation areas, leaving the thermal state of ablation zones poorly constrained. Here, we present borehole thermometry and ground-penetrating radar surveys from six small Swiss glaciers (<0.5 km2, 2700–3800 m a.s.l.). We confirm polythermal conditions in three glaciers – Alphubel South, Chessjengletscher, and Hohsaasgletscher – where the cold-temperate transition surface lies 17–38 m below the surface and ice temperatures range from temperate to −2.1 °C. A fourth site, Glacier du Sex Rouge, likely retains its historically documented polythermal structure, but borehole measurements were limited to the near-surface cold layer and do not reach the temperate ice below. A consistent spatial pattern emerges, with temperate ice at higher elevations transitioning into fully or partially cold-based glacier termini. Ground-penetrating radar retrievals are generally consistent with borehole-derived thermal conditions, with low scattering in cold ice and enhanced scattering in temperate zones. The observed thermal structures are closely linked to the history of firn cover loss, reconstructed from long-term mass balance records, with sites that lost their firn cover earliest showing the most advanced cooling. Our findings suggest that polythermal conditions among small Alpine glaciers may be more widespread than previously recognized, with important implications for glacial hazard assessments and highlighting the need for systematic regional-scale thermal observations and modeling.
- Article
(12568 KB) - Full-text XML
-
Supplement
(14169 KB) - BibTeX
- EndNote


The glacier thermal structure influences key glacier processes, including ice deformation, ice viscosity, and basal sliding, as well as the storage and drainage of meltwater (Jansson, 1996; Flowers and Clarke, 2002; Boon and Sharp, 2003; Cuffey and Paterson, 2010). Glacier thermal conditions are generally classified into three categories: (1) fully temperate, where all ice is at the pressure melting point (PMP), (2) cold, where ice temperatures remain below the PMP, or (3) polythermal, where both cold and temperate ice coexist within a glacier. Englacial temperature is influenced by multiple factors, including the surface energy balance, ice advection, internal heat production due to strain heating, geothermal heat flux, and latent heat release from refreezing water (Cuffey and Paterson, 2010).
Despite their importance, englacial temperature measurements remain sparse. In the Alps, existing observations are biased toward accumulation areas above 3800 m a.s.l., including sites in the Monte Rosa, Mont Blanc and Bernese Alps massifs (Haeberli and Alean, 1985; Haeberli and Funk, 1991; Suter and Hoelzle, 2002; Hoelzle et al., 2011; Pavlova et al., 2014) (Fig. S1 in the Supplement), where limited energy availability has historically resulted in predominantly cold thermal structures. More recent studies using both modeling and direct measurements have reported increasing englacial temperatures at these elevations (Vincent et al., 2020; Mattea et al., 2021; Gastaldello et al., 2025; Huss et al., 2026), a trend linked to extended melt seasons and latent heat release from refreezing meltwater in firn. In contrast, observations from ablation areas at lower elevations are scarce. A small number of measurements exist from large valley glaciers, primarily dating back to the 1970s (Haeberli, 1976), as well as early pioneering measurements from the nineteenth century (Hugi, 1842; Agassiz, 1847). More recent ablation-area measurements are limited to a few notable exceptions: Glacier de Tête Rousse (Vincent et al., 2012), Vadret dal Corvatsch (Haeberli et al., 2004), Vadret Muragl, Vadret da Rims (Engadin, Switzerland) and Glacier du Sex Rouge (Fischer, 2018).
At these lower elevations (<3800 m a.s.l.), glaciers may respond to atmospheric warming differently from higher-elevation glaciers that still retain firn-covered accumulation areas, because firn loss alters how latent heat from meltwater is retained (Hock, 2005). Where firn is present, meltwater percolates to depth and refreezes in ice that is less thermally coupled to the surface, retaining the released latent heat; where firn is absent, meltwater instead runs off over the impermeable ice or refreezes at the surface, where the heat is quickly lost to the atmosphere. This loss of retained latent heat can outweigh other heat inputs, allowing the ice to cool despite rising air temperatures (Wilson and Flowers, 2013; van Pelt et al., 2016). While this effect has been studied in Arctic glaciers (Irvine-Fynn et al., 2006, 2011; Delcourt et al., 2013; Karušs et al., 2022), it has received comparatively little attention in alpine and high-mountain environments (Gilbert et al., 2012; Huss and Fischer, 2016). Such cooling may promote the development of polythermal structures and may be particularly important for small glaciers, where limited ice flow and internal deformation (Huss and Fischer, 2016) reduce strain heating and sparse crevassing limits deep meltwater infiltration. Despite this expected sensitivity, the englacial thermal regime of small Alpine glaciers undergoing rapid firn loss remains almost entirely unobserved.
Understanding where and when such polythermal structures develop has direct relevance for glacier hazard assessment. While thermal conditions alone do not directly cause instability (Faillettaz et al., 2015), they can promote preconditions for ice break-offs, avalanches (Kavanaugh and Clarke, 2001; Faillettaz et al., 2015; Bondesan and Francese, 2023), glacier lake and water pocket outburst floods (Röthlisberger, 1978; Huggel et al., 2004; Vincent et al., 2010, 2012), and even large-scale glacier detachments (Gilbert et al., 2018; Kääb et al., 2018; Jacquemart et al., 2020). In particular, polythermal glaciers are thought to be prone to the development of hazardous conditions, as the presence of cold ice can inhibit the development of efficient drainage systems, increasing a glacier's susceptibility to accumulate meltwater beyond its drainage capacity (Wadham et al., 2001; Vincent et al., 2012; Karušs et al., 2022; Jacquemart et al., 2024). A recent example is the 2022 collapse of the Marmolada Glacier (Dolomites, Italy), which caused 11 fatalities and has been linked to a polythermal configuration in which cold basal ice likely prevented efficient meltwater drainage, leading to a frontal ice break-off (Bondesan and Francese, 2023; Olivieri and Bettanini, 2023). Assessing the hazard potential of alpine glaciers therefore requires a better understanding of the distribution of polythermal glaciers. Unfortunately, the lack of observations currently precludes any predictions about which glaciers might fall into this category, especially in the poorly sampled 2700–3800 m a.s.l. range (Fig. S1).
To address this knowledge gap, we instrumented six small (<0.5 km2) glaciers in the Swiss Alps, spanning an elevation range of 2700–3800 m a.s.l. In addition to several new glaciers, we included Glacier du Sex Rouge and Vadret dal Corvatsch in our study, where previous englacial temperature measurements (Haeberli et al., 2004; Fischer, 2018) enable a direct assessment of thermal change over decadal timescales. At all sites we measured englacial temperatures in boreholes during the summers of 2024 and 2025 and performed ground-penetrating radar (GPR) surveys to provide spatially continuous proxies for the thermal conditions, exploiting the sensitivity of radar scattering to liquid water content. To contextualise the observed thermal structures, we reconstructed the evolution of the firn cover from the 1970s to present, drawing on measured and modeled mass balance data (GLAMOS – Glacier Monitoring Switzerland, 2025).
To address the observational gap identified above, site selection was guided by the following criteria:
-
Elevation; targeting glaciers below the current firn line where ongoing firn loss enhances susceptibility to conductive cooling and englacial temperature observations remain scarce.
-
Size; with a preference for very small glaciers (<0.5 km2) where strain heating can be expected to be minimal (Huss and Fischer, 2016).
-
Limited crevassing, which reduces surface permeability and meltwater infiltration (Huss and Fischer, 2016; Gilbert et al., 2020).
-
An availability of previous englacial temperature measurements, enabling direct comparison with past observations.
-
Accessibility.
Following these criteria, we selected six small glaciers (<0.5 km2) in the Swiss Alps: Alphubel South, Chessjengletscher, Hohsaasgletscher, Glacier du Sex Rouge, Glacier de Tortin, and Vadret dal Corvatsch (hereafter Alphubel, Chessjen, Hohsaas, Sex Rouge, Tortin, and Corvatsch, respectively; Table 1; Figs. 1 and 2). The sites cover an elevation range from ca. 2700 to 3800 m a.s.l. and mean surface slopes between 9 and 29° within the study areas. The sites span all aspects, although the majority are located on north- and west-facing slopes. Three sites (Sex Rouge, Tortin, and Corvatsch) are part of the GLAMOS mass balance monitoring network, providing multi-year surface mass balance records as context for the thermal observations (Huss et al., 2026). For Sex Rouge and Corvatsch past borehole observations are available as indicated in Table 1.
Table 1Key characteristics of the six study sites. Area and elevation range were derived from the SwissALTI3D Digital Elevation Model (DEM) (Swisstopo, 2023a) clipped to the 2023 Swiss Glacier Inventory (SGI2023) outlines (Huss et al., 2026). Center coordinates are given in the Swiss coordinate system (LV95; EPSG:2056). Mean slope was averaged over the study area (the GPR survey/borehole footprint); aspect was averaged over all glacier pixels. For Chessjengletscher, this study focused on the lower ice body (area given in parenthesis). The hydrological year when in-situ measurements were started in the frame of GLAMOS measurements is given. Previous T: references to englacial temperature measurements prior to this study.
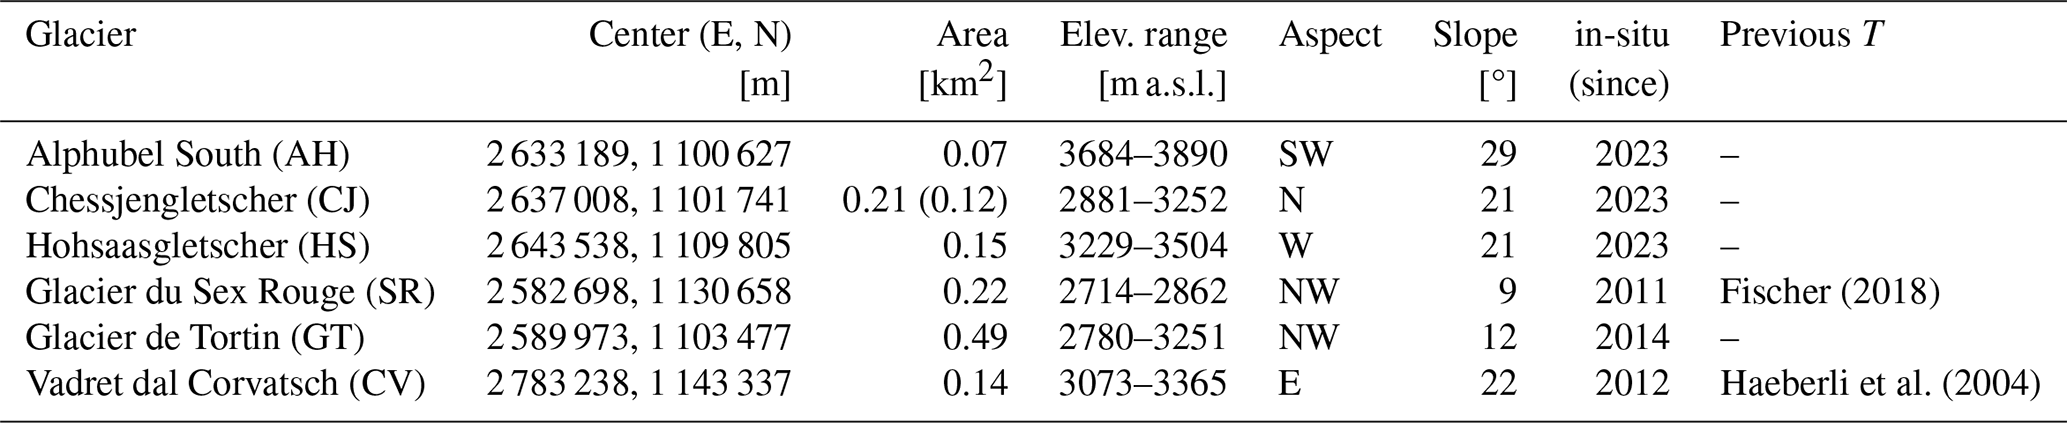
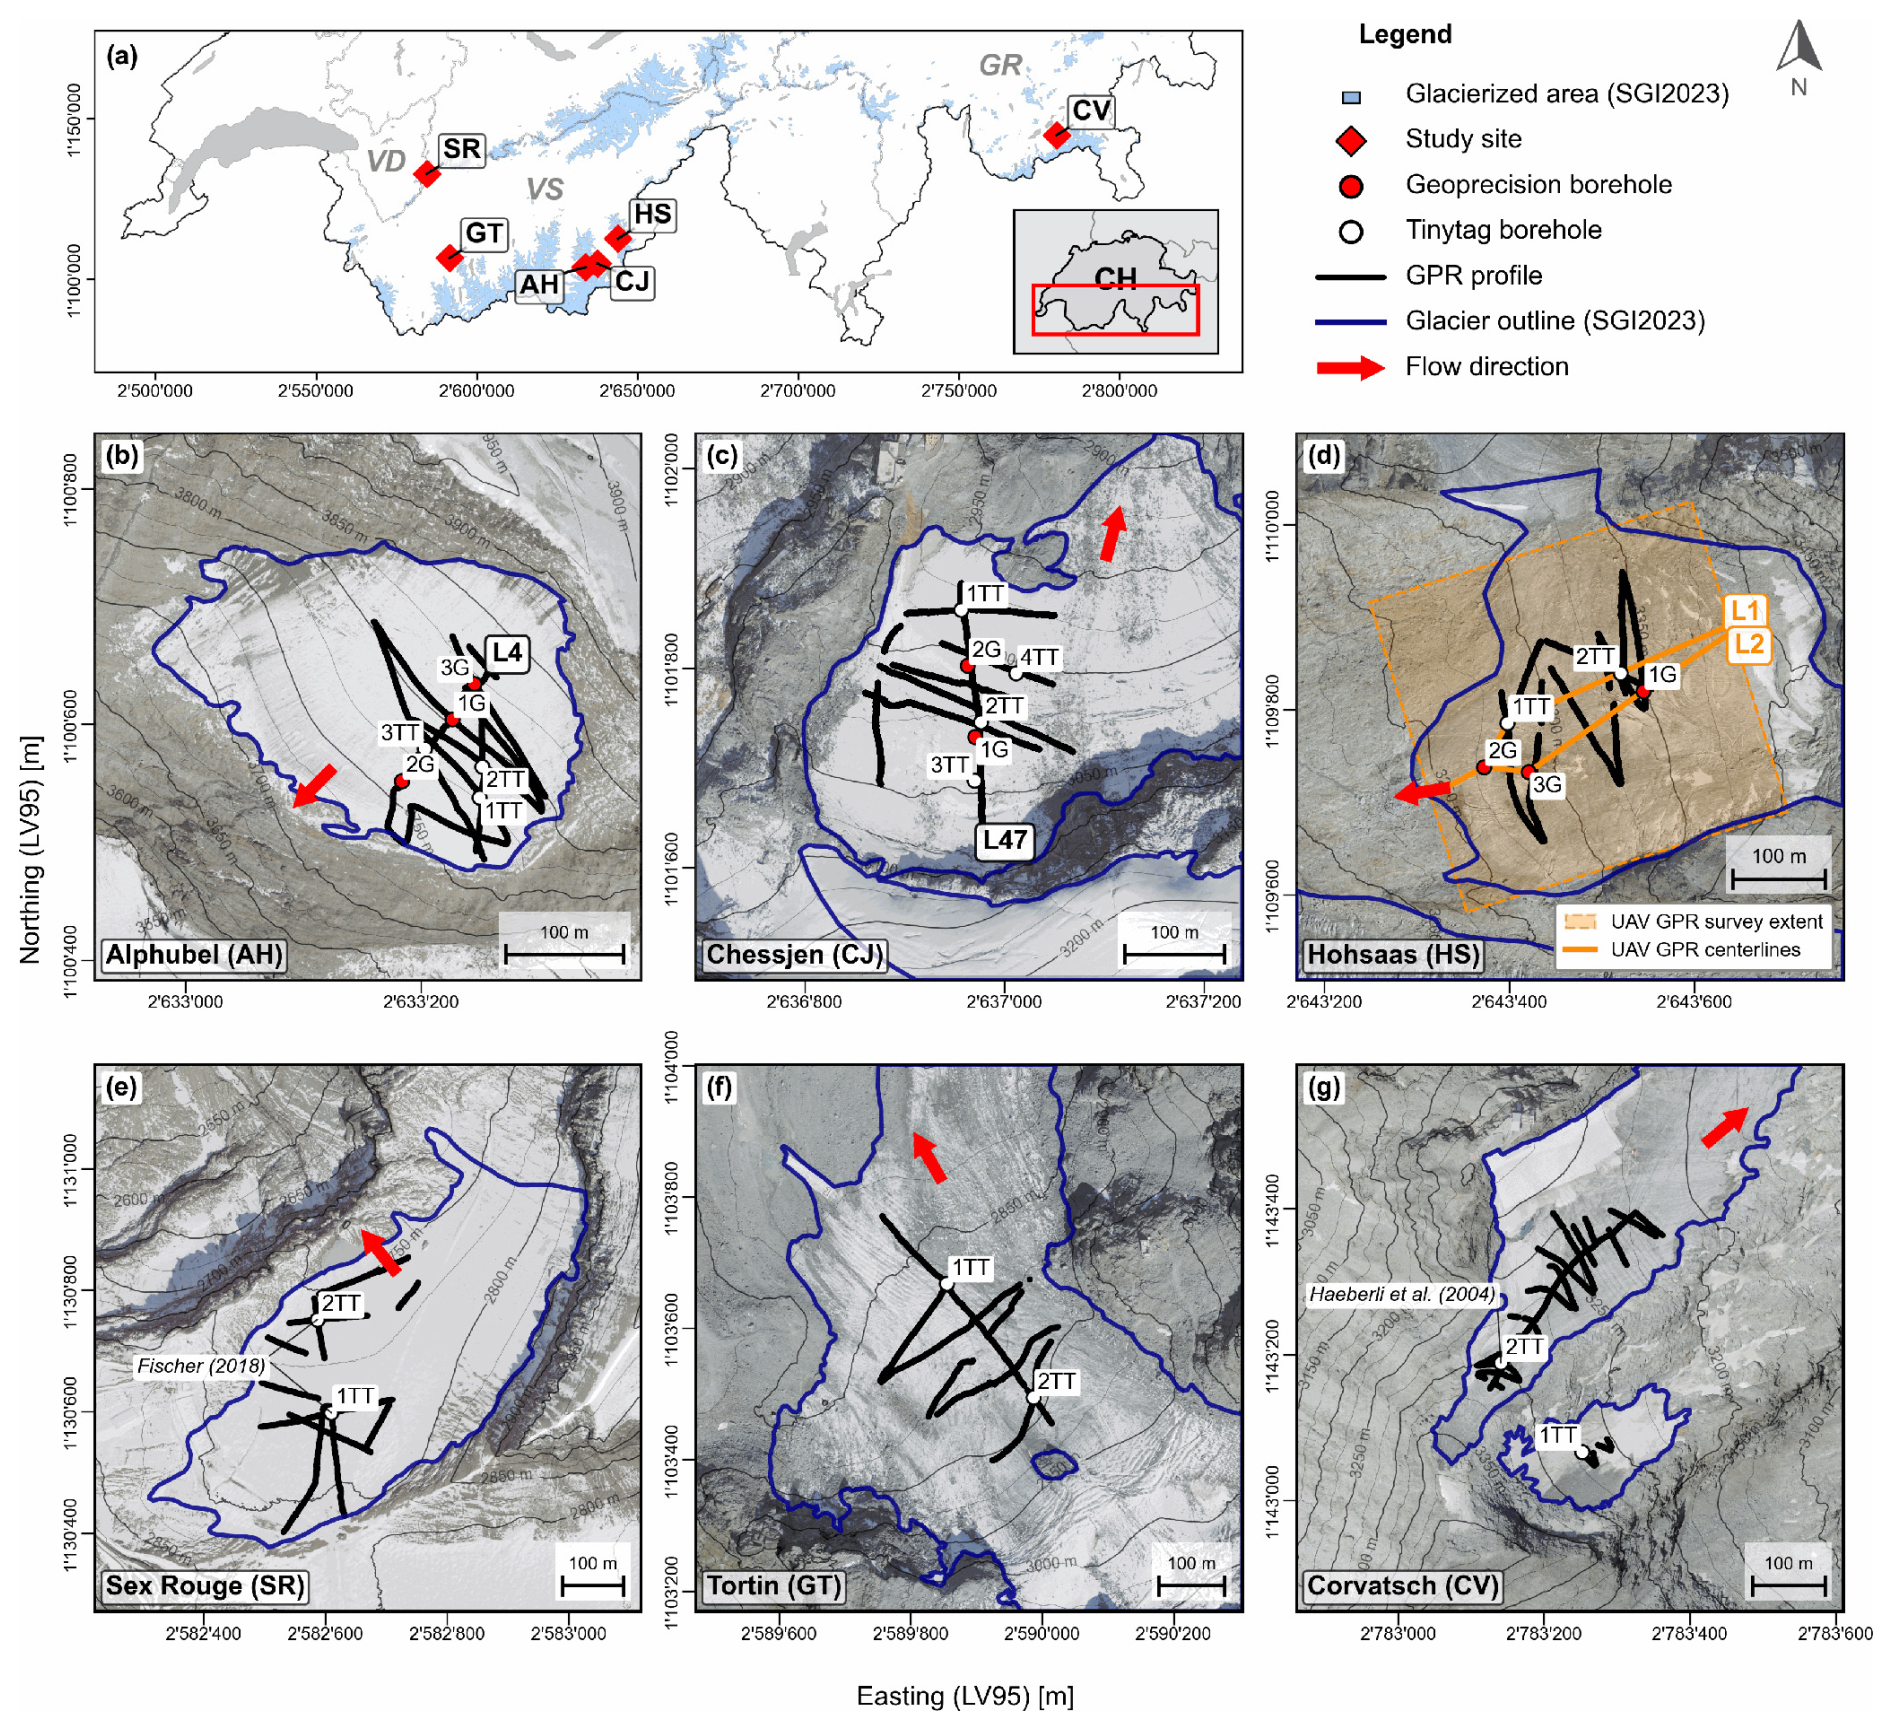
Figure 1Overview and detailed maps of the six glaciers investigated in this study. (a) Location of study sites with cantonal boundaries (VD: Vaud; VS: Valais; GR: Graubünden) and glacierized area according to the Swiss Glacier Inventory 2023 (SGI2023) (Huss et al., 2026). (b–g) Alphubel (AH), Chessjen (CJ), Hohsaas (HS), Sex Rouge (SR), Tortin (GT), and Corvatsch (CV), showing field installations on orthophotos (Swisstopo, 2024) with contour lines (Swisstopo, 2023a) and SGI2023 glacier outlines. Red arrows indicate approximate flow direction. Boreholes are distinguished by the type of thermistor string (see legend) and labeled profiles indicate transects used for temperature interpolation (L4, L47, L1, L2). Annotations on SR and CV mark sites of prior temperature measurements (Haeberli et al., 2004; Fischer, 2018). For Hohsaas (d), the survey extent and the extracted centerlines of a UAV-based GPR survey are indicated.
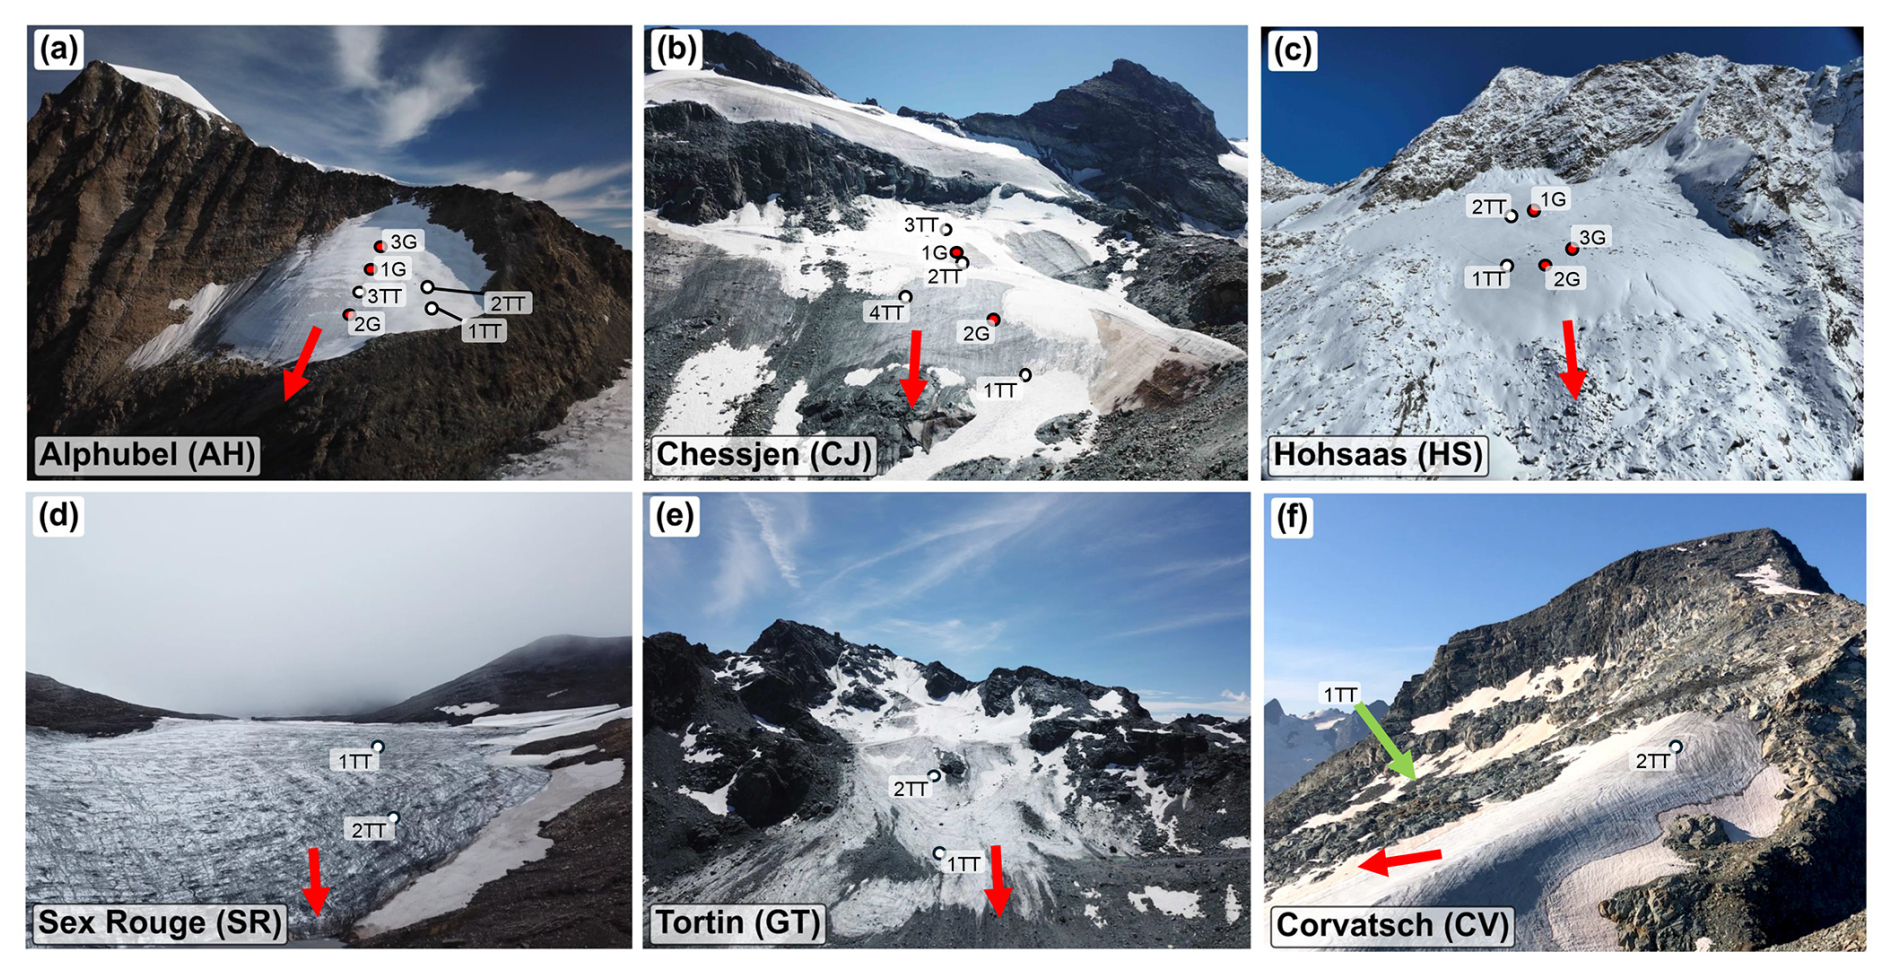
Figure 2Overview images of the six study sites taken in July–August 2025: (a) Alphubel, (b) Chessjen, (c) Hohsaas, (d) Sex Rouge, (e) Tortin, and (f) Corvatsch. Approximate borehole locations are marked on each image and color-coded by sensor type: Geoprecision (G, red) and Tinytag (TT, white). The red arrow indicates the approximate flow direction of each glacier. CV1TT lies in a small depression and is therefore not directly visible; the green arrow indicates its approximate location.
We conducted two field campaigns, in the summers of 2024 and 2025. Before detailing the individual methods (Sects. 3.2 to 3.4), we first give a chronological overview of this fieldwork. During the initial campaign in August 2024, we drilled shallow boreholes on all six glaciers to depths of approximately 15 m and equipped them with two thermistors. In parallel, we conducted ground-based GPR surveys on all glaciers except Alphubel. Follow-up visits in September and October 2024 were used to retrieve initial thermistor data after sensor equilibration. A second field campaign between 5 and 13 August 2025 included the retrieval of the complete shallow temperature records and the drilling of additional deep boreholes (here defined as bed-reaching boreholes of 17 to 58.3 m depth) at Alphubel, Chessjen, and Hohsaas. We retrieved temperature data from these deeper boreholes after one month (16–17 September 2025), with the exception of Chessjen, where a second readout was conducted in mid-December 2025. Additional radar measurements included a GPR survey at Alphubel in May 2025 and an uncrewed aerial vehicle (UAV)-based GPR survey at Hohsaas in September 2025. Furthermore, mass balance measurements were conducted at all six study sites. End-of-melt-season stake readings were performed between August and October 2024 and 2025, with stake networks ranging from two to seven mass balance stakes per glacier. Snow depth measurements were collected in April and May 2025. A timeline of all borehole instrumentation and GPR surveys across the six study sites is given in Fig. S2.
3.1 Ground-penetrating radar (GPR) surveys
Two GPR systems were used in this study: a ground-based system deployed at all sites, and a UAV-based system used at Hohsaas. An overview of the setups for both systems is provided in Fig. S7.
All ground-based GPR surveys were conducted using a Sensors & Software pulseEKKO Pro system. The choice of antenna frequency balanced penetration and robustness against scattering on the one hand, and ease of handling on the other. We used 100 MHz antennas at most sites as a conservative choice, ensuring good-quality bedrock reflections given the expected ice thickness and the scattering from englacial water and inhomogeneities. At Alphubel, the steep terrain favored the more compact 250 MHz antennas which still imaged the bedrock reliably. Antenna positions were tracked with a Leica differential GNSS receiver operating in real-time kinematic (RTK) mode, providing centimeter-level positioning accuracy. Antenna elevations were corrected for the offset between the GNSS and radar antennas and for the antenna height above the ground surface. Depending on surface conditions, the antennas were either carried approximately 50 cm above the surface or, in areas with sufficient snow cover (Sex Rouge, Corvatsch, Alphubel), mounted on a sledge and pulled at approximately 10 cm above the surface. In both configurations, a constant separation of 2 m between transmitter and receiver was maintained. At most sites, the survey included a profile approximately along the glacier centerline connecting the borehole locations.
At Hohsaas, we employed a recently developed UAV-based GPR system (Ruols et al., 2023), using an M300 RTK UAV (DJI) carrying a GPR unit with a single transmit-receive antenna at a center frequency of 80 MHz. Survey line positions were determined using a D-RTK 2 high-precision GNSS mobile station (DJI), providing centimeter-level RTK positioning (nominal accuracy 1 cm+1 ppm horizontal, 2 cm+1 ppm vertical). By flying a regular grid of parallel lines with 4 m spacing oriented approximately along the glacier contours, we obtained a 3D data cube covering nearly the entire glacier area. For the thermal interpolation, we extracted two down-slope profiles from this grid by sampling across the survey lines, each profile intersecting three boreholes.
All ground-based GPR data were processed using a standard workflow in Geolitix (Geolitix Technologies Inc., 2020); details are provided in Sect. S2.8.1. The UAV-based GPR data from Hohsaas were processed using a separate workflow described in Sect. S2.8.2. In both cases, the basal reflection was manually picked and ice thickness computed as the difference between surface and bed elevations, establishing the geometric framework needed for interpolation of the temperature data. We estimate the resulting bedrock-depth uncertainty at approximately ±5 m, arising from the manual picking of the basal reflection and the vertical resolution of the radar. We primarily used the radar data to characterize the englacial thermal structure: In GPR data, temperate ice containing free water at grain boundaries produces diffuse scattering and signal attenuation, whereas cold ice is largely transparent to radar (Pettersson et al., 2004; Vincent et al., 2012; Wilson et al., 2013; Sevestre et al., 2015; Gilbert et al., 2020; Forte et al., 2025). The cold-temperate transition surface (CTS) is therefore identifiable as the boundary between diffuse scattering and low-reflectivity zones, used here to independently validate borehole-derived CTS positions and to extend the thermal interpretation beyond the borehole network.
3.2 Borehole temperature measurements
3.2.1 Drilling and borehole locations
During the initial campaign in August 2024, we drilled two shallow boreholes on each of the six glaciers using a Heucke steam drill (Heucke, 1999). We selected this system for its portability, even though it limited maximum borehole depth to 15 m. Attained borehole depths ranged from 7 to 15.6 m, reaching bedrock at the shallowest sites. We generally selected one borehole at higher and one at lower elevation per glacier to capture contrasts in surface settings. At Corvatsch and Sex Rouge, locations were chosen to allow comparison with previous measurements. Shallow boreholes for ablation stakes were drilled using a Kovacs ice auger powered by an electrical hand drill, which was also used to pre-drill the upper few meters of deeper boreholes. Ablation stake readings were used to monitor local melt and adjust the effective measurement depth of the thermistors.
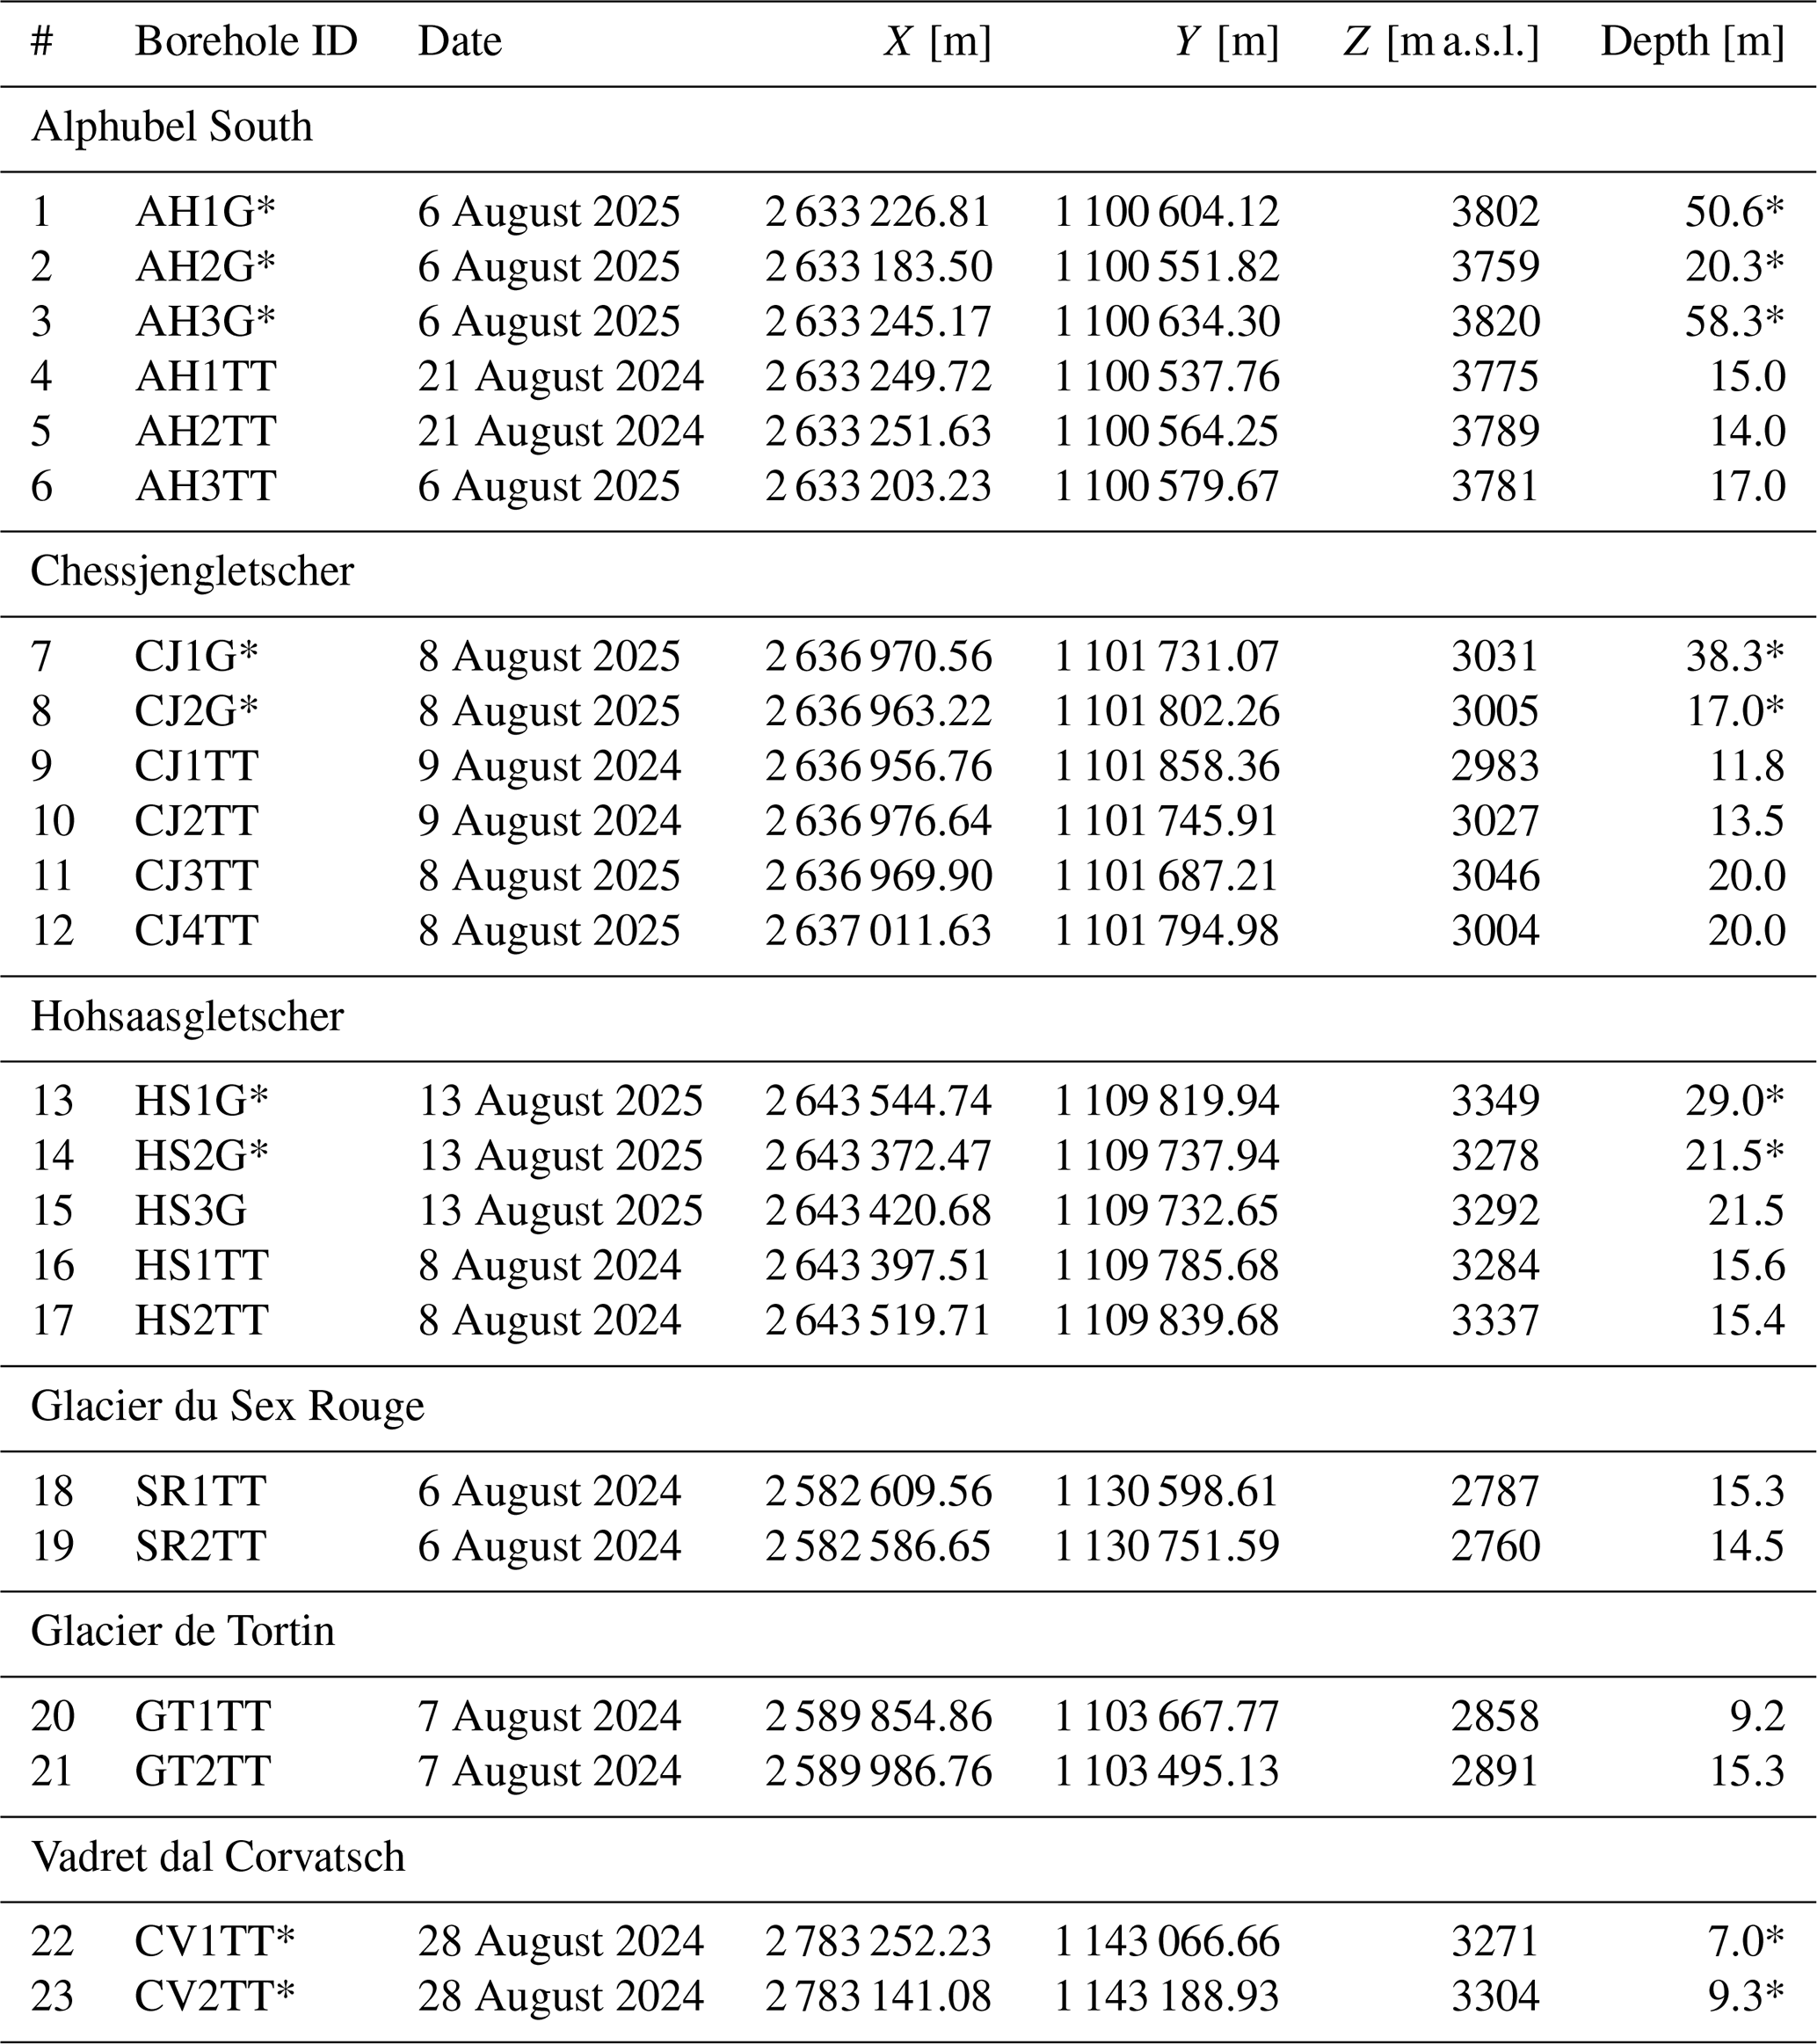
Based on the preliminary insights from the 2024 data, in 2025 we drilled boreholes to the glacier bed at Alphubel, Chessjen, and Hohsaas to acquire complete vertical temperature profiles. Drilling was conducted using a hot-water drill system consisting of a Kärcher HD 9/23G pressure pump connected to a HG43 flow heater (Fig. S3). In this manner we drilled eleven additional boreholes (four each at Alphubel and Chessjen, three at Hohsaas), with depths ranging from 17 to 58.3 m and with seven of them reaching bedrock. Boreholes were positioned near the glacier centerline and, where possible, in a way to fill gaps from the 2024 campaign. We surveyed all borehole positions using a GNSS antenna, which also enabled calculation of annual glacier surface displacement rates for the 2024 boreholes (Table S17 in the Supplement). Across both campaigns, we drilled a total of 23 boreholes. Table A1 in the Appendix provides an overview of locations, elevations, depths, and sensor types, while Figs. 1b–g and 2 illustrate borehole positions and local topography.
3.2.2 Measurements and calibration
Depending on the borehole depth, we used two thermistor setups: Tinytag Plus 2 (TGP-4520) loggers from Gemini Data Loggers for shallow boreholes, and multi-sensor thermistor chains from Geoprecision for deeper boreholes.
During the 2024 campaign, we installed Tinytag loggers in weatherproof enclosures mounted on aluminum plates and secured to ablation stakes at the borehole sites (Fig. S4a). Each logger records two Tinytag PB-5010 negative temperature coefficient (NTC) thermistors with a nominal accuracy of ±0.2 °C (manufacturer specification) and a reading resolution of 0.02 °C. We positioned the sensors so that one reached the maximum borehole depth and the second was installed five meters above. Since our shallow boreholes were approximately 15 m deep, this configuration typically provided measurements at depths of about 10 and 15 m. For the Tinytag sensors, which operated over a full year, we were able to compute the actual sensor depth at the time of readout by accounting for surface melt measured at the stake locations between installation and retrieval. Prior to deployment, we calibrated these sensors in an ice-bath setup after 1–2 h of thermal equilibration to quantify and correct sensor-specific offsets relative to 0 °C. The median offset was 0.3 °C, larger than the nominal accuracy and thus a meaningful correction for these sensors.
The Geoprecision multi-sensor thermistor chains, deployed in the deep boreholes, were secured by taping the logger at the top of each chain to a 1 m wooden stick over the borehole (Fig. S4b). Depending on borehole depth, the chains contained 5–10 TNodeHD thermistors that were spaced between 2.5 and 5 m apart. Like the Tinytag sensors, the TNodeHD thermistors use NTC sensors but offer higher measurement accuracy (±0.05 °C, manufacturer specification) and a temperature resolution of 0.0001 °C. These chains were calibrated in a temperature-controlled alcohol bath (Huber CC245 WL) against a high-precision reference thermometer (ISOTECH F250; Fig. S5). The median offset was only −0.004 °C.
The derived offsets were applied to all sensors before analysis. A detailed description of the calibration procedures, including stability criteria and a statistical overview of the offsets, is provided in Sect. S2.4. The temperature contrasts underlying our interpretations are generally substantially larger than these sensor accuracies; where individual values fall within sensor accuracy of the melting point, we interpret them accordingly.
3.3 Borehole temperature analysis
3.3.1 Temperature data analysis
The temperature data were analyzed with two objectives: characterizing the seasonal thermal signal at each site, and constructing time-averaged vertical temperature profiles for spatial interpolation. The Tinytag time series (boreholes 1TT and 2TT), which cover nearly a full annual cycle (Fig. S2), are used to characterize seasonal variations, estimate the depth of the zero annual amplitude (ZAA; see Sect. S2.7), and identify transient events such as short-term warming following water intrusion. This analysis is presented in Sect. 4.1. At Sex Rouge and Corvatsch, where historical temperature measurements are available, the continuous Tinytag record also allows a day-to-day comparison with the historical data, which consist of single transient measurements.
To construct vertical temperature profiles, we averaged temperatures over the measurement period for each sensor, excluding an initial equilibration phase of 14 d following installation to allow the borehole to refreeze and temperatures to stabilise. The thermal disturbance introduced by hot-water drilling is spatially confined to the immediate borehole surroundings and decays over timescales of days to weeks, depending on borehole diameter and ice temperature (Humphrey and Echelmeyer, 1990; Cuffey and Paterson, 2010). Our 14 d exclusion window is therefore sufficient for the deep boreholes to converge on stable, undisturbed ice temperatures, as confirmed directly by the equilibrated sensor records (Figs. S14–S16). Sensor depths were corrected for cumulative surface melt between installation and readout, using the melt-corrected final depth zfinal as the effective measurement depth for interpolation. The interpolation was restricted to Alphubel, Chessjen, and Hohsaas, where the installation of additional thermistor chains provided a higher density of observations, including measurements at or near the glacier bed. The interpolated temperature fields were subsequently compared against ground-penetrating radar reflectivity patterns to assess their consistency and to avoid over-interpretation of areas without direct temperature measurements.
Finally, boreholes were assigned to one of three thermal-regime categories based on the fraction of temperature measurements at or above 0 °C within sensor accuracy (0.05 °C for Geoprecision, 0.20 °C for Tinytag): boreholes with less than 2 % such measurements were classified as cold, those with 50 % or more as temperate, and all others as polythermal. These categories are used in Fig. 8 to contextualise borehole thermal structure within the firn cover reconstruction.
3.3.2 Interpolation and CTS detection
Borehole temperature data were interpolated along downslope profiles, connecting as many borehole locations as possible. This resulted in one profile for Alphubel and Chessjen and two profiles for Hohsaas, extracted by sampling across the contour-parallel UAV-GPR survey lines. The profiles (L4, L47, L1, L2) are marked in Fig. 1b–d. Interpolation was performed using Radial Basis Function (RBF) interpolation (Hardy, 1971), implemented via the RBFInterpolator routine of the SciPy library (Virtanen et al., 2020). RBF interpolation is well suited for this application as it makes no assumptions about the spatial pattern of the temperature field and handles sparse, unevenly distributed observations well. To account for the strong vertical temperature gradients (compared to horizontal) (Cuffey and Paterson, 2010), the vertical coordinate was scaled prior to interpolation. The scaling factor was determined empirically from the ratio of observed vertical to horizontal temperature gradients in the borehole data. A multiquadric kernel was used and the interpolated field was evaluated on a regular grid masked to the glacier geometry. A detailed description of the interpolation scheme is provided in Sect. S2.5.
The position of the CTS was estimated by identifying grid cells where the interpolated temperature approached the pressure-dependent melting point, following the Clausius-Clapeyron relation with °C m−1 (Cuffey and Paterson, 2010) and a tolerance of δCTS=0.05 °C. Details are given in Sect. S2.6.
3.4 Mass balance and long-term firn cover development
Annual point mass balance was measured at all Tinytag borehole locations (1TT and 2TT). Snow depth measurements were additionally collected across each glacier in April 2025 using manual probing at 15–60 points per site (Fig. S9). Snow density was measured on site using a coring device, or adopted from measurements on nearby glaciers. At Corvatsch, Sex Rouge and Tortin, these measurements are part of monitoring programs started around 2010. Point measurements of ablation and accumulation were spatially extrapolated to the entire glacier using a distributed mass balance model (Huss et al., 2021), which accounts for spatial variability and the inhomogeneous distribution of field observations. The model combines a distributed accumulation model with a temperature-index melt model that includes a potential-solar-radiation term (Hock, 1999), rather than a full surface energy balance. Melt is computed from air temperature and potential clear-sky solar radiation, while accumulation is derived from precipitation, scaled by a correction factor and distributed using observed snow-accumulation patterns to capture the spatial variability of snow deposition across the glacier. Model parameters are calibrated against the seasonal stake and snow-probing measurements at each site. A full description of the model, including the melt and accumulation formulations and the calibration procedure, is given in Huss et al. (2021). This approach allows inferring surface mass balance distribution on a 10 m spatial grid.
The calibrated mass balance model can also be driven by meteorological forcing outside of the period covered by in-situ measurements. In this case, the model is constrained by observed long-term changes in ice volume (Huss et al., 2015). Supported by the detailed measurements of the recent years, informing about the spatial variability of mass balance components, the model thus provides a gridded annual mass balance distribution for each glacier from 1970 to 2025. These grids were used to derive spatially distributed firn cover maps by cumulatively tracking mass balance at each grid cell through time. Firn thickness was updated annually by adding positive mass balance (accumulation) and removing negative mass balance (ablation) from the existing firn column, with ablation removing the most recently deposited layers first. Grid cells were classified as firn-covered if they accumulated snow in two consecutive years. This criterion excluded single years with a larger end-of-season snow extent from the firn extent. Firn layers persisting for more than 20 years were considered ice, a simple assumption consistent with typical densification timescales in the Alps (Ambach and Eisner, 1966). This approach yields annual maps of firn thickness and extent from 1970 to 2025 for each glacier. Because the reconstruction depends primarily on the accumulation component, its reliability rests on how well snow accumulation and its spatial distribution are captured. For Alphubel, Chessjen, and Hohsaas the accumulation model is constrained by only a single year of snow-probing data, fewer than at the long-monitored sites (Corvatsch, Sex Rouge, Tortin). We therefore assessed the reconstructed firn extent independently against firn/perennial-snow boundaries manually digitized from high-resolution SWISSIMAGE orthophotos (Swisstopo, 2023b); the comparison shows no systematic bias and comparable agreement across all six glaciers, including the less-constrained polythermal sites (Sect. 3.1). From the annual firn cover maps we computed the time since firn loss for each cell.
4.1 Seasonal temperature variations and meltwater signals
Tinytag sensors installed in 2024 recorded nearly a full annual temperature cycle at all six sites (Fig. 3). Over the measurement period, surface melt thinned the ice above each sensor, so that effective sensor depths changed between installation (Zinit) and retrieval (Zfinal). For simplicity, all depths stated in the following refer to the installation depth. The reduction in effective depth ranged from approximately 0.4 m to more than 2 m, meaning that sensors progressively sampled shallower ice over the course of the measurement period. We expect this to result in slightly larger observed seasonal amplitudes. Unless stated otherwise, reported temperatures carry an uncertainty corresponding to the calibrated sensor accuracy, ±0.2 °C for the Tinytag and ±0.05 °C for the Geoprecision sensors. Seasonal temperature amplitudes varied by more than two orders of magnitude across sensors and sites, with the largest recorded amplitude of 3.64 °C at Tortin (GT1TT, 4.2 m), the smallest of 0.03 °C at Hohsaas (HS1TT, 15.6 m). As expected, amplitudes decreased systematically with depth and the temperatures at depths of 10 to 15 m lagged roughly six months behind the surface (Fig. 3a–d), meaning that the lowest temperatures occurred in the summer, the highest in winter.
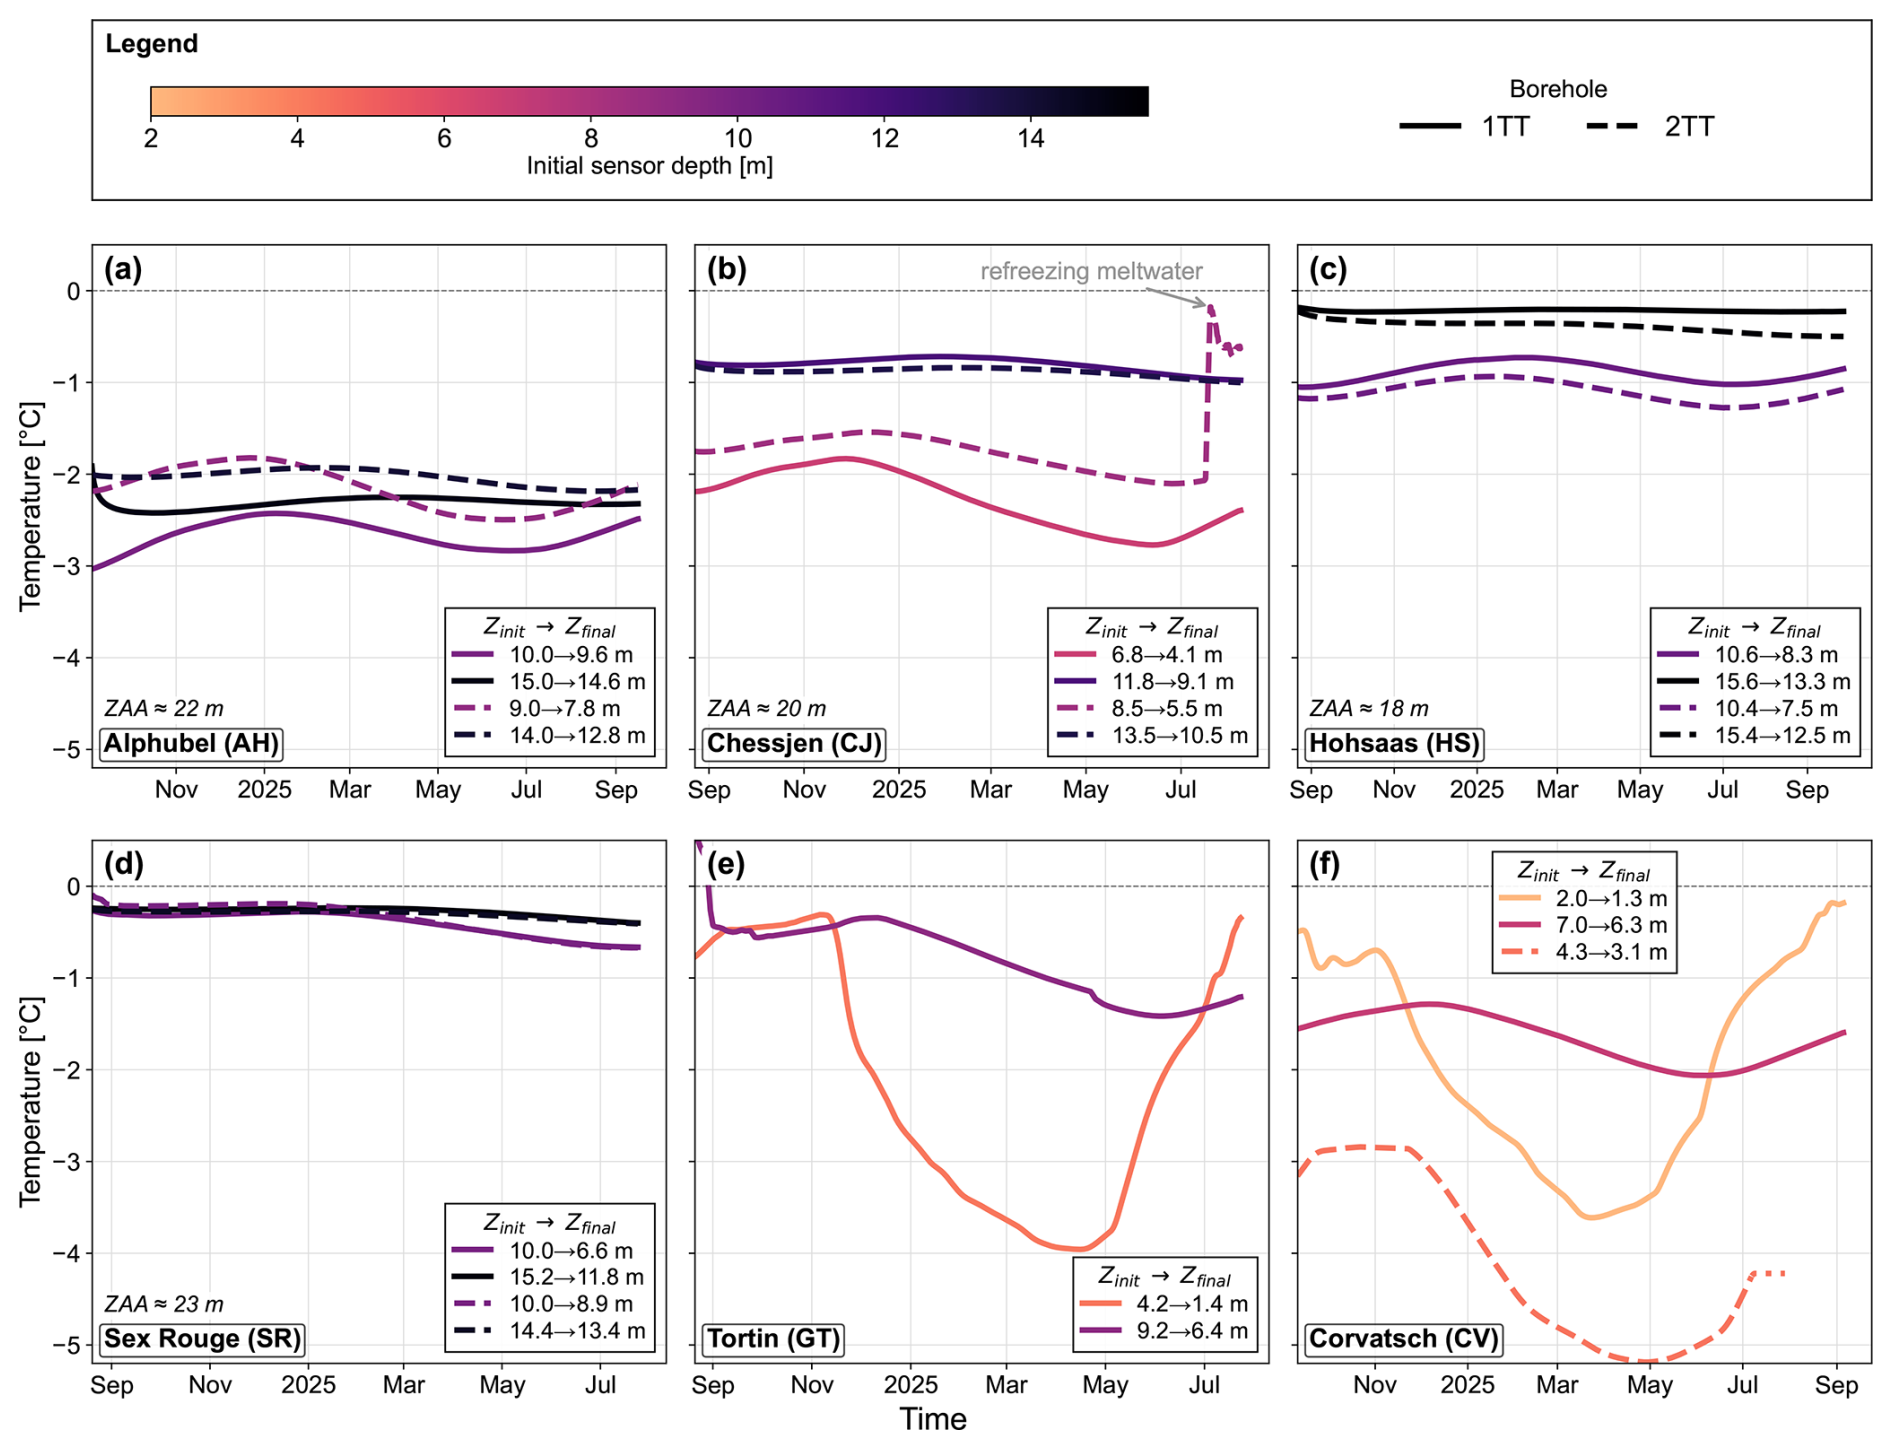
Figure 3Seasonal evolution of englacial temperature at all six study sites from August 2024 to September 2025. Line color indicates initial sensor installation depth, with solid lines denoting Tinytag borehole 1 (1TT) and dashed lines borehole 2 (2TT). For Glacier de Tortin, only borehole 1 is shown due to calibration issues affecting borehole 2. Each panel lists sensor installation depth (Zinit) and depth at last readout (Zfinal). At CV2TT the lower sensor failed during the measurement period and is thus not shown. Where the seasonal amplitude at the deepest sensor was sufficiently small, the ZAA is indicated.
At Alphubel, Chessjen, Hohsaas, and Sex Rouge, temperatures showed no sign of approaching 0 °C at the instrumented depths (6.8–15.4 m), suggesting that the winter cold wave could not be compensated for during summer. Two sensors are exceptions to this: SR2TT (10 m) and HS1TT (15.6 m), whose temperature maxima (−0.18 and −0.1 °C, respectively) fall within the ±0.2 °C sensor accuracy, meaning temperate conditions at these depths are likely. Shallow sensors at Tortin and Corvatsch were trending toward 0 °C by the end of the observation period and are most likely approaching temperate conditions later in the year. The final readout was conducted before the 2025 summer warming signal had fully propagated through the ice column. GT1TT (4.2 m) and CV1TT (2.0 m) are therefore expected to reach their annual maximum during or shortly after the melt season, while sensors at 10 to 15 m depth likely do so between December and March.
At Chessjen, Hohsaas, and Sex Rouge, mean temperatures increase with depth. Temperatures at greater depth are 1.2–1.5 °C warmer than those nearer the surface at Chessjen, 0.6–0.9 °C warmer at Hohsaas, and approximately 0.1 °C warmer at Sex Rouge. This distinction is less obvious at Alphubel, where mean temperatures appear to vary more with borehole position than with depth, ranging from −2.0 to −2.2 °C at AH2TT (the upper borehole) and from −2.3 to −2.7 °C at AH1TT further downslope. At Alphubel, Chessjen, Hohsaas, and Sex Rouge, where the deepest sensors exhibit amplitudes below 0.3 °C, we estimated the depth of zero annual amplitude (ZAA; see Sect. S2.7) to range from 18 m at Hohsaas to 23 m at Sex Rouge (see annotation in panels a–d).
Short-term temperature jumps are visible in both the Tinytag and Geoprecision time series data at Alphubel and Chessjen. At CJ2TT, the shallow sensor recorded an abrupt warming of 1.64 °C on 18–19 July (Fig. 3b), and at Alphubel, the second-highest borehole (AH1G) showed a temperature jump of approximately 0.15 °C on 17–18 August (Fig. S14a). Since these events occurred during the melt season and have transient character, we interpret them as the effect of englacial meltwater, likely routed via crevasses and englacial channels. The resulting temperature jumps reflect heat input to the surrounding ice, through direct exchange with liquid water, latent heat release upon refreezing, or both – processes central to the thermal structures discussed in Sect. 4.3.
4.2 Decadal changes of englacial temperatures at Sex Rouge and Corvatsch
The availability of previously published borehole data at Sex Rouge and Corvatsch provides a rare opportunity to investigate how englacial temperatures at these sites have evolved over decadal timescales (Fig. 4). The earlier measurements represent multiple, single-day snapshots, while our data comprise a full annual time series. To compare, we extracted the matching days of the year from our time series for each prior measurement date. Matching the day of year controls for the seasonal phase of the signal but not for inter-annual weather variability, which still influences temperatures within the seasonally affected zone sampled here. We therefore compare the historical single-day measurements against the full modern annual range at each depth (min-max envelope in Fig. 4), and interpret differences within the seasonal zone in terms of the broader thermal structure and its evolution rather than as precise climatic-trend magnitudes.
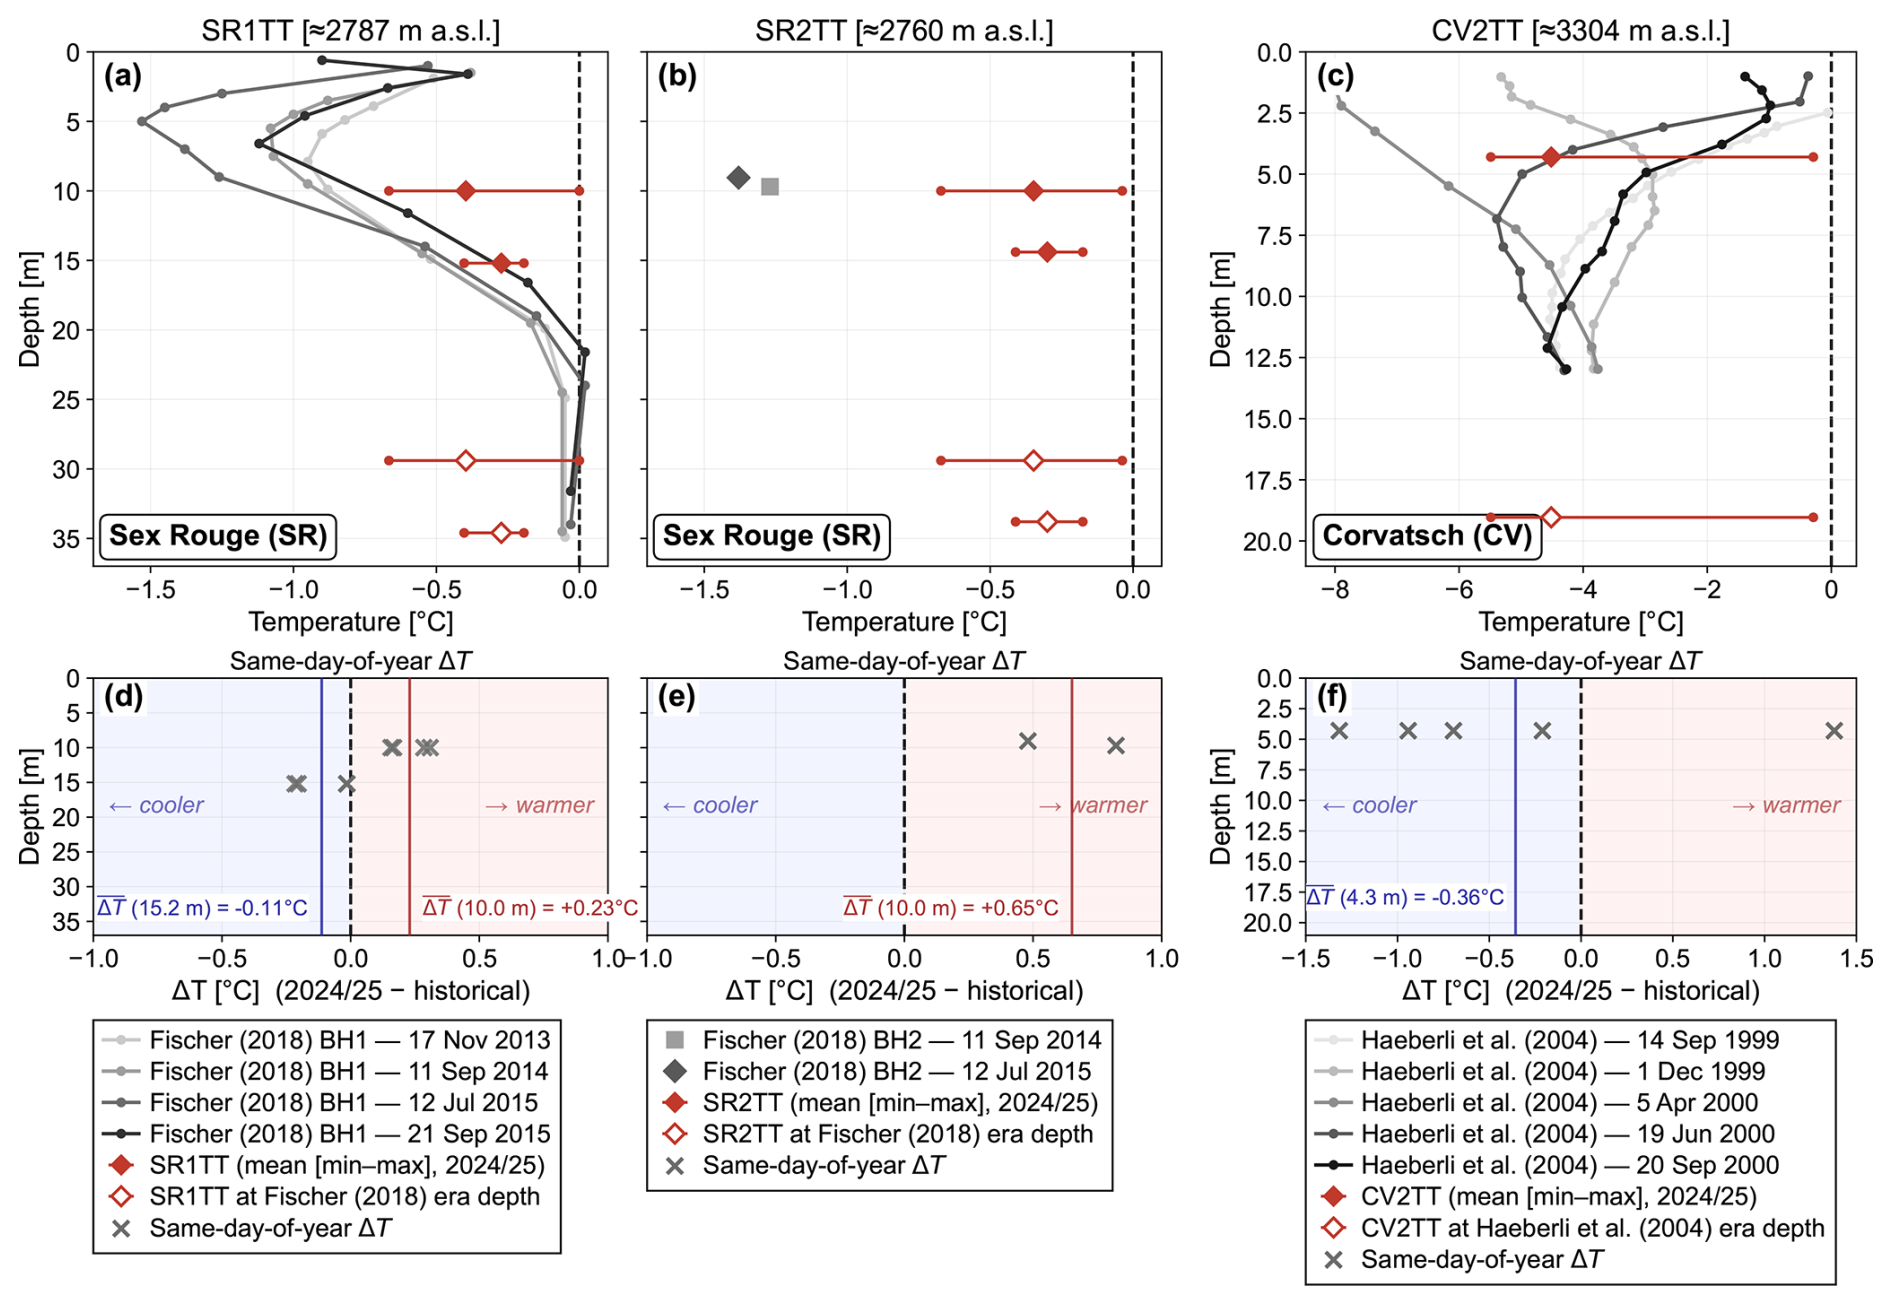
Figure 4Englacial temperature profiles at Sex Rouge and Corvatsch compared with historical borehole data. (a) SR1TT versus four repeated profiles from BH1 by Fischer (2018). (b) SR2TT versus two single-point measurements from BH2 by Fischer (2018). (c) CV2TT versus five profiles by Haeberli et al. (2004). Red diamonds indicate the time-averaged temperature at each sensor depth over the August 2024–September 2025 measurement period; horizontal bars show the observed min–max range. (d–f) Temperature difference relative to historical measurements, computed by matching each historical snapshot to the same calendar day in our 2024/25 record; vertical lines indicate the mean difference at each sensor depth.
At Sex Rouge, Fischer (2018, data from 2013–2015) documented a polythermal structure with a cold surface layer of approximately 20 m overlying a temperate core. We also found a persistent cold surface layer with a strong temperature gradient trending to 0 °C with depth (Fig. 4a and b), suggesting that this polythermal structure likely still persists today. Relative to the 2013–2015 measurements, temperatures at 10 m rose by 0.65 °C at SR2TT and by 0.23 °C at SR1TT, while at 15.2 m temperatures fell by 0.11 °C at SR1TT, remaining within sensor accuracy (±0.2 °C). However, with approximately 20 m of surface ice lost through ablation since 2013 (GLAMOS – Glacier Monitoring Switzerland, 2025), our sensors sample ice that was located considerably deeper during the earlier measurement period. The hollow red diamonds in Fig. 4 show our current temperatures projected to their estimated depths at the time of the prior measurements, illustrating this reference-frame shift. This vertical shift complicates our interpretations. The observed signal reflects the effects of downward cold wave penetration and surface removal of cold ice through ablation, rather than atmospheric forcing alone. These competing drivers are discussed further in Sect. 5.1.
At Corvatsch, Haeberli et al. (2004) documented cold-based conditions with temperatures of approximately −4 °C at 13 m depth in 1999/2000. The glacier has since thinned to a point where the entire ice column, now only 9.3 m thick (as of 2026), is subject to seasonal temperature fluctuations (Fig. 3f). Temperatures at 4.3 m depth exhibit a clear seasonal cycle but remain sub-zero throughout the year, indicating that summer warming is insufficient to bring the ice to the melting point. Our measured temperatures at 4.3 m depth were on average −0.36 °C colder than the measurements at comparable depths from Haeberli et al. (2004). The lower sensor reached the bed at 9.3 m but failed during equilibration, recording −1.3 °C with temperatures still declining at the time of failure, suggesting the bed remains cold today. Among the six study sites, Corvatsch occupies a unique topographic position on a narrow ice ridge. The ridge geometry limits snow accumulation and firn formation while exposing both flanks to lateral conductive heat loss, providing an additional cooling pathway beyond surface forcing alone (Haeberli et al., 2004). The persistently cold conditions observed here are therefore at least partly a consequence of this inherently cold topographic setting, alongside the long firn-free history of the site, discussed further in Sect. 5.1.
4.3 Polythermal sites (Alphubel, Chessjen, Hohsaas)
Because deep boreholes reaching the glacier bed were drilled only at Alphubel, Chessjen, and Hohsaas (Sect. 3.2.1), the following analysis of the full vertical thermal structure is limited to these three sites. The shallow (≤15 m) boreholes at Corvatsch, Sex Rouge, and Tortin sample only the seasonally influenced near-surface layer. At all three deep-drilled sites, englacial temperature profiles reveal polythermal conditions (Figs. 5–7), with a recurring spatial pattern: a temperate core in the upper reaches transitioning to partially and fully cold-based conditions near the terminus.
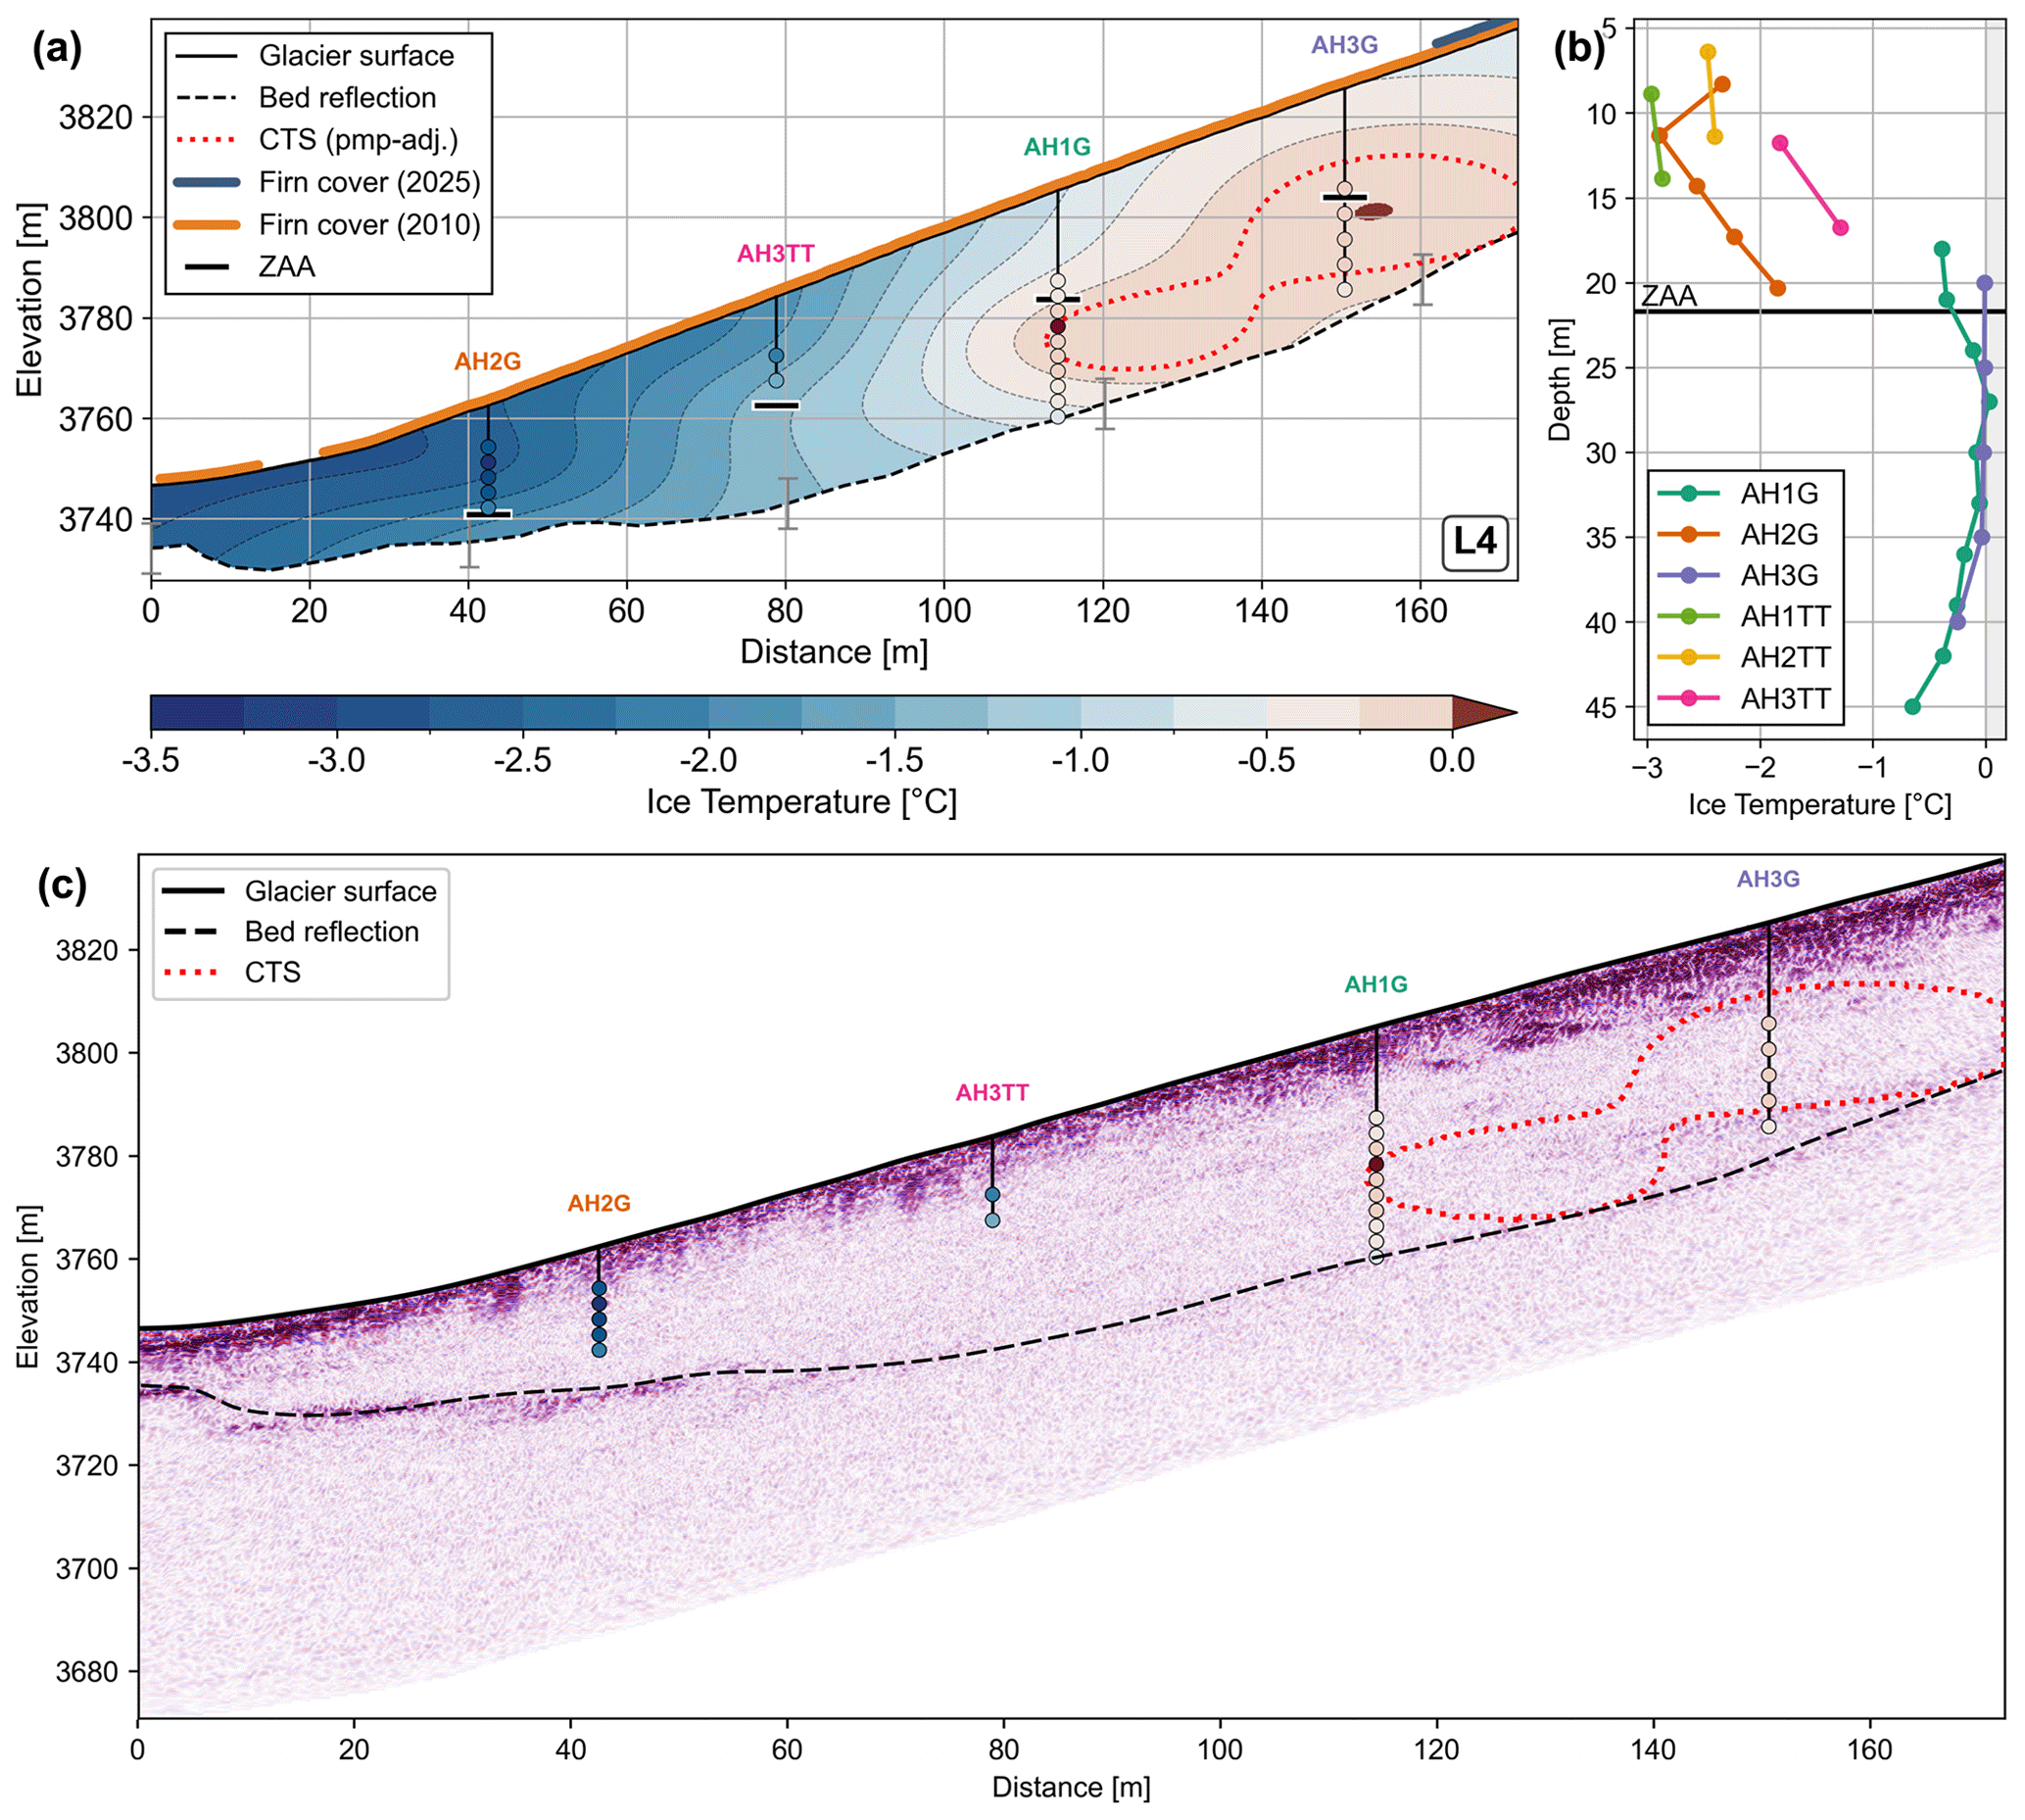
Figure 5Englacial temperature structure and radar reflectivity along Alphubel profile L4 (for profile location, see Fig. 1b). (a) Interpolated englacial temperature field derived from borehole measurements. Temperatures at AH1G–AH3G and AH3TT are averaged over the period 10 August–16 September 2025; AH1TT–AH2TT over September 2024–September 2025. Modeled firn cover extent is shown for 2010 (orange) and 2025 (blue). Whiskers along the bed denote ±5 m bedrock-depth uncertainty. Black ticks along each borehole mark the depth of zero annual temperature amplitude (ZAA), below which seasonal temperature variations become negligible. (b) Vertical temperature profiles for all boreholes; the gray-shaded area marks temperatures above 0 °C, and the solid black line marks the ZAA depth. (c) Depth radargram along profile L4 with borehole positions and the CTS derived from the interpolated temperature field.
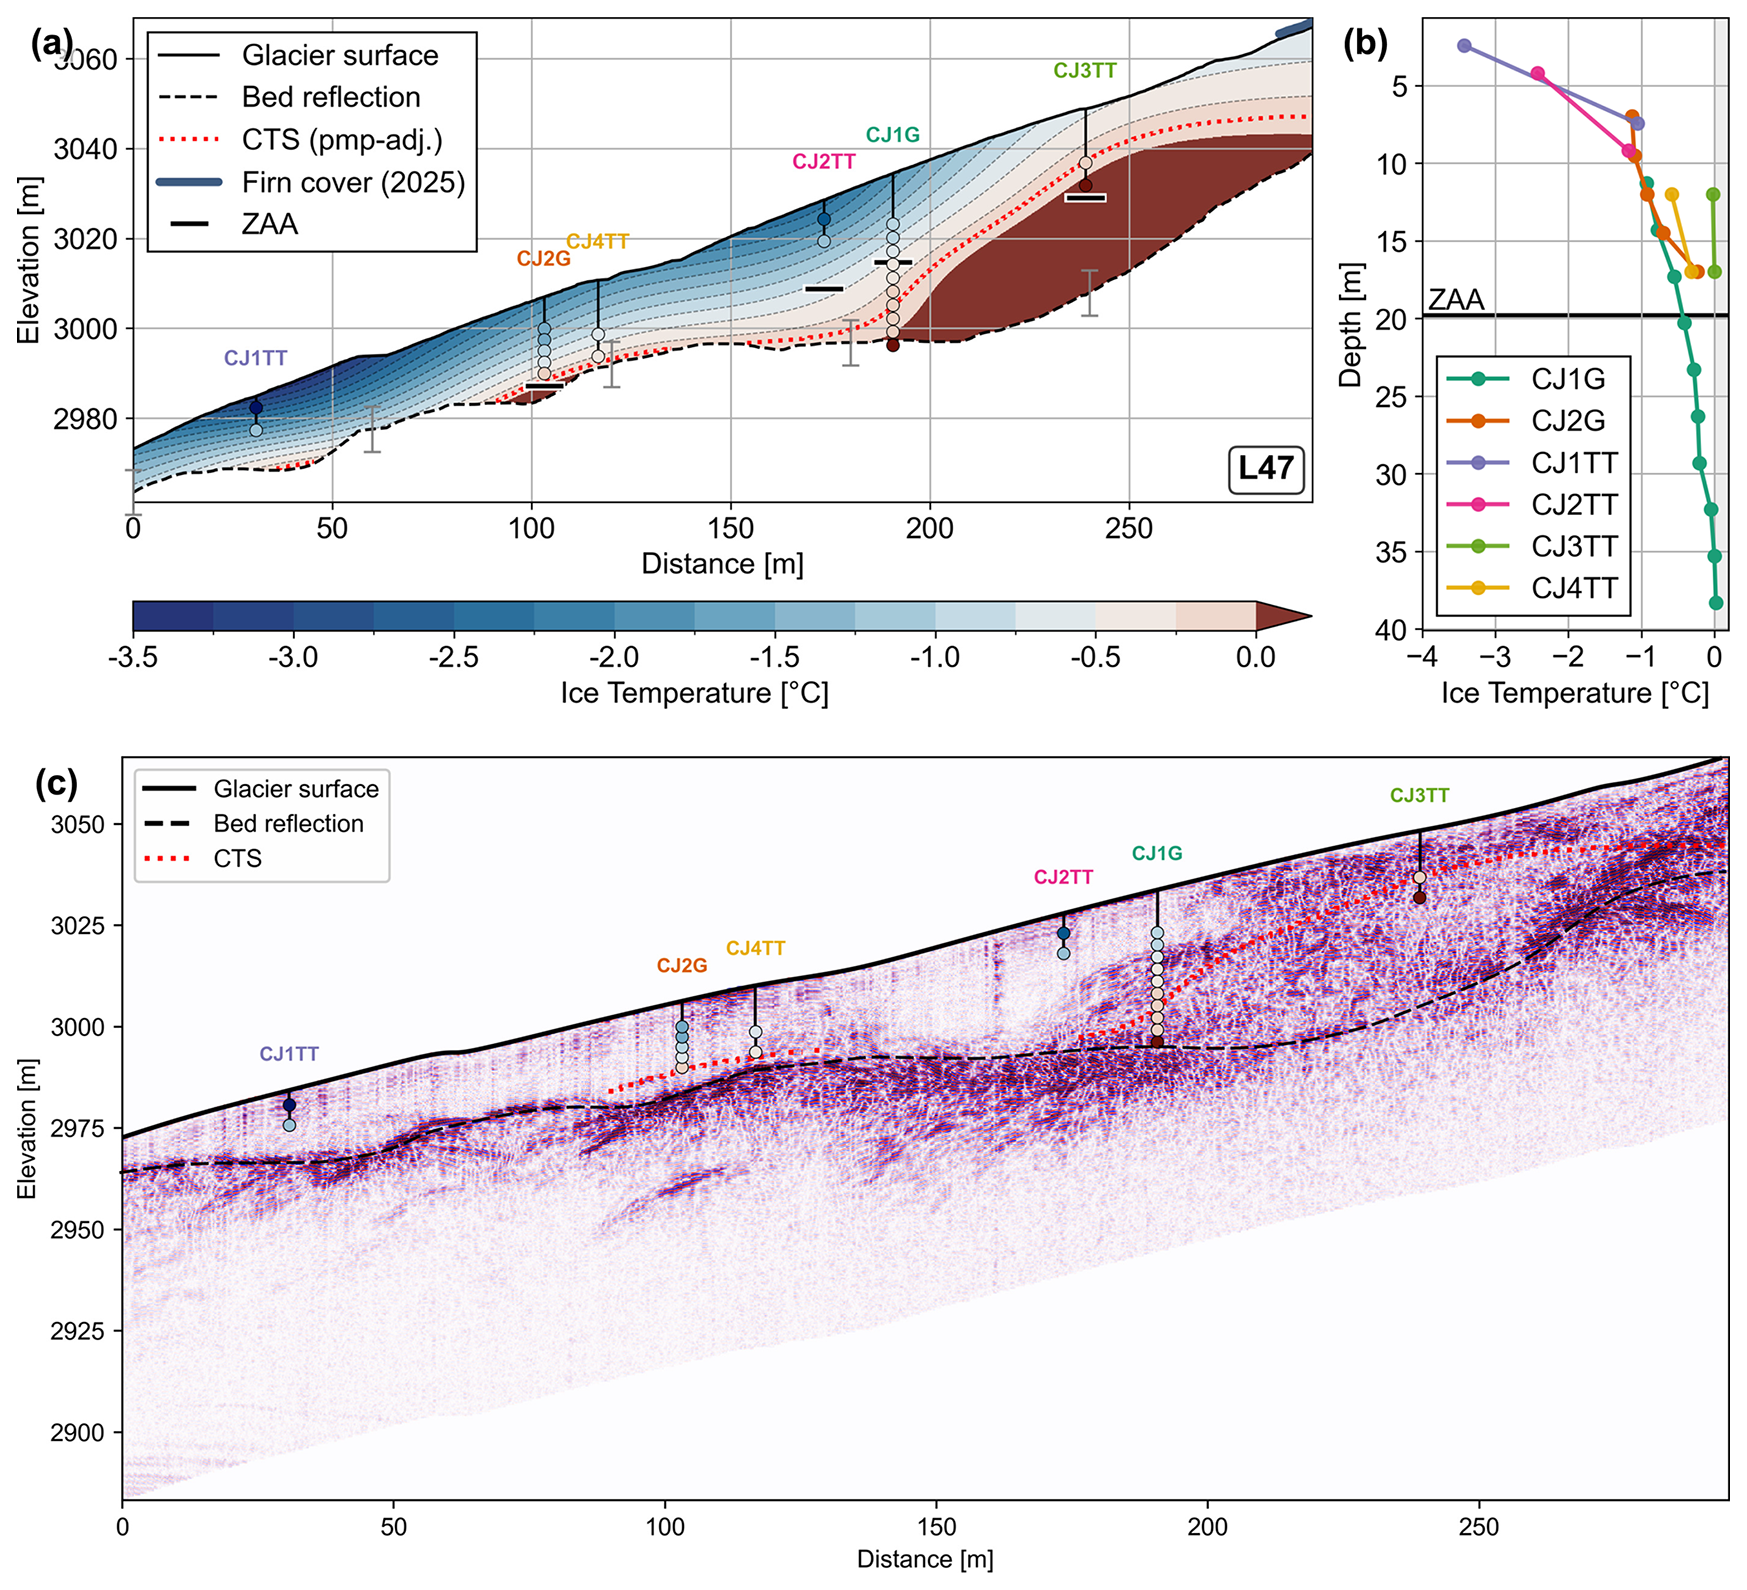
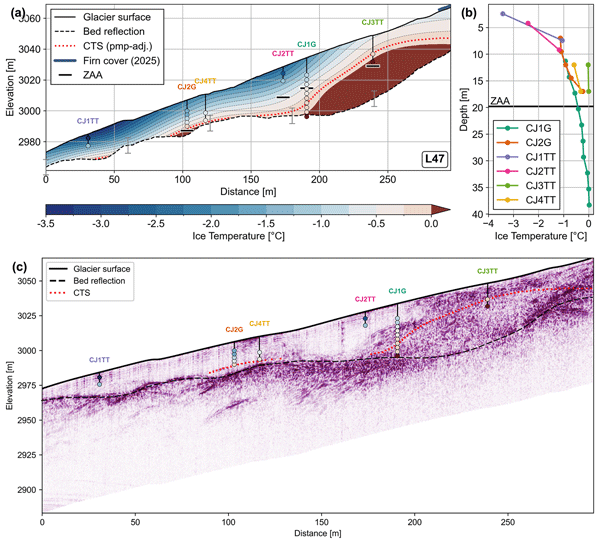
Figure 6Englacial temperature structure and radar reflectivity along Chessjen profile L47 (for profile location, see Fig. 1c). (a) Interpolated englacial temperature field derived from borehole measurements. Temperatures at CJ1G, CJ2G, CJ3TT, and CJ4TT are averaged over the period 8 August–3 September 2025; CJ1TT and CJ2TT over September 2024–September 2025. Modeled firn cover extent is shown for 2025. In the year 2010 no firn was present at Chessjen. Black ticks along each borehole mark the ZAA depth. (b) Vertical temperature profiles for all boreholes; the gray-shaded area marks temperatures above 0 °C, and the solid black line marks the ZAA depth. (c) Depth radargram along profile L47 with borehole positions and the CTS derived from the interpolated temperature field.
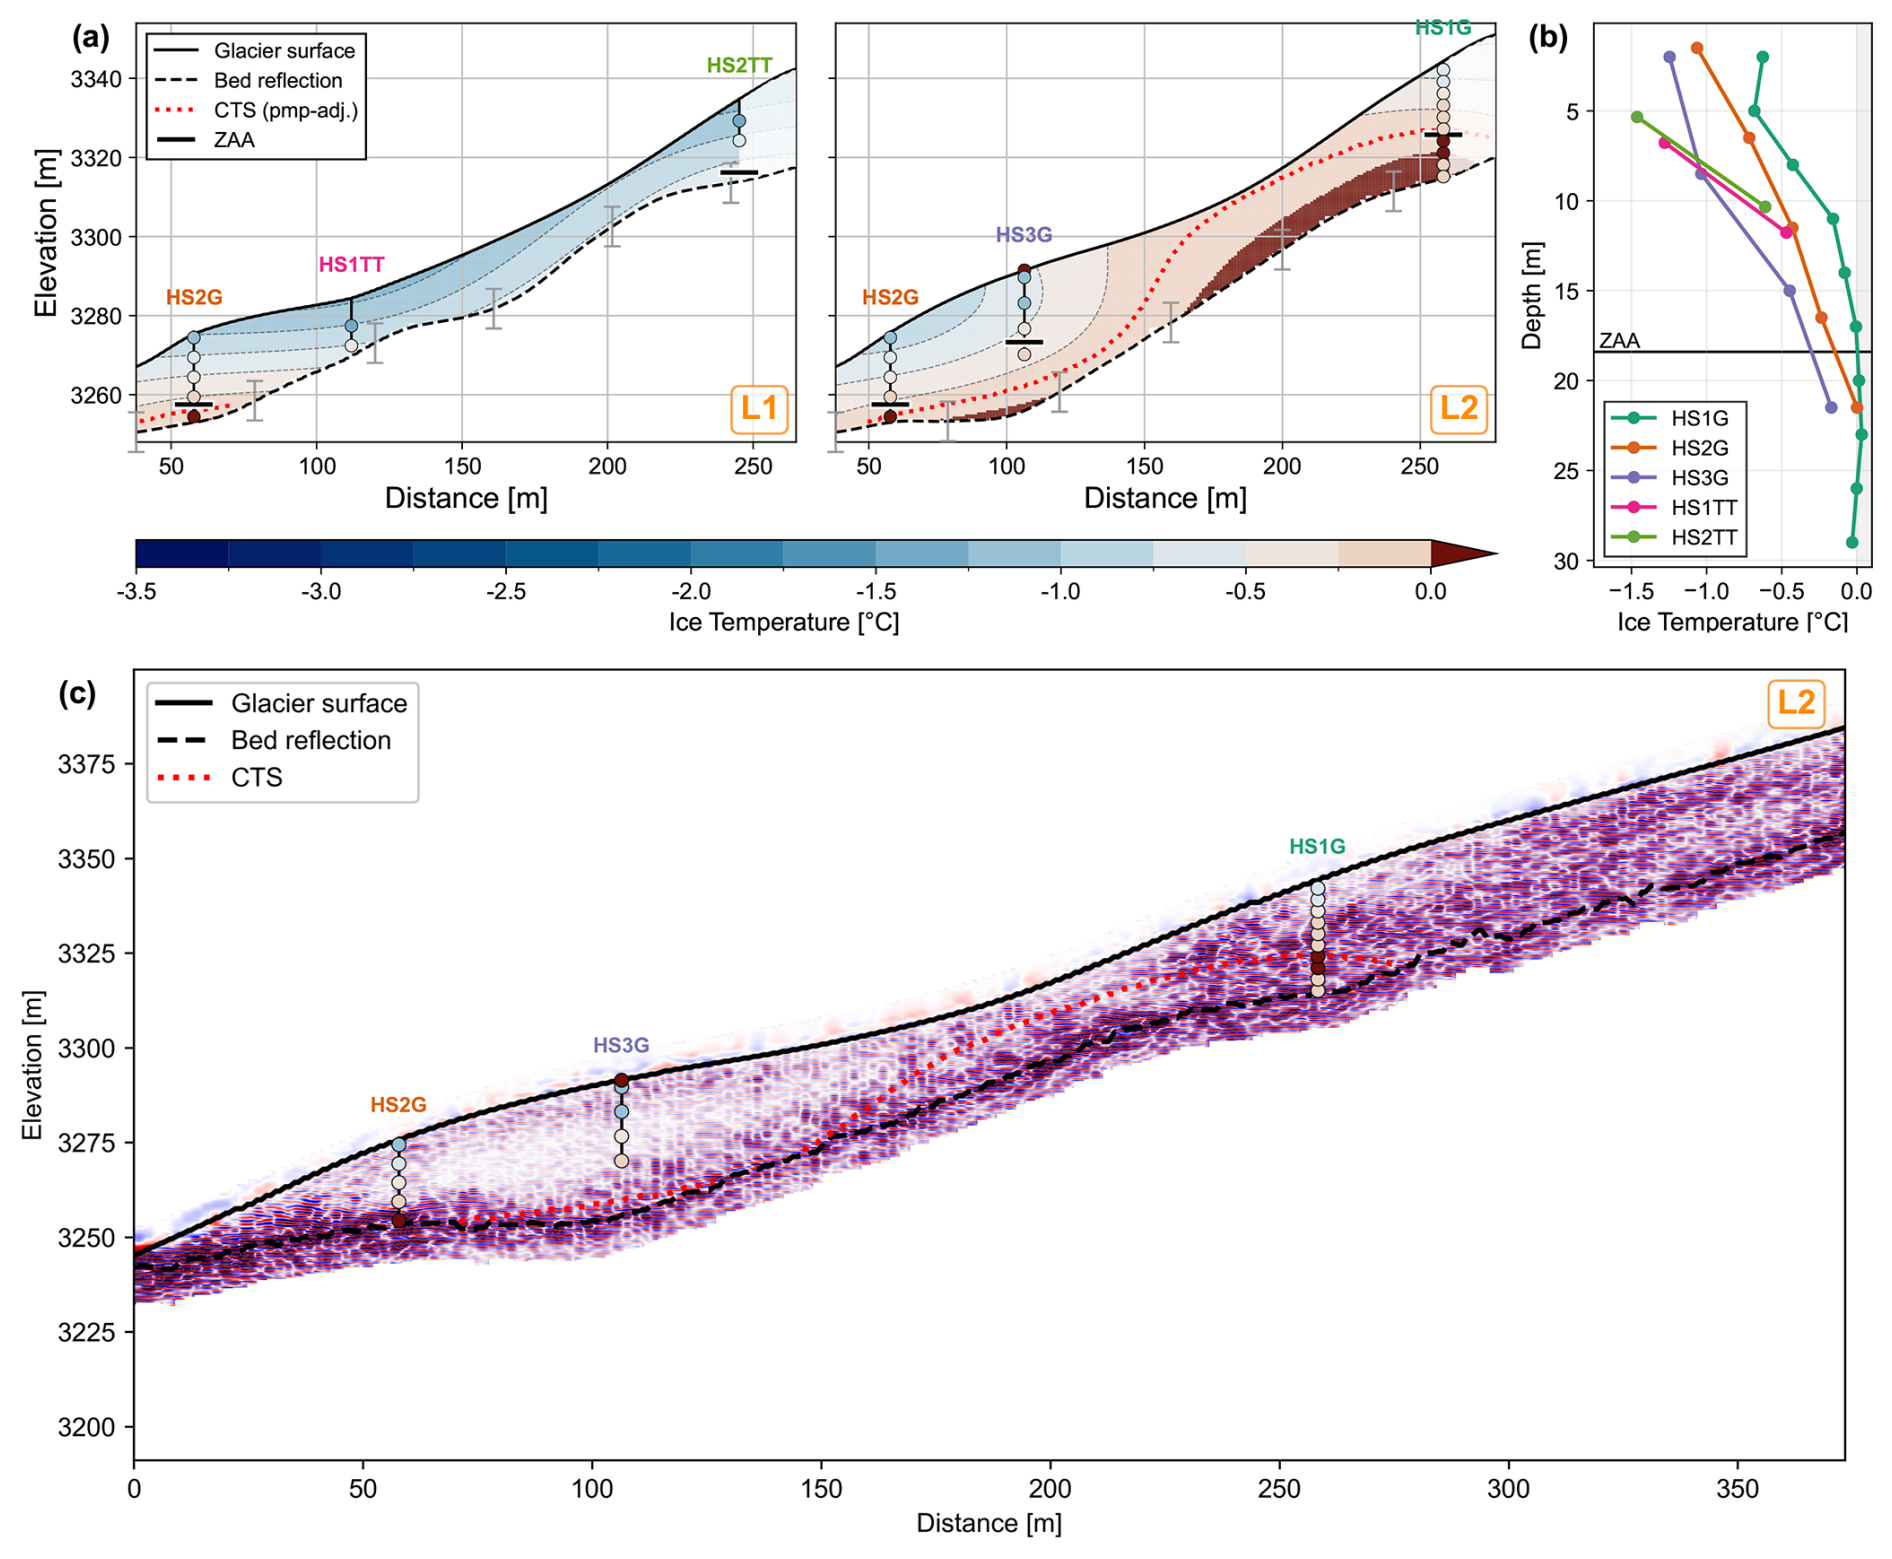
Figure 7Englacial temperature structure and radar reflectivity at Hohsaas. (a) Interpolated temperature fields along profiles L1 (left) and L2 (right) (for profile location, see Fig. 1d). Temperatures at HS1G, HS2G, and HS3G are averaged over the period 13 August–27 September 2025; HS1TT and HS2TT over September 2024–September 2025. Whiskers along the bed denote ±5 m bedrock-depth uncertainty. Black ticks along each borehole mark the ZAA depth. (b) Vertical temperature profiles for all boreholes (HS1G, HS2G, HS3G, HS1TT, HS2TT); the gray-shaded area marks temperatures above 0 °C, and the solid black line marks the ZAA depth. (c) Depth radargram along profile L2 with borehole positions and the CTS derived from the interpolated temperature field.
In all three glaciers, we determined the CTS to be at relatively shallow depths of 17–20 m in the upper reaches, while ice near the termini was found to be predominantly cold (Figs. 5a, 6a, and 7a, b). At Alphubel, temperate ice was confirmed between 25 and 33 m depth at AH1G and between 20 and 25 m at AH3G, with the transition to cold conditions occurring approximately 110 m upstream of the terminus (Fig. 5a). Notably, in both AH1G and AH3G, temperatures approach 0 °C at intermediate depths but drop below 0 °C again toward the bed, suggesting the temperate zone forms a sort of core zone. As neither AH1G nor AH3G have sensors shallower than 17 m, the cold ice overlying the temperate zone is not directly sampled but is assumed to correspond to the seasonally influenced surface layer (Sect. 4.1). At Chessjen, the CTS was identified at the two higher-elevation boreholes (CJ1G and CJ3TT) at depths of 17 to 38 m, with the CTS descending toward the bed approximately 180 m upstream of the terminus, beyond which cold conditions dominate throughout (Fig. 6a). At Hohsaas, the CTS was identified at a depth of 20 m at the higher-elevation borehole (HS1G), from where it rises toward the surface and remains shallow (0–5 m) down-glacier until approximately 150 m from the terminus, where it begins to descend toward the bed. At the northern profile L1, the ice becomes progressively thinner and colder, suggesting a more laterally extensive cold zone in this part of the glacier (Fig. 7a).
Despite a broadly similar thermal structure across the three sites, basal conditions differ. At Alphubel, bed temperatures remained cold throughout, reaching as low as −2.1 °C at the terminus. At Chessjen, CJ2G reached the bed at 17 m depth, confirming temperate conditions in early August 2025, but cooled to −0.43 °C by mid-December (Fig. S15b). We interpret this as a seasonally evolving basal thermal regime: meltwater sustains temperate conditions through summer, while basal refreezing occurs once melt ceases in autumn. At Hohsaas, HS2G confirmed temperate basal conditions close to the terminus despite cold conditions in the overlying ice column, though basal coverage between HS2G and HS1G remains limited.
To complement the point measurements from the boreholes with a spatially continuous view of the thermal structure, we next consider the radar profiles. The GPR profiles at all three sites are broadly consistent with the borehole-derived thermal conditions, though the degree of agreement varies. At Alphubel (Fig. 5c), the profile shows a substantially cleaner signal than at the other two sites, with little scattering even in the area where boreholes confirmed temperate ice. This difference is at least partly attributable to survey timing: unlike the late-summer surveys at Chessjen and Hohsaas (August–September), the Alphubel GPR survey was conducted at the end of winter in mid-May (Fig. S2). At this time of year and at 3800 m a.s.l., liquid water is expected to be at its seasonal minimum regardless of thermal state, potentially suppressing scattering that would otherwise indicate temperate ice. Still, the clean signal below the seasonally influenced layer suggests limited englacial water content at depth, supporting the cold bed interpretation derived from the borehole temperatures. At Chessjen (Fig. 6c), the scattering pattern corresponds well with the interpolated temperature field. Radar scatter is high throughout the temperate zone up-glacier and diminishes toward the terminus below CJ1G. Notably, scattering extends to the glacier surface in the upper part of the profile, suggesting the ice column is temperate throughout and that the CTS detected here reflects the seasonal penetration depth of the winter cold wave rather than a stable year-round thermal boundary. At Hohsaas (Fig. 7c), a qualitatively similar pattern is observed, with increased scattering around the upper borehole HS1G and a largely clean signal in the cold terminus. At both Chessjen and Hohsaas, enhanced near-bed scattering suggests that temperate basal conditions are likely more extensive than the borehole network resolves.
While polythermal glacier structures can arise through a variety of mechanisms (Irvine-Fynn et al., 2011), the consistent pattern observed across all three sites, with temperate ice confined to higher elevations and cold conditions prevailing toward the terminus, points to a shared underlying control on englacial heat distribution, a point that we further examine in the following.
5.1 Firn cover loss as primary control on the thermal structure of small glaciers
Temperate ice within glaciers can be generated or sustained by several heat sources, including geothermal heat flux, strain heating associated with ice flow, latent heat release from refreezing of percolating meltwater, and advection of temperate ice from upstream (Cuffey and Paterson, 2010; Wilson and Flowers, 2013; Oerlemans, 2013; Gilbert et al., 2020; Law et al., 2021; Karlsson et al., 2021; Raspoet and Pattyn, 2025). The glaciers investigated here are all small (<0.5 km2), meaning that internal heat production from strain heating is expected to be limited (Huss and Fischer, 2016), consistent with the low surface displacement rates observed at all sites (Table S17). Since the temperate ice identified here lies in the uppermost reaches of each glacier, where no upstream ice input exists, advection from upstream can also be ruled out as a means of supplying temperate ice. Geothermal heat flux in the region is modest (<80 mW m−2; Medici and Rybach, 1995) and, as a basal heat source, cannot account for the temperate conditions observed throughout substantial portions of the ice column at these sites.
Instead, we believe that the observed thermal structure is primarily controlled by firn cover distribution and its temporal evolution. Firn acts as a meltwater reservoir, retaining water that percolates to depth, refreezes, and releases latent heat, warming the underlying ice and sustaining temperate conditions (Gilbert et al., 2012; Huss and Fischer, 2016; Gastaldello et al., 2025). The densification of temperate firn into glacier ice provides an additional, if secondary, supply of temperate ice to the system. Where firn is absent and meltwater runs off, both of these heat sources are lost and the ice can cool. This process chain is supported by modeling studies showing that meltwater refreezing and entrapment can dominate the internal heat budget of small polythermal glaciers, making the thermal structure highly sensitive to changes in surface melt and firn availability (Gilbert et al., 2012; Wilson and Flowers, 2013; Gilbert et al., 2014).
To examine the role of firn cover as a control on englacial thermal structure, we reconstructed its evolution across the six studied glaciers from the 1970s until today using modeled annual mass balance distribution constrained with GLAMOS mass balance data (Huss et al., 2015; GLAMOS – Glacier Monitoring Switzerland, 2025). Across the six sites, firn-free durations at the borehole locations span from less than a decade at Alphubel to more than three decades at Sex Rouge, Tortin and Corvatsch, providing a range of exposure histories against which to assess the thermal response to firn loss (Fig. 8).
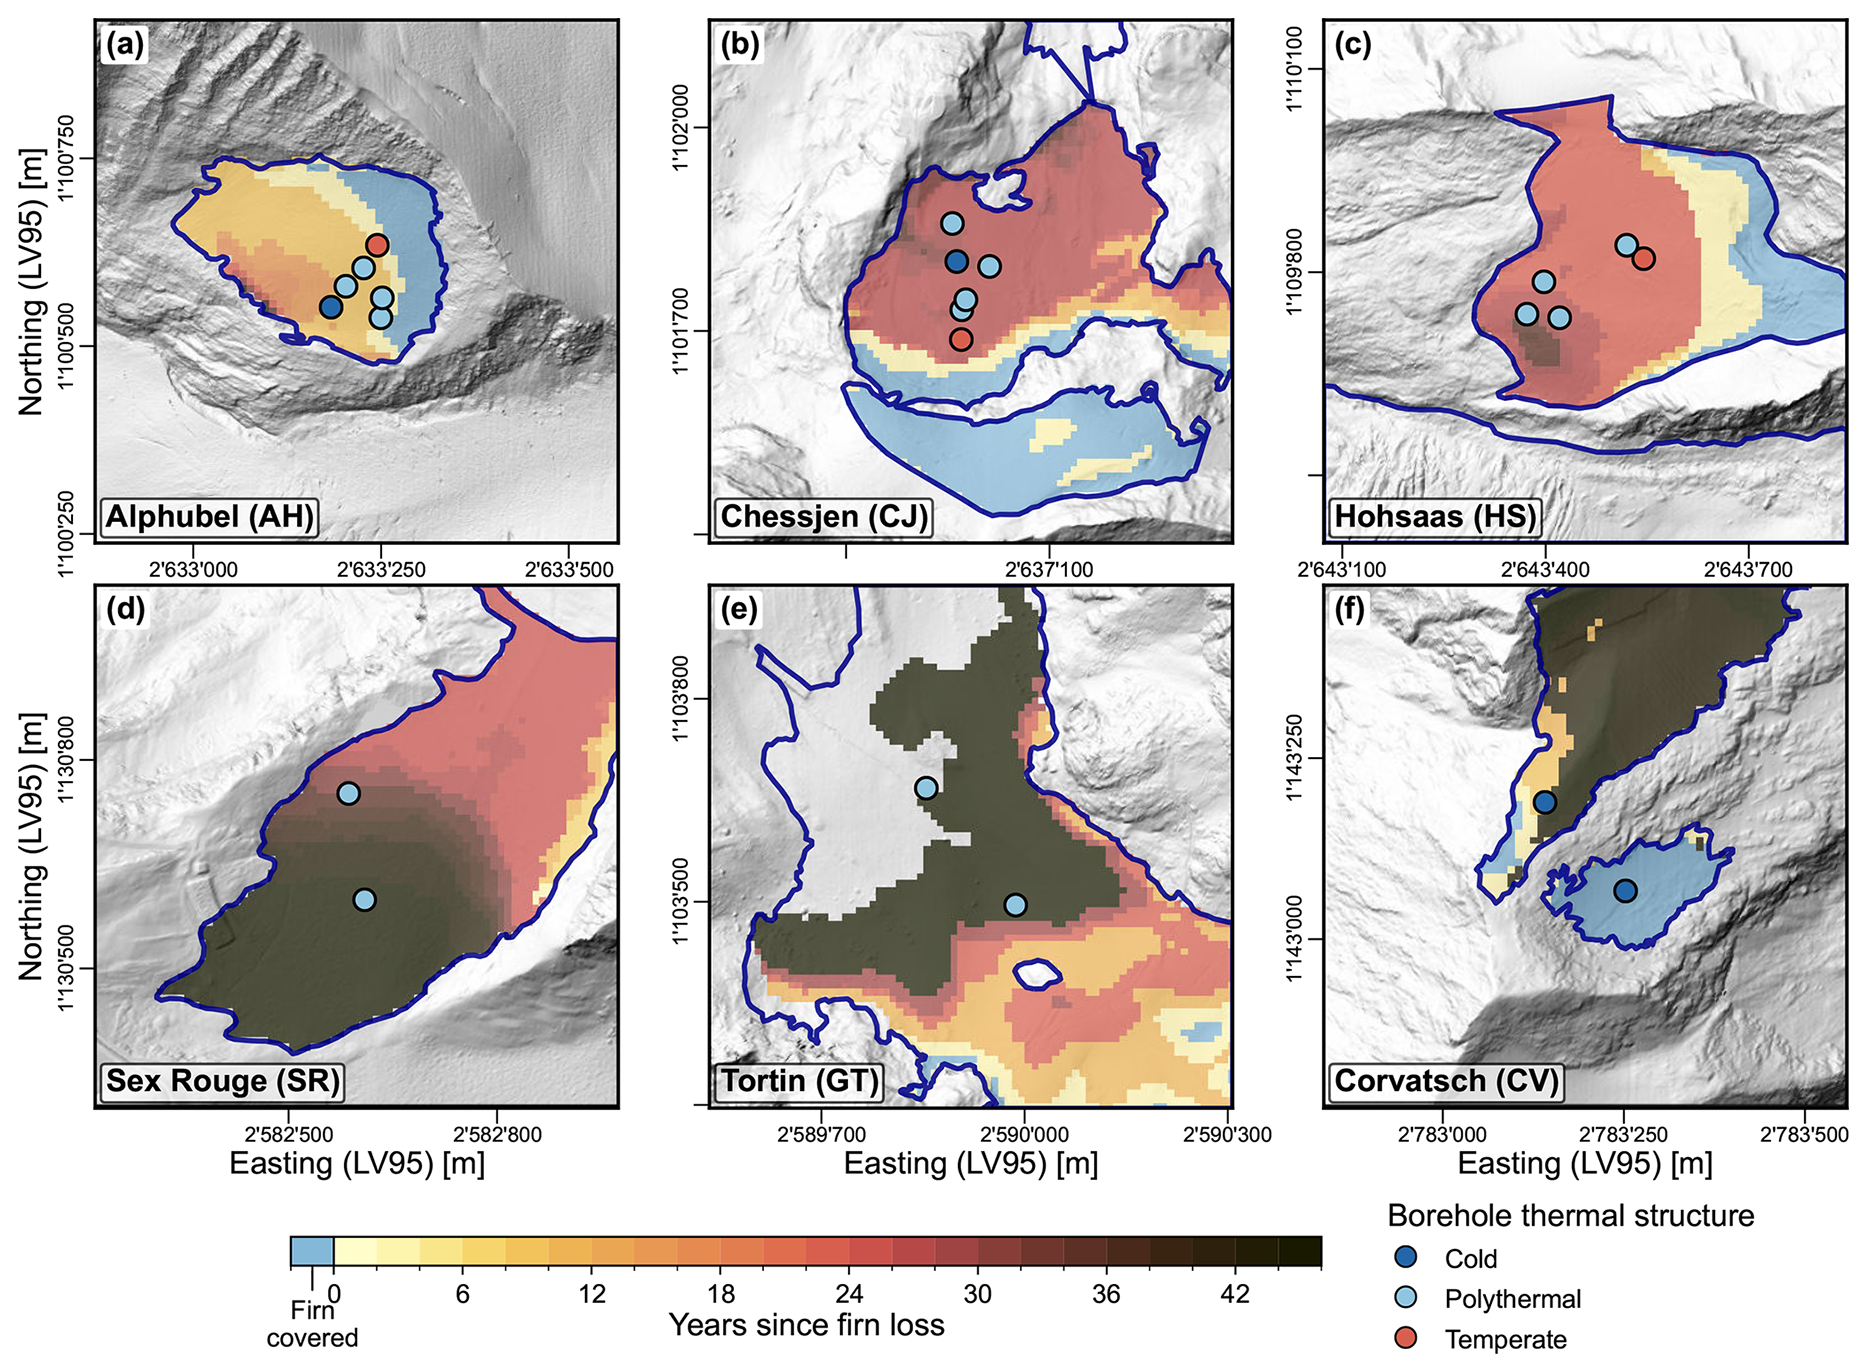
Figure 8Number of years a given area was firn-free, mapped across all six study glaciers and draped over a shaded-relief DEM (Swisstopo, 2023a). Darker colors indicate longer firn-free periods (prior to 2025). The 2025 firn cover extent is indicated in light blue. Grid cells which have been part of the ablation area over the entire time series (1970–2025) are masked out. Borehole colors indicate thermal regime: dark blue = cold (entire ice column frozen to the bed); light blue = polythermal; red = temperate. The blue line marks the SGI2023 outline.
Firn-free exposure broadly reflects the thermal state across the six sites, with longer firn-free histories associated with more advanced cooling. The clearest examples are Sex Rouge and Corvatsch, both firn-free for more than three decades, where cold surface conditions prevail throughout the measured depth range. At Sex Rouge, the apparent near-surface warming relative to previous measurements (Sect. 4.2) is most plausibly explained by surface ablation removing cold ice from above rather than a genuine change in thermal forcing. At Tortin, where borehole locations have similarly been firn-free for more than 30 years, shallow measurements alone are insufficient to characterize the full thermal structure.
At Chessjen and Hohsaas, the spatial pattern of time since firn loss broadly reflects the glacier's thermal structure, with the CTS deepest in areas that lost firn earliest, suggesting the up-glacier retreat of the firn line has left a spatial imprint on the thermal regime. At both sites, firn-free duration increases down-glacier, ranging from approximately 15–20 years at the uppermost borehole positions to 25–30 years toward the terminus. That temperate ice nonetheless persists beneath the upper reaches, despite one to two decades without firn, reflects the slow pace of conductive cooling combined with continued heat input. Conductive cooling of a temperate layer tens of meters thick proceeds on a timescale of decades (Cuffey and Paterson, 2010; Gilbert et al., 2012, 2014); over the firn-free period, the cold front driven by firn loss would be expected to penetrate roughly 20–25 m, broadly consistent with, though slightly deeper than, the 17–20 m CTS depths observed. That temperate ice is preserved to somewhat shallower depths than conduction alone would predict points to additional heat input. Two mechanisms contribute. First, the downward migration of the cold front is slowed by the latent heat released as residual pore water in the temperate ice refreezes ahead of it, so that temperate conditions persist longer than pure conduction would imply. Second, meltwater delivery to the firn-free temperate zone has likely not ceased: at both sites, patches of firn persist in the highest reaches of the glacier, up-glacier of the borehole network (Fig. 8), and bergschrunds and crevasses provide englacial entry points for meltwater draining from these still firn-covered areas into the temperate zone below, sustaining it through latent-heat release. At Chessjen, the transient temperature jump observed in mid-July (Sect. 4.1) provides indirect support that such pathways remain active.
The situation at Alphubel is more nuanced. While the firn-free terminus is cold and the firn-covered upper glacier is temperate, consistent with the pattern seen at Chessjen and Hohsaas, the underlying thermal history likely differs. The largely cold-based terminus is difficult to reconcile with a firn-free period of only 5–10 years, and the cold-temperate-cold vertical structure observed, where a temperate layer is sandwiched between a cold surface layer and a cold bed, suggests a fundamentally different thermal history at this site. Historical imagery from 1930 shows Alphubel as a much thicker hanging glacier with a prominent frontal break-off (Fig. S18), a morphology more characteristic of cold or polythermal high-elevation hanging glaciers with limited basal sliding (Gilbert et al., 2015). This is in contrast to the much larger valley glacier systems represented by Chessjen and Hohsaas, as documented in the historical imagery. We therefore interpret the cold terminus as largely predating the current period of firn loss, with the temperate core in the upper glacier representing a relatively recent feature sustained by meltwater percolation from the remaining firn cover above. A similar transition from a cold to a polythermal regime has been documented at Whymper hanging glacier on the Grande Jorasses south face (Gilbert et al., 2026).
5.2 Implications for our understanding of Alpine glacier thermal regimes
The conceptual diagram in Fig. 9 illustrates our interpretation of how the thermal structure of small Alpine glaciers may have evolved in response to climate change and the associated firn cover retreat over the last decades. In the past (e.g., 1980s), the glaciers studied here were likely entirely temperate. Extensive firn cover, sustained by a cooler climate, provided an effective heat source through meltwater percolation and latent heat release upon refreezing (Gilbert et al., 2012; Huss and Fischer, 2016; Gastaldello et al., 2025). Active glacier dynamics promoted crevassing, creating englacial entry points for meltwater and further supporting temperate conditions throughout the ice column via cryo-hydrologic warming (Phillips et al., 2010; Gilbert et al., 2020). Greater ice flow velocities also enhanced strain heating, providing an additional internal heat source (Cuffey and Paterson, 2010).
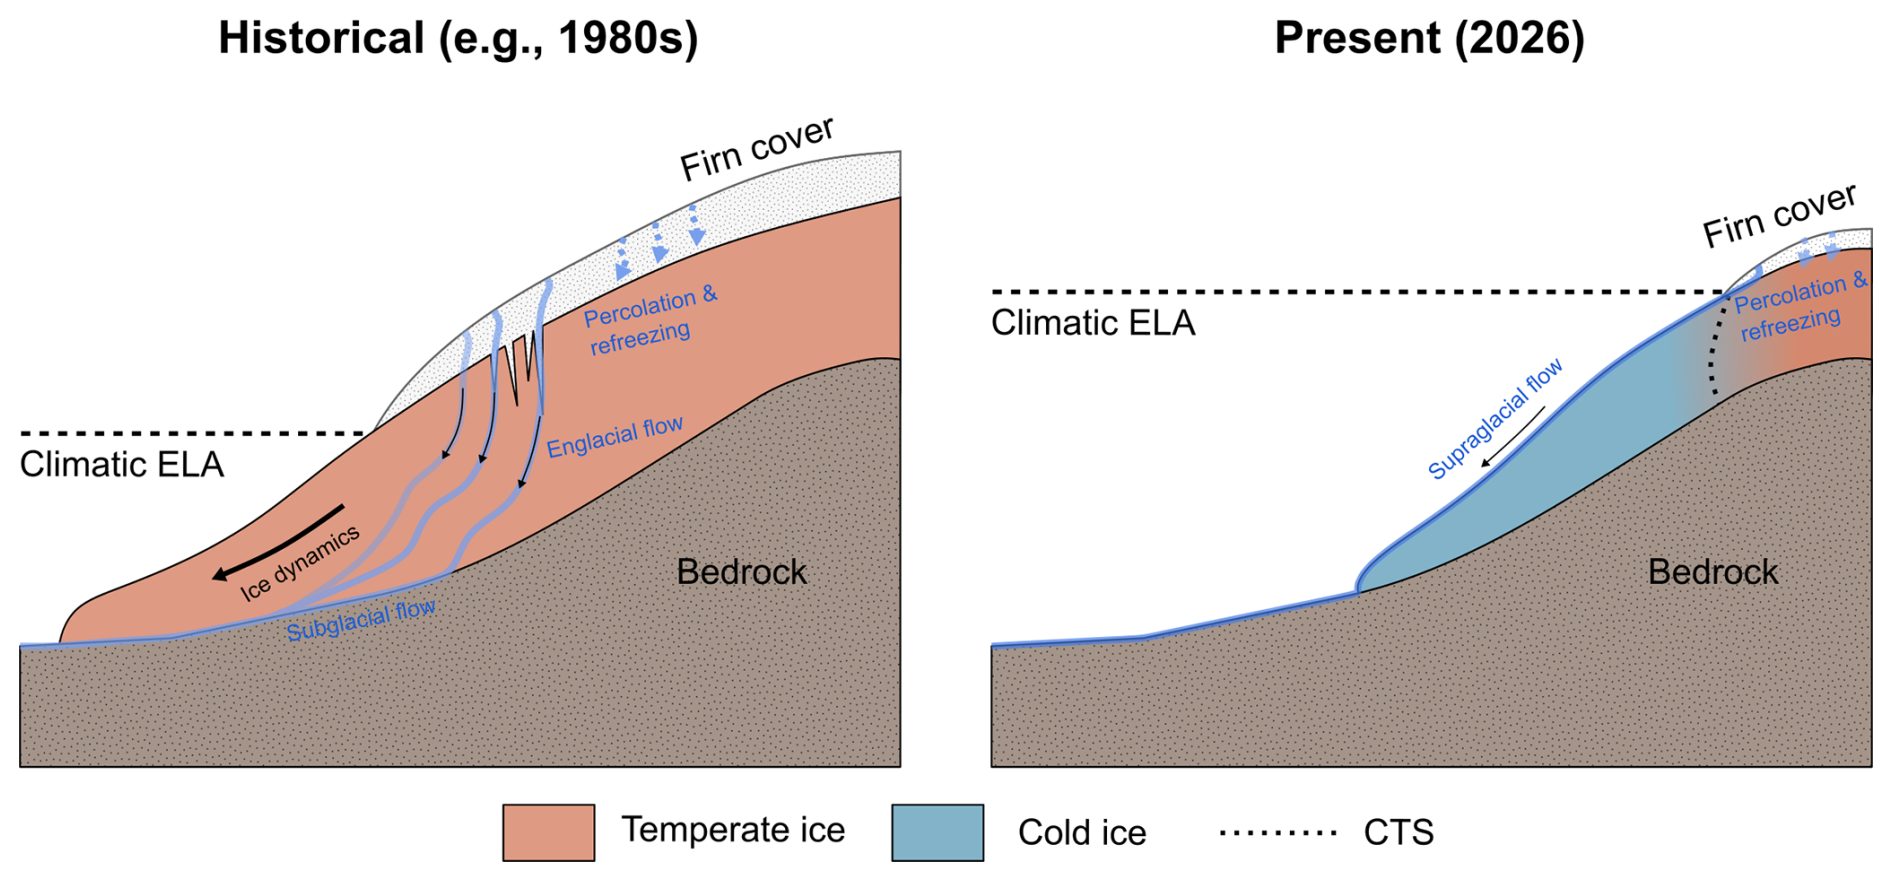
Figure 9Conceptual illustration of the thermal consequences of firn cover loss under glacier recession, comparing the 1980s with present-day (2026) conditions.
Sustained atmospheric warming has driven firn retreat, progressively reducing latent heat input from meltwater percolation and refreezing. Where firn is lost, meltwater runs off at the surface rather than percolating into the pore space. The associated latent heat release upon refreezing is therefore lost (Wilson and Flowers, 2013; van Pelt et al., 2016). Simultaneously, ongoing glacier recession reduces ice flow velocities and with it strain heating, while also limiting crevassing and the availability of englacial meltwater pathways. In the absence of firn, both the loss of latent heat from refreezing and the reduced insulation allow the winter cold wave to penetrate the ice surface more effectively, initiating the development of a cold surface layer and, over time, cold ice. The thermal response to firn loss is neither instantaneous nor spatially uniform. This is illustrated by the contrast between profiles L1 and L2 at Hohsaas, which are only 20–30 m apart but show markedly different thermal structures (Fig. 7a). At L1, ice thickness (15–17 m) is comparable to the seasonally-influenced layer, leaving insufficient ice thickness for a temperate core to persist even where firn-loss history is similar to L2; at L2, the greater ice thickness (>30 m) provides enough insulated depth for temperate ice to remain despite ongoing cooling. This contrast highlights how ice thickness modulates the pace and completeness of thermal response to firn loss, independent of the surface forcing itself. Elevation, topography, residual meltwater supply, and the thermal inertia of the ice all modulate how quickly and how completely cold conditions develop following firn loss. In some cases, atmospheric warming may already offset the cooling initiated by firn loss, for instance where accelerated surface ablation removes cold ice faster than the winter cold wave can produce it. Alphubel may represent an exception to this thermal history, reminding us of the complexity of thermal responses to climate change. As a high-elevation hanging glacier, it likely harboured cold or polythermal conditions at its terminus even historically, in contrast to Chessjen and Hohsaas which, as much larger valley glacier systems, were likely fully temperate (Fig. S18).
The results presented here suggest that polythermal structures may be more widespread among small Alpine glaciers than previously recognized. The existing observational ice temperature record is strongly biased toward larger glaciers (Haeberli, 1976) and high-altitude sites (Haeberli and Alean, 1985; Haeberli and Funk, 1991; Hoelzle et al., 2011), largely overlooking smaller glaciers at lower elevations where firn is progressively being lost and polythermal structures may be actively emerging. Regional-scale thermal modeling, informed by the growing body of englacial temperature observations such as those compiled in the glenglat database (Jacquemart et al., 2025) and the records presented here, offers a path toward assessing the current distribution of polythermal structures and projecting their evolution under continued atmospheric warming. Such projections are particularly relevant given the hazard implications of polythermal configurations.
5.3 Possible hazard implications
Polythermal glaciers are not dangerous per se. The thermal structures identified in this study are however consistent with a configuration known to promote meltwater accumulation beyond drainage capacity: a frozen terminus combined with a temperate upper glacier (Dutto et al., 1991; Wadham et al., 2001; Vincent et al., 2012; Jacquemart et al., 2024; Ogier et al., 2025). During drilling at Alphubel, the only site with direct evidence for a fully frozen terminus, pressurised water escaped from borehole AH1TT at approximately 15 m depth, producing a water fountain 3 to 5 m high. This indicates that water pressure locally exceeded the ice overburden, implying that meltwater had been trapped sub- or englacially and could not drain. If such conditions occur at the glacier bed, basal friction may be substantially reduced locally (Iken and Bindschadler, 1986; Cuffey and Paterson, 2010). A broadly similar configuration, combining a cold glacier tongue with pressurised englacial water, has been discussed in the context of the 2022 Marmolada collapse (Bondesan and Francese, 2023; Olivieri and Bettanini, 2023). Whether similar configurations exist at other small Alpine glaciers remains unknown, but the number of potentially affected sites may be substantial.
To give a rough sense of how many glaciers share the size and elevation characteristics of our study sites, we filtered the SGI2023 (Huss et al., 2026) for glaciers smaller than 0.5 km2 within an elevation range of 2900 to 3800 m a.s.l. The choice of 2900 m a.s.l. as a lower bound roughly excludes elevations where surface ablation dominates over cold ice formation, as suggested by our observations at Sex Rouge. Approximately 515 glaciers in Switzerland meet these criteria, a number that is likely an underestimate, as small hanging glaciers at high elevations are frequently mapped as part of glacier accumulation areas. This underscores the need for a systematic assessment of the thermal structure of small Alpine glaciers and its implications for hazard potential.
In this study, we presented englacial temperature data for six small glaciers (<0.5 km2) in the Swiss Alps. The observations span an elevation range of 2700–3800 m a.s.l., directly addressing a key gap in the existing ablation area record. Our dataset combines borehole thermometry from a total of 23 boreholes with ground-penetrating radar surveys to assess glacier thermal structures.
Polythermal conditions were identified in three glaciers, Alphubel, Chessjen, and Hohsaas, with the CTS occurring at depths of 17 to 38 m. Beneath the cold seasonal layer, ice temperatures ranged from temperate conditions to −2.1 °C. A consistent pattern emerged across these three glaciers, with a generally temperate zone at higher elevations transitioning into fully or partially cold-based glacier termini. However, evidence for a consistently frozen glacier terminus was only found at Alphubel, the highest-elevation glacier in our dataset. At the three additional shallow-drilled sites, Corvatsch appears predominantly cold-based, while Sex Rouge likely retains a polythermal structure with a cold surface layer overlying temperate basal ice (Fischer, 2018), though this remains poorly constrained at depth. At Tortin, sensors were limited to the seasonally influenced surface layer, precluding any assessment of the deeper thermal structure. Our GPR surveys confirmed the spatial thermal patterns inferred from boreholes, with low scattering in cold ice and enhanced scattering in temperate zones. Enhanced near-bed scattering at Chessjen and Hohsaas further suggests that temperate basal conditions may extend beyond what the borehole network resolves.
The fact that three out of six glaciers were confirmed polythermal, with a fourth, likely retaining its historically documented polythermal structure (Fischer, 2018), suggests that this thermal regime may be more widespread among small Alpine glaciers than previously recognized. A systematic regional-scale assessment of their distribution and hazard implications represents an important next step, and our dataset provides essential constraints for the thermal modeling efforts needed to address it.
Table A1Overview of the boreholes drilled in this study, showing drilling date, borehole coordinates (X, Y; EPSG:2056), elevation (Z), and sensor depth at the time of installation. The borehole ID suffix indicates the sensor type (TT = Tinytag loggers; G = Geoprecision loggers). Boreholes marked with * reached the bedrock.
The source code used to process our data is publicly available on GitHub under https://github.com/sdrocer/polythermal_swiss_glaciers (Beer, 2026a) and archived on Zenodo at https://doi.org/10.5281/zenodo.22834279 (Beer, 2026b). The borehole thermometry data has been added to the Global Englacial Temperature database (glenglat) available on GitHub under https://github.com/mjacqu/glenglat (Jacquemart et al., 2025). The ground based ground-penetrating radar data presented in this study are available in the ETH Research Collection at https://doi.org/10.3929/ethz-c-000799146 (Beer et al., 2026).
The supplement related to this article is available online at https://doi.org/10.5194/tc-20-5453-2026-supplement.
Janosch Beer: Conceptualization, Data curation, Formal analysis, Investigation, Project administration, Visualization, Writing – original draft, Writing – review and editing. Mylène Jacquemart: Conceptualization, Supervision, Writing – review and editing. Matthias Huss: Conceptualization, Software (firn cover reconstruction), Supervision, Writing – review and editing. Ilaria Santin: Investigation, Data curation (ground-based GPR post-processing), Writing – review and editing. Gabriela Clara Racz: Investigation, Methodology, Data curation (UAV-based GPR survey and post-processing, Hohsaas), Writing – review and editing. Christophe Ogier: Investigation, Data curation (ground-based GPR post-processing, Alphubel), Writing – review and editing. Saskia Gindraux: Investigation, Financing, Writing – review and editing. Leo Hösli: Investigation, Writing – review and editing. Raphael Moser: Investigation. James Irving: Conceptualization, Methodology, Investigation (UAV-based GPR), Writing – review and editing. Mauro Fischer: Resources (historical englacial temperature data, Sex Rouge), Investigation, Writing – review and editing. Daniel Farinotti: Conceptualization, Investigation, Financing, Supervision, Writing – review and editing.
At least one of the (co-)authors is a member of the editorial board of The Cryosphere. The peer-review process was guided by an independent editor, and the authors also have no other competing interests to declare.
Publisher's note: Copernicus Publications remains neutral with regard to jurisdictional claims made in the text, published maps, institutional affiliations, or any other geographical representation in this paper. The authors bear the ultimate responsibility for providing appropriate place names. Views expressed in the text are those of the authors and do not necessarily reflect the views of the publisher.
This study draws on an extensive series of field campaigns that would not have been possible without the dedication, support, and hard work of all those who contributed. The first author made use of Claude (Anthropic) as an AI-assisted tool to support language editing and code development. All scientific interpretations, analyses, and conclusions are the sole responsibility of the authors. The first author would like to thank Dominika Teluchová for her personal support throughout this work.
This study was primarily supported by internal research funds of ETH Zurich and WSL. Fieldwork was additionally supported by the Section of Natural Hazards of the Canton of Valais, Switzerland.
This paper was edited by Caroline Clason and reviewed by Marcus Gastaldello and one anonymous referee.
Agassiz, L.: Nouvelles études et expériences sur les glaciers actuels, V. Masson, Paris, 1847. a
Ambach, W. and Eisner, H.: Analysis of a 20 m. Firn Pit on the Kesselwandferner (Ötztal Alps), J. Glaciol., 6, 223–231, https://doi.org/10.3189/S0022143000019237, 1966. a
Beer, J.: Code for: Polythermal Conditions in Small Glaciers in the Swiss Alps, GitHub [code], https://github.com/sdrocer/polythermal_swiss_glaciers (last access: 22 September 2026), 2026a. a
Beer, J.: Code for: Polythermal conditions in small glaciers in the Swiss Alps (Version v1.0.0), Zenodo [code], https://doi.org/10.5281/zenodo.22834279, 2026b. a
Beer, J., Santin, I., and Ogier, C.: GPR Data for Beer et al. 2026: Radar Dataset of Glacier du Sex Rouge, Glacier de Tortin, Vadret dal Corvatsch, Alphubel South, Chessjengletscher, Hohsaasgletscher [data set], https://doi.org/10.3929/ethz-c-000799146, 2026. a
Bondesan, A. and Francese, R. G.: The Climate-Driven Disaster of the Marmolada Glacier (Italy), Geomorphology, 431, 108687, https://doi.org/10.1016/j.geomorph.2023.108687, 2023. a, b, c
Boon, S. and Sharp, M.: The Role of Hydrologically-Driven Ice Fracture in Drainage System Evolution on an Arctic Glacier, Geophys. Res. Lett., 30, https://doi.org/10.1029/2003GL018034, 2003. a
Cuffey, K. M. and Paterson, W. S. B.: The Physics of Glaciers, 4th edn., Academic Press, ISBN 978-0-12-369461-4, 2010. a, b, c, d, e, f, g, h, i
Delcourt, C., Van Liefferinge, B., Nolan, M., and Pattyn, F.: The Climate Memory of an Arctic Polythermal Glacier, J. Glaciol., 59, 1084–1092, https://doi.org/10.3189/2013JoG12J109, 2013. a
Dutto, F., Godone, F., and Mortara, G.: L'écroulement du glacier supérieur de Coolidge. (Paroi nord du Mont Viso, Alpes occidentales), Rev. Geogr. Alp., 79, 7–18, https://doi.org/10.3406/rga.1991.3597, 1991. a
Faillettaz, J., Funk, M., and Vincent, C.: Avalanching Glacier Instabilities: Review on Processes and Early Warning Perspectives, Rev. Geophys., 53, 203–224, https://doi.org/10.1002/2014RG000466, 2015. a, b
Fischer, M.: Understanding the Response of Very Small Glaciers in the Swiss Alps to Climate Change, PhD thesis no. 2067, University of Fribourg, Switzerland, 2018. a, b, c, d, e, f, g, h
Flowers, G. E. and Clarke, G. K. C.: A Multicomponent Coupled Model of Glacier Hydrology 1. Theory and Synthetic Examples, J. Geophys. Res.-Sol. Ea., 107, ECV 9-1–ECV 9-17, https://doi.org/10.1029/2001JB001122, 2002. a
Forte, E., Gutgesell, P., Securo, A., Marcer, M., Citterio, M., Machguth, H., and Colucci, R. R.: Comparing GPR with Ice Thickness and Thermal Models: Insights from Two Polythermal Glaciers in West Greenland, J. Glaciol., 71, e97, https://doi.org/10.1017/jog.2025.10067, 2025. a
Gastaldello, M., Mattea, E., Hoelzle, M., and Machguth, H.: Modelling cold firn evolution at Colle Gnifetti, Swiss/Italian Alps, The Cryosphere, 19, 2983–3008, https://doi.org/10.5194/tc-19-2983-2025, 2025. a, b, c
Geolitix Technologies Inc.: Geolitix: Cloud-hosted Platform for GPR Data Visualization and Interpretation, https://geolitix.com (last access: 21 September 2026), 2020. a
Gilbert, A., Vincent, C., Wagnon, P., Thibert, E., and Rabatel, A.: The Influence of Snow Cover Thickness on the Thermal Regime of Tête Rousse Glacier (Mont Blanc Range, 3200 m a.s.l.): Consequences for Outburst Flood Hazards and Glacier Response to Climate Change, J. Geophys. Res., 117, https://doi.org/10.1029/2011JF002258, 2012. a, b, c, d, e
Gilbert, A., Gagliardini, O., Vincent, C., and Wagnon, P.: A 3-D Thermal Regime Model Suitable for Cold Accumulation Zones of Polythermal Mountain Glaciers, J. Geophys. Res.-Earth, 119, 1876–1893, https://doi.org/10.1002/2014JF003199, 2014. a, b
Gilbert, A., Vincent, C., Gagliardini, O., Krug, J., and Berthier, E.: Assessment of Thermal Change in Cold Avalanching Glaciers in Relation to Climate Warming, Geophys. Res. Lett., 42, 6382–6390, https://doi.org/10.1002/2015GL064838, 2015. a
Gilbert, A., Leinss, S., Kargel, J., Kääb, A., Gascoin, S., Leonard, G., Berthier, E., Karki, A., and Yao, T.: Mechanisms leading to the 2016 giant twin glacier collapses, Aru Range, Tibet, The Cryosphere, 12, 2883–2900, https://doi.org/10.5194/tc-12-2883-2018, 2018. a
Gilbert, A., Sinisalo, A., Gurung, T. R., Fujita, K., Maharjan, S. B., Sherpa, T. C., and Fukuda, T.: The influence of water percolation through crevasses on the thermal regime of a Himalayan mountain glacier, The Cryosphere, 14, 1273–1288, https://doi.org/10.5194/tc-14-1273-2020, 2020. a, b, c, d
Gilbert, A., Troilo, F., Gagliardini, O., Vincent, C., Perret, P., Mondardini, L., Piard, L., Laarman, O., and Le Meur, E.: The thermal regime of the Whymper hanging glacier under climate change (Grandes Jorasses, 4050 m a.s.l., Italy), EGUsphere [preprint], https://doi.org/10.5194/egusphere-2026-4058, 2026. a
GLAMOS – Glacier Monitoring Switzerland: Swiss Glacier Mass Balance (Release 2025), https://doi.org/10.18750/MASSBALANCE.2025.R2025, 2025. a, b, c
Haeberli, W.: Eistemperaturen in den Alpen, Zeitschrift für Gletscherkunde und Glazialgeologie, 11, 203–220, 1976. a, b
Haeberli, W. and Alean, J.: Temperature and Accumulation of High Altitude Firn in the Alps, Ann. Glaciol., 6, 161–163, https://doi.org/10.3189/1985AoG6-1-161-163, 1985. a, b
Haeberli, W. and Funk, M.: Borehole Temperatures at the Colle Gnifetti Core-Drilling Site (Monte Rosa, Swiss Alps), J. Glaciol., 37, 37–46, https://doi.org/10.3189/S0022143000042775, 1991. a, b
Haeberli, W., Frauenfelder, R., Kääb, A., and Wagner, S.: Characteristics and Potential Climatic Significance of “Miniature Ice Caps” (Crest- and Cornice-Type Low-Altitude Ice Archives), J. Glaciol., 50, 129–136, https://doi.org/10.3189/172756504781830330, 2004. a, b, c, d, e, f, g
Hardy, R. L.: Multiquadric Equations of Topography and Other Irregular Surfaces, J. Geophys. Res., 76, 1905–1915, https://doi.org/10.1029/JB076i008p01905, 1971. a
Heucke, E.: A Light Portable Steam-Driven Ice Drill Suitable for Drilling Holes in Ice and Firn, Geogr. Ann. A, 81, 603–609, https://doi.org/10.1111/1468-0459.00088, 1999. a
Hock, R.: A Distributed Temperature-Index Ice- and Snowmelt Model Including Potential Direct Solar Radiation, J. Glaciol., 45, 101–111, https://doi.org/10.3189/S0022143000003087, 1999. a
Hock, R.: Glacier Melt: A Review of Processes and Their Modelling, Progress in Physical Geography: Earth and Environment, 29, 362–391, https://doi.org/10.1191/0309133305pp453ra, 2005. a
Hoelzle, M., Darms, G., Lüthi, M. P., and Suter, S.: Evidence of accelerated englacial warming in the Monte Rosa area, Switzerland/Italy, The Cryosphere, 5, 231–243, https://doi.org/10.5194/tc-5-231-2011, 2011. a, b
Huggel, C., Haeberli, W., Kääb, A., Bieri, D., and Richardson, S.: An Assessment Procedure for Glacial Hazards in the Swiss Alps, Can. Geotech. J., 41, 1068–1083, https://doi.org/10.1139/t04-053, 2004. a
Hugi, F. J.: Ueber das Wesen der Gletscher und Winterreise in das Eismeer, Cotta'scher Verlag, Stuttgart und Tübingen, https://www.digitale-sammlungen.de/en/view/bsb10133937 (last access: 22 September 2026), 1842. a
Humphrey, N. and Echelmeyer, K.: Hot-Water Drilling And Bore-hole Closure In Cold Ice, J. Glaciol., 36, 287–298, https://doi.org/10.3189/002214390793701354, 1990. a
Huss, M. and Fischer, M.: Sensitivity of Very Small Glaciers in the Swiss Alps to Future Climate Change, Front. Earth Sci., 4, https://doi.org/10.3389/feart.2016.00034, 2016. a, b, c, d, e, f, g
Huss, M., Dhulst, L., and Bauder, A.: New Long-Term Mass-Balance Series for the Swiss Alps, J. Glaciol., 61, 551–562, https://doi.org/10.3189/2015JoG15J015, 2015. a, b
Huss, M., Bauder, A., Linsbauer, A., Gabbi, J., Kappenberger, G., Steinegger, U., and Farinotti, D.: More than a Century of Direct Glacier Mass-Balance Observations on Claridenfirn, Switzerland, J. Glaciol., 67, 697–713, https://doi.org/10.1017/jog.2021.22, 2021. a, b
Huss, M., Bauder, A., Barandun, M., Hodel, E., and Linsbauer, A.: Swiss Glacier Bulletin 2025, Tech. Rep. 146, GLAMOS – Glacier Monitoring Switzerland, https://doi.org/10.18752/GLBULLETIN_2025, 2026. a, b, c, d, e
Iken, A. and Bindschadler, R. A.: Combined Measurements of Subglacial Water Pressure and Surface Velocity of Findelengletscher, Switzerland: Conclusions about Drainage System and Sliding Mechanism, J. Glaciol., 32, 101–119, https://doi.org/10.3189/S0022143000006936, 1986. a
Irvine-Fynn, T. D. L., Moorman, B. J., Williams, J. L. M., and Walter, F. S. A.: Seasonal Changes in Ground-Penetrating Radar Signature Observed at a Polythermal Glacier, Bylot Island, Canada, Earth Surf. Proc. Land., 31, 892–909, https://doi.org/10.1002/esp.1299, 2006. a
Irvine-Fynn, T. D. L., Hodson, A. J., Moorman, B. J., Vatne, G., and Hubbard, A. L.: Polythermal Glacier Hydrology: A Review, Rev. Geophys., 49, https://doi.org/10.1029/2010RG000350, 2011. a, b
Jacquemart, M., Loso, M., Leopold, M., Welty, E., Berthier, E., Hansen, J. S., Sykes, J., and Tiampo, K.: What Drives Large-Scale Glacier Detachments? Insights from Flat Creek Glacier, St. Elias Mountains, Alaska, Geology, 48, 703–707, https://doi.org/10.1130/G47211.1, 2020. a
Jacquemart, M., Weber, S., Chiarle, M., Chmiel, M., Cicoira, A., Corona, C., Eckert, N., Gaume, J., Giacona, F., Hirschberg, J., Kaitna, R., Magnin, F., Mayer, S., Moos, C., van Herwijnen, A., and Stoffel, M.: Detecting the Impact of Climate Change on Alpine Mass Movements in Observational Records from the European Alps, Earth-Sci. Rev., 258, 104886, https://doi.org/10.1016/j.earscirev.2024.104886, 2024. a, b
Jacquemart, M., Welty, E., Gastaldello, M., and Carcanade, G.: glenglat: a database of global englacial temperatures, Earth Syst. Sci. Data, 17, 1627–1666, https://doi.org/10.5194/essd-17-1627-2025, 2025 (data available at: https://github.com/mjacqu/glenglat, last access: 21 September 2026). a, b
Jansson, P.: Dynamics and Hydrology of a Small Polythermal Valley Glacier, Geogr. Ann. A, 78, 171–180, https://doi.org/10.1080/04353676.1996.11880463, 1996. a
Kääb, A., Leinss, S., Gilbert, A., Bühler, Y., Gascoin, S., Evans, S. G., Bartelt, P., Berthier, E., Brun, F., Chao, W.-A., Farinotti, D., Gimbert, F., Guo, W., Huggel, C., Kargel, J. S., Leonard, G. J., Tian, L., Treichler, D., and Yao, T.: Massive Collapse of Two Glaciers in Western Tibet in 2016 after Surge-like Instability, Nat. Geosci., 11, 114–120, https://doi.org/10.1038/s41561-017-0039-7, 2018. a
Karlsson, N. B., Solgaard, A. M., Mankoff, K. D., Gillet-Chaulet, F., MacGregor, J. A., Box, J. E., Citterio, M., Colgan, W. T., Larsen, S. H., Kjeldsen, K. K., Korsgaard, N. J., Benn, D. I., Hewitt, I. J., and Fausto, R. S.: A First Constraint on Basal Melt-Water Production of the Greenland Ice Sheet, Nat. Commun., 12, 3461, https://doi.org/10.1038/s41467-021-23739-z, 2021. a
Karušs, J., Lamsters, K., Sobota, I., Ješkins, J., Džeriņš, P., and Hodson, A.: Drainage System and Thermal Structure of a High Arctic Polythermal Glacier: Waldemarbreen, Western Svalbard, J. Glaciol., 68, 591–604, https://doi.org/10.1017/jog.2021.125, 2022. a, b
Kavanaugh, J. L. and Clarke, G. K. C.: Abrupt Glacier Motion and Reorganization of Basal Shear Stress Following the Establishment of a Connected Drainage System, J. Glaciol., 47, 472–480, https://doi.org/10.3189/172756501781831972, 2001. a
Law, R., Christoffersen, P., Hubbard, B., Doyle, S. H., Chudley, T. R., Schoonman, C. M., Bougamont, M., des Tombe, B., Schilperoort, B., Kechavarzi, C., Booth, A., and Young, T. J.: Thermodynamics of a Fast-Moving Greenlandic Outlet Glacier Revealed by Fiber-Optic Distributed Temperature Sensing, Science Advances, 7, eabe7136, https://doi.org/10.1126/sciadv.abe7136, 2021. a
Mattea, E., Machguth, H., Kronenberg, M., van Pelt, W., Bassi, M., and Hoelzle, M.: Firn changes at Colle Gnifetti revealed with a high-resolution process-based physical model approach, The Cryosphere, 15, 3181–3205, https://doi.org/10.5194/tc-15-3181-2021, 2021. a
Medici, F. and Rybach, L.: Geothermal Map of Switzerland 1995 (Heat Flow Density), Tech. Rep. 30, Commission Suisse de Géophysique, Zurich, Switzerland, 1995. a
Oerlemans, J.: A note on the water budget of temperate glaciers, The Cryosphere, 7, 1557–1564, https://doi.org/10.5194/tc-7-1557-2013, 2013. a
Ogier, C., Fischer, M., Werder, M. A., Huss, M., Hupfer, M., Jacquemart, M., Gagliardini, O., Gilbert, A., Hösli, L., Thibert, E., Vincent, C., and Farinotti, D.: Definition, Formation and Rupture Mechanisms of Water Pockets in Alpine Glaciers: Insights from an Updated Inventory for the Swiss Alps, J. Glaciol., 71, e82, https://doi.org/10.1017/jog.2025.43, 2025. a
Olivieri, L. and Bettanini, C.: Preliminary Observation of Marmolada Glacier Collapse of July 2022 with Space-Based Cameras, Remote Sens. Lett., 14, 21–29, https://doi.org/10.1080/2150704X.2022.2152754, 2023. a, b
Pavlova, P. A., Schmid, P., Bogdal, C., Steinlin, C., Jenk, T. M., and Schwikowski, M.: Polychlorinated Biphenyls in Glaciers. 1. Deposition History from an Alpine Ice Core, Environ. Sci. Technol., 48, 7842–7848, https://doi.org/10.1021/es5017922, 2014. a
Pettersson, R., Jansson, P., and Blatter, H.: Spatial Variability in Water Content at the Cold-Temperate Transition Surface of the Polythermal Storglaciären, Sweden, J. Geophys. Res.-Earth, 109, https://doi.org/10.1029/2003JF000110, 2004. a
Phillips, T., Rajaram, H., and Steffen, K.: Cryo-Hydrologic Warming: A Potential Mechanism for Rapid Thermal Response of Ice Sheets, Geophys. Res. Lett., 37, https://doi.org/10.1029/2010GL044397, 2010. a
Raspoet, O. and Pattyn, F.: Estimates of Basal and Englacial Thermal Conditions of the Antarctic Ice Sheet, J. Glaciol., 71, e104, https://doi.org/10.1017/jog.2025.10087, 2025. a
Röthlisberger, H.: Eislawinen und Ausbrüche von Gletscherseen, Gletscher und Klima, Jahrbuch der Schweizerischen Naturforschenden Gesellschaft, 170–212, 1978. a
Ruols, B., Baron, L., and Irving, J.: Development of a Drone-Based Ground-Penetrating Radar System for Efficient and Safe 3D and 4D Surveying of Alpine Glaciers, J. Glaciol., 69, 2087–2098, https://doi.org/10.1017/jog.2023.83, 2023. a
Sevestre, H., Benn, D. I., Hulton, N. R. J., and Bælum, K.: Thermal Structure of Svalbard Glaciers and Implications for Thermal Switch Models of Glacier Surging, J. Geophys. Res.-Earth, 120, 2220–2236, https://doi.org/10.1002/2015JF003517, 2015. a
Suter, S. and Hoelzle, M.: Cold Firn in the Mont Blanc and Monte Rosa Areas, European Alps: Spatial Distribution and Statistical Models, Ann. Glaciol., 35, 9–18, https://doi.org/10.3189/172756402781817059, 2002. a
Swisstopo: SWISSALTI3D – The Digital Elevation Model of Switzerland, https://www.swisstopo.admin.ch (last access: 21 September 2026), 2023a. a, b, c
Swisstopo: SWISSIMAGE 10 Cm, https://map.geo.admin.ch (last access: 21 September 2026), 2023b. a
Swisstopo: SWISSIMAGE: Orthophoto Mosaic of Switzerland, https://www.swisstopo.admin.ch/en/orthoimage-swissimage-10 (last access: 21 September 2026), 2024. a
van Pelt, W. J. J., Pohjola, V. A., and Reijmer, C. H.: The Changing Impact of Snow Conditions and Refreezing on the Mass Balance of an Idealized Svalbard Glacier, Front. Earth Sci., 4, https://doi.org/10.3389/feart.2016.00102, 2016. a, b
Vincent, C., Garambois, S., Thibert, E., Lefèbvre, E., Meur, E. L., and Six, D.: Origin of the Outburst Flood from Glacier de Tête Rousse in 1892 (Mont Blanc Area, France), J. Glaciol., 56, 688–698, https://doi.org/10.3189/002214310793146188, 2010. a
Vincent, C., Descloitres, M., Garambois, S., Legchenko, A., Guyard, H., and Gilbert, A.: Detection of a Subglacial Lake in Glacier de Tête Rousse (Mont Blanc Area, France), J. Glaciol., 58, 866–878, https://doi.org/10.3189/2012JoG11J179, 2012. a, b, c, d, e
Vincent, C., Gilbert, A., Jourdain, B., Piard, L., Ginot, P., Mikhalenko, V., Possenti, P., Le Meur, E., Laarman, O., and Six, D.: Strong changes in englacial temperatures despite insignificant changes in ice thickness at Dôme du Goûter glacier (Mont Blanc area), The Cryosphere, 14, 925–934, https://doi.org/10.5194/tc-14-925-2020, 2020. a
Virtanen, P., Gommers, R., Oliphant, T. E., Haberland, M., Reddy, T., Cournapeau, D., Burovski, E., Peterson, P., Weckesser, W., Bright, J., van der Walt, S. J., Brett, M., Wilson, J., Millman, K. J., Mayorov, N., Nelson, A. R. J., Jones, E., Kern, R., Larson, E., Carey, C. J., Polat, İ., Feng, Y., Moore, E. W., VanderPlas, J., Laxalde, D., Perktold, J., Cimrman, R., Henriksen, I., Quintero, E. A., Harris, C. R., Archibald, A. M., Ribeiro, A. H., Pedregosa, F., and van Mulbregt, P.: SciPy 1.0: Fundamental Algorithms for Scientific Computing in Python, Nat. Methods, 17, 261–272, https://doi.org/10.1038/s41592-019-0686-2, 2020. a
Wadham, J. L., Hodgkins, R., Cooper, R. J., and Tranter, M.: Evidence for Seasonal Subglacial Outburst Events at a Polythermal Glacier, Finsterwalderbreen, Svalbard, Hydrol. Process., 15, 2259–2280, https://doi.org/10.1002/hyp.178, 2001. a, b
Wilson, N. J. and Flowers, G. E.: Environmental controls on the thermal structure of alpine glaciers, The Cryosphere, 7, 167–182, https://doi.org/10.5194/tc-7-167-2013, 2013. a, b, c, d
Wilson, N. J., Flowers, G. E., and Mingo, L.: Comparison of Thermal Structure and Evolution between Neighboring Subarctic Glaciers, J. Geophys. Res.-Earth, 118, 1443–1459, https://doi.org/10.1002/jgrf.20096, 2013. a