
the Creative Commons Attribution 4.0 License.
the Creative Commons Attribution 4.0 License.
 | 21 Sep 2026
Substantial accumulation rates on a glacier avalanche cone from time-lapse photogrammetry and field measurements

Patrick Wagnon
Laurent Arnaud
Louise Balmas
Olivier Laarman
Bruno Jourdain
Amaury Dehecq
Emmanuel Lemeur
Fanny Brun
Andrea Kneib-Walter
Ilaria Santin
Laurane Charrier
Thierry Faug
Giulia Mazzotti
Antoine Rabatel
Delphine Six
Daniel Farinotti
Avalanches are critical contributors to the mass balance and spatial accumulation patterns of mountain glaciers. While gravitational snow redistribution models predict high localized accumulation, these predictions lack field validation due to the difficulty of monitoring highly dynamic avalanche cones. Here, we present two years of high-resolution monitoring of a large avalanche cone in the accumulation area of Argentière Glacier (French Alps). To capture these dynamics, we employed a multi-sensor approach: Uncrewed Aerial Vehicle (UAV) surveys and a time-lapse photogrammetry array consisting of 7 low-cost cameras deployed ∼ 1 km away from the cone. Point clouds and Digital Elevations Models were produced at a two-week resolution using Structure-from-Motion photogrammetry. Methodological validation shows that while side-looking time-lapse photogrammetry captures the overall elevation changes, it tends to underestimate them compared to UAV data, with biases up to 1.8 m and precisions of 2–6 m. Despite these uncertainties, our results reveal extreme spatial variability in accumulation. The top of the cone is the most active zone, exhibiting elevation changes of ∼ 30 m annually corresponding to a local annual mass balance reaching 23 ± 4 m w.e. in 2023 and 16 ± 4 m w.e. in 2024. We identify a topographical threshold for snow storage: the upper cone fills early in the season until reaching a critical slope of ∼ 35°, after which subsequent avalanches bypass the cone's apex to deposit mass at the cone's base. From May onwards, mass redistribution is further modulated by the development of surface channels. Our findings demonstrate that time-lapse photogrammetry is a viable tool for monitoring dynamic glacier surfaces and provide rare empirical evidence of the dominant role avalanches play in the local glacier mass budget.
- Article
(6806 KB) - Full-text XML
-
Supplement
(1488 KB) - BibTeX
- EndNote


Glaciers gain mass primarily through solid precipitation and snow redistribution processes such as wind drift and avalanching (Dadic et al., 2010; Laha et al., 2017; Brun et al., 2019). Traditionally, surface mass balance is quantified via in-situ point observations at stakes, supplemented by snow pits and firn cores to determine height and density (Cuffey and Paterson, 2010). These point measurements can be expanded spatially using high-frequency ground-penetrating radar (Jourdain et al., 2023; Patil et al., 2025) or temporally using multi-annual accumulation records from firn cores (Mayer et al., 2014) or crevasse stratigraphy (Purdie et al., 2011). However, for logistical, safety and representativity reasons, these monitoring efforts are typically confined to relatively flat, accessible, crevasse-free and avalanche-free areas (Benn and Lehmkuhl, 2000). This sampling bias frequently neglects glacier margins at the base of steep headwalls, where avalanches concentrate mass (Kneib et al., 2024b). By omitting these high-accumulation zones, traditional methods may fail to capture a critical component of the total mass budget (Benn and Lehmkuhl, 2000; Hynek et al., 2024). Such omissions may contribute to discrepancies between glaciological and geodetic mass balance estimates, which must be reconciled to derive consistent, long-term mass balance time-series (Zemp et al., 2013; Wagnon et al., 2021).
The specific contribution of avalanches to glacier mass balance remains difficult to isolate from solid precipitation. Current estimates often rely on numerical models constrained by observations from off-glacier terrain (Quéno et al., 2024; Kneib et al., 2025). Avalanche contributions have been quantified at various spatial scales, using models of various complexity. Turchaninova et al. (2019) performed simulations based on depth-averaged flow equations using the software RAMMS to show that avalanches contribute up to 10 % of total accumulation for specific glaciers in the Tien Shan. At the global scale, Kneib et al. (2025) utilized a simpler parametrization of gravitational snow redistribution (Gruber, 2007; Bernhardt and Schulz, 2010) to demonstrate that avalanches significantly contribute to glacier mass balance across regions such as New Zealand, Central Europe, and High Mountain Asia. While such parametrizations are now widely integrated into glacio-hydrological models (Burger et al., 2018; Mimeau et al., 2019; Jouberton et al., 2025), they remain fundamentally under-constrained because of the lack of empirical data – even when considering off-glacier avalanche records (Kneib et al., 2025).
Complementary approaches have utilized ice flux inversions combined with geodetic elevation changes to estimate avalanche contributions via the continuity equation (Terleth et al., 2023; Kneib et al., 2024b). While these methods are data-driven, they rely on strong assumptions on the glacier bed geometry and on mass balance modelling to partition avalanche mass from direct snowfall. Direct field measurements using high-frequency ground-penetrating radar (GPR) provide perhaps the most robust ground-truth for end-of-season snow height on on-glacier avalanche deposits (Purdie et al., 2015; Mott et al., 2019; Hynek et al., 2024). However, GPR surveys are often limited by sparse sampling of highly heterogeneous snowpacks and the inherent danger of operating in steep, rockfall-prone zones. More recently, close-range remote sensing – including terrestrial LiDAR and UAV-based photogrammetry – has been employed to map surface changes at high resolution (e.g. Piermattei et al., 2015). Yet, these snapshot surveys typically do not account for vertical velocity due to ice flow, which complicates the conversion of elevation change into actual mass accumulation (Jourdain et al., 2023).
Sites affected by avalanche deposits are characterized by high mass turnover, driven by exceptional accumulation rates from the localized redistribution of snow from surrounding headwalls. However, precisely quantifying this effect requires capturing the high spatial and temporal variability of the physical processes occurring within these dynamic zones – a task that has remained elusive until now. Here, we use a combination of field measurements – centred on close-range remote sensing from UAV surveys and an array of time-lapse cameras – to estimate the contribution of avalanches on a selected cone of Argentière Glacier (France) located at the base of the North-north-east face of the Courtes (3856 m a.s.l.), a 700 m-high headwall located in the Mont-Blanc massif. We aim to evaluate the mass turnover at this location on an annual scale, and estimate the contribution of the different processes underlying this evolution.
Argentière Glacier (45°55′ N, 7°00′ E) is located in the Mont Blanc massif, European Alps (Fig. 1). In 2022, the glacier extended from ∼ 3500 to ∼ 1600 m a.s.l. at the terminus, covering an area of ∼ 12 km2 with a length of ∼ 10 km. The glacier is characterized by steep surrounding headwalls that frequently release large avalanches onto its surface (Fig. 1; Kneib et al., 2024a, b). The glacier surface mass balance has been continuously monitored since 1975 using a network of stakes (Vincent et al., 2009) as part of the GLACIOCLIM monitoring programme (https://glacioclim.osug.fr/, last access: 11 January 2026). Here, we focus on an avalanche cone of the accumulation zone of Argentière Glacier located at the base of the North-north-east face of the Courtes (3856 m a.s.l.), between 2850 and 3150 m a.s.l. This feature, hereafter referred to as “the cone”, is an avalanche-deposit fan fed by the steep (∼ 45° on average, rising to ∼ 3800 m a.s.l.) slopes above (Fig. 1). The partly crevassed cone effectively functions as a small tributary, flowing directly into the main glacier unit. We selected this site as it is strongly fed by snow avalanches, while the absence of seracs or hanging ice in the above slopes allowed us to safely access the cone at certain times of the year with stable snow conditions. Furthermore, the cone is naturally delineated by two prominent rock ridges, which provide stable terrain on both sides of the cone for co-registration of UAV and time-lapse photogrammetry surveys.
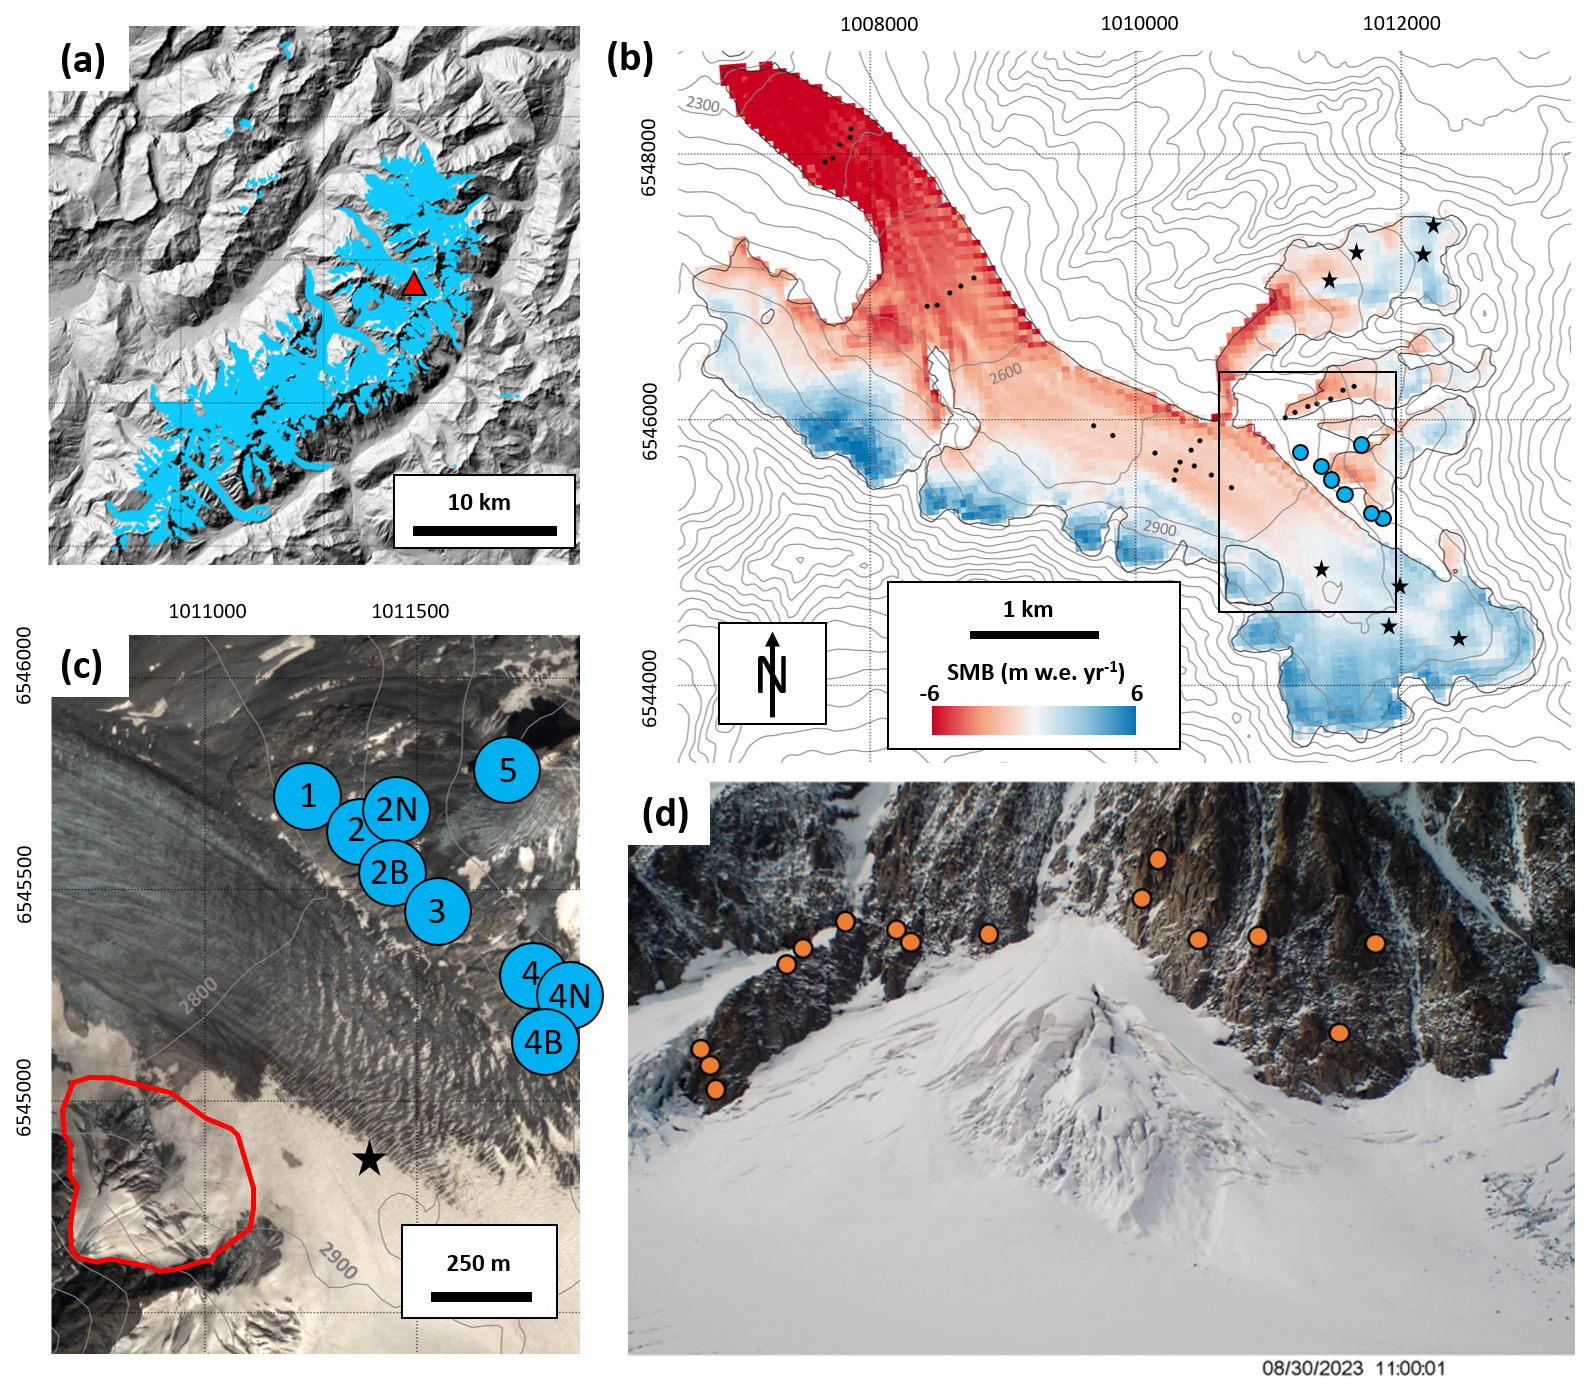
Figure 1Field site. (a) Location of the avalanche cone on Argentière Glacier (red triangle) in the Mont-Blanc massif. Glaciers from the RGI v6.0 are shown in light blue (RGI Consortium, 2017) and the background hillshade is from the AW3D30 30 m Digital Elevation Model (DEM, Tadono et al., 2014). (b) 2012–2021 mean distributed surface mass balance of Argentière Glacier as obtained from an ice flux inversion using the Instructed Glacier Model (Kneib et al., 2024b). The blue dots correspond to the location of the time-lapse cameras and the black dots and stars represent the location of long-term ablation and accumulation stake measurements, respectively. The 100 m contour lines are from the AW3D30 30 m DEM. (c) 21 August 2023 Pléiades false-colour image of the cone (red outlines) and camera locations (blue circles). Pléiades © CNES 2023, Distribution AIRBUS DS. The 100 m contour lines are from the AW3D30 30 m DEM and the black star shows the location of the closest long-term accumulation measurements. (d) 30 August 2023 oblique view of the cone from Camera 5. The orange dots indicate the location of prominent features used as natural Ground Control Points in the processing of the point clouds.
3.1 UAV photogrammetry
To obtain high-resolution information of the local topography, we conducted four UAV surveys during the study period: 4 May, 27 September 2023, 29 May, and 23 October 2024 (Fig. 2). An initial attempt on 26 January 2023 failed due to low temperatures that prevented UAV operation. For all successful missions, we utilized either a DJI Phantom 4 or a DJI Mavic 3 UAV, both equipped with Real-Time Kinematic (RTK) positioning. To ensure inter-survey alignment, a base station was positioned at the foot of the cone for each flight and referenced to a fixed base station ∼ 1 km away. The surveys included both nadir and 60° oblique flights with 70 % lateral overlap and 80 % frontal overlap between images, while maintaining a constant altitude of 100 m above ground.
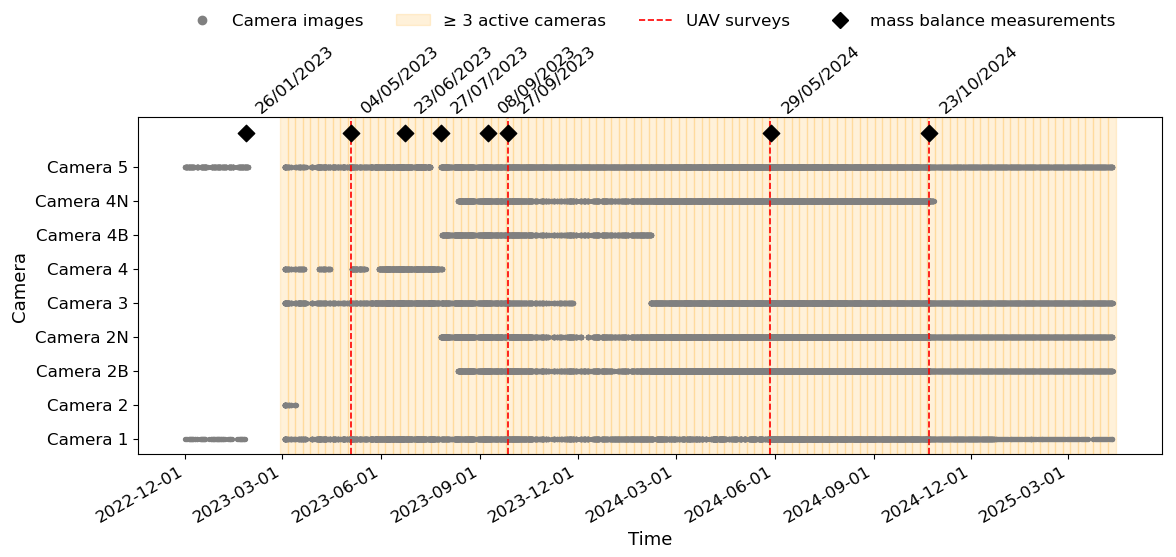
Figure 2Timeline of all measurements used in the frame of this study. The positions of the individual cameras are shown in Fig. 1a.
Image processing followed a Structure-from-Motion (SfM) workflow in Agisoft Metashape (v1.8.3) as described by Over et al. (2021), resulting in high-density point clouds (200–500 points m−2). Ten Ground Control Points (GCP) distributed across the cone were used to process the 27 September 2023 acquisition, which served as our reference. The remaining three surveys, conducted without GCPs, were co-registered to this reference point cloud using the Iterative Closest Point (ICP) algorithm (Besl and McKay, 1992) via the Python library py4dgeo v0.6.0 (py4dgeo Development Core Team, 2022). The stable terrain needed for the point cloud co-registration could not be extracted manually given the transient presence of snow on the rock walls around the cone. We therefore automatically extracted the snow-free locations using brightness and colour thresholds (Fig. S1). Finally, the point clouds were interpolated into 1 m resolution Digital Elevation Models (DEMs) and orthoimages using a cubic spline method.
Using the same automated classification applied to the point clouds, we computed the standard deviation of the DEM differences over assumed stable terrain, off-glacier, and obtained a vertical uncertainty of the UAV-derived elevation change maps of 1.0 m (Fig. S2; Kneib et al., 2022). Because the stable rock slopes surrounding the avalanche cone are in general steeper than the cone itself, this value represents a conservative, upper-bound estimate of the uncertainty across the study area, due to the positive relationship between slope and uncertainty (Kneib et al., 2022; Hugonnet et al., 2022).
3.2 Time-lapse photogrammetry
We used an array of time-lapse cameras to quantify the elevation changes on the cone at high temporal resolution. The time-lapse monitoring network consisted of low-cost Stealthcam Core DS4K cameras (32 MPx, 52° diagonal field of view) mounted on stable rock outcrops on the other side of the glacier, ∼ 1 km from the cone (Fig. 1). Each unit was secured with a 3D printed part to a custom metal frame bolted directly into the rock (Fig. S3). The total cost for one full camera setup was ∼ EUR 350 including batteries and storage on 64 GB SD cards. Cameras were programmed to capture images at 1 h intervals throughout daylight hours from 31 November 2022 to 10 April 2025 (Fig. 2). Six AA Lithium-ion batteries provided more than a year of autonomous operation, though maintenance was required when units were buried by snow, suffered physical damage, or experienced orientation shifts leading to discontinuous time series for individual cameras (Fig. 2). We georeferenced each camera position using dGPS and recorded viewing angles (pitch, yaw, and roll) using a compass and inclinometer during installation and after any observed shifts. All cameras were dismantled in April 2025.
3.2.1 Avalanche events from time-lapse images
To characterize the temporal evolution of accumulation, we visually analysed 7121 images from Camera 5, spanning the period from 30 November 2022 to 10 April 2025. Avalanche deposits were identified across seven distinct sectors of the cone and categorized by magnitude: small if the deposit area was smaller than 10 % of the sector, medium (>10 % and <40 % of the sector) and large (>40 % of the sector) (Fig. S4). This dataset was supplemented by additional images from a time-lapse camera directed at the mountain headwall from 27 July 2023 to 29 March 2024, providing a qualitative proxy for snow accumulating on the contributing slopes. Observational continuity was hindered between November and January by poor illumination and regular snowfalls, which often limited the analysis to at most one usable image per day. These visual observations were ultimately used to delineate the study area of the cone as well as the contributing slopes above, ensuring that the cone boundaries encompassed the maximum observed extent of avalanche activity.
3.2.2 Structure-from-motion photogrammetry
Using the camera images, we generated 1 m resolution DEMs of the cone every two weeks from 4 March 2023 to 28 February 2025 using an array-based SfM photogrammetry workflow (Agisoft Metashape v1.8.3), following the methodology of Kneib et al. (2022). Initial camera positions and orientations were constrained by the in-situ dGPS measurements, compass bearings, and inclinometer readings. We performed a two-step calibration: first, time-lapse images from 27 September 2023 were processed together with the concurrent UAV images and its 10 associated GCPs in one Metashape project. This enabled a rigorous calibration of camera extrinsic (position, viewing angles) and intrinsic (lens) parameters relative to the UAV reference. Second, we re-processed the time-lapse images independently using these calibrated parameters to generate a reference camera point cloud. From this reference, we identified 16 Ground Control Points (GCPS, Fig. 1d) as natural features located on stable rock outcrops. These GCPs remained visible throughout the year, even during peak snow cover, and were used for the remainder of the bi-weekly time-lapse series.
Following the calibration of the 27 September 2023 reference, we processed bi-weekly time-lapse point clouds from 4 March 2023 to 28 February 2025 using a semi-automated SfM workflow (Kneib et al., 2022). We manually selected image sets captured under optimal illumination – typically late morning, when the North-East aspect of the cone was most evenly lit. The 16 GCPs were used to re-calibrate the camera parameters at each epoch, accounting for potential shifts in viewing angles or seasonal variation in lens distortion (Kneib et al., 2022; Ioli et al., 2024). This re-calibration also enabled the seamless integration of a changing camera network, as several units were relocated or added during the summer of 2023 (Fig. 2). Finally, the individual resulting dense point clouds were co-registered to the 27 September 2023 reference using the same ICP-based alignment approach applied to the UAV datasets.
We assessed the uncertainties of the time-lapse photogrammetry using two independent approaches. First, we validated the time-lapse-derived elevation change against the UAV-derived elevation change for overlapping periods. We compared the elevation change patterns rather than the DEMs as we were interested in the relative elevation changes and wanted to avoid being influenced by potentially systematic bias between UAV and time-lapse DEMs. This allowed us to quantify systematic biases – defined as the mean of the residuals – and random noise, characterized by the standard deviation of the residuals. To account for spatial autocorrelation, we computed the variogram of these residuals using the xdem library (Hugonnet et al., 2022; xDEM contributors, 2024), which determined the number of independent pixels for area-weighted uncertainty propagation. Second, we evaluated the internal precision and repeatability of the method by comparing two clusters of near-simultaneous time-lapse DEMs: nine acquisitions from 25–26 May 2024 and nine from 22–24 November 2023. This second experiment provided an estimate of short-term random error. Third, we computed the evolution of the absolute median (bias) and Normalized Median Absolute Deviation (NMAD) of the M3C2 distances over stable terrain relative to the 27 September 2023 reference point cloud. This third experiment allowed us to isolate the influence of seasonality and varying illumination on the photogrammetric reconstruction.
Finally, we conducted a sensitivity analysis to determine how variations in the number of active cameras (Fig. 2) influenced point density and random error. We processed point clouds for 27 September 2023 (12:00 UTC+1) and 28 May 2024 (15:00 UTC+2) using subsets of three, four, and five cameras. Cameras were prioritized for inclusion based on their operational longevity; those with the highest cumulative uptime were retained across all subsets, while less frequently active units were progressively excluded. After co-registration, these test clouds were compared against a reference for each date using the Multiscale Model-to-Model Cloud Comparison (M3C2) algorithm (Lague et al., 2013). For the September 2023 epoch, the reference was a point cloud generated from the full 7-camera array; for the May 2024 epoch, the test clouds were compared directly to the concurrent high-resolution UAV point cloud.
3.3 Mass balance calculations
3.3.1 Theoretical framework
To convert observed elevation changes into mass balance components, we account for the vertical ice flux. Following Jourdain et al. (2023), the local surface mass balance () is expressed as the product of the near-surface density (ρs) and the sum of the surface elevation change () and the submergence velocity (Vsub):
Here, Vsub integrates both the vertical displacement of ice due to glacier dynamics and the effects of firn compaction in layers older than the study period, which we assume to be constant (Cuffey and Paterson, 2010; Jourdain et al., 2023). Following standard convention, upward terms are positive and downward terms are negative.
We leveraged the above equation to quantify the surface mass balance through the following steps:
-
Density derivation: ρs and its associated uncertainties were derived from density profiles conducted on the cone.
-
Submergence velocity quantification: Vsub was quantified using Eq. (1) for specific periods where contemporaneous in situ mass balance measurements () and elevation change data () were both available.
-
Temporal extrapolation of mass balance: for the other periods was derived by assuming a constant Vsub for the duration of the study period and applying it to the bi-weekly elevation change data following Eq. (1).
Following this procedure, mass balance was calculated for distinct areas of the cone across different periods. Uncertainties were propagated from density measurements, elevation change maps, and submergence velocity; for the latter, uncertainties relate to the temporal variability of the near-surface density and to the elevation change. As the variability in near-surface density could not be quantified, we adopted the UAV vertical uncertainty as a proxy for the vertical uncertainty in the submergence and discuss this aspect in Sect. 5.
3.3.2 Ablation stake network
To estimate the vertical ice flux and monitor seasonal mass loss, we maintained an ablation stake network during the 2023 and 2024 summer seasons (Fig. 2). Between 4 May and 27 September 2023, eight stakes were installed on and adjacent to the cone. In the following season, three stakes were re-installed from 29 May to 23 October 2024. Stake placement was constrained by exposure to rockfall and avalanches from the surrounding headwalls. Furthermore, several stakes were lost over the study period, likely due to crevasse opening. For both years we calculated the summer mass balance of the cone for the monitored period by extrapolating the stake measurements on the cone. The mass balance on the cone was also compared to mass balance records from the French glacier monitoring program (GLACIOCLIM), which maintains a network of reference stakes in the main accumulation zone of Argentière Glacier, away from any avalanche influence (Fig. 1).
3.3.3 Submergence velocity
We solved Eq. (1) for Vsub (m d−1) for both summer periods by subtracting the extrapolated stake mass balance ( in m d−1) from the UAV-derived elevation changes ( in m d−1). For this purpose, we manually masked crevasses from the elevation change maps, thereby excluding signals from snow bridge collapses or crevasse expansion. The resulting gaps were filled using a bilinear interpolation and the final Vsub submergence maps were smoothed using a 40×40 m median filter. These estimates of Vsub were compared to the distributed flux divergence values modelled for Argentière Glacier by Kneib et al. (2024b) for the 2012–2021 period.
3.3.4 Density profiles
Between 2023 and 2024, we derived five snow and firn density profiles from the avalanche cone by extracting and weighing firn core segments. Two initial profiles (F1 and F2) were measured on 26 January 2023; these were followed by two additional profiles on 4 May 2023, with one located at the F1 dGPS coordinates to track vertical change. A final profile was recorded on 29 May 2024. In the repeated F1 profile, a distinct stratigraphic horizon was identified between January and May, providing a direct measurement of vertical ice displacement (Jourdain et al., 2023).
3.3.5 GPR measurements
To assess the spatial variability of snow depth, we conducted a Ground-Penetrating Radar (GPR) survey on part of the cone on 4 May 2023. The survey was performed using a GPR system equipped with a pair of 250 MHz antennas, manually dragged on the surface. The GPR lines were planned to intersect the locations close to the density profiles conducted on the same day. The irregular surface and locally steep slopes led to variable antenna coupling and acquisition geometry, introducing local inconsistencies and apparent discontinuities in the GPR sections. Despite these artefacts, crossing points show good agreement between profiles. Processing aimed to improve imaging of the snow base horizon and consisted of time-zero correction, background removal, band-pass filtering (corner frequencies 150–300 MHz), and amplitude recovery. Time-to-depth conversion was performed with a velocity of 0.21 m ns−1, which corresponds to a density in the range of the measured densities on that day (Kovacs et al., 1995). After processing, the snow-firn transition was more clearly recognizable across the profiles, as a laterally continuous reflector. This approach allowed us to spatially extrapolate the discrete density measurements by identifying these continuous stratigraphic reflectors within the snowpack (Jourdain et al., 2023; Patil et al., 2025).
3.3.6 Meteorological data
We compared our mass balance observations against meteorological data from an Automated Weather Station (AWS) maintained by GLACIOCLIM and located near the glacier at 2439 m a.s.l. We estimated baseline snowfall on the cone and its contributing headwalls by applying a standard environmental lapse rate of −6.5 K km−1 to the AWS temperature series. The precipitation phase was partitioned using a linear transition, assuming solid precipitation below 0 °C and liquid precipitation above 2 °C. By combining these partitioned precipitation data with the ablation rates measured at our stakes, we derived a theoretical net mass balance for the cone over the study period. This baseline represents the mass balance expected from direct climatic forcing alone.
4.1 Evaluation of the time-lapse observations
We evaluated the time-lapse elevation change against the UAV reference datasets (1.0 m upper-bound vertical uncertainty). A comparison of elevation change maps revealed systematic seasonal biases: the time-lapse method consistently underestimated the magnitude of the elevation changes, with biases between 2.0 and 3.3 m (Fig. 3). This indicates that while the time-lapse array captures the overall signals, it tends to underestimate the total magnitude of seasonal elevation fluctuations. The NMAD of the residuals – a metric to quantify the measurement spread that is robust to large outliers – ranged between 1.5 and 2.5 m (Fig. 3).
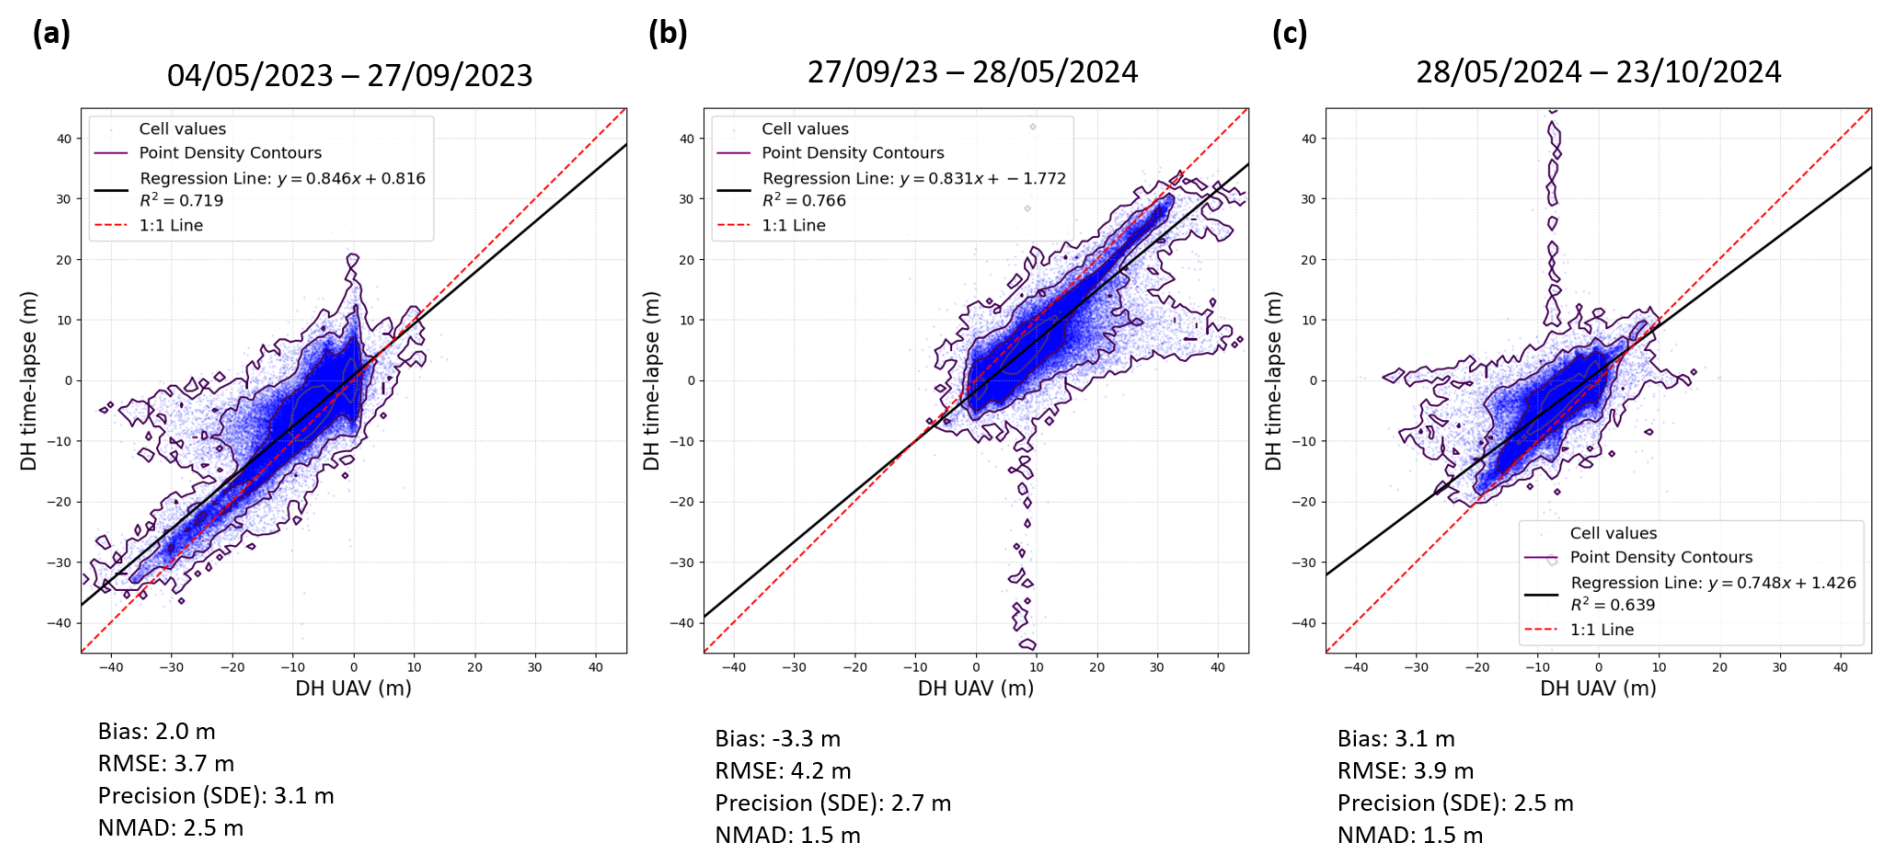
Figure 3Comparison of the elevation change from the time-lapse DEMs and for the UAV DEMs for the ablation-period 2023 (a), the accumulation-period 2023–2024 (b) and the ablation-period 2024 (c). RMSE: Root Mean Square Error. SDE: Standard deviation. NMAD: Normalized Median Absolute Deviation. Point density contours are defined on a logarithmic scale.
These findings are consistent with our intra-day repeatability tests (Fig. S5). Comparing nine DEMs generated within 48 h windows over which we assumed negligible changes (no precipitation and limited melt), we observed biases between 0.02 and 1.8 m and a mean precision (standard deviation) of 3.8 m. This internal precision remained stable between the May and November repeatability tests, with mean absolute biases of 0.5 m in May and 0.6 m in November. The number of active cameras in the array presents a trade-off between point density and reconstruction accuracy (Tables S1–S2). While increasing the camera count from three to five (or seven) improved the average point density (from ∼ 4.2 to ∼ 6.7 points m−2), it also increased the noise. For both the May and September test cases, the highest absolute biases and standard deviations were observed with 5 cameras (reaching 1.0 and 4.4 m, respectively). Conversely, the lowest biases (∼ 0.2 m) were achieved with only 3 cameras. This suggests that as more oblique angles are integrated into the SfM solution, the potential for geometric contradictions increases, though a higher camera count remains necessary for spatial coverage of the complex cone topography. For our setup there were at least 4 cameras available for the whole duration of the survey, so the strongest influence on the number of points and on the bias and precision came from the seasonality (Fig. S6). Indeed, the November–February months had a relatively high bias (0.31 m on average) and NMAD (2.0 m) of M3C2 distances over stable terrain, compared to the March-October months, with bias and NMAD of 0.29 m and 1.6 m, respectively. Similarly, the mean number of points was lower during these winter months (1.4 million) compared to the rest of the year (2.1 million).
4.2 Surface elevation dynamics
The UAV-derived elevation change maps reveal a pronounced spatial gradient between the uppermost part of the cone and its lower extents (Fig. 4). The largest elevation change occurs in the uppermost section, immediately below the bergschrund. In 2023, this zone experienced a seasonal downwasting of ∼ 30 m during the ablation period, followed by a compensatory gain of ∼ 30 m during the 2023–2024 accumulation season (Fig. 4a–b). While the 2024 ablation season showed a smaller negative change (∼ 15 m), this was influenced by early-season snowfall in September 2024. These events triggered significant avalanche deposits at the top of the cone prior to the October 2024 survey, partially masking the summer ablation signal. In contrast, the lower cone – beyond 100 m horizontally from the bergschrund – exhibited more moderate fluctuations, typically on the order of ±10 m. Strong localized signals were also observed in crevassed areas, where snow bridge collapse and crevasse expansion generated high-amplitude positive and negative elevation changes.
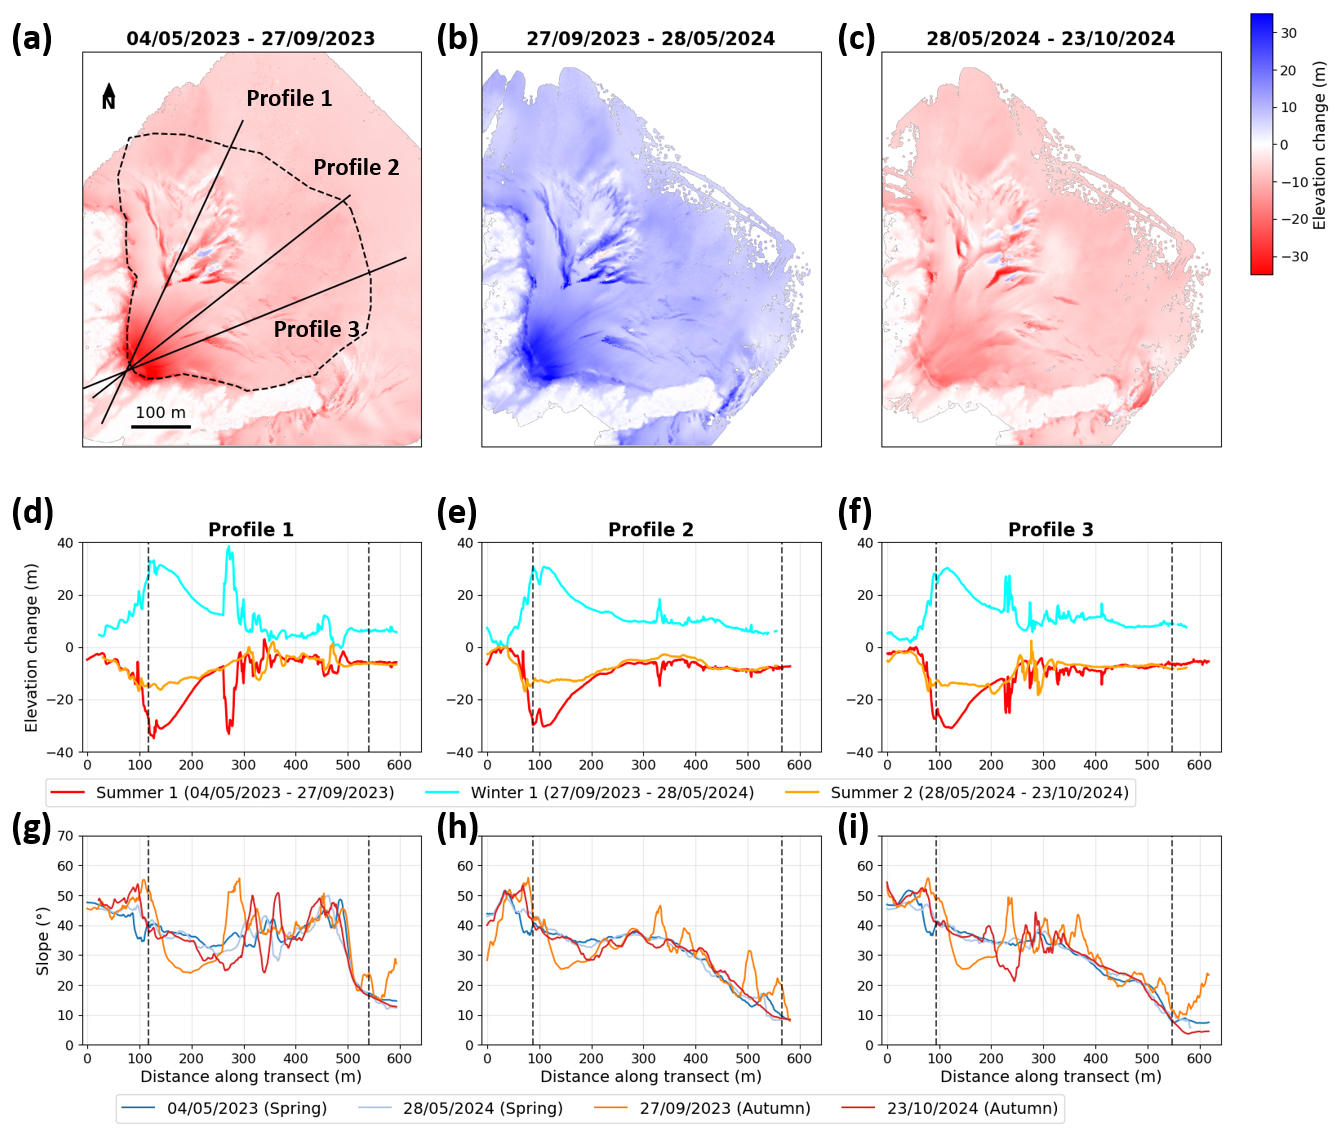
Figure 4Elevation change maps from UAV DEMs. (a) 4 May–27 September 2023. (b) 27 September–28 May 2023. (c) 28 May 2023–23 October 2024. The black lines in panel (a) indicate three transects along which the elevation change and slope values displayed in panels (d)–(i) were extracted. (d–f) Elevation change profiles along the radial transects of panel (a). (g–i) Slope profiles of the different DEMs along the same transects. The slope was smoothed using a 20 m moving average. The dashed black lines correspond to the extents of the cone, with the distance along the transects indicated in the downslope direction.
The bi-weekly time-lapse data mirror these UAV patterns while providing the temporal context for these fluctuations (Fig. 5). Elevation minima were reached in late September 2023 and early September 2024, with peak elevation occurring in April. The maximum amplitude of 30–35 m was consistently located just below the headwall for both years. Radial profiles extracted from the time-lapse DEMs show a characteristic “double-peak” pattern: after the maximum at the top, the amplitude of change decreases to a local minimum of 5–10 m at a distance of 300 m, before increasing again to a secondary peak of 10–15 m between 400 and 500 m (Fig. 5). These spatial patterns remained consistent between the two study years, with the primary deviations restricted to Profile 1, where active crevassing introduced localized variability. Surface slope angles remained relatively stable throughout the study period, with the exception of the uppermost section. In this high-accumulation zone, slopes fluctuated from a minimum of 24° at the end of the ablation season to a maximum of 36° during the spring or following early autumn avalanches (Fig. 4g–i). While localized slope variability was high near active crevasses, the radial profiles revealed two local minima: one at the transition between the headwall and the upper cone – which became more pronounced at the end of the summer ablation – and a second in the lower reaches, where the slope consistently decreased to less than 10°.
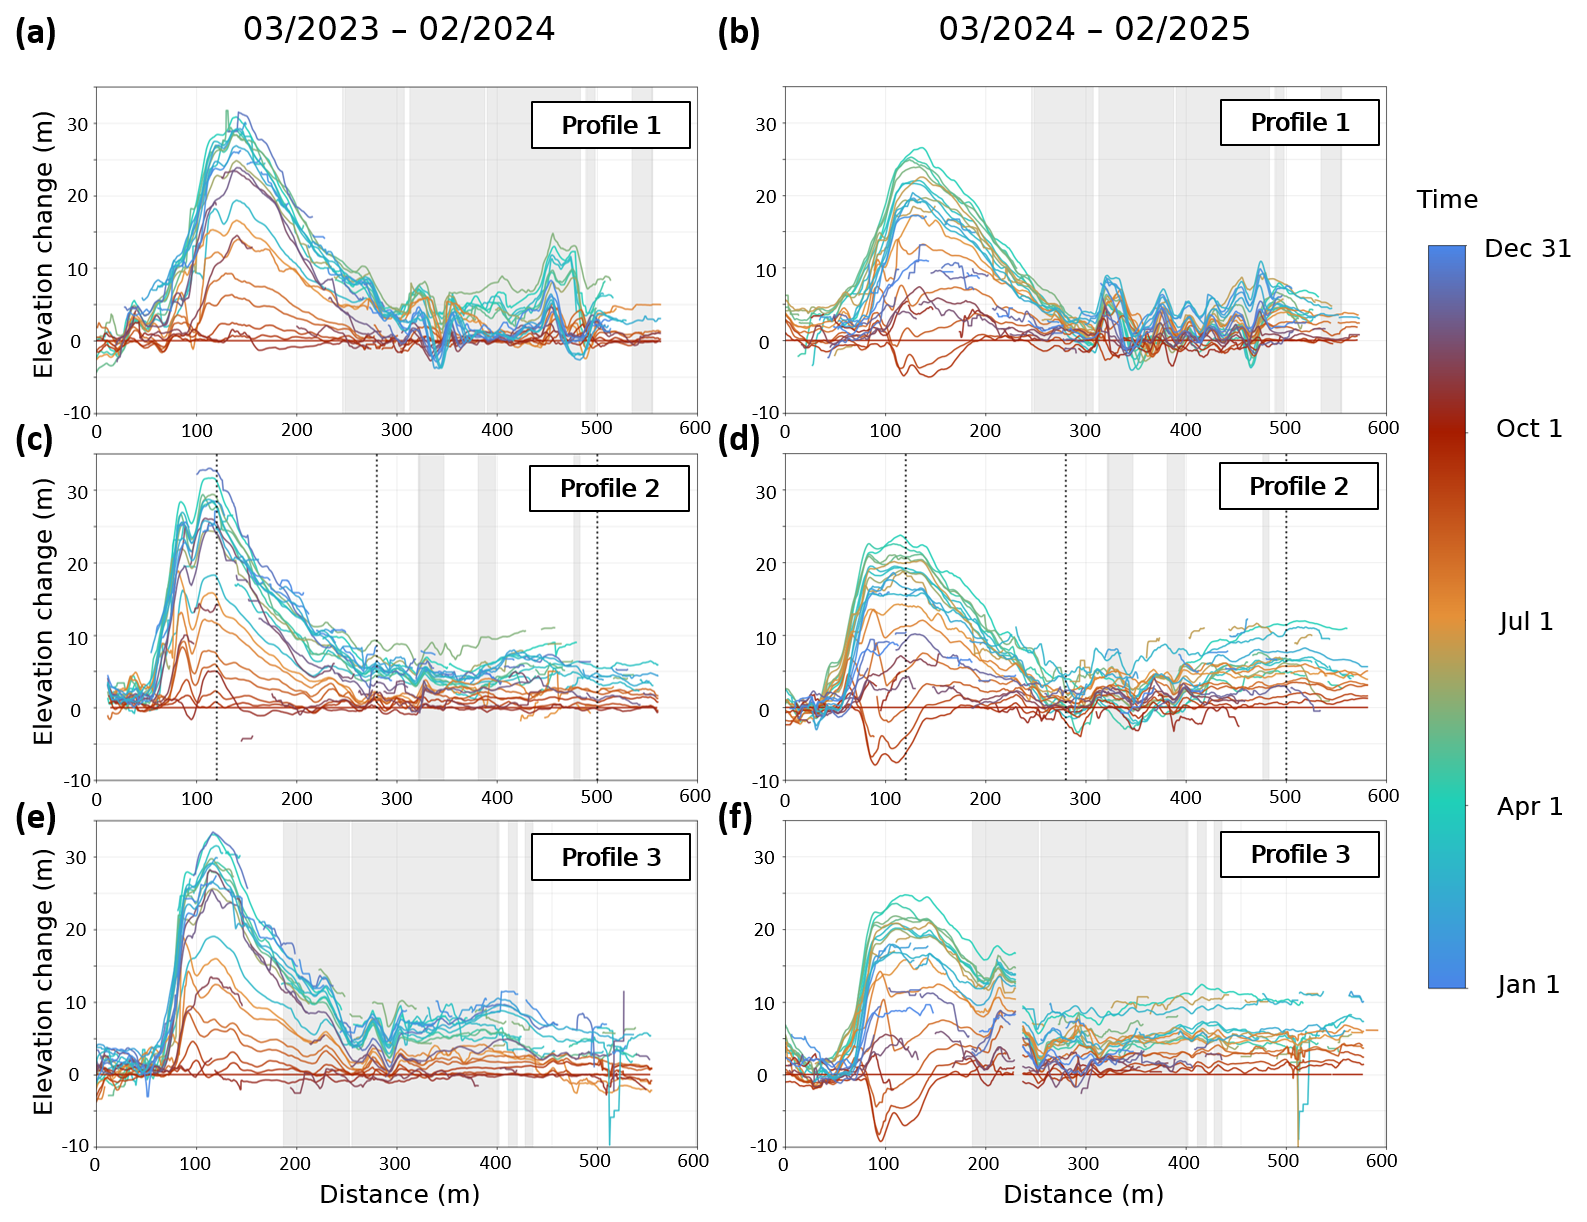
Figure 5Elevation change between the time-lapse DEMs and a reference end-of-summer time-lapse DEM for the periods March 2023–February 2024 (year 1; a, c, e) and March 2024–February 2025 (year 2; b, d, f) along the profiles indicated in Fig. 4a. We used the 27 September 2023 time-lapse DEM as reference for year 1 and the 29 September 2024 time-lapse DEM for year 2. The shaded grey zones correspond to zones affected by crevasses during the study period. The vertical dashed lines correspond to the points used to plot the time series in Fig. 9.
4.3 Surface mass balance
4.3.1 In-situ density and ablation
All profiles showed a densification with depth, and the average snow density across all profiles was 420 ± 50 kg m−3, with the May profiles slightly higher at 430 ± 60 kg m−3 (Fig. 6) than the January profiles. We consider these values to be a lower-bound estimate for the entire annual accumulation layer, as most profiles did not reach the previous year's summer horizon. To account for the denser, underlying firn – previously measured in non-avalanche-fed accumulation zones at 550 ± 30 kg m−3 at the end of the summer period (Thibert et al., 2008; Six and Vincent, 2014) – we adopted a depth-integrated density conversion factor of 500 ± 80 kg m−3 for all subsequent mass balance calculations, which encompasses the mean depth-integrated density estimates while giving reasonable bounds to the density of a snow layer of a few months to a few years old (Cuffey and Paterson, 2010).
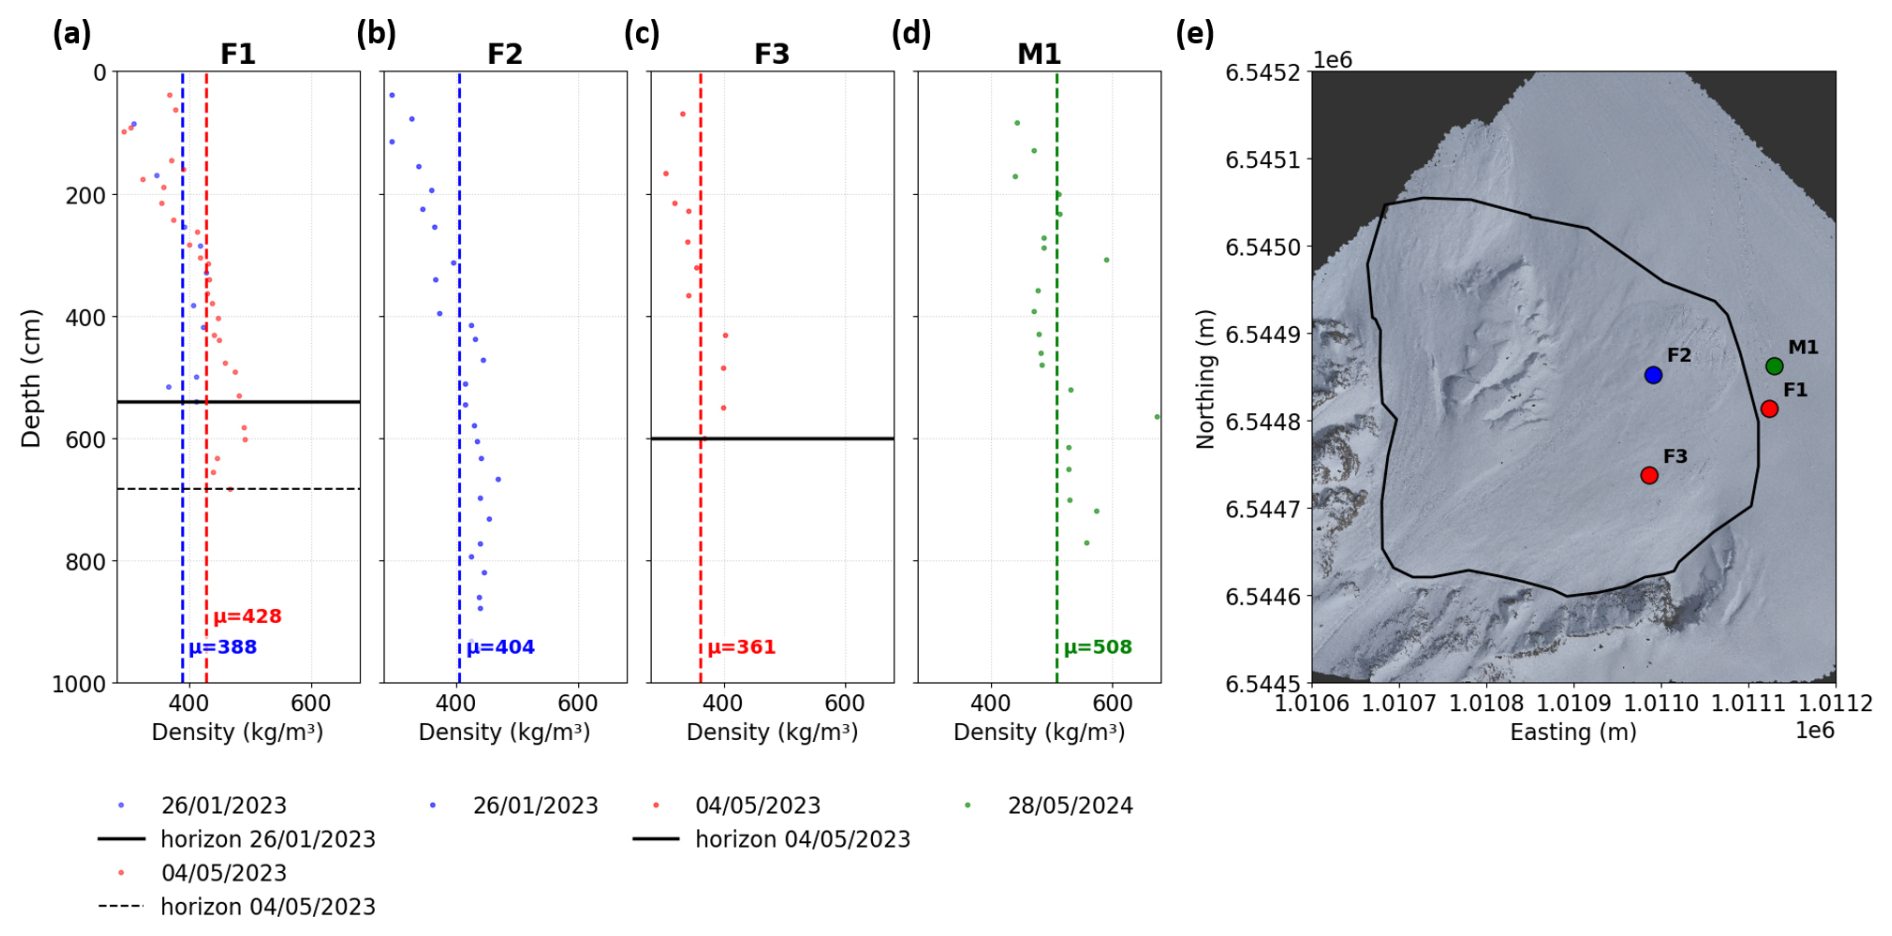
Figure 6Density measurements on and in the vicinity of the cone. (a–d) density profiles at various locations (indicated by the letters) and various dates (indicated by the colours). The vertical dashed lines indicate the mean density of each profile while the horizontal black lines indicate if the profile reached the previous year's horizon. (e) Location of the density measurements with the 4 May 2023 UAV orthoimage as background. Black outlines show the cone extents.
Stake measurements revealed a relatively homogeneous spatial distribution of melt across the cone. During the 2023 ablation season (4 May to 27 September), stake readings ranged between −6.8 and −6.2 m (Fig. 7). Irregular stake length changes were measured for the first half of the period at stakes S3 and S8, but most likely due to the opening of crevasses at these locations (Fig. 7a). Only two stakes survived the summer in 2024 but they also displayed consistent mass balance values of −5.4 and −6.0 m between 29 May 2024 and 23 October 2024. Given this observed uniformity, we applied the mean stake-derived ablation rate to the entire study area. By subtracting this uniform ablation signal from the UAV-derived elevation changes, we isolated the distributed submergence velocity Vsub across the cone for both summer periods (Sect. 4.3.2).
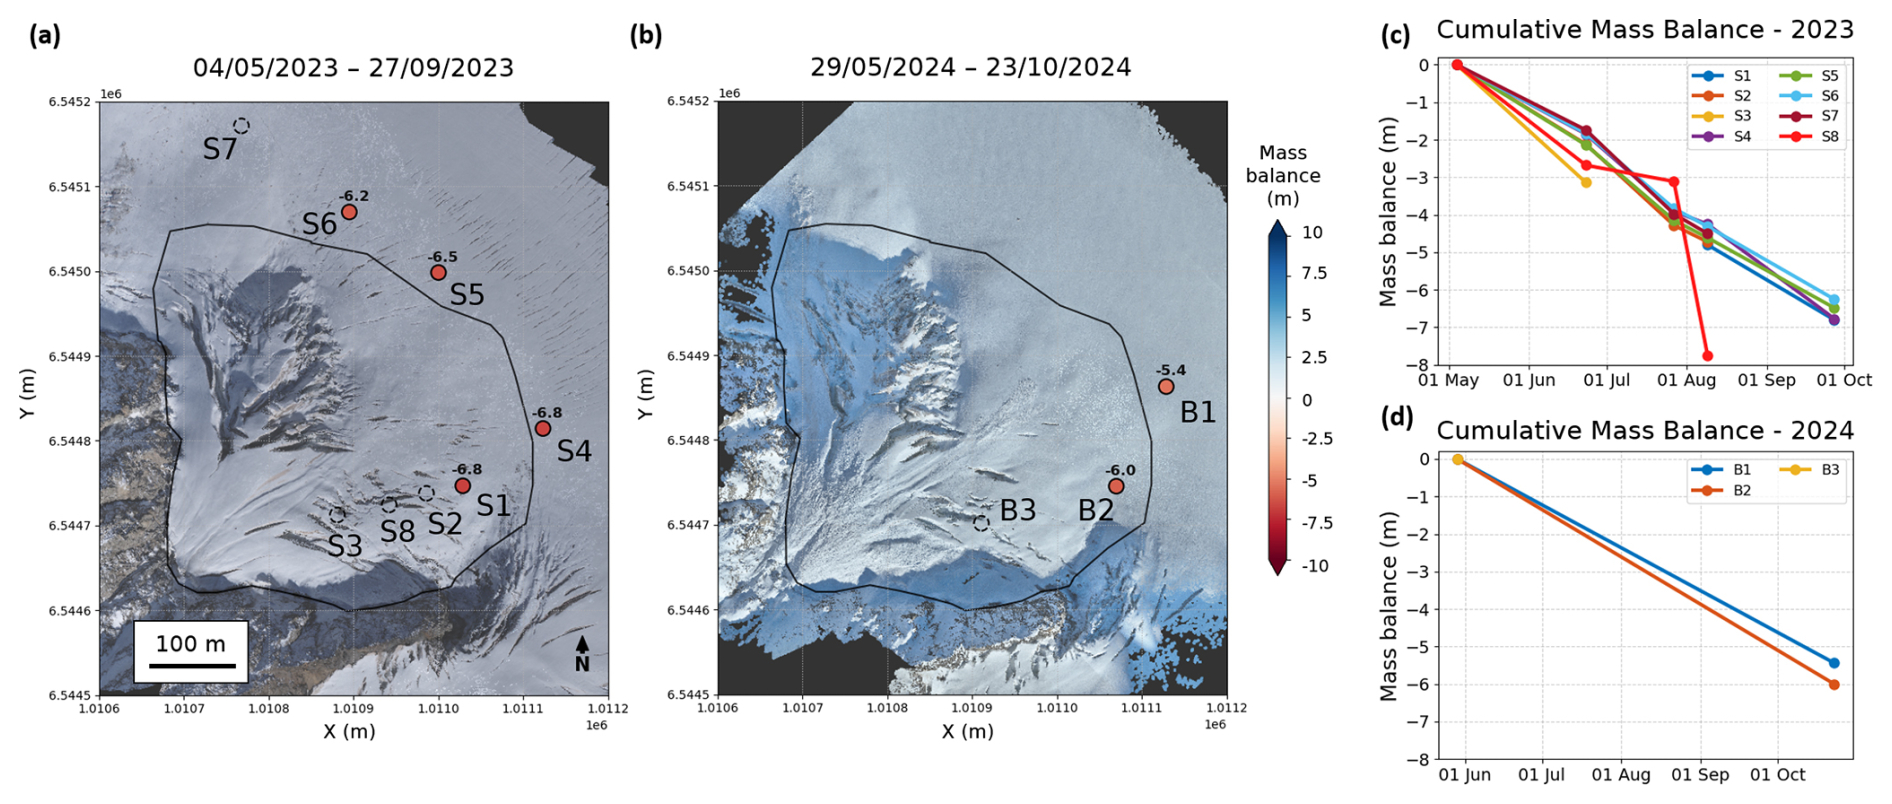
Figure 7In situ measurements at stakes in 2023 and 2024. (a–b) Location of the stakes and respective measured mass balance over the ablation seasons of 2023 and 2024. Empty circles correspond to stakes that were not recovered at the end of the measurement period. The background image is the end-of-period UAV orthoimage. Black outlines show the cone extents. (c–d) Cumulative mass balance measurements at the stake locations.
4.3.2 Submergence velocity
The spatial distribution of Vsub remained consistent across both ablation periods, with mean values of −4.3 m yr−1 in 2023 and −3.4 m yr−1 in 2024 (Fig. 8). A distinct lateral asymmetry was observed in the lower part of the cone: the true left side exhibited positive vertical velocity (emergence), while the true right side showed persistent negative values (submergence). However, velocity was significantly higher in 2023 than in 2024, likely because the later October 2024 UAV survey captured early avalanche accumulation. This violated our assumption of spatial homogeneity of ablation across the cone for the 2024 period. Consequently, we utilized the summer 2023 submergence map as the reference for all subsequent mass balance calculations (Eq. 1). We considered the 1σ uncertainty on the submergence to be the same as the uncertainty on the UAV elevation change, which gave 2.5 m yr−1. We assumed full spatial correlation, so this uncertainty can be interpreted as a conservative estimate. Our locally derived submergence patterns revealed greater spatial heterogeneity and higher magnitudes than those predicted by glacier-wide ice-flux inversions, which estimated an integrated flux divergence of −2.3 ± 1.2 m yr−1 for the cone area over the period 2012–2021 (Fig. 8c, Kneib et al., 2024b).
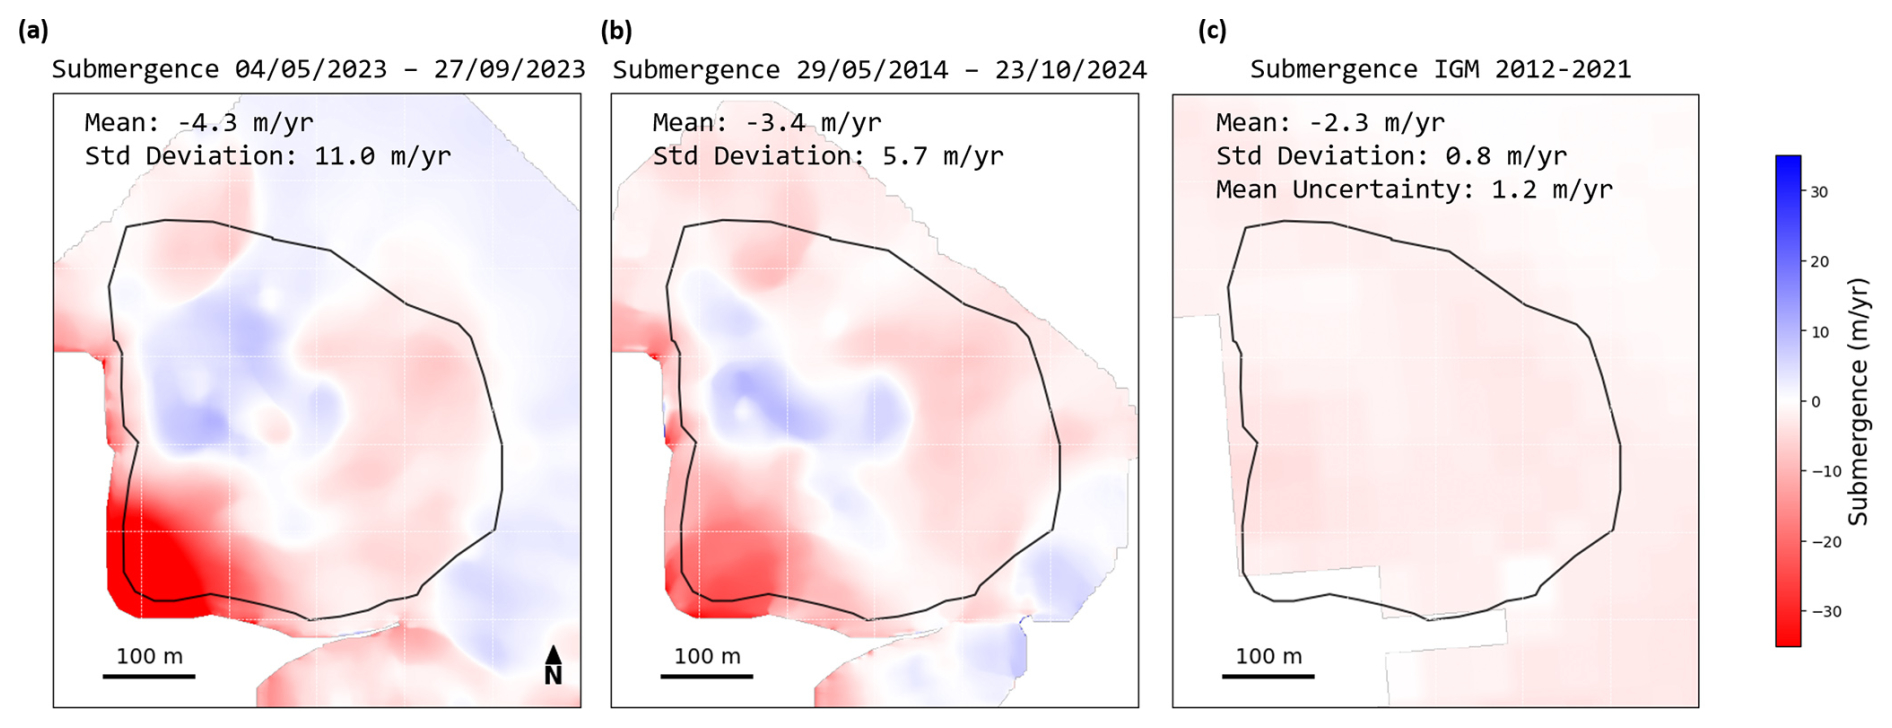
Figure 8Spatial distribution of the submergence at the location of the cone (black outlines) for summer 2023 (a) and summer 2024 (b) after subtraction of the measured mass balance from the elevation change. (c) Spatial distribution of the submergence over the same area from an ice flux inversion using the Instructed Glacier Model (IGM; Kneib et al., 2024b).
We validated the summer-derived Vsub using the stratigraphic horizon identified in our density profiles at location F1 between 26 January and 4 May 2023. During this winter window, the snowpack thickened from 5.40 to 6.91 m, while the surface elevation rose by 1.63 m. This specific point-measurement yielded a local emergence of 0.45 m yr−1. This result agrees with our 2023 summer estimate at that same location (0.2 ± 2.5 m yr−1 emergence).
4.3.3 Dynamics of the on-glacier avalanche cone
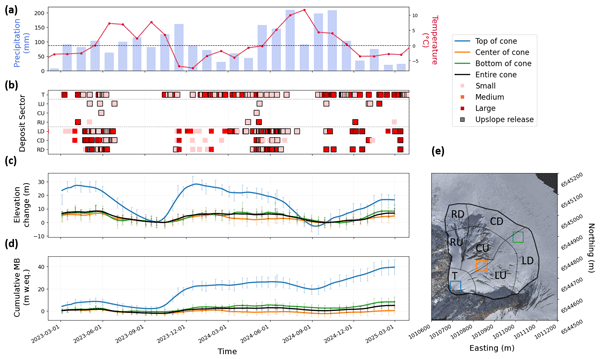
The two-year study period (March 2023–February 2025) was characterized by contrasting meteorological conditions (Fig. 9a). There were no avalanche events visible in the summer 2023, which was characterized by only 279 mm of precipitation in June–July–August. The 2023–2024 winter was characterized by a wet November 2023 (161 mm precipitation, 351 mm between November and February), with numerous avalanches. The 2024 summer was wetter than the previous one, with 447 mm of precipitation in June–July–August, which partly fell as snow at high elevation. As a result, avalanches occurred every month from October 2023 to the end of the survey period in February 2025 (Fig. 9b). The start of the 2024–2025 winter was significantly drier than 2023–2024, receiving 235 mm of precipitation between November and February, with also less avalanches.
Our visual analysis and surface elevation time series indicate a phase lag in accumulation across the cone's altitudinal profile (Fig. 9). The uppermost sectors were most active during the early winter (September–December), particularly in November 2023 with an accumulation of 8.7 ± 3.5 m w.e. in a single month. As the season progressed and the upper slopes reached an angle of ∼ 35° (Fig. 4g–i), avalanche run-out distances increased. This led to a peak in both elevation change and accumulation for the lower sectors of the cone several months later, between April and June. The central sectors remained relatively stable, with very few deposits coming to rest in this mid-slope transition zone (Fig. 9b).
After correcting for submergence, we identified high localized mass balance values in the uppermost extents of the cone (Fig. 9d). Between early March 2023 and late February 2024, the top of the cone reached a peak annual mass balance of 23.3 ± 4.4 m w.e., followed by 16.3 ± 3.5 m w.e. in the subsequent year. The lower sections exhibited more moderate accumulation, with balances of 3.5 ± 2.4 m w.e. (2023/24) and 4.8 ± 2.5 m w.e. (2024/25). Notably, the central sectors remained nearly neutral over the two years (0.5 ± 2.3 m w.e.). When integrated across the entire survey domain, the cone-wide mass balance was 2.3 ± 2.3 m w.e. for 2023/24 and 2.7 ± 2.4 m w.e. in 2024/25. In contrast, the four GLACIOCLIM accumulation stakes – located between 2890 and 2980 m a.s.l. in non-avalanche-fed areas – recorded average annual balances of 0.3 ± 0.1 m w.e. for the hydrological year 2023 and 0.8 ± 0.4 m w.e. in 2024. In comparison, the annual mass balance was 49 ± 16 times higher on the top of the cone, 9 ± 5 times higher in the lower extents, and 6 ± 4 times higher for the cone as a whole. As a result, while the cone represented only 1.7 % of the accumulation zone of Argentière, it contributed 6.8 ± 6.4 % of the total accumulation when compared to the spatially interpolated stake measurements in the accumulation zone.
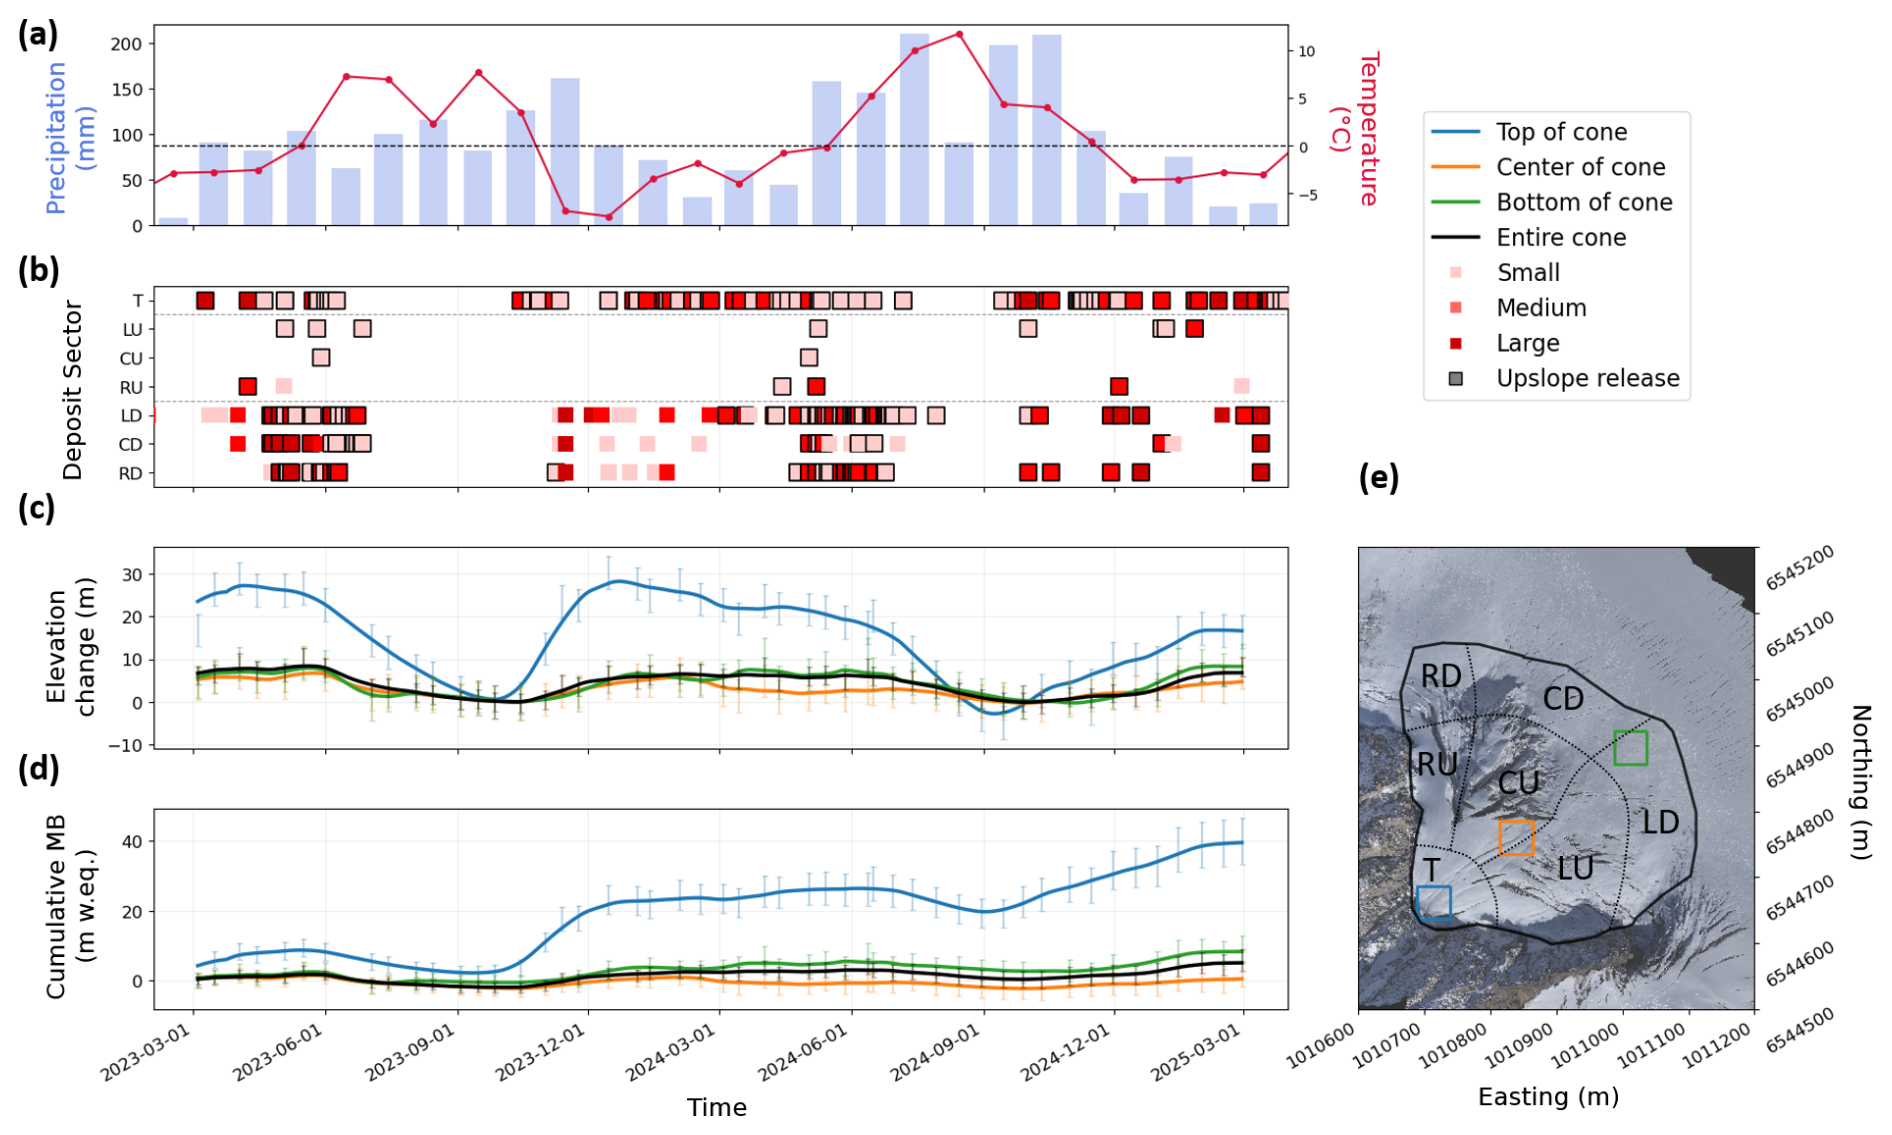
Figure 9Spatio-temporal dynamics of the cone. (a) Monthly precipitation and temperature time-series from the AWS located at 2435 m a.s.l., in the vicinity of the glacier. (b) Avalanche events (squares) identified in the images of Camera 5 and categorized based on their size (colours) and the cone sector reached by the avalanche deposit (y-labels). Squares are outlined in black if the avalanche was released above the cone, while for the others the avalanche released from within the cone. The different sectors are shown in (e). (c) Elevation change time-series of 50×50 m areas at the top (blue), centre (orange) and bottom (green) of the cone, and for the entire cone (black). Corresponding zones are shown in (e). The curves were obtained by linearly interpolating the camera-derived DEM time series and smoothing using a 40 d mean window. (d) Cumulative mass balance for the same areas. (e) Map of the cone with the different sectors and areas. 27 September 2023 orthoimage as background. T: Top of cone. LU: Left-Up. CU: Centre Up. RU: Right Up. LD: Left Down. CD: Centre Down. RD: Right Down.
5.1 Potential of time-lapse photogrammetry to quantify surface changes of dynamic glacier surfaces
The time-lapse photogrammetric network deployed in this study represents a balance between high temporal resolution, quantitative observations and low-cost equipment. Despite the relatively high vertical uncertainties compared to more expensive systems, the ∼ EUR 350 per unit cost allowed for a multi-camera array capable of capturing daily to bi-weekly surface evolution of a glacier landform at ∼ 1 km distance. Combining the bias and precision, our time-lapse DEMs had an elevation change uncertainty of 6 m, an important part of which came from a systematic bias which resulted in an underestimation of the elevation changes and could not be reduced by spatial averaging. This underestimation is likely due to the different viewing angles of the time-lapse cameras, which are strongly off-nadir relative to the UAV (e.g. Wackrow and Chandler, 2011). This uncertainty translated into an uncertainty-to-range ratio of approximately 1:150 (1 m of uncertainty with 150 m distance). This is higher than the ratios reported for more sophisticated setups ranging between 1:650 and 1:5000 (James and Robson, 2012; Smith and Vericat, 2015; Filhol et al., 2019; Kneib et al., 2022; Ioli et al., 2024). The divergence in these ratios may be tied to differing error calculation methodologies, but more critically, the environmental constraints are likely to considerably affect the quality of the resulting point clouds. Monitoring the accumulation area of the Argentière Glacier was particularly challenging due to high snow accumulation leading to the loss and relocation of cameras (Fig. S3), poor illumination in winter and shadows the rest of the year, in addition to the lack of texture on homogeneous snow surfaces which are known to increase noise in SfM reconstructions (Revuelto et al., 2021). Interestingly, our sensitivity analysis suggested that while additional cameras expanded spatial coverage, they slightly reduced overall accuracy, likely due to the introduction of conflicting oblique geometries. However, for our setup there were at least 4 time-lapse cameras available during the whole duration of the study period, which meant that the strongest influence on the point cloud precision, bias and number of points came from the seasonality, with less points and higher uncertainties in the winter months (November–February) with low light conditions, extensive shading and smooth snow surfaces (Fig. S6). Nonetheless, the seasonal effect on the uncertainties remained limited with a 25 % increase in NMAD and 7 % increase in bias on average during the winter months (Fig. S6). Ultimately, the high frequency of data acquisition provided useful insights into the timing of mass distribution that would be impossible to capture via traditional UAV or LiDAR surveys.
Converting surface elevation change to surface mass balance remains challenging due to the important sources of uncertainty. Our snow density profiles highlighted a highly variable density, both spatially and temporally, which confirms past observations conducted on off-glacier avalanche deposits where the density varied between 200 and 700 kg m−3 (McClung and Schaerer, 1985; Dent et al., 1998; Vallet et al., 2001; Sovilla et al., 2006; Hao et al., 2021; Kern, 2023). Logistical and safety constraints precluded direct sampling at the top of the cone, introducing a potential bias in our peak accumulation estimates. To mitigate this, we adopted a wide uncertainty margin of ±80 kg m−3, similar to the conservative uncertainty bounds introduced by Jourdain et al. (2023) for the accumulation zone of the Mer de Glace, in the Mont-Blanc massif.
Beyond density, our derivation of surface mass balance relies on two fundamental assumptions regarding the submergence velocity: the spatial homogeneity of summer ablation and the temporal consistency of Vsub over seasonal scales. While the loss of the stakes located on the upper part of the cone limited our ability to directly measure ablation at the top of the cone, we justify our extrapolation of a uniform mass balance in summer 2023 based on three factors. First, distributed energy-balance modelling by Roussel et al. (2025) indicates consistent incoming shortwave radiation and ablation rates in this specific area. Second, our time-lapse data confirmed the absence of major avalanche events during the 2023 calibration period (Fig. 9b). Third, when comparing summer 2023 and 2024 data in regions unaffected by late-season avalanches, we observed consistent Vsub values (Fig. 8).
The assumption of a temporally constant Vsub remains a significant simplification. Our observational framework does not fully constrain the temporal variability of submergence in a setting characterized by rapid thickness fluctuations, which likely drive temporal changes in both driving stresses and compaction rates – potentially affecting even the near-surface snow layers during the ablation season. These uncertainties are likely most pronounced at the top of the cone, where thickness changes are maximized and logistical constraints precluded in situ measurements. While the stationarity of ice flow and surface slopes is well-documented in non-avalanche-fed accumulation zones (Stocker-Waldhuber et al., 2019; Vincent et al., 2020), including in the Argentière basin (Kneib et al., 2024b), such assumptions are more difficult to validate in our avalanche-fed system. We note that because our calibration period for Vsub encompassed the full range of annual cone elevations, these transient effects are likely at least partly integrated into our estimated uncertainty range, and despite these limitations, our derived Vsub maps offer a critical refinement of the spatially smoothed flux inversions from remote sensing studies (Kneib et al., 2024b). Future investigations into these dynamic adjustments are recommended, though the logistical challenges of monitoring such high-relief environments remain considerable.
5.2 Accumulation dynamics
The time-lapse data reveal a progressive shift in mass accumulation governed by slope-dependent depositional thresholds. The cone's evolution is characterized by a “top-down” filling mechanism. In early winter, avalanche deposits increase the upper cone surface slope. Once the slope reaches a threshold of ∼ 35° (Fig. 4g–i), deposition ceases in the upper sector, which subsequently functions as transport zones, as for the central sectors. This is consistent with the findings of Sovilla et al. (2010), who observed a decay in snow deposition depth as slope angles increase, with close to no snow accumulating beyond 35°. This morphological limit also explains the near-zero annual mass balance in the central sector. This pattern was corroborated by the GPR survey (4 May 2023), which recorded up to 12 m of winter snow depth in the lower sectors compared to ∼ 4 m in the central region (Fig. S7).
By May of each year, we observed deeply cut surface channelization at the surface of the cone which further enhanced the spatial variability of the mass distribution, routing high-density spring avalanches toward the lower parts of the cone while potentially eroding older deposits in the upper sectors (Fig. S8). We also observed a significant lateral variability in mass accumulation. The true left sector of the cone exhibits emergence velocity patterns and negligible avalanche accumulation due to its bulged shape leading to the avalanches depositing on either side. This part of the cone effectively behaves as a small independent flow unit, possibly flowing over a bump in the bedrock. Conversely, the true right sector and the top of the cone receive the bulk of the gravitational mass redistribution.
5.3 Relative importance of local accumulation from avalanches
The accumulation rates measured on the Argentière cone represent an extreme case of localized mass gain, aligning with previous studies on ice-debris fans (Kochel and Trop, 2012; Jacob et al., 2021) and field-based assessments of avalanche contributions to glacier mass balance, which have measured snow depths higher than 12 m (Purdie et al., 2015; Hynek et al., 2024) and up to 32 m (Mott et al., 2019) at different on-glacier avalanche deposits of various glaciers. The system exhibits strong spatial variability with mass balance values close to zero in the nearby non-avalanche-fed areas.
We made a direct estimate of the cone's mass balance by calculating the total snow accumulation on the cone and in the above headwall based on the meteorological observations of precipitation and air temperature, and the ablation on the cone by extrapolating the stake measurements (Fig. S9). This suggested a net ablation for the cone area, which disagreed with the actual measured balance from our UAV and time-lapse time series. This discrepancy is partly driven by the strong early-winter accumulation patterns, but it also points to the inherent difficulty of constraining high-elevation solid precipitation in steep terrain, despite the presence of a nearby meteorological station (Miao et al., 2024). The decoupling of the snow precipitation and accumulation on the cone could also be caused by the retention of snow on the headwall during the winter, introducing a delay between the snowfall and the redistribution on the cone (Fig. S10). This decoupling could be enhanced even more by the presence of a hanging glacier above similar cones, which could store and release mass over multi-year cycles (Ravanel et al., 2023).
Our measurements provide a high-resolution benchmark for regional models. For instance, the SnowSlide parameterization of gravitational snow redistribution by avalanches estimated an additional accumulation of 1.5 ± 0.4 m w.e. yr−1 for the cone over the period 2012–2021, with some local values reaching 3.9 ± 0.4 m w.e. yr−1 (Kneib et al., 2024b). This is significantly lower than our observed values of 23 ± 4 m w.e. in 2023 and 16 ± 4 m w.e. in 2024, but aligned with the cone-wide mass balance of 2.3 ± 2.3 m w.e. for 2023/24 and 2.7 ± 2.4 m w.e. in 2024/25, relative to the annual mass balance measured in the accumulation zone outside of the cone (0.3 ± 0.1 m w.e. in 2023 and 0.8 ± 0.4 m w.e. in 2024). This validates the overall mass redistribution predicted by SnowSlide, despite the fact that it misses the extreme accumulation values, likely due to the coarse resolution of the DEM used (30 m, Kneib et al., 2024b). These avalanche cones act as accumulation “hotspots”, with this particular cone contributing 6.8 ± 6.4 % of the total accumulation for only 1.7 % of the accumulation area, so an accumulation enhancement factor of 4.0 ± 3.8. On a glacier of Argentière's scale, these cones represent a secondary contribution compared to main-trunk accumulation (Kneib et al., 2024b), however for smaller mountain glaciers, this mechanism becomes the primary driver of mass turnover (Purdie et al., 2015; Mott et al., 2019; Kneib et al., 2025).
While time-lapse photogrammetry has provided unique insights into the magnitude and timing of the above processes, the logistical and technical difficulties of monitoring such extreme environments remain a significant bottleneck for validating models aiming at accounting for this contribution. Relying solely on in-situ or terrestrial remote sensing is likely insufficient to fully constrain the mass turnover of on-glacier avalanche cones at larger scales however we note that a major step toward more accurate modelling of these processes will depend on our ability to better constrain high-elevation precipitation – the critical and currently under-determined input that drives these gravitational mass-flux enhancements (Immerzeel et al., 2015; Miao et al., 2024; Aguayo et al., 2024).
This study quantifies the extreme mass turnover of an on-glacier avalanche cone using a low-cost terrestrial photogrammetric array. By integrating hourly time-lapse imagery with UAV-derived elevation changes and in situ data, we isolated the seasonal dynamics of an active avalanche cone on Argentière Glacier. While the uncertainty-to-range ratio of 1:150 is lower than that of high-end monitoring systems, the low-cost setup successfully resolved high-amplitude mass-flux signals that are typically missed in seasonal surveys. The results reveal localized annual mass balance peaks reaching 23 ± 4 m w.e. in 2023 and 16 ± 4 m w.e. in 2024, representing a 49-fold enhancement relative to annual mass balance measurements conducted in non-avalanche-fed locations of the accumulation zone. This strong influx is accommodated by high local submergence rates and governed by a critical slope threshold of ∼ 35°, beyond which the cone surface transitions from a depositional to a transport-dominated regime. As glaciers retreat into high-relief cirques, the accurate representation of these gravitational processes in numerical models will depend on better constraints for high-elevation precipitation and the integration of high-resolution terrestrial monitoring.
The codes to process the time-lapse DEMs are available on GitHub: https://github.com/MarinKneib/TimeLapse_photogrammetry (last access: 11 September 2026; DOI: https://doi.org/10.5281/zenodo.22800142, Kneib, 2026a). Processing of the point clouds into elevation change rely on py4dgeo (https://github.com/3dgeo-heidelberg/py4dgeo, py4dgeo Development Core Team, 2022) and xdem (https://doi.org/10.5281/zenodo.19636034, xDEM contributors, 2024).
DEMs, orthoimages, point clouds, mass balance measurements and GPR measurements will are available on Zenodo: https://doi.org/10.5281/zenodo.22712764 (Kneib, 2026b).
The supplement related to this article is available online at https://doi.org/10.5194/tc-20-5327-2026-supplement.
Conceptualisation: MK, PW, LA. Data curation: MK. Formal analysis: MK, LB, AKW, IS. Funding acquisition: MK, PW. Investigation: all authors contributed to at least part of the investigation. Methodology: MK, PW, LA, OL, BJ, AD, EL, FB, TF. Writing (original draft preparation): MK. Writing (review and editing): all authors contributed.
At least one of the (co-)authors is a member of the editorial board of The Cryosphere. The peer-review process was guided by an independent editor, and the authors also have no other competing interests to declare.
Publisher's note: Copernicus Publications remains neutral with regard to jurisdictional claims made in the text, published maps, institutional affiliations, or any other geographical representation in this paper. The authors bear the ultimate responsibility for providing appropriate place names. Views expressed in the text are those of the authors and do not necessarily reflect the views of the publisher.
The Pléiades image used in this study was obtained through the Kalideos–Alpes project (https://alpes.kalideos.fr, last access: 11 January 2026) funded by the French Space Agency (Centre National d'Etudes Spatiales, CNES) and the DINAMIS initiative through the research infrastructure DATA TERRA (https://dinamis.data-terra.org/, last access: 11 January 2026). The authors thank the GLACIOCLIM monitoring service (CNRS-INSU, UGA-OSUG, IRD, INRAE, IPEV, Météo France) for the in-situ surface mass balance measurements (https://glacioclim.osug.fr/, last access: 11 January 2026). Special thanks to Luc Piard for the design of the 3D printed pieces to mount the cameras, and to all the field helpers: Thomas Chauve, Adrien Gilbert, Victor Ramseyer, Guillem Carcanade, Auguste Basset, Luc Beraud, Alexis Buffet, Coline Kneib, Fleur Kneib and Jean-Paul Kneib. The author(s) used an AI-based language model for the sole purpose of technical text refinement and linguistic editing during the preparation of this manuscript.
This project has received funding from the Swiss National Science Foundation (SNSF) under the Postdoc.Mobility programme, grant agreement P500PN_210739, CAIRN, “Contribution of avalanches to glacier mass balance” and grant agreement P5R5PN_225605, CAIRN-GLOBAL, “Contribution of avalanches to glacier mass balance at the global scale”. Authors from IGE acknowledge the support from the LabEx OSUG@2020 (Investissements d'Avenir – ANR10 LABX56).
This paper was edited by Jürg Schweizer and reviewed by Rebecca Mott and one anonymous referee.
Aguayo, R., Maussion, F., Schuster, L., Schaefer, M., Caro, A., Schmitt, P., Mackay, J., Ultee, L., Leon-Muñoz, J., and Aguayo, M.: Unravelling the sources of uncertainty in glacier runoff projections in the Patagonian Andes (40–56° S), The Cryosphere, 18, 5383–5406, https://doi.org/10.5194/tc-18-5383-2024, 2024.
Benn, D. I. and Lehmkuhl, F.: Mass balance and equilibrium-line altitudes of glaciers in high-mountain environments, Quatern. Int., 65–66, 15–29, https://doi.org/10.1016/S1040-6182(99)00034-8, 2000.
Bernhardt, M. and Schulz, K.: SnowSlide: A simple routine for calculating gravitational snow transport, Geophys. Res. Lett., 37, https://doi.org/10.1029/2010GL043086, 2010.
Besl, P. J. and McKay, N. D.: Method for registration of 3-D shapes, 586–606, https://doi.org/10.1117/12.57955, 1992.
Brun, F., Wagnon, P., Berthier, E., Jomelli, V., Maharjan, S. B., Shrestha, F., and Kraaijenbrink, P. D. A.: Heterogeneous Influence of Glacier Morphology on the Mass Balance Variability in High Mountain Asia, J. Geophys. Res.-Earth, 124, 1331–1345, https://doi.org/10.1029/2018JF004838, 2019.
Burger, F., Ayala, A., Farias, D., Shaw, T. E., MacDonell, S., Brock, B., Mcphee, J., and Pellicciotti, F.: Interannual variability in glacier contribution to runoff from a high-elevation Andean catchment: understanding the role of debris cover in glacier hydrology, Hydrol. Process., 33, 214–229, https://doi.org/10.1002/hyp.13354, 2018.
Cuffey, C. and Paterson, W. S. B.: The Physics of Glaciers, Academic Press, ISBN 9780123694614, 2010.
Dadic, R., Mott, R., Lehning, M., and Burlando, P.: Wind influence on snow depth distribution and accumulation over glaciers, J. Geophys. Res.-Earth, 115, https://doi.org/10.1029/2009JF001261, 2010.
Dent, J. D., Burrell, K. J., Schmidt, D. S., Louge, M. Y., Adams, E. E., and Jazbutis, T. G.: Density, velocity and friction measurements in a dry-snow avalanche, Ann. Glaciol., 26, 247–252, https://doi.org/10.3189/1998AoG26-1-247-252, 1998.
Filhol, S., Perret, A., Girod, L., Sutter, G., Schuler, T. v, and Burkhart, J. F.: Time‐Lapse Photogrammetry of Distributed Snow Depth During Snowmelt, Water Resour. Res., 55, 7916–7926, https://doi.org/10.1029/2018WR024530, 2019.
Gruber, S.: A mass-conserving fast algorithm to parameterize gravitational transport and deposition using digital elevation models, Water Resour. Res., 43, https://doi.org/10.1029/2006WR004868, 2007.
Hao, J., Mind'je, R., Liu, Y., Huang, F., Zhou, H., and Li, L.: Characteristics and hazards of different snow avalanche types in a continental snow climate region in the Central Tianshan Mountains, J. Arid Land, 13, 317–331, https://doi.org/10.1007/s40333-021-0058-5, 2021.
Hugonnet, R., Brun, F., Berthier, E., Dehecq, A., Mannerfelt, E. S., Eckert, N., and Farinotti, D.: Uncertainty Analysis of Digital Elevation Models by Spatial Inference From Stable Terrain, IEEE J. Sel. Top. Appl. Earth Obs. Remote Sens., 15, 6456–6472, https://doi.org/10.1109/JSTARS.2022.3188922, 2022.
Hynek, B., Binder, D., Citterio, M., Larsen, S. H., Abermann, J., Verhoeven, G., Ludewig, E., and Schöner, W.: Accumulation by avalanches as a significant contributor to the mass balance of a peripheral glacier of Greenland, The Cryosphere, 18, 5481–5494, https://doi.org/10.5194/tc-18-5481-2024, 2024.
Immerzeel, W. W., Wanders, N., Lutz, A. F., Shea, J. M., and Bierkens, M. F. P.: Reconciling high-altitude precipitation in the upper Indus basin with glacier mass balances and runoff, Hydrol. Earth Syst. Sci., 19, 4673–4687, https://doi.org/10.5194/hess-19-4673-2015, 2015.
Ioli, F., Dematteis, N., Giordan, D., Nex, F., and Pinto, L.: Deep Learning Low-cost Photogrammetry for 4D Short-term Glacier Dynamics Monitoring, PFG – Journal of Photogrammetry, Remote Sensing and Geoinformation Science, 92, 657–678, https://doi.org/10.1007/s41064-023-00272-w, 2024.
Jacob, R. W., Trop, J. M., and Kochel, R. C.: Subsurface architecture of alpine icy debris fans: Integration of ground-penetrating radar and surface observations in Alaska and New Zealand, Geomorphology, 375, 107544, https://doi.org/10.1016/j.geomorph.2020.107544, 2021.
James, M. R. and Robson, S.: Straightforward reconstruction of 3D surfaces and topography with a camera: Accuracy and geoscience application, J. Geophys. Res.-Earth, 117, https://doi.org/10.1029/2011JF002289, 2012.
Jouberton, A., Shaw, T. E., Miles, E., Kneib, M., Fugger, S., Buri, P., McCarthy, M., Kayumov, A., Navruzshoev, H., Halimov, A., Kabutov, K., Homidov, F., and Pellicciotti, F.: Snowfall decrease in recent years undermines glacier health and meltwater resources in the Northwestern Pamirs, Commun. Earth Environ., 6, 691, https://doi.org/10.1038/s43247-025-02611-8, 2025.
Jourdain, B., Vincent, C., Réveillet, M., Rabatel, A., Brun, F., Six, D., Laarman, O., Piard, L., Ginot, P., Sanchez, O., and Berthier, E.: A method to estimate surface mass-balance in glacier accumulation areas based on digital elevation models and submergence velocities, J. Glaciol., 69, 1403–1418, https://doi.org/10.1017/jog.2023.29, 2023.
Kern, H.: Le dépôt d'avalanche: une nouvelle variable dans la connaissance du risque avalancheux, https://theses.fr/2023PA01H003 (last access: 16 September 2026), 2023.
Kneib, M.: MarinKneib/TimeLapse_photogrammetry: TLphotogrammetry_v0.0.1, Zenodo [software], https://doi.org/10.5281/zenodo.22800142, 2026a.
Kneib, M.: Data for 'Substantial accumulation rates on a glacier avalanche cone from time-lapse photogrammetry and field measurements', Zenodo [data set], https://doi.org/10.5281/zenodo.22712764, 2026b.
Kneib, M., Miles, E. S., Buri, P., Fugger, S., McCarthy, M., Shaw, T. E., Chuanxi, Z., Truffer, M., Westoby, M. J., Yang, W., and Pellicciotti, F.: Sub-seasonal variability of supraglacial ice cliff melt rates and associated processes from time-lapse photogrammetry, The Cryosphere, 16, 4701–4725, https://doi.org/10.5194/tc-16-4701-2022, 2022.
Kneib, M., Dehecq, A., Brun, F., Karbou, F., Charrier, L., Leinss, S., Wagnon, P., and Maussion, F.: Mapping and characterization of avalanches on mountain glaciers with Sentinel-1 satellite imagery, The Cryosphere, 18, 2809–2830, https://doi.org/10.5194/tc-18-2809-2024, 2024a.
Kneib, M., Dehecq, A., Gilbert, A., Basset, A., Miles, E. S., Jouvet, G., Jourdain, B., Ducasse, E., Beraud, L., Rabatel, A., Mouginot, J., Carcanade, G., Laarman, O., Brun, F., and Six, D.: Distributed surface mass balance of an avalanche-fed glacier, The Cryosphere, 18, 5965–5983, https://doi.org/10.5194/tc-18-5965-2024, 2024b.
Kneib, M., Maussion, F., Brun, F., Carcanade, G., Farinotti, D., Huss, M., van Tiel, M., Jouberton, A., Schmitt, P., Schuster, L., Dehecq, A., and Champollion, N.: Topographically-controlled contribution of avalanches to glacier mass balance in the 21st century, Nat. Commun., 16, 10122, https://doi.org/10.1038/s41467-025-65608-z, 2025.
Kochel, R. C. and Trop, J. M.: Active processes, morphology, and dynamics of icy debris fans: Landform evolution along rapidly degrading escarpments in alpine regions undergoing recent deglaciation, Geomorphology, 151–152, 59–76, https://doi.org/10.1016/j.geomorph.2012.01.014, 2012.
Kovacs, A., Gow, A. J., and Morey, R. M.: The in-situ dielectric constant of polar firn revisited, Cold Reg. Sci. Technol., 23, 245–256, https://doi.org/10.1016/0165-232X(94)00016-Q, 1995.
Lague, D., Brodu, N., and Leroux, J.: Accurate 3D comparison of complex topography with terrestrial laser scanner: application to the Rangitikei canyon (N-Z), ISPRS J. Photogramm., 82, 10–26, https://doi.org/10.1016/j.isprsjprs.2013.04.009, 2013.
Laha, S., Kumari, R., Singh, S., Mishra, A., Sharma, T., Banerjee, A., Nainwal, H. C., and Shankar, R.: Evaluating the contribution of avalanching to the mass balance of Himalayan glaciers, Ann. Glaciol., 58, 110–118, https://doi.org/10.1017/aog.2017.27, 2017.
Mayer, C., Lambrecht, A., Oerter, H., Schwikowski, M., Vuillermoz, E., Frank, N., and Diolaiuti, G.: Accumulation Studies at a High Elevation Glacier Site in Central Karakoram, Adv. Meteorol., 2014, https://doi.org/10.1155/2014/215162, 2014.
McClung, D. M. and Schaerer, P. A.: Characteristics of Flowing Snow and Avalanche Impact Pressures, Ann. Glaciol., 6, 9–14, https://doi.org/10.3189/1985AoG6-1-9-14, 1985.
Miao, C., Immerzeel, W. W., Xu, B., Yang, K., Duan, Q., and Li, X.: Understanding the Asian water tower requires a redesigned precipitation observation strategy, P. Natl. Acad. Sci. USA, 121, https://doi.org/10.1073/pnas.2403557121, 2024.
Mimeau, L., Esteves, M., Zin, I., Jacobi, H.-W., Brun, F., Wagnon, P., Koirala, D., and Arnaud, Y.: Quantification of different flow components in a high-altitude glacierized catchment (Dudh Koshi, Himalaya): some cryospheric-related issues, Hydrol. Earth Syst. Sci., 23, 3969–3996, https://doi.org/10.5194/hess-23-3969-2019, 2019.
Mott, R., Wolf, A., Kehl, M., Kunstmann, H., Warscher, M., and Grünewald, T.: Avalanches and micrometeorology driving mass and energy balance of the lowest perennial ice field of the Alps: a case study, The Cryosphere, 13, 1247–1265, https://doi.org/10.5194/tc-13-1247-2019, 2019.
Over, J.-S. R., Ritchie, A. C., Kranenburg, C. J., Brown, J. A., Buscombe, D. D., Noble, T., Sherwood, C. R., Warrick, J. A., and Wernette, P. A.: Processing coastal imagery with Agisoft Metashape Professional Edition, version 1.6 – Structure from motion workflow documentation, USGS, https://doi.org/10.3133/ofr20211039, 2021.
Patil, A. M., Mayer, C., Seehaus, T., Groos, A. R., and Bauder, A.: Investigating firn structure and density in the accumulation area of the Grosser Aletschgletscher using ground-penetrating radar, The Cryosphere, 19, 5547–5577, https://doi.org/10.5194/tc-19-5547-2025, 2025.
Piermattei, L., Carturan, L., and Guarnieri, A.: Use of terrestrial photogrammetry based on structure-from-motion for mass balance estimation of a small glacier in the Italian alps, Earth Surf. Process. Landf., 40, 1791–1802, https://doi.org/10.1002/ESP.3756, 2015.
Purdie, H., Mackintosh, A., Lawson, W., and Anderson, B.: Synoptic Influences on Snow Accumulation on Glaciers East and West of a Topographic Divide: Southern Alps, New Zealand, Arct. Antarct. Alp. Res., 43, 82–94, https://doi.org/10.1657/1938-4246-43.1.82, 2011.
Purdie, H., Rack, W., Anderson, B., Kerr, T., Chinn, T., Owens, I., and Linton, M.: The impact of extreme summer melt on net accumulation of an avalanche fed glacier, as determined by ground‐penetrating radar, Geogr. Ann. A, 97, 779–791, https://doi.org/10.1111/geoa.12117, 2015.
py4dgeo Development Core Team: py4dgeo: library for change analysis in 4D point clouds, GitHub [code], https://github.com/3dgeo-heidelberg/py4dgeo (last access: 16 September 2026), 2022.
Quéno, L., Mott, R., Morin, P., Cluzet, B., Mazzotti, G., and Jonas, T.: Snow redistribution in an intermediate-complexity snow hydrology modelling framework, The Cryosphere, 18, 3533–3557, https://doi.org/10.5194/tc-18-3533-2024, 2024.
Ravanel, L., Guillet, G., Kaushik, S., Preunkert, S., Malet, E., Magnin, F., Trouvé, E., Montagnat, M., Yan, Y., and Deline, P.: Ice aprons on steep high-alpine slopes: insights from the Mont-Blanc massif, Western Alps, J. Glaciol., 69, 1275–1291, https://doi.org/10.1017/jog.2023.15, 2023.
Revuelto, J., Alonso-Gonzalez, E., Vidaller-Gayan, I., Lacroix, E., Izagirre, E., Rodríguez-López, G., and López-Moreno, J. I.: Intercomparison of UAV platforms for mapping snow depth distribution in complex alpine terrain, Cold Reg. Sci. Technol., 190, 103344, https://doi.org/10.1016/j.coldregions.2021.103344, 2021.
RGI Consortium: Randolph Glacier Inventory – A Dataset of Global Glacier Outlines: Version 6.0: Technical Report, Global Land Ice Measurements from Space, Colorado, USA, Digital Media, https://doi.org/10.7265/N5-RGI-60, 2017.
Roussel, L., Dumont, M., Réveillet, M., Six, D., Kneib, M., Nabat, P., Fourteau, K., Monteiro, D., Gascoin, S., Thibert, E., Rabatel, A., Sicart, J.-E., Bonnefoy, M., Piard, L., Laarman, O., Jourdain, B., Fructus, M., Vernay, M., and Lafaysse, M.: Saharan dust impacts on the surface mass balance of Argentière Glacier (French Alps), The Cryosphere, 19, 5201–5230, https://doi.org/10.5194/tc-19-5201-2025, 2025.
Six, D. and Vincent, C.: Sensitivity of mass balance and equilibrium-line altitude to climate change in the French Alps, J. Glaciol., 60, 867–878, https://doi.org/10.3189/2014JoG14J014, 2014.
Smith, M. W. and Vericat, D.: From experimental plots to experimental landscapes: topography, erosion and deposition in sub‐humid badlands from Structure‐from‐Motion photogrammetry, Earth Surf. Process. Landf., 40, 1656–1671, https://doi.org/10.1002/esp.3747, 2015.
Sovilla, B., Burlando, P., and Bartelt, P.: Field experiments and numerical modeling of mass entrainment in snow avalanches, J. Geophys. Res.-Earth, 111, https://doi.org/10.1029/2005JF000391, 2006.
Sovilla, B., McElwaine, J. N., Schaer, M., and Vallet, J.: Variation of deposition depth with slope angle in snow avalanches: Measurements from Vallée de la Sionne, J. Geophys. Res.-Earth, 115, https://doi.org/10.1029/2009JF001390, 2010.
Stocker-Waldhuber, M., Fischer, A., Helfricht, K., and Kuhn, M.: Long-term records of glacier surface velocities in the Ötztal Alps (Austria), Earth Syst. Sci. Data, 11, 705–715, https://doi.org/10.5194/essd-11-705-2019, 2019.
Tadono, T., Ishida, H., Oda, F., Naito, S., Minakawa, K., and Iwamoto, H.: Precise Global DEM Generation by ALOS PRISM, ISPRS Ann. Photogramm. Remote Sens. Spatial Inf. Sci., II-4, 71–76, https://doi.org/10.5194/isprsannals-II-4-71-2014, 2014.
Terleth, Y., van Pelt, W. J. J., and Pettersson, R.: Spatial variability in winter mass balance on Storglaciären modelled with a terrain-based approach, J. Glaciol., 69, 749–761, https://doi.org/10.1017/jog.2022.96, 2023.
Thibert, E., Blanc, R., Vincent, C., and Eckert, N.: Glaciological and volumetric mass-balance measurements: error analysis over 51 years for Glacier de Sarennes, French Alps, J. Glaciol., 54, 522–532, https://doi.org/10.3189/002214308785837093, 2008.
Turchaninova, A. S., Lazarev, A. v., Marchenko, E. S., Seliverstov, Yu. G., Sokratov, S. A., Petrakov, D. A., Barandun, M., Kenzhebaev, R., and Saks, T.: Methods of snow avalanche nourishment assessment (on the example of three Tian Shan glaciers), Ice and Snow, 59, 460–474, https://doi.org/10.15356/2076-6734-2019-4-438, 2019.
Vallet, J., Gruber, U., and Dufour, F.: Photogrammetric avalanche volume measurements at Vallée de la Sionne, Switzerland, Ann. Glaciol., 32, 141–146, https://doi.org/10.3189/172756401781819689, 2001.
Vincent, C., Soruco, A., Six, D., and le Meur, E.: Glacier thickening and decay analysis from 50 years of glaciological observations performed on Glacier d'Argentière, Mont Blanc area, France, Ann. Glaciol., 50, 73–79, https://doi.org/10.3189/172756409787769500, 2009.
Vincent, C., Gilbert, A., Jourdain, B., Piard, L., Ginot, P., Mikhalenko, V., Possenti, P., Le Meur, E., Laarman, O., and Six, D.: Strong changes in englacial temperatures despite insignificant changes in ice thickness at Dôme du Goûter glacier (Mont Blanc area), The Cryosphere, 14, 925–934, https://doi.org/10.5194/tc-14-925-2020, 2020.
Wackrow, R. and Chandler, J. H.: Minimising systematic error surfaces in digital elevation models using oblique convergent imagery, Photogramm. Rec., 26, 16–31, https://doi.org/10.1111/j.1477-9730.2011.00623.x, 2011.
Wagnon, P., Brun, F., Khadka, A., Berthier, E., Shrestha, D., Vincent, C., Arnaud, Y., Six, D., Dehecq, A., Ménégoz, M., and Jomelli, V.: Reanalysing the 2007–19 glaciological mass-balance series of Mera Glacier, Nepal, Central Himalaya, using geodetic mass balance, J. Glaciol., 67, 117–125, https://doi.org/10.1017/jog.2020.88, 2021.
xDEM contributors: xDEM version 0.2, Zenodo [code], https://doi.org/10.5281/zenodo.19636034, 2024.
Zemp, M., Thibert, E., Huss, M., Stumm, D., Rolstad Denby, C., Nuth, C., Nussbaumer, S. U., Moholdt, G., Mercer, A., Mayer, C., Joerg, P. C., Jansson, P., Hynek, B., Fischer, A., Escher-Vetter, H., Elvehøy, H., and Andreassen, L. M.: Reanalysing glacier mass balance measurement series, The Cryosphere, 7, 1227–1245, https://doi.org/10.5194/tc-7-1227-2013, 2013.