
the Creative Commons Attribution 4.0 License.
the Creative Commons Attribution 4.0 License.
 | 03 Sep 2026
Recent intensification of extreme precipitation over East Antarctica driven by increases in greenhouse gases and stratospheric ozone
Sai Prabala Swetha Chittella

Andrew Orr
Pranab Deb
Quentin Dalaiden
Extreme precipitation is a major contributor to the total precipitation over Antarctica and its variability. However, it remains poorly understood whether Antarctic extreme precipitation has undergone recent changes and, if so, whether these changes are anthropogenically driven. Using ERA5 reanalysis for 1979–2023, we identify significant regional trends in total and extreme precipitation across Antarctic drainage basins, including significant increases over the Filchner-Ronne sector, Dronning Maud Land, and Enderby Land in East Antarctica. We then perform a regression-based detection and attribution analysis of these trends using precipitation outputs from CESM1 global climate model large ensembles based on “all-forcing” experiments and “single-forcing” experiments that isolate the effects of greenhouse gases, anthropogenic aerosols, and stratospheric ozone. For five of the six basins exhibiting positive trends in total precipitation (within the Filchner-Ronne sector, Dronning Maud Land, and Enderby Land) and three of the four basins exhibiting positive trends in extreme precipitation (within Dronning Maud Land and Enderby Land), the ERA5 signal was formally detected in the CESM1 all-forcing simulations, indicating that these trends are driven by a combination of anthropogenic and natural forcings. Our analysis further show that for one basin (within Enderby Land) the increases in total and extreme precipitation are robustly attributed to greenhouse gases and stratospheric ozone, while for another basin (within Dronning Maud Land) the increases in total precipitation are attributed to stratospheric ozone only. In contrast, none of the precipitation trends could be attributed to anthropogenic aerosols despite all-forcing and single-forcing simulations of anthropogenic aerosols exhibiting similar trend patterns. Applying the same analysis to CESM2 large ensembles confirmed that the ERA5 precipitation signal was detected in the all-forcing simulations but unlike CESM1 did not provide robust attribution of total or extreme precipitation to any individual forcing. These findings provide evidence that external drivers have already impacted East Antarctic total and extreme precipitation, while demonstrating that uncertainties in attributing individual forcings remain a key limitation in understanding future changes to the Antarctic surface mass balance.
- Article
(3929 KB) - Full-text XML
-
Supplement
(2195 KB) - BibTeX
- EndNote


Intense precipitation events have increased in intensity and frequency globally in recent decades (Donat et al., 2013; Sun et al., 2021; Dunn et al., 2020; Li et al., 2024), which has been attributed to anthropogenically-induced climate change (Min et al., 2011; Zhang et al., 2013; Paik et al., 2020; Kirchmeier-Young and Zhang, 2020; Dong et al., 2020, 2021; Estrada et al., 2023; IPCC, 2023). In Antarctica, these events have generally been referred to as extreme precipitation events (EPEs; Gorodetskaya et al., 2014; Turner et al., 2019; Adusumilli et al., 2021; Wille et al., 2021, 2024, 2025; Gehring et al., 2022; Maclennan et al., 2022, 2023; Simon et al., 2024). We adopt the same nomenclature for consistency with existing literature, while recognising that the events analysed here represent high-intensity precipitation rather than extreme. In Antarctica, EPEs are also often associated with intense atmospheric rivers (ARs; Gorodetskaya et al., 2014; Adusumilli et al., 2021; Wille et al., 2021, 2024, 2025; Gehring et al., 2022; Maclennan et al., 2022, 2023; Simon et al., 2024). However, identifying statistically significant trends in EPEs over recent decades in Antarctica is hampered by such events being difficult to separate from the substantial interannual precipitation variability that characterises its climate, as well as by limited observations (Connolley, 1997; Hosking et al., 2013; Yu et al., 2018, 2025). For example, Intergovernmental Panel on Climate Change (IPCC) assessments of observed extreme precipitation changes largely exclude Antarctica (Seneviratne et al., 2021). Nevertheless, positive trends in the number of EPEs occurring over recent decades have been identified over parts of East Antarctica (Yu et al., 2018; Simon et al., 2024).
Antarctic precipitation and EPEs are the major component of surface mass balance (Turner et al., 2019; Kittel et al., 2021; Mottram et al., 2021; Clem and Raphael, 2024; Davison et al., 2023; Wille et al., 2024) and thus play a crucial role in controlling the stability of the Antarctic ice sheet by offsetting dynamically driven ice-losses (Favier et al., 2017; Zwally et al., 2017; Paolo et al., 2018; Rignot et al., 2019; Kromer and Trusel, 2023; Otosaka et al., 2023; Wang et al., 2025). Furthermore, mass gained from precipitation and EPEs over Antarctic ice shelves can partially compensate for mass-losses caused by either basal or surface melting (Paolo et al., 2015; Pattyn, 2017; Gardner et al., 2018; Rignot et al., 2019; Nakayama et al., 2021; Johnson et al., 2022). This is especially critical as ice shelf thinning results in the acceleration of grounded ice toward the ocean, where the ice subsequently calves into the ocean as icebergs and causes increased sea-level rise (Rott et al., 1996; Pritchard et al., 2012; Rignot et al., 2019). Additionally, snowfall is an essential factor in minimizing the susceptibility of ice shelves to surface melt pond formation, which can initiate hydrofracturing of ice shelves, by counteracting any firn air depletion caused by surface melting (Scambos et al., 2000; Munneke et al., 2014; Banwell and MacAyeal, 2015; Lai et al., 2020; Orr et al., 2023; Van Wessem et al., 2023).
Therefore, a better physical understanding of the trends in EPEs during the past decades over Antarctica is critical. Moreover, an enhanced understanding of the drivers of these trends, such as anthropogenically-induced changes (i.e., external climate forcing), is also of critical importance to better highlight how EPEs and associated impacts might change under future climate projections (Kittel et al., 2021; Vignon et al., 2021). For example, Dalaiden et al. (2022) identified that increased greenhouse gas emissions and stratospheric ozone depletion were the primary drivers of increased precipitation and temperature over West Antarctica since the middle of the twentieth century. These two drivers were also identified as causing recent changes in Southern Ocean temperature and salinity by Swart et al. (2018) and Hobbs et al. (2021). Additionally, increased anthropogenic aerosol emissions in Asia in recent decades have been suggested by Gu et al. (2025) to affect Antarctica's climate by Rossby-wave teleconnections. However, the strong internal variability prevailing in the Southern Hemisphere high latitudes makes it challenging to detect the signal of anthropogenically-produced climatic changes from the observed changes during the past decades (e.g., Fyke et al., 2017), as well as when this signal will emerge from natural variability in the future (Trusel et al., 2015; Previdi and Polvani, 2016; Morioka et al., 2024).
This study addresses the knowledge gap around our understanding of the drivers of changes in EPEs over Antarctica by performing a detection and attribution (D&A) analysis to investigate the influence of external forcings and natural variability on annual trends in total and extreme precipitation across Antarctica from 1979 to the present-day. Our approach uses precipitation from: (i) ERA5 atmospheric reanalysis to identify trends, and (ii) large ensembles performed using the Community Earth System Model Versions 1 and 2 (CESM1 and CESM2), which are fully-coupled global climate models, to undertake D&A of the ERA5-based trends and determine the effects of greenhouses gases, anthropogenic aerosols, and stratospheric ozone versus internal climate variability. Results from both CESM1 and CESM2 ensembles are analysed because differences have been found in their responses to external forcing, due to differences in experimental design and model physics (Simpson et al., 2023).
2.1 Datasets
In situ measurements of precipitation over Antarctica are extremely scarce and difficult to make due to the challenging remote environment and difficulties distinguishing between falling and wind-driven snow (Pritchard, 2021). Therefore, we use hourly precipitation (both rainfall and snowfall) data from the ERA5 reanalysis (Hersbach et al., 2020) at a horizontal resolution of 0.25° to identify present-day precipitation trends in Antarctica as this provides complete spatial and temporal coverage of this region for the period of interest. ERA5 precipitation has been used previously in studies examining daily precipitation over Antarctica (Vignon et al., 2021; Carter et al., 2022; Tewari et al., 2022) and for extreme event analysis (Yu et al., 2025). However, for this study we only use data from 1979 to 2023 (45 years), as prior to this period there were relatively few satellite observations over the Southern Ocean and Antarctica, which are necessary to constrain the reanalysis (Bromwich et al., 2024). Additionally, as ARs are an important contributor to EPEs (Gorodetskaya et al., 2014; Maclennan et al., 2022; Wille et al., 2025), we identify their occurrence using a 3-hourly AR detection catalog at a horizontal resolution of 0.5°, derived from ERA5 reanalysis (Wille et al., 2021). Here, ARs are identified based on the meridional component of integrated vapor transport exceeding the 98th percentile of the monthly climatologies.
We also use daily precipitation (both rainfall and snowfall) output for the period 1979 to 2023 from the large ensemble simulations performed with the CESM1 and CESM2 models. These simulations were selected because they have a number of factors that are crucial for the D&A analysis, including: (i) “all-forcing” (ALL) large ensembles that consider forcings from all anthropogenic and natural (such as solar variability and volcanic eruptions) sources, (ii) “single-forcing” large ensembles that isolate the impact of specific external forcings resulting from anthropogenic activities, such as greenhouse gas (GHG) emissions, aerosol (AER) emissions, and stratospheric ozone depletion (O3) and (iii) a relatively good representation of the surface climate of Antarctica (Dunmire et al., 2022; Dalaiden et al., 2020, 2022; England et al., 2016; Landrum et al., 2017; Lenaerts et al., 2016). Note that the atmosphere component of CESM1 is stratospheric-resolving and includes interactive ozone chemistry, while CESM2 has a model top near 40 km and uses prescribed stratospheric ozone depletion (Kay et al., 2015; Danabasoglu et al., 2020; Deser et al., 2020; Simpson et al., 2023).
CESM1 includes a 40-member ALL ensemble that spans the period from 1920 to 2100, based on CMIP5 (Coupled Model Intercomparison Project Phase 5) historical radiative forcing from 1920 to 2005 and the RCP8.5 (Representative Concentration Pathway 8.5, representing additional radiative forcing of 8.5 W m−2 by 2100) scenario from 2006 to 2100 (Kay et al., 2015). Its single-forcing large ensembles employ an “all-but-one” design (Deser et al., 2020): all external forcings evolve in time as in the ALL large ensemble, except the forcing of interest, which is held fixed throughout the simulation. It includes 20-member all-but-one forcing ensembles from 1920 to 2080 with greenhouse gases (xGHG) and anthropogenic aerosols (xAER) fixed at 1920 levels. In the xAER ensemble, the aerosols included are from industrial, agricultural, household, and transportation-related sources but exclude any anthropogenic biomass burning sources. Additionally, CESM1 also includes an 8-member all-but-one forcing ensemble from 1955 to 2005 with stratospheric ozone (xO3) fixed at 1955 levels (Landrum et al., 2017). Following Deser et al. (2020), the individual members of the single-forcing ensembles (GHG, AER, O3) are calculated from the all-but-one forcing ensembles (xGHG, xAER, xO3) as follows:
where the subscript “i” represents an individual ensemble member and “em” the ensemble mean. To assess internal variability we use the CESM1 pre-industrial 2200-year long control simulation (with all external forcings fixed at 1850 values), but exclude the first 400 years of the simulation to avoid any artifact related to the initialization.
CESM2 includes a 50-member ALL ensemble that spans the period from 1850 to 2100 based on the CMIP6 (Coupled Model Intercomparison Project Phase 6) historical forcings from 1850 to 2014 and the SSP370 (Shared Socioeconomic Pathways, representing additional radiative forcing of 7 W m−2 by 2100) scenario from 2015 to 2100. Its single-forcing large ensembles employ an “only” design (Simpson et al., 2023): all external forcings are held fixed at 1850 values, except the forcing of interest, which evolve in time throughout the simulation. It includes a 15-member GHG ensemble and a 20-member AER ensemble from 1850 to 2050. In the AER ensemble, anthropogenic biomass burning sources are again excluded. To assess internal variability we use the CESM2 pre-industrial 2000-year long control simulation (with external forcings fixed at 1850 values). Note that there are no CESM2 single-forcing simulations for stratospheric ozone depletion available (Simpson et al., 2023).
2.2 Methods
Hourly ERA5 precipitation outputs are firstly re-gridded onto the CESM1 grid (resolution of 1°) using an area-weighted averaging method, and then summed over 24 h intervals to produce daily values. We then compute trends in total and extreme precipitation (at each grid point) for ERA5 and the CESM1 ensembles ALL, GHG, and AER for the period 1979 to 2023 and O3 for the period 1979 to 2005. Here, precipitation days are defined as days with precipitation exceeding a threshold of 0.02 mm d−1, and extreme precipitation as days with precipitation exceeding the 95th percentile of all precipitation days over the period 1979 to 2023, following Swetha Chittella et al. (2022). These daily data are then annually aggregated to obtain an annual time-series of both total and extreme precipitation for ERA5, ALL, GHG, and AER from 1979 to 2023 and O3 from 1979 to 2005. These time-series are subsequently used to calculate over Antarctica the spatial distributions of annual trends of total and extreme precipitation for ERA5, ALL, GHG, AER, and O3. Additionally, we also calculate analogous basin-averaged annual trends of total and extreme precipitation for Antarctica's 18 drainage basins (mapped using the Ice Sheet Mass Balance Inter-comparison (IMBIE) dataset shown in Fig. 1; Rignot et al., 2019). Here, we first compute the daily basin-averaged precipitation, with basin-averaged precipitation days defined as days with this exceeding a threshold of 0.02 mm d−1, and basin-averaged extreme precipitation days as days with this exceeding the 95th percentile. These daily data are then annually aggregated to obtain a basin-averaged annual time-series of both total and extreme precipitation for ERA5, ALL, GHG, and AER from 1979 to 2023 and O3 from 1979 to 2005, which we use to calculate basin-averaged annual trends.
Next we perform an initial comparison between the precipitation trends from ERA5 and the CESM1 ALL ensemble for the period 1979 to 2023. Here, if the basin-averaged linear trends in the total and extreme precipitation time-series from the ALL ensemble are significant at the 90 % level and consistent with the trends estimated by ERA5, then the CESM1 ALL ensemble was judged to reproduce the ERA5-based trends for that basin. For the basins identified during this step, we subsequently conduct a preliminary attribution analysis by assessing the contribution of the trends in the total and extreme precipitation time-series from the GHG, AER and O3 ensembles to the trends in the ALL ensemble. This was primarily achieved by comparing probability density distributions for the precipitation trends for each of the basins, calculated using a kernel density estimation method (significant at the 90 % confidence level).
We then apply a regression-based D&A technique for the selected drainage basins, based on a least-squares fitting statistical approach (Allen and Stott, 2003; Ribes et al., 2013; Dong et al., 2020; Hobbs et al., 2021; Dalaiden et al., 2022), to formally quantify to what extent the total and extreme precipitation trends from ERA5 is related to external forcing. This method calculates the scaling factors between observations (in this study, ERA5) and the estimated forced response from climate model ensembles (including all external forcing or only a subset), which is expressed as follows (Ribes et al., 2013; Dalaiden et al., 2022):
where y* is the “true” climate response to all external forcings, the simulated climate response to the ith specific external forcing considered (up to a total of n), and βi the scaling factor (regression coefficient) for the ith external forcing. Here the actual observations , with ϵ0 corresponding to the noise term on y, i.e., internal climate variability. And represents the ensemble mean of the simulated response to the ith external forcing, with ϵi the noise term on forcing xi, i.e., internal variability. This method also provides confidence intervals associated with the scaling factors. If the scaling factor, including the confidence interval, is greater than zero, then the observed changes are outside the range of internal variability. We therefore conclude that the observed changes can only be explained by external forcing (Dong et al., 2020; Dalaiden et al., 2022). In the case the scaling factor, including the confidence interval, is greater (lower) than one, this implies that the model significantly underestimates (overestimates) the observed trends. Finally, if the lower bound of the confidence interval is smaller than or equal to zero, we cannot conclude a statistically impact of external forcing on the observed changes.
Note that to improve the signal-to-noise ratio, D&A studies commonly apply a pre-whitening step to both observations and model simulated responses to suppress the contribution from internal climate variability (e.g., Allen and Stott, 2003). For the regression-based D&A technique, the ERA5 time series and the model responses are therefore pre-whitened using the covariance matrix of internal variability (also referred to as the noise covariance matrix). We estimate this matrix using the regularized optimal fingerprinting approach of Ribes et al. (2013). Additionally, as the ensemble mean smoothed out the impact of internal variability, we scaled up the variance of the ensemble mean response by using the square root of ensemble size (Allen and Stott, 2003; Ribes et al., 2013; Kirchmeier-Young et al., 2017).
Using the regression-based D&A technique, detection is performed by applying a one-signal analysis for CESM1, where the basin-averaged total and extreme precipitation time-series from the ALL ensemble (along with internal variability) are regressed onto the ERA5 time-series, resulting in scaling factors (and confidence intervals) for ALL (Dalaiden et al., 2022). Following this, attribution is performed in CESM1 by applying a two-signal analysis, where the basin-averaged total and extreme precipitation time-series from the ALL and all-but-one forcing ensembles are regressed onto the ERA5 time-series, resulting in the scaling factors for a specific external forcing and for all other forcing except that specific forcing (Dalaiden et al., 2022). In other words, regressing: (i) ALL and xGHG against ERA5, results in the scaling factors for GHG and xGHG, (ii) ALL and xAER against ERA5, results in scaling factors for AER and xAER, and (iii) ALL and xO3 against ERA5, results in scaling factors for O3 and xO3 (Dalaiden et al., 2022). However, here we only focus on the scaling factors (and confidence intervals) associated with GHG, AER, and O3. Both the one-signal and two-signal analysis involving the GHG and AER ensembles were performed with the same number of members, which was therefore limited to 20, i.e., the number from the GHG and AER ensembles, as this was less than the ALL (40) ensembles. However, the two-signal analysis involving the O3 ensemble was limited to 8 members. Note that the one-signal analysis results in CESM1 using all 40 members from the ALL ensemble were largely identical to those using 20 members (not shown). For CESM1, the noise covariance matrix is derived from pre-industrial control simulations. More details on the method are provided in Ribes et al. (2013) and Kirchmeier-Young et al. (2017).
The above analysis is then repeated using the CESM2 ensembles ALL, GHG, and AER to assess to what extent the ERA5 trends can be detected and attributed to specific external forcings using this model. For the regression-based D&A technique, we again apply a one-signal analysis to regress the ALL ensemble onto the ERA5 time-series. However, since the single-forcing ensembles for CESM2 were generated differently than for CESM1, attribution is also performed by applying a three-signal analysis, where the basin-averaged total and extreme precipitation time-series from the ALL, GHG and AER ensembles (along with internal variability) are regressed onto the ERA5 time-series (Dalaiden et al., 2022). This results in scaling factors (and confidence intervals) for GHG and AER, and also all forcings other than greenhouse gases and anthropogenic aerosols, which is labelled OTHERS (Gillett et al., 2021; Dalaiden et al., 2022). Similarly to CESM1, the noise covariance matrix is derived from the pre-industrial control simulation. Both one-signal and three-signal analysis were performed with a common number of members from each ensemble, which was therefore limited to 15, i.e., the number from the GHG ensemble, as this was less than both the ALL (50) and AER (20) ensembles. However, the one-signal analysis results in CESM2, using all 50 members from the ALL ensemble, was largely identical to using 15 members (not shown). Investigating results from two climate models is important as they enable an assessment of the robustness of the results. However, the investigation will predominately focus on analysis of the CESM1 results, as these include an O3 ensemble.
Finally, we examine trends in AR-associated total and extreme precipitation from 1980 to 2023 by combining the AR detection catalog with ERA5 precipitation. Here, daily values of AR-associated total and extreme precipitation are calculated by estimating the amount of ERA5 total and extreme precipitation occurring within each AR footprint. These daily data are then annually aggregated to obtain an annual time-series of both AR-associated total and extreme precipitation. Following the approach of Maclennan et al. (2022), this was subsequently used to investigate: (i) the spatial distribution of statistically significant (90 % confidence interval) trends in AR-associated total and extreme precipitation from 1980 to 2023, and (ii) the relative contribution of AR-associated total and extreme precipitation trends to the ERA5-based total and extreme precipitation trends from 1980 to 2023 (which required regridding the total and extreme precipitation from ERA5 onto the AR detection catalog grid). Note that spuriously large percentages for the relative contributions of AR-associated total and extreme precipitation trends are produced if the ERA5-based total and extreme precipitation trends are close to zero, which is avoided by only calculating this for grid cells where the ERA5-based trends exceed a threshold of 0.05 mm yr−1.
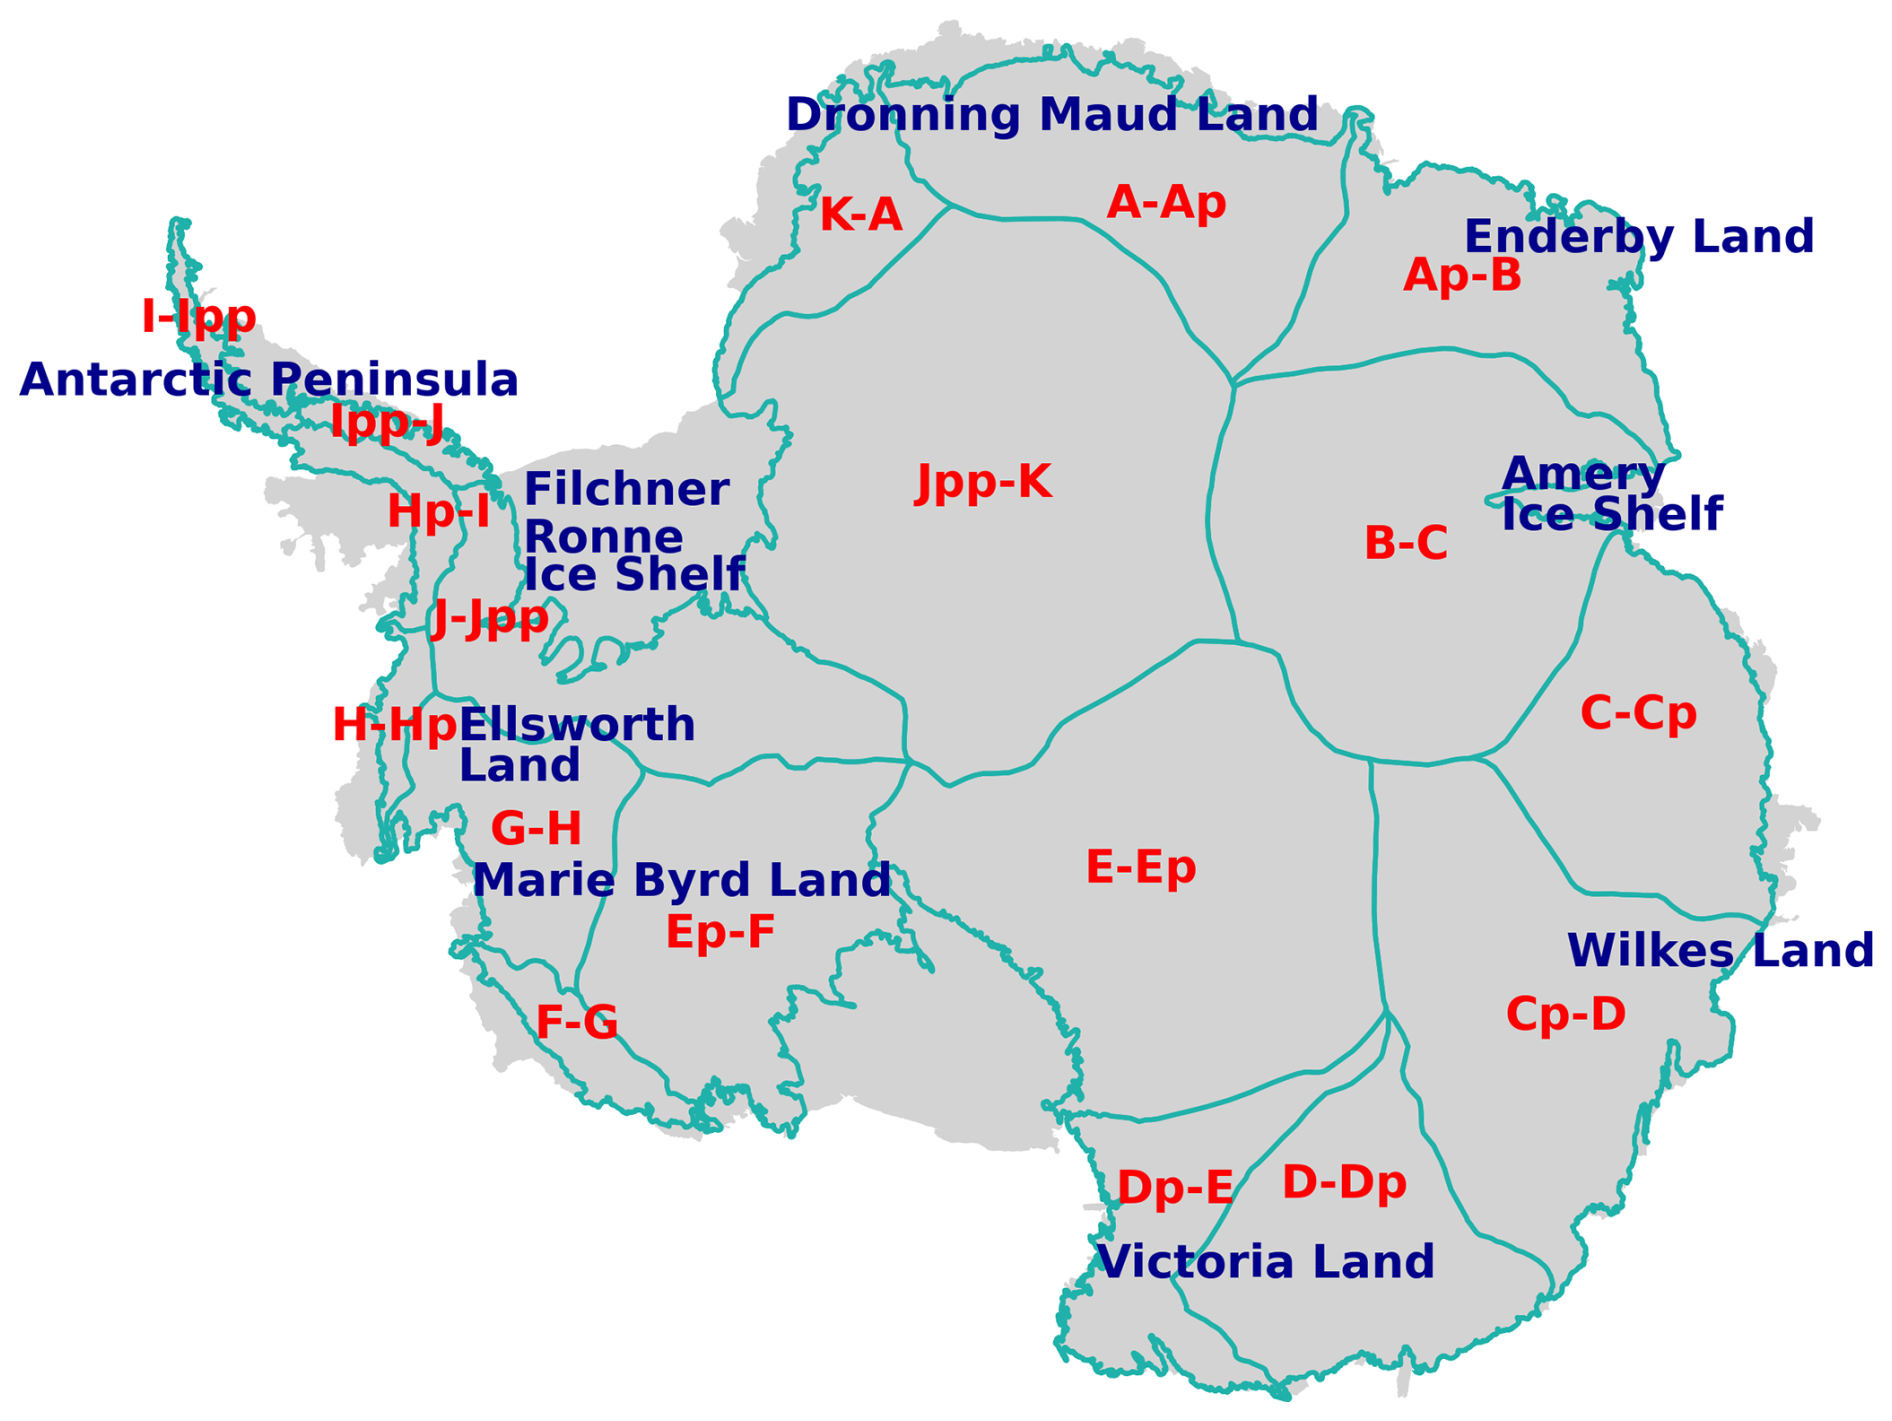
Figure 1Map of Antarctica showing key regions of interest (names in blue) and the 18 major drainage basins (names in red), as defined in the IMBIE dataset (Rignot et al., 2019).
3.1 Identification of precipitation trends in ERA5
Figure 2a, e shows annual trends in total and extreme precipitation from ERA5 from 1979 to 2023. This shows that broad positive trends for both total and extreme precipitation (up to 2 mm yr−1) are apparent from Ellsworth Land in West Antarctica to the Amery ice shelf in East Antarctica, while negative trends (up to −2 mm yr−1) are evident from Marie Byrd Land in West Antarctica to Wilkes Land in East Antarctica (see Fig. 1 for locations). However, for some of these regions, the trends are statistically insignificant, with only Ellsworth Land, the Filchner-Ronne basin, Dronning Maud Land, Enderby Land, and the Amery Ice Shelf showing relatively large areas with significant positive trends. By contrast, the regions showing significant negative trends are patchy and confined to Marie Byrd Land, Victoria Land, and Wilkes Land. Over the Antarctic Peninsula, the ERA5 trends in total and extreme precipitation differ in direction, with total precipitation increasing and extreme precipitation decreasing, except the northern Antarctic Peninsula, where the extreme precipitation trends are significantly positive.
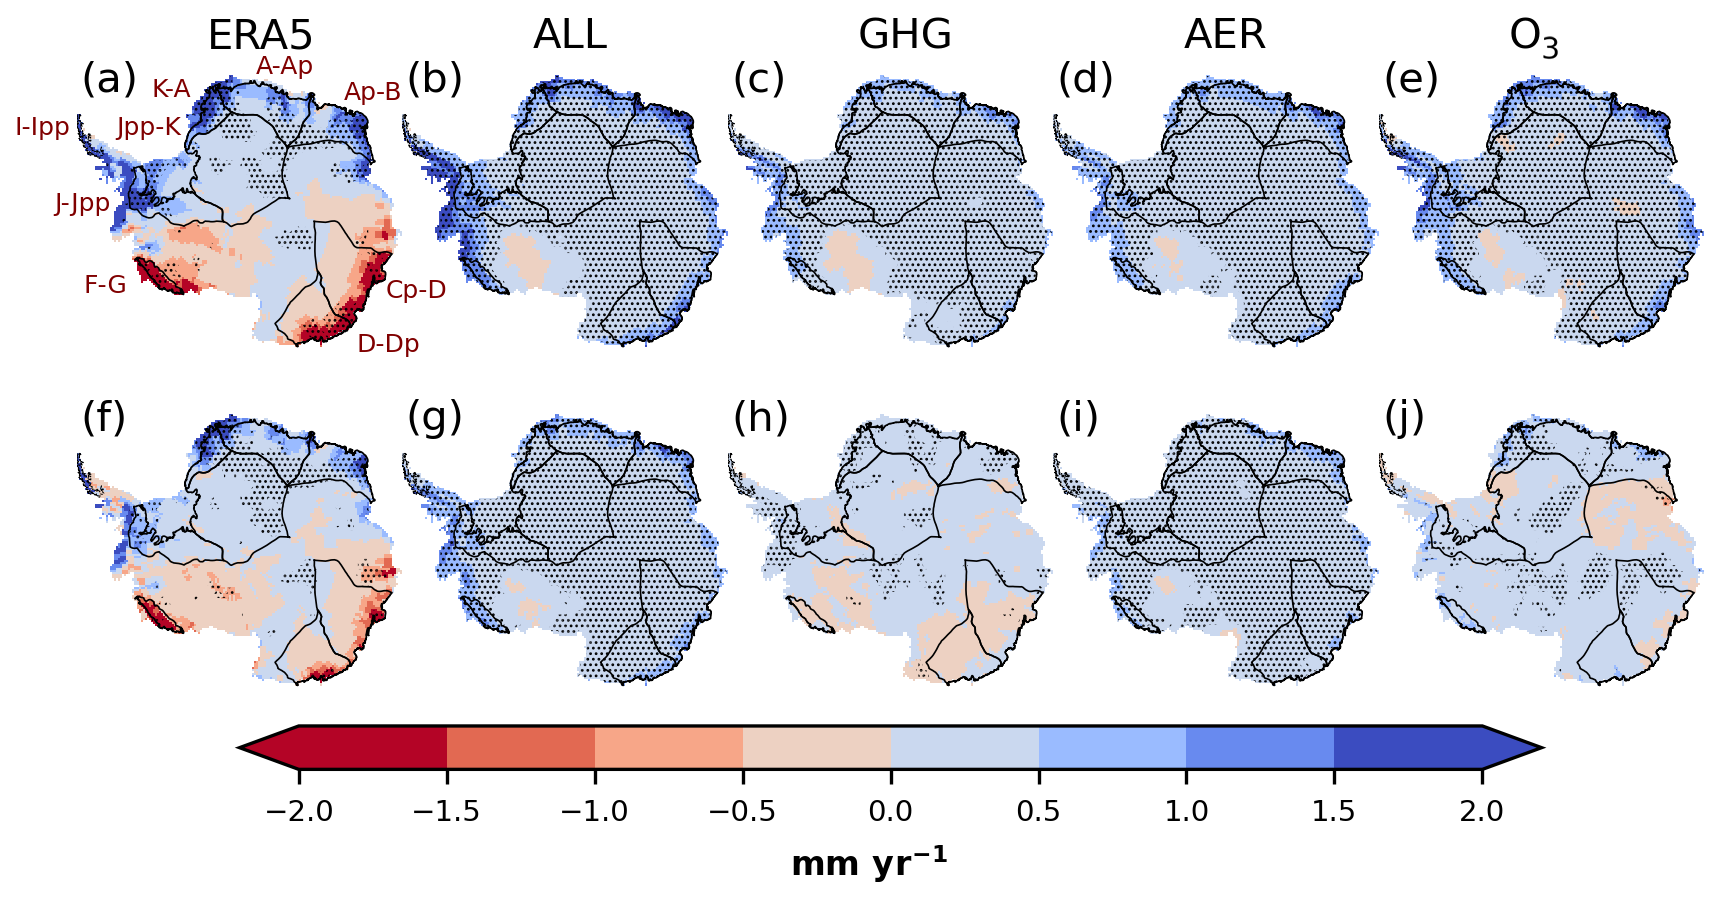
Figure 2Annual linear trends in (a–e) total and (f–j) extreme precipitation over Antarctica from 1979 to 2023 (mm yr−1) for (a, f) ERA5 and the CESM1 ensemble mean for (b, g) ALL, (c, h) GHG, (d, i) AER and (e, j) O3. Stippling indicates regions where trends are statistically significant at the 90 % confidence level. Also shown in panel (a) are the locations of the A-Ap and K-A (Dronning Maud Land), Ap-B (Enderby Land), Cp-D (Wilkes Land), D-Dp (Victoria Land), and Jpp-K (Filchner-Ronne) basins in East Antarctica, the F-G (Marie Byrd Land) and J-Jpp (Filchner-Ronne) basins in West Antarctica, and the I-Ipp basin in the Antarctic Peninsula.
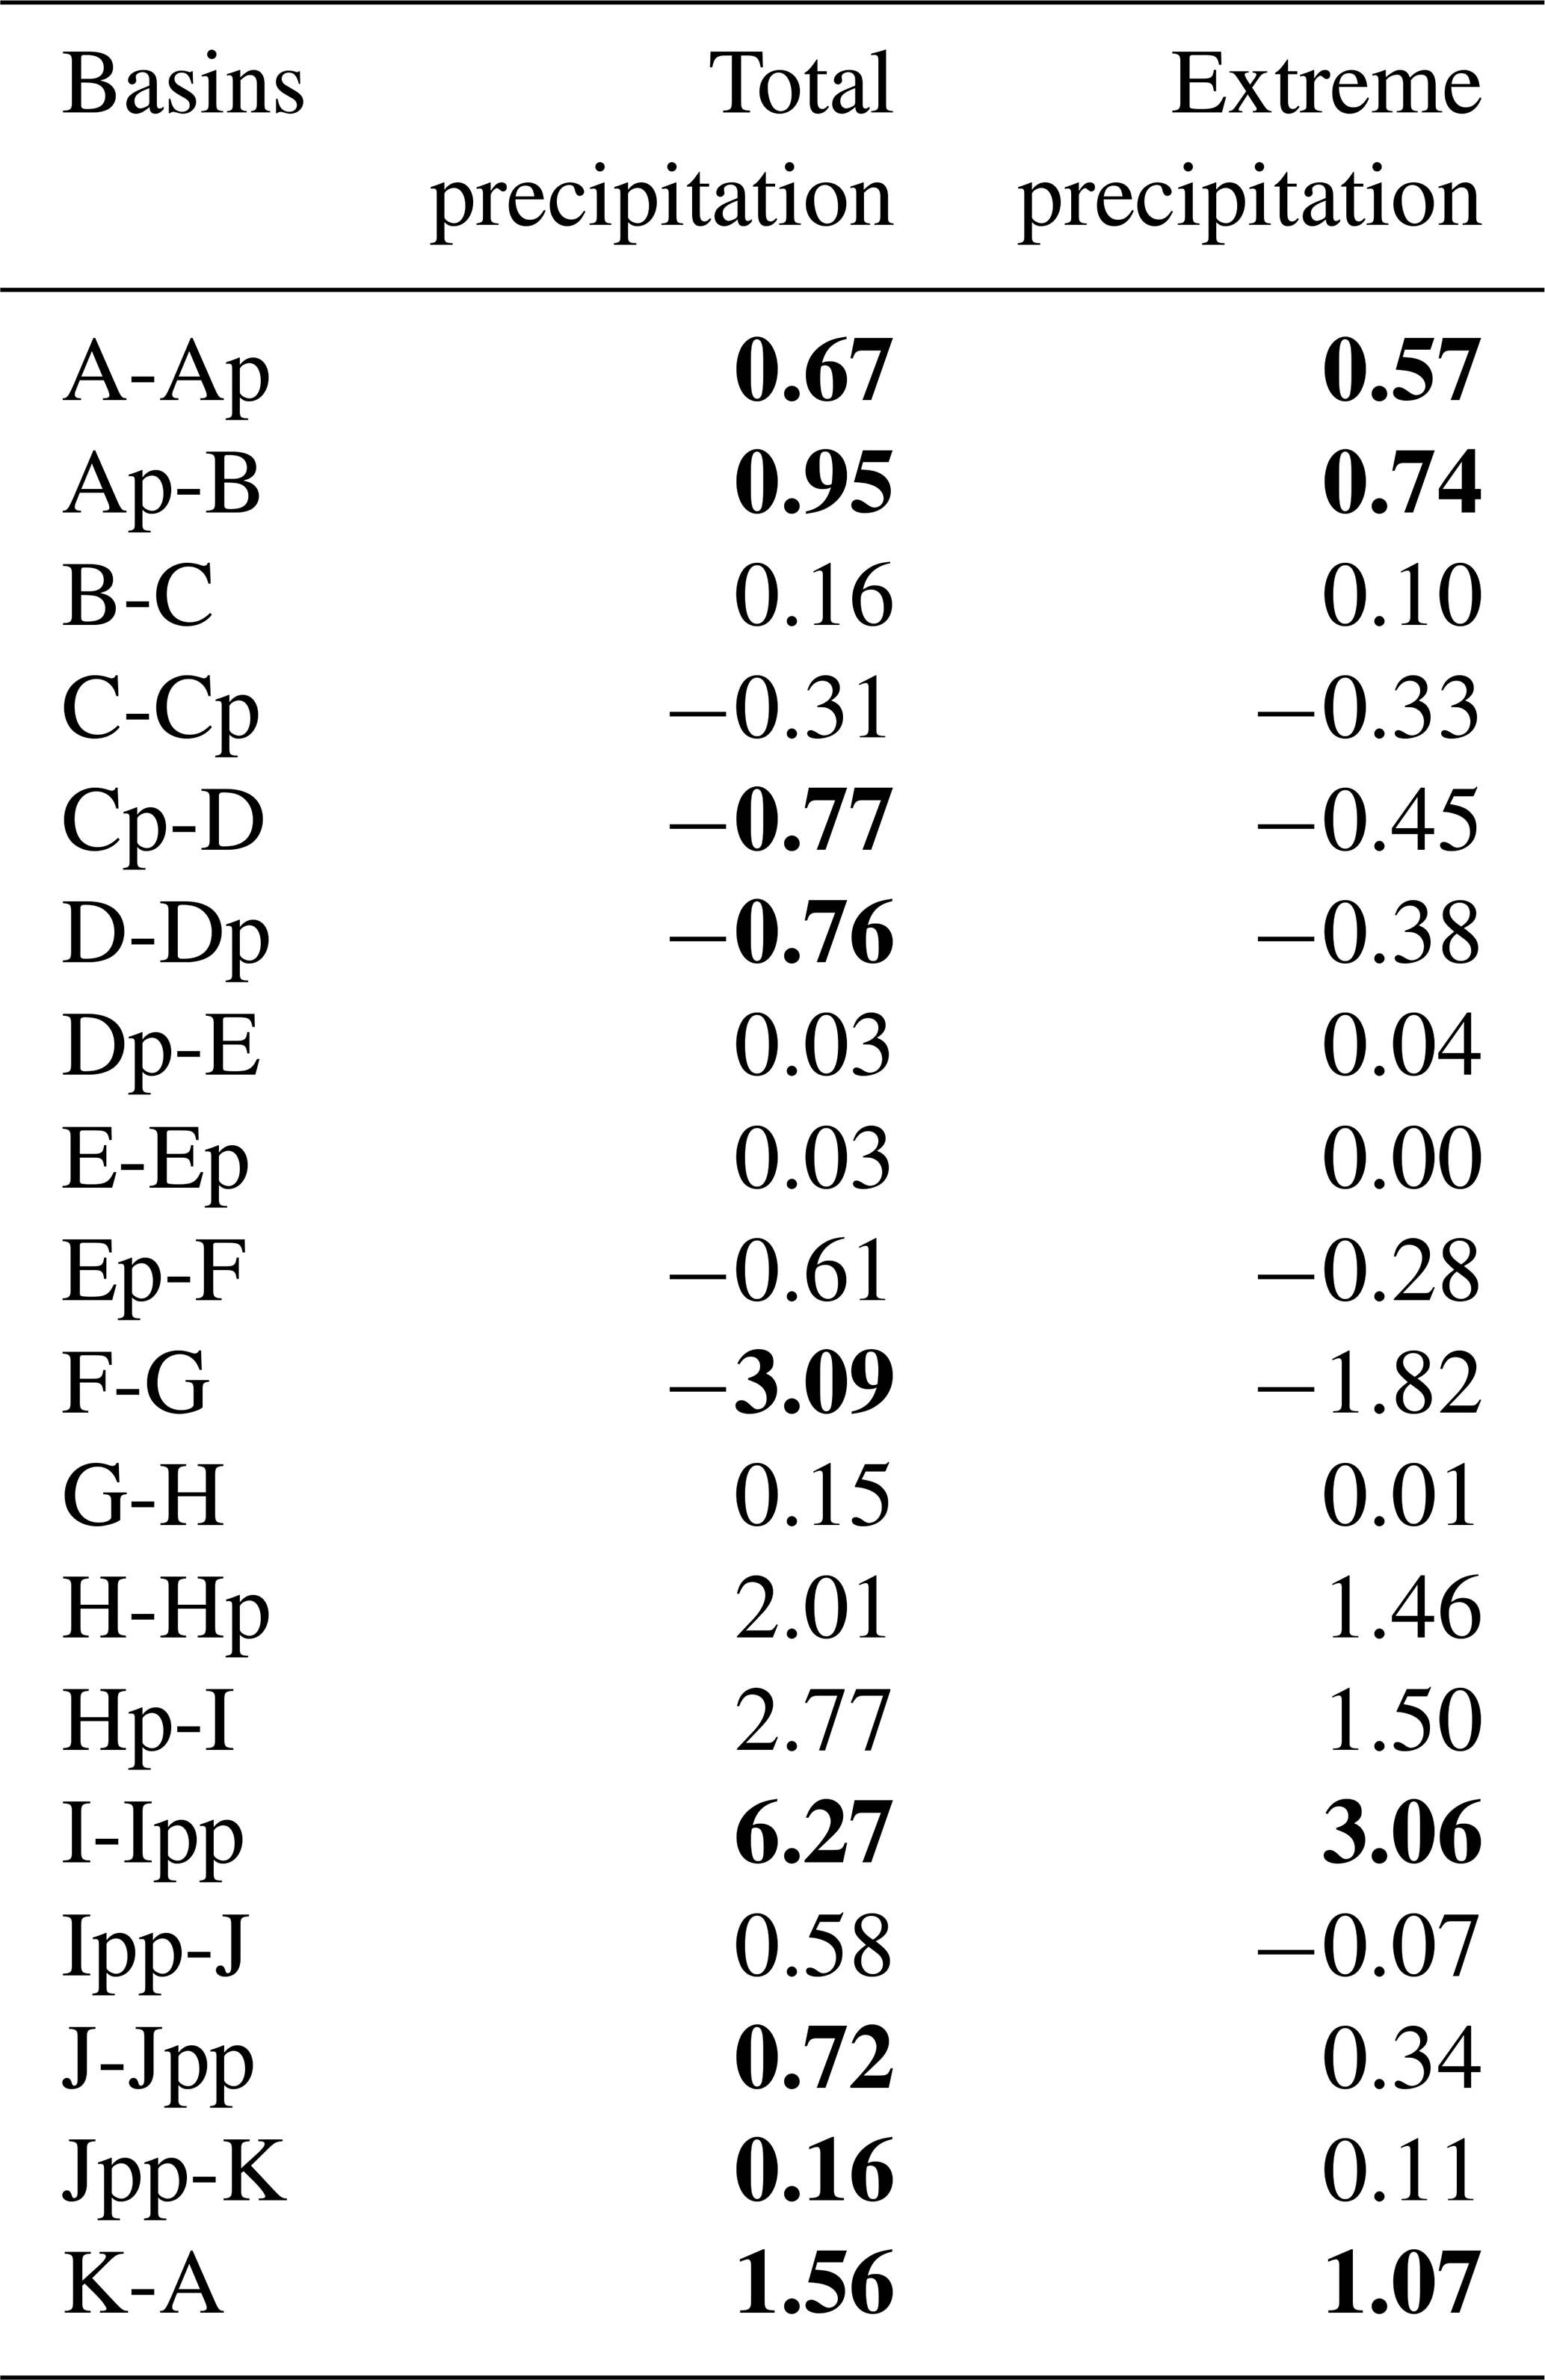
Within the regions showing positive ERA5-based trends, we identified four drainage basins with statistically significant positive basin-averaged trends in both total and extreme precipitation (Table 1). These are basin I-Ipp in the Antarctic Peninsula, basins K-A and A-Ap in East Antarctica (both part of Dronning Maud Land), and Ap-B in East Antarctica (Enderby Land) (see Fig. 1 for locations). The basins A-Ap and Ap-B have similar ERA5 trends of around 0.7 to 0.9 mm yr−1 for total precipitation and around 0.6 to 0.7 mm yr−1 for extreme precipitation, whereas basins K-A and I-Ipp have trends of 1.56 and 6.27 mm yr−1 for total precipitation and 1.07 and 3.06 mm yr−1 for extreme precipitation, respectively. Additionally, we identified two basins with statistically significant positive basin-averaged trends in total precipitation only, which were J-Jpp in West Antarctica and Jpp-K in East Antarctica (both part of the Filchner-Ronne basin), with trends of 0.72 and 0.16 mm yr−1, respectively. Furthermore, within the regions showing negative ERA5-based trends, we identified three drainage basins with significant negative basin-averaged trends in total precipitation only, which were basins Cp-D in East Antarctica (Wilkes Land), D-Dp in East Antarctica (Victoria Land), and F-G in West Antarctica (Marie Byrd Land), with trends of −0.77, −0.76, and −3.09 mm yr−1, respectively.
Table 1Basin-averaged annual linear trends in total and extreme precipitation (mm yr−1) for the 18 major drainage basins of Antarctica from 1979 to 2023 for ERA5. Trends that are statistically significant at the 90 % confidence level are shown in bold.
3.2 Detection of precipitation trends in CESM1
Figure 2b, g demonstrates that the CESM1 ensemble mean for ALL also shows statistically significant positive trends for both total and extreme precipitation from Ellsworth Land to the Amery ice shelf (up to 2 mm yr−1), as well as positive trends for total precipitation over the Antarctic Peninsula, which agree with the statistically significant positive trends from ERA5. By contrast, the ensemble mean for ALL shows positive trends in total and extreme precipitation over Marie Byrd Land, Wilkes Land, and Victoria Land, and positive trends for extreme precipitation over the Antarctic Peninsula, which disagree with ERA5. However, some differences in trends between the ALL ensemble and ERA5 results are to be expected as the ALL results are based on an ensemble of model means, which would therefore artificially reduce the contribution from internal variability.
For the nine drainage basins identified as having statistically significant ERA5-based trends for total precipitation, Fig. 3 shows that the CESM1 ALL simulations are in good agreement with ERA5 for five of them (J-Jpp in West Antarctica, and Jpp-K, A-Ap, Ap-B, and K-A in East Antarctica, all showing positive trends). Furthermore, for the four drainage basins identified as having statistically significant ERA5-based trends for extreme precipitation, the ALL simulations are in good agreement with ERA5 for three of them (A-Ap, Ap-B, and K-A, all showing positive trends). In these basins, (i) the basin-averaged trends of the ensemble mean for ALL are close to the ERA5 trends (although this is less apparent for basin K-A), and (ii) the range of basin-averaged ALL trends from the different members includes the ERA5 trends. By contrast, for the remaining four basins identified as having statistically significant ERA5-based trends for total precipitation, Fig. 3 shows for basin I-Ipp (Antarctic Peninsula) that the range of the ALL trends from the different members does not include the ERA5 trend, while for basins Cp-D and D-Dp (East Antarctica) and F-G the ensemble mean for ALL is positive whereas the ERA5 trends are negative. Furthermore, for extreme precipitation for basin I-Ipp, the range of the ALL trends from the different members does not include the ERA5 trend.
For the rest of our analysis we therefore focus on the five drainage basins (J-Jpp, Jpp-K, A-Ap, Ap-B, and K-A) identified as having ALL trends for total precipitation that are in good agreement with ERA5 trends, and the three basins (A-Ap, Ap-B, and K-A) identified as having ALL trends for extreme precipitation that are in good agreement with ERA5 trends. Note therefore that the basins considered from here on are only associated with positive precipitation trends. To further compare the basin-averaged trends between ERA5 and the ensemble mean for ALL for these selected basins, Fig. 4 shows their time-series of total and extreme precipitation from 1979 to 2023. Consistent with Fig. 3, this shows (i) broadly similar positive trends for selected basins for both ERA5 and ALL, and (ii) the ensemble spread of ALL encompassing the ERA5-based precipitation amounts, indicating confidence in the ability of CESM1 to capture regional internal variability, as well as the trends.
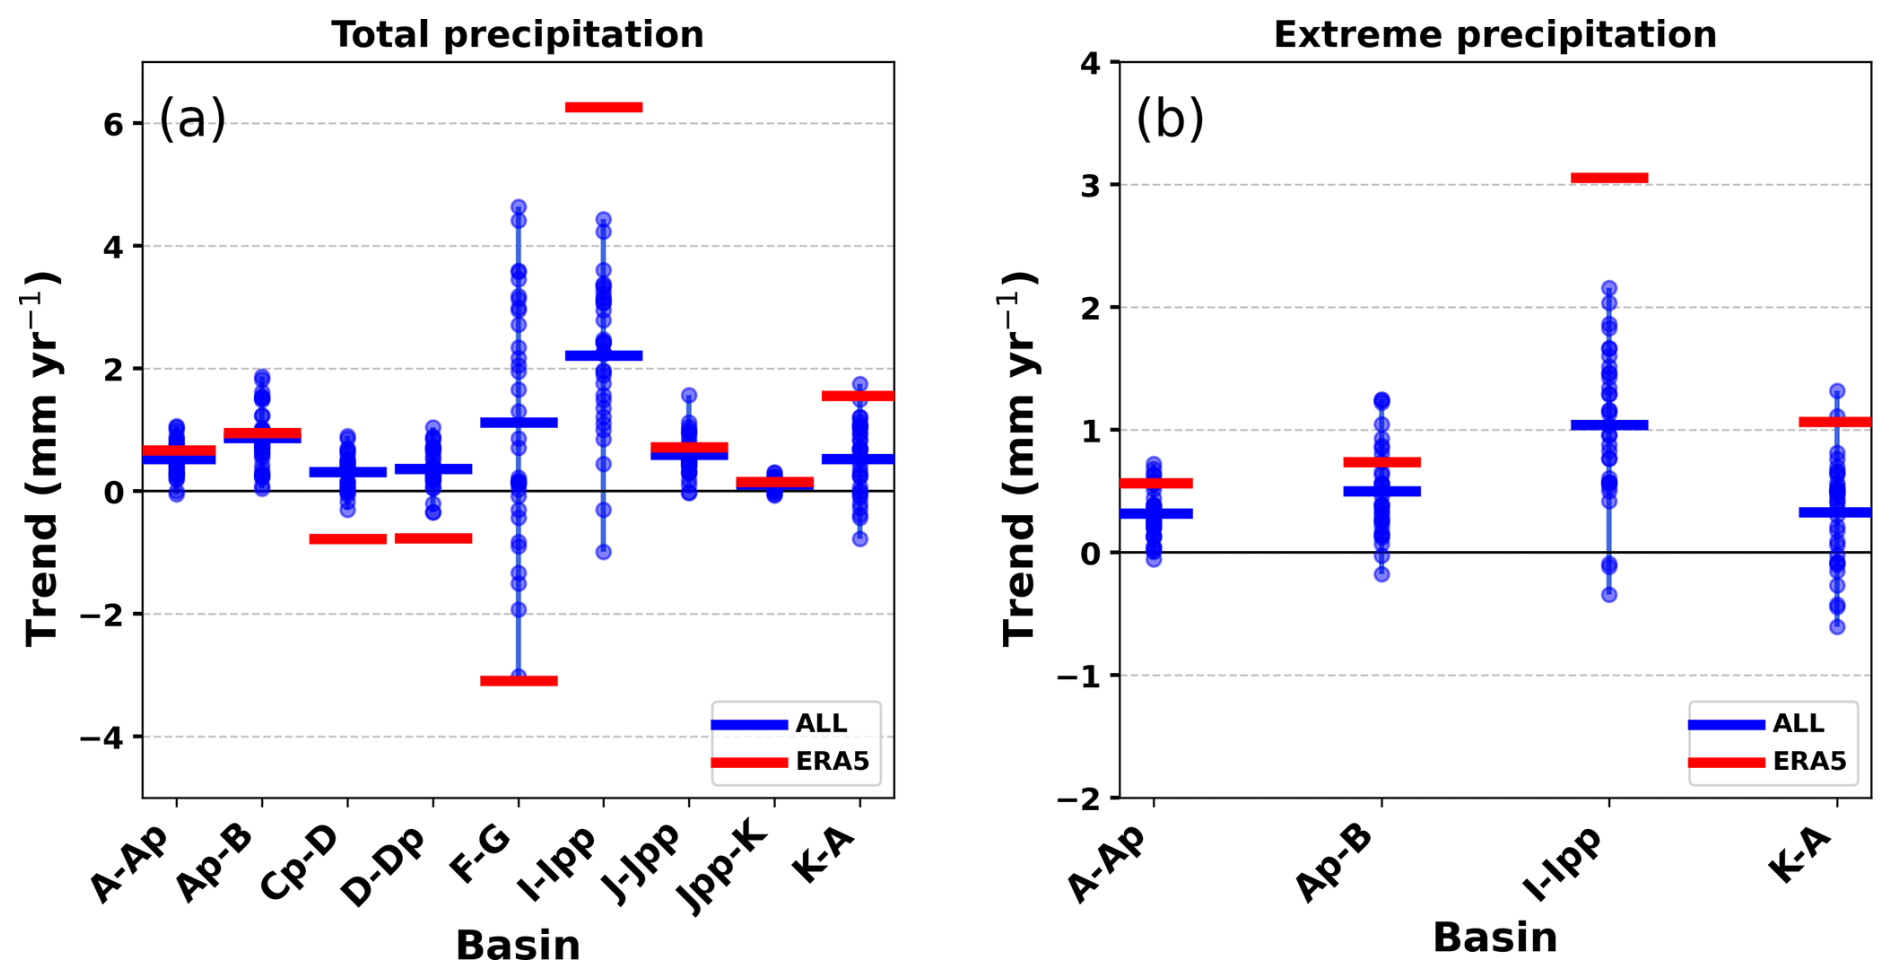
Figure 3(a) Basin-averaged annual linear trends in total precipitation (mm yr−1) for drainage basins A-Ap, Ap-B, Cp-D, D-Dp, F-G, I-Ipp, J-Jpp, Jpp-K, and K-A for ERA5 (thick red line) and the CESM1 ensemble mean for ALL (thick blue line). (b) as (a) but for extreme precipitation for basins A-Ap, Ap-B, I-Ipp, and K-A. Also shown are the basin-averaged trends from the 40 different members of the ALL ensemble (filled blue circles). The trends are statistically significant with a 90 % confidence level. The A-Ap and K-A (Dronning Maud Land), Ap-B (Enderby Land), Cp-D (Wilkes Land), D-Dp (Victoria Land), and Jpp-K (Filchner-Ronne) basins are in East Antarctica, the F-G (Marie Byrd Land) and J-Jpp (Filchner-Ronne) basins in West Antarctica, and the I-Ipp basin in the Antarctic Peninsula.
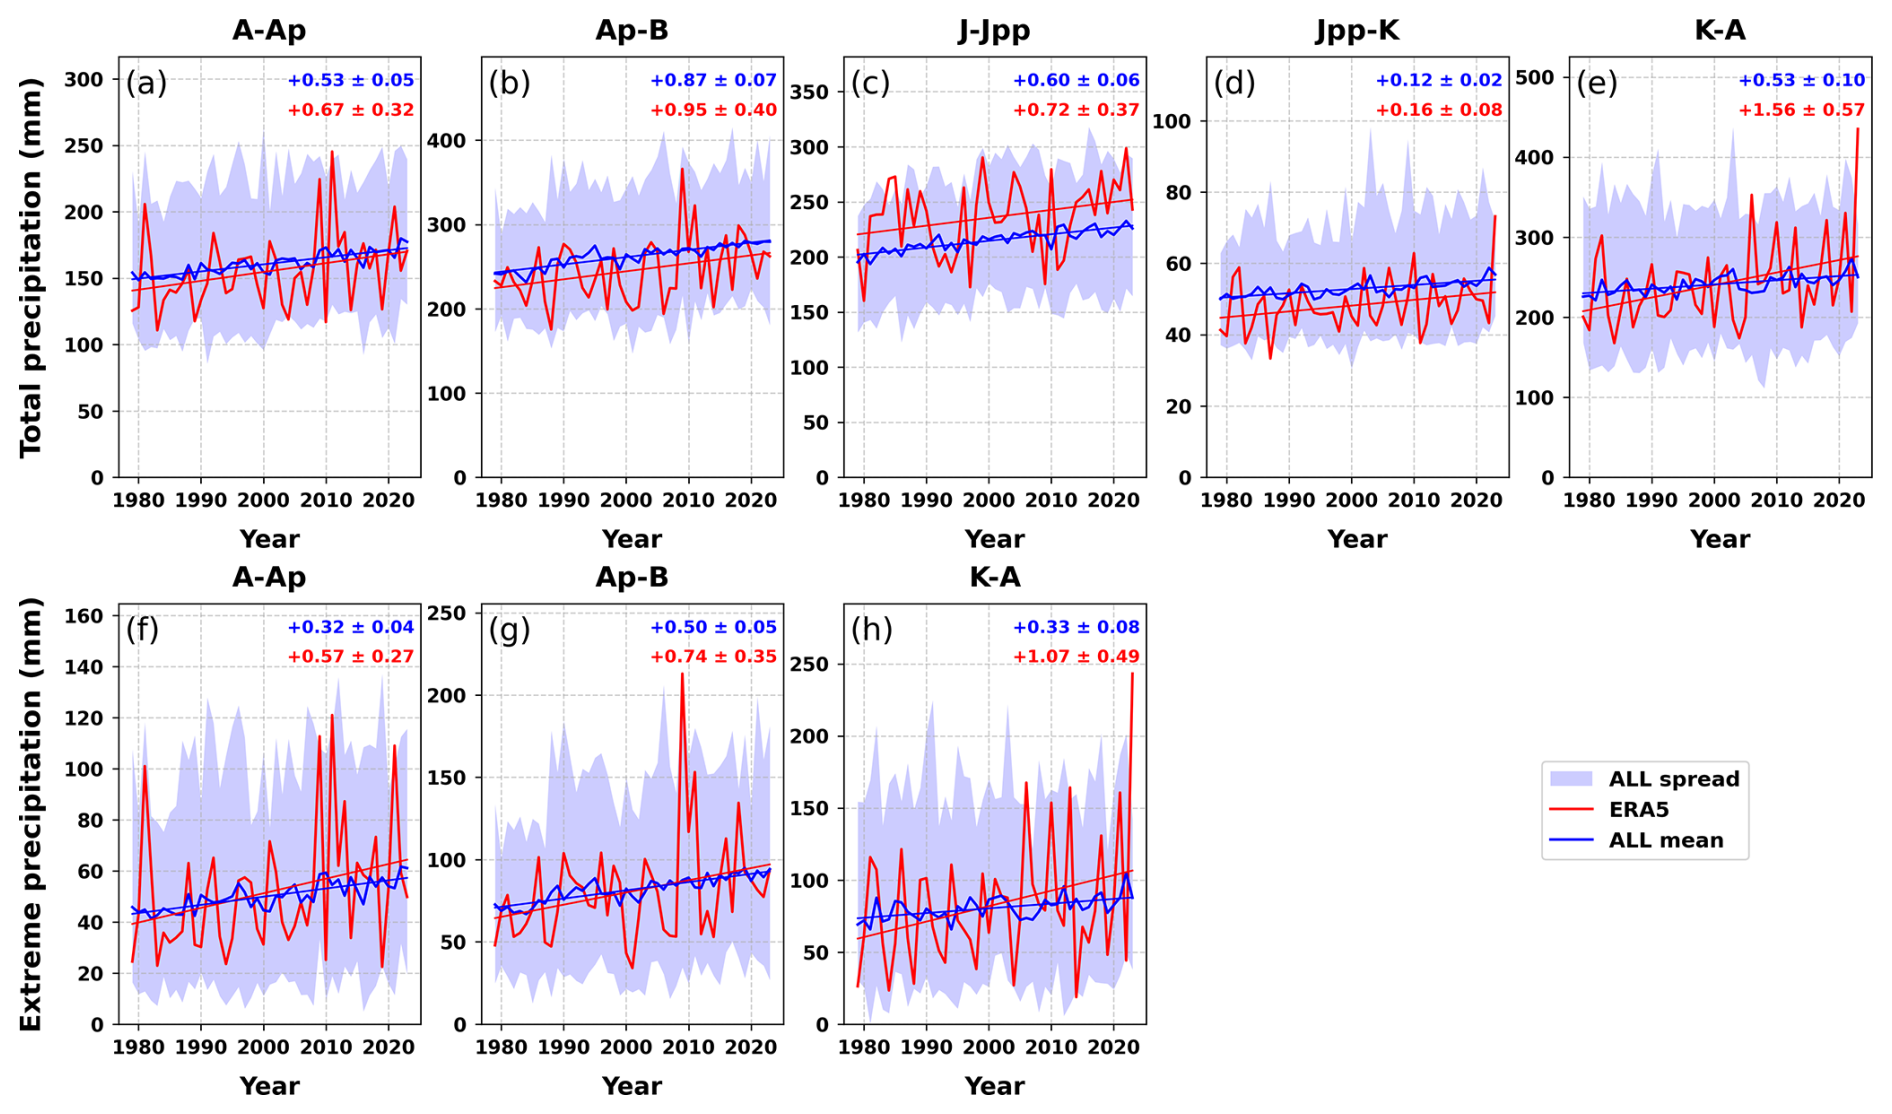
Figure 4Times series of basin-averaged annual total precipitation (mm) for (a) A-Ap, (b) Ap-B, (c) J-Jpp, (d) Jpp-K, and (e) K-A, and annual extreme precipitation (mm) for (f) A-Ap, (g) Ap-B, and (h) K-A, from 1979 to 2023 from ERA5 (red) and the CESM1 ensemble mean for ALL (blue). Linear trends (statistically significant at 90 % confidence level) for ERA5 and ALL are represented by the red and blue lines, respectively. Blue shading represents the maximum and minimum ensemble spread of ALL. Each panel also shows the linear trend and the standard error (mm yr−1). The A-Ap and K-A (Dronning Maud Land), Ap-B (Enderby Land), and J-Jpp (Filchner-Ronne) basins are in East Antarctica, and the Jpp-K (Filchner-Ronne) basin in West Antarctica.
Figure 5 presents the one-signal D&A results for total and extreme precipitation across the selected basins, based on regression of the CESM1 ALL ensemble onto ERA5. Here the scaling factors and the confidence intervals are greater than zero, which suggests that the ERA5-based trends in total precipitation for the five basins (J-Jpp, Jpp-K, K-A, A-Ap, Ap-B) and extreme precipitation for the three basins (K-A, A-Ap, Ap-B) are explained by external forcing (i.e., successful detection, and supporting the results from Figs. 2, 3 and 4). Furthermore, because the confidence intervals include unity for K-A and A-Ap for total precipitation and K-A, A-Ap and Ap-B for extreme precipitation, suggests that the ALL trends are statistically consistent with the associated ERA5-based trends for these basins. In contrast, for total precipitation, the scaling factors are slightly less than one for Jpp-K and Ap-B, which suggests that for these basins that ALL tends to overestimate the associated ERA5-based trends, and slightly greater than one for J-Jpp, which suggests that for this basin that ALL tends to underestimate the associated ERA5-based trends. Also, the slightly narrower intervals for total precipitation indicates that the influence of internal variability is larger for extreme precipitation compared to total precipitation.
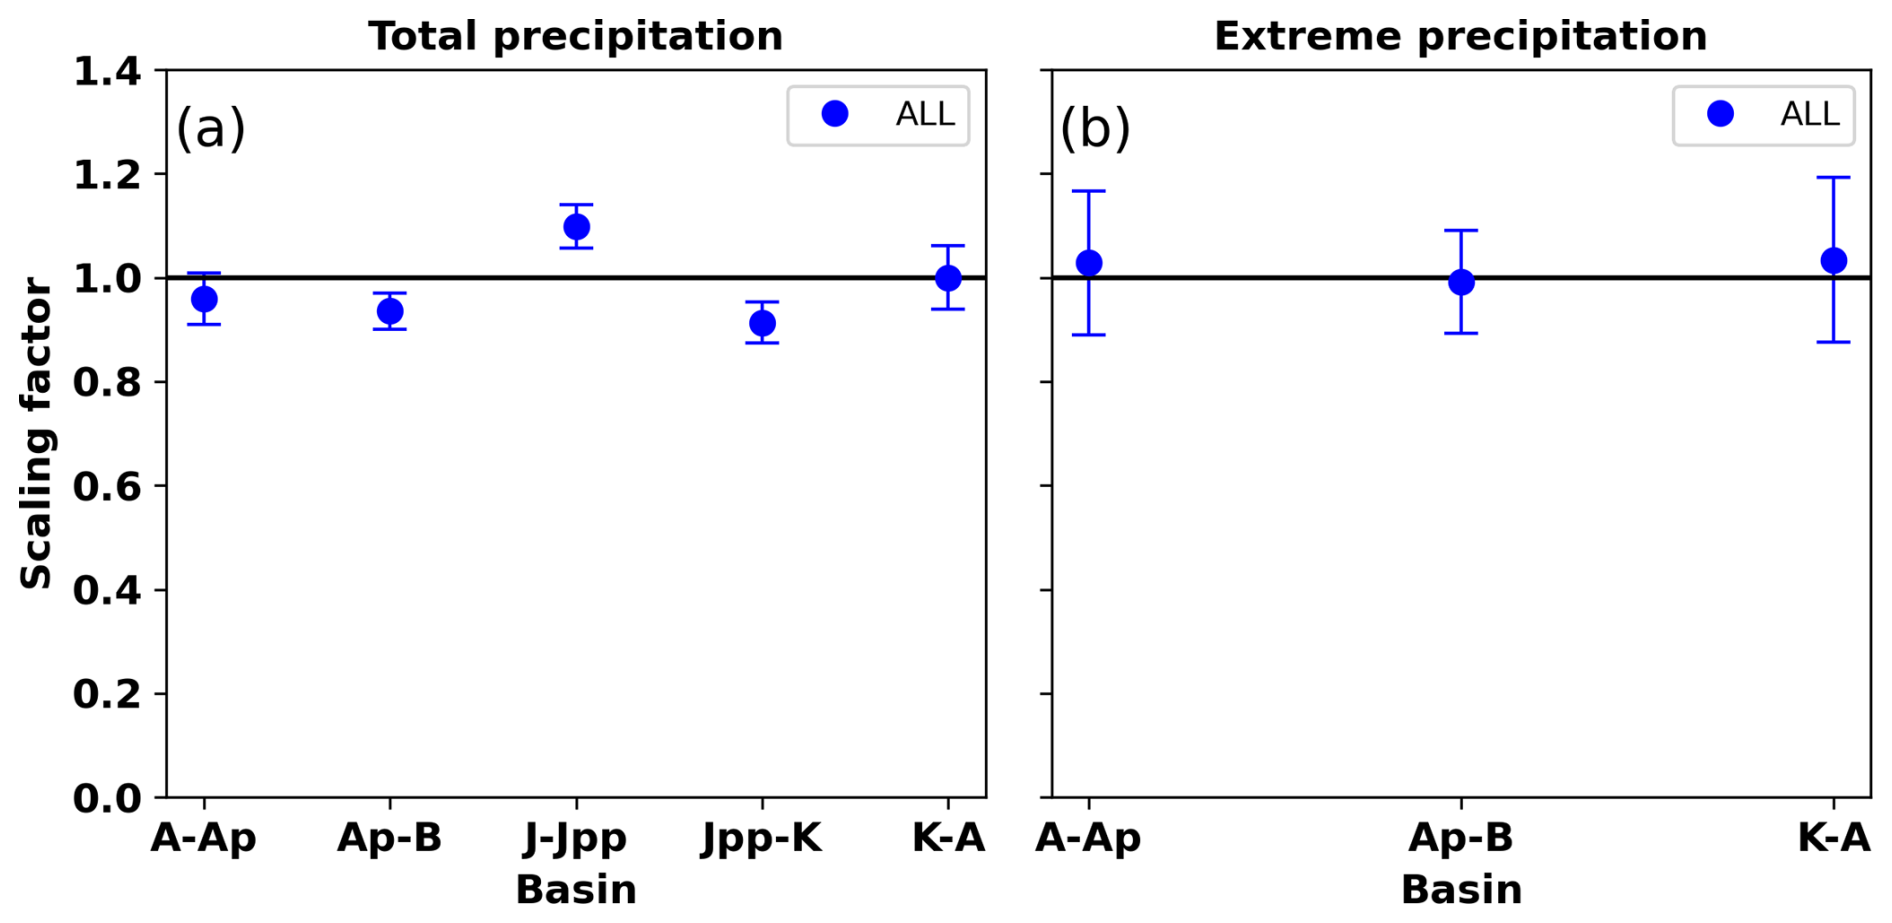
Figure 5(a) One-signal estimates of basin-averaged scaling factors (solid blue circles) for annual total precipitation for drainage basins A-Ap, Ap-B, J-Jpp, Jpp-K and K-A from 1979 to 2023 based on regressing the CESM1 ALL ensemble against ERA5. (b) as (a) but for annual extreme precipitation for basins A-Ap, Ap-B and K-A. The error bars denote the 90 % confidence intervals and the horizontal line indicates a scaling factor of one. The A-Ap and K-A (Dronning Maud Land), Ap-B (Enderby Land), and J-Jpp (Filchner-Ronne) basins are in East Antarctica, and the Jpp-K (Filchner-Ronne) basin in West Antarctica.
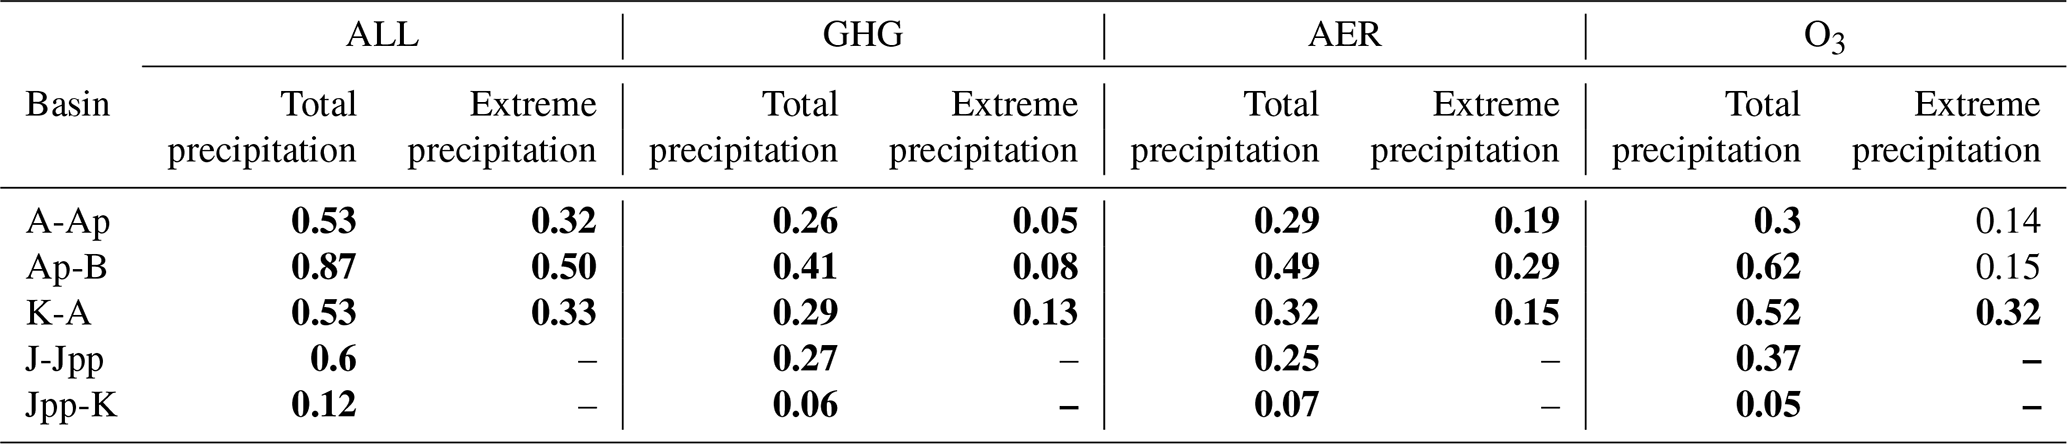
Table 2Basin-averaged annual trends in total and extreme precipitation (mm yr−1) for drainage basins, A-Ap, Ap-B, K-A, J-Jpp, and Jpp-K from 1979 to 2023 (mm yr−1) for the CESM1 ensemble mean for ALL, GHG, AER and O3. Trends that are statistically significant at the 90 % confidence level are shown in bold. The A-Ap and K-A (Dronning Maud Land), Ap-B (Enderby Land), and J-Jpp (Filchner-Ronne) basins are in East Antarctica, and the Jpp-K (Filchner-Ronne) basin in West Antarctica.
3.3 Attribution of precipitation trends in CESM1
An initial assessment of the contribution from different external forcings to the statistically significant positive ensemble mean trends for CESM1 ALL for both total and extreme precipitation over Ellsworth Land, the Filchner-Ronne basin, Dronning Maud Land, Enderby Land, and the Amery ice shelf (i.e., the regions in agreement with ERA5) was made by comparing these trends with the CESM1 ensemble mean trends for GHG, AER and O3 (Fig. 2). These results show that the ensemble mean trends in total and extreme precipitation for GHG, AER, and O3 are mostly positive and significant over these regions, indicating that greenhouse gases, anthropogenic aerosols, and stratospheric ozone are all important drivers of the positive precipitation trends in the ALL response over these regions. However, for extreme precipitation, the trends for GHG and O3 are notably weaker, sometimes non-significant, and less spatially coherent than the AER trends, indicating that greenhouse gases and stratospheric ozone are less important for driving the positive extreme precipitation trends in the ALL response over these regions.
To initially assess the contributions from different external forcings to the positive ensemble mean trends for CESM1 ALL for both total and extreme precipitation for the selected basins, Table 2 compares basin-averaged ensemble mean trends for ALL, GHG, AER and O3 for each of these sites. For total precipitation, the trends for ALL are statistically significant and positive for all five basins, with values ranging from 0.12 to 0.87 mm yr−1. By comparison, the trends for total precipitation for GHG, AER, and O3 are also statistically significant and positive for all five basins, with values ranging from 0.06 to 0.41 mm yr−1 for GHG and 0.07 to 0.49 mm yr−1 for AER (i.e., GHG and AER similar values, both around half that of the ALL trends), and from 0.05 to 0.62 mm yr−1 for O3 (with O3 trends higher than GHG and AER in three basins). Also, for basin K-A the total precipitation trend for O3 and ALL are 0.52 and 0.53 mm yr−1, respectively, which are comparable in magnitude. For extreme precipitation, the trends for ALL are also statistically significant and positive across for all three basins, with values ranging from 0.32 to 0.50 mm yr−1. By comparison, the trends for extreme precipitation for GHG and AER are also statistically significant and positive for all three basins, with values ranging from 0.05 to 0.13 mm yr−1 for GHG (i.e., typically around 20 % of the ALL trends) and from 0.15 to 0.29 mm yr−1 for AER (i.e., much higher than the GHG trends and typically around a half of the ALL trends, and consistent with Fig. 2). However, the trends for O3 are only statistically significant for basin K-A, which has a value of 0.32 mm yr−1, which is comparable to the value for ALL of 0.33 mm yr−1 (consistent with Fig. 2).
The relative importance of greenhouse gases, anthropogenic aerosol, and stratospheric ozone forcings for producing the positive trends in total and extreme precipitation over the selected basins is also evident from comparison of the probability distribution functions of the trends for all of the CESM1 ensembles for ALL, GHG, AER and O3 (Fig. S1 in the Supplement). These results show considerable similarities between the different distributions, which are generally shifted towards positive trends and largely overlap each other, although ALL is especially positively skewed and generally has a longer right-hand-side tail. However, for total precipitation the results also show that the O3 distributions are especially positively skewed and have a longer right-hand-side tail compared to GHG and AER, and in several basins overlap with ALL (e.g., K-A). However, this may partly reflect the shorter O3 simulation period (1979–2005) and the smaller ensemble size (8 members), both of which increase the sensitivity of the estimated trends to internal variability. For extreme precipitation, the results show that the GHG distributions are relatively less positively skewed/weak, suggesting again that greenhouse gases are less important for driving the positive extreme precipitation trends compared to AER.
Figure 6 presents the two-signal D&A results for total and extreme precipitation across the selected basins, showing scaling factors and confidence intervals for the CESM1 ensembles GHG, AER, and O3. The results for total precipitation show that the signal from GHG is identified in basin Ap-B and from O3 in basins Ap-B and K-A (scaling factors and confidence intervals being greater than zero and including unity). These results were also generally associated with relatively small confidence intervals, indicating high confidence that the increases in ERA5-based total precipitation in these basins can be robustly attributed to greenhouse gas emissions and stratospheric ozone forcing in CESM1. Additionally, for total precipitation the signal from AER is identified in basins Ap-B and K-A. However, for Ap-B the upper bound of the confidence interval is less than unity and for K-A the lower bound of the confidence interval is greater than unity, which suggests that increases in anthropogenic aerosols in CESM1 tends to overestimate for Ap-B and underestimate for K-A the increases in ERA5-based total precipitation in these basins. By contrast, results from other basins for total precipitation have confidence intervals that include zero, indicating that the total precipitation signals for GHG (for A-Ap, K-A, J-Jpp, Jpp-K), AER (for A-Ap, J-Jpp, Jpp-K) and O3 (for A-Ap, J-Jpp, Jpp-K) cannot be considered statistically significant. Therefore, the increases in ERA5-based total precipitation cannot be formally associated with these external forcings. The results for extreme precipitation show that the signals from GHG and O3 are identified in basin Ap-B (scaling factors and their confidence intervals are greater than zero and include unity), thus indicating that the increase in ERA5-based extreme precipitation in this basin can be robustly attributed to greenhouse gas emissions and stratospheric ozone forcing in CESM1. However, this result for stratospheric ozone forcing is inconsistent with the results based on the initial assessment of the contributions from different external forcings to the trends for ALL, which showed that the signal for stratospheric ozone was only apparent in basin K-A, and not Ap-B (Table 2) – suggesting that although the basin-averaged trends are the same for both approaches, the statistical significances are different. By contrast, extreme precipitation for the other basins have confidence intervals that include zero, indicating that the extreme precipitation signals for GHG (for A-Ap and K-A), AER (A-Ap, Ap-B, K-A) and O3 (A-Ap and K-A) cannot be considered statistically significant, i.e., the increases in ERA5-based extreme precipitation cannot be formally associated with these external forcings.
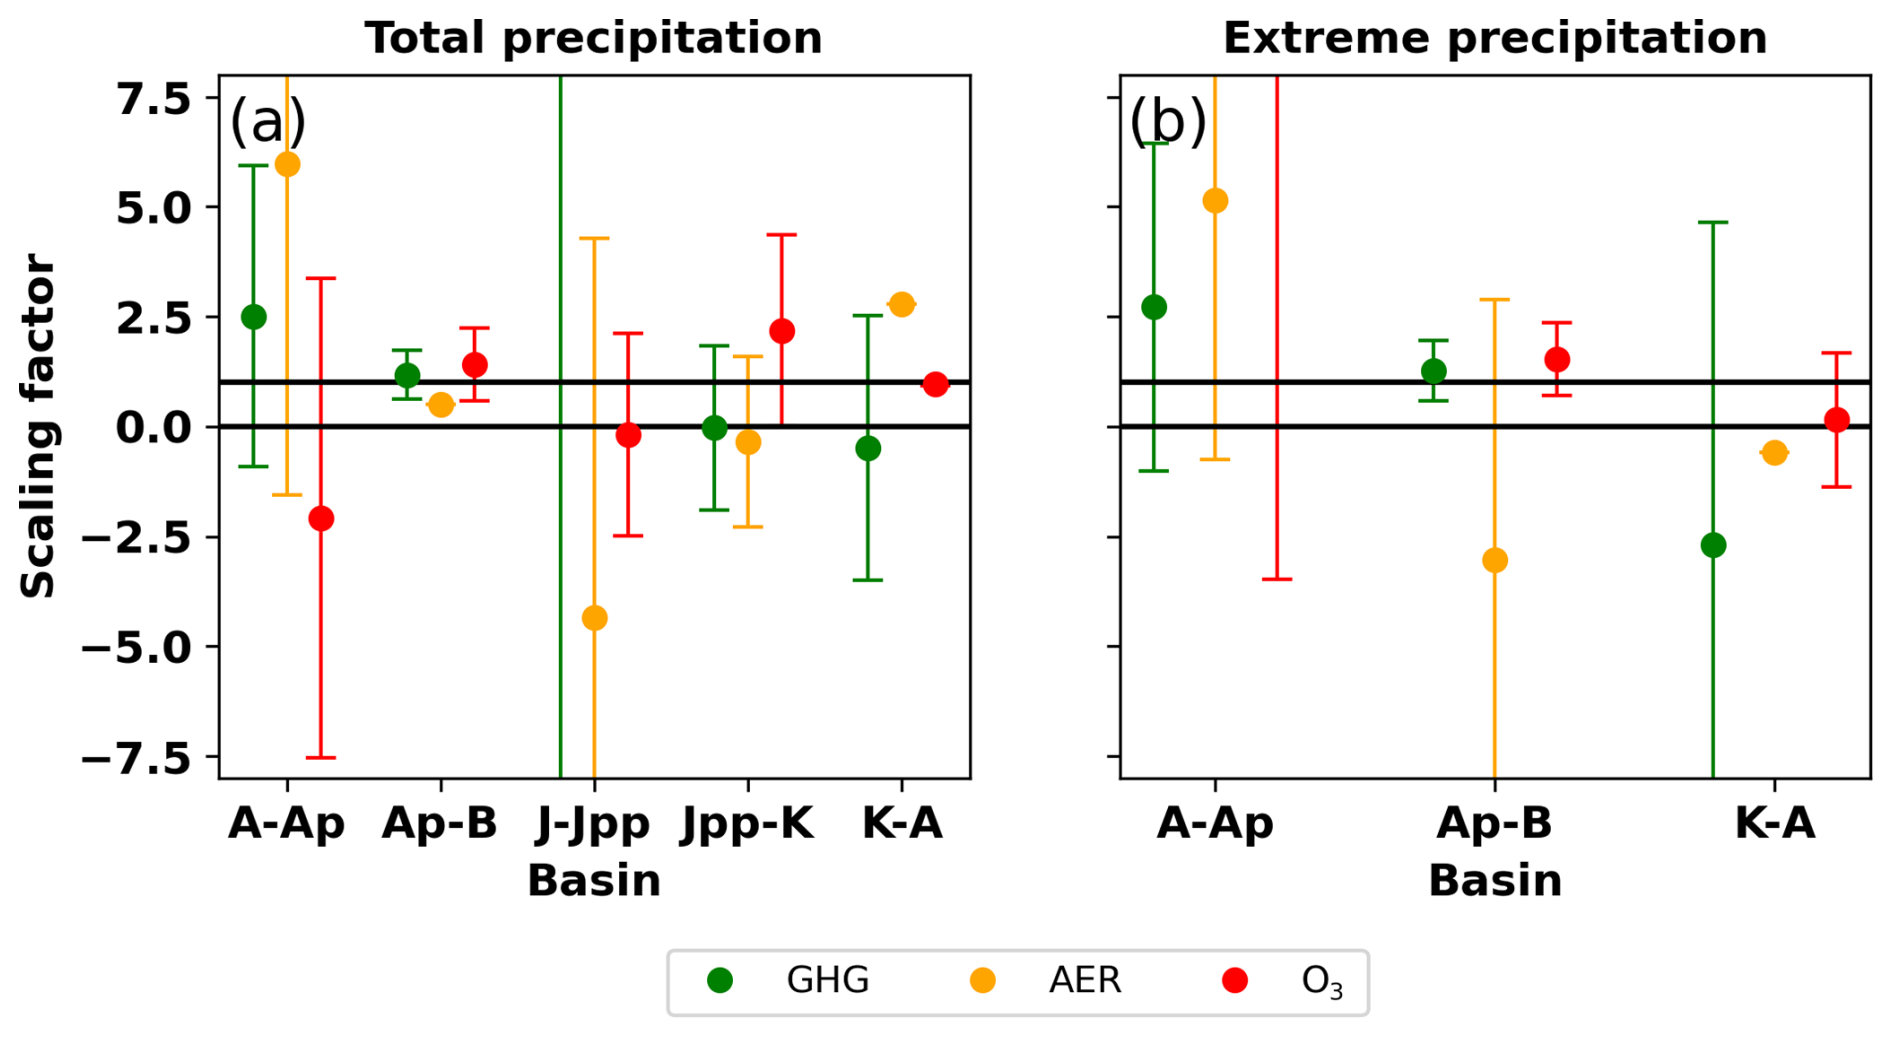
Figure 6As Fig. 5, but showing two-signal estimates of basin-averaged scaling factors for (a) annual total precipitation for drainage basins A-Ap, Ap-B, J-Jpp, Jpp-K and K-A from 1979 to 2023 for the CESM1 ensembles for GHG (solid green circles), AER (solid orange circles), and O3 (solid red circles). The GHG scaling factors are based on regressing ALL and xGHG against ERA5, AER scaling factors based on regressing ALL and xAER against ERA5, and O3 scaling factors based on regressing ALL and xO3 against ERA5. (b) as (a) but for annual extreme precipitation for basins A-Ap, Ap-B and K-A. The error bars denote the 90 % confidence intervals and the horizontal line indicates a scaling factor of one. The A-Ap and K-A (Dronning Maud Land), Ap-B (Enderby Land), and J-Jpp (Filchner-Ronne) basins are in East Antarctica, and the Jpp-K (Filchner-Ronne) basin in West Antarctica. Note that, for some scaling factors, the confidence intervals are sufficiently narrow that they are not visually discernible.
3.4 Detection and attribution of precipitation trends using CESM2
Figures S2 to S7 in the Supplement are analogous to Figs. 2 to 6, but based on results from the CESM2 ensembles for ALL, GHG, and AER. For the detection analysis, the results based on the CESM2 ALL ensemble are broadly consistent with those based on the CESM1 ALL ensemble, showing statistically significant positive annual trends in total and extreme precipitation over the same regions, which agree with ERA5 (Fig. S2). Additionally, the results based on the CESM2 ALL ensemble also identify the same basins as the CESM1 ALL ensemble that are associated with statistically significant positive trends in both total and extreme precipitation, which agree with ERA5 (i.e., A-Ap, Ap-B, J-Jpp, Jpp-K, and K-A for total precipitation, and A-Ap, Ap-B, and K-A for extreme precipitation) (Fig. S3). Moreover, for the three drainage basins that have statistically significant negative ERA5-based basin-averaged trends in total precipitation (Cp-D, D-Dp, and F-G), the range of the ALL trends from the different members includes negative values for two of the basins (Cp-D and D-Dp) (Fig. S3). Furthermore, another difference between the CESM1 and CESM2 results is that the CESM2 ensemble mean for ALL shows considerably higher precipitation amounts than ERA5 over the basins at the start of the period analysed (Fig. S4), reflecting a mean state bias in the CESM2 model (Dunmire et al., 2022). Additionally, the one-signal D&A results for total and extreme precipitation across the selected basins, based on regression of the CESM2 ALL ensemble onto ERA5, shows (i) scaling factors from 0.4 to 0.8 for both total and extreme precipitation, and (ii) relatively small confidence intervals, with total precipitation showing narrower intervals than extreme precipitation. Since the scaling factors are greater than zero and the confidence intervals are relatively small, this suggests with high confidence that the signal from the CESM2 ALL ensemble is detectable in ERA5, i.e., consistent with CESM1. Additionally, because the scaling factors are less than one, this suggests that the CESM2 ALL ensemble tends to overestimate the trends apparent in ERA5. Also, the slightly narrower intervals for total precipitation suggests that the influence of internal variability is larger for extreme precipitation compared to total precipitation in CESM2, i.e., consistent with CESM1.
For the attribution analysis, the results show that the ensemble mean trends in total and extreme precipitation from the CESM2 GHG ensemble are in good agreement with those from the CESM2 ALL ensemble over much of Antarctica (Fig. S2), i.e., indicating that greenhouse gas forcing is the primary driver of the positive trends in the CESM2 ALL ensemble, consistent with CESM1. For example, the CESM2 GHG ensemble captures the positive trends from Marie Byrd Land to the western section of Wilkes Land that are apparent in ALL. By contrast, the trends of the ensemble mean of the CESM2 AER ensemble are mostly negative for total and extreme precipitation over Antarctica, although areas that show statistically significant trends are rather patchy, i.e., indicating that the effects of increased anthropogenic aerosols tend to offset the positive trends from increased greenhouse gases, which is inconsistent with CESM1 results. The importance of greenhouse gas forcing for producing the positive trends in total and extreme precipitation over the selected basins is also evident from probability distribution functions of the trends from the CESM2 ensembles for ALL, GHG, and AER, which shows considerable similarities between the distributions for the GHG and ALL trends (Fig. S6). The distribution of the AER trends also confirms the offsetting effect of anthropogenic aerosols for total precipitation (Jpp-K and K-A) and extreme precipitation (Ap-B and K-A), with the AER distributions skewed towards negative values. For the remaining basins (both total and extreme precipitation) the AER distributions include some positive trends for both total and extreme precipitation, albeit the negative trends still tend to dominate (with the exception of J-Jpp for total precipitation).
Finally, Fig. S7 presents the three-signal D&A results for total and extreme precipitation for the selected basins, based on regression of the CESM2 ensembles for ALL, GHG, and AER against ERA5, which produces scaling factors for GHG, AER, and OTHERS (i.e., all forcings other than greenhouse gases and anthropogenic aerosols). Here, the results were associated with confidence intervals that included zero, indicating that the total and extreme precipitation signals for GHG, AER, and OTHERS cannot be considered statistically significant, indicating that the increases in ERA5-based total precipitation cannot be formally associated with these external forcings.
3.5 Role of atmospheric rivers in driving precipitation trends
Finally, to assess the role of ARs in driving the positive trends of total and extreme precipitation that are apparent in ERA5 over the five selected basins (J-Jpp, Jpp-K, A-Ap, Ap-B, and K-A), we also show the annual trends in AR-associated total and extreme precipitation from 1980 to 2023 (Fig. 7a, b), as well as the relative contribution of these trends to the total and extreme precipitation trends from ERA5 (Fig. 7c, d). The results show broadly statistically significant positive trends in AR-associated total and extreme precipitation over the basins considered, with trends around 0.5 mm yr−1 over basins J-Jpp and Jpp-K and up to 2 mm yr−1 over K-A, A-Ap, and Ap-B. Additionally, the relative contribution of the AR trends to the ERA5-based total and extreme precipitation trends has increased across all selected basins, with values of 10 % to 40 % over sections of basins J-Jpp, Jpp-K, and K-A, and up to 100 % over sections of basins A-Ap and Ap-B.
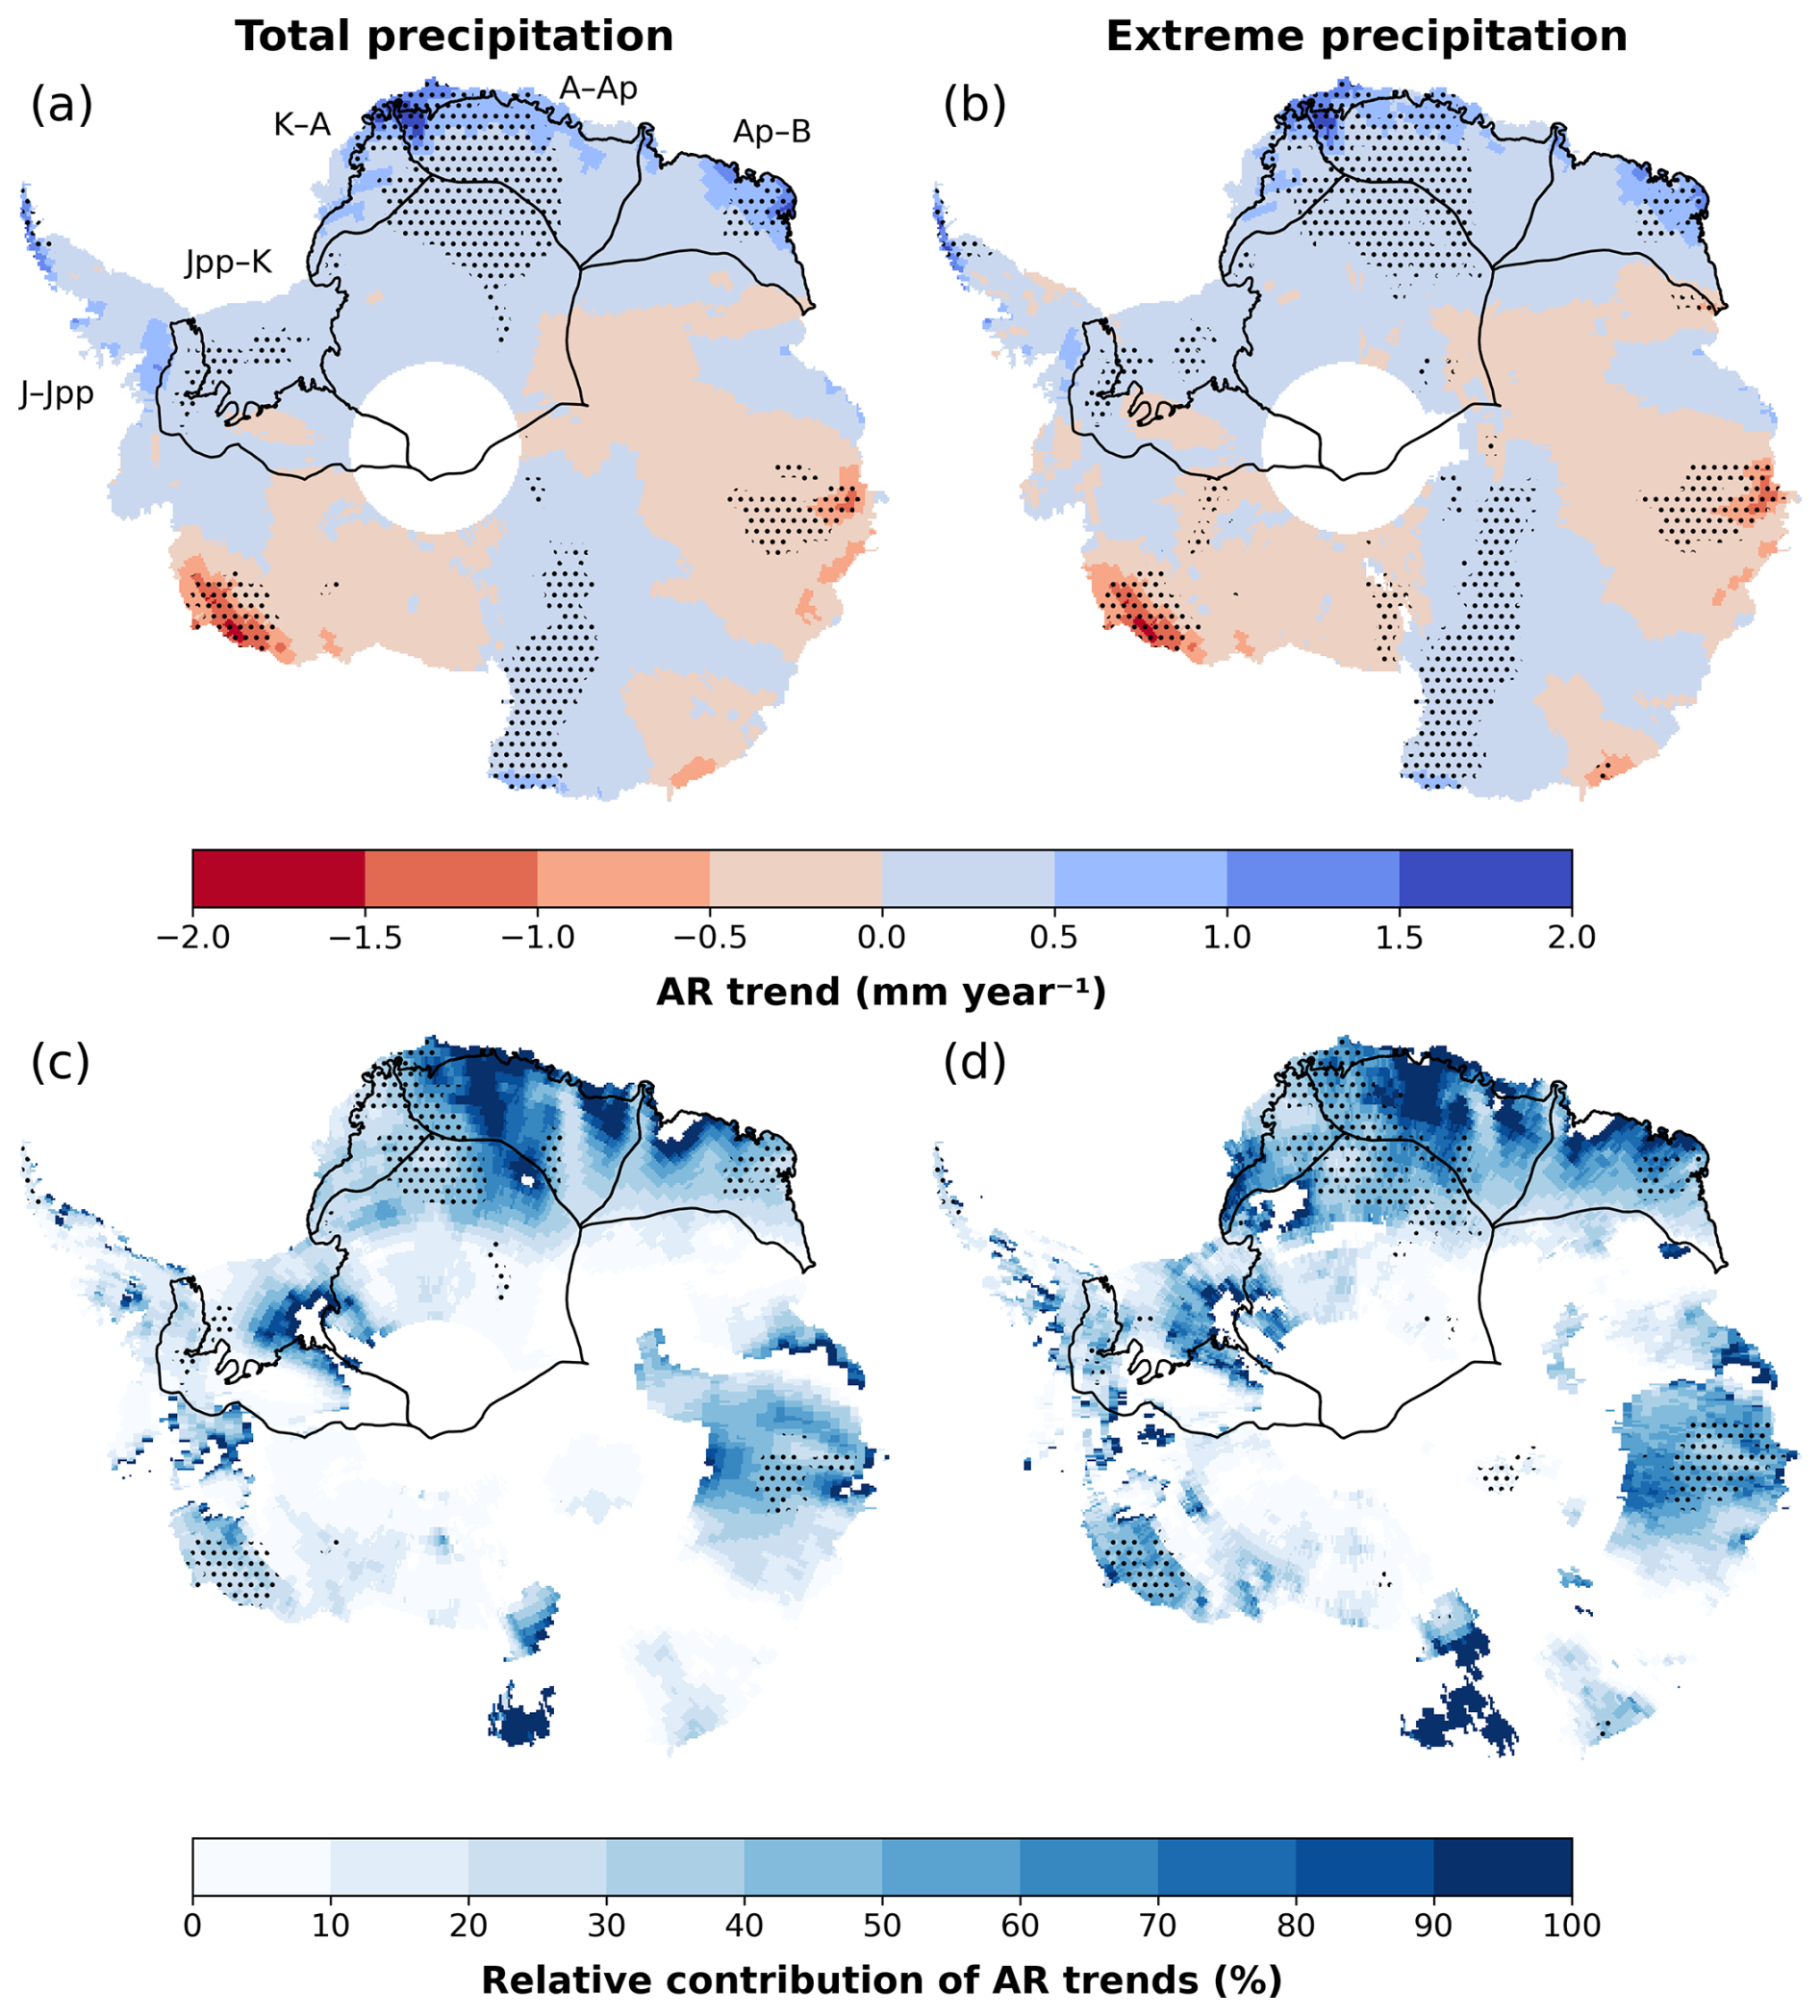
Figure 7Annual trends in AR-associated (a) total and (b) extreme precipitation over Antarctica from 1980 to 2023 (mm yr−1) from the AR detection dataset. Also shown are the relative contribution of the (c) AR-associated total precipitation trend to the ERA5-based total precipitation trend (%), and the (d) AR-associated extreme precipitation trend to the ERA5-based extreme precipitation trend (%). Stippling indicates regions where trends are statistically significant at the 90 % confidence level. Also shown in panel (a) are the locations of the A-Ap and K-A (Dronning Maud Land), Ap-B (Enderby Land), and J-Jpp (Filchner-Ronne) basins are in East Antarctica, and the Jpp-K (Filchner-Ronne) basin in West Antarctica.
This study identifies nine drainage basins with statistically significant trends for total precipitation in Antarctica from 1979 to 2023, based on the ERA5 reanalysis (Table 1, Figs. 2 and 3). For six of these basins the ERA5-based trends were positive, including one basin in the Antarctic Peninsula (I-Ipp), one in West Antarctica (J-Jpp situated within the Filchner-Ronne basin), and four in East Antarctica (K-A and A-Ap situated within Dronning Maud Land, Jpp-K situated within the Filchner-Ronne basin, and Ap-B situated within Enderby Land). For the other three basins the ERA5-based trends were negative, including one basin in West Antarctica (F-G situated within Marie Byrd Land), and two in East Antarctica (Cp-D situated within Wilkes Land, and D-Dp situated within Victoria Land). Additionally, four of the basins with positive basin-averaged trends in total precipitation also have positive trends in extreme precipitation, including one in the Antarctic Peninsula (I-Ipp) and three in East Antarctica (K-A and A-Ap situated within Dronning Maud Land, and Ap-B situated within Enderby Land).
For five of the six basins exhibiting positive trends in total precipitation (J-Jpp and Jpp-K situated within the Filchner-Ronne basin, K-A and A-Ap situated within Dronning Maud Land, and Ap-B situated within Enderby Land) and three of the four basins exhibiting positive trends in extreme precipitation (K-A and A-Ap situated within Dronning Maud Land, and Ap-B situated within Enderby Land), the basin-averaged trends from the CESM1 ensembles for ALL are in good agreement with ERA5 (Figs. 2 and 3), i.e., suggesting that a combination of both anthropogenic and natural forcings are responsible for the 1979–2023 positive trends in total and extreme precipitation over these basins. By contrast, the trends from the CESM1 ensembles for ALL are in poor agreement for the three basins with negative ERA5-based trends in total precipitation (Fig. 3). Moreover, for these basins exhibiting positive trends the signal in ERA5 was formally detected in the CESM1 ensemble using the one-signal regression-based D&A analysis (Fig. 5), implying the emergence of the forced signal over internal variability. One of the main challenges in detecting a trend in total and extreme precipitation is separating the signal from forced variability and internal variability, which is exacerbated in Antarctica by the climate being particularly characterized by strong internal variability (Jones et al., 2016; Previdi and Polvani, 2016; Stenni et al., 2017). However, the successful detection of the signal in ERA5 in the CESM1 ensemble in four basins located in East Antarctica (J-Jpp situated within the Filchner-Ronne basin, K-A and A-Ap situated within Dronning Maud Land, and Ap-B situated within Enderby Land) and one basin in West Antarctica (Jpp-K situated within the Filchner-Ronne basin) agrees with Casado et al. (2023), who found weaker multi-decadal variability in East Antarctica compared to West Antarctica, i.e., the relatively weaker internal multi-decadal variability in East Antarctica increases the signal-to-noise ratio, and enables a more robust detection in this region.
Our initial attribution analysis based on comparison of basin-averaged trends using the CESM1 ensembles showed that increases in greenhouse gases, anthropogenic aerosols (excluding anthropogenic influences on biomass burning), and stratospheric ozone depletion are all important drivers of the positive trends for total precipitation for our (five) basins of interest (Figs. 2 and S1, and Table 2). However, for extreme precipitation, the role of greenhouse gases and stratospheric ozone depletion are less important than anthropogenic aerosols for driving the positive trends for our (three) basins of interest (Figs. 2 and S1, and Table 2). For example, for extreme precipitation, only basin K-A (Dronning Maud Land) showed that greenhouse gases, anthropogenic aerosols, and stratospheric ozone depletion are all important drivers of the trends (Fig. 2 and Table 2).
By contrast, the two-signal regression-based D&A analysis using the CESM1 ensembles for ALL and GHG, ALL and AER, and ALL and O3 (resulting in scaling factors and confidence intervals for GHG, AER, and O3) found robust attribution for the increases in total precipitation to greenhouse gases in one basin (Ap-B situated within Enderby Land) and stratospheric ozone depletion in two basins (Ap-B situated within Enderby Land, and K-A situated within Dronning Maud Land), and the increases in extreme precipitation to greenhouse gases and stratospheric ozone depletion in one basin (Ap-B situated within Enderby Land) (Fig. 6), i.e., for one basin (within Enderby Land) the increases in total and extreme precipitation are robustly attributed to both greenhouse gases and stratospheric ozone depletion. The other results for total and extreme precipitation using the two-signal regression-based approach have confidence intervals that include zero, indicating that any increases in total or extreme precipitation cannot formally be associated with these external forcings, including all results related to anthropogenic aerosols. These other results (with confidence intervals that include zero) are therefore inconsistent with the initial assessment of the contributions from different external forcings to the trends for ALL (Table 2), suggesting that although the basin-averaged trends are the same for both approaches, the statistical significance are different.
Results based on the CESM2 ensembles were also included to enable us to identify the responses that are consistent for both CESM1 and CESM2, and which are sensitive to the choice of model (Simpson et al., 2023). The results based on the CESM2 ALL ensemble identifies the same basins as the CESM1 ALL ensembles that are associated with positive trends in both total and extreme precipitation, which are in agreement with ERA5 (A-Ap, Ap-B, J-Jpp, Jpp-K, and K-A for total precipitation, and A-Ap, Ap-B, and K-A for extreme precipitation) (Fig. S3), i.e., confirming that a combination of both anthropogenic and natural forcings are responsible for the positive trends. However, repeating the three-signal regression-based D&A analysis using the CESM2 ensembles ALL, GHG and AER ensembles (resulting in scaling factors for GHG, AER, and OTHERS) was unable to provide robust attribution for total or extreme precipitation to any specific single-forcing, including greenhouse gases (Fig. S7). The reason why the CESM2 increases in total or extreme precipitation cannot formally be associated with external forcings, unlike CESM1, may be because the three-signal analysis used for CESM2 has more degrees of freedom than the two-signal analysis for CESM1, making it more uncertain. Nevertheless, repeating the initial attribution analysis based on comparison of basin-averaged trends using the CESM2 ensembles also agreed with the equivalent CESM1 analysis that greenhouse gases are an important driver of the precipitation trends over these basins (cf. Figs. 2 and S2). However, these initial results also suggest that increases in anthropogenic aerosol emissions in CESM2 can oppose/offset the increases in precipitation from increased greenhouse gases over our selected basins, which contradicts our findings based on CESM1 (cf. Figs. 2 and S2).
The differences in the CESM1 and CESM2 results on the effects of anthropogenic aerosols could be due to the differences in either model physics or experimental design. For example, Simpson et al. (2023) showed that the simulated climate response in response to external forcings, particularly for anthropogenic aerosols, was particularly sensitive to the different approaches that are used to produce the single-forcing large ensembles. For example, in CESM1 an “all-but-one” design is used (i.e., everything is time evolving except the external forcing of interest), while in CESM2 an “only” design is used (i.e., only the external forcing of interest is time evolving). Furthermore, Simpson et al. (2023) also highlighted that the climate response for CESM2 was substantially more nonlinear compared to CESM1, meaning that the response to external forcing in CESM2 is more non-additive. The combined and potential non-linear effects of different forcings is likely important for representing precipitation, and especially for extreme precipitation where linear assumptions are least valid (Meehl et al., 2003; Pope et al., 2020) Note also that Deser et al. (2020) showed that increases in anthropogenic aerosol emissions in CESM1 resulted in negative precipitation trends over coastal regions of Antarctica and the Southern Ocean (their Fig. 4), while our CESM1 results showed that this caused positive trends over coastal regions of Antarctica (Fig. 2). However, this disparity is perhaps due to the CESM1 anthropogenic aerosol simulations used by Deser et al. (2020) also containing biomass burning aerosols, which were excluded from our simulations.
We also showed that the trends in total and extreme precipitation over the selected basins can be linked to increasing ARs (Fig. 7). This provides physical support for the analysis, highlighting the consistency between the identification of the trends and the underlying dynamical drivers. This result is also consistent with previous results that suggested that ARs contribute up to 20 % of total precipitation in East Antarctica (Wille et al., 2021, 2025; Maclennan et al., 2022), and as much as 50 % to 70 % of extreme precipitation (Wille et al., 2021, 2025; Simon et al., 2024). Furthermore, most of the basins where precipitation changes are successfully detected are located in the Atlantic sector, where surface ocean warming and a sea-ice loss in the Weddell Sea are reported (Goosse et al., 2024). These oceanic changes likely enhance atmospheric moisture availability and, together with a strengthening of the low-pressure system located off the East Antarctic coast (Goosse et al., 2024), create favorable conditions for increased precipitation over the continent. Moreover, additional anomalous transport from the midlatitudes through Rossby-wave teleconnections could also be a factor (Wille et al., 2025). In addition, future increases in greenhouse gas concentrations are expected to strengthen Antarctic total and extreme precipitation by causing warmer atmospheric conditions (leading to more moisture, via the Clausius-Clapeyron relation; Dalaiden et al., 2020) and a reduction in sea-ice cover (Frieler et al., 2015; Lenaerts et al., 2016; Previdi and Polvani, 2016; Kittel et al., 2021; Vignon et al., 2021; Zhu et al., 2023; Nicola et al., 2023).
It's noteworthy that the effects of increased greenhouse gas emissions are generally considered to be a positive trend in the Southern Annular Mode (SAM) (Kushner et al., 2001; Arblaster and Meehl, 2006), which corresponds to stronger, poleward-shifted westerlies around Antarctica, resulting in reduced temperatures (and precipitation) over East Antarctica (Medley and Thomas, 2019). Based on this, as greenhouse gases are one of the primary drivers of the present-day trends, a decrease in precipitation and extreme precipitation over our five target basins (four of which are in East Antarctica) would be expected, rather than an increase. However, one reason for this contradiction may be a reversal in the relationship between SAM and temperature anomalies across East Antarctica during the twenty-first century, which occurred in response to anomalous high pressure over East Antarctica (Marshall et al., 2013). This anomalous circulation would result in increased northerly airflow into East Antarctica, i.e., consistent with our results showing increased precipitation and intensification of ARs. Additionally, increased anthropogenic aerosol emissions are generally considered to result in a negative trend in the SAM (Gillett et al., 2013; Pope et al., 2020), corresponding to weaker circumpolar westerlies, which would likely result in enhanced precipitation over Antarctica - consistent with the results based on CESM1 only. Also, the Antarctic ozone hole has been the primary driver of summertime atmospheric circulation changes in the Southern hemisphere from around 1980 onwards (Thompson and Solomon, 2002; Polvani et al., 2011; Orr et al., 2021), which Dalaiden et al. (2022) showed was partly responsible for recent increases in precipitation over West Antarctica.
Although detecting the fingerprint of anthropogenic forcing on recent Antarctic precipitation changes remains extremely challenging (Previdi and Polvani, 2016; Dalaiden et al., 2022), our results demonstrate that the effects of greenhouse gases and stratospheric ozone are particularly important for driving the present-day increases in total and extreme precipitation over drainage basins within the Filchner-Ronne sector, Dronning Maud Land, and Enderby Land, while the role of anthropogenic aerosols remains uncertain. Additionally, given the importance of ARs for Antarctica's surface climate, applying the D&A framework to changes in their properties (e.g., intensity, duration, and spatial extent) in future work would represent an important step toward identifying the contribution of external forcing versus internal variability in the AR changes, as well as their associated impacts.
The code used in this study can be obtained from the corresponding author upon reasonable request. Precipitation output from the ERA5 reanalysis dataset is publicly available through the Copernicus Climate Data Store: https://cds.climate.copernicus.eu/datasets/reanalysis-era5-single-levels?tab=overview (last access: 1 September 2026). Precipitation output from the CESM1 ensembles with all external forcings, single-forcings and pre-industrial control simulation are available at: https://gdex.ucar.edu/datasets/d651027/ (last access: 31 August 2026). Precipitation output from the CESM1 ensembles of stratospheric ozone are available at: https://gdex.ucar.edu/datasets/d651053/ (last access: 31 August 2026). Precipitation output from the CESM2 ensembles with all external forcings are available at:https://rda.ucar.edu/datasets/d651056/ (last access: 31 August 2026). Precipitation output from the CESM2 ensembles with single-forcings are available at: https://rda.ucar.edu/datasets/d651055/dataaccess/ (last access: 31 August 2026). Precipitation output from the CESM2 pre-industrial control simulation are available at: https://doi.org/10.22033/ESGF/CMIP6.7733 (Danabasoglu et al., 2019). The AR detection dataset derived from ERA5 is available at:https://doi.org/10.5281/zenodo.15830634 (Wille, 2025).
The supplement related to this article is available online at https://doi.org/10.5194/tc-20-5005-2026-supplement.
SPSC designed the study and, together with PD and AO, conceptualized it. SPSC carried out the primary analysis with support from PD, AO, and QD. SPSC and AO were primarily responsible for writing the manuscript, with additions from PD and QD.
The contact author has declared that none of the authors has any competing interests.
Publisher's note: Copernicus Publications remains neutral with regard to jurisdictional claims made in the text, published maps, institutional affiliations, or any other geographical representation in this paper. The authors bear the ultimate responsibility for providing appropriate place names. Views expressed in the text are those of the authors and do not necessarily reflect the views of the publisher.
The authors would like to thank the two reviewers for providing such thoughtful, thorough, and expert comments, which greatly improved the quality of the study. We would also like to thank Jonathan Wille for his advice on using the AR detection dataset.
SPSC and PD received funding from the Indian Institute of Technology Kharagpur and the Ministry of Education, Government of India. AO received support from the Natural Environment Research Council funded project PICANTE (Processes, Impacts and Changes of ANTarctic Extreme weather; grant no. NE/Z503356/1). QD received support from European Union's EU Horizon 2020 research and innovation programme (Marie Skłodowska-Curie grant no. 101149188).
This paper was edited by Michiel van den Broeke and reviewed by three anonymous referees.
Adusumilli, S., Fish, M. A., Fricker, H. A., and Medley, B.: Atmospheric river precipitation contributed to rapid increases in surface height of the west Antarctic ice sheet in 2019, Geophys. Res. Lett., 48, https://doi.org/10.1029/2020GL091076, 2021.
Allen, M. R. and Stott, P. A.: Estimating signal amplitudes in optimal fingerprinting, Part I: Theory, Clim. Dynam., 21, 477–491, https://doi.org/10.1007/s00382-003-0313-9, 2003.
Arblaster, J. M. and Meehl, G. A.: Contributions of external forcings to southern annular mode trends, J. Climate, 19, 2896–2905, https://doi.org/10.1175/JCLI3774.1, 2006.
Banwell, A. F. and MacAyeal, D. R.: Ice-shelf fracture due to viscoelastic flexure stress induced by fill/drain cycles of supraglacial lakes, Antarct. Sci., 27, 587–597, https://doi.org/10.1017/S0954102015000292, 2015.
Bromwich, D. H., Ensign, A., Wang, S. H., and Zou, X.: Major artifacts in ERA5 2 m air temperature trends over Antarctica prior to and during the modern satellite era, Geophys. Res. Lett., 51, https://doi.org/10.1029/2024GL111907, 2024.
Carter, J., Leeson, A., Orr, A., Kittel, C., and van Wessem, J. M.: Variability in Antarctic surface climatology across regional climate models and reanalysis datasets, The Cryosphere, 16, 3815–3841, https://doi.org/10.5194/tc-16-3815-2022, 2022.
Casado, M., Hébert, R., Faranda, D., and Landais, A.: The quandary of detecting the signature of climate change in Antarctica, Nat. Clim. Change, 13, 1082–1088, https://doi.org/10.1038/s41558-023-01791-5, 2023.
Clem, K. R. and Raphael, M. N.: STATE OF THE CLIMATE IN 2023, https://doi.org/10.1175/BAMS-D-24-0099.1, 2024.
Connolley, W. M.: Variability in annual mean circulation in southern high latitudes, Clim. Dynam., 13, 745–756, https://doi.org/10.1007/s003820050195, 1997.
Dalaiden, Q., Goosse, H., Lenaerts, J. T., Cavitte, M. G., and Henderson, N.: Future Antarctic snow accumulation trend is dominated by atmospheric synoptic-scale events, Commun. Earth Environ., 1, 62, https://doi.org/10.1038/s43247-020-00062-x, 2020.
Dalaiden, Q., Schurer, A. P., Kirchmeier‐Young, M. C., Goosse, H., and Hegerl, G. C.: West Antarctic surface climate changes since the mid‐20th century driven by anthropogenic forcing, Geophys. Res. Lett., 49, https://doi.org/10.1029/2022GL099543, 2022.
Danabasoglu, G., Lawrence, D., Lindsay, K., Lipscomb, W., and Strand, G.: NCAR CESM2 model output prepared for CMIP6 CMIP piControl, Earth System Grid Federation [data set], https://doi.org/10.22033/ESGF/CMIP6.7733, 2019.
Danabasoglu, G., Lamarque, J. F., Bacmeister, J., Bailey, D. A., DuVivier, A. K., Edwards, J., Emmons, L. K., Fasullo, J., Garcia, R., Gettelman, A., Hannay, C., Holland, M. M., Large, W. G., Lauritzen, P. H., Lawrence, D. M., Lenaerts, J. T. M., Lindsay, K., Lipscomb, W. H., Mills, M. J., Neale, R., Oleson, K. W., Otto-Bliesner, B., Phillips, A. S., Sacks, W., Tilmes, S., van Kampenhout, L., Vertenstein, M., Bertini, A., Dennis, J., Deser, C., Fischer, C., Fox-Kemper, B., Kay, J. E., Kinnison, D., Kushner, P. J., Larson, V. E., Long, M. C., Mickelson, S., Moore, J. K., Nienhouse, E., Polvani, L., Rasch, P. J., and Strand, W. G.: The community earth system model version 2 (CESM2), J. Adv. Model. Earth Sy., 12, https://doi.org/10.1029/2019MS001916, 2020.
Davison, B. J., Hogg, A. E., Rigby, R., Veldhuijsen, S., van Wessem, J. M., van den Broeke, M. R., Holland, P. R., Selley, H. L., and Dutrieux, P.: Sea level rise from West Antarctic mass loss significantly modified by large snowfall anomalies, Nat. Commun., 14, 1479, https://doi.org/10.1038/s41467-023-36990-3, 2023.
Deser, C., Phillips, A. S., Simpson, I. R., Rosenbloom, N., Coleman, D., Lehner, F., Pendergrass, A. G., DiNezio, P., and Stevenson, S.: Isolating the evolving contributions of anthropogenic aerosols and greenhouse gases: A new CESM1 large ensemble community resource, J. Climate, 33, 7835–7858, https://doi.org/10.1175/JCLI-D-20-0123.1, 2020.
Donat, M. G., Alexander, L. V., Yang, H., Durre, I., Vose, R., Dunn, R. J. H., Willett, K. M., Aguilar, E., Brunet, M., Caesar, J., Hewitson, B., Jack, C., Klein Tank, A. M. G., Kruger, A. C., Marengo, J., Peterson, T. C., Renom, M., Oria Rojas, C., Rusticucci, M., Salinger, J., Elrayah, A. S., Sekele, S. S., Srivastava, A. K., Trewin, B., Villarroel, C., Vincent, L. A., Zhai, P., Zhang, X., and Kitching, S.: Updated analyses of temperature and precipitation extreme indices since the beginning of the twentieth century: The HadEX2 dataset, J. Geophys. Res.-Atmos., 118, 2098–2118, https://doi.org/10.1002/jgrd.50150, 2013.
Dong, S., Sun, Y., and Li, C.: Detection of human influence on precipitation extremes in Asia, J. Climate, 33, 5293–5304, https://doi.org/10.1175/JCLI-D-19-0371.1, 2020.
Dong, S., Sun, Y., Li, C., Zhang, X., Min, S. K., and Kim, Y. H.: Attribution of extreme precipitation with updated observations and CMIP6 simulations, J. Climate, 34, 871–881, https://doi.org/10.1175/JCLI-D-19-1017.1, 2021.
Dunmire, D., Lenaerts, J. T. M., Datta, R. T., and Gorte, T.: Antarctic surface climate and surface mass balance in the Community Earth System Model version 2 during the satellite era and into the future (1979–2100), The Cryosphere, 16, 4163–4184, https://doi.org/10.5194/tc-16-4163-2022, 2022.
Dunn, R. J. H., Alexander, L. V., Donat, M. G., Zhang, X., Bador, M., Herold, N., Lippmann, T., Allan, R., Aguilar, E., Barry, A. A., Brunet, M., Caesar, J., Chagnaud, G., Cheng, V., Cinco, T., Durre, I., de Guzman, R., Htay, T. M., Ibadullah, W. M. W., Bin Ibrahim, M. K. I., Khoshkam, M., Kruger, A., Kubota, H., Leng, T. W., Lim, G., Li-Sha, L., Marengo, J., Mbatha, S., McGree, S., Menne, M., de los Milagros Skansi, M., Ngwenya, S., Nkrumah, F., Oonariya, C., Pabon-Caicedo, J. D., Panthou, G., Pham, C., Rahimzadeh, F., Ramos, A., Salgado, E., Salinger, J., Sané, Y., Sopaheluwakan, A., Srivastava, A., Sun, Y., Timbal, B., Trachow, N., Trewin, B., van der Schrier, G., Vazquez-Aguirre, J., Vasquez, R., Villarroel, C., Vincent, L., Vischel, T., Vose, R., and Bin Hj Yussof, M. N. A.: Development of an updated global land in situ‐based data set of temperature and precipitation extremes: HadEX3, J. Geophys. Res.-Atmos., 125, https://doi.org/10.1029/2019JD032263, 2020.
England, M. R., Polvani, L. M., Smith, K. L., Landrum, L., and Holland, M. M.: Robust response of the Amundsen Sea Low to stratospheric ozone depletion, Geophys. Res. Lett., 43, 8207–8213, https://doi.org/10.1002/2016GL070055, 2016.
Estrada, F., Perron, P., and Yamamoto, Y.: Anthropogenic influence on extremes and risk hotspots, Sci. Rep., 13, 35, https://doi.org/10.1038/s41598-022-27220-9, 2023.
Favier, V., Krinner, G., Amory, C., Gallée, H., Beaumet, J., and Agosta, C.: Antarctica-regional climate and surface mass budget, Curr. Clim. Change Rep, 3, 303–315, https://doi.org/10.1007/s40641-017-0072-z, 2017.
Frieler, K., Clark, P. U., He, F., Buizert, C., Reese, R., Ligtenberg, S. R. M., van den Broeke, M. R., Winkelmann, R., and Levermann, A.: Consistent evidence of increasing Antarctic accumulation with warming, Nat. Clim. Change, 5, 348–352, https://doi.org/10.1038/nclimate2574, 2015.
Fyke, J., Lenaerts, J. T. M., and Wang, H.: Basin-scale heterogeneity in Antarctic precipitation and its impact on surface mass variability, The Cryosphere, 11, 2595–2609, https://doi.org/10.5194/tc-11-2595-2017, 2017.
Gardner, A. S., Moholdt, G., Scambos, T., Fahnstock, M., Ligtenberg, S., van den Broeke, M., and Nilsson, J.: Increased West Antarctic and unchanged East Antarctic ice discharge over the last 7 years, The Cryosphere, 12, 521–547, https://doi.org/10.5194/tc-12-521-2018, 2018.
Gehring, J., Vignon, É., Billault‐Roux, A. C., Ferrone, A., Protat, A., Alexander, S. P., and Berne, A.: Orographic flow influence on precipitation during an atmospheric river event at Davis, Antarctica, J. Geophys. Res.-Atmos., 127, https://doi.org/10.1029/2021JD035210, 2022.
Gillett, N. P., Fyfe, J. C., and Parker, D. E.: Attribution of observed sea level pressure trends to greenhouse gas, aerosol, and ozone changes, Geophys. Res. Lett., 40, 2302–2306, https://doi.org/10.1002/grl.50500, 2013.
Gillett, N. P., Kirchmeier-Young, M., Ribes, A., Shiogama, H., Hegerl, G. C., Knutti, R., Gastineau, G., John, J. G., Li, L., Nazarenko, L., Rosenbloom, N., Seland, Ø., Wu, T., Yukimoto, S., and Ziehn, T.: Constraining human contributions to observed warming since the pre-industrial period, Nat. Clim. Change, 11, 207–212, https://doi.org/10.1038/s41558-020-00965-9, 2021.
Goosse, H., Dalaiden, Q., Feba, F., Mezzina, B., and Fogt, R. L.: A drop in Antarctic sea ice extent at the end of the 1970s, Commun. Earth Environ., 5, 628, https://doi.org/10.1038/s43247-024-01793-x, 2024.
Gorodetskaya, I. V., Tsukernik, M., Claes, K., Ralph, M. F., Neff, W. D., and Van Lipzig, N. P.: The role of atmospheric rivers in anomalous snow accumulation in East Antarctica, Geophys. Res. Lett., 41, 6199–6206, https://doi.org/10.1002/2014GL060881, 2014.
Gu, C., Luo, Y., Liu, F., Lu, J., and Chen, Z.: Increased Asian aerosols contribute to historical climate change in Antarctica, Geophys. Res. Lett., 52, https://doi.org/10.1029/2025GL114888, 2025.
Hersbach, H., Bell, B., Berrisford, P., Hirahara, S., Horányi, A., Muñoz-Sabater, J., Nicolas, J., Peubey, C., Radu, R., Schepers, D., Simmons, A., Soci, C., Abdalla, S., Abellan, X., Balsamo, G., Bechtold, P., Biavati, G., Bidlot, J., Bonavita, M., De Chiara, G., Dahlgren, P., Dee, D., Diamantakis, M., Dragani, R., Flemming, J., Forbes, R., Fuentes, M., Geer, A., Haimberger, L., Healy, S., Hogan, R. J., Hólm, E., Janisková, M., Keeley, S., Laloyaux, P., Lopez, P., Lupu, C., Radnoti, G., de Rosnay, P., Rozum, I., Vamborg, F., Villaume, S., and Thépaut, J.-N.: The ERA5 global reanalysis, Q. J. Roy. Meteor. Soc., 146, 1999–2049, https://doi.org/10.1002/qj.3803, 2020.
Hobbs, W. R., Roach, C., Roy, T., Sallée, J. B., and Bindoff, N.: Anthropogenic temperature and salinity changes in the Southern Ocean, J. Climate, 34, 215–228, https://doi.org/10.1175/JCLI-D-20-0454.1, 2021.
Hosking, J. S., Orr, A., Marshall, G. J., Turner, J., and Phillips, T.: The influence of the Amundsen–Bellingshausen Seas low on the climate of West Antarctica and its representation in coupled climate model simulations, J. Climate, 26, 6633–6648, https://doi.org/10.1175/JCLI-D-12-00813.1, 2013.
IPCC: Climate Change 2023: Synthesis Report, Contribution of Working Groups I, II and III to the Sixth Assessment Report of the Intergovernmental Panel on Climate Change, Core Writing Team, edited by: Lee, H. and Romero, J., IPCC, Geneva, Switzerland, 184 pp., https://doi.org/10.59327/IPCC/AR6-9789291691647, 2023.
Johnson, A., Hock, R., and Fahnestock, M.: Spatial variability and regional trends of Antarctic Ice Shelf surface melt duration over 1979–2020 derived from passive microwave data, J. Glaciol., 68, 533–546, https://doi.org/10.1017/jog.2021.112, 2022.
Jones, J. M., Gille, S. T., Goosse, H., Abram, N. J., Canziani, P. O., Charman, D. J., Clem, K. R., Crosta, X., de Lavergne, C., Eisenman, I., England, M. H., Fogt, R. L., Frankcombe, L. M., Marshall, G. J., Masson-Delmotte, V., Morrison, A. K., Orsi, A. J., Raphael, M. N., Renwick, J. A., Schneider, D. P., Simpkins, G. R., Steig, E. J., Stenni, B., Swingedouw, D., and Vance, T. R.: Assessing recent trends in high-latitude Southern Hemisphere surface climate, Nat. Clim. Change, 6, 917–926, https://doi.org/10.1038/nclimate3103, 2016.
Kay, J. E., Deser, C., Phillips, A., Mai, A., Hannay, C., Strand, G., Arblaster, J. M., Bates, S. C., Danabasoglu, G., Edwards, J., Holland, M., Kushner, P., Lamarque, J.-F., Lawrence, D., Lindsay, K., Middleton, A., Munoz, E., Neale, R., Oleson, K., Polvani, L., and Vertenstein, M.: The community Earth system model (CESM) large ensemble project: A community resource for studying climate change in the presence of internal climate variability, B. Am. Meteorol. Soc., 96, 1333–1349, https://doi.org/10.1175/BAMS-D-13-00255.1, 2015.
Kirchmeier-Young, M. C., Zwiers, F. W., and Gillett, N. P.: Attribution of extreme events in Arctic sea ice extent, J. Climate, 30, 553–571, https://doi.org/10.1175/JCLI-D-16-0412.1, 2017.
Kirchmeier-Young, M. C. and Zhang, X.: Human influence has intensified extreme precipitation in North America, P. Natl. Acad. Sci. USA, 117, 13308–13313, https://doi.org/10.1073/pnas.1921628117, 2020.
Kittel, C., Amory, C., Agosta, C., Jourdain, N. C., Hofer, S., Delhasse, A., Doutreloup, S., Huot, P.-V., Lang, C., Fichefet, T., and Fettweis, X.: Diverging future surface mass balance between the Antarctic ice shelves and grounded ice sheet, The Cryosphere, 15, 1215–1236, https://doi.org/10.5194/tc-15-1215-2021, 2021.
Kromer, J. D. and Trusel, L. D.: Identifying the impacts of sea ice variability on the climate and surface mass balance of West Antarctica, Geophys. Res. Lett., 50, https://doi.org/10.1029/2023GL104436, 2023.
Kushner, P. J., Held, I. M., and Delworth, T. L.: Southern Hemisphere atmospheric circulation response to global warming, J. Climate, 14, 2238–2249, https://doi.org/10.1175/1520-0442(2001)014<0001:SHACRT>2.0.CO;2, 2001.
Lai, C.-Y, Kingslake, J., Wearing, M. G., Cameron Chen, P.-H., Gentine, P., Li, H., Spergel, J. J., and van Wessem, J. M.: Vulnerability of Antarctica's ice shelves to meltwater-driven fracture, Nature, 584, 574–578, https://doi.org/10.1038/s41586-020-2627-8, 2020.
Landrum, L. L., Holland, M. M., Raphael, M. N., and Polvani, L. M.: Stratospheric ozone depletion: An unlikely driver of the regional trends in Antarctic Sea ice in Austral fall in the late twentieth century, Geophys. Res. Lett., 44, 11062–11070, https://doi.org/10.1002/2017GL075618, 2017.
Lenaerts, J. T. M., Vizcaino, M., Fyke, J., van Kampenhout, L., and van den Broeke, M. R.: Present-day and future Antarctic ice sheet climate and surface mass balance in the Community Earth System Model, Clim. Dynam., 47, 1367–1381, https://doi.org/10.1007/s00382-015-2907-4, 2016.
Li, S., Chen, Y., Wei, W., Fang, G., and Duan, W.: The increase in extreme precipitation and its proportion over global land, J. Hydrol., 628, 130456, https://doi.org/10.1016/j.jhydrol.2023.130456, 2024.
Maclennan, M. L., Lenaerts, J. T., Shields, C., and Wille, J. D.: Contribution of atmospheric rivers to Antarctic precipitation, Geophys. Res. Lett., 49, https://doi.org/10.1029/2022GL100585, 2022.
Maclennan, M. L., Lenaerts, J. T. M., Shields, C. A., Hoffman, A. O., Wever, N., Thompson-Munson, M., Winters, A. C., Pettit, E. C., Scambos, T. A., and Wille, J. D.: Climatology and surface impacts of atmospheric rivers on West Antarctica, The Cryosphere, 17, 865–881, https://doi.org/10.5194/tc-17-865-2023, 2023.
Marshall, G. J., Orr, A., and Turner, J.: A predominant reversal in the relationship between the SAM and East Antarctic temperatures during the twenty-first century, J. Climate, 26, 5196–5204, https://doi.org/10.1175/JCLI-D-12-00671.1, 2013.
Medley, B. and Thomas, E. R.: Increased snowfall over the Antarctic Ice Sheet mitigated twentieth-century sea-level rise, Nat. Clim. Change, 9, 34–39, https://doi.org/10.1038/s41558-018-0356-x, 2019.
Meehl, G. A., Washington, W. M., Wigley, T. M. L., Arblaster, J. M., and Dai, A.: Solar and greenhouse gas forcing and climate response in the twentieth century, J. Climate, 16, 426–444, https://doi.org/10.1175/1520-0442(2003)016<0426:SAGGFA>2.0.CO;2, 2003.
Min, S. K., Zhang, X., Zwiers, F. W., and Hegerl, G. C.: Human contribution to more-intense precipitation extremes, Nature, 470, 378–381, https://www.nature.com/articles/nature09763 (last access: 1 September 2026), 2011.
Morioka, Y., Zhang, L., Cooke, W., Nonaka, M., Behera, S. K., and Manabe, S.: Role of anthropogenic forcing in Antarctic sea ice variability simulated in climate models, Nat. Commun., 15, 10511, doi10.1038/s41467-024-54485-7, 2024.
Mottram, R., Hansen, N., Kittel, C., van Wessem, J. M., Agosta, C., Amory, C., Boberg, F., van de Berg, W. J., Fettweis, X., Gossart, A., van Lipzig, N. P. M., van Meijgaard, E., Orr, A., Phillips, T., Webster, S., Simonsen, S. B., and Souverijns, N.: What is the surface mass balance of Antarctica? An intercomparison of regional climate model estimates, The Cryosphere, 15, 3751–3784, https://doi.org/10.5194/tc-15-3751-2021, 2021.
Munneke, P. K., Ligtenberg, S. R., Van Den Broeke, M. R., and Vaughan, D. G.: Firn air depletion as a precursor of Antarctic ice-shelf collapse, J. Glaciol., 60, 205–214, https://doi.org/10.3189/2014JoG13J183, 2014.
Nakayama, Y., Greene, C. A., Paolo, F. S., Mensah, V., Zhang, H., Kashiwase, H., Simizu, D., Greenbaum, J. S., Blankenship, D. D., Abe-Ouchi, A., and Aoki, S.: Antarctic slope current modulates ocean heat intrusions towards Totten Glacier, Geophys. Res. Lett., 48, https://doi.org/10.1029/2021GL094149, 2021.
Nicola, L., Notz, D., and Winkelmann, R.: Revisiting temperature sensitivity: how does Antarctic precipitation change with temperature?, The Cryosphere, 17, 2563–2583, https://doi.org/10.5194/tc-17-2563-2023, 2023.
Orr, A., Lu, H., Martineau, P., Gerber, E. P., Marshall, G. J., and Bracegirdle, T. J.: Is our dynamical understanding of the circulation changes associated with the Antarctic ozone hole sensitive to the choice of reanalysis dataset?, Atmos. Chem. Phys., 21, 7451–7472, https://doi.org/10.5194/acp-21-7451-2021, 2021.
Orr, A., Deb, P., Clem, K. R., Gilbert, E., Bromwich, D. H., Boberg, F., Colwell, S., Hansen, N., Lazzara, M. A., Mooney, P. A., Mottram, R., Niwano, M., Phillips, T., Pishniak, D., Reijmer, C. H., van de Berg, W. J., Webster, S., and Zou, X.: Characteristics of surface “melt potential” over Antarctic ice shelves based on regional atmospheric model simulations of summer air temperature extremes from 1979/80 to 2018/19, J. Climate, 36, 3357–3383, https://doi.org/10.1175/JCLI-D-22-0386.1, 2023.
Otosaka, I. N., Horwath, M., Mottram, R., and Nowicki, S.: Mass balances of the Antarctic and Greenland ice sheets monitored from space, Surv. Geophys., 44, 1615–1652, https://doi.org/10.1007/s10712-023-09795-8, 2023.
Paik, S., Min, S. K., Zhang, X., Donat, M. G., King, A. D., and Sun, Q.: Determining the anthropogenic greenhouse gas contribution to the observed intensification of extreme precipitation, Geophys. Res. Lett., 47, https://doi.org/10.1029/2019GL086875, 2020.
Paolo, F. S., Fricker, H. A., and Padman, L.: Volume loss from Antarctic ice shelves is accelerating, Science, 348, 327–331, https://doi.org/10.1126/science.aaa0940, 2015.
Paolo, F., Padman, L., Fricker, H., Adusumilli, S., Howard, S., and Siegfried, M.: Response of Pacific-sector Antarctic ice shelves to the el Niño/southern oscillation, Nat. Geosci., 11, 121–126, https://doi.org/10.1038/s41561-017-0033-0, 2018.
Pattyn, F.: Sea-level response to melting of Antarctic ice shelves on multi-centennial timescales with the fast Elementary Thermomechanical Ice Sheet model (f.ETISh v1.0), The Cryosphere, 11, 1851–1878, https://doi.org/10.5194/tc-11-1851-2017, 2017.
Polvani, L. M., Waugh, D. W., Correa, G. J. P., and Son, S.-W.: Stratospheric ozone depletion: The main driver of twentieth-century atmospheric circulation changes in the Southern Hemisphere, J. Climate, 24, 795–812, https://doi.org/10.1175/2010JCLI3772.1, 2011.
Pope, J. O., Orr, A., Marshall, G. J., and Abraham, N. L.: Non‐additive response of the high‐latitude Southern Hemisphere climate to aerosol forcing in a climate model with interactive chemistry, Atmos. Sci. Lett., 21, https://doi.org/10.1002/asl.1004, 2020.
Previdi, M. and Polvani, L. M.: Anthropogenic impact on Antarctic surface mass balance, currently masked by natural variability, to emerge by mid-century, Environ. Res. Lett., 11, https://doi.org/10.1088/1748-9326/11/9/094001, 2016.
Pritchard, H. D., Ligtenberg, S. R. M., Fricker, H. A., Vaughan, D. G., van den Broeke, M. R., and Padman, L.: Antarctic ice-sheet loss driven by basal melting of ice shelves, Nature, 484, 502–505, https://doi.org/10.1038/nature10968, 2012.
Pritchard, H. D.: Global data gaps in our knowledge of the terrestrial cryosphere, Front. Clim, 3, https://doi.org/10.3389/fclim.2021.689823, 2021.
Ribes, A., Planton, S., and Terray, L.: Application of regularised optimal fingerprinting to attribution. Part I: Method, properties and idealised analysis, Clim. Dynam., 41, 2817–2835, https://doi.org/10.1007/s00382-013-1735-7, 2013.
Rignot, E., Mouginot, J., Scheuchl, B., van den Broeke, M., van Wessem, M. J., and Morlighem, M.: Four decades of Antarctic ice sheet mass balance from 1979–2017, P. Natl. Acad. Sci. USA, 116, 1095–1103, https://doi.org/10.1073/pnas.1812883116, 2019.
Rott, H., Skvarca, P., and Nagler, T.: Rapid collapse of northern Larsen Ice Shelf, Antarctica, Science, 271, 788–792, https://doi.org/10.1126/science.271.5250.788, 1996.
Scambos, T. A., Hulbe, C., Fahnestock, M., and Bohlander, J.: The link between climate warming and break-up of ice shelves in the Antarctic Peninsula. J. Glaciol., 46, 516–530, https://doi.org/10.3189/172756500781833043, 2000.
Seneviratne, S. I., Zhang, X., Adnan, M., Badi, W., Dereczynski, C., Di Luca, A., Ghosh, S., Iskandar, I., Kossin, J., Lewis, S., Otto, F., Pinto, I., Satoh, M., Vicente-Serrano, S. M., Wehner, M., and Zhou, B.: Weather and Climate Extreme Events in a Changing Climate, in: Climate Change 2021: The Physical Science Basis, Contribution of Working Group I to the Sixth Assessment Report of the Intergovernmental Panel on Climate Change, edited by: Masson-Delmotte, V., Zhai, P., Pirani, A., Connors, S. L., Péan, C., Berger, S., Caud, N., Chen, Y., Goldfarb, L., Gomis, M. I., Huang, M., Leitzell, K., Lonnoy, E., Matthews, J. B. R., Maycock, T. K., Waterfield, T., Yelekçi, O., Yu, R., and Zhou, B., Cambridge University Press, Cambridge, United Kingdom and New York, NY, USA, 1513–1766, https://doi.org/10.1017/9781009157896.013, 2021.
Simon, S., Turner, J., Thamban, M., Wille, J. D., and Deb, P.: Spatiotemporal variability of extreme precipitation events and associated atmospheric processes over Dronning Maud Land, East Antarctica, J. Geophys. Res.-Atmos., 129, https://doi.org/10.1029/2023JD038993, 2024.
Simpson, I. R., Rosenbloom, N., Danabasoglu, G., Deser, C., Yeager, S. G., McCluskey, C. S., Yamaguchi, R., Lamarque, J.-F., Tilmes, S., Mills, M. J., and Rodgers, K. B.: The CESM2 single-forcing large ensemble and comparison to CESM1: Implications for experimental design, J. Climate, 36, 5687–5711, https://doi.org/10.1175/JCLI-D-22-0666.1, 2023.
Stenni, B., Curran, M. A. J., Abram, N. J., Orsi, A., Goursaud, S., Masson-Delmotte, V., Neukom, R., Goosse, H., Divine, D., van Ommen, T., Steig, E. J., Dixon, D. A., Thomas, E. R., Bertler, N. A. N., Isaksson, E., Ekaykin, A., Werner, M., and Frezzotti, M.: Antarctic climate variability on regional and continental scales over the last 2000 years, Clim. Past, 13, 1609–1634, https://doi.org/10.5194/cp-13-1609-2017, 2017.
Sun, Q., Zhang, X., Zwiers, F., Westra, S., and Alexander, L. V.: A global, continental, and regional analysis of changes in extreme precipitation, J. Climate, 34, 243–258, https://doi.org/10.1175/JCLI-D-19-0892.1, 2021.
Swart, N. C., Gille, S. T., Fyfe, J. C., and Gillett, N. P.: Recent Southern Ocean warming and freshening driven by greenhouse gas emissions and ozone depletion, Nat. Geosci., 11, 836–841, https://doi.org/10.1038/s41561-018-0226-1, 2018.
Swetha Chittella, S. P., Deb, P., and Melchior van Wessem, J.: Relative contribution of atmospheric drivers to “extreme” snowfall over the Amundsen Sea Embayment, Geophys. Res. Lett., 49, https://doi.org/10.1029/2022GL098661, 2022.
Tewari, K., Mishra, S. K., Salunke, P., and Dewan, A.: Future projections of temperature and precipitation for Antarctica, Environ. Res. Lett., 17, 014029, https://doi.org/10.1088/1748-9326/ac43e2, 2022.
Thompson, D. W. and Solomon, S.: Interpretation of recent Southern Hemisphere climate change, Science, 296, 895–899, https://doi.org/10.1126/science.1069270, 2002.
Trusel, L. D., Frey, K. E., Das, S. B., Karnauskas, K. B., Kuipers Munneke, P., Van Meijgaard, E., and Van Den Broeke, M. R.: Divergent trajectories of Antarctic surface melt under two twenty-first-century climate scenarios, Nat. Geosci., 8, 927–932, https://doi.org/10.1038/ngeo2563, 2015.
Turner, J., Phillips, T., Thamban, M., Rahaman, W., Marshall, G. J., Wille, J. D., Favier, V., Winton, V. H. L., Thomas, E., Wang, Z., van den Broeke, M., Hosking, J. S., and Lachlan-Cope, T.: The dominant role of extreme precipitation events in Antarctic snowfall variability, Geophys. Res. Lett., 46, 3502–3511, https://doi.org/10.1029/2018gl081517, 2019.
van Wessem, J. M., van den Broeke, M. R., Wouters, B., and Lhermitte, S.: Variable temperature thresholds of melt pond formation on Antarctic ice shelves, Nat. Clim. Change, 13, 161–166, https://doi.org/10.1038/s41558-022-01577-1, 2023.
Vignon, É., Roussel, M. L., Gorodetskaya, I. V., Genthon, C., and Berne, A.: Present and future of rainfall in Antarctica, Geophys. Res. Lett., 48, https://doi.org/10.1029/2020GL092281, 2021.
Wang, S., Alexander, P. M., Alley, R. B., Huang, Z., Parizek, B. R., Willet, A. G., and Anandakrishnan, S.: Recent variability in fracture characteristics and ice flow of Thwaites Ice Shelf, West Antarctica, J. Geophys. Res.-Earth, 130, https://doi.org/10.1029/2024JF008118, 2025.
Wille, J.: Polar specific atmospheric river detection algorithm catalogs, Zenodo [data set], https://doi.org/10.5281/zenodo.15830634, 2025
Wille, J. D., Favier, V., Gorodetskaya, I. V., Agosta, C., Kittel, C., Beeman, J. C., Jourdain, N. C., Lenaerts, J. T. M., and Codron, F.: Antarctic atmospheric river climatology and precipitation impacts, J. Geophys. Res.-Atmos., 126, https://doi.org/10.1029/2020JD033788, 2021.
Wille, J. D., Favier, V., Jourdain, N. C., Kittel, C., Turton, J. V., Agosta, C., Gorodetskaya, I. V., Picard, G., Codron, F., Leroy-Dos Santos, C., Amory, C., Fettweis, X., Blanchet, J., Jomelli, V., and Berchet, A.: Intense atmospheric rivers can weaken ice shelf stability at the Antarctic Peninsula, Commun. Earth Environ., 3, 90, https://doi.org/10.1038/s43247-022-00422-9, 2022.
Wille, J. D., Alexander, S. P., Amory, C., Baiman, R., Barthélemy, L., Bergstrom, D. M., Berne, A., Binder, H., Blanchet, J., Bozkurt, D., Bracegirdle, T. J., Casado, M., Choi, T., Clem, K. R., Codron, F., Datta, R., Di Battista, S., Favier, V., Francis, D., Fraser, A. D., Fourré, E., Garreaud, R. D., Genthon, C., Gorodetskaya, I. V., González-Herrero, S., Heinrich, V. J., Hubert, G., Joos, H., Kim, S.-J., King, J. C., Kittel, C., Landais, A., Lazzara, M., Leonard, G. H., Lieser, J. L., Maclennan, M., Mikolajczyk, D., Neff, P., Ollivier, I., Picard, G., Pohl, B., Ralph, F. M., Rowe, P., Schlosser, E., Shields, C. A., Smith, I. J., Sprenger, M., Trusel, L., Udy, D., Vance, T., Vignon, É., Walker, C., Wever, N., and Zou, X.: The extraordinary March 2022 East Antarctica “heat” wave, Part II: Impacts on the Antarctic ice sheet, J. Climate, 37, 779–799, https://doi.org/10.1175/JCLI-D-23-0176.1, 2024.
Wille, J. D., Favier, V., Gorodetskaya, I. V., Agosta, C., Baiman, R., Barrett, J. E., Barthélemy, L., Boza, B., Bozkurt, D., Casado, M., Chyhareva, A., Clem, K. R., Codron, F., Datta, R. T., Durán-Alarcón, C., Francis, D., Hoffman, A. O., Kolbe, M., Krakovska, S., Linscott, G., Maclennan, M. L., Mattingly, K. S., Mu, Y., Pohl, B., Leroy-Dos Santos, C., Shields, C. A., Toker, E., Winters, A. C., Yin, Z., Zou, X., Zhang, C., and Zhang, Z.: Atmospheric rivers in Antarctica, Nat. Rev. Earth Environ., 6, 178–192, https://doi.org/10.1038/s43017-024-00638-7, 2025.
Yu, L., Yang, Q., Vihma, T., Jagovkina, S., Liu, J., Sun, Q., and Li, Y.: Features of extreme precipitation at Progress Station, Antarctica, J. Climate, 31, 9087–9105, https://doi.org/10.1175/JCLI-D-18-0128.1, 2018.
Yu, L., Zhong, S., Jagovkina, S., Sui, C., and Sun, B.: Interannual Variability and Trends in Extreme Precipitation in Dronning Maud Land, East Antarctica, Remote Sens., 17, 324, https://doi.org/10.3390/rs17020324, 2025.
Zhang, X., Wan, H., Zwiers, F. W., Hegerl, G. C., and Min, S. K.: Attributing intensification of precipitation extremes to human influence, Geophys. Res. Lett., 40, 5252–5257, https://doi.org/10.1002/grl.51010, 2013.
Zhu, Z., Liu, J., Song, M., and Hu, Y.: Changes in extreme temperature and precipitation over the southern extratropical continents in response to Antarctic Sea ice loss, J. Climate, 36, 4755–4775, https://doi.org/10.1175/JCLI-D-22-0577.1, 2023.
Zwally, H. J., Robbins, J. W., and Luthcke, S. B.: Mass balance of east Antarctic ice sheet: Reconciling icesat altimetry with grace gravimetry and long-term ice history, in: Agu fall meeting abstracts, Vol. 2017, C23D–08, https://doi.org/10.1017/jog.2021.8, 2017.