
the Creative Commons Attribution 4.0 License.
the Creative Commons Attribution 4.0 License.
 | 26 Aug 2026
On the non-linear response of Antarctic ice shelf surface melt to warming

Willem Jan van de Berg
Christiaan van Dalum
Kristiina Verro
Maurice van Tiggelen
Michiel van den Broeke
Surface meltwater can saturate firn, form melt ponds, and trigger hydrofracturing of Antarctic ice shelves, ultimately accelerating grounded ice flow and contributing to sea level rise. Although the response of surface melt to atmospheric warming (expressed by near-surface air temperature) is known to be non-linear, the mechanisms driving this non-linearity remain poorly understood. In this study we explain the non-linear temperature-melt relationship from an energy balance perspective and assess its spatial variability across Antarctic ice shelves. We use the regional climate model RACMO2.4p1, forced by ERA5 re-analysis and two global earth system models under the SSP3-7.0 high emission scenario, to simulate contemporary and future Antarctic climate and surface mass balance until 2100. We find that the temperature dependence of net shortwave radiation is the primary driver of the non-linearity on ice shelves in relatively dry climates. Warming increases cloud cover and snowfall, which both raise albedo, reducing net shortwave radiation. When summer air temperatures approach −12 °C, the snowmelt-albedo feedback dominates the response: warming leads to melt that reduces albedo, enhancing shortwave radiation absorption. The temperature–melt relationship also varies spatially: ice shelves in drier regions experience more melt at the same average summer temperatures than those in wetter regions, highlighting the role of snowfall in suppressing the albedo feedback. In wetter regions, elevated humidity and cloudiness enhance the sensitivity of melt to warming through changes in net longwave radiation, rather than albedo changes. When mean summer air temperatures reach or exceed the melting point (0 °C), ice shelves become even more sensitive to warming. Surface temperatures can not rise above 0 °C while the atmosphere can, allowing the sensible heat and net longwave radiation to increase. At the same time, snowfall transitions to rain, amplifying the albedo feedback. Our results suggest that currently colder, drier and stable ice shelves could experience rapid increases in melt under future warming, with implications for their long-term stability.
- Article
(12796 KB) - Full-text XML
- BibTeX
- EndNote


Surface melt plays a critical role in the stability of Antarctic ice shelves, which act as barriers slowing the flow of inland ice into the ocean (Fürst et al., 2016). Episodes of intense or prolonged surface melting can lead to the formation of melt ponds on the surface (Kingslake et al., 2017), which may trigger hydrofracture and rapid ice shelf collapse (Kuipers Munneke et al., 2014; Lai et al., 2020). Such collapses reduce ice shelf buttressing, accelerate flow and mass loss of grounded ice and result in sea level rise (Bell et al., 2018). Whether melt ponds might form on the ice shelves depends on the balance between snow accumulation and snow melt: regions with low snowfall accumulation have limited capacity to store meltwater before saturation and ponding occurs (van Wessem et al., 2023; Kuipers Munneke et al., 2014). Surface melt and runoff from Antarctic ice shelves are projected to increase with warming (Gilbert and Kittel, 2021; Kittel et al., 2021; Ligtenberg et al., 2013). However, the response of melt to warming is highly non-linear (Abram et al., 2013), resulting in a large spread of predicted melt rates at the end of the 21st century between different future scenarios (Trusel et al., 2015; Seroussi et al., 2020). The processes that drive this non-linearity are not yet fully understood.
Current surface melt rates over Antarctic ice shelves can be estimated from satellite products (Di Biase et al., 2026; Zheng et al., 2025) and regional climate models. Polar-adapted regional climate models (RCMs), such as the polar (p) version of the Regional Atmospheric Climate Model (RACMO), are currently among the most effective tools for quantifying current and predicting future Antarctic surface melt. These models include snowpack physics and surface energy balance (SEB) schemes to simulate key surface processes driving melt, and are typically run at much higher spatial resolutions (1–20 km) than global Earth system models (∼100 km). However, due to the computational costs, RCMs are not typically used to estimate melt in large ensembles of future climate scenarios, such as those from CMIP, or coupled to ice sheet models to link the surface processes and ice dynamics. Instead, studies propose simplified empirical relationships or melt potential indices based solely on near-surface air temperature (Orr et al., 2023; Trusel et al., 2015; Vaughan, 2006; Zheng et al., 2023). These approaches rely on the fact that many SEB components are themselves dependent on temperature, such as incoming longwave radiation and sensible heat flux (Ambach, 1988; Braithwaite and Olesen, 1990; Ohmura, 2001). While widely used (Coulon et al., 2024; DeConto et al., 2021; Golledge et al., 2019), empirical relationships between temperature and melt such as positive degree day (PDD) models or temperature-melt index models, are often applied uniformly across space. This is despite the known spatial variability in melt sensitivity to temperature, which arises from differences in local surface conditions, cloudiness, and SEB regimes across Antarctic ice shelves (van den Broeke et al., 2023; Zheng et al., 2023).
The relationship between summer near-surface air temperature and surface melt on Antarctic ice shelves has an exponential shape (Trusel et al., 2015; van Wessem et al., 2023). This means that for ice shelves already experiencing melt, even a small temperature increase can lead to a disproportionately large increase in melt, potentially reaching levels of melt at which ice shelves have collapsed in the past (Scambos et al., 2000; Trusel et al., 2015; van den Broeke, 2005). One of the possible explanations for this non-linearity is the snowmelt-albedo feedback (Jakobs et al., 2019, 2021) in which melt and subsequent refreezing lowers the albedo of snow, increasing absorption of solar radiation and melt. The potential of this feedback to enhance surface melt is modulated by the frequency and timing of snowfall events in summer. But as noted by Jakobs et al. (2019), under warmer conditions such as those currently observed on the Antarctic Peninsula, the snowmelt-albedo feedback becomes less important in enhancing melt, and other processes such as exposure of bare ice or turbulent fluxes also play a role. Other surface energy balance terms such as longwave radiation and the latent heat flux may also respond non-linearly to air temperature through changes in atmospheric moisture and cloud conditions that are associated with the atmospheric warming.
In this study we use output from RACMO to investigate the physical processes driving the non-linearity of the relationship between summer air temperature and surface melt across Antarctic ice shelves. We analyse both historical and future simulations to (1) assess the spatial variability in the temperature-melt relationship and (2) identify the dominant SEB components contributing to the non-linearity. Our findings will provide new insights into the physical controls on melt sensitivity and provide guidance on when and where temperature-based approaches to estimate surface melt are appropriate, and where they lack reliability due to more complex local SEB conditions.
2.1 The regional climate model RACMO
The Regional Atmospheric Climate Model (RACMO) is a hydrostatic regional climate model developed at the Royal Netherlands Meteorological Institute (KNMI). It incorporates atmospheric dynamics from HIRLAM (Undén et al., 2002), which uses a semi-Lagrangian approach with semi-implicit time stepping, and physical parameterizations from the ECMWF Integrated Forecasting System (IFS) (ECMWF, 2020). We use the polar version of RACMO which is developed and maintained at the Institute for Marine and Atmospheric Research Utrecht (IMAU). This version is specifically adapted for simulating the climate and surface processes of the polar regions and includes a multi-layer snow/firn model applied to glaciated surface tiles. The snow model simulates key processes to represent the surface energy and mass balance of snow, such as metamorphism, compaction, melt and refreezing of snow. In this study, we used the latest RACMO version 2.4p1 (van Dalum et al., 2024), in this paper referred to as RACMO. The main differences between RACMO2.4p1 and the previous operational version, RACMO2.3p2, are:
-
Update of IFS physics parameterizations from ECMWF cycle 33r1 to 47r1 (ECMWF, 2020), which includes improvements of cloud and precipitation physics such as a better representation of mixed phase clouds, separate prognostics variables for cloud water/ice, rain and snow that allows for advection of precipitation, the radiation scheme is replaced by ecRad, aerosols prescription with Copernicus Atmospheric Monitoring Service (CAMS), and improved cloud optical properties from the Suite Of Community RAdiative Transfer codes based on Edwards and Slingo (SOCRATES). Additional processes that are included in the change to IFS cycle 47r1 are described in van Dalum et al. (2024);
-
Fractional ice cover, based on the BedMachine Antarctica version 3 ice mask (Morlighem et al., 2020), where grid cells can be partially glaciated and therefore provide a better representation of areas such as the McMurdo Dry Valleys;
-
A narrowband snow albedo model, which was introduced in the non-operational RACMO version 2.3p3 (van Dalum et al., 2022). This new albedo model explicitly resolves radiation penetration and subsurface heating in snow and ice. Because the albedo calculation is wavelength-dependent, it captures the spectral effect of clouds on albedo. Cloud cover scatters much of the near-infrared radiation, which has a low albedo, leaving mostly visible light, for which the spectral albedo is higher (van Dalum et al., 2020).;
-
An updated snowdrift model (Gadde and van de Berg, 2024)
2.2 Surface energy balance
Within the updated snow model, shortwave radiation can penetrate the snowpack and be absorbed in the subsurface. The total net absorbed shortwave radiation (SWnet) is thus split up in surface absorption (SWnet,surf) and internal absorption (SWpen). Internal shortwave absorption leads to warming of the snowpack and internal melt when the snow reaches the melting point. As a result, melt can occur both at the surface and in the snowpack. The SEB of the skin layer is defined as:
where QM,surf is the energy available for surface melt, LWnet is net longwave radiation, SH and LH represent the turbulent fluxes of sensible and latent heat and QG is the subsurface conductive heat flux. All fluxes are defined as positive towards the surface and are in units of W m−2.
Since we are interested in understanding the relationship between temperature and total melt; i.e. occurring both at the surface as well as in the subsurface, we use a pseudo-SEB for the analysis which is not strictly valid for a skin layer as in Eq. (1), but for the near-surface. This definition is comparable to previous SEB formulations, in which penetration of solar radiation was not included, and is as follows:
Where QM is the energy available for melt (surface + internal melt) and QG,rec is a reconstructed conductive heat flux defined as , with Qm,internal energy available for internal melt. This formulation assumes that, on seasonal timescales, the effects of short-term heat storage and energy redistribution in the near-surface are negligible, such that total SWnet (surface + penetrated) can be used as the radiative driver of total melt. In Appendix A we show that this pseudo-SEB produces comparable SEB terms to the classical formulation without shortwave penetration, supporting its use for the analysis in this study.
The resulting melt rate (kg m−2) is then obtained by converting the available melt energy into a meltwater mass flux using the latent heat of fusion, such that the energy remaining after warming the snow to the melting point produces melt. Melt contributes to mass loss when the resulting meltwater is not refrozen or retained in the snow and instead leads to runoff (RU). The surface mass balance (SMB) describes the balance between accumulation and ablation in the near-surface firn or ice:
with Ptot total precipitation, SUs is surface sublimation and SUds sublimation of blowing snow, RU runoff and ER drifting snow erosion which can be both ablative (erosion, ER >0) and accumulative (deposition, ER <0).
2.3 Historical and future forcing
We use RACMO2.4p1 with a domain covering Antarctica and the southern tip of South America with a horizontal resolution of 11 km, forced with both ERA5 reanalysis and Earth-System-Model (ESM) datasets. Using ERA5 provides present-day conditions, while the ESM-forced simulations extend the analysis into future climates, allowing the temperature–melt relationship to be examined across a wider range of melt intensities and summer temperatures than occur today. The simulations for this domain were performed as part of the PolarRES project, an EU Horizon 2020 funded project that uses RCMs to simulate the current and future climate of the polar regions (Gilbert et al., 2026). Projections spanning 2015 to 2099 were forced using boundary conditions from two CMIP6 ESMs: the Community Earth System Model 2 (CESM2) and the Max-Planck Institute Earth System model (MPI-ESM), under the high emission SSP3-7.0 scenario. SSP3-7.0 was chosen within the PolarRES framework because it is considered a more plausible high-emission pathway than SSP5-8.5. CESM2 and MPI-ESM were then selected from the CMIP6 ESMs using a storyline approach to represent two contrasting but plausible Antarctic climate futures: CESM2 reflects a future with extensive sea ice loss and an earlier summertime stratospheric polar vortex breakdown, while MPI-ESM captures a scenario with limited sea ice loss and a delayed polar vortex breakdown (Williams et al., 2024).
We use the RACMO simulation forced by ERA5 reanalysis data (Hersbach et al., 2017), previously evaluated with observations by van Dalum et al. (2025), as the reference simulation for the historical period (1979–2023), hereafter referred to as RACMO(ERA5). At the lateral boundaries of the modelling domain, windspeed, temperature, pressure and humidity are specified using multi-level data from either ERA5 or ESM output. Sea surface temperature and sea-ice cover are defined at the ocean surface boundary and prescribed from ERA5 or ESM output. Sea ice temperature is calculated using the four-layer sea ice slab model from the ECMWF IFS model, which assumes a fixed maximum thickness of 1.5 m. Furthermore, in the free atmosphere the temperature, wind field and humidity are gently relaxed to either the ERA5 or ESM output, following van de Berg and Medley (2016).
RACMO(ERA5) has been extensively evaluated against weather station and mass balance observations in van Dalum et al. (2025). Using observations from automatic weather stations on the Antarctic Peninsula and in Dronning Maud Land, this study shows that version 2.4p1 performs well in simulating Antarctica's near-surface air temperature (bias of −1.40 and an RMSE of 4.38 °C) and shortwave radiation (bias of 8.5 and −8.8 W m−2 for downward and upward shortwave radiation, respectively), but has larger differences with observations for longwave radiative fluxes (bias of −20.4 and 11.7 W m−2 for downward and upward longwave radiation, respectively). Turbulent fluxes have small bias (−0.3 and 1.5 W m−2 for latent and sensible heat flux, respectively), but large spread (RMSE of 5.0 and 14.2 W m−2, respectively). As the biases in longwave and shortwave radiation partially offset one another, the resulting melt rates are less affected. This is reflected in the good agreement between simulated meltwater presence in the snow and satellite-based estimates (van Dalum et al., 2025).
As a second evaluation step, historical simulations (1985–2014) forced with ESMs are compared to RACMO(ERA5) in Sect. 3.1. We evaluate whether the mean differences between the ESM-forced simulations and RACMO(ERA5) exceed the inter-annual standard deviation of RACMO(ERA5). The RACMO simulations forced by CESM2 and MPI-ESM are hereafter referred to as RACMO(CESM2) and RACMO(MPI-ESM), respectively.
2.4 Assessing temperature-dependency of SEB
To study the drivers of the non-linear response of melt to temperature, we assess how the individual SEB terms respond to temperature. Because this response may itself be non-linear, each SEB-temperature slope is evaluated across discrete temperature bins. As albedo and cloud feedbacks are expected to play a dominant role, we first assess their temperature sensitivity. The influence of clouds on albedo is examined by comparing clear-sky and all-sky albedo, making use of the fact that RACMO separately calculates radiative fluxes under clear-sky and cloudy-sky conditions and subsequently combines them into total-sky fluxes based on cloud fraction. Based on this analysis, the following SEB analysis is split between ice shelves in relatively dry and wet climates, based on a threshold in annual snowfall. Following van Wessem et al. (2023), we use the median annual snowfall of ∼500 mm yr−1 as the threshold separating “dry” and “wet” ice shelves, which results in two equally sized groups. The map in Fig. B1 provides an overview of the ice shelves that are classified in each category.
To systematically assess the temperature dependence of SEB terms and explain the non-linear temperature–melt relationship, we use the following approach. For each ice shelf grid cell that experiences an average summer melt of at least 1 mm during the historical period, we fit either a linear or exponential function relating the summer average SEB component to air temperature. The function with the higher R2 value is selected, and grid cells where the optimal fit parameters could not be reliably estimated (average R2<0.3) are excluded from the analysis. We then calculate the average slope of the selected fits across all grid cells, grouped into temperature bins of 2 °C. If the selected fit is exponential, the slope at the middle of the bin is taken. The resulting average slopes vary across temperature bins because each bin averages fits from different locations. We calculate uncertainty bands based on the standard deviation between the fits (reflecting variability between locations) weighted with the average R2 value (reflecting the strength of the fit).
First, the performance of RACMO forced by the ESMs is evaluated to gain confidence in the simulations before using them in the analysis. We then assess the temperature and melt trends in the future projection runs, which provide the basis for studying the temperature–melt relationship. Finally, we analyse the spatial variability in the relationship between temperature and melt, the role of albedo feedbacks in the non-linearity and systematically assess how all SEB terms depend on temperature and contribute to the melt response.
3.1 Evaluation of RACMO historical simulations with ESM forcings
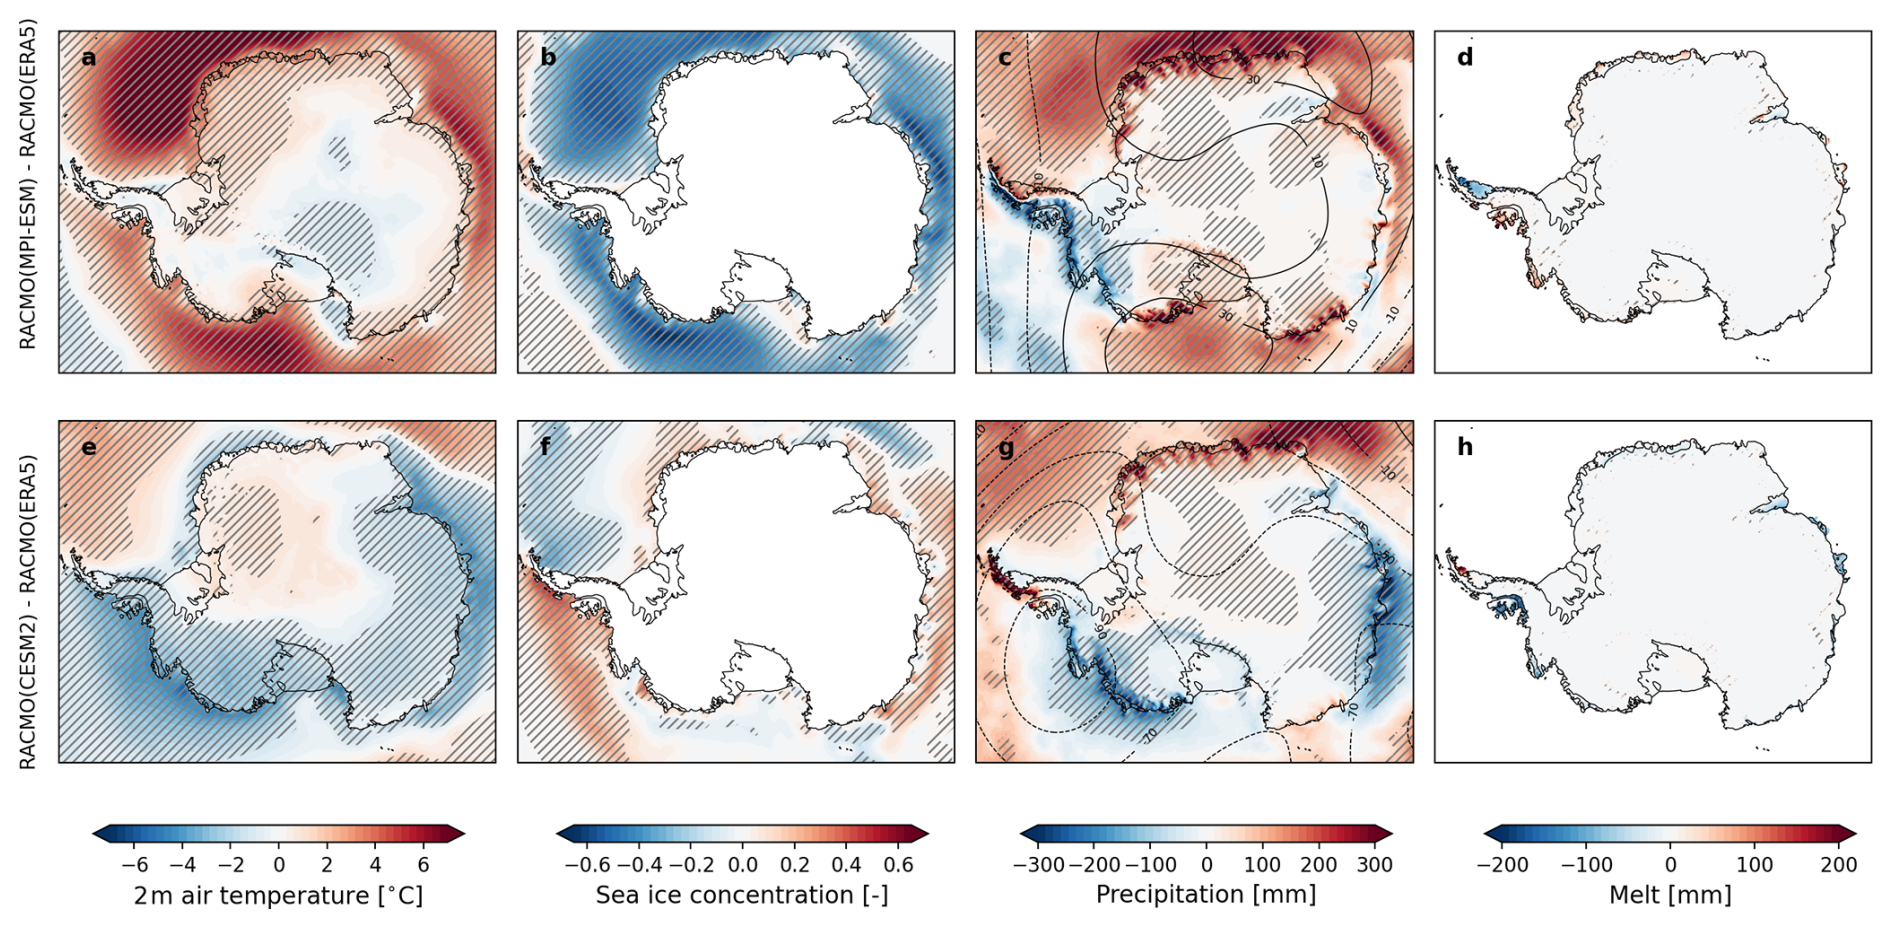
Because ESM-forced simulations are not constrained by data assimilation, we evaluate the ESM-forced simulations by comparing the mean and variability of near-surface climate variables over 1985–2014 with those from RACMO(ERA5) for the same period. Figure 1 shows the differences in DJF means of several key variables between simulations forced by ESMs and forced by ERA5. In the figure, hatching indicates areas where the mean difference between the ESM-forced simulations and RACMO(ERA5) is larger than the ERA5 interannual standard deviation over the historical period. RACMO(MPI-ESM) is warmer compared to RACMO(ERA5), especially over the sea ice zone (Fig. 1a). This is caused by the lower sea ice extent in RACMO(MPI-ESM) compared to RACMO(ERA5) (Fig. 1b). The influence of the lower sea ice extent in RACMO(MPI-ESM) on air temperature becomes even clearer when examining the annual mean fields (Fig. C1). Over the Antarctic continent, RACMO(MPI-ESM) temperatures differ little from RACMO(ERA5) relative to the year-to-year variability. Exceptions are Dronning Maud Land, which is warmer, and the high interior plateau in East Antarctica, where temperatures are lower than RACMO(ERA5) by more than the inter-annual standard deviation. The temperatures and sea ice conditions in RACMO(CESM2) are more realistic, but show a cold bias over West Antarctica and large parts of East-Antarctica, where the 500 hPa geopotential height is lower compared to RACMO(ERA5) (contours in Fig. 1g).
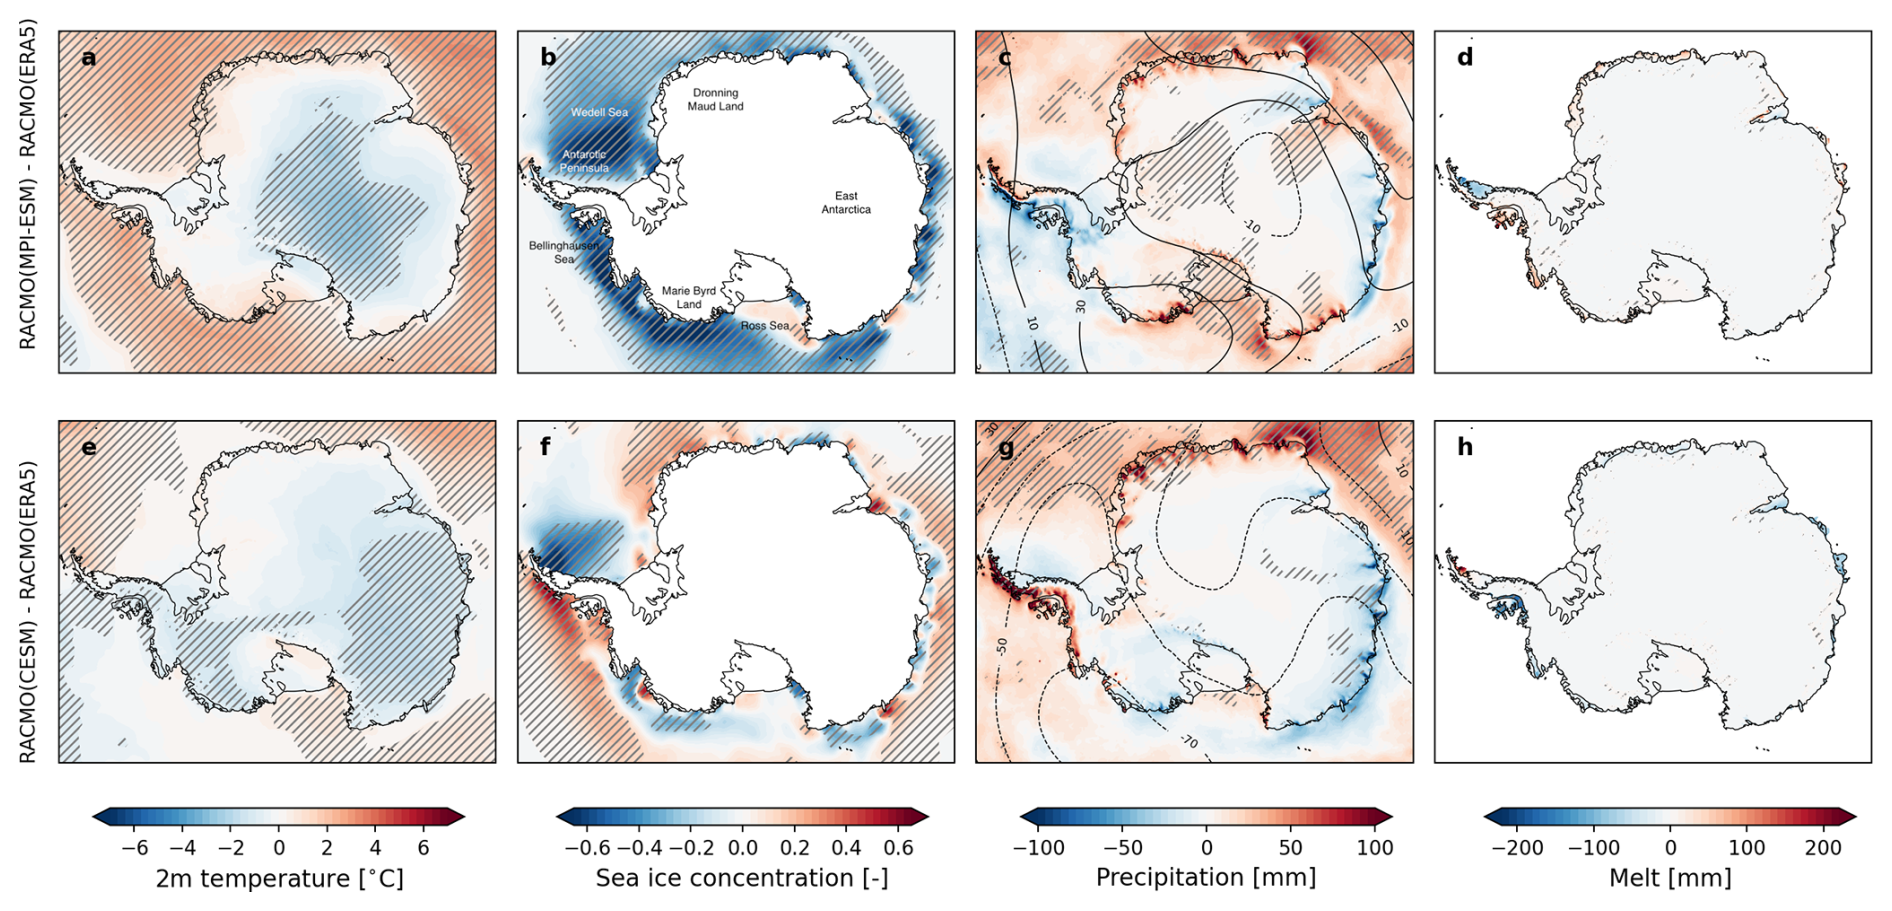
Figure 1Difference in DJF mean near-surface air temperature, sea ice concentration, precipitation and surface melt between RACMO simulations forced by MPI (a–d) or CESM (e–h) and those forced by ERA5 in the period 1985–2014. Hatched areas show where differences are larger than the standard deviation over the historical period in ERA5. Contour lines in (c) and (g) indicate corresponding difference in 500 hPa geopotential height with RACMO(ERA5).
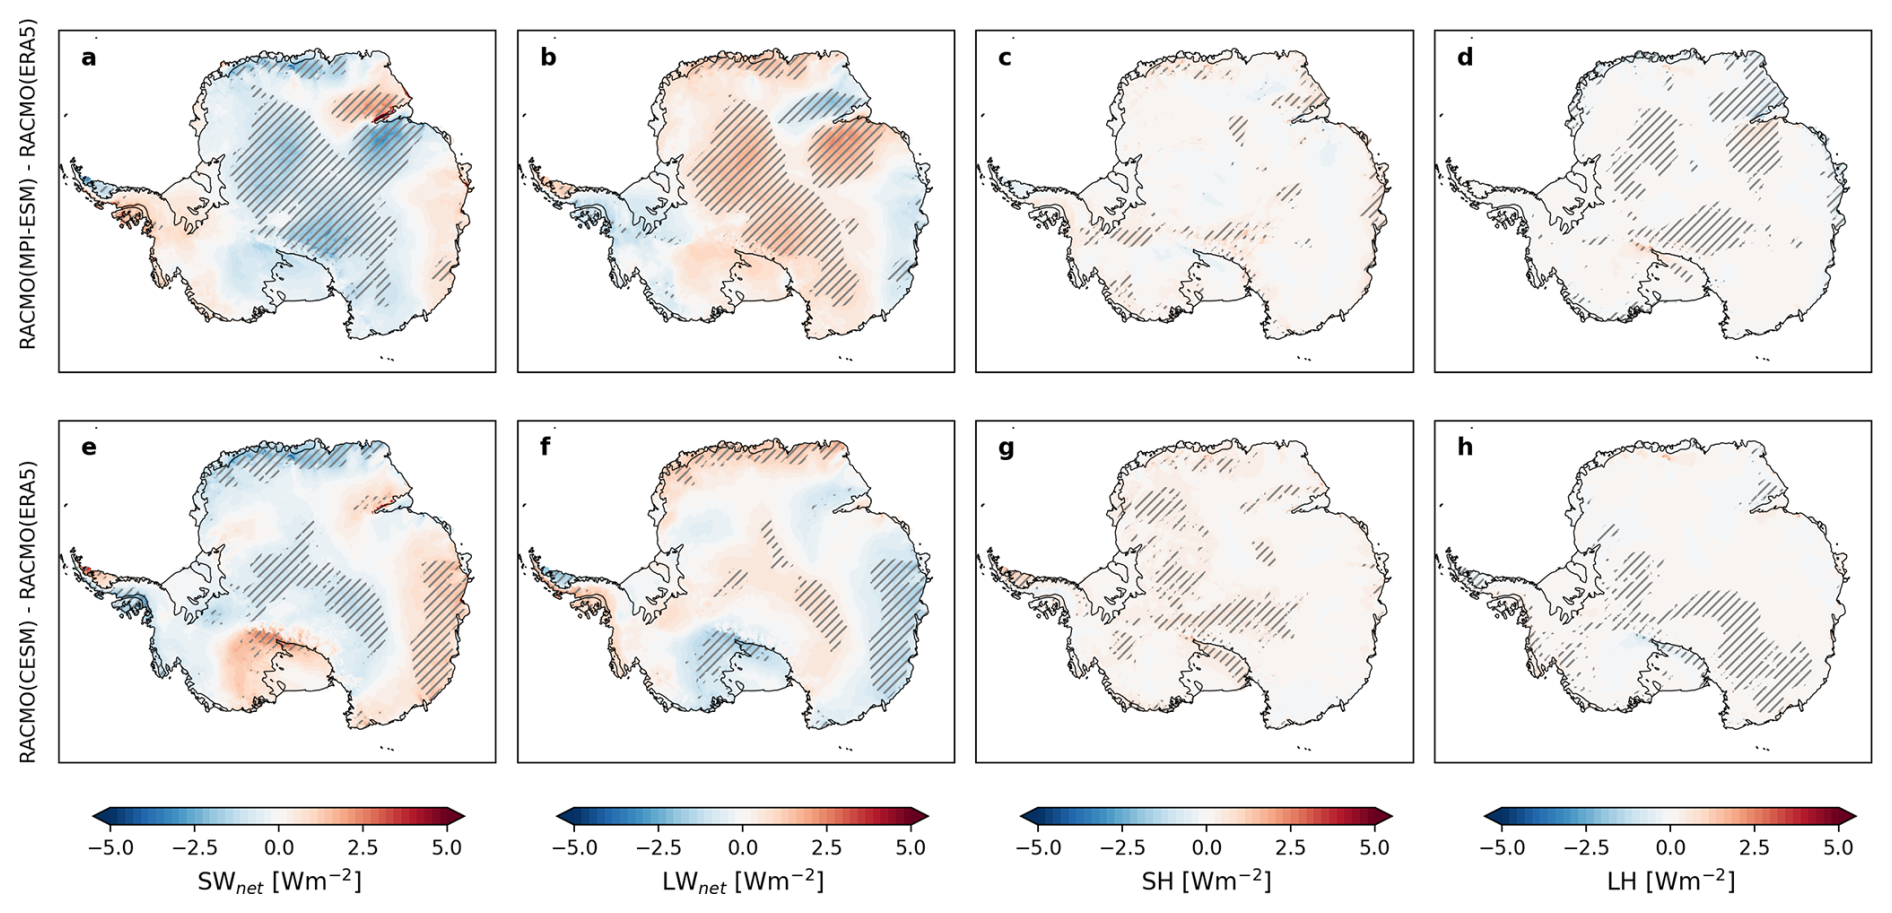
Figure 2As in Fig. 1 but for net shortwave radiation (SWnet), net longwave radiation (LWnet), sensible and latent heat flux (SH and LH).
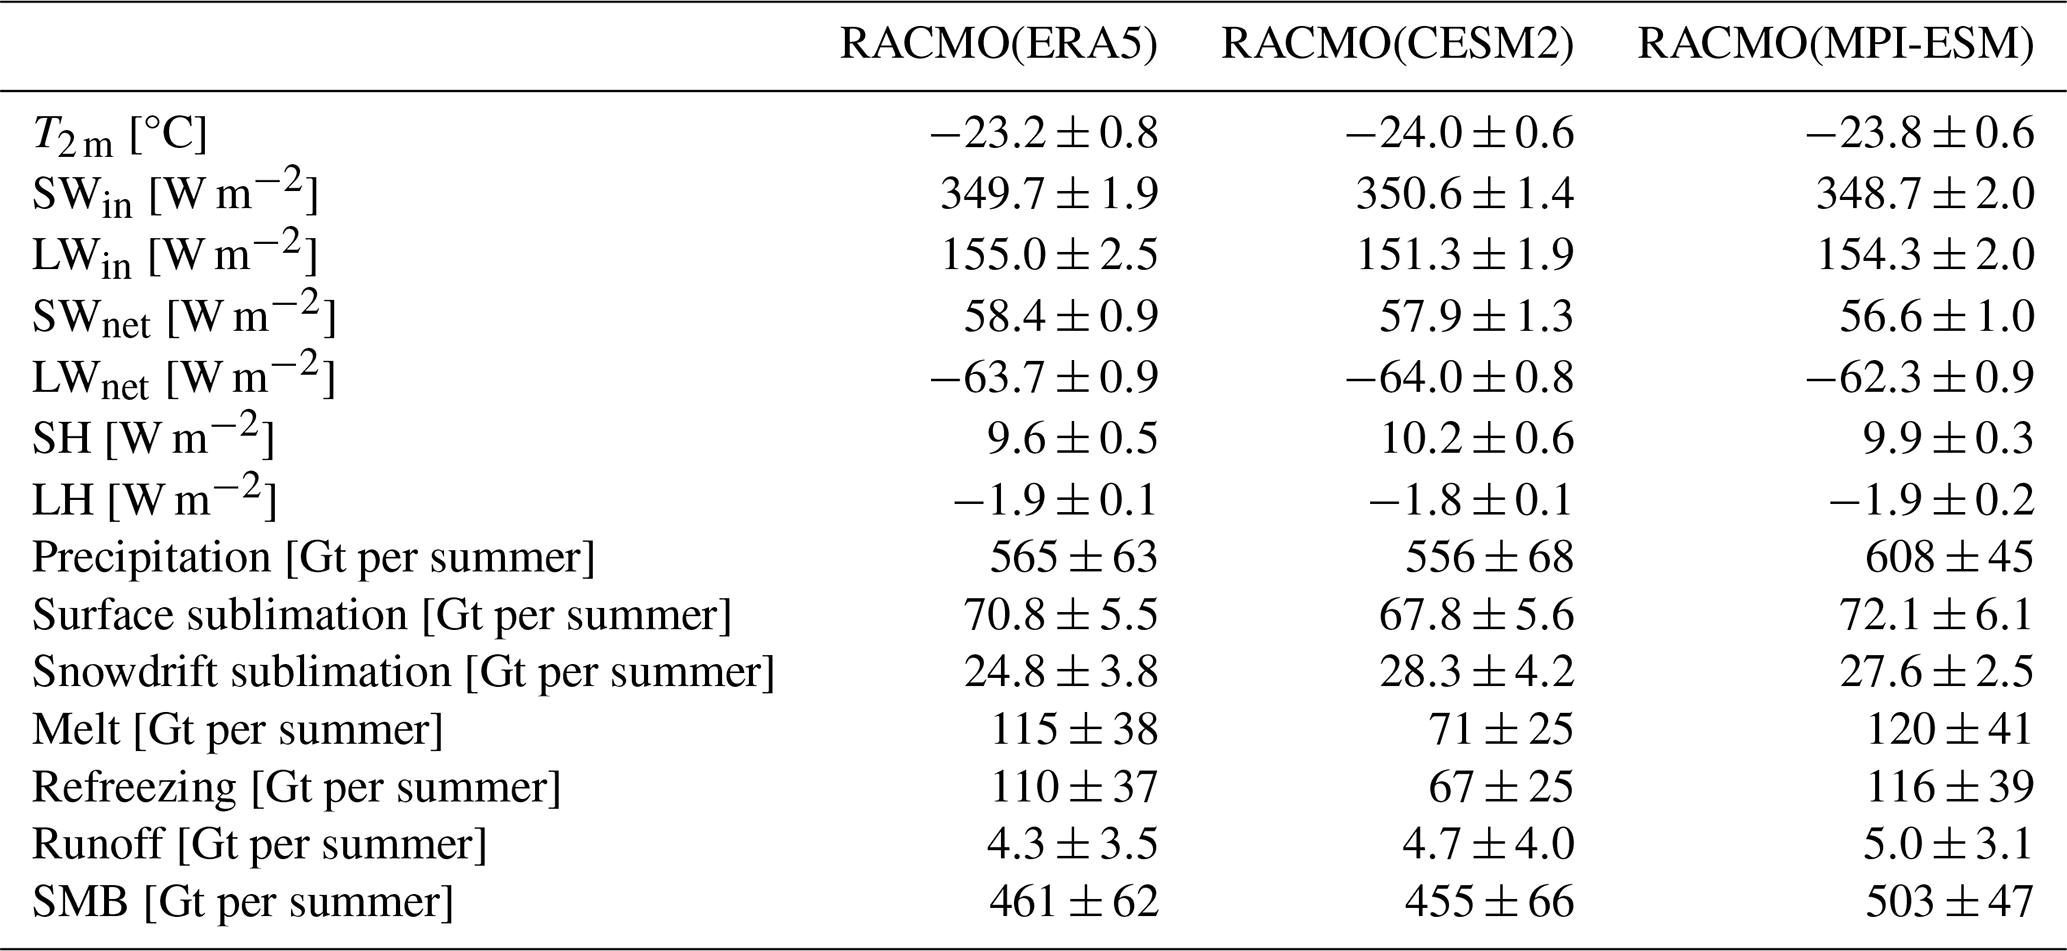
RACMO(CESM2) and RACMO(MPI-ESM) have similar precipitation difference patterns, with more precipitation in Dronning Maud Land and less in other parts of coastal East Antarctica compared to RACMO(ERA5) (Fig. 1c, g). Over the Antarctic Peninsula, RACMO(MPI-ESM) simulates less precipitation on the western side and more on the eastern side compared to RACMO(ERA5). This pattern is associated with a weaker Amundsen Sea Low, reflected in a positive geopotential height difference over the Amundsen-Ross Sea in Fig. 1c. In contrast, RACMO(CESM2) shows lower geopotential heights over the Bellinghausen Sea relative to RACMO(ERA5), which enhances westerly winds across the Antarctic Peninsula and orographic precipitation on the western slopes. In RACMO(MPI-ESM), melt rates are higher on the western side of the Antarctic Peninsula and lower on the eastern side compared to RACMO(ERA5); however, these differences do not exceed the inter-annual standard deviation. They likely reflect the impact of precipitation differences and albedo changes on SWnet (Fig. 2a). The opposite pattern holds for RACMO(CESM2), where melt rates are mostly underestimated on the western Antarctic Peninsula ice shelves, consistent with lower air temperatures and increased precipitation that reduces SWnet (Fig. 2e). Outside the Antarctic Peninsula, melt differences in RACMO(MPI-ESM) and RACMO(CESM2) are generally small compared to the inter-annual variability in RACMO(ERA5). The Antarctic-integrated melt in RACMO(MPI-ESM) is similar to that in RACMO(ERA5) (120±41 versus 115±38 Gt yr−1, see Table C1). In RACMO(CESM2) the Antarctic-integrated melt is lower (71±25 Gt yr−1 compared to 115±38 Gt yr−1 in ERA5).
The differences in SEB components between the simulations also reflect atmospheric circulation-related differences between the ESMs and ERA5 (Fig. 2). In both ESM-forced simulations, enhanced moisture transport to Dronning Maud Land reduces SWnet and increases LWnet compared to RACMO(ERA5) through albedo and cloud effects. Away from Dronning Maud Land, RACMO(CESM2) is drier along much of coastal East-Antarctica compared to RACMO(ERA5), leading to higher SWnet and lower LWnet. Differences in the turbulent heat fluxes are generally small, except in regions that are influenced by the lower pressure over the Amundsen Sea in RACMO(CESM2). This pressure difference strengthens westerly winds across the Antarctic Peninsula, increasing sensible heating and sublimation through foehn winds on the eastern side, and also enhances the warm and dry downslope flow over the Ross Ice Shelf. Overall, the ESM-forced simulations reproduce Antarctic near-surface climate, SEB and melt patterns well over the ice shelves, with differences relative to RACMO(ERA5) generally within the inter-annual standard deviation, except in a few localized regions such as Wilkins and George VI ice shelves. This close agreement supports the reliability of these simulations for investigating the temperature-melt relationship over the 21st century.
3.2 Historical and future trends in Antarctic warming and surface melt
In our simulations under the SSP3-7.0 scenario, warming of the near-surface atmosphere over the 21st century is strongest in autumn and winter, especially over the sea ice zone (Fig. 3). We find large differences between RACMO(CESM2) and RACMO(MPI-ESM): the former consistently shows stronger warming across all seasons, with the most pronounced differences in autumn and winter that have substantial sea ice decline. Part of the different warming rates stem from the different starting conditions in the historical climate states, with MPI-ESM simulating significantly lower sea ice concentrations and higher air temperatures (Fig. 1b). Another reason for the difference in warming is likely the contrasting atmospheric circulation response of the ESMs. MPI-ESM has a stronger intensification and poleward shift of the jet stream compared to CESM2, which limits the advection of warm air from lower latitudes and therefore suppresses warming, especially in winter (Williams et al., 2024).
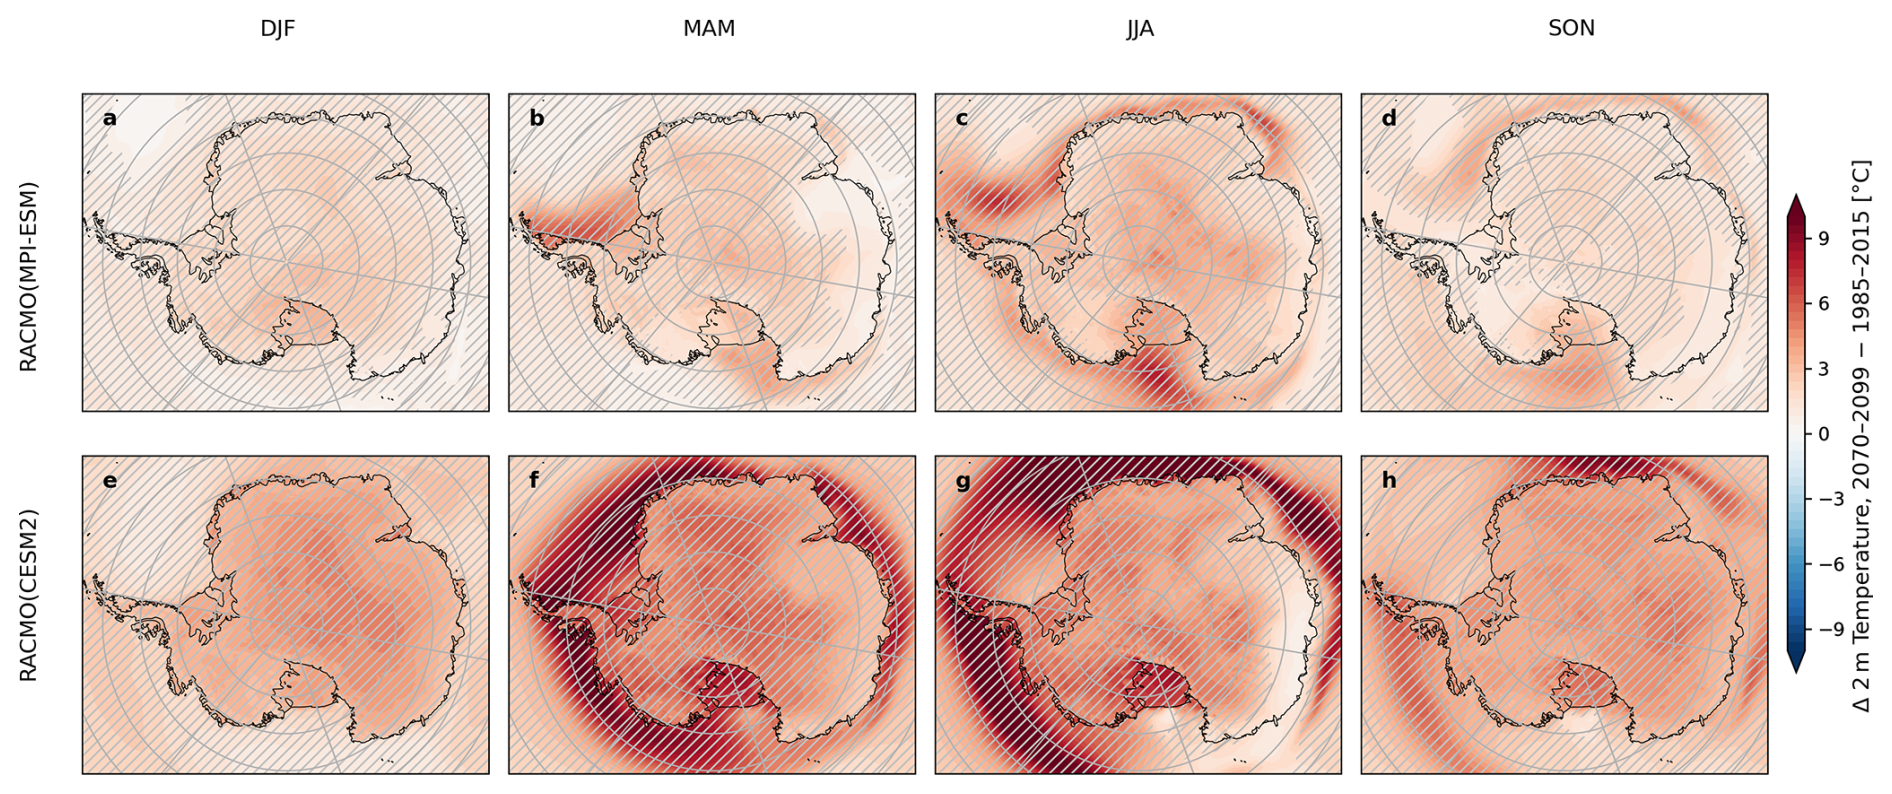
Figure 3Average near-surface air temperature change between the current climate (1985–2014) and future climate (2070–2099) as modeled by RACMO. Panels (a)–(d) are forced by MPI-ESM, while panels (e)–(h) are forced by CESM2. Hatched areas show where changes in temperature are larger than the standard deviation over the historical period in ERA5.
The warming over the Southern Ocean is weakest in summer, when sea ice concentration, and thus trends in sea ice concentration, are smallest. The large thermal inertia of the ocean inhibits a fast surface warming and subsequently a quick rise of the near-surface air temperature. Nevertheless, both RACMO(CESM2) and RACMO(MPI-ESM) show warming over the entire Antarctic continent during summer.
We now focus on Antarctic ice shelves and assess their summer warming and surface melt evolution, which provides the context for the following analyses of the temperature–melt relationship and its physical drivers. For all regions, ice shelves are warming significantly over the 21st century (Fig. 4). However, output from RACMO(CESM2) consistently shows a greater rate of warming than RACMO(MPI-ESM). Interestingly, for most regions melt in RACMO(MPI-ESM) and RACMO(CESM2) is more similar in the historical period and diverges in the future scenario, apart from ice shelves in West Antarctica (Fig. 4g) that start with a large difference but converge in the future.
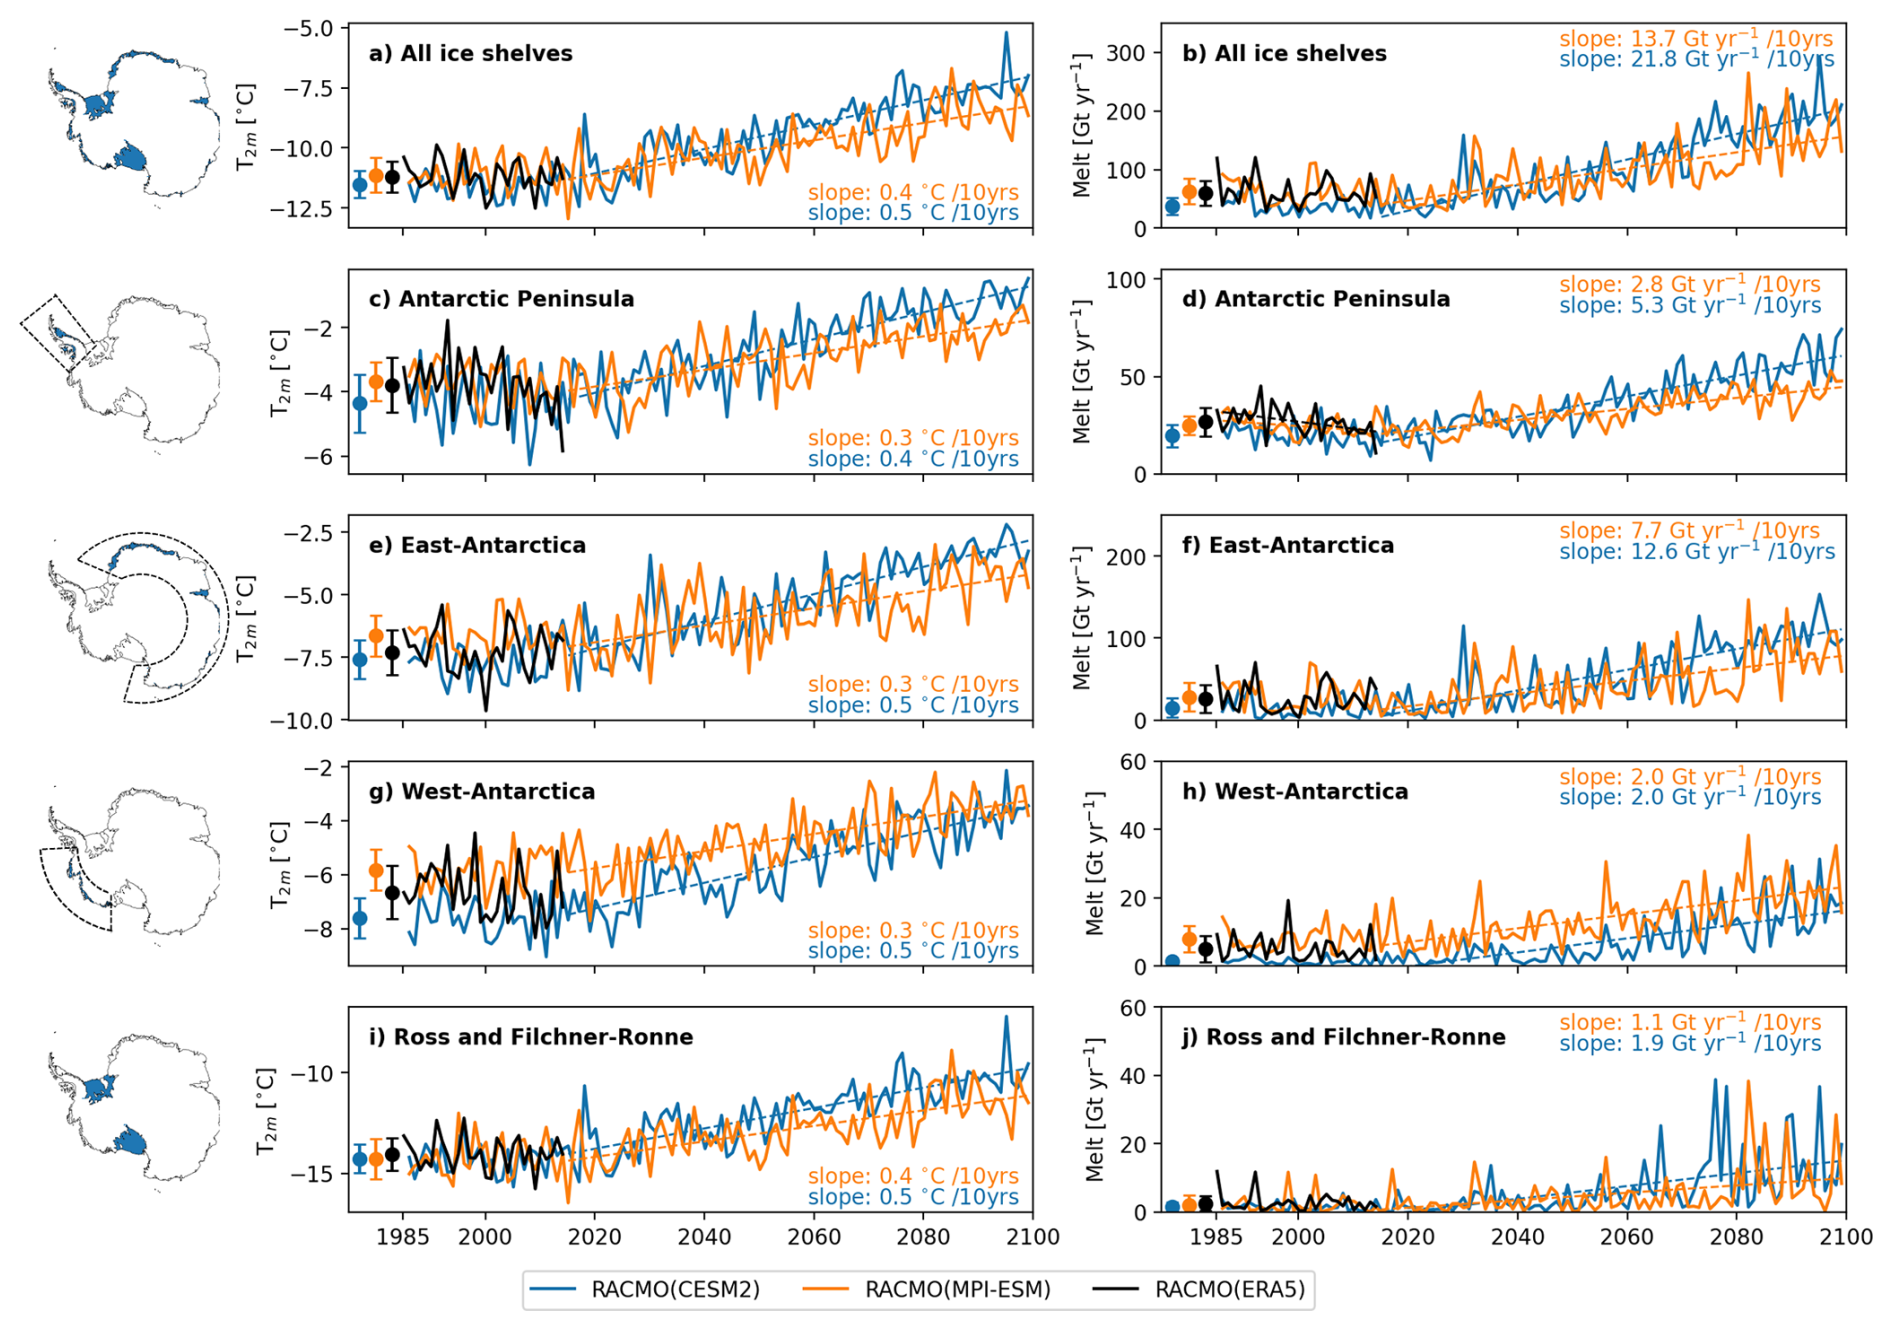
Figure 4Timeseries of summer average near-surface air temperature and melt over all ice shelves and selected ice-shelf regions. Error bars indicate the mean and standard deviation over the historical period (1985–2014). Trendlines are shown where a significant trend (p value <0.05) is detected in either the historical (1985–2014) or SSP3-7.0 (2015–2099) simulations.
No significant trends in melt are found over the historical period, except for a decrease in melt on the ice shelves of the Antarctic Peninsula in RACMO(ERA5) (Fig. 4d). This agrees with previous studies that report a significant regional cooling since the late 1990s driven by changes in atmospheric circulation and increased sea ice advection (Turner et al., 2016; van Wessem et al., 2016), which changed in the mid-2010s together with changes in the large-scale climate modes (Carrasco et al., 2021). Melt starts to increase in the future simulations, showing significant increases over all regions. On the Filchner-Ronne and Ross Ice Shelves, the interannual variability relative to the overall melt trend is largest, particularly after 2070. Melt increases more rapidly in RACMO(CESM2) compared to RACMO(MPI-ESM) for all regions, consistent with the stronger temperature increase. As a result, for most ice shelves RACMO(CESM2) starts with lower temperatures and melt, but ends higher than RACMO(MPI-ESM).
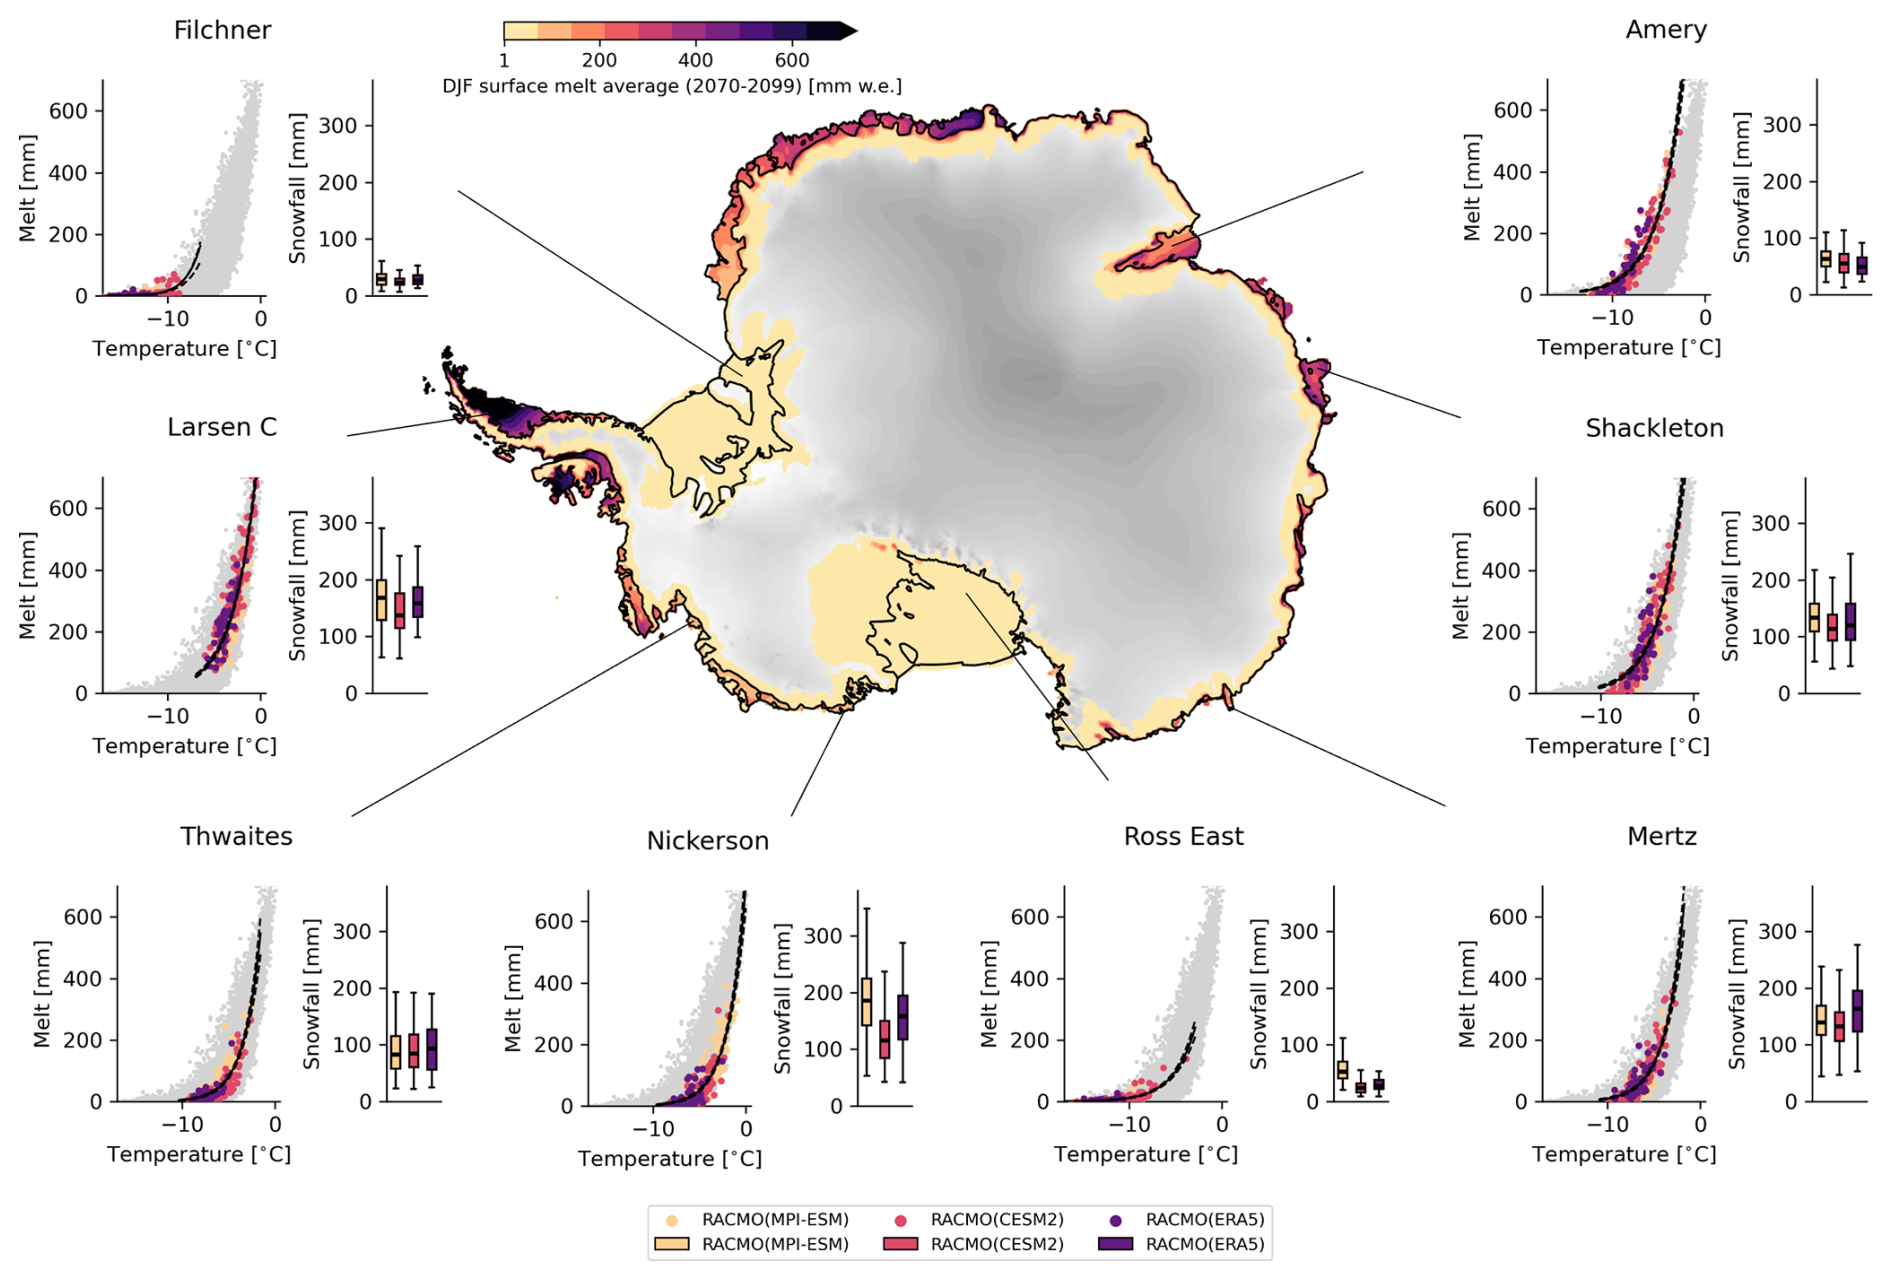
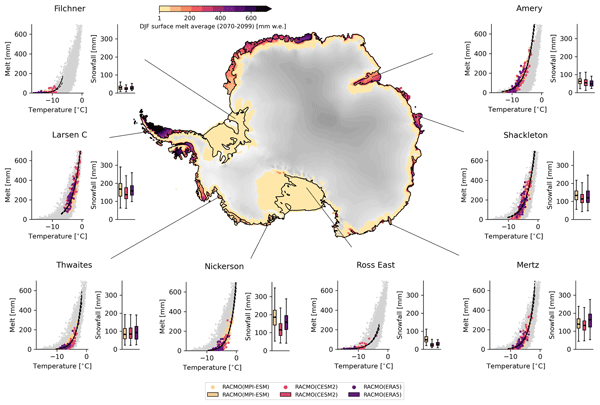
Figure 5Spatial variability in the temperature–melt relationship over Antarctic ice shelves. Scatter plots show the relationship between summer melt and temperature from RACMO simulations, forced by ERA5 (1979–2023, purple), CESM2 (1985–2099, pink), and MPI-ESM (1985–2099, yellow), with grey background scatter representing all ice shelves and all RACMO simulations. Black line shows exponential fit between temperature and melt for the considered ice shelf, with dashed line showing the 97.5th percentile confidence interval. Boxplots of summer snowfall rates are shown for each simulation. The boxplots show the distribution of summer snowfall for each simulation, with the box representing the middle 50 % and whiskers extending to values within 1.5× the interquartile range. The map displays the average surface melt for 2070–2099 in RACMO(CESM2) (shading), overlaid on a grey elevation map of Antarctica.
3.3 Spatial variability in temperature-melt relationship
Given the strong link between temperature and melt suggested by previous research (Trusel et al., 2015) and the future trends (Fig. 4), we now explore the temperature–melt relationship in more detail, showing that it is highly non-linear and varies significantly across regions (Fig. 5). Even though the simulations have different warming rates, the relationship between temperature and melt is consistent across the ERA5 and ESM model forcings (scatter plots in Fig. 5). The Filchner-Ronne and Ross ice shelves are coldest and while they experience significant warming, their melt rates remain small compared to other ice shelves, with shelves on the Antarctic Peninsula experiencing most melt. Summer melt is exponentially related to summer air temperature (Kittel et al., 2021; van Wessem et al., 2023), although the shape and steepness of this relationship vary across different ice shelves (Fig. 5).
Ice shelves in drier climates tend to experience more melt at the same temperatures compared those in wetter climates. For example, the Amery ice shelf, which receives less than 100 mm snowfall during summer (boxplot in Fig. 5), has a temperature-melt curve where melt starts increasing at much lower temperatures compared to other ice shelves (grey scatter Fig. 5). In contrast, the Nickerson Ice Shelf, located in a much wetter climate on the Marie Byrd Land coast, shows melt rates increasing only at substantially higher summer air temperatures. These examples show that the average summer temperature required to reach a certain melt rate varies between ice shelves.
To further quantify this, we use the fitted exponential temperature-melt relationships and determine for each ice shelf the summer air temperature at which 200 mm of melt would occur. This temperature is plotted against summer snowfall rates in Fig. 6. Although the exact relationship differs between simulations, all show a clear pattern: ice shelves in drier climates reach 200 mm of melt at summer air temperatures several degrees lower than those in wetter climates.
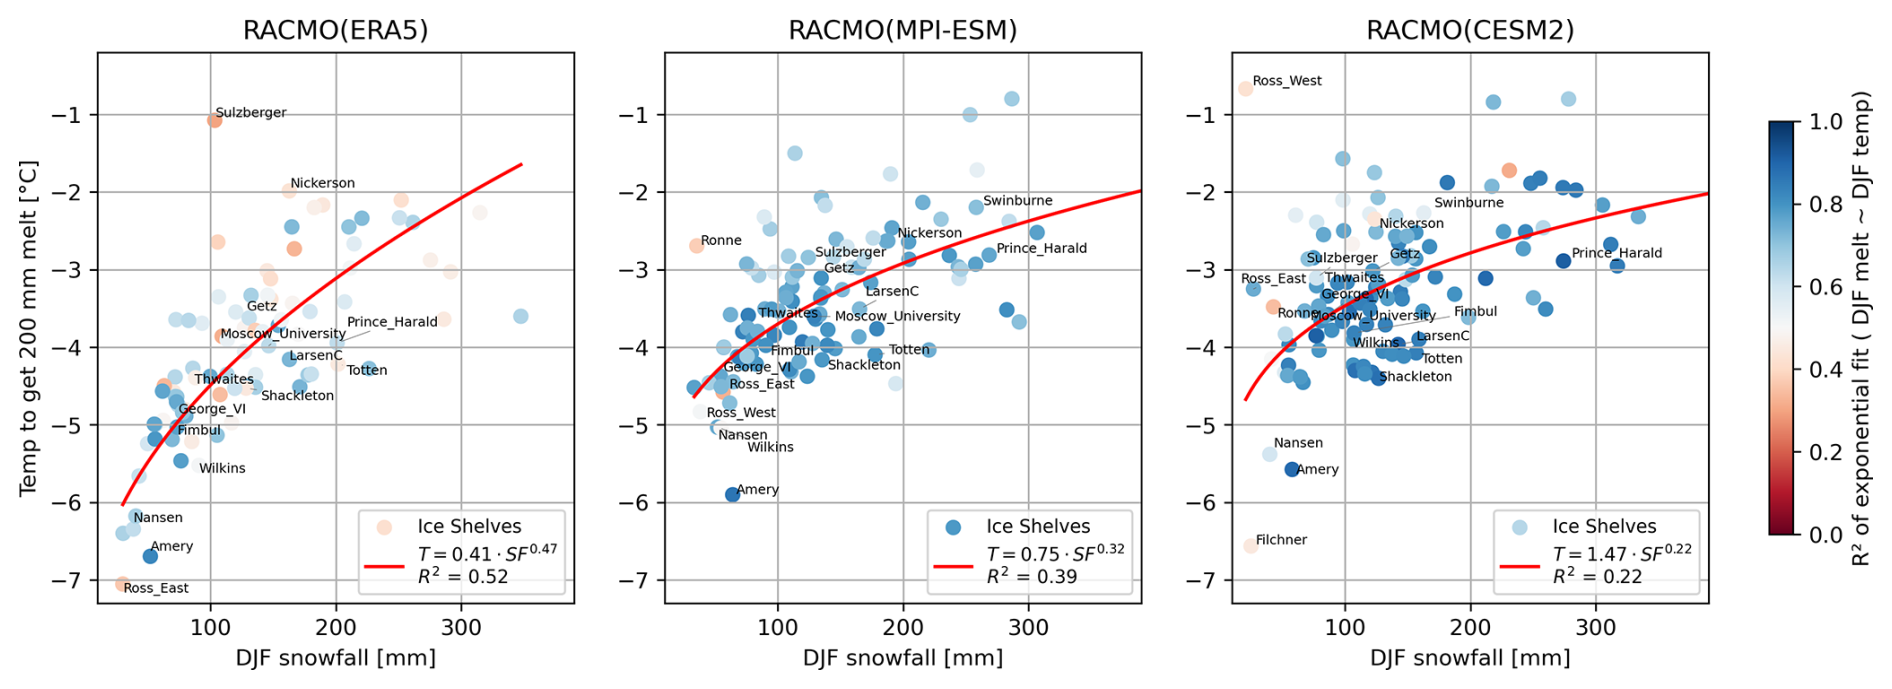
Figure 6Average DJF snowfall rates over the historical period vs. DJF near-surface air temperature required to produce 200 mm of surface melt according to fitted exponential relationships between temperature and melt per ice shelve, across the three RACMO simulations (columns). Each point represents one ice shelf, colored by the R2 of an exponential fit. The red solid line shows a power law fit through the points, illustrating the relationship between snowfall and the temperature sensitivity of surface melt.
3.4 Variable albedo feedbacks
To better understand the relationship between temperature, surface melt, and the role of snowfall, we examine one of the primary drivers of Antarctic surface melt: the absorption of shortwave radiation (Elvidge et al., 2020; Gilbert et al., 2022; Hofsteenge et al., 2023; Jakobs et al., 2020). Figure 7 illustrates the temperature dependency of summer albedo across the major Antarctic ice shelves (ice shelf area >800 km2). Here and throughout this section, albedo refers to surface albedo. The effect of clouds on surface albedo is assessed by comparing all-sky and clear-sky surface albedo. When summer air temperatures remain below approximately −10 °C, such as on the Ronne-Filchner and Ross ice shelves, albedo is higher during warmer summers compared to colder ones. This can be attributed to increased atmospheric moisture content during warm summers, leading primarily to increased cloudiness, with a smaller contribution from increased snowfall (not shown). Both fresh snowfall and increased cloudiness increase surface albedo. The effect of clouds on albedo is illustrated in the second row of Fig. 7, which shows the difference in albedo between modelled (all-sky) and hypothetical clear-sky conditions across temperature bins. The figure demonstrates that, across all temperature ranges, warming is associated with increased cloud cover, which increases albedo. The cloud effect on albedo increases for lower albedos, as snow metamorphism primarily lowers the spectral albedo for red and near-infrared light, enhancing the cloud effect (Gardner and Sharp, 2010).
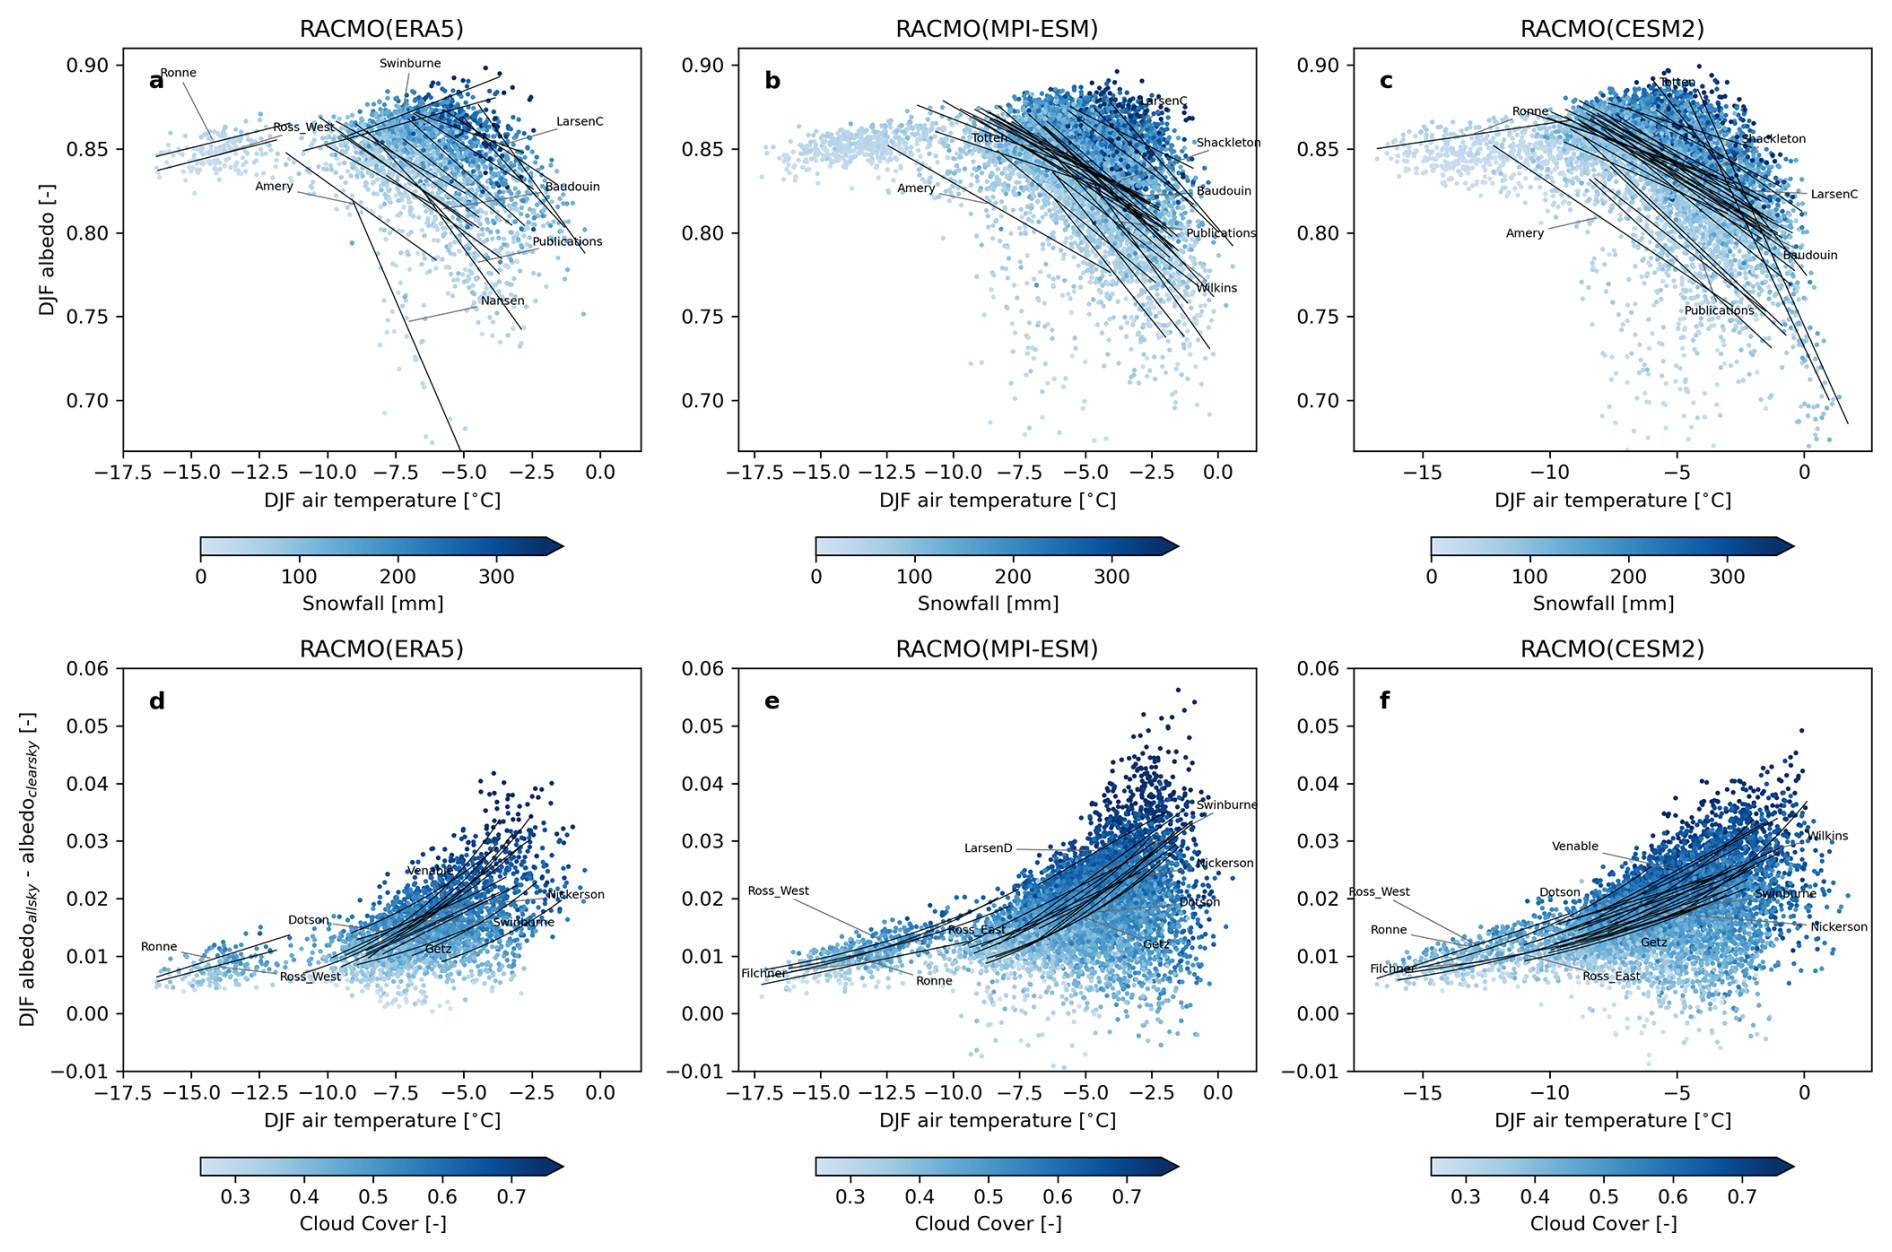
Figure 7Temperature dependence of surface albedo and its relationship with snowfall rates in RACMO simulations forced by ERA5 (1979–2023) (a), CESM2 (1985–2099) (b), and MPI-ESM (1985–2099) (c). The row below shows the same analysis but for the effect of clouds on albedo, with DJF cloud cover indicated by color shading (d–f). Each scatter point represents the average over one summer season (DJF) over one major Antarctic ice shelf (ice shelves with area >800 km2). Linear fits are shown in black for each ice shelf where the R2 value exceeds 0.3.
At higher summer near-surface air temperatures ( °C), warming still leads to increased cloud cover that tends to enhance albedo (Fig. 7d–f), but this effect is outweighed by albedo reductions associated with snow melt and snow metamorphism. While Fig. 7d–f show that increased cloud cover can raise albedo by up to 0.05, the net albedo change on the warmer ice shelves is a decrease of larger magnitude (Fig. 7a–c). Antarctic snow albedo is largely dependent on the snow grain size, and the coarsening of grains, snow metamorphism, happens at a rate that increases with temperature (Picard et al., 2012; Taillandier et al., 2007). Additionally, when snow melts and refreezes, the grain size increases, which enhances light absorption and further lowers albedo, a process known as the snowmelt–albedo feedback (Jakobs et al., 2019, 2021). Whether melt or dry metamorphism plays a greater role in lowering albedo depends on the timing of snowfall relative to melt events. The magnitude of the albedo decline depends on snowfall rates, as frequent snowfall brings small-grained, highly reflective snow to the surface. This is evident in Fig. 7a–c, where the strongest decreases in albedo with increasing temperature occur at ice shelves with low snowfall rates (e.g. Nansen and Publications ice shelves), whereas some ice shelves with high snowfall rates show little to no decline, or even an increase in albedo (e.g. Swinburne ice shelf in RACMO(ERA5)). This helps explain our previous findings that ice shelves that receive more snowfall have a lower melt sensitivity to near-surface air temperature compared to drier ice shelves. Frequent fresh snowfall dampens metamorphism and the snowmelt-albedo feedback, consistent with Jakobs et al. (2021).
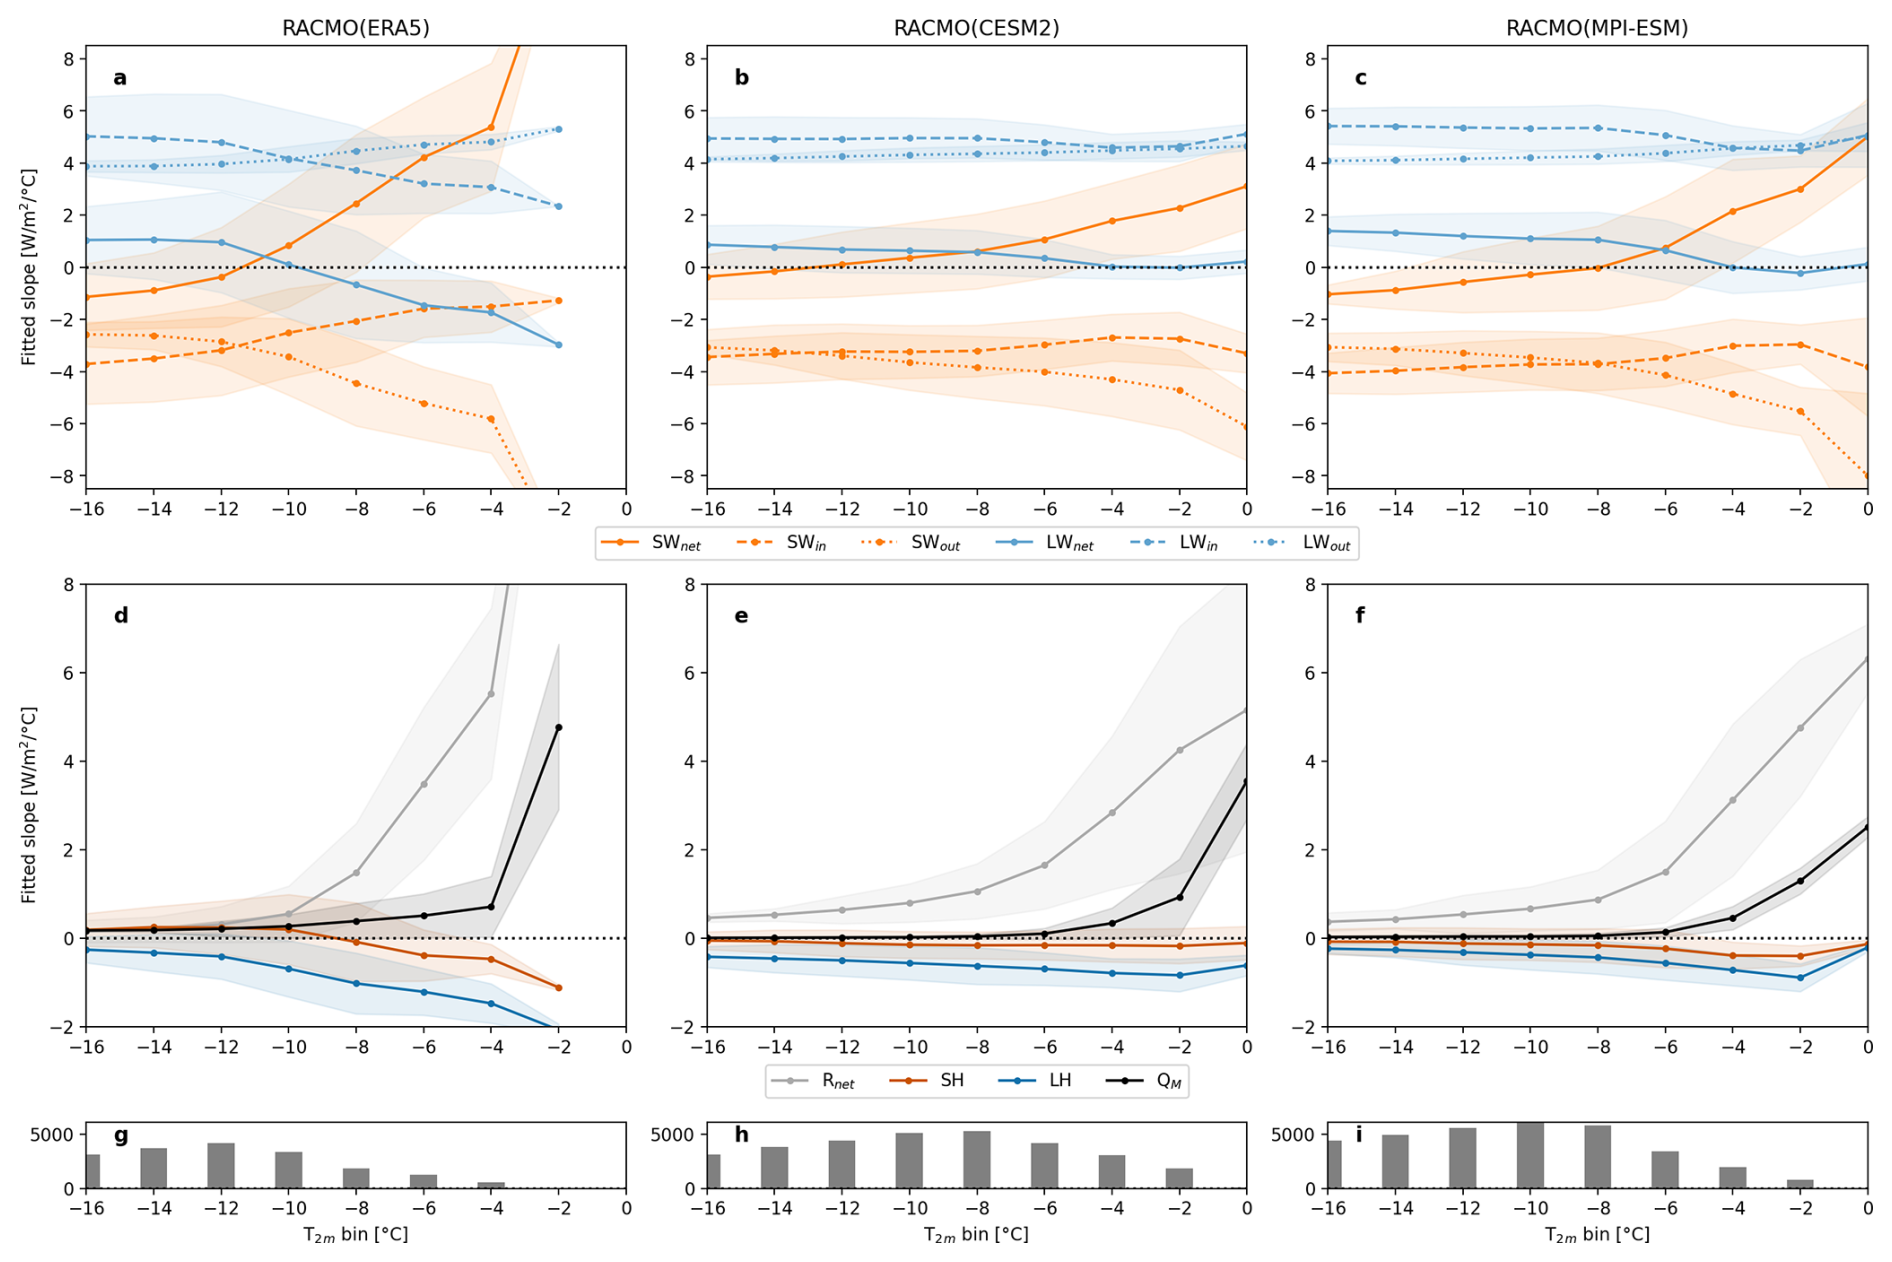
Figure 8Temperature-dependent average fitted slope between summer surface energy balance (SEB) components and summer air temperature over dry ice shelves (annual precipitation mm). Each point represents the average slope of the SEB term with respect to temperature within a 2 °C bin, calculated over all dry ice-shelf grid cells that experience melt. Shaded areas indicate the weighted standard deviation, representing the error due to spatial variability across grid cells and strength of the fit. Columns represent the different RACMO simulations and the number of grid cells used to compute the average slope per bin shown in (g), (h), (i).
3.5 Temperature dependency of SEB components
Next, we systematically assess how each SEB component responds to temperature and contributes to the non-linear relationship between temperature and melt. Figure 8 shows the average SEB-temperature slopes for dry ice shelves (see Sect. 2.4 how dry and wet ice shelves are defined). Rnet represents net radiation (SWnet+LWnet). The relationship between net shortwave radiation (SWnet) and temperature is not constant across temperature bins (Fig. 8a–c). In the lower temperature bins, the slope of SWnet is negative, indicating that SWnet decreases with warming. This decrease occurs because higher atmospheric moisture and increased cloud cover reduce incoming shortwave radiation (SWin) by reflecting more sunlight. This decrease in SWin is larger than the reduction in outgoing shortwave radiation (SWout), because surface albedo increases with temperature in this range and ∂SW remains negative (Fig. 7). However, at higher temperature bins, this pattern reverses and the slope of SWout becomes positive: SWout begins to decrease faster than SWin with warming as albedo drops due to snow metamorphism and melt, leading to ∂SW. Thus, on dry ice shelves net shortwave radiation (SWnet) first declines with warming and then increases with further warming, producing a distinct crossover point visible across all three model combinations. The exact temperature at which this crossover occurs varies between −13 and −8 °C across the simulations, but it broadly aligns with the −11 °C threshold where the strength of the snowmelt–albedo feedback increases in Jakobs et al. (2021). The slope between SWnet and temperature continues to increase beyond this point in all simulations, initially driven by snowmelt refreezing and dry snow metamorphism. At the highest temperature bins, albedo can decrease further due to the refreezing of rainfall and the increasing exposure of bare ice (not shown). In the RACMO simulations, rainfall begins to occur at summer mean air temperatures around −7.5 °C, increases to up to 50 mm per summer by −2.5 °C, and then rises sharply above −2.5 °C, following an exponential trend (not shown).
Longwave radiation components exhibit strong and consistent temperature response. Outgoing longwave radiation (LWout) increases with near-surface air temperature due to its dependence on surface temperature, as governed by the Stefan-Boltzmann law. Meanwhile, incoming longwave radiation (LWin) increases too due to a warmer, moister atmosphere. This increase in LWin is generally stronger than the additional LWout from a warmer surface, resulting in a net gain in longwave radiation. In the simulation forced by ERA5, however, LWout begins to increase more rapidly than LWin at −10 °C (Fig. 8a), likely due to a weakening in sensitivity of LWin and difference in cloud response to the other model forcings. This decline in the sensitivity of LWin is weaker and occurs at higher temperatures in the ESM-forced simulations (Fig. 8b, c). Together, changes in net shortwave and net longwave radiation nearly compensate for each other at lower temperatures, yielding a small effect on net radiation (Rnet in Fig. 8d–f). But at higher temperatures, the strong increase in temperature sensitivity of SWnet drives a strong increase in net radiation, amplifying melt.
The relative contributions of sensible and latent heat fluxes to the temperature response of the SEB are small compared to that of the radiative components, as the turbulent fluxes are generally smaller components in the SEB during summer (e.g. Fig. A1). The sensible heat flux is on average positive in summer, as the surface temperature is colder than air temperature. The SH-temperature slope is very small or negative, especially for higher temperature bins in RACMO(ERA5). This indicates the sensible heat flux decreases despite rising air temperatures, because the darkening of the snow decreases the air-surface gradient due to increasing surface temperatures. The latent heat flux is on average negative in summer (not shown), indicating net sublimation. This flux becomes increasingly negative with rising air temperature, meaning that more energy is used for sublimation. Warmer air can hold more moisture and since the overlying air is typically dry due to its inland/katabatic origin, the humidity gradient between surface and atmosphere increases. Additionally, the saturation specific humidity at the ice surface increases exponentially with surface temperature, further increasing the vapor pressure gradient and sublimation. The energy losses through turbulent fluxes compensate for energy gains from net radiation, but this only holds at lower temperatures. At these low temperatures, most of the days included are non-melting days, and QM changes little for increasing temperature.
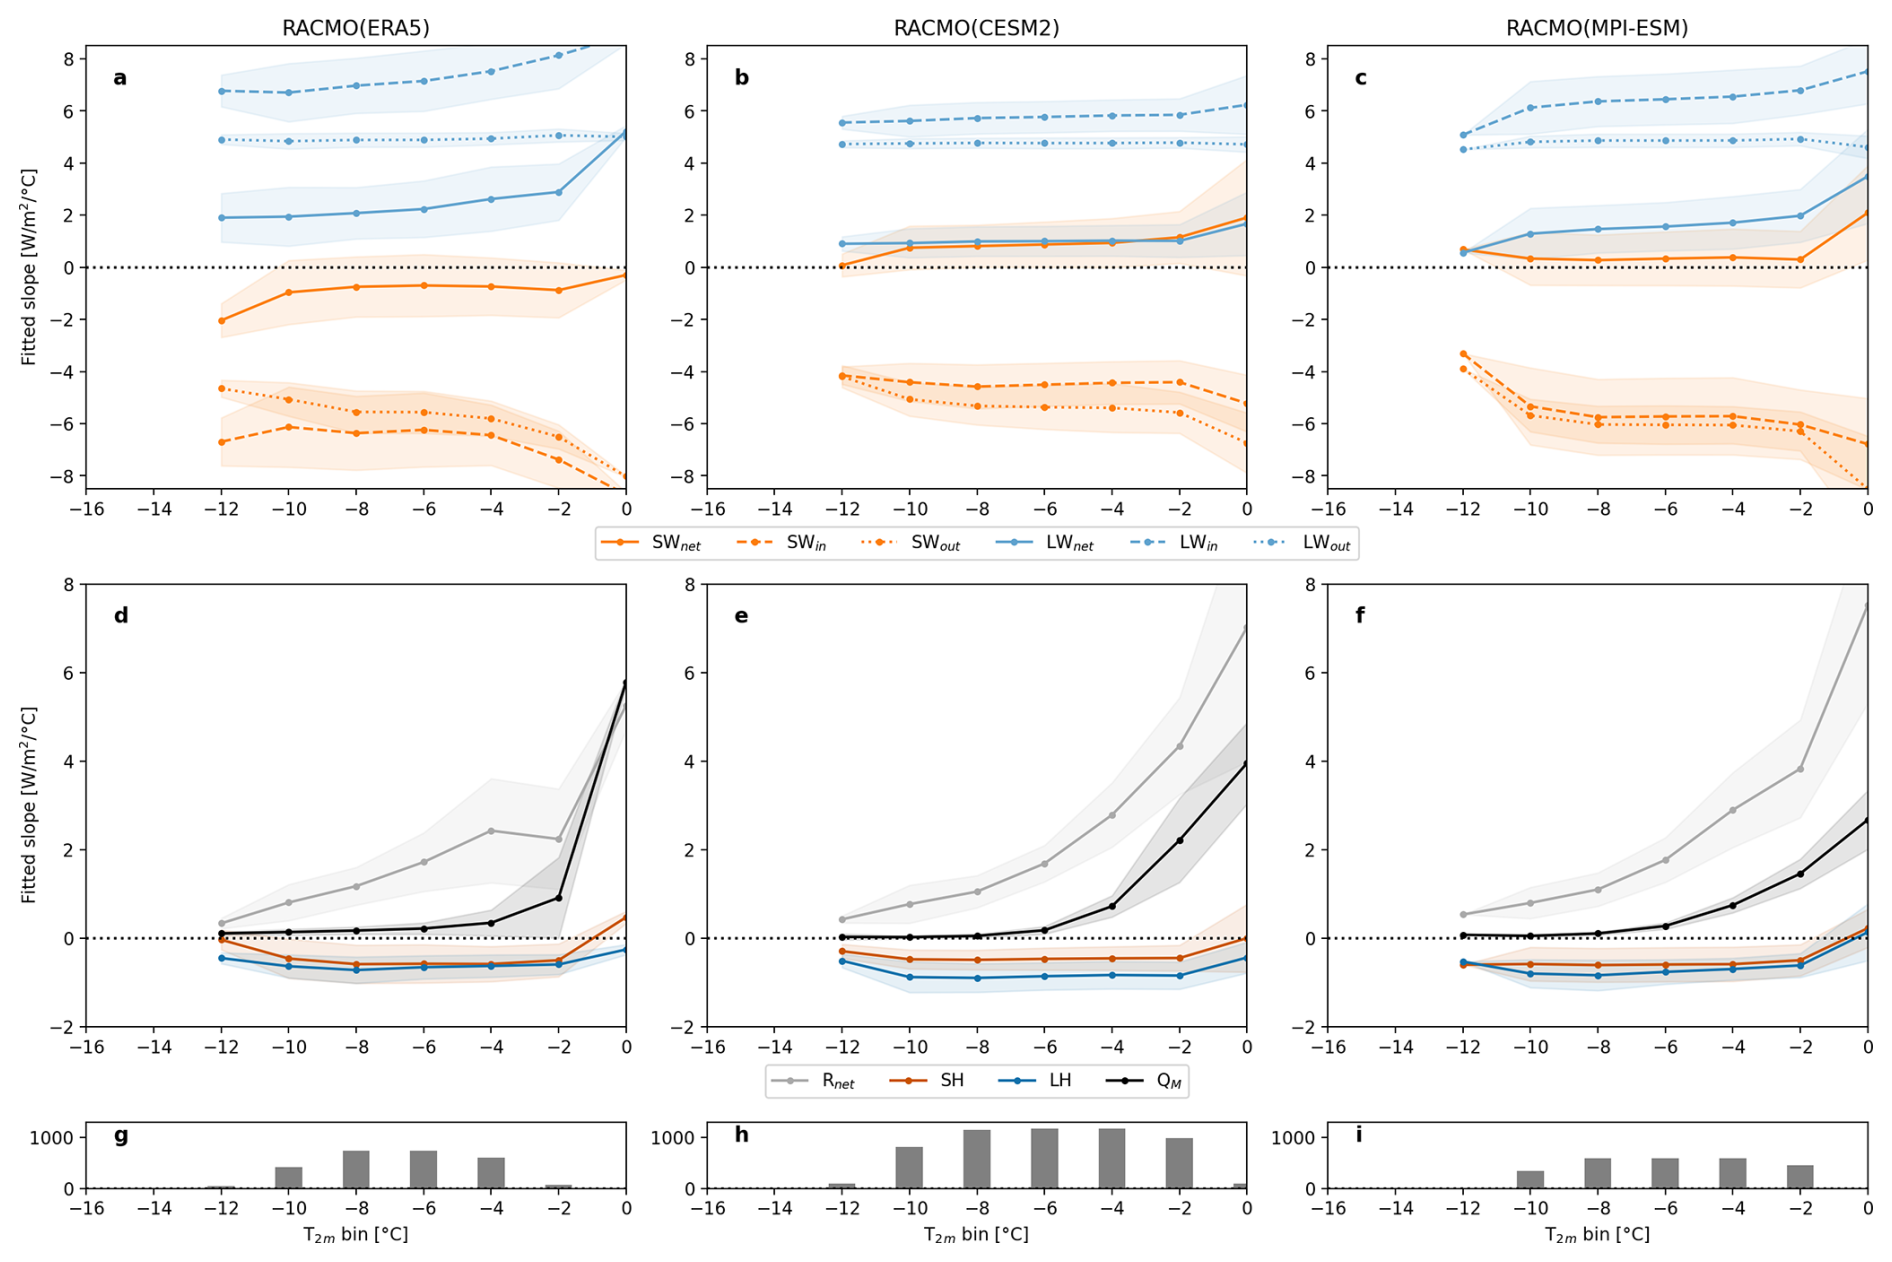
When considering wet ice shelves (defined by annual snowfall mm, see Sect. 2.4), which are generally warmer, the picture looks different than for dry ice shelves (Fig. 9). For these wet ice shelves, fewer grid cells fall into the lowest temperature bins, while a larger number of points contribute to the highest bins. The response of SWnet to warming is weaker and less consistent across the model forcings, which may result from differences in cloud and precipitation patterns among the models in the coastal regions of the Amundsen Sea (Fig. 1), where many of these wet ice shelves are located (Fig. B1). The lower temperature sensitivity of SWnet over wet ice shelves is consistent with our findings in Fig. 7, which show that snowfall dampens the snowmelt–albedo feedback. The slope of SWnet is relatively constant across the temperature bins, except for the bin around 0 °C, where SWnet increases more rapidly with warming. In this temperature range, a fraction of the precipitation falls as rain, which removes the damping effect of fresh snowfall and reduces albedo through refreezing of rainwater.
A notable difference between dry and wet ice shelves is the response of net longwave radiation to warming. On dry ice shelves, the increase in net longwave radiation with temperature weakens or reverses at higher temperature bins, whereas on wet ice shelves it remains positive and even strengthens (Fig. 9a–c). This shows the influence of increased humidity and cloudiness that increases incoming longwave radiation and contribute to melt on wet ice shelves. The increase in net longwave radiation contributes more to the increase in melt energy on wet ice shelves than net shortwave radiation, whereas the opposite is true at dry ice shelves.
Both sensible and latent heat fluxes generally decrease with warming on wet ice shelves, except as summer mean air temperatures approach 0 °C. While the turbulent fluxes partly offset the increase in net radiation at lower temperatures, they intensify melt rates near 0 °C. First, air temperatures can exceed 0 °C while the surface remains at the melting point, allowing sensible heat flux to become positive and provide additional energy to the surface (reflected in the shift to a positive slope in highest temperature bin for SH in Fig. 9d–f). Second, energy loss through sublimation levels off because the saturation vapor pressure over ice no longer increases when the surface temperature halts at 0 °C, suppressing further sublimation while the air in the boundary layer can become more humid. This transition to an increasing contribution from the turbulent fluxes, together with a rapid increase in Rnet, explains the non-linear increase in energy available for melt.
This study examines the spatial variability in the non-linear relationship between summer near-surface air temperature and surface melt across Antarctic ice shelves, and aims to identify the key physical processes driving this non-linearity. To investigate this, we used the regional climate model RACMO to dynamically downscale ERA5 reanalysis data for historical simulations and two historical and future climate scenarios from ESM simulations. We find that the temperature sensitivity of the surface energy balance components are similar across all simulations, indicating that the ESM-forced simulations reliably reproduce the relevant physical processes and can therefore be used to extend the temperature and melt range beyond that of the historical RACMO(ERA5) simulation. Building on Trusel et al. (2015), who related summer near-surface air temperature to surface melt using an exponential fit, we extended the analysis by examining its spatial variability and physical drivers. We find that there is no single relation between temperature and melt, but that there are differences in the exponential relationship between ice shelves in dry versus wet climates. For the same summer average air temperature, dry ice shelves tend to experience more surface melt compared to wetter ones. While most ice shelves in drier climates are currently still cold and relatively stable with little melt, these ice shelves could experience rapid increases in melt under future warming. An example of a dry ice shelf that already experiences high melt rates is Amery Ice Shelf, where the largest amount of surface meltwater is observed from satellites in East Antarctica (Tuckett et al., 2025).
Several studies have proposed possible explanations for the non-linearity in melt sensitivity to temperature (Trusel et al., 2015; van Wessem et al., 2023). However, this is the first study to systematically assess the temperature sensitivity of SEB components and their contribution to surface melt across Antarctica. We find that the non-linear relationship is strongly related to the temperature dependency of net shortwave radiation. At lower temperatures, warming increases cloudiness and snowfall, reducing net shortwave radiation. As summer average air temperatures approach −12 °C, the metamorphism-albedo and snowmelt-albedo feedback become increasingly important, enhancing net shortwave radiation, particularly on dry ice shelves. This is consistent with Jakobs et al. (2021), who found that the snowmelt-albedo feedback begins to strengthen around −12 °C and peaks between −9 and −7 °C. At higher temperatures, additional albedo-lowering processes become important, including the transition from snowfall to rainfall and increasing exposure of bare ice. Rainfall can precondition the snowpack for enhanced melt through refreezing (Nicolas et al., 2017; Vignon et al., 2021), something already observed on the Greenland Ice Sheet (Doyle et al., 2015). In our simulations, mean annual rainfall over ice shelves increases by 4–7 mm over the 21st century, with the largest increase over the Antarctic Peninsula (15–40 mm increase) and West Antarctic ice shelves (15–20 mm increase). However, projected rainfall changes vary widely across CMIP6 models (Vignon et al., 2021), highlighting the need for improved observations and high-resolution modelling to assess the role of rainfall in enhancing melt and affecting ice shelf stability (Gilbert et al., 2025).
On wet ice shelves, changes in net longwave radiation with temperature drive melt more strongly than changes in net shortwave radiation, reflecting the effects of humidity and cloudiness. By contrast, on dry ice shelves, the temperature sensitivity of net longwave radiation is weak or even negative at higher temperatures, so it contributes little to enhanced melt. For average summer air temperatures below 0 °C, when some melt is already occurring, turbulent heat fluxes respond weakly or decrease slightly with warming, partially offsetting increases in net radiation. As temperatures approach 0 °C, both turbulent fluxes and longwave radiation increase strongly, providing additional energy for melt and amplifying the non-linear rise in melt with temperature. This happens because the surface temperature is constrained at the melting point, while air temperatures continue to rise. Such near-0 °C conditions are still relatively rare over Antarctic ice shelves, so the strong contribution of turbulent fluxes to melt is limited. By contrast, at the margins of the Greenland Ice Sheet, where average summer air temperatures are often positive, sensible heat flux exhibits strong temperature sensitivity and plays a major role in driving melt anomalies (Braithwaite and Olesen, 1990; Franco et al., 2013; van den Broeke et al., 2008; Wang et al., 2021). In many other regions of Greenland however, net shortwave radiation and albedo changes are also the dominant factors controlling melt sensitivity (Franco et al., 2013).
We show that melt sensitivity to temperature varies spatially across Antarctic ice shelves, due to regional differences in snowfall, surface albedo and cloud cover, which influence the dominant SEB components and their sensitivity to temperature. These findings suggest that using a uniform, temperature-only approach, such as a fixed degree-day factor in positive degree day modeling, oversimplifies melt prediction and misses important regional differences and feedbacks. For example, ice shelves in dry climates tend to experience more melt at a given air temperature than ice shelves in wetter climates, partly due to lower snowfall rates, which limits fresh snow accumulation, and enhances the snowmelt–albedo feedback. Therefore, spatially varying degree-day factors are needed to more accurately represent melt sensitivity in different climate regimes (Zheng et al., 2023). Alternatively, melt parameterizations could be improved by incorporating additional variables such as precipitation or albedo (Garbe et al., 2023), or by shifting toward fully resolved SEB formulations.
Our findings have important implications for understanding the vulnerability of Antarctic ice shelves to climate change. The higher melt rates for the same temperature on dry ice shelves suggests that these regions may be more sensitive to future warming than previously recognized, as earlier estimates did not account for regional differences in melt sensitivity. Not only their higher melt sensitivity, but also their lower snowfall rates mean they are more likely to reach the melt-over-accumulation (MOA) threshold of around 0.7 at which meltwater ponding and hydrofracture become possible (van Wessem et al., 2023; Donat-Magnin et al., 2021). A recent study based on satellite observations confirmed that these drier ice shelves in East Antarctica are more favorable for meltwater ponding compared to ice shelves in West Antarctica (Tuckett et al., 2025). Our findings support and extend on the study by van Wessem et al. (2023) and Veldhuijsen et al. (2024), emphasizing an underestimated risk of ice shelves in dry climates to contribute to Antarctic mass loss.
To illustrate that radiation penetration considerably alters the SEB, Fig. A1a compares the SEB over the Larsen C Ice Shelf as simulated by RACMO2.3p2, which does not account for solar radiation penetration, with the SEB from RACMO2.4p1 (Eq. 1). Because of penetration of solar radiation in RACMO2.4p1, the net shortwave radiation at the skin layer is smaller, and part of the radiation absorbed in the subsurface is resupplied as energy to the surface through QG. Because a large fraction of the melt occurs now as internal melt, QM,surf is smaller in RACMO2.4p1 compared to RACMO2.3p2. Figure A1b shows the pseudo-SEB of RACMO2.4p1 (Eq. 2), which is comparable to the SEB in RACMO2.3p2. QM is here the energy used for both surface and internal melt and agrees better with QM in RACMO2.3p2, which demonstrates that the pseudo-SEB approach is valid. Differences in the energy fluxes between the model versions also arise from differences in simulated near-surface climate, albedo (between Dec-Mar) as well as considerable year round changes in cloud cover leading to less downwelling longwave radiation (van Dalum et al., 2025), subsequently altering e.g. LWnet and SH.
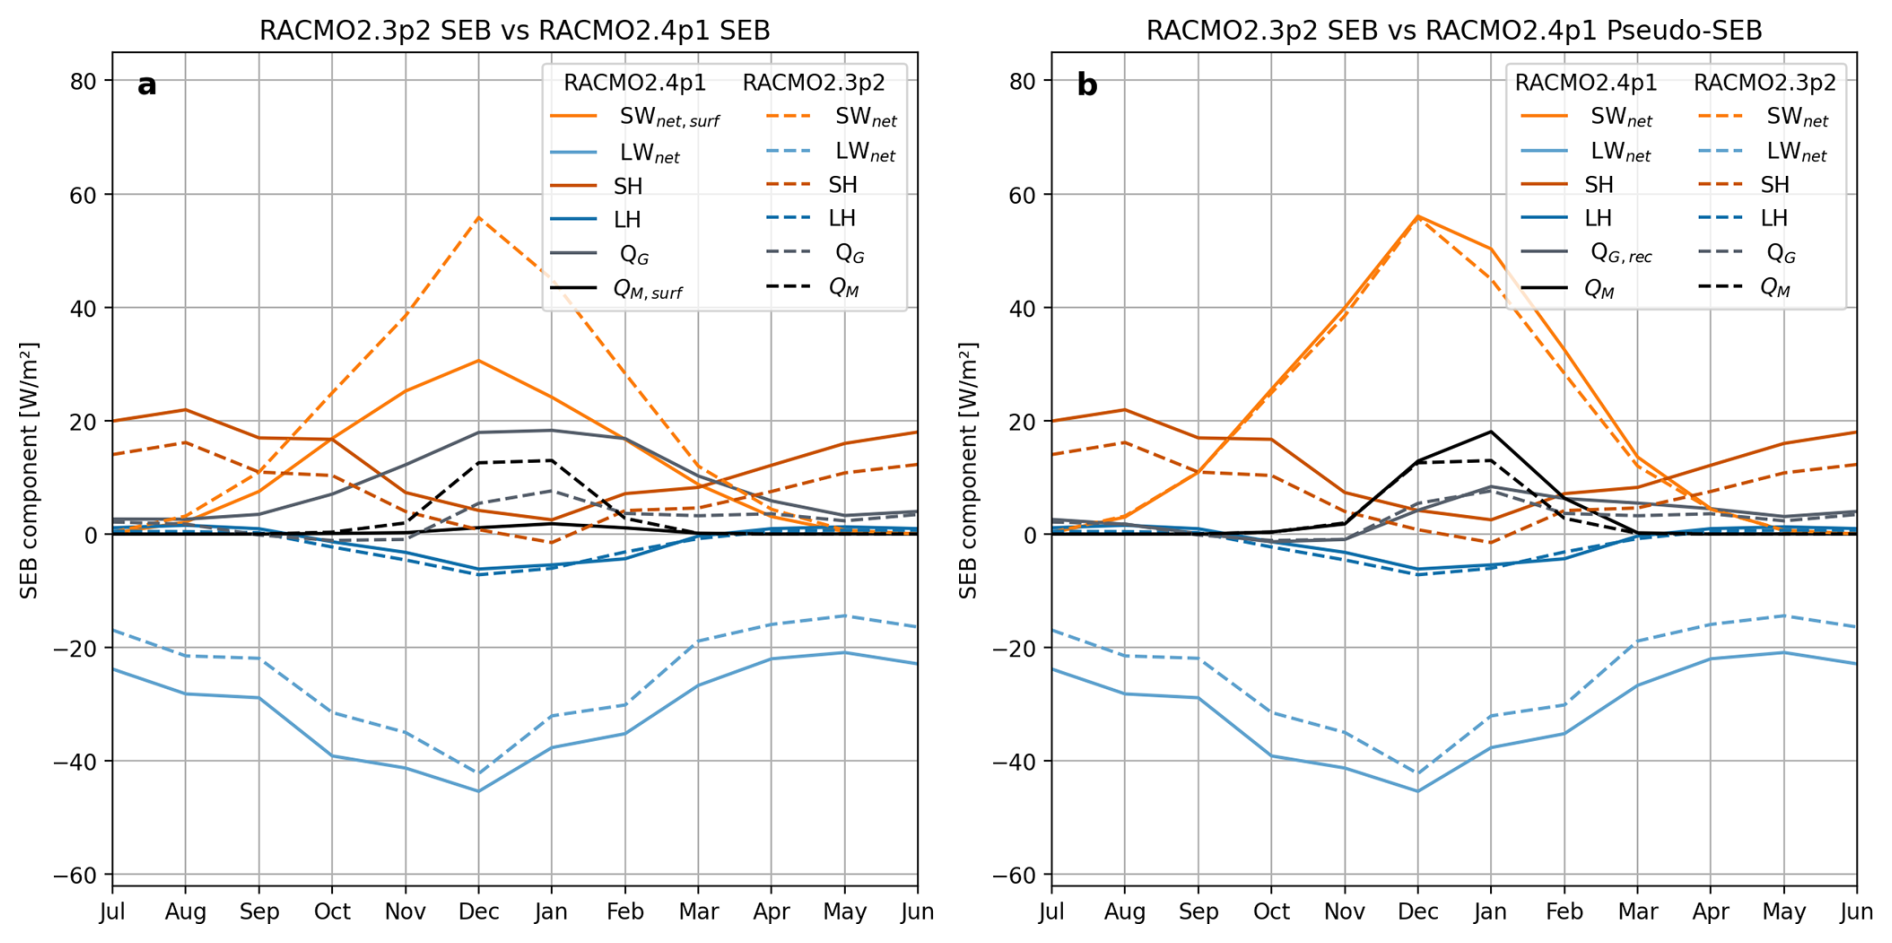
Figure A1Monthly mean surface energy balance (SEB) components from RACMO2.4p1 and RACMO2.3p2 for 2001–2016, spatially averaged over the Larsen C Ice Shelf. In (a) the SEB from RACMO2.4p1 (solid lines) is given as in Eq. (1) and in (b) the pseudo-SEB for RACMO2.4p1 (solid lines) is given as in Eq. (2). In both panels, RACMO2.3p2 estimates (dashed lines) are shown for comparison. The data are taken from van Dalum et al. (2024), as these simulations are on the exact same grid.
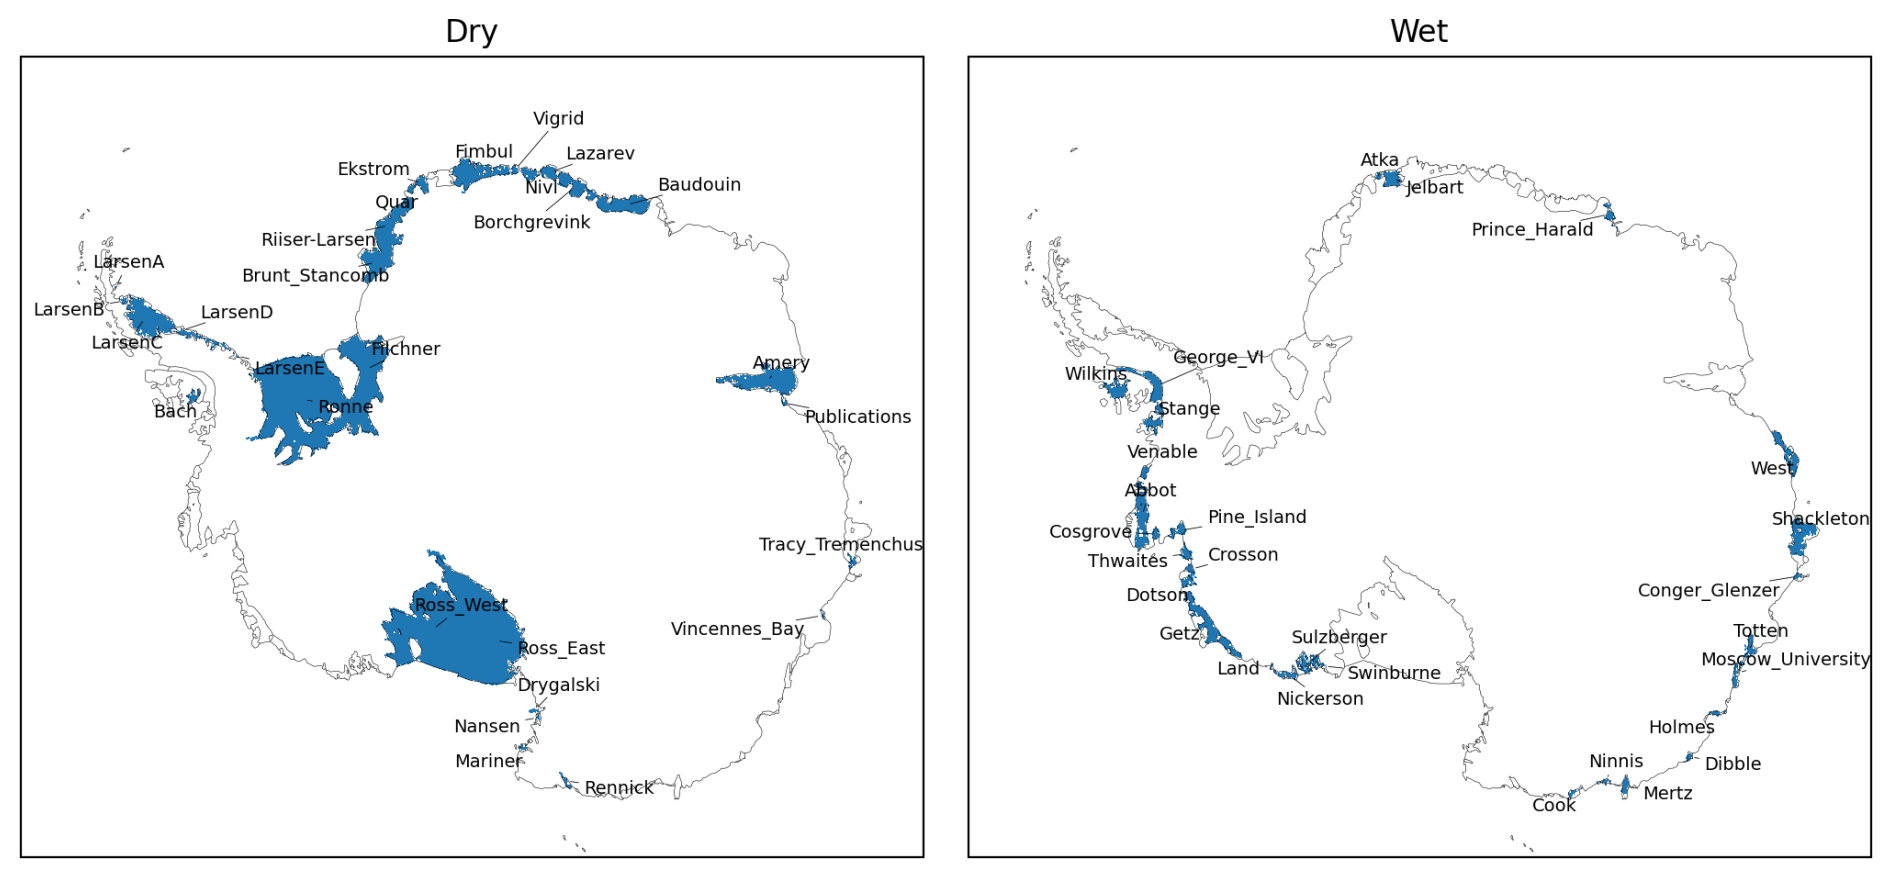
Figure B1Maps of Antarctic ice shelves classified into dry (left) and wet (right) climates, separated by the median snowfall threshold of ∼500 mm yr−1. Labels indicate the ice shelves within each category.
Table C1RACMO2.4p1 simulated summer averages (1985–2014) forced by ERA5, CESM2 and MPI-ESM. The table shows 30-year mean values and standard deviations for ice sheet average near-surface air temperature, surface energy balance [W m−2] and ice sheet integrated average summer totals of mass balance components [Gt per summer].
Monthly SMB components, SEB components and near-surface variables (e.g. temperature, windspeed, pressure) from RACMO2.4p1 simulations forced by ERA5, CESM2 and MPI-ESM are available at: https://doi.org/10.5281/zenodo.21991227 (Hofsteenge et al., 2026).
MGH led the conceptualization and analysis with guidance from WJvdB and MvdB. CvD and WJvdB developed this version of RACMO and, together with KV and MvT, performed the simulations and postprocessing. MGH prepared the manuscript with contributions from all co-authors.
At least one of the (co-)authors is a member of the editorial board of The Cryosphere. The peer-review process was guided by an independent editor, and the authors also have no other competing interests to declare.
Publisher's note: Copernicus Publications remains neutral with regard to jurisdictional claims made in the text, published maps, institutional affiliations, or any other geographical representation in this paper. The authors bear the ultimate responsibility for providing appropriate place names. Views expressed in the text are those of the authors and do not necessarily reflect the views of the publisher.
This publication was supported by PolarRES project, which received funding from the European Union's Horizon 2020 research and innovation programme call H2020-LC25 CLA-2018-2019-2020 under grant agreement number 101003590. This research was also supported by Ocean Cryosphere Exchanges in ANtarctica: Impacts on Climate and the Earth system, OCEAN ICE, which is funded by the European Union, Horizon Europe Funding Programme for research and innovation under grant agreement No. 101060452, https://doi.org/10.3030/101060452. This research is OCEAN ICE contribution number 35. MvdB is supported by EMBRACER (Summit grant SUMMIT.1.034) financed by the Netherlands Organization for Scientific Research (NWO). We acknowledge the ECMWF for storage facilities and computational time on their supercomputer.
This research has been supported by the European Commission, EU Horizon 2020 Framework Programme (grant nos. 101003590 and 101060452) and NWO (SUMMIT.1.034).
This paper was edited by Christian Haas and reviewed by Sammie Buzzard and two anonymous referees.
Abram, N. J., Mulvaney, R., Wolff, E. W., Triest, J., Kipfstuhl, S., Trusel, L. D., Vimeux, F., Fleet, L., and Arrowsmith, C.: Acceleration of snow melt in an Antarctic Peninsula ice core during the twentieth century, Nat. Geosci., 6, 404–411, 2013. a
Ambach, W.: Interpretation of the Positive-Degree-Days Factor by Heat Balance Characteristics-West Greenland, Nordic Hydrology, 19, 217–224, 1988. a
Bell, R. E., Banwell, A. F., Trusel, L. D., and Kingslake, J.: Antarctic surface hydrology and impacts on ice-sheet mass balance, Nat. Clim. Change, 8, 1044–1052, https://doi.org/10.1038/s41558-018-0326-3, 2018. a
Braithwaite, R. J. and Olesen, O. B.: Response of the Energy Balance on the Margin of the Greenland Ice Sheet to Temperature Changes, J. Glaciol., 36, 217–221, https://doi.org/10.3189/s0022143000009461, 1990. a, b
Carrasco, J. F., Bozkurt, D., and Cordero, R. R.: A review of the observed air temperature in the Antarctic Peninsula. Did the warming trend come back after the early 21st hiatus?, Polar Sci., 28, 100653, https://doi.org/10.1016/J.POLAR.2021.100653, 2021. a
Coulon, V., Klose, A. K., Kittel, C., Edwards, T., Turner, F., Winkelmann, R., and Pattyn, F.: Disentangling the drivers of future Antarctic ice loss with a historically calibrated ice-sheet model, The Cryosphere, 18, 653–681, https://doi.org/10.5194/tc-18-653-2024, 2024. a
DeConto, R. M., Pollard, D., Alley, R. B., Velicogna, I., Gasson, E., Gomez, N., Sadai, S., Condron, A., Gilford, D. M., Ashe, E. L., Kopp, R. E., Li, D., and Dutton, A.: The Paris Climate Agreement and future sea-level rise from Antarctica, Nature, 593, 83–89, https://doi.org/10.1038/s41586-021-03427-0, 2021. a
Di Biase, V., Kuipers Munneke, P., Wouters, B., van den Broeke, M. R., and van Tiggelen, M.: Estimating Antarctic surface melt rates using passive microwave data calibrated with weather station observations, The Cryosphere, 20, 87–96, https://doi.org/10.5194/tc-20-87-2026, 2026. a
Donat-Magnin, M., Jourdain, N. C., Kittel, C., Agosta, C., Amory, C., Gallée, H., Krinner, G., and Chekki, M.: Future surface mass balance and surface melt in the Amundsen sector of the West Antarctic Ice Sheet, The Cryosphere, 15, 571–593, https://doi.org/10.5194/tc-15-571-2021, 2021. a
Doyle, S. H., Hubbard, A., van de Wal, R. S., Box, J. E., van As, D., Scharrer, K., Meierbachtol, T. W., Smeets, P. C., Harper, J. T., Johansson, E., Mottram, R. H., Mikkelsen, A. B., Wilhelms, F., Patton, H., Christoffersen, P., and Hubbard, B.: Amplified melt and flow of the Greenland ice sheet driven by late-summer cyclonic rainfall, Nat. Geosci., 8, 647–653, https://doi.org/10.1038/NGEO2482, 2015. a
ECMWF: IFS Documentation CY47R1 – Part IV: Physical Processes, https://www.ecmwf.int/en/elibrary/81189-ifs-documentation-cy47r1-part-iv-physical-processes (last access: 24 August 2026), 2020. a, b
Elvidge, A. D., Kuipers Munneke, P., King, J. C., Renfrew, I. A., and Gilbert, E.: Atmospheric Drivers of Melt on Larsen C Ice Shelf: Surface Energy Budget Regimes and the Impact of Foehn, J. Geophys. Res.-Atmos., 125, https://doi.org/10.1029/2020JD032463, 2020. a
Franco, B., Fettweis, X., and Erpicum, M.: Future projections of the Greenland ice sheet energy balance driving the surface melt, The Cryosphere, 7, 1–18, https://doi.org/10.5194/tc-7-1-2013, 2013. a, b
Fürst, J. J., Durand, G., Gillet-Chaulet, F., Tavard, L., Rankl, M., Braun, M., and Gagliardini, O.: The safety band of Antarctic ice shelves, Nat. Clim. Change, 6, 479–482, 2016. a
Gadde, S. and van de Berg, W. J.: Contribution of blowing-snow sublimation to the surface mass balance of Antarctica, The Cryosphere, 18, 4933–4953, https://doi.org/10.5194/tc-18-4933-2024, 2024. a
Garbe, J., Zeitz, M., Krebs-Kanzow, U., and Winkelmann, R.: The evolution of future Antarctic surface melt using PISM-dEBM-simple, The Cryosphere, 17, 4571–4599, https://doi.org/10.5194/tc-17-4571-2023, 2023. a
Gardner, A. S. and Sharp, M. J.: A review of snow and ice albedo and the development of a new physically based broadband albedo parameterization, J. Geophys. Res.-Earth Surf., 115, 1009, https://doi.org/10.1029/2009JF001444, 2010. a
Gilbert, E. and Kittel, C.: Surface Melt and Runoff on Antarctic Ice Shelves at 1.5 °C, 2 °C, and 4 °C of Future Warming, Geophys. Res. Lett., 48, https://doi.org/10.1029/2020GL091733, 2021. a
Gilbert, E., Orr, A., Renfrew, I. A., King, J. C., and Lachlan-Cope, T.: A 20-Year Study of Melt Processes Over Larsen C Ice Shelf Using a High-Resolution Regional Atmospheric Model: 2. Drivers of Surface Melting, J. Geophys. Res.-Atmos., 127, https://doi.org/10.1029/2021JD036012, 2022. a
Gilbert, E., Pishniak, D., Torres, J. A., Orr, A., Maclennan, M., Wever, N., and Verro, K.: Extreme precipitation associated with atmospheric rivers over West Antarctic ice shelves: insights from kilometre-scale regional climate modelling, The Cryosphere, 19, 597–618, https://doi.org/10.5194/tc-19-597-2025, 2025. a
Gilbert, E., Torres-Alavez, J. A., Hofsteenge, M. G., van de Berg, W. J., Boberg, F., Christensen, O. B., van Dalum, C. T., Fettweis, X., Gumber, S., Hansen, N., Kittel, C., Lambin, C., Maure, D., Mottram, R., Olesen, M., Orr, A., Phillips, T., van Tiggelen, M., Verro, K., and Mooney, P. A.: The PolarRES dataset: a state-of-the-art regional climate model ensemble for understanding Antarctic climate, The Cryosphere, 20, 2629–2658, https://doi.org/10.5194/tc-20-2629-2026, 2026. a
Golledge, N. R., Keller, E. D., Gomez, N., Naughten, K. A., Bernales, J., Trusel, L. D., and Edwards, T. L.: Global environmental consequences of twenty-first-century ice-sheet melt, Nature, 566, 65–72, https://doi.org/10.1038/s41586-019-0889-9, 2019. a
Hersbach, H., Bell, B., Simmons, A., Berrisford, P., Dahlgren, P., Horányi, A., Muñoz-Sabater, J., Nicolas, J., Radu, R., Schepers, D., Soci, C., Villaume, S., Bidlot, J. R., Haimberger, L., Woollen, J., Buontempo, C., and Thépaut, J. N.: Complete ERA5 from 1940: Fifth generation of ECMWF atmospheric reanalyses of the global climate, Copernicus Climate Change Service (C3S) Data Store (CDS) [data set], https://doi.org/10.24381/cds.143582cf, 2017. a
Hofsteenge, M. G., Cullen, N. J., Conway, J. P., Reijmer, C. H., Van Den Broeke, M. R., and Katurji, M.: Meteorological drivers of melt at two nearby glaciers in the McMurdo Dry Valleys of Antarctica, J. Glaciol., 70, e48, https://doi.org/10.1017/jog.2023.98, 2023. a
Hofsteenge, M., van de Berg, W. J., van Dalum, C. T., Verro, K., Van Tiggelen, M., and van den Broeke, M. R.: Monthly RACMO2.4p1 data for Antarctica (11 km) forced with ERA5 (1979–2023), CESM2 (1985–2100) and MPI-ESM (1985–2100), Zenodo [data set], https://doi.org/10.5281/zenodo.21991227, 2026. a
Jakobs, C. L., Reijmer, C. H., Kuipers Munneke, P., König-Langlo, G., and van den Broeke, M. R.: Quantifying the snowmelt–albedo feedback at Neumayer Station, East Antarctica, The Cryosphere, 13, 1473–1485, https://doi.org/10.5194/tc-13-1473-2019, 2019. a, b, c
Jakobs, C. L., Reijmer, C. H., Smeets, C. J., Trusel, L. D., Van De Berg, W. J., Van Den Broeke, M. R., and Van Wessem, J. M.: A benchmark dataset of in situ Antarctic surface melt rates and energy balance, J. Glaciol., 66, 291–302, https://doi.org/10.1017/JOG.2020.6, 2020. a
Jakobs, C. L., Reijmer, C. H., van den Broeke, M. R., van de Berg, W. J., and van Wessem, J. M.: Spatial Variability of the Snowmelt-Albedo Feedback in Antarctica, J. Geophys. Res.-Earth Surf., 126, https://doi.org/10.1029/2020JF005696, 2021. a, b, c, d, e
Kingslake, J., Ely, J. C., Das, I., and Bell, R. E.: Widespread movement of meltwater onto and across Antarctic ice shelves, Nature, 544, 349–352, https://doi.org/10.1038/nature22049, 2017. a
Kittel, C., Amory, C., Agosta, C., Jourdain, N. C., Hofer, S., Delhasse, A., Doutreloup, S., Huot, P.-V., Lang, C., Fichefet, T., and Fettweis, X.: Diverging future surface mass balance between the Antarctic ice shelves and grounded ice sheet, The Cryosphere, 15, 1215–1236, https://doi.org/10.5194/tc-15-1215-2021, 2021. a, b
Kuipers Munneke, P., Ligtenberg, S. R., van den Broeke, M. R., and Vaughan, D. G.: Firn air depletion as a precursor of Antarctic ice-shelf collapse, J. Glaciol., 60, 205–214, https://doi.org/10.3189/2014JoG13J183, 2014. a, b
Lai, C. Y., Kingslake, J., Wearing, M. G., Chen, P. H. C., Gentine, P., Li, H., Spergel, J. J., and van Wessem, J. M.: Vulnerability of Antarctica’s ice shelves to meltwater-driven fracture, Nature, 584, 574–578, 2020. a
Ligtenberg, S. R., van de Berg, W. J., van den Broeke, M. R., Rae, J. G., and van Meijgaard, E.: Future surface mass balance of the Antarctic ice sheet and its influence on sea level change, simulated by a regional atmospheric climate model, Clim. Dynam., 41, 867–884, https://doi.org/10.1007/S00382-013-1749-1, 2013. a
Morlighem, M., Rignot, E., Binder, T., Blankenship, D., Drews, R., Eagles, G., Eisen, O., Ferraccioli, F., Forsberg, R., Fretwell, P., Goel, V., Greenbaum, J. S., Gudmundsson, H., Guo, J., Helm, V., Hofstede, C., Howat, I., Humbert, A., Jokat, W., Karlsson, N. B., Lee, W. S., Matsuoka, K., Millan, R., Mouginot, J., Paden, J., Pattyn, F., Roberts, J., Rosier, S., Ruppel, A., Seroussi, H., Smith, E. C., Steinhage, D., Sun, B., Broeke, M. R. d., Ommen, T. D., Wessem, M. V., and Young, D. A.: Deep glacial troughs and stabilizing ridges unveiled beneath the margins of the Antarctic ice sheet, Nat. Geosci., 13, 132–137, https://doi.org/10.1038/S41561-019-0510-8, 2020. a
Nicolas, J. P., Vogelmann, A. M., Scott, R. C., Wilson, A. B., Cadeddu, M. P., Bromwich, D. H., Verlinde, J., Lubin, D., Russell, L. M., Jenkinson, C., Powers, H. H., Ryczek, M., Stone, G., and Wille, J. D.: January 2016 extensive summer melt in West Antarctica favoured by strong El Niño, Nat. Commun., 8, 1–10, https://doi.org/10.1038/NCOMMS15799, 2017. a
Ohmura, A.: Physical Basis for the Temperature-Based Melt-Index Method, J. Appl. Meteorol. Climatol., 40, 753–761, https://doi.org/10.1175/1520-0450(2001)040<0753:PBFTTB>2.0.CO;2, 2001. a
Orr, A., Deb, P., Clem, K. R., Gilbert, E., Bromwich, D. H., Boberg, F., Colwell, S., Hansen, N., Lazzara, M. A., Mooney, P. A., Mottram, R., Niwano, M., Phillips, T., Pishniak, D., Reijmer, C. H., van de Berg, W. J., Webster, S., and Zou, X.: Characteristics of Surface “Melt Potential” over Antarctic Ice Shelves based on Regional Atmospheric Model Simulations of Summer Air Temperature Extremes from 1979/80 to 2018/19, J. Climate, 36, 3357–3383, https://doi.org/10.1175/JCLI-D-22-0386.1, 2023. a
Picard, G., Domine, F., Krinner, G., Arnaud, L., and Lefebvre, E.: Inhibition of the positive snow-albedo feedback by precipitation in interior Antarctica, Nat. Clim. Change, 2, 795–798, https://doi.org/10.1038/NCLIMATE1590, 2012. a
Scambos, T. A., Hulbe, C., Fahnestock, M., and Bohlander, J.: The link between climate warming and break-up of ice shelves in the Antarctic Peninsula, J. Glaciol., 46, 516–530, https://doi.org/10.3189/172756500781833043, 2000. a
Seroussi, H., Nowicki, S., Payne, A. J., Goelzer, H., Lipscomb, W. H., Abe-Ouchi, A., Agosta, C., Albrecht, T., Asay-Davis, X., Barthel, A., Calov, R., Cullather, R., Dumas, C., Galton-Fenzi, B. K., Gladstone, R., Golledge, N. R., Gregory, J. M., Greve, R., Hattermann, T., Hoffman, M. J., Humbert, A., Huybrechts, P., Jourdain, N. C., Kleiner, T., Larour, E., Leguy, G. R., Lowry, D. P., Little, C. M., Morlighem, M., Pattyn, F., Pelle, T., Price, S. F., Quiquet, A., Reese, R., Schlegel, N.-J., Shepherd, A., Simon, E., Smith, R. S., Straneo, F., Sun, S., Trusel, L. D., Van Breedam, J., van de Wal, R. S. W., Winkelmann, R., Zhao, C., Zhang, T., and Zwinger, T.: ISMIP6 Antarctica: a multi-model ensemble of the Antarctic ice sheet evolution over the 21st century, The Cryosphere, 14, 3033–3070, https://doi.org/10.5194/tc-14-3033-2020, 2020. a
Taillandier, A. S., Domine, F., Simpson, W. R., Sturm, M., and Douglas, T. A.: Rate of decrease of the specific surface area of dry snow: Isothermal and temperature gradient conditions, J. Geophys. Res.-Earth Surf., 112, 3003, https://doi.org/10.1029/2006JF000514, 2007. a
Trusel, L. D., Frey, K. E., Das, S. B., Karnauskas, K. B., Kuipers Munneke, P., Van Meijgaard, E., and Van Den Broeke, M. R.: Divergent trajectories of Antarctic surface melt under two twenty-first-century climate scenarios, Nat. Geosci., 8, 927–932, https://doi.org/10.1038/ngeo2563, 2015. a, b, c, d, e, f, g
Tuckett, P. A., Sole, A. J., Livingstone, S. J., Jones, J. M., Lea, J. M., and Gilbert, E.: Continent-wide mapping shows increasing sensitivity of East Antarctica to meltwater ponding, Nat. Clim. Change, https://doi.org/10.1038/s41558-025-02363-5, 2025. a, b
Turner, J., Lu, H., White, I., King, J. C., Phillips, T., Hosking, J. S., Bracegirdle, T. J., Marshall, G. J., Mulvaney, R., and Deb, P.: Absence of 21st century warming on Antarctic Peninsula consistent with natural variability, Nature, 535, 411–415, https://doi.org/10.1038/nature18645, 2016. a
Undén, P., Rontu, L., Jarvinen, H., Lynch, P., Calvo Sánchez, F., Cats, G., Cuxart, J., Eerola, K., Fortelius, C., García-Moya, J., and Jones, C.: HIRLAM-5 scientific documentation, Tech. rep., https://www.researchgate.net/publication/278962772 (last access: 24 August 2026), 2002. a
van Dalum, C. T., van de Berg, W. J., Lhermitte, S., and van den Broeke, M. R.: Evaluation of a new snow albedo scheme for the Greenland ice sheet in the Regional Atmospheric Climate Model (RACMO2), The Cryosphere, 14, 3645–3662, https://doi.org/10.5194/tc-14-3645-2020, 2020. a
van Dalum, C. T., van de Berg, W. J., and van den Broeke, M. R.: Sensitivity of Antarctic surface climate to a new spectral snow albedo and radiative transfer scheme in RACMO2.3p3, The Cryosphere, 16, 1071–1089, https://doi.org/10.5194/tc-16-1071-2022, 2022. a
van Dalum, C. T., van de Berg, W. J., Gadde, S. N., van Tiggelen, M., van der Drift, T., van Meijgaard, E., van Ulft, L. H., and van den Broeke, M. R.: First results of the polar regional climate model RACMO2.4, The Cryosphere, 18, 4065–4088, https://doi.org/10.5194/tc-18-4065-2024, 2024. a, b, c
van Dalum, C. T., van de Berg, W. J., van den Broeke, M. R., and van Tiggelen, M.: The surface mass balance and near-surface climate of the Antarctic ice sheet in RACMO2.4p1, The Cryosphere, 19, 4061–4090, https://doi.org/10.5194/tc-19-4061-2025, 2025. a, b, c, d
van de Berg, W. J. and Medley, B.: Brief Communication: Upper-air relaxation in RACMO2 significantly improves modelled interannual surface mass balance variability in Antarctica, The Cryosphere, 10, 459–463, https://doi.org/10.5194/tc-10-459-2016, 2016. a
van den Broeke, M.: Strong surface melting preceded collapse of Antarctic Peninsula ice shelf, Geophys. Res. Lett., 32, 1–4, https://doi.org/10.1029/2005GL023247, 2005. a
van den Broeke, M., Smeets, P., Ettema, J., van der Veen, C., van de Wal, R., and Oerlemans, J.: Partitioning of melt energy and meltwater fluxes in the ablation zone of the west Greenland ice sheet, The Cryosphere, 2, 179–189, https://doi.org/10.5194/tc-2-179-2008, 2008. a
van den Broeke, M. R., Kuipers Munneke, P., Noël, B., Reijmer, C., Smeets, P., van de Berg, W. J., and van Wessem, J. M.: Contrasting current and future surface melt rates on the ice sheets of Greenland and Antarctica: Lessons from in situ observations and climate models, PLOS Climate, 2, https://doi.org/10.1371/journal.pclm.0000203, 2023. a
van Wessem, J. M., Ligtenberg, S. R. M., Reijmer, C. H., van de Berg, W. J., van den Broeke, M. R., Barrand, N. E., Thomas, E. R., Turner, J., Wuite, J., Scambos, T. A., and van Meijgaard, E.: The modelled surface mass balance of the Antarctic Peninsula at 5.5 km horizontal resolution, The Cryosphere, 10, 271–285, https://doi.org/10.5194/tc-10-271-2016, 2016. a
van Wessem, J. M., van den Broeke, M. R., Wouters, B., and Lhermitte, S.: Variable temperature thresholds of melt pond formation on Antarctic ice shelves, Nat. Clim. Change, 13, 161–166, https://doi.org/10.1038/s41558-022-01577-1, 2023. a, b, c, d, e, f, g
Vaughan, D. G.: Recent Trends in Melting Conditions on the Antarctic Peninsula and Their Implications for Ice-sheet Mass Balance and Sea Level, Arct. Antarct. Alp. Res., 38, 147–152, https://doi.org/10.1657/1523-0430(2006)038[0147:RTIMCO]2.0.CO;2, 2006. a
Veldhuijsen, S. B. M., van de Berg, W. J., Kuipers Munneke, P., and van den Broeke, M. R.: Firn air content changes on Antarctic ice shelves under three future warming scenarios, The Cryosphere, 18, 1983–1999, https://doi.org/10.5194/tc-18-1983-2024, 2024. a
Vignon, Roussel, M. L., Gorodetskaya, I. V., Genthon, C., and Berne, A.: Present and Future of Rainfall in Antarctica, Geophys. Res. Lett., 48, e2020GL092281, https://doi.org/10.1029/2020GL092281, 2021. a, b
Wang, W., Zender, C. S., van As, D., Fausto, R. S., and Laffin, M. K.: Greenland Surface Melt Dominated by Solar and Sensible Heating, Geophys. Res. Lett., 48, e2020GL090653, https://doi.org/10.1029/2020GL090653, 2021. a
Williams, R. S., Marshall, G. J., Levine, X., Graff, L. S., Handorf, D., Johnston, N. M., Karpechko, A. Y., Andrew, O. R., van de Berg, W. J., Wijngaard, R. R., and Mooney, P. A.: Future Antarctic Climate: Storylines of Midlatitude Jet Strengthening and Shift Emergent from CMIP6, J. Climate, 37, 2157–2178, https://doi.org/10.1175/JCLI-D-23-0122.1, 2024. a, b
Zheng, L., Shang, X., van den Broeke, M. R., Noël, B., Li, X., Fettweis, X., Liang, Q., Wang, K., Liu, J., and Cheng, X.: Rapid increases in satellite-observed ice sheet surface meltwater production, Nat. Clim. Change, 15, 769–774, https://doi.org/10.1038/s41558-025-02364-4, 2025. a
Zheng, Y., Golledge, N. R., Gossart, A., Picard, G., and Leduc-Leballeur, M.: Statistically parameterizing and evaluating a positive degree-day model to estimate surface melt in Antarctica from 1979 to 2022, The Cryosphere, 17, 3667–3694, https://doi.org/10.5194/tc-17-3667-2023, 2023. a, b, c
- Abstract
- Introduction
- Methods
- Results
- Discussion and conclusions
- Appendix A: Demonstration of the pseudo-SEB approach
- Appendix B: Map of dry and wet ice shelves
- Appendix C: Evaluation of RACMO historical simulations with ESM forcings
- Data availability
- Author contributions
- Competing interests
- Disclaimer
- Acknowledgements
- Financial support
- Review statement
- References
- Abstract
- Introduction
- Methods
- Results
- Discussion and conclusions
- Appendix A: Demonstration of the pseudo-SEB approach
- Appendix B: Map of dry and wet ice shelves
- Appendix C: Evaluation of RACMO historical simulations with ESM forcings
- Data availability
- Author contributions
- Competing interests
- Disclaimer
- Acknowledgements
- Financial support
- Review statement
- References