
the Creative Commons Attribution 4.0 License.
the Creative Commons Attribution 4.0 License.
 | 13 Aug 2026
Experimental investigation of the direct shear strength parameters of compacted snow
Haifeng Huo
Hui Xu
Jixiu Wu
Tao Li
Jingjin Liu
Enzhao Xiao
Xueyuan Tang
Compacted snow is utilized as a building material in various construction and engineering applications across global high-latitude regions. For the safety assessment of snow and ice structures in cold regions, cohesion and internal friction angle are key shear strength parameters for compacted snow. Direct shear tests were carried out on low-density natural snow and high-density artificial snow in a −10 °C cold laboratory. In total, 112 test conditions were designed to quantify the effects of initial density, sintering time and sintering temperature on shear strength parameters at normal stresses below 100 kPa. Results show that under high sintering degree conditions and low normal pressures, the shear stress–displacement curve tends to exhibit strain softening. As initial density increases from 300 to 650 kg m−3, both cohesion and internal friction angle increase linearly. With sintering time increasing from 0 to 60 d, cohesion first rises and then falls, while the internal friction angle steadily decreases. As sintering temperature decreases from −5 to −25 °C, cohesion decreases, whereas the internal friction angle increases slightly. A Genetic Algorithm-Back Propagation (GA-BP) neural network was utilized to construct a shear strength prediction model, taking density, sintering time, sintering temperature, and normal stress as inputs, and offering benchmark values for cohesion and internal friction angle under various conditions. These benchmarks can be adaptively adjusted when additional influencing factors require consideration. This study provides essential strength parameters for the design and construction of compacted snow structures and offers a framework for accounting for the influence of other factors on these parameters.
- Article
(13698 KB) - Full-text XML
- BibTeX
- EndNote


Compacted snow is utilized as a building material for infrastructure in high-latitude regions, including runways and pavement structures, etc. (Ager, 1960; Putkisto, 1959; Sun et al., 2021). In assessing the safety of compacted snow layers, shear strength is a critical mechanical indicator (Abele and Frankenstein, 1967; McClung, 1979), which is significantly influenced by environmental and construction factors. In engineering applications, snow is usually compacted and sintered to enhance the strength of snow layers (Sun et al., 2021). Compaction increases snow density, thereby enhancing its frictional strength (Li et al., 2024). Large sintering times promote the formation of bonds among ice particles (Colbeck, 1983b; Wei et al., 2024; Demmenie et al., 2025), which improves intergranular bonding strength (Hong et al., 2022; Wei et al., 2024). Additionally, lower temperatures slow down the sintering process (Abele, 1990); consequently, the temperature of the snow is often raised to accelerate sintering and rapidly attain the target engineering strength (White et al., 2023). Furthermore, initial density, sintering time, and sintering temperature are known to significantly affect the strength development of compacted snow (Sun et al., 2021).
Previous studies have primarily examined the variation patterns of shear strength under different influencing factors through laboratory and field experiments. Butkovich (1958) and Ballard et al. (1965) investigated the relationship between shear strength and density, finding that shear strength increases exponentially with density. Snow with a higher degree of sintering exhibits greater shear strength (Ballard et al., 1965; Podolskiy et al., 2014), and the rate of this process is largely controlled by temperature – higher sintering temperatures accelerate sintering and lead to a rapid increase in strength over a short period (Abele, 1990). Conversely, higher shearing temperatures reduce the shear strength of snow (Ballard et al., 1965; Schweizer, 1998; Perla et al., 1982). Shear strength is also influenced by snow particle morphology (De Biagi et al., 2019), with different snow types showing varying strengths. For example, depth hoar (Perla et al., 1982; Keeler and Weeks, 1968; Fukuzawa and Narita, 1993) and graupel (Abe, 2004) possess lower shear strength compared to fresh snow, while wet snow exhibits lower shear strength than dry snow (Yamano and Endo, 2002). Shear rate strongly influences snow strength and failure modes. Shear strength initially increases, then subsequently decreases rapidly with the transition from ductile to brittle (McClung, 1977; De Montmollin, 1982; Puzrin et al., 2019). De Montmollin (1982) examined the effect of shear rate on snow failure and categorized the failure modes, showing that in the medium-to-high shear rate regime, both shear strength and residual stress after brittle failure decrease with increasing shear rate.
Numerous studies have focused on the development of shear strength testing devices and methods (Barbero et al., 2016; Nakamura et al., 2010). The shear frame, a device specifically designed to measure the shear strength of snow under static loads, is widely used due to its convenient operation (Abe, 2004; Fohn and Camponovo, 1997; Jamieson and Johnston, 2001; Perla et al., 1982). However, the shear frame exhibits significant variability in sample measurement, making it difficult to achieve high precision. To address this limitation, Barbero et al. (2016) developed an in-situ direct shear testing apparatus that integrates sampling and shearing functions, enabling the retrieval of nearly undisturbed snow specimens and allowing accurate control and monitoring of normal and shear stresses via a pneumatic system. Reiweger et al. (2010) designed a laboratory loading device capable of tilting snow samples to simulate actual slope angles; this device applies incremental weights to replicate snow overburden loading and can be coupled with particle image velocimetry for local strain analysis and acoustic emission monitoring to trace damage evolution. Podolskiy et al. (2013) developed a portable shear loading apparatus that enables shearing along a predefined weak interface; by sintering two snow blocks and shearing at the bonded interface, the apparatus can be adopted to quantify the contribution of sintering to snow shear strength.
Previous snow avalanche studies have mainly focused on low-density natural snow (McClung, 1977; Schweizer, 1998), whereas engineering-oriented investigations have concentrated on compacted or artificially modified snow (Sun et al., 2021; White and McCallum, 2020; White et al., 2023). Although the shear strength of snow has been widely investigated, few studies have quantitatively examined the key strength parameters critical for engineering assessment, namely cohesion and internal friction angle. Accordingly, this study performed direct shear tests on natural snow with densities ranging from 300 to 400 kg m−3 and artificial snow with densities ranging from 300 to 650 kg m−3. A total of 112 test conditions were designed considering the coupled effects of initial density, sintering time, and sintering temperature, and systematic direct shear tests were carried out on compacted snow specimens. Based on the shear stress–displacement curves, shear strength was defined as the peak shear stress for strain-softening responses and as the shear stress at a shear displacement of 4 mm for strain-hardening responses. The cohesion c and internal friction angle φ were then determined in accordance with the Mohr–Coulomb linear criterion, and their magnitudes and variation characteristics under different influencing factors were analyzed. A Genetic Algorithm-Back Propagation (GA-BP) neural network was employed to establish a predictive model for shear strength parameters under multi-factor coupling conditions, thereby providing benchmark values for c and φ under various combinations of influencing factors. The findings of this study provide both theoretical insight and experimental data to support the design and construction of ice and snow engineering projects.
2.1 Snow Production and Sample Preparation
In this study, two types of snow materials were employed, namely natural snow and machine-made snow. Natural snow was harvested from the snowpack in Urumqi, Xinjiang, China, and was used to fabricate low-density specimens. Machine-made snow was artificially produced to prepare high-density specimens, which was generated via atomization, cooling, and crystallization processes, closely replicating the natural snow formation mechanism (Dong et al., 2023). During snow production, a high-pressure pump within the snowmaking machine pressurized water to 6 MPa, and the pressurized water was subsequently atomized into fine droplets through a custom-designed nozzle (Kang et al., 2018; Vijay et al., 2015). These droplets were transported by a high-velocity fan over a specified distance. At sub-zero temperatures, the droplets cooled rapidly upon contact with ambient air, forming ice nuclei that subsequently adsorbed surrounding water vapor to generate snow particles.
The environmental parameters for outdoor snow production were controlled as follows: temperature of −5 °C, relative humidity of 30 %, wind speed of 6 to 7 m s−1, snowmaking machine elevation angle of 45°, and spraying distance of 10 m. After collection, both machine-made snow and natural snow were immediately transported to a cold storage chamber with a temperature of −10 °C and relative humidity of 60 % for prompt specimen preparation. Both snow types exhibited comparable physical properties. The initial density of natural snow was approximately 200 kg m−3, whereas that of machine-made snow was around 300 kg m−3. Following the classification by Barrett et al. (2012), the snow crystals were plate-like, with particle sizes ranging approximately from 0.5 to 1.5 mm.
The preparation process included the following steps:
-
Compaction: A cylindrical ring formwork with an inner diameter of 61.8 mm and height of 20 mm was adopted for specimen preparation. Based on the target initial density ranging from 300 to 650 kg m−3 and the fixed volume of the formwork, the required mass of snow for each specimen was calculated and pre-weighed using an electronic balance with an accuracy of 0.01 g, and the mass error was controlled within ±0.05 g. The snow was uniformly layered into the ring formwork, and compaction was conducted after each layer using a custom-made cylindrical tool (with a diameter slightly smaller than the formwork) to ensure homogeneous stress distribution. The compaction force was applied manually at a slow and constant rate until the specimen surface was level with the top of the ring formwork. During compaction, snow grains were partially fractured to generate finer particles that filled intergranular voids, thereby increasing the specimen density. Any specimen with visible cracks or surface irregularities was discarded and re-prepared. At least three parallel specimens were prepared for each test condition, and all compaction procedures were performed in a −10 °C cold chamber. The prepared compacted specimen is presented in Fig. 1a.
-
Sintering: to simulate the natural sintering environment, a sealing membrane was placed over the compacted specimen while it remained inside the ring formwork. Uniform snowflakes were then distributed around the specimen and across the membrane to replicate the in-situ conditions within a natural snowpack. The surrounding snowflakes mitigated rapid sublimation from exposed surfaces, whereas the membrane isolated the specimen from the overlying snow, thus preventing unintended sintering bonding between the specimen and external snow. The entire assembly was subsequently placed in a temperature-controlled test chamber and sintered at the prescribed temperature for the designated duration. Specimens covered with sealing membranes are shown in Fig. 1b, and snowflakes deposited on the specimens and membranes are presented in Fig. 1c.
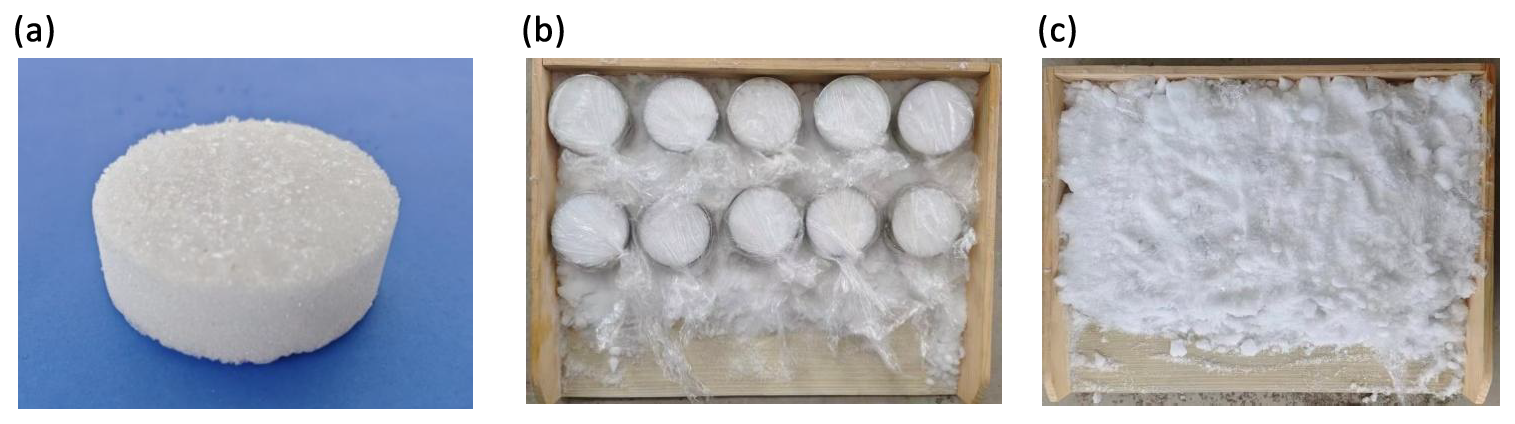
Figure 1Sample preparation process (a, compacted specimen; b, samples covered with membranes; c, sprinkling snowflakes).
2.2 Test Equipment
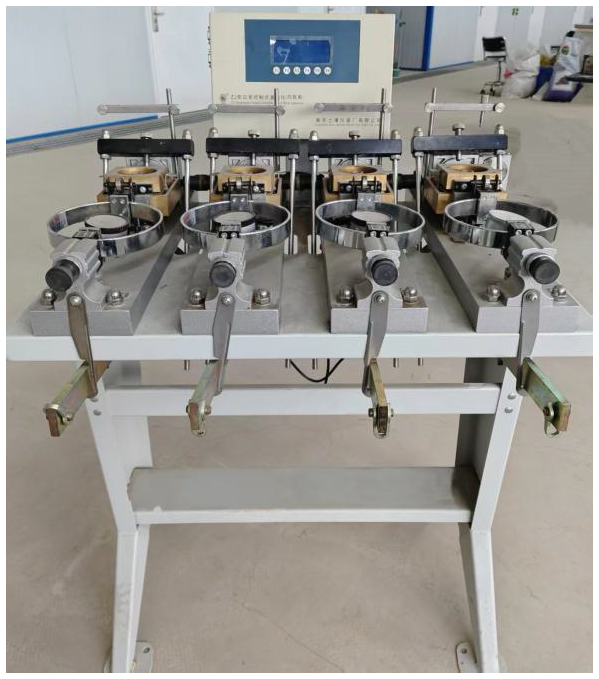
Direct shear equipment used in the test is shown in Fig. 2. The shear box holds cylindrical snow samples with a diameter of 61.8 mm and a height of 20 mm. Normal stress was imposed through a standard weight and lever mechanism, whereas the horizontal shear load was driven by a motor at a constant displacement rate. The device is capable of shearing four samples simultaneously, with a controllable shear rate ranging from 0 to 2.4 mm min−1.
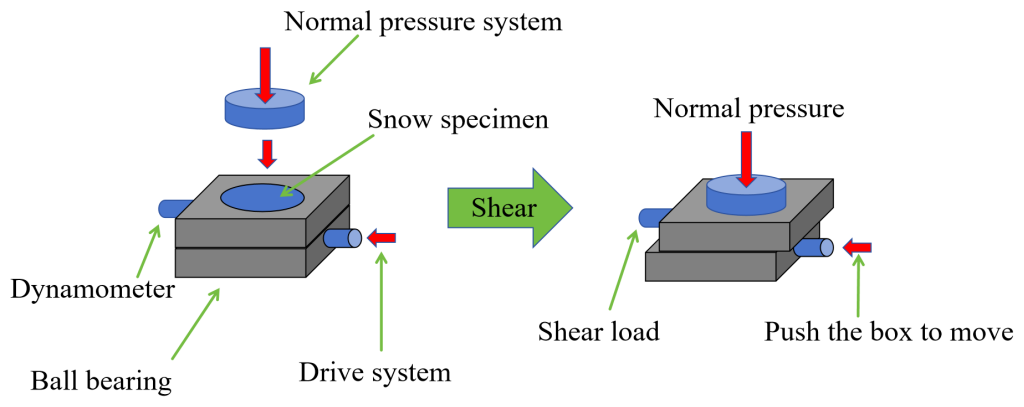
The shearing process of the snow specimen is illustrated in Fig. 3. The normal stress system is connected to a lever and weights, while the drive system is linked to an electric motor. The shear box comprises upper and lower sections, with the specimen placed inside. During shearing, the upper box remains stationary, and the lower box equipped with ball bearings at its base, undergoes horizontal displacement via the drive system. A dynamometer is installed on the upper shear box. The shear plane is determined by the interface between the upper and lower shear boxes; no artificial weak plane is prefabricated in the specimen, and shear failure occurs naturally as the lower box moves horizontally relative to the upper box.
2.3 Test Procedure
Shearing rate directly influences the failure mode and strength characteristics of construction materials in both soil and snow-ice materials. Figure 4 (redrawn from Puzrin et al., 2019) shows that the shear strength of snow first increases and then decreases with increasing shear strain rate, and the shear strength parameters also vary accordingly. From the perspective of engineering design, however, site investigation reports must provide quantitative characteristic values of strength parameters as a basis for structural design. Chinese Geotechnical Testing Standard (GB/T 50123; Ministry of Housing and Urban-Rural Development of the People's Republic of China, 2019) specifies a constant shearing rate of 0.8 mm min−1 for the quick direct shear test of soils. Therefore, the shear rate of snow was set at a constant value of 0.8 mm min−1 in this study. The shear strain rate is about s−1, which is in the gray area in Fig. 4. This study also follows the sample dimension, testing process, standard shear rate, and strength value methods used in soil mechanics. Analysis of the test data shows that, the shear stress-displacement curves of snow under this shearing rate exhibit both peak and non-peak types, which are all similar to soil test results. Moreover, the transition between these two failure modes exhibited a clear trend, and the variation in shear strength with external factors followed a similarly well-defined pattern.
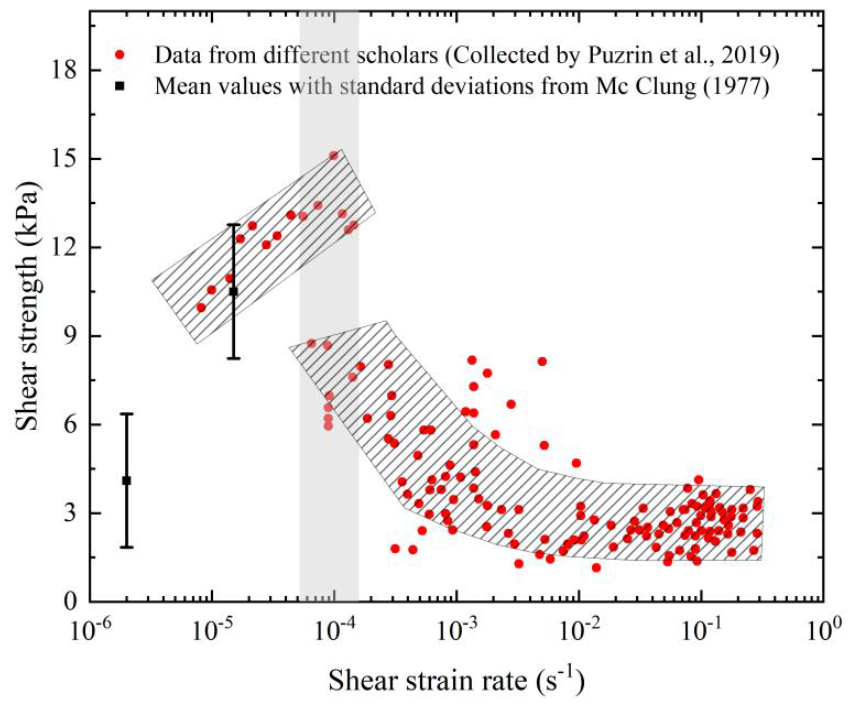
Figure 4Variation of shear strength with shear strain rate (Redrawing from Puzrin et al., 2019).
Snow is a particular construction material, which testing apparatus and methods for obtaining mechanical parameters are often adapted from geotechnical engineering practices (Abele, 1990; Abele and Frankenstein, 1967; White and McCallum, 2020). Therefore, this study strictly adhered to International Geotechnical Testing Standard (ISO 17892-10; International Organization for Standardization, 2018) and Chinese Geotechnical Testing Standard (GB/T 50123).
Direct shear test procedure is as follows:
-
Demolding: the sintered sample was carefully and slowly removed from the ring formwork to avoid structural damage.
-
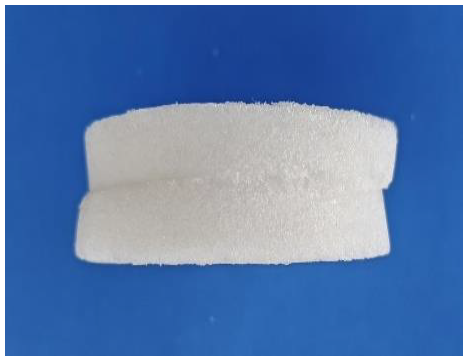
Shearing: the demolded sample was placed into the direct shear apparatus, and normal pressures of 25, 50, 75, and 100 kPa were applied. Shear loading was applied horizontally at a constant rate of 0.8 mm min−1, with the ambient temperature maintained at −10 °C. To ensure thermal consistency, the shear apparatus was preconditioned in cold storage for 2 h prior to testing so that the temperature of the shear box matched the test environment. Figure 5 shows the sheared specimen.
-
Data Collection and Processing: during the testing process, record the stress and displacement. If a peak shear stress is observed during the test with increasing shear displacement, it is taken as the shear strength. If no peak occurs, the shear stress at 4 mm displacement is adopted as the shear strength in accordance with the specimen size specifications of the Chinese geotechnical testing standard (GB/T 50123), with the test terminated at 6 mm displacement.
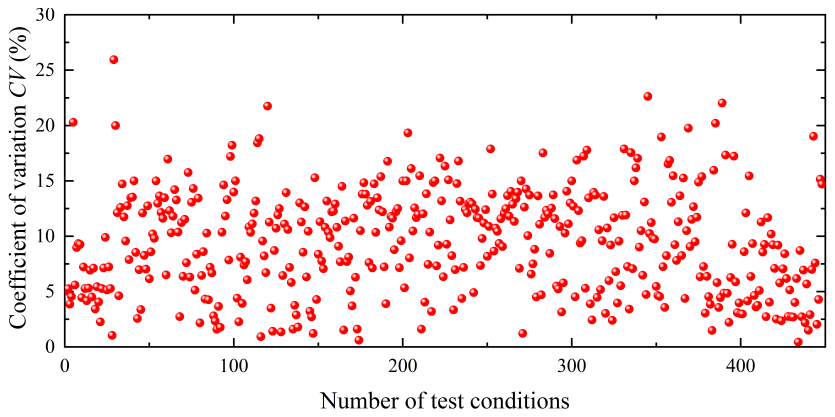
For each test condition, three parallel specimens were tested, and the average shear strength was calculated. The coefficient of variation (CV) is a widely used index for quantifying the dispersion of snow strength (Jamieson and Johnston, 2001; Perla, 1977; Sommerfeld and King, 1979). In this study, CV was used to evaluate the dispersion of the measured strength values, which was calculated as follows:
where s is the standard deviation and is the mean of the three parallel strength values.
Figure 6 presents the distribution of CV values for all specimens. The CV was below 20 % for most specimens and did not exceed 30 % for any specimen, indicating that the specimens possessed relatively good uniformity.
Many previous studies (McClung, 1977; Barbero et al., 2016; Perla, 1977; Fyffe and Zaiser, 2007; Chiaia et al., 2008; Gaume et al., 2014) have adopted the Mohr–Coulomb criterion as the failure criterion for snow. Preliminary tests were first conducted under normal stresses ranging from 25 to 350 kPa to determine the linear portion of the shear strength–normal stress envelope. Based on the test results, the mean values and standard deviations of shear strength for the three parallel specimens under each condition were plotted. According to the linear Mohr–Coulomb criterion (Eq. 2), the cohesion c and internal friction angle φ were determined using the least squares method, and the error bars of c and φ were plotted based on the fitting results.
where τf is the shear strength, σ is the normal stress, and c and φ denote cohesion and internal friction angle, respectively.
2.4 Test Conditions
Naturally deposited snow must be compacted before being used as an engineering material. Preliminary tests indicated that for machine-made snow with an initial density of approximately 300 kg m−3, specimens remained loose with large internal pores and could not maintain structural stability when compacted to a density below 400 kg m−3. When the compacted density reached 450 kg m−3, the specimens exhibited satisfactory formability and integrity after compaction, satisfying the requirements for subsequent sintering and shear tests. Under mechanical compaction, the interparticle contact area increases significantly as the density approaches approximately 700 kg m−3, resulting in a rapid increase in frictional resistance that makes further densification extremely difficult. Under the laboratory conditions of this study, the maximum density achievable via manual compaction was 650 kg m−3. Similarly, for natural snow with an initial density of approximately 200 kg m−3, stable specimens could only be formed when compacted to 300 kg m−3. Therefore, natural snow was used to prepare specimens with densities ranging from 300 to 400 kg m−3, and machine-made snow was used to prepare specimens with densities ranging from 450 to 650 kg m−3.
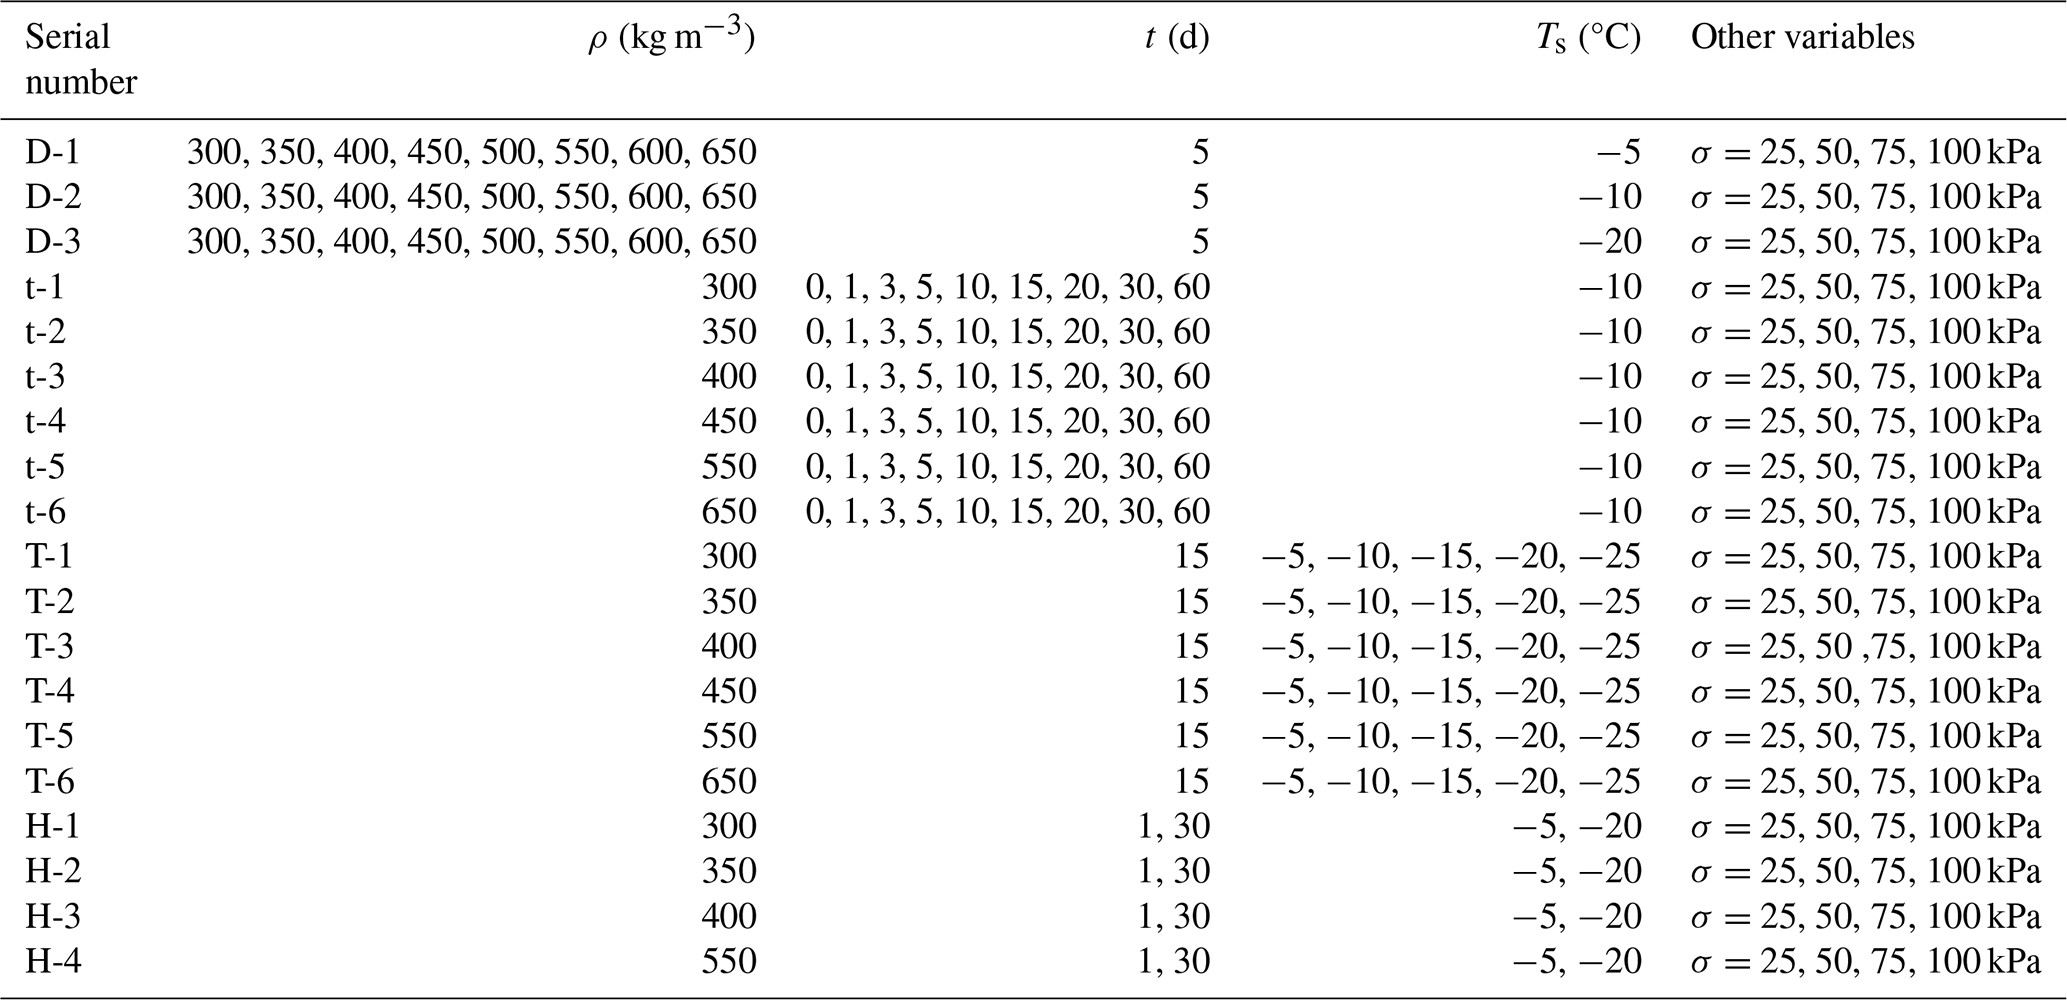
The effects of initial density ρ, sintering time t, and sintering temperature Ts were systematically examined through 112 test conditions, as detailed in Table 1. Each test condition incorporated shear strength measurements at four normal stress levels, resulting in 448 sets of valid shear strength data points.
3.1 Development Pattern of Shear Stress-Displacement Curves
Specimen deformation is characterized by shear displacement rather than strain in accordance with ISO 17892-10. Figure 7 shows the shear stress-displacement curves at a shear rate of 0.8 mm min−1. The peak stress is defined as the shear strength when there is a peak in the curve; and the stress at a shear displacement of 4 mm is defined when there is no peak value.
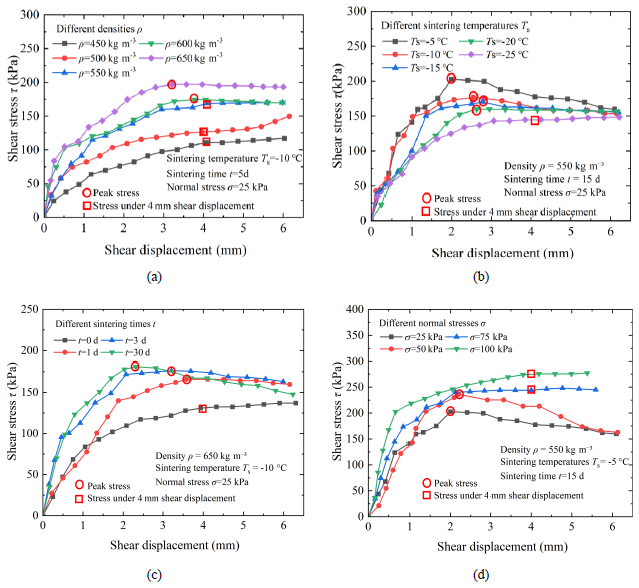
Figure 7Shear stress–displacement curves under different test conditions (a, different densities; b, different sintering temperatures; c, different sintering times; d, different normal stresses).
During the initial shear stage, all curves rise steeply, indicating a rapid increase in shear stress with displacement. In the intermediate stage, the slope decreases, leading to a more gradual increase in stress. As shearing progresses, curves exhibiting a peak stress show a stress decline after a critical displacement; in contrast, those without a distinct peak either continue to rise at a minimal rate or stabilize.
Figure 8 illustrates the development patterns of shear stress–displacement curves under other varying conditions: different densities ( °C, t=5 d), different sintering times (ρ=650 kg m−3, °C), and different sintering temperatures (ρ=550 kg m−3, t=15 d), all tested under normal stresses ranging from 25 to 100 kPa. White indicates strain hardening (no peak strength), while dark shades represent strain softening (with peak strength). The color depth reflects the shear displacement at which peak stress occurs. The results show that strain softening is more likely to occur under conditions of high density, extended sintering time, elevated sintering temperature, and low normal pressure. In contrast, strain hardening tends to appear under opposite conditions. As discussed in Sect. 3.2, higher density, longer sintering duration, and higher sintering temperature are associated with increased sintering degree. Therefore, snow samples with greater sintering degree, when subjected to low normal pressure, tend to exhibit strain softening, and the higher the sintering degree, the smaller the shear displacement corresponding to the stress peak.
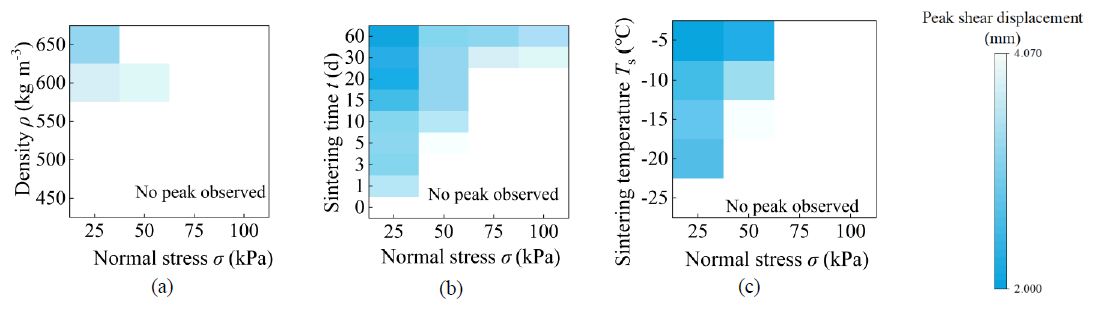
Figure 8Development patterns of shear stress–displacement curves under varying influencing factors (a, different densities; b, different sintering times; c, different sintering temperatures).
3.2 Shear strength and shear strength parameters
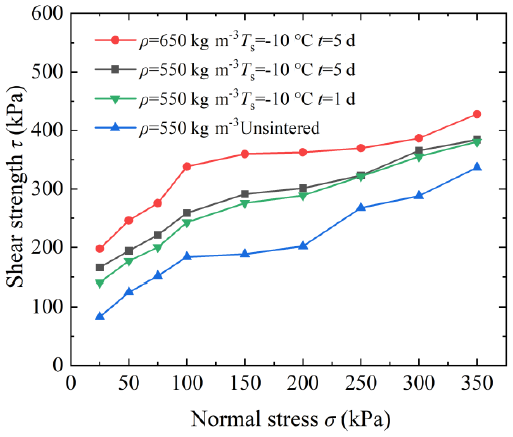
Shear tests were preliminarily carried out in this study under normal stresses ranging from 25 to 350 kPa. Figure 9 presents the shear strength envelopes of compacted snow under different normal stresses, obtained from tests. It is evident that for snow samples with varying densities and in unsintered conditions, the shear strength increases linearly with normal pressure up to 100 kPa. Beyond this threshold, the rate of increase in shear strength diminishes, and increases again after 250 kPa, indicating nonlinear behavior. In practical ice and snow engineering, the depth of snow foundations and the height of snow slopes are generally limited, resulting in relatively low overburden pressures. Therefore, normal pressures of 25, 50, 75, and 100 kPa were selected for calculating cohesion c and internal friction angle φ.
3.2.1 Effect of Initial Density
Figure 10 presents the variation in shear strength of snow at initial densities ranging from 300 to 650 kg m−3 after 5 d of sintering at −5, −10, and −20 °C. The results show that shear strength increases approximately linearly with density. For instance, at −10 °C, the shear strengths of snow samples with densities of 300 and 650 kg m−3 increased from 35.01, 41.72, 50.31, and 60.28 kPa to 207.86, 256.19, 285.70, and 348.22 kPa under normal stresses of 25, 50, 75, and 100 kPa, respectively.
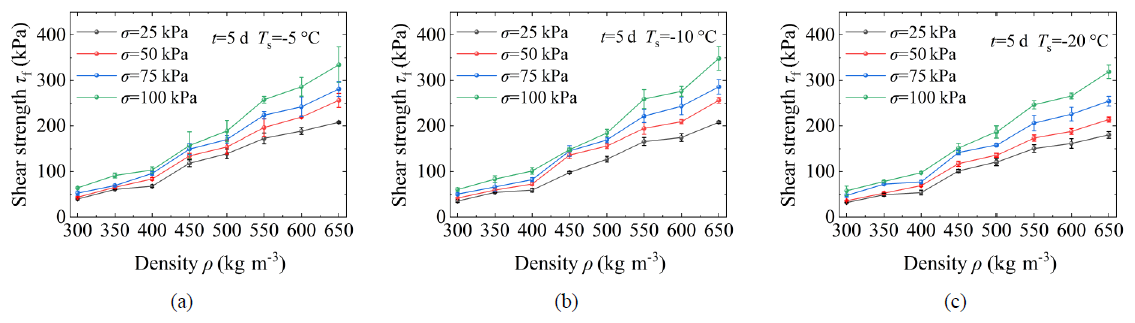
Figure 10Variation of shear strength with initial density under different normal stresses after 5 d (a, °C; b, °C; c, °C).
Figure 11 shows the corresponding changes in cohesion c and internal friction angle φ with varying initial densities under the same sintering conditions. Both parameters increase approximately linearly with density. As density increases from 300 to 650 kg m−3, cohesion rises from 29.35, 25.73, and 20.90 kPa to 168.60, 161.85, and 127.65 kPa at sintering temperatures of −5, −10, and −20 °C, respectively. Similarly, φ increases from 18.18, 18.65, and 19.55° to 58.29, 60.98, and 61.31°, respectively.
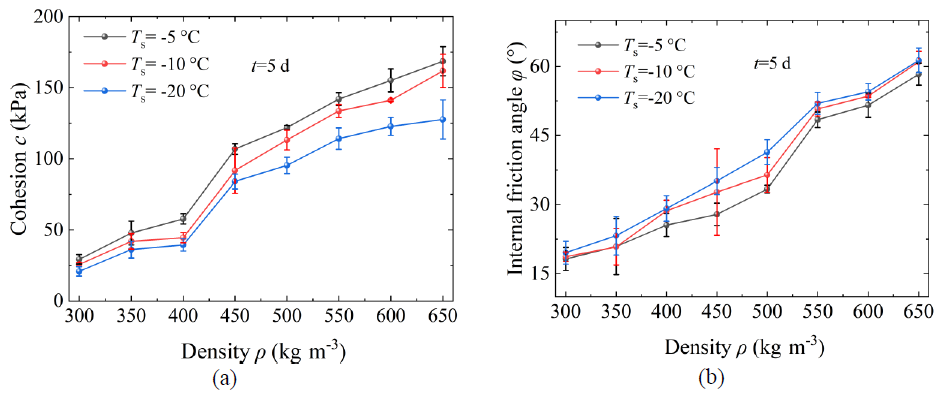
Figure 11Variation of shear strength parameters at different initial densities after 5 d (a, cohesion c; b, internal friction angle φ).
3.2.2 Effect of Sintering Time
Figure 12 shows the variation in sample density over different sintering times (using 550 kg m−3 as a reference). It can be observed that density remains relatively stable during the first 3 d, followed by a gradual decline. By the 60th days of sintering, the sample mass decreased by 0.8 g, and the density decreased from 550 to 537 kg m−3. All specimens experienced identical absolute mass loss during same sintering days. This corresponded to a decrease in mass loss percentage from 4.44 % to 2.05 % as specimen density increased from 300 to 650 kg m−3.This reduction is attributed to sublimation under sub-zero temperatures, where snow transitions directly from solid to gas, leading to a decrease in density.
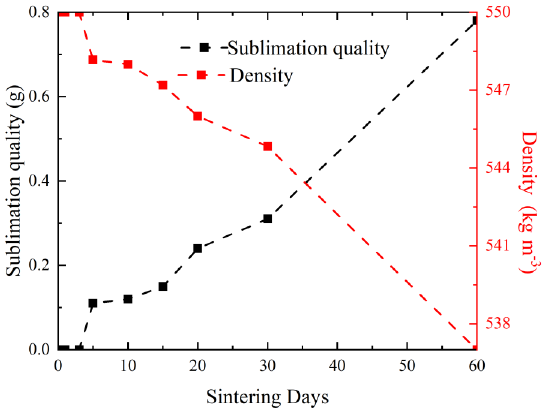
Figure 12Variation of average sublimation mass and specimen density with different sintering times.
Figure 13 presents the variation in shear strength with sintering time for snow specimens with initial densities of 350, 450, 550, and 650 kg m−3 at a constant sintering temperature of −10 °C. With increasing sintering time, the shear strength generally displays a trend of initial increase, subsequent stabilization, and final decrease. This trend reflects the competing effects between sintering (which strengthens the snow) and sublimation (which weakens it). In the early sintering stage, the strengthening effect of sintering dominates, leading to a remarkable increase in shear strength. In the middle stage (3–15 d), under the coupled effects of sintering and sublimation, the shear strength increases slowly and then tends to stabilize. In the late stage, sublimation becomes the dominant factor, resulting in a continuous decrease in shear strength.
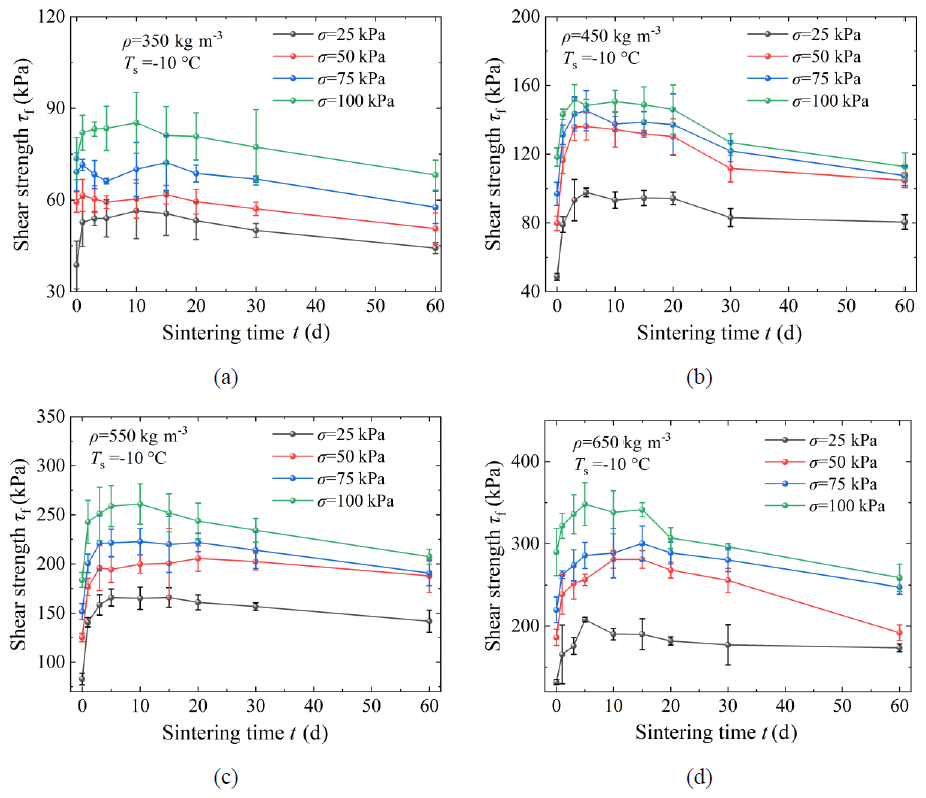
Figure 13Variation of shear strength τf with different sintering times under sintering temperature of −10 °C (a, ρ=350 kg m−3; b, ρ=450 kg m−3; c, ρ=550 kg m−3; d, ρ=650 kg m−3).
Figure 14 illustrates the changes in cohesion c and internal friction angle φ of snow samples with sintering time at the same four densities and sintering temperature. Cohesion c initially increases with time and then gradually declines, although it remains higher than that of unsintered snow even after 60 d. In contrast, the internal friction angle φ shows a marked decrease over time. This reduction may be attributed to the sintering-induced bonding between snow grains, which transforms the internal structure from loosely packed particles into a more continuous matrix, thereby reducing the interlocking frictional resistance.
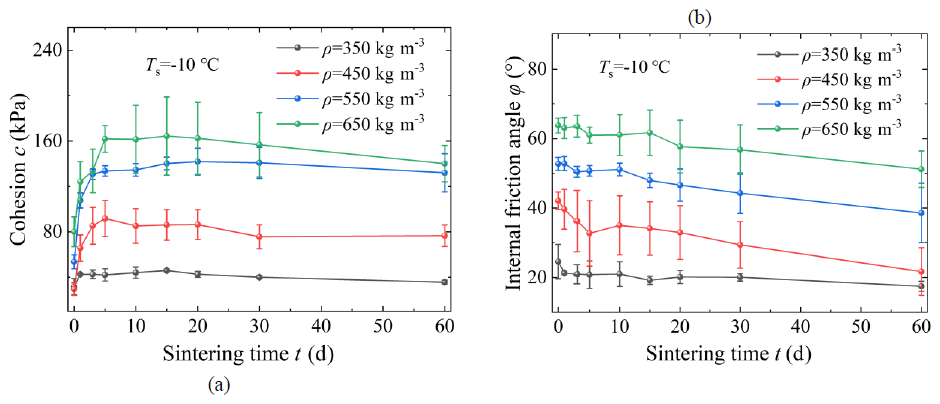
Figure 14Variation of shear strength parameters with different sintering times under sintering temperature of −10 °C (a, cohesion c; b, internal friction angle φ).
3.2.3 Effect of Sintering Temperature
Figure 15 presents the variation in shear strength τf of snow samples with different sintering temperatures at densities of 350, 450, 550, and 650 kg m−3 after 15 d of sintering. As sintering temperature increases, particle bonding accelerates, significantly enhancing the shear strength of the samples. For example, at a density of 550 kg m−3, the shear strengths at normal stresses of 25, 50, 75, and 100 kPa increased from 144.85, 178.41, 183.64, and 237.91 kPa at −25 °C to 202.64, 236.99, 243.52, and 274.82 kPa at −5 °C, respectively.
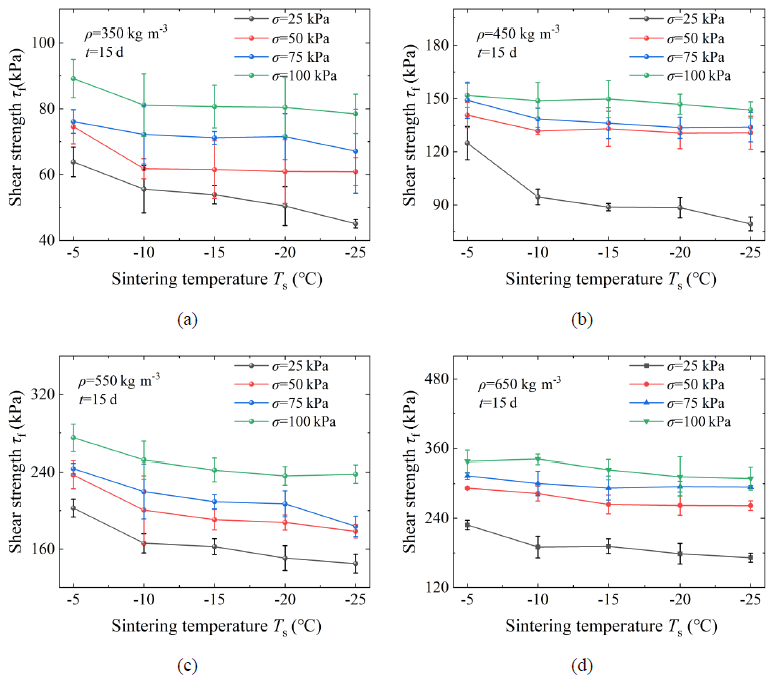
Figure 15Variation of shear strength τf at different sintering temperatures after 15 d (a, ρ=350 kg m−3; b, ρ=450 kg m−3; c, ρ=550 kg m−3; d, ρ=650 kg m−3).
Figure 16 shows the variation in cohesion c and internal friction angle φ of snow samples with different sintering temperatures under the same conditions. As the sintering temperature decreases, cohesion c declines, while the internal friction angle increases slightly.
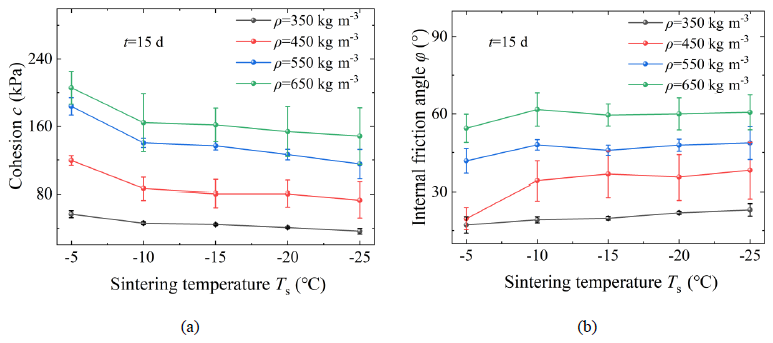
Figure 16Shear strength at different sintering temperatures after 15 d (a, cohesion c; b, internal friction angle φ).
As demonstrated in Sect. 3, the effects of various influencing factors on shear strength are characterized by complex interactions and nonlinear relationships. Such behaviors are difficult to characterize accurately using conventional function-fitting methods. By comparison, machine learning methods, including neural networks, random forests, Gaussian processes, and support vector machines, have demonstrated strong capability in processing nonlinear data and capturing complex interactions among variables. To quantitatively identify the specific influence trends of these factors, this section utilizes a genetic algorithm (GA) to optimize a back propagation (BP) neural network. Based on experimental data, a predictive model was developed with initial density, sintering time, sintering temperature, and normal stress as input variables, and shear strength as the output variable. The model aims to explore the underlying relationships among these parameters.
4.1 Model Establishment Method
4.1.1 Data Collection and Preprocessing
A total of 448 experimental data points were obtained, among which 70 % were randomly assigned to the training set, 15 % to the validation set, and the remaining 15 % to the test set. The data were scaled to the interval (0, 1) by applying max–min normalization, as defined in Eq. (3):
where Xnorm denotes the normalized value, Xi denotes the original input, and Xmax and Xmin denote the maximum and minimum values of the input variable, respectively.
4.1.2 BP Neural Network Model
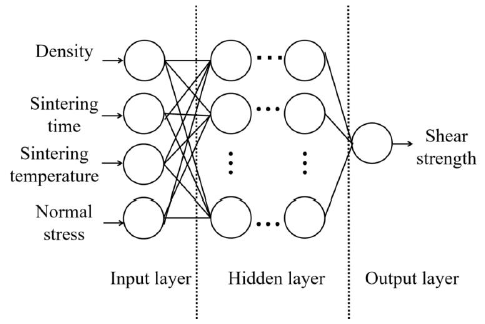
A back-propagation (BP) neural network updates connection weights through error back-propagation from the output layer to the input layer, and is commonly utilized for nonlinear function fitting and approximation. The input layer of the neural network comprises four variables: density, sintering time, sintering temperature, and normal stress. Although a more complex hidden layer architecture could substantially improve the prediction accuracy on the training data, it would also introduce a higher risk of overfitting and degrade generalization performance. Therefore, in this study, the hidden layer structure was simplified as much as possible while ensuring that the network retained adequate predictive capability; after extensive comparative tests, a single hidden layer with 10 neurons was ultimately adopted, striking a balance between prediction accuracy and generalization performance. The output layer contains one neuron representing the predicted shear strength. The architecture of the neural network is illustrated in Fig. 17.
The ReLU (Rectified Linear Unit) function was selected as the activation function for the neural network, defined as Eq. (4):
The performance of the trained neural network model was assessed using the coefficient of determination (R2), root mean square error (RMSE), and mean absolute error (MAE), which are defined as Eqs. (5) to (7):
where yi denotes the actual value, denotes the predicted value, denotes the mean of the actual values, and n denotes the number of samples.
4.1.3 GA-BP Neural Network Model
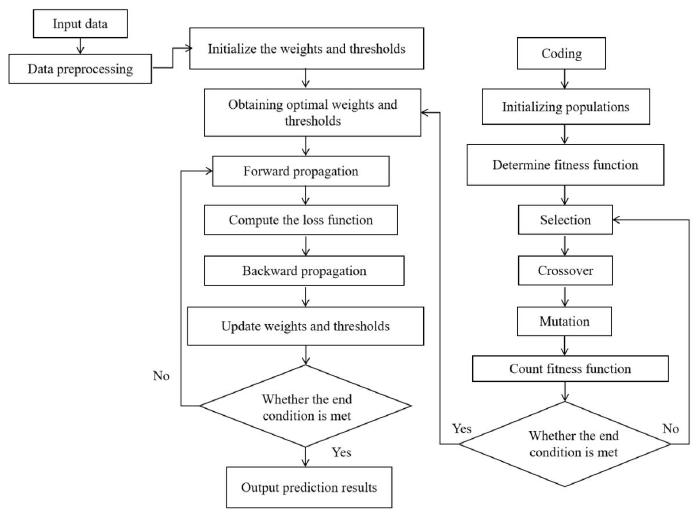
To mitigate the risk of local optima caused by random initialization, a genetic algorithm (GA) was employed to optimize the initial weights and thresholds of the BP neural network. A population of real-valued individuals encoding candidate weights and biases was randomly generated, and the fitness function was defined as the reciprocal of the mean squared error between the predicted and measured shear strength values. Through selection, crossover, and mutation operations, the population evolved iteratively until the predefined termination criterion was satisfied. The optimal individual obtained was then used to initialize the BP network, which was further trained by forward propagation and error backpropagation until convergence. The established GA-BP model was adopted to predict the shear strength corresponding to given inputs of density, sintering time, sintering temperature, and normal stress. The complete flowchart and key parameters of the GA are presented in Fig. 18 and Table 2, respectively.

4.2 Prediction Results and Analysis
4.2.1 Model Parameter Analysis
Figure 19a presents the Spearman correlation coefficients between shear strength τf and each input variable, namely normal stress σ, sintering temperature Ts, sintering time t, and density ρ. The low correlation coefficients among normal stress, sintering temperature, sintering time, and density indicate that these variables are largely independent. The correlation coefficients between shear strength and normal stress, sintering time, sintering temperature, and density are 0.283, 0, 0.754, and 0.934, respectively. The weak interdependence among input variables supports their appropriateness as model inputs. Among these, the variables most strongly correlated with shear strength, in descending order, are density, normal stress, sintering time, and sintering temperature. Figure 19b illustrates the relative importance of each input variable to shear strength, calculated using the Connection Weights Method (Olden et al., 2004), which quantifies variable importance by means of the raw connection weights between adjacent network layers. Density exhibits the highest influence at 42.5 %, followed by sintering time and sintering temperature at 21.9 % and 20.8 %, respectively, while normal stress contributes the least at 14.8 %.
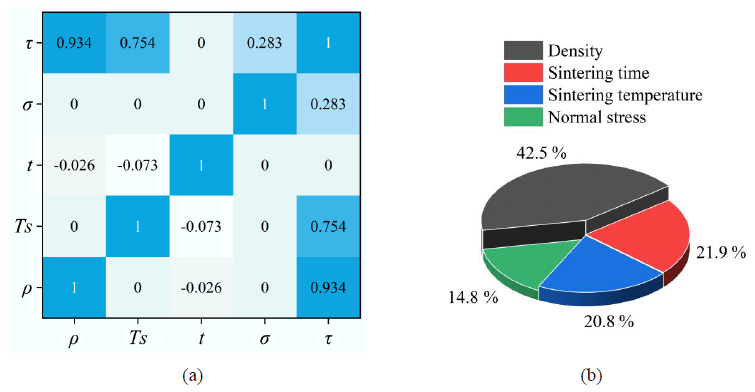
Figure 19Analysis of model parameters (a, Spearman's correlation coefficient matrix; b, relative importance of each parameter).
4.2.2 Neural Network Prediction Results
Upon completion of neural network training, 15 % of the total dataset (67 samples), excluded from the training process, was randomly assigned as the test set. The predictive accuracy of the trained neural network was subsequently assessed by comparing the model-predicted values with the experimental measured data. Figure 20a compares the predicted and actual shear strength values for 67 test set data points using both the unoptimized BP neural network and the GA-BP neural network. Figure 20b presents the relative errors of both models compared to the actual values. The relative errors of the GA-BP neural network are most below 20 % and are consistently lower than those of the unoptimized BP model, demonstrating that the GA-BP neural network offers superior predictive accuracy, greater precision, and improved applicability.
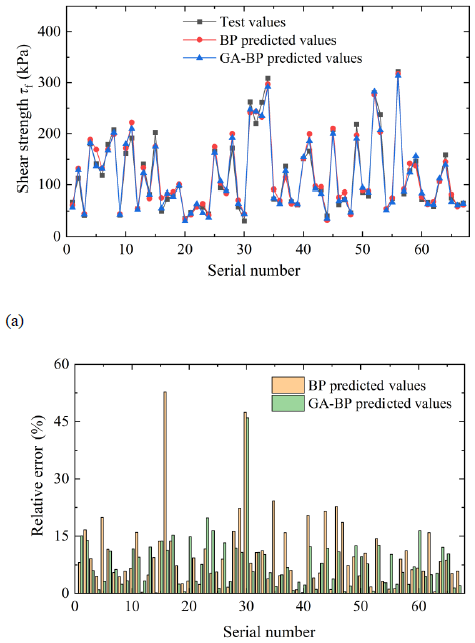
Figure 20Shear strength prediction errors of the neural network model on the test set (a, Prediction value error; b, relative error of prediction value).
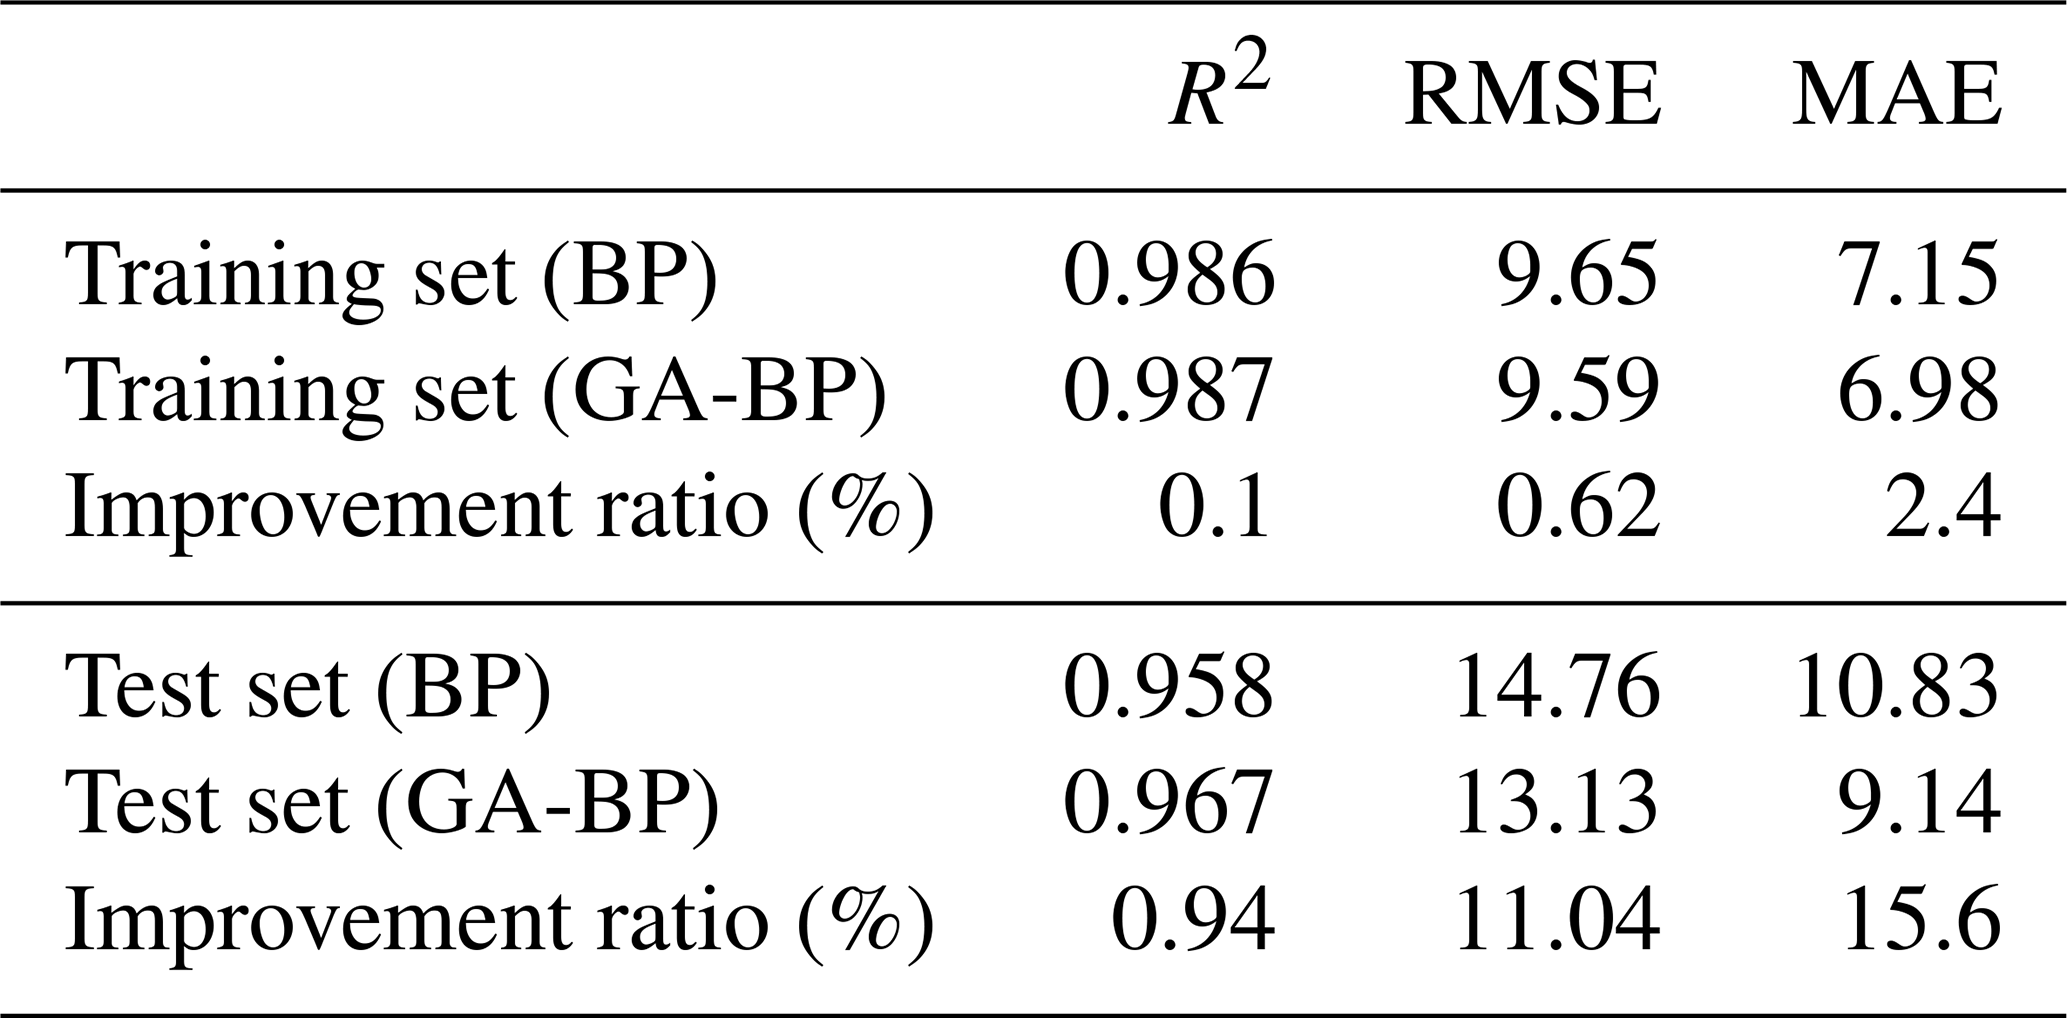
Figure 21a and b illustrate the performance of the BP neural network and the GA-BP neural network on the training and test datasets. The GA-BP model demonstrates superior performance across all evaluation metrics – R2, RMSE, and MAE – compared to the traditional BP neural network. In the training set, the GA-BP model improved R2, RMSE, and MAE by 0.1 %, 0.62 %, and 2.4 %, respectively. For the test set, the corresponding improvements were 0.94 %, 11.04 %, and 15.6 %, as detailed in Table 3. In summary, although the predictive performance on the test set is slightly lower than that on the training set, the degradation is limited and the test set accuracy remains at a satisfactory level. This indicates that the neural network model does not suffer from severe overfitting and possesses adequate generalization ability for practical application.
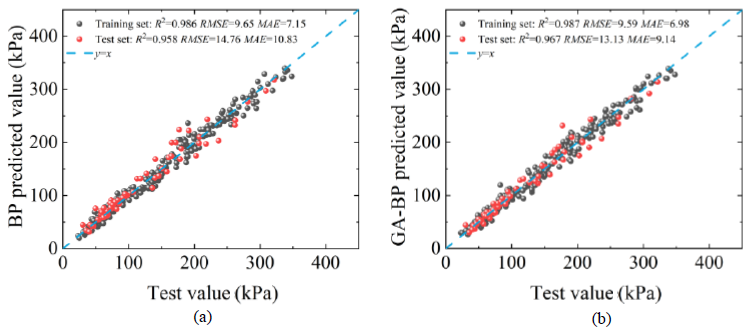
Figure 21Training and test set prediction performance of the neural networks (a, BP neural network; b, GA-BP neural network).
Table 3Performance evaluation metrics for training and test sets.
4.2.3 Prediction of Shear Strength Parameters
Based on the GA-BP neural network model, shear strength was predicted for various combinations of density (300 to 650 kg m−3), sintering time (0 to 60 d), sintering temperature (−5 to −25 °C), and normal stresses of 25, 50, 75, and 100 kPa, at a fixed shear rate of 0.8 mm min−1. These predicted values were used to derive the corresponding cohesion and internal friction angle, with the results summarized in Table 4.
Table 4Compacted snow shear strength parameters (25 to 100 kPa normal stress, shear rate v=0.8 mm min−1).

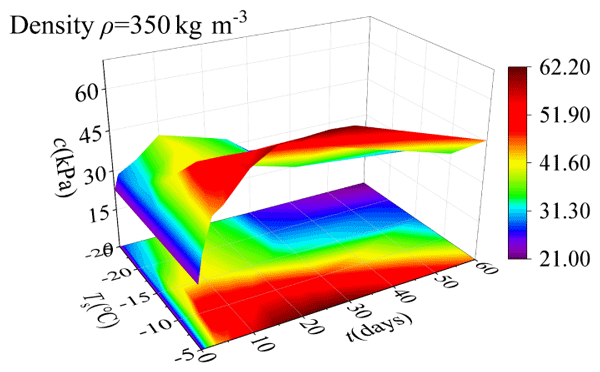
Figure 22 presents the predicted cohesion c of snow samples with densities of 350, 450, 550, and 650 kg m−3 under varying sintering temperatures and sintering times. Cohesion c demonstrates a pronounced trend of initially increasing, then stabilizing, and eventually decreasing with extended sintering time across all densities. Furthermore, lower sintering temperatures consistently lead to reduced cohesion. The lowest cohesion values are observed in unsintered snow, while the highest are typically found at −5 °C and sintering times between 10 and 25 d. Notably, lower-density snow reaches its peak cohesion within a shorter sintering period.
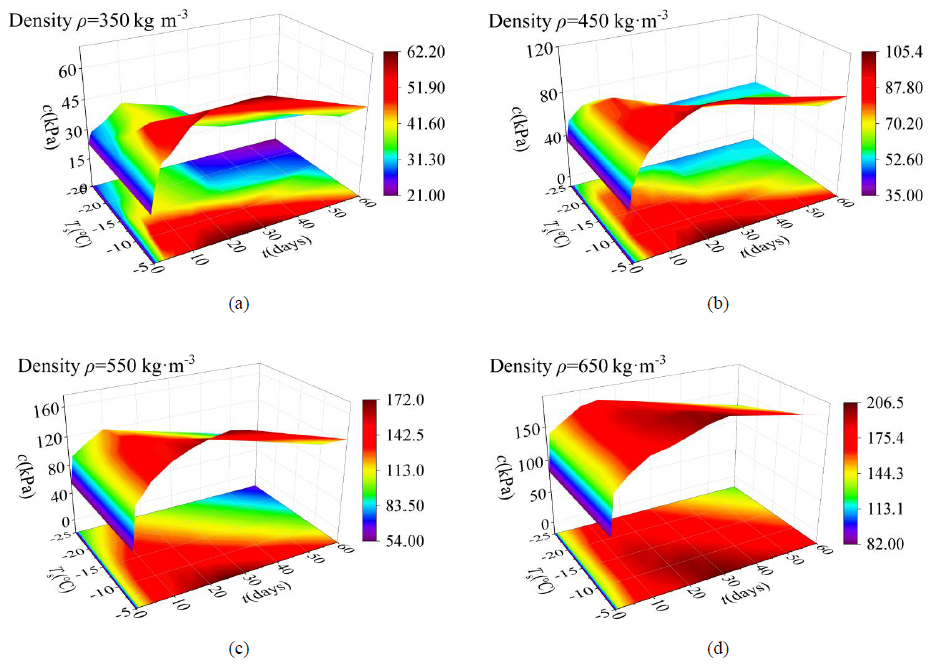
Figure 22Predicted cohesion c values for various combinations (a, ρ=350 kg m−3; b, ρ=450 kg m−3; c, ρ=550 kg m−3; d, ρ=650 kg m−3).
Figure 23 illustrates the predicted internal friction angle φ of snow samples with densities of 350, 450, 550, and 650 kg m−3 under various sintering temperatures and times. The internal friction angle consistently decreases with increasing sintering time, while it increases with decreasing sintering temperature. These trends align with the experimental results. At shorter sintering durations and lower sintering temperatures, snow exhibits higher internal friction angles. However, as sintering time progresses, φ declines, with the most pronounced reductions occurring at higher sintering temperatures (e.g., −5 °C).
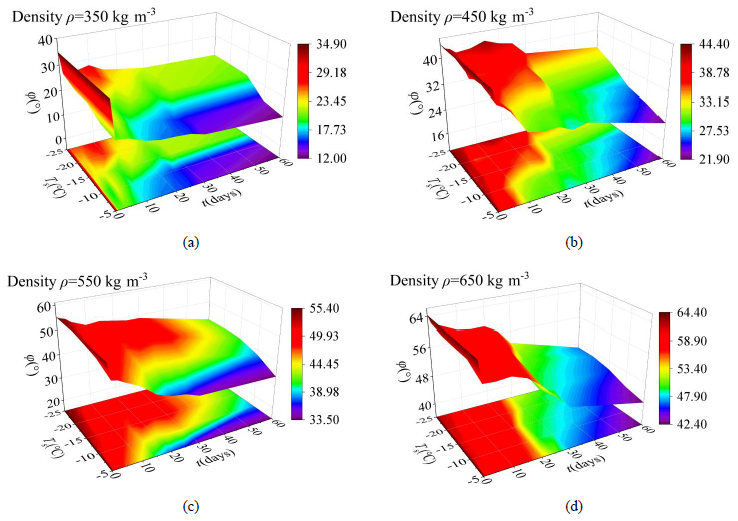
Figure 23Predicted internal friction angle φ values for various combinations (a, ρ=350 kg m−3; b, ρ=450 kg m−3; c, ρ=550 kg m−3; d, ρ=650 kg m−3).
4.3 Discussion
4.3.1 Physical mechanisms governing the evolution of direct shear strength parameters
Initial density is the dominant factor governing the direct shear strength and mechanical strength parameters of compacted snow. An increase in density creates more interparticle contact points per unit volume and yields a denser internal microstructure (Butkovich, 1958; Mellor, 1977), which strengthens intergranular bonding and frictional interlocking. As illustrated in Fig. 11, both cohesion and internal friction angle rise markedly as the initial density increases from 300 to 650 kg m−3. Under a sintering temperature of −10 °C and a sintering duration of 5 d, cohesion increases from 25.73 to 161.85 kPa, while the internal friction angle grows from 18.65 to 60.98°.
The shear strength evolution of compacted snow with sintering time is governed by the coupled effects of sublimation and the formation of interparticle hydrogen bonds during sintering. In the early sintering stage, hydrogen bonds form rapidly between snow grains, whereas the density attenuation induced by sublimation remains insignificant, resulting in a rapid rise in shear strength. Subsequently, the sintering process gradually stabilizes, accompanied by sustained density reduction. Controlled by the interplay of these two mechanisms, the shear strength fluctuates slightly and maintains a relatively stable level. As sintering time further prolongs, sublimation gradually dominates the structural evolution, leading to a continuous decline in shear strength.
During sintering, the protrusions on snow grain surfaces undergo preferential sublimation, rendering particle morphologies more regular (Bahaloo et al., 2024; Colbeck, 1983a; Paterson, 1994; Wang, 1982; Zhuang, 2019). This smoothens particle surface roughness and consequently induces a gradual reduction in the internal friction angle. By contrast, cohesion exhibits a variation trend consistent with that of shear strength, rising initially and then declining slowly. Taking the specimen with a density of 550 kg m−3 sintered at −10 °C as an example (Fig. 14), as sintering time extends to 60 d, cohesion first increases from 53.54 to 141.85 kPa and then decreases to 131.99 kPa; meanwhile, the internal friction angle drops from 52.78 to 38.58°.
Elevated sintering temperature intensifies the Brownian motion of water vapor, which promotes the formation of hydrogen bonds among snow particles (Abele, 1990; Abele and Frankenstein, 1967; Colbeck, 1983a). A higher sintering degree further reinforces interparticle bonding and regularizes grain surface morphology. As shown in Fig. 15, when the sintering temperature rises from −25 to −5 °C, cohesion increases considerably. For specimens with a density of 550 kg m−3 sintered for 15 d, cohesion increases from 115.4 to 183.72 kPa, while the internal friction angle decreases from 48.69 to 41.74°.
4.3.2 Comparison with existing studies
This study systematically investigated the variation patterns of shear strength and its key parameters of compacted snow, with a focus on the effects of three critical factors: initial density, sintering time, and sintering temperature. The influences of initial density and sintering temperature observed in this study are consistent with the findings of previous research (Butkovich, 1958; Ballard et al., 1965; Perla et al., 1982; Schweizer, 1998). With respect to the effect of sintering time, similar conclusions have been corroborated by both field investigations and laboratory experiments (Jellinek, 1959; Zhuang, 2019; Fu, 2020; Yang, 2024).
In contrast, Abele (1990) reported that the sintering strength of snow continued to increase without exhibiting a decreasing trend. However, the experimental details (e.g., ambient humidity and specimen sealing conditions) were not clearly described in that study, which may have led to discrepancies in the observed results. Therefore, more refined and controlled experiments are required in future research to further clarify and verify the strength variation patterns of compacted snow.
4.3.3 Highlights and limitations of this study
Combining laboratory experiments and a neural network model, this study established baseline direct shear strength parameters for compacted snow covering a range of influencing conditions: an initial density of 300 to 650 kg m−3, sintering temperature of −25 to −5 °C, sintering duration of 0 to 60 d, and normal stress of 25 to 100 kPa. The derived baseline parameters can provide a reference for engineers to conduct deformation analysis, bearing capacity evaluation, and stability calculation of snow-based infrastructures in polar and cold regions. When snow type or environmental conditions vary, updated strength parameters can be acquired via laboratory testing. By further establishing the quantitative correlation between newly measured parameters and the baseline values proposed in this study, targeted correction of the existing baseline data can be realized.
This study solely considered four influencing factors, namely initial density, sintering temperature, sintering time, and normal stress within the range of 25 to 100 kPa, with a fixed shear loading rate of 0.8 mm min−1. The evolution characteristics of the shear strength parameters of compacted snow under additional internal and external influencing factors remain to be explored in future research. Key internal factors include snow type, liquid water content, and particle size distribution, while major external factors cover ambient humidity, specimen sealing conditions, loading rate, and extended normal stress levels.
Through laboratory direct shear tests and machine learning, the evolution patterns of shear stress-displacement curves, shear strength, and shear strength parameters of compacted snow were analyzed, leading to the following conclusions:
-
The shear stress–displacement curves of compacted snow exhibit two distinct development patterns: softening (with a peak stress) and hardening (without a peak). Softening tends to occur under greater sintering degree conditions – such as higher initial density, longer sintering time, and higher sintering temperature – and lower normal stress. Moreover, the greater the degree of sintering, the smaller the shear displacement corresponding to the stress peak.
-
As the initial density increases from 300 to 650 kg m−3, both cohesion and internal friction angle show clear upward trends. With increasing sintering time from 0 to 60 d, cohesion initially increases and then decreases, while the internal friction angle consistently declines. As the sintering temperature decreases from −5 to −25 °C, cohesion continuously drops, whereas the internal friction angle shows a corresponding increase.
-
Neural network analysis revealed the relative influence of the main factors on shear strength: the relative importance contributions are 42.5 % for initial density, 21.9 % for sintering time, 20.8 % for sintering temperature, and 14.8 % for normal stress.
-
Based on the (GA-BP) neural network, this study establishes benchmark values of shear strength parameters for compacted snow under different initial densities, sintering durations, and sintering temperatures. These benchmark values provide reliable quantitative references for the design, construction, and performance optimization of snow-based structures in engineering practice. In future research, the proposed benchmark values can be adapted and extended to accommodate diverse engineering environments and compaction technologies, thereby supporting the rational selection of parameters and comprehensive performance evaluation of snow engineering structures across various application scenarios.
This study focused on three key factors, which are initial density, sintering time, and sintering temperature. Other variables such as water content, particle size, morphology and shear rate influence snow strength as well. When accounting for these factors in engineering practice, adaptive adjustments should be implemented based on the benchmark framework established in this study.
The code used in this study is available upon request from the authors.
Data will be made available on request.
H.H: Conceptualization, Methodology, Formal analysis, Investigation, Data curation, Writing – original draft, Visualization. H.X: Conceptualization, Methodology, Resources, Supervision, Funding acquisition. J.W: Validation, Resources, Supervision. T.L: Validation, Resources, Supervision. J.L: Validation, Resources, Supervision, Funding acquisition. E.X: Validation, Supervision. X.T: Validation, Supervision.
The contact author has declared that none of the authors has any competing interests.
Publisher's note: Copernicus Publications remains neutral with regard to jurisdictional claims made in the text, published maps, institutional affiliations, or any other geographical representation in this paper. The authors bear the ultimate responsibility for providing appropriate place names. Views expressed in the text are those of the authors and do not necessarily reflect the views of the publisher.
The authors would like to thank the editor and the two anonymous reviewers for their constructive comments and suggestions, which have significantly improved the quality of this manuscript.
This research has been supported by the National Natural Science Foundation of China (grant no. 42576221) and the Central University Fund (grant no. 3122026GJ07).
This paper was edited by Guillaume Chambon and reviewed by two anonymous referees.
Abe, O.: Shear strength and angle of repose of snow layers including graupel, Ann. Glaciol., 38, 305–308, https://doi.org/10.3189/172756404781815149, 2004.
Abele, G.: Snow roads and runways, CRREL Monograph 90–2, US Army Cold Regions Research and Engineering Laboratory, Hanover, 1990.
Abele, G. and Frankenstein, G. E.: Snow and ice properties as related to roads and runways in Antarctica, US Army CRREL Technical Report 190, Cold Regions Research and Engineering Laboratory, Hanover, ASIN B0007F4F4A, 1967.
Ager, B. H.: Snow road preparation in Scandinavia, Timber Canada, 2, 56–58, https://doi.org/10.4224/40001217, 1960.
Bahaloo, H., Forsberg, F., Lycksam, H., Casselgren, J., and Sjödahl, M.: Material mapping strategy to identify the density-dependent properties of dry natural snow, Appl. Phys. A-Mater., 130, https://doi.org/10.1007/s00339-024-07288-y, 2024.
Ballard, G. E. H., Feldt, E. D., and Toth, S. R.: Direct shear study on snow: procedures and data, CRREL Special Report 92, Cold Regions Research and Engineering Laboratory, Hanover, 1965.
Barbero, M., Barpi, F., Borri-Brunetto, M., and Pallara, O.: An apparatus for in situ direct shear tests on snow, Exp. Techniques, 40, 149–158, https://doi.org/10.1007/s40799-016-0019-7, 2016.
Barrett, J. W., Garcke, H., and Nürnberg, R.: Numerical computations of faceted pattern formation in snow crystal growth, Phys. Rev. E, 86, 011604, https://doi.org/10.1103/PhysRevE.86.011604, 2012.
Butkovich, T. R.: Strength studies of high-density snows, Eos Trans. AGU, 39, 305–312, https://doi.org/10.1029/TR039i002p00305, 1958.
Chiaia, B. M., Cornetti, P., and Frigo, B.: Triggering of dry snow slab avalanches: stress versus fracture mechanical approach, Cold Reg. Sci. Technol., 53, 170–178, https://doi.org/10.1016/j.coldregions.2007.08.003, 2008.
Colbeck, S. C.: Theory of metamorphism of dry snow, J. Geophys. Res.-Oceans, 88, 5475–5482, https://doi.org/10.1029/JC088iC09p05475, 1983a.
Colbeck, S. C.: Sintering in a dry snow cover, J. Appl. Phys., 54, 3327–3330, https://doi.org/10.1063/1.368684, 1983b.
De Biagi, V., Barbero, M., Barpi, F., Borri-Brunetto, M., and Podolskiy, E.: Failure mechanics of snow layers through image analysis, Eur. J. Mech. A-Solid., 74, 26–33, https://doi.org/10.1016/j.euromechsol.2018.10.018, 2019.
De Montmollin, V.: Shear test on snow explained by fast metamorphism, J. Glaciol., 28, 187–198, https://doi.org/10.3189/S0022143000011898, 1982.
Demmenie, M., Woutersen, S., and Bonn, D.: Ice Sintering by Sublimation and Condensation, J. Phys. Chem. Lett., 16, 2104–2109, https://doi.org/10.1021/acs.jpclett.5c00050, 2025.
Dong, P., Chen, Q., Liu, G., Zhang, B., Yan, G., and Wang, R.: Effects of Geometric Parameters on Flow and Atomization Characteristics of Swirl Nozzles for Artificial Snowmaking, Int. J. Refrig., 154, 56–65, https://doi.org/10.1016/j.ijrefrig.2023.07.015, 2023.
Fohn, P. and Camponovo, C.: Improvements by measuring shear strength of weak layers, in: Proceedings of the International Snow Science Workshop, Banff, Canada, 158–162, 1997.
Fu, X.: Test study on seasonal snow thermal properties and mechanical properties in Northeast China, MS thesis, Northeast Agricultural University, https://doi.org/10.27010/d.cnki.gdbnu.2020.000222, 2020.
Fukuzawa, T. and Narita, H.: An experimental study on the mechanical behavior of a depth hoar under shear stress, in: Proceedings of the 1992 International Snow Science Workshop, edited by: Armstrong, R., Breckenridge, USA, ISSW, 171–175, 1993.
Fyffe, B. and Zaiser, M.: Interplay of basal shear fracture and slab rupture in slab avalanche release, Cold Reg. Sci. Technol., 49, 26–38, https://doi.org/10.1016/j.coldregions.2006.09.011, 2007.
Gaume, J., Schweizer, J., van Herwijnen, A., Chambon, G., Reuter, B., Eckert, N., and Naaim, M.: Evaluation of slope stability with respect to snowpack spatial variability, J. Geophys. Res.-Earth, 119, 1783–1799, https://doi.org/10.1002/2014JF003193, 2014.
Hong, J., Talalay, P., Man, T., Li, Y., Fan, X., Li, C., and Zhang, N.: Effect of high-pressure sintering on snow density evolution: Experiments and results, J. Glaciol., 68, 1107–1115, https://doi.org/10.1017/jog.2022.11, 2022.
International Organization for Standardization: Geotechnical investigation and testing – Laboratory testing of soil, ISO 17892-10:2018, https://www.iso.org/standard/72015.html (last access: 12 August 2026), 2018.
Jamieson, B. and Johnston, C. D.: Evaluation of the shear frame test for weak snowpack layers, Ann. Glaciol., 32, 59–69, https://doi.org/10.3189/172756401781819472, 2001.
Jellinek, H.: Compressive strength properties of snow, J. Glaciol., 3, 345–354, https://doi.org/10.3189/S0022143000017019, 1959.
Kang, Z., Wang, Z.-G., Li, Q., and Cheng, P.: Review on Pressure Swirl Injector in Liquid Rocket Engine, Acta Astronaut., 145, 174–198, https://doi.org/10.1016/j.actaastro.2017.12.038, 2018.
Keeler, C. M. and Weeks, W. E.: Investigations into the mechanical properties of alpine snow-packs, J. Glaciol., 7, 253–271, https://doi.org/10.3189/S0022143000031038, 1968.
Li, T., Huo, H., Hu, B., Jia, W., and Chen, Q.: Discrete element method analyses of the polar high-density sintered snow under the unconfined compression tests, Polar Res., 36, 240–253, https://doi.org/10.13679/j.jdyj.20220436, 2024.
McClung, D. M.: Direct simple shear tests on snow and their relation to slab avalanche formation, J. Glaciol., 19, 101–109, https://doi.org/10.3189/S0022143000215578, 1977.
McClung, D. M.: Shear fracture precipitated by strain softening as a mechanism of dry slab avalanche release, J. Geophys. Res.-Sol. Ea., 84, 3519–3526, https://doi.org/10.1029/JB084iB07p03519, 1979.
Mellor, M.: Engineering properties of snow, J. Glaciol., 19, 15–66, https://doi.org/10.3189/S002214300002921X, 1977.
Ministry of Housing and Urban-Rural Development of the People's Republic of China: Standard for geotechnical testing method, GB/T 50123–2019, China Planning Press, 2019.
Nakamura, T., Abe, O., Hashimoto, R., and Ohta, T.: A dynamic method to measure the shear strength of snow, J. Glaciol., 56, 333–338, https://doi.org/10.3189/002214310791968502, 2010.
Olden, J. D., Joy, M. K., and Death, R. G.: An accurate comparison of methods for quantifying variable importance in artificial neural networks using simulated data, Ecol. Model., 178, 389–397, https://doi.org/10.1016/j.ecolmodel.2004.03.013, 2004.
Paterson, W. S. B.: The physics of glaciers, 3rd edn., Pergamon Press, https://doi.org/10.3189/S002214300003522X, 1994.
Perla, R.: Slab avalanche measurements, Can. Geotech. J., 14, 206–213, https://doi.org/10.1139/t77-021, 1977.
Perla, R., Beck, T. M. H., and Cheng, T. T.: The shear strength index of alpine snow, Cold Reg. Sci. Technol., 6, 11–20, https://doi.org/10.1016/0165-232X(82)90040-4, 1982.
Podolskiy, E. A., Barbero, M., Barpi, F., Borri-Brunetto, M., Pallara, O., Frigo, B., Chiaia, B., Chambon, G., and Naaim, M.: Testing a new shear loading apparatus for in-situ studies of weak snow layers, in: ISSW 2013 Proceedings, https://hal.science/hal-00951689 (last access: 12 August 2026), 2013.
Podolskiy, E. A., Barbero, M., Barpi, F., Chambon, G., Borri-Brunetto, M., Pallara, O., Frigo, B., Chiaia, B., and Naaim, M.: Healing of snow surface-to-surface contacts by isothermal sintering, The Cryosphere, 8, 1651–1659, https://doi.org/10.5194/tc-8-1651-2014, 2014.
Putkisto, K.: Snow as a road-building material, National Research Council of Canada, Ottawa, https://doi.org/10.4224/20358958, 1959.
Puzrin, A. M., Faug, T., and Einav, I.: The mechanism of delayed release in earthquake-induced avalanches, P. Roy. Soc. A, 475, 20190092, https://doi.org/10.1098/rspa.2019.0092, 2019.
Reiweger, I., Schweizer, J., Ernst, R., and Dual, J: Load-controlled test apparatus for snow, Cold Reg. Sci. Technol., 62, 119–125, https://doi.org/10.1016/j.coldregions.2010.04.002, 2010.
Schweizer, J.: Laboratory experiments on shear failure of snow, Ann. Glaciol., 26, 97–102, https://doi.org/10.3189/1998AoG26-1-97-102, 1998.
Sommerfeld, R. A. and King, R. M.: A recommendation for the application of the Roch index for slab avalanche release, J. Glaciol., 22, 547–549, https://doi.org/10.1017/s0022143000014520, 1979.
Sun, B., Tang, X., Xiao, E., Shi, X., Cheng, X., Li, L., Wei, F., and Zhang, T.: Ice and snow runway engineering in the Antarctica: current status and prospect, Chin. J. Eng. Sci., 23, 161–168, https://doi.org/10.15302/J-SSCAE-2021.02.022, 2021.
Vijay, G. A., Moorthi, N. S. V., and Manivannan, A.: Internal and External Flow Characteristics of Swirl Atomizers: A Review, Atomization Spray., 25, 153–188, https://doi.org/10.1615/AtomizSpr.2014010219, 2015.
Wang, Y.: Metamorphosis of seasonal snow cover in the upper reaches of the Ili River in the Tianshan Mountains, J. Glacial Permafrost, 2, 63–72, https://doi.org/10.7522/j.issn.1000-0240.1982.0024, 1982.
Wei, J., Lu, P., Hu, S., Zhao, Q., Yuan, S., Huo, P., and Wang, Q.: Research on the Evolution of Snow Crystal Necks and the Effect on Hardness during Snowpack Metamorphism, Water, 16, 48, https://doi.org/10.3390/w16010048, 2024.
White, G. and McCallum, A.: Review of ice and snow runway pavements, Int. J. Pavement Res. Technol., 11, 311–320, https://doi.org/10.1016/j.ijprt.2017.11.002, 2020.
White, G., Outram, J., and McCallum, A.: Sintering of manufactured snow using liquid dye in a simulated environment, J. Cold Reg. Eng., 37, 04023007, https://doi.org/10.1061/JCRGEI.CRENG-694, 2023.
Yamano, K. and Endo, Y.: Dependence of shear strength of snow cover on density and water content, J. Jpn. Soc. Snow Ice, 64, 443–451, https://doi.org/10.5331/seppyo.64.443, 2002.
Yang, M.: Analysis on Mechanical Characteristics and Influencing Factors of Compacted Snow in Northeast China, MS thesis, Northeast Agricultural University, https://doi.org/10.27010/d.cnki.gdbnu.2024.000351, 2024.
Zhuang, F.: Experimental Study on Snow Hardness and Its Testing Technology, MS thesis, Dalian University of Technology, https://doi.org/10.26991/d.cnki.gdllu.2019.000727, 2019.