
the Creative Commons Attribution 4.0 License.
the Creative Commons Attribution 4.0 License.
 | 24 Jul 2026
Assessing the effect of land cover on ISBA snow water equivalent and land surface temperature simulations over Europe
Oscar Rojas-Munoz
Constantin Ardilouze
Bertrand Bonan
Diane Tzanos
Darren Ghent
Céline Lamarche
Thomas Nagler
Jean-Christophe Calvet
An accurate representation of the land surface is essential for simulating the exchange of energy, water and carbon between the land and the atmosphere. This study evaluates the impact of land cover (LC) representation on snow simulations in the Interactions Between Soil, Biosphere and Atmosphere (ISBA) land surface model in Europe between 2010 and 2022. The study employs the European Centre for Medium-Range Weather Forecasts (ECMWF) ERA5 atmospheric forcing dataset. Offline simulation experiments were conducted using two different versions of the model to prescribe LC. The most recent version uses the latest LC data from the European Space Agency's (ESA) Climate Change Initiative (CCI). The model's ability to reproduce snow dynamics was evaluated through a comparison of the simulations with ESA CCI satellite snow water equivalent (SWE) and land surface temperature (LST) retrievals and ERA5 snow analyses. The ERA5 analysis shows the highest level of agreement with satellite-derived SWE at the domain scale. On average, both the ERA5 and ISBA simulations tend to overestimate SWE compared to the CCI SWE. However, it is also possible that the CCI SWE product underestimates the actual SWE. This bias is particularly large during the warm winter of 2020, while the scaled SWE anomalies are comparable to those observed by ESA CCI and ERA5. Using ESA CCI LC data reduces the ISBA SWE bias by around 23 %, with this reduction being observed over most of the domain. Further analysis of LC transitions shows that the reduction in SWE bias is driven primarily by a few vegetation changes, particularly the transition from grasslands to forests. Changes in SWE are also found in areas where the dominant LC remains unchanged. This indicates that modifications in sub-grid vegetation fractions can affect snow-vegetation interactions and SWE bias. The updated LC has a very limited impact on the model's performance for land surface temperature, indicating that the impact of LC updates is more noticeable for SWE than for LST. These findings emphasise the importance of accurate land cover data for improving snow representation in land surface models and highlight the need for updated vegetation information in future snow-related applications.
- Article
(9438 KB) - Full-text XML
-
Supplement
(1726 KB) - BibTeX
- EndNote


Land surface models (LSMs) are essential for simulating energy, water and carbon fluxes at the interface between the land and the atmosphere. They are widely used in weather forecasting, climate modelling and hydrological applications, such as predicting droughts and floods (Crow et al., 2012; Mishra et al., 2024; Quintana-Seguí et al., 2020), as well as informing land-use and water-use policy (Blyth et al., 2021). However, the accuracy of LSM outputs depends heavily on the quality of boundary conditions and surface parameters, particularly land cover (LC) data. LC maps are used to define key properties such as albedo, roughness, rooting depth and vegetation type. These properties modulate surface fluxes and soil–vegetation–atmosphere interactions (Bounoua et al., 2002; Levis, 2010). Traditional LC datasets used in LSMs often rely on static or outdated classifications that may no longer accurately reflect current land use patterns or vegetation changes caused by climate change and human activity (Maas et al., 2018). Updating these datasets is important in order to better estimate surface heat fluxes and soil temperature (Jose et al., 2024). ECOCLIMAP-II (Faroux et al., 2013), for example, has long been the reference within the SURFEX modelling system (Masson et al., 2013), providing global 1 km resolution maps. Over Europe, ECOCLIMAP-II is based on data from the early 2000s (Kaptue et al., 2009; Etchanchu et al., 2017). However, it does not incorporate recent satellite-derived LC changes. To overcome these limitations, a new LC product called ECOCLIMAP-SG (Calvet and Champeaux, 2020) has been developed. This product integrates LC data from the European Space Agency (ESA) Climate Change Initiative (CCI) LC v2.0.7 product with vegetation data from the Copernicus Land Monitoring Service (CLMS). This fusion enables the representation of LC changes at a resolution of 300 m and incorporates inter-annual LC variability and seasonal vegetation dynamics (Barella-Ortiz et al., 2022; Li et al., 2018). Previous research has shown that dynamic, high-resolution LC data can enhance the modelling of vegetation growth, energy flux partitioning, albedo, and hydrological processes (Lawrence and Chase, 2007; Liu et al., 2021; Wang et al., 2023). Although improvements to LC datasets can reduce uncertainties in surface parameterisation, it is still important to validate these updates against independent observations. Satellite-based Earth observation (EO) products provide a valuable way of assessing the accuracy of model outputs over large areas and long periods of time. Recent advances in EO have enabled the development of long-term, harmonised satellite products (Gao et al., 2013; de Jeu et al., 2008), which are crucial for validating and benchmarking LSMs. Notably, the ESA Climate Change Initiative (CCI) has produced global datasets for critical surface variables, including snow water equivalent (CCI SWE) and land surface temperature (CCI LST). The CCI products are derived from multi-sensor satellite observations using consistent retrieval algorithms, and have been validated against ground-based measurements to ensure reliability across various climate regimes (Sun et al., 2025; Ling et al., 2021; Pérez-Planells et al., 2023; Reiners et al., 2021; Saeedi et al., 2021). Their spatial resolution and temporal coverage make them suitable for evaluating models at regional to continental scales, helping to identify biases in models and assess structural or parametric deficiencies (Raoult et al., 2018; Seo and Dirmeyer, 2022).
This study evaluates the impact of integrating updated LC information into the Interactions Between Soil, Biosphere and Atmosphere (ISBA) LSM, by benchmarking simulations driven by old LC data and updated CCI LC data. The aim is to assess the influence of the updated LC dataset on the simulation of SWE and LST. We use ESA CCI satellite products and the European Centre for Medium-Range Weather Forecasts (ECMWF) ERA5 reanalysis (Kouki et al., 2023) as reference datasets to evaluate model performance.
This study is organised as follows: Sect. 2 presents the model configuration and observational datasets. Section 3 describes the experimental design. Section 4 presents the benchmarking results. Section 5 discusses the findings of this study. Finally, Sect. 6 outlines future research directions and provides conclusions.
2.1 ISBA model
The ISBA land surface model is integrated within the SURFEX modelling framework, which was developed by the Centre National de Recherches Météorologiques (CNRM) (Masson et al., 2013). Its purpose is to simulate the exchange of energy, water and carbon between snow, the soil-plant system, and the atmosphere. ISBA operates in both coupled and offline modes and is used for a variety of applications, ranging from operational weather forecasting (Giard and Bazile, 2000; Bélair et al., 2003a, b) to climate simulations (Delire et al., 2020). The ISBA model computes various land surface variables, such as soil moisture and temperature, as well as heat, water and energy fluxes. The model can operate at different timescales, ranging from hours to days, and at different spatial scales, ranging from local to global.
This study uses SURFEX version 9 (CNRM, 2023) in offline mode over Europe, i.e. without interacting with an atmospheric model. Snow is represented using an intermediate-complexity snow physics scheme called ISBA-ES (Explicit Snow), which was developed by Boone and Etchevers (2001) and updated by Decharme et al. (2016). This scheme resolves the vertical evolution of the snowpack through multiple layers. The scheme simulates processes such as snow accumulation, compaction, metamorphism, melting, refreezing and sublimation, as well as heat exchanges between the snowpack, the soil, the vegetation canopy and the atmosphere. In the ISBA model, the simulated LST represents the radiative surface temperature of the grid cell. This variable is not simply the average of the temperatures of the soil, vegetation and snow. Instead, it is computed within the ISBA radiative transfer scheme as an effective surface temperature, integrating the contributions of all surface components (i.e. soil, the vegetation canopy, and snow) according to their fractional coverage and radiative properties. In this study, the snowpack comprises twelve layers, while the soil is divided into up to 14 layers. The maximum depths are 12 m for temperature and 2 m for moisture, depending on the vegetation characteristics. Simulations of SWE and LST are analysed. The vertical evolution of soil temperature and moisture is computed using a multi-layer diffusion scheme (Boone et al., 2000; Decharme et al., 2019).
Vegetation dynamics can influence snow accumulation, interception and melt processes. The ISBA configuration used here to represent the soil-plant system is ISBA-A-gs, which is CO2-responsive and explicitly simulates carbon fluxes, gross primary production, and vegetation growth by resolving leaf-level photosynthesis and stomatal conductance (gs) processes (Calvet et al., 1998, 2008). This configuration dynamically computes leaf biomass and leaf area index (LAI) through balancing net carbon assimilation (A) and photosynthesis-dependent senescence using plant functional type-specific SLA (Specific Leaf Area). LAI is a prognostic variable derived from carbon fluxes that evolves dynamically in response to photosynthesis, leaf respiration and senescence processes. In this study, the representation of LAI is particularly important, as it directly affects the surface energy balance and snow processes. Vegetation influences snow accumulation, sublimation and melt dynamics by controlling canopy radiative transfer, turbulent heat fluxes and interception capacity. Dense canopies can, for instance, intercept snowfall, thereby reducing the amount that reaches the ground. Therefore, interactive simulation of LAI is essential to capture the impact of changes in land cover on SWE and LST, even in the absence of direct observational constraints.
2.2 CCI SWE data
As part of the ESA CCI, the CCI Snow project provides a long-term, consistent and well-calibrated climate data record of SWE for the Northern Hemisphere (Luojus et al., 2024). This record is derived from passive microwave radiometer observations during the winter season (October to May). The SWE product (version 3.1) spans the period from January 1979 to May 2022, offering daily coverage at a spatial resolution of 0.10°. It is based on measurements from the SMMR, SSM/I and SSMIS sensors aboard the Nimbus-7 and DMSP platforms. The retrieval algorithm uses the GlobSnow methodology (Luojus et al., 2021) to combine satellite microwave observations with in situ snow depth data via a Bayesian assimilation scheme. This enables robust SWE estimates to be generated, masked for mountainous, glaciated, and coastal regions where retrievals are less reliable. In this study, the daily SWE product from the CCI Snow project is regridded to a coarser resolution of 0.25° to match the horizontal resolution of the ISBA land surface model outputs, using linear interpolation. Linear interpolation was selected because the aim of this study is to compare the ISBA model at its native resolution, rather than to preserve sub-grid variability. The focus is on the European domain, where SWE from satellite observations is compared with ISBA-simulated SWE under two different land cover configurations. The aim is to evaluate the effect of updating the land cover map on modelled snow mass, and to assess the spatial and seasonal consistency of modelled and observed SWE patterns. Given its multi-decade consistency and independence from the ISBA model inputs, the CCI SWE product provides a reference for evaluating the influence of vegetation representation on snow simulations.
2.3 CCI LST data
The LST data used in this study (Ghent et al., 2025) originate from the ESA CCI LST project, which produces various products from different sensors (Pérez-Planells et al., 2023). Thanks to its validated accuracy and temporal consistency, the high-resolution product derived from NASA's Moderate Resolution Imaging Spectroradiometer (MODIS) observations is widely used in climate studies and land surface modelling. The MODIS LST data are available for daytime and night-time overpasses, enabling the characterisation of the diurnal surface temperature cycle across different land types and climate zones. In this study, we use a pre-release version 4 of the Aqua MODIS CCI LST dataset, which is more recent and has been processed at a resolution of 0.05°. This version provides consistent daily LST estimates corresponding to satellite overpass times of approximately 13:30 and 01:30 local solar time (LT), based on Aqua MODIS observations. This temporal resolution allows day and night surface temperature dynamics to be separated. The LST CCI product has been resampled to a resolution of 0.25°, using linear interpolation.
2.4 ERA5 SWE and LST data
In this study, we include SWE and LST data from the ERA5 reanalysis in order to provide an additional, model-based reference with which to compare ISBA simulations and satellite products. ERA5 is the fifth generation of ECMWF atmospheric reanalyses and offers a consistent, physically constrained representation of atmospheric and surface variables globally (Hersbach et al., 2020). The SWE variable takes into account both new snowfall and snow metamorphosis processes. It is computed using a multi-layer snow scheme within the Integrated Forecasting System (IFS), which models processes such as snow compaction, melting and sublimation. Since 2004, ERA5 has assimilated the Interactive Multi-sensor Snow and Ice Mapping System (IMS) product at altitudes below 1500 m. The IMS (Chiu et al., 2020; Orsolini et al., 2019) is produced by the National Oceanic and Atmospheric Administration (NOAA). It combines microwave, visible, and infrared satellite data to produce snow cover data for the Northern Hemisphere with a spatial resolution of 4 km. ERA5 snow depth data is available with an hourly temporal resolution and a horizontal resolution of approximately 31 km, globally, since 1979. The ERA5 data were originally provided on a regular 0.25°×0.25° latitude–longitude grid. In our study, daily averages of snow depth and hourly LST are extracted and interpolated onto the same 0.25° grid as the ISBA outputs over the European domain, using linear interpolation. Although not an observational product, ERA5 provides a valuable, physically consistent estimate of snowpack evolution that can contextualise differences between model simulations and satellite retrievals.
2.5 CCI LC data
This study investigates the impact of incorporating ESA CCI Land Cover (LC) data into the ISBA land surface model. Two datasets are considered: ECOCLIMAP-II (Faroux et al., 2013) and the updated ECOCLIMAP-SG (Calvet and Champeaux, 2020). These LC products are used within the SURFEX platform to define biophysical parameters associated with vegetation types by classifying them into plant functional types (PFTs). These PFTs include categories such as broadleaf and needleleaf forests, C3/C4 crops, irrigated areas, bare soil, grasslands and more. Surface parameters of the ISBA model are associated with each PFT and can vary depending on the local cover composition. For the purposes of this study, a configuration of 12 PFTs has been set. While ECOCLIMAP-II relies on older land cover inventories (Corine Land Cover 2000, GLC2000), ECOCLIMAP-SG integrates higher-resolution ESA CCI LC data at 300 m and accounts for recent land use changes. Consequently, the differences between the two datasets reflect actual LC changes that occurred between the early 2000s and 2010, as well as improvements resulting from more recent satellite observations and a higher spatial resolution. Therefore, the New LC dataset should not be interpreted as solely depicting LC change, but rather as providing a more realistic representation of LC conditions during the study period. This study uses CCI LC v2.0.7 for the year 2010. Figure 1 illustrates the dominant land cover types over Europe at a spatial resolution of 0.25°, as represented in ECOCLIMAP-II and ECOCLIMAP-SG. These will be referred to as Old LC and New LC, respectively, throughout the rest of this study.

Figure 1Dominant land cover type over Europe at a spatial resolution of 0.25°×0.25° as derived from (a) Old LC ECOCLIMAP-II (Faroux et al., 2013), (b) New LC ECOCLIMAP-SG (Calvet and Champeaux, 2020), with CCI LC v2.0.7 2010, and (c) model grid cells (in blue) where ESA CCI SWE is available. The subdomain used for the LST evaluation is indicated by the red solid line. The 12 dominants land cover types are indicated in the colour bar: 1 – flooded shrubs or grass, 2 – tropical grasslands, 3 – temperate grasslands, 4 – flooded trees, 5 – C4 crops (e.g. maize), 6 – C3 crops (e.g. wheat), 7 – broadleaf evergreen trees, 8 – coniferous trees, 9 – deciduous broadleaf trees, 10 – permanent snow and ice, 11 – rocks, urban, 12 – ocean and water bodies, 13 – bare soil with no vegetation.
Substantial regional differences emerge due to variations in the source data and methodology. The Old LC tends to underestimate forest cover, particularly coniferous forests, across northern Europe. These forests are more extensively represented in New LC. In contrast, New LC, which integrates more recent, higher-resolution, satellite-derived vegetation products, exhibits finer spatial variability and improved delineation of agricultural and wetland areas. Notably, C4 crops are more accurately localised in southern and Eastern Europe in New LC. There is less bare soil in Mediterranean regions and the Middle East. Irrigation is no longer categorised as a land surface type. Instead, it relies on independent irrigation maps, meaning that all vegetation types can be irrigated (Druel et al., 2022).
Two offline experiments were conducted using the SURFEX v9 framework over the European domain (28.125° N–71.875° N, 25.875° W–63.875° E) to evaluate the sensitivity of the ISBA simulations to land cover input. The experiments used Old LC and New LC data. These offline simulations cover the period from January 2010 to September 2022 and are not coupled with an atmospheric model. Instead, they are driven by hourly ERA5 atmospheric reanalysis data (Muñoz-Sabater et al., 2021), which has been interpolated to the ISBA grid at a resolution of 0.25°×0.25° using bilinear interpolation. LAI and SWE are calculated interactively and are not constrained by satellite observations. Both LC simulations use the ISBA-A-gs and ISBA-ES configurations and have the same model structure and physical parameterisations. To ensure equilibrium of deep soil temperature and root-zone moisture, long spin-up integrations preceded both setups. Specifically, a 200-year generic spin-up was followed by two multidecadal spin-ups for Old LC and New LC, as described by Liu et al. (2025). The multidecadal spin-ups consisted of the same 10-year period repeated at least four times to ensure equilibrium by 31 December 2009, prior to the start of the evaluation period (2010–2022). This ensures stable initial conditions for the evaluation period. The model's outputs are updated every three hours (00:00, 03:00, 06:00 UTC and so on) for land grid cells excluding large water bodies, rocks and urban surfaces. The number of valid land grid cells ranges from 34 801 for the Old LC to 35 775 for New LC. These outputs are then compared with satellite estimates of SWE and LST from the ESA CCI datasets. The ISBA SWE simulations are also compared with ERA5 SWE simulations.
The LST subdomain is shown in Fig. 1. We conduct two distinct analyses to benchmark ISBA-simulated LST against CCI LST: one for daytime (12:00 UTC) and one for night-time (00:00 UTC), over a subdomain that covers the westernmost part of the domain (10° W–30° E, 28.125° N–71.875° N). This separation improves the assessment of model performance in capturing diurnal temperature variations, which are essential for energy balance and hydrological modelling. This enables us to benchmark the model's performance and quantify the impact of land cover updates. We consider the Pearson correlation coefficient (R), the root-mean square difference (RMSD), normalised RMSD (nRMSD), and the unbiased RMSD (ubRMSD) score values, together with the mean bias (MB). The square of the RMSD value is equal to the sum of the squares of the ubRMSD and the MB. The nRMSD is the RMSD divided by the mean SWE and LST values above a certain threshold. Threshold values of 15 mm and 5 °C are used for SWE and LST, respectively. The simulated LST is derived from the surface energy balance and corresponds to the temperature that would reproduce the longwave radiation emitted by the heterogeneous surface. As such, it can be directly compared with satellite LST products, which also represent a radiometric surface temperature. In our analysis, we extract the simulated LST at model time steps closest to satellite overpass times (13:30 LT for daytime and 01:30 LT for nighttime), thereby ensuring temporal consistency with ESA CCI LST data.
For SWE, all statistics are computed only where ESA CCI SWE is available (Fig. 1c), after the datasets have been temporally aligned and restricted to snow relevant grid cells (i.e. grid cells with valid snow data). This ensures the use of valid SWE data and strict temporal alignment between modelled and observed values. A consistent spatial mask derived from the ESA CCI SWE product is used to retain only grid cells for which at least one valid CCI SWE value was available over the study period. This mask was then systematically applied to all datasets, including the ISBA simulations (Old LC and New LC configurations), as well as ERA5.
ISBA LAI, LST and SWE anomalies are computed as standardised anomalies (z-scores) with respect to a multi-year climatology. For each grid point, the time series is grouped by calendar day (day of year (DOY)), and the climatological mean and standard deviation are computed for each corresponding day of year across all available years. The scaled anomaly of a variable x at time t is then defined as follows:
where x′(t) is the standardized anomaly at time t, and μDOY(t) and σDOY(t) are the climatological mean and standard deviation of x for the corresponding DOY at that grid point. This approach removes the seasonal cycle. The scaled anomalies are expressed in terms of standard deviations, allowing for consistent comparisons across regions and variables.
4.1 Climatological features and anomaly patterns in ISBA simulations
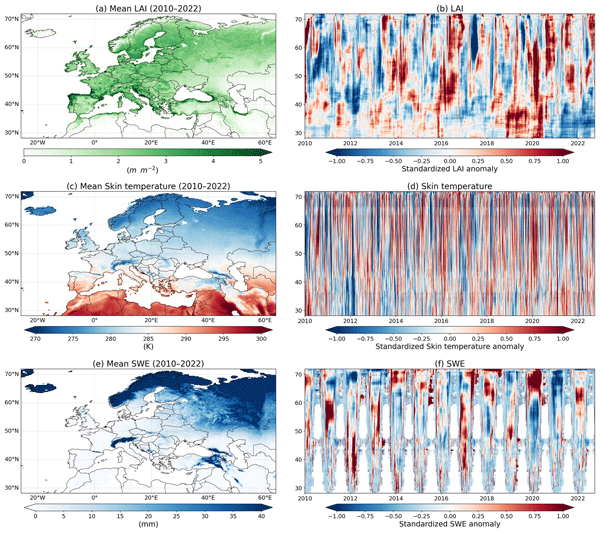
The results of New LC are presented in Fig. 2, with a focus on key surface variables: LAI, LST, and SWE. Panels (a), (c) and (e) show the climatological means of LAI, LST and SWE over Europe for the period 2010–2022, respectively. LAI (panel a) is higher in forested areas. LST (panel c) follows latitudinal climatic forcing patterns, with higher values in southern Europe and progressively cooler conditions towards the north. SWE (panel e) is largely confined to northern latitudes and alpine regions, consistent with colder conditions and zones of seasonal snow accumulation. These spatial distributions highlight the expected climate-driven gradients and confirm the physical consistency between surface water, energy and vegetation processes as modelled in ISBA. The standardised Hovmöller diagrams (panels b, d and f) show how scaled anomalies (Eq. 1) in LAI, LST and SWE vary across different latitudes and over time. LAI anomalies (panel b) reveal strong seasonal dynamics and interannual variability, particularly in the middle latitudes, where positive anomalies were prominent in 2016 and in 2020. One notable feature is the winter of 2020, when positive anomalies were simultaneously observed in LAI, LST and SWE across the northernmost latitudes. This coherent signal highlights a large-scale warm anomaly that affects both vegetation activity and surface thermal conditions. While SWE anomalies primarily occur in northern regions during winter, the co-occurrence of these anomalies with positive temperature anomalies during this event indicates a strong coupling between vegetation dynamics and the surface energy balance in the presence of unusually warm winter conditions.
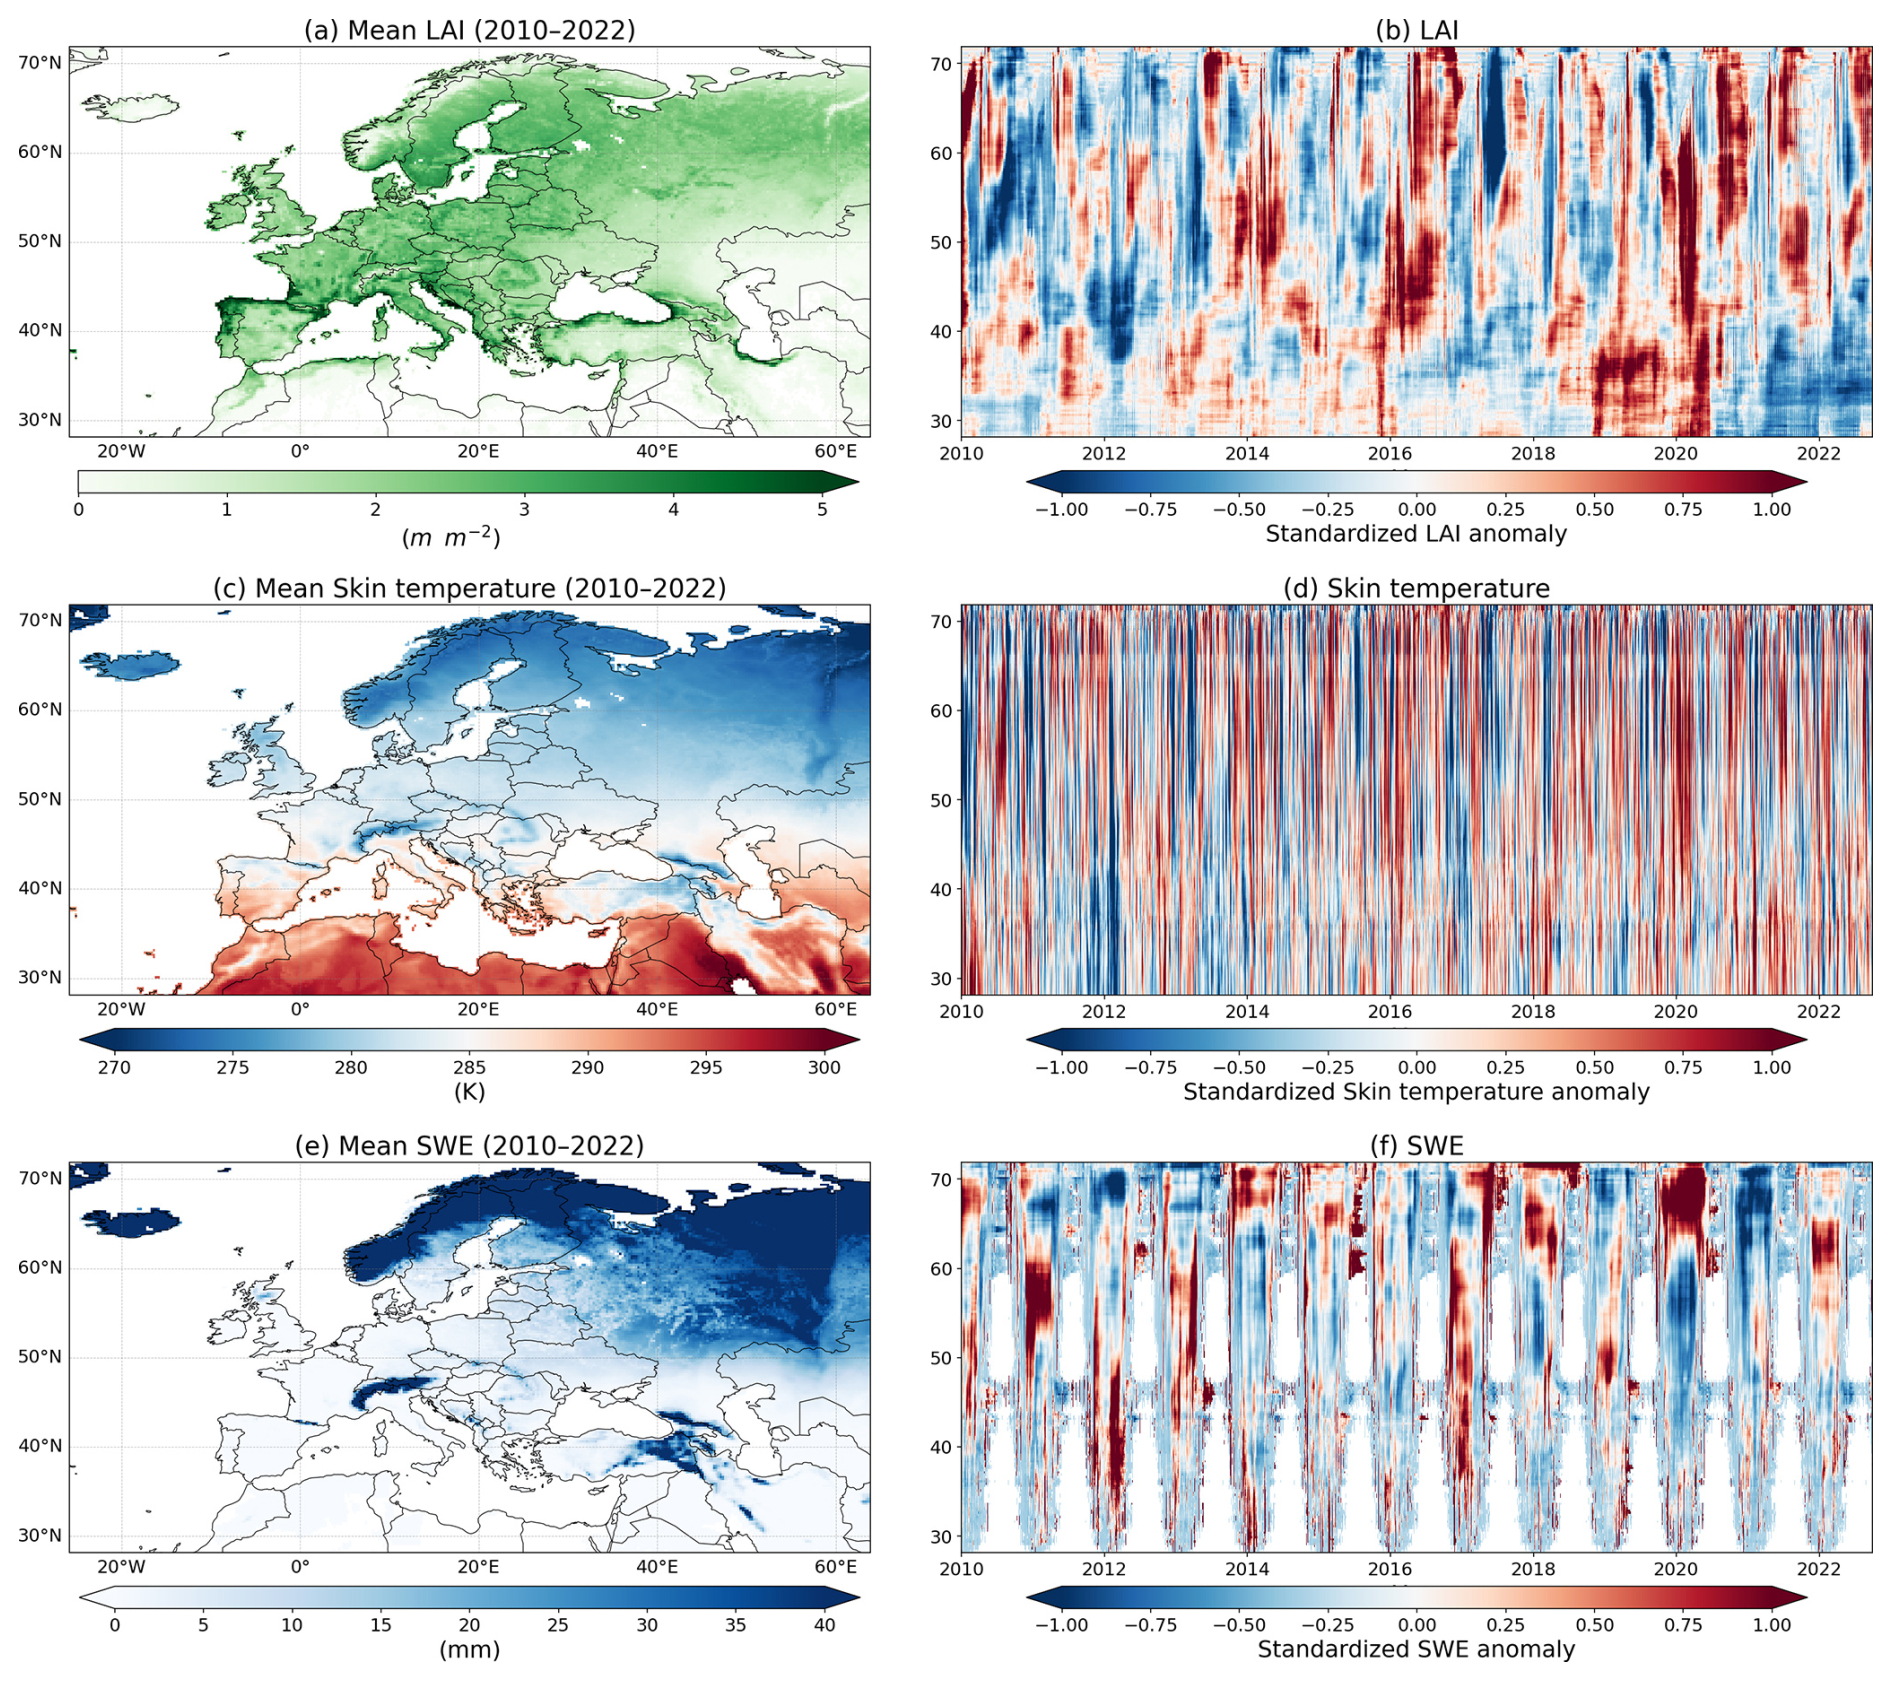
Figure 2New LC simulations over the whole European domain forced by ERA5 atmospheric variables from 2010 to 2022 at a spatial resolution of 0.25°×0.25°: Mean values (a, c, e) and Hovmöller plot (b, d, f) of scaled anomalies (z-score) of (a, b) LAI, (c, d) LST, and (e, f) SWE.
These shifts in vegetation activity may reflect climatic influences, such as warm winters, heatwaves or droughts. LST anomalies (panel d) exhibit a consistent latitudinal pattern, featuring the warm winter of 2020 that coincides with SWE deficits in mid-latitude regions and SWE excess at high latitudes (panel f).
4.2 Assessment of New LC SWE simulations
Figure 3 shows the time series of the SWE, averaged over the entire European domain from 2010 to 2022. It compares the SWE derived from ESA CCI satellite data with the SWE simulated by Old LC and New LC, as well as the ERA5 SWE. All datasets capture the expected seasonal cycle of snow accumulation and melt, with consistent timing across years. However, the ISBA simulations consistently overestimate peak SWE values compared to the ESA CCI product, especially during the warm winter of 2020, when differences between models and CCI SWE exceed 20 mm. Using New LC slightly reduces the overestimation compared to the Old LC, narrowing the difference with the CCI SWE. ERA5 performs better in terms of amplitude and variability. However, some differences remain with the satellite product, particularly during the warm winter of 2020.
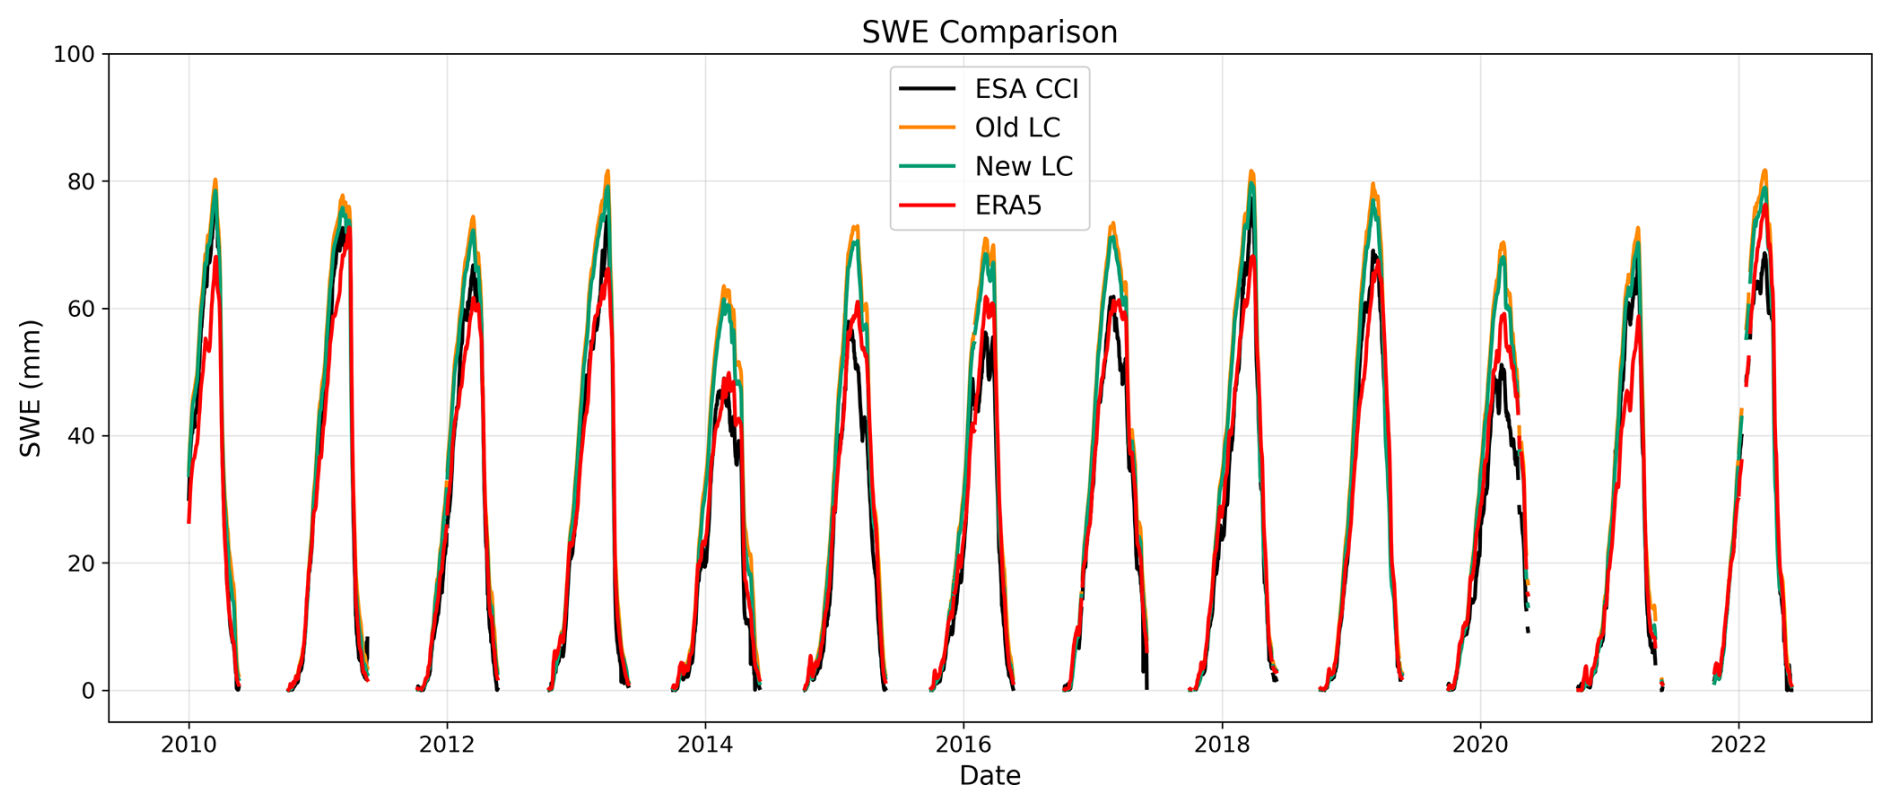
Figure 3Time series of daily mean SWE values over the whole European domain from 2010 to 2022, based on the CCI SWE dataset, New LC, Old LC, and the ERA5 SWE.
Figure 4 presents the spatial patterns of SWE. The maps compare the mean SWE fields from CCI and New LC for the period 2010–2022, along with the difference between them. While the model generally captures the large-scale distribution of SWE, regional biases are evident, particularly in northern Europe. In regions like Sweden and Finland, the model underestimates SWE despite its tendency to overestimate peak values in the time series shown in Fig. 3.
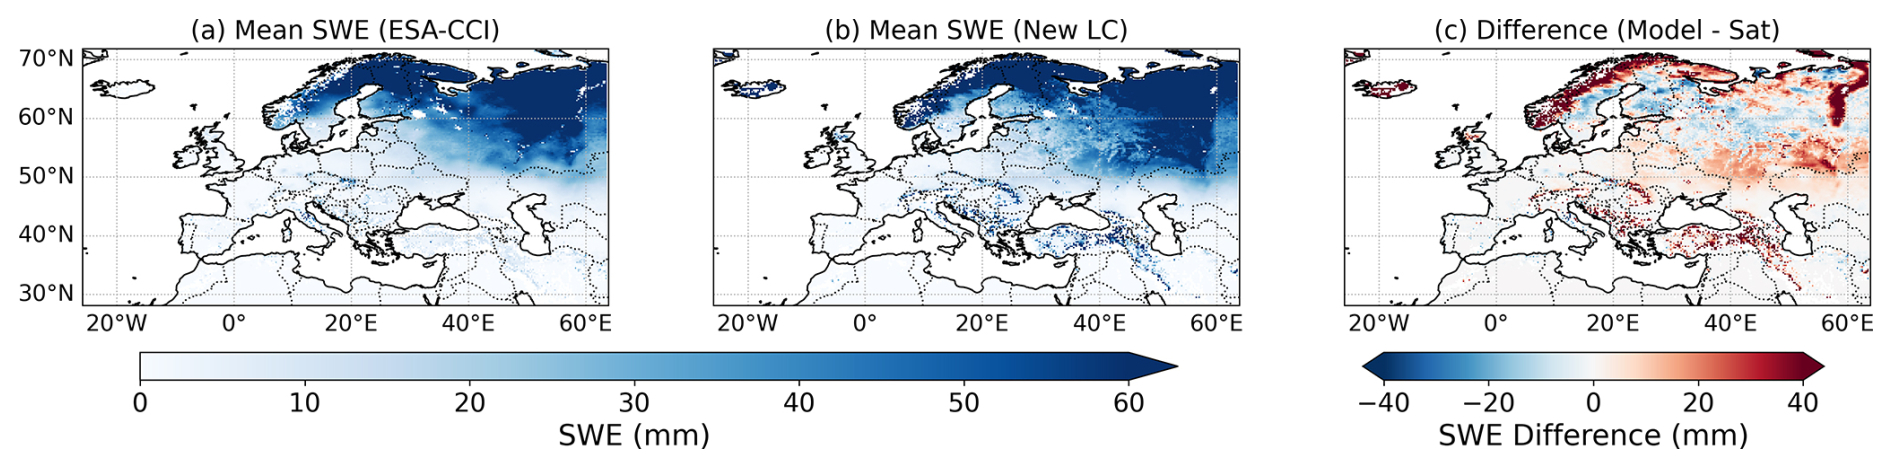
Figure 4Maps of mean SWE values at altitudes below 1500 m across the whole of Europe from 2010 to 2022 derived from: (a) CCI SWE, (b) New LC, and (c) the difference between New LC and CCI SWE.
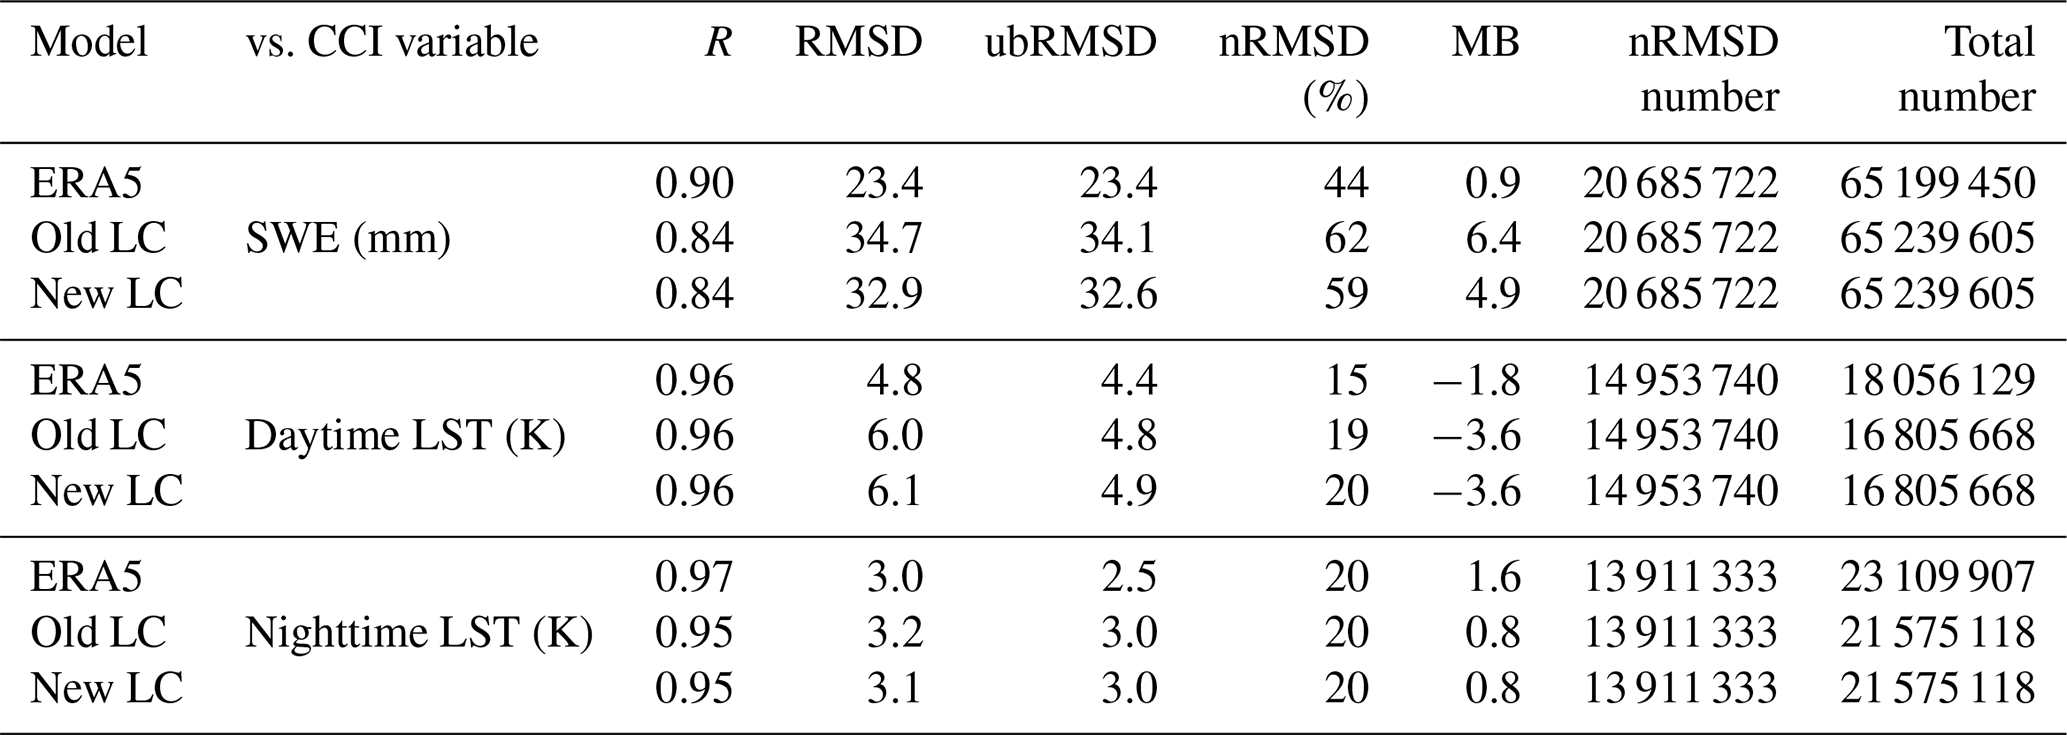
The statistical evaluation summarised in Table 1 provides further support for these findings. The effect of using New LC on ISBA SWE simulations over Europe is detailed in Fig. S1 in the Supplement. Using the New LC does not change the mean Pearson correlation coefficient between the modelled and observed SWE (R=0.84). This indicates that there is essentially no change in the temporal agreement with ESA CCI SWE. On the other hand, RMSD, ubRMSD, nRMSD, and MB are slightly reduced in New LC simulations: from 34.7 to 32.9 mm, 34.1 to 32.6 mm, 62 % to 59 %, and 6.4 to 4.9 mm, respectively. This suggests that the more detailed and updated LC dataset more accurately represents snow accumulation processes in ISBA, while only achieving modest improvements in domain-averaged SWE performance. This is primarily due to reductions in systematic errors, rather than changes in temporal agreement with ESA CCI SWE.
Table 1Mean grid-cell level score values of the New LC and Old LC simulations for SWE and LST (both daytime and nighttime) over the 2010–2022 period. SWE score values are over the whole European domain. LST score values are for the westernmost part of the domain (10° W–30° E, 28.125° N–71.875° N). The number of data and score values for ERA5 are also shown.
To further evaluate the impact of land cover representation on ISBA snow simulations, we move beyond domain-averaged statistics (see Table 1) and analyse the spatial distribution of performance score differences in relation to CCI SWE. Figure 5 shows the difference in performance between simulations using New LC and Old LC.
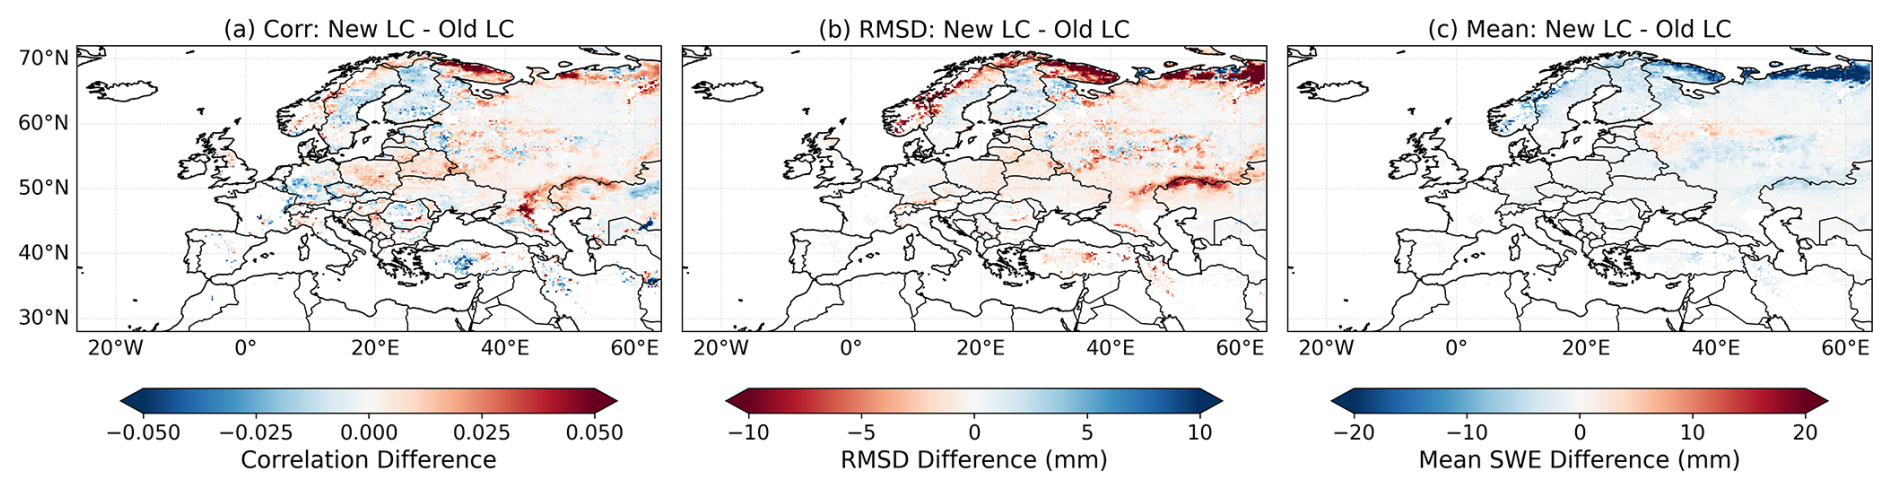
Figure 5Spatial differences in the statistical performance metrics of New LC and Old LC SWE simulations with respect to CCI SWE over the whole European domain, over the 2010–2022 period: difference in (a) R, (b) RMSD and (c) mean difference of SWE between the two simulations. For R and RMSD, red zones indicate improvement (e.g. higher correlations or lower errors) when using New LC, while blue zones indicate degradation.
The comparison reveals a heterogeneous spatial response to changes in land cover. While improvements are evident in regions such as Eastern Europe, a slight degradation is visible over areas of northern Europe, particularly in Southern Sweden, and Finland.
Figure 6 illustrates the comparison between New LC SWE simulations and ERA5 SWE with respect to CCI SWE. The correlation difference map shows that, in general, ERA5 achieves a higher level of agreement with satellite-derived snow dynamics than the ISBA simulation, particularly across central and northern Europe. The RMSD difference map further highlights ERA5's superior performance across much of the domain, as indicated by the large areas of blue showing lower total errors. However, specific regions such as Northern Italy show local advantages for ISBA. The SWE difference map shows that New LC consistently produces higher mean SWE values than the ERA5 simulations across large areas, particularly in high-latitude and mountainous regions. These patterns align with the SWE biases in New LC (Fig. 4c), indicating that SWE positive biases are less pronounced in ERA5.
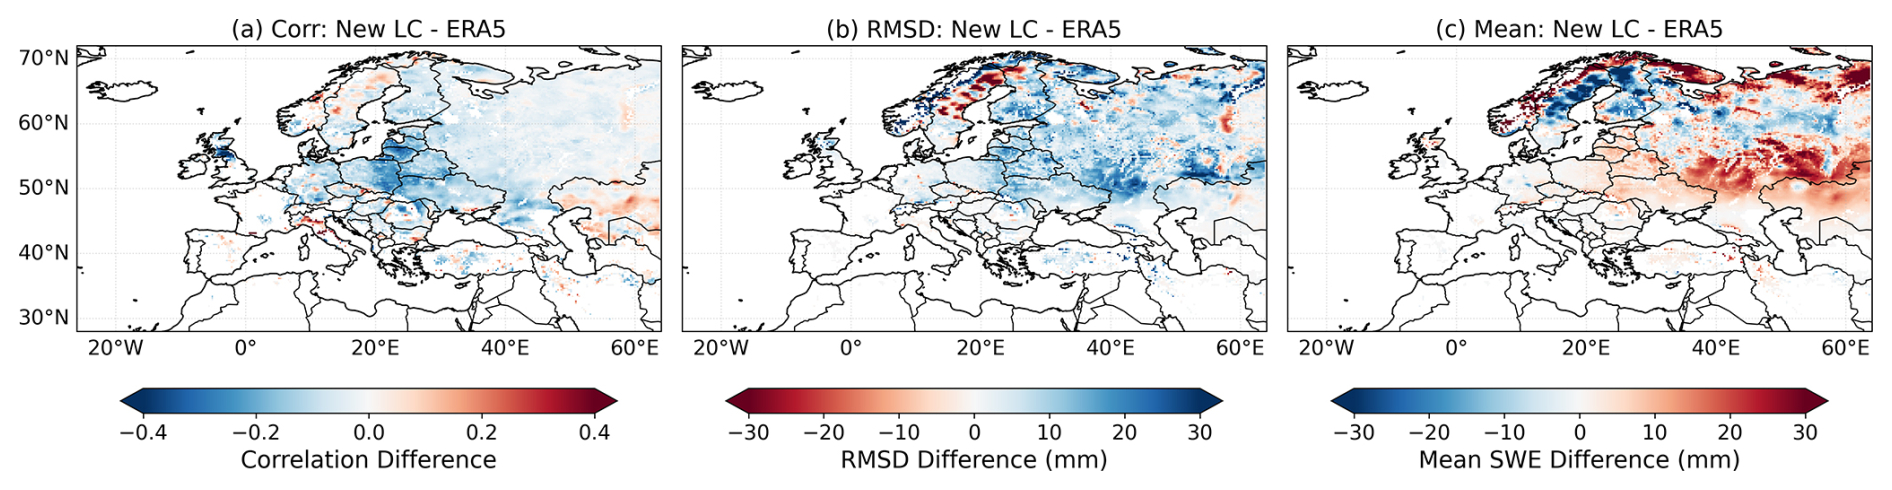
Figure 6As in Fig. 5, except for differences between New LC and ERA5.
Figure 7 shows the cumulative distribution functions (CDFs) of score values to complement this spatial assessment, summarising model performance across all grid cells.
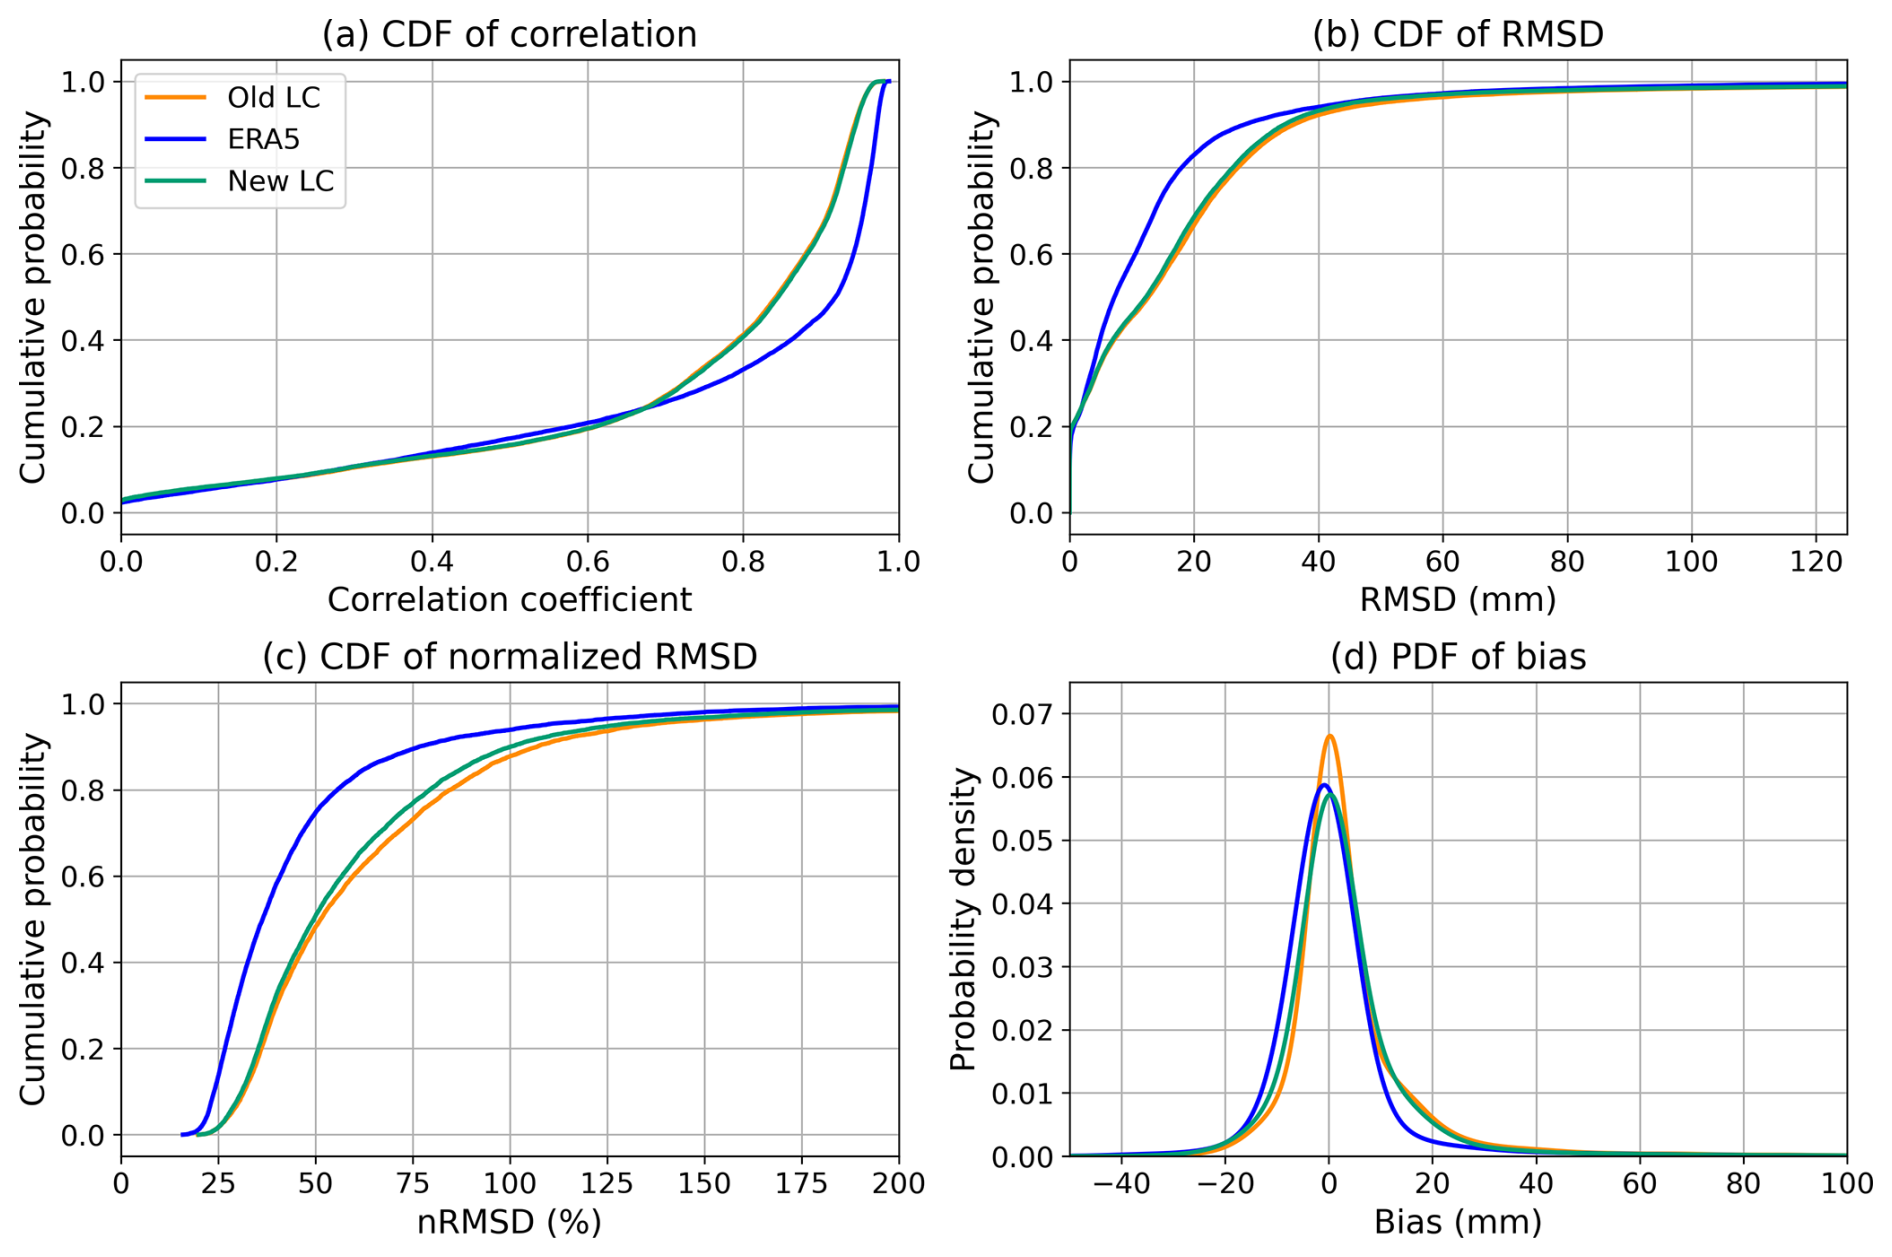
Figure 7Cumulative distribution functions (CDFs) of (a) R, (b) RMSD, and (c) ubRMSD, alongside (d) the probability density function (PDF) of the bias, for SWE simulations from Old LC, New LC, and ERA5 (red, green, and blue, respectively), benchmarked against CCI SWE the whole European domain for the period 2010–2022.
ERA5 shows the highest R values and the lowest RMSD and ubRMSD values overall. Over half of the points have correlation values above 0.8, indicating that all three models (ERA5, Old LC and New LC) accurately depict the seasonal changes in SWE. However, the correlation distributions of Old LC and New LC are very similar, which is consistent with the domain-averaged statistics shown in Table 1. Over 90 % of the domain has RMSD values below 40 mm. As climatological SWE varies substantially across Europe, nRMSD (Fig. 7c) provides a more meaningful measure of relative error. This metric corroborates the findings derived from absolute RMSD, indicating that ERA5 exhibits the lowest relative errors across the majority of the domain. Conversely, the New LC simulation consistently shifts the nRMSD distribution towards lower values compared to Old LC, suggesting a notable reduction in relative SWE errors following land cover updates. Although the bias spread of the New LC is not reduced compared to the old LC, instances of systematic SWE overestimation have been significantly reduced. Therefore, the main difference between the two ISBA simulations is not an obvious improvement in temporal correlation, but rather a slight reduction in RMSD, ubRMSD and mean bias, alongside a more notable reduction in nRMSD. The corresponding CDFs of ubRMSD and normalised ubRMSD are provided in the Supplement (Fig. S7).
4.3 Assessment of ISBA LST simulations
Figures 8 and 9 show that there is a persistent cold bias in ISBA daytime LST over the westernmost part of the domain, while nighttime LST is slightly overestimated. As shown in Table 1, using New LC has a limited impact on the daytime and nighttime LST bias. It also shows that, while ERA5 LST is more consistent with CCI LST than ISBA in terms of RMSD, ubRMSD and nRMSD, its nighttime warm bias is larger (1.6 compared to 0.8 K for ISBA). ERA5 LST bias is reduced during the day compared with New LC (−1.8 and −3.7 K, respectively). The effect of using New LC on ISBA LST simulations over Europe is detailed in Figs. S2 and S3, for both daytime and nighttime.
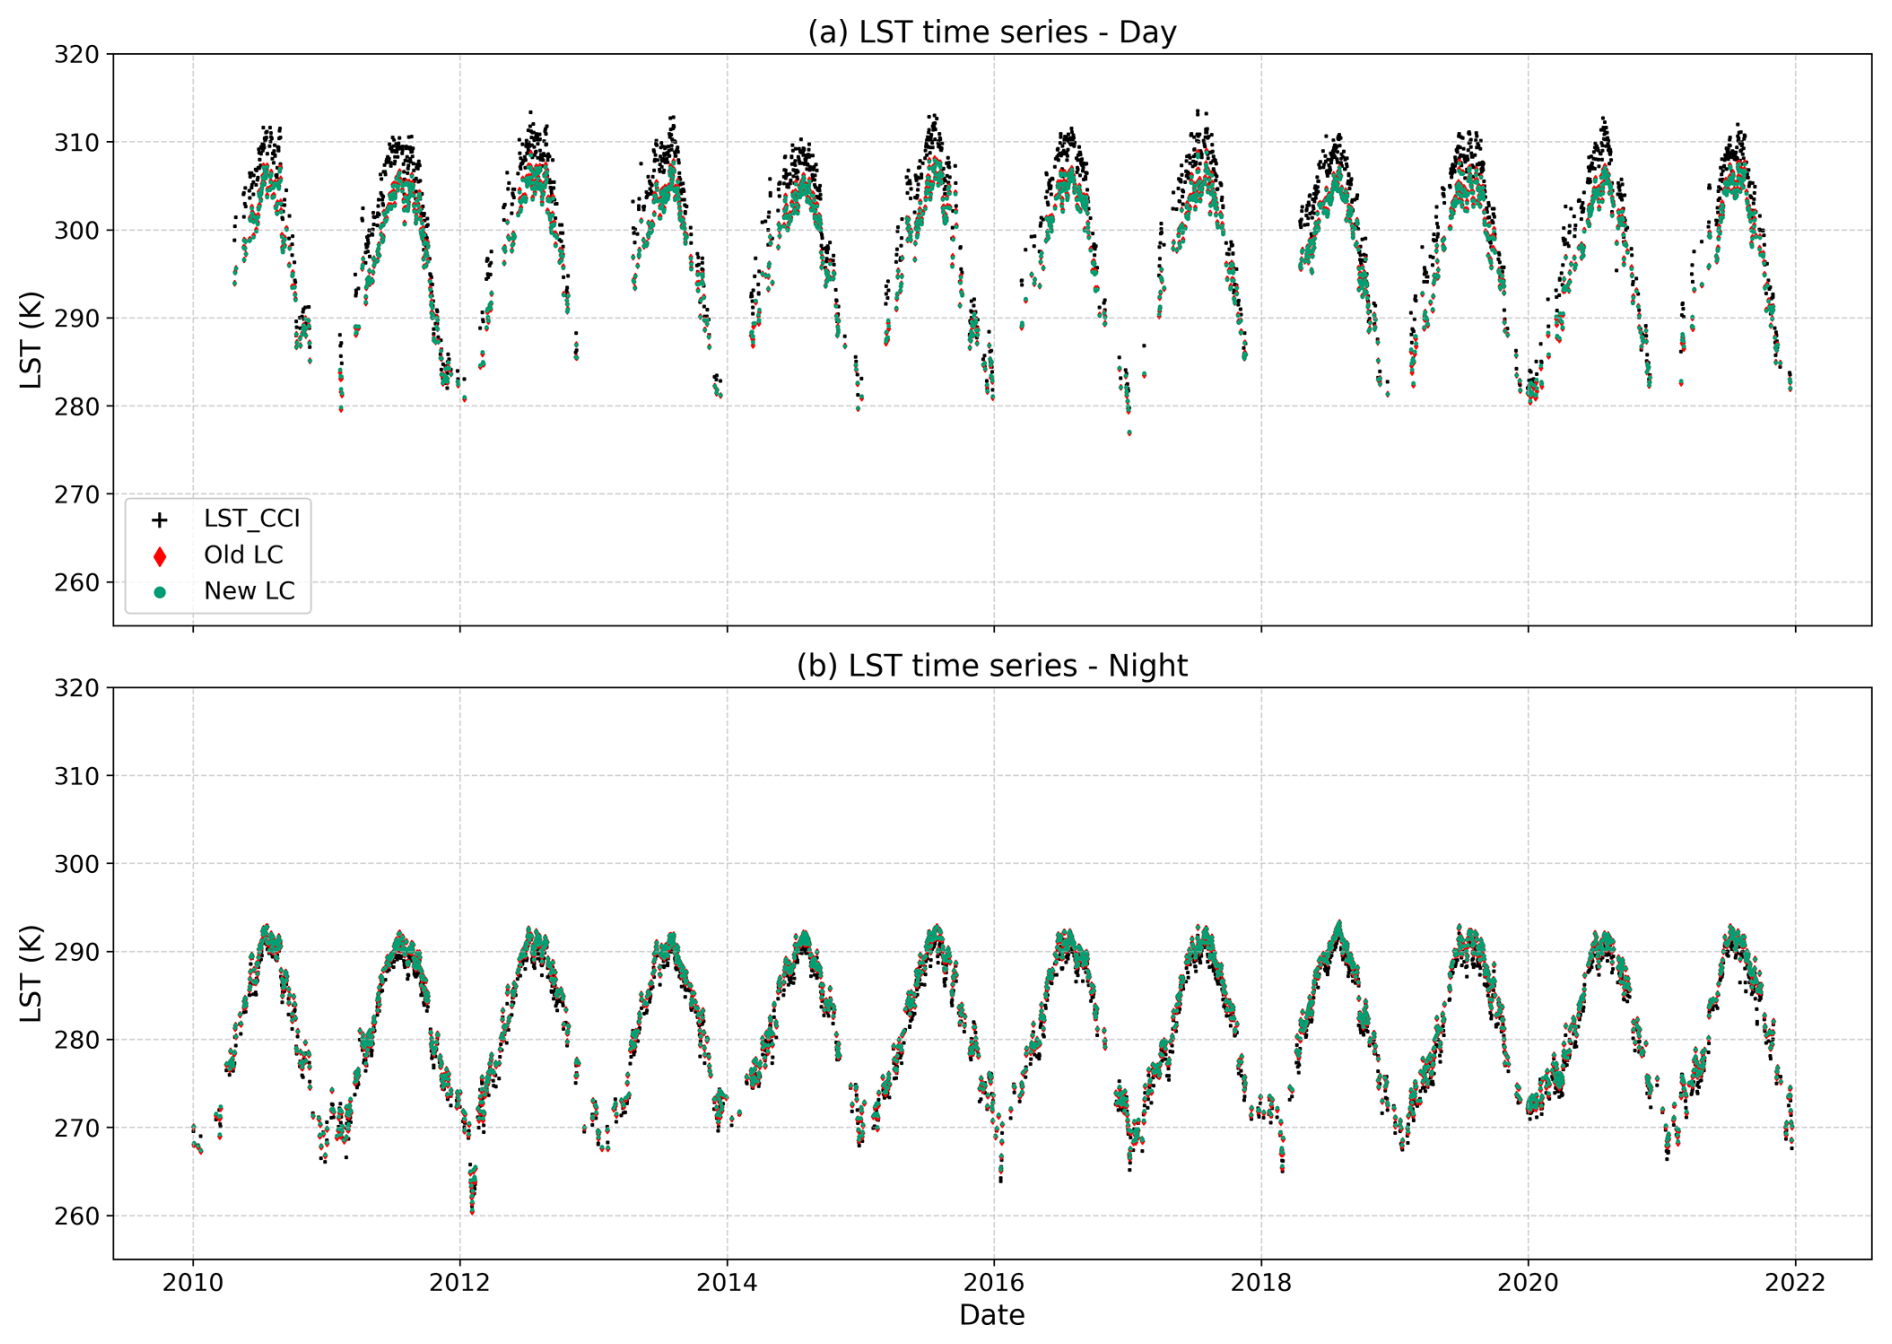
Figure 8Time series of mean LST value over westernmost part of the domain (10° W–30° E, 28.125° N–71.875° N) from CCI LST, Old LC and New LC from 2010 to 2022: (a) daytime values at 13:30 LT for CCI LST, (b) nighttime at 01:30 LT, corresponding to ISBA simulations at 12:00 and 00:00 UTC, respectively.
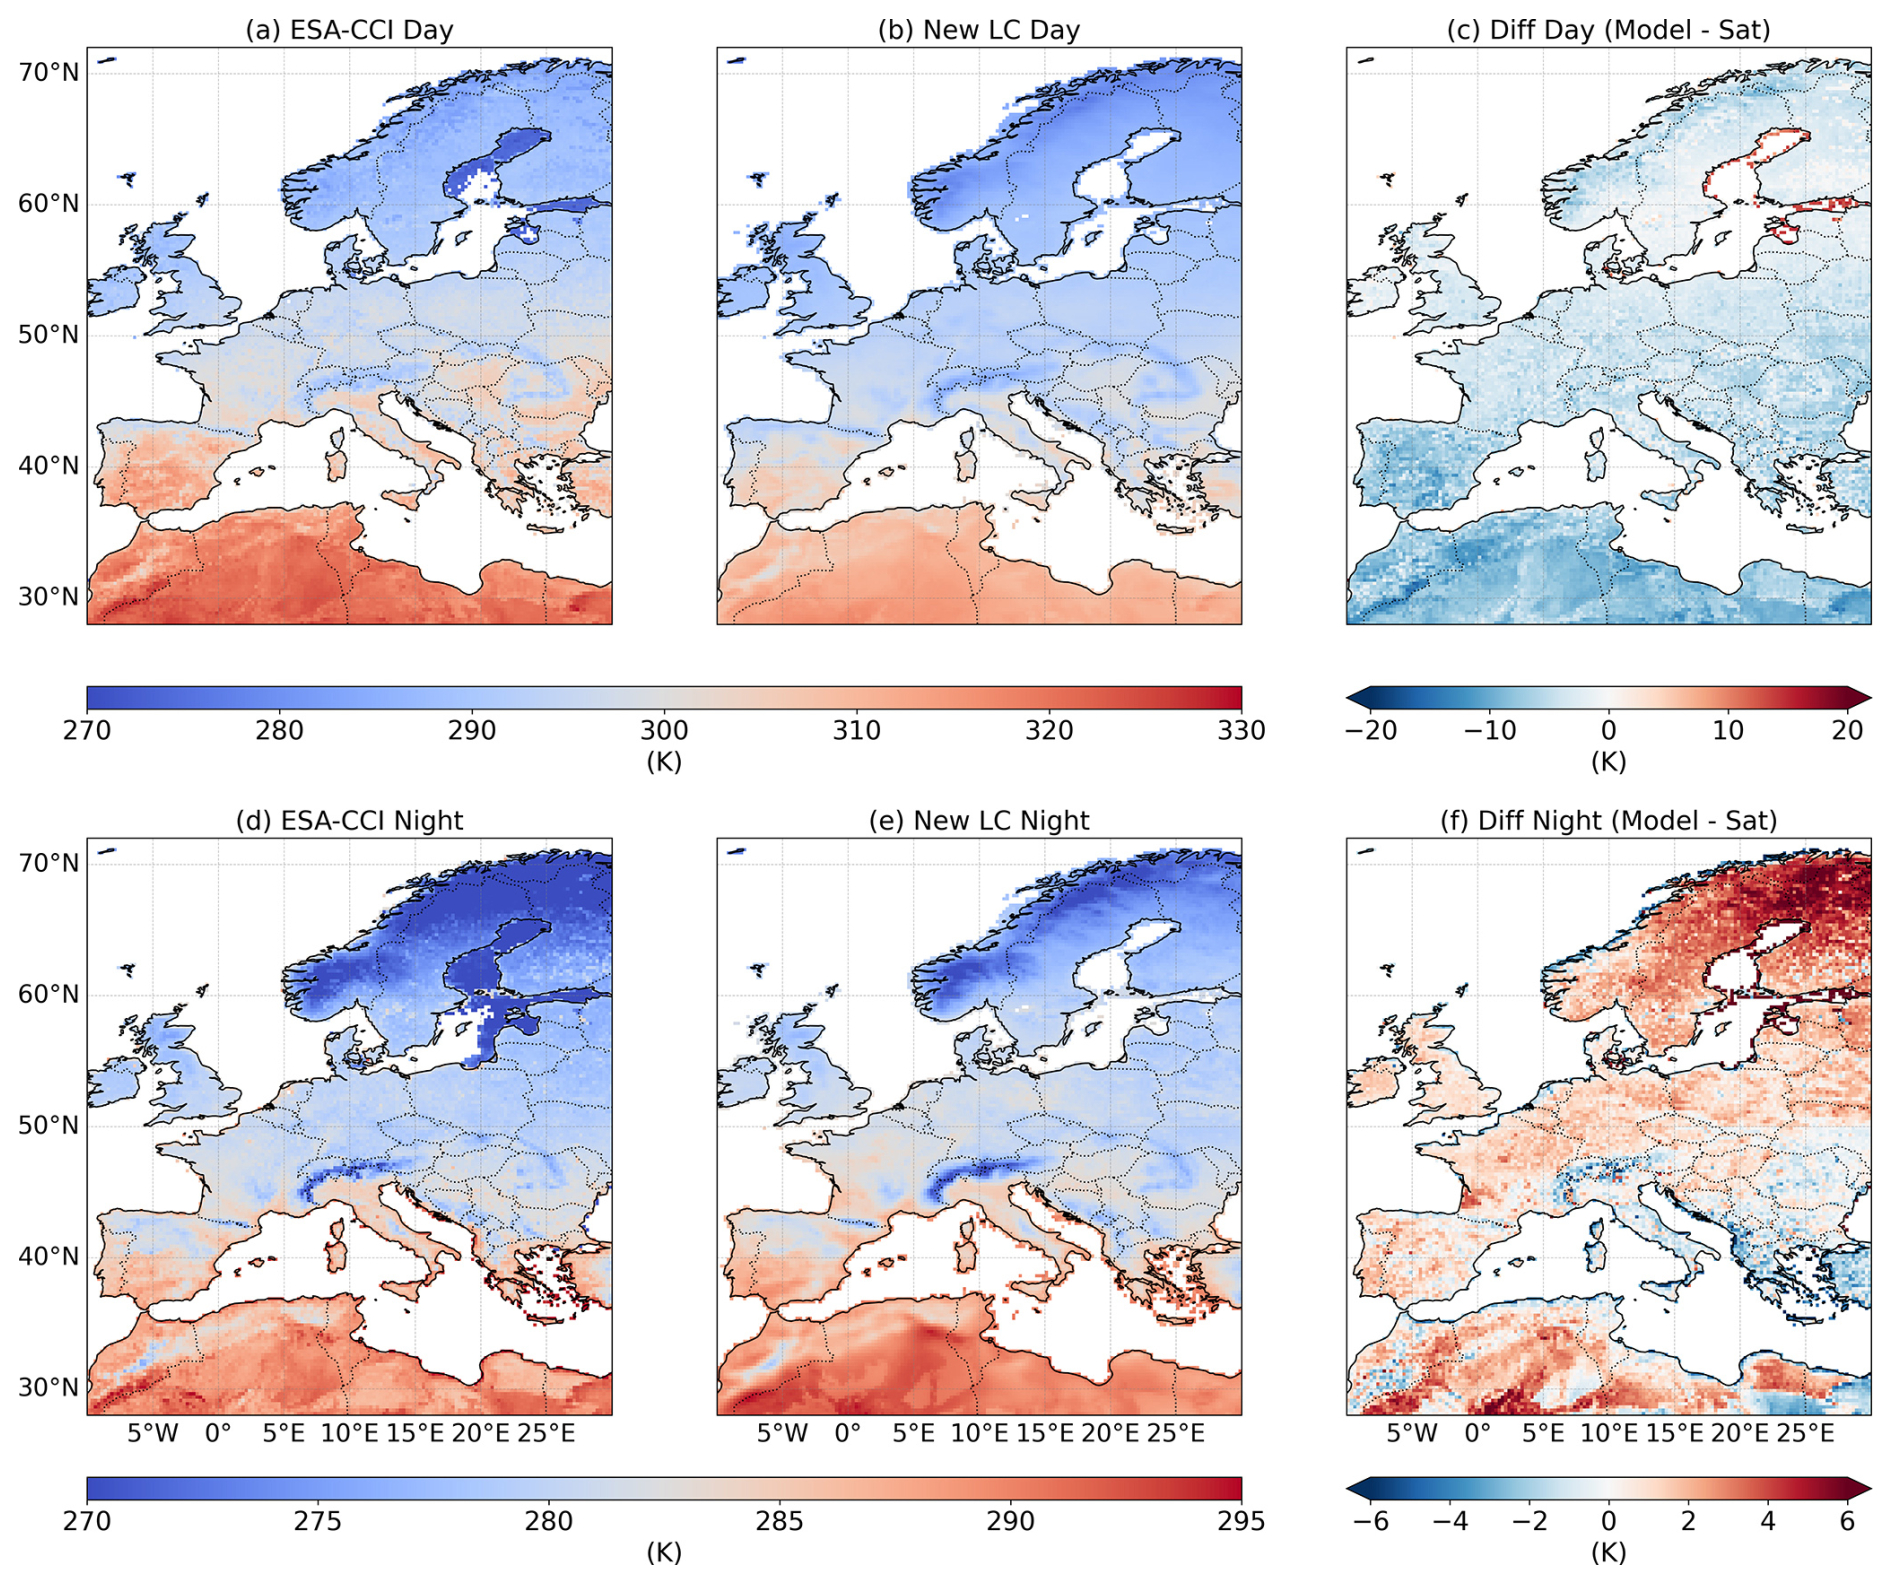
Figure 9Maps showing the mean (a, b, c) daytime and (d, e, f) nighttime (bottom) LST values over westernmost part of the domain (10° W–30° E, 28.125° N–71.875° N) for the whole 2010–2022 study period, derived from (a, d) CCI LST, (b, e) New LC and (c, f) the difference between New LC and CCI LST.
When considering only snow-free conditions (see Table S1), the LST score values are not fundamentally different to those shown in Table 1. When considering the December–January–February (DJF) winter season only (Table S2), the MB values are reduced, but the nighttime ubRMSD values of New LC increase. Considering snow-free conditions and the DJF season simultaneously (Table S3) yields smaller nighttime ubRMSD values for New LC and ERA5.
5.1 How do LC changes affect ISBA SWE simulations?
In order to address this question, we conducted a thorough quantification of LC changes across the domain. Specifically, we calculated the number of grid cells affected by each transition and their relative spatial coverage (percentage of grid cells), as well as the associated changes in SWE and model performance metrics (bias, RMSD and ubRMSD). Our analysis shows that LC changes are highly heterogeneous in both space and impact. The most frequent transitions, e.g. grasslands to deciduous broadleaf forests (DBF) and grasslands to coniferous forests (CNF), affect approximately 4 % to 5 % of grid cells, whereas the majority of transitions affect less than 1 % of the domain individually (see Table 2).
Table 2Summary of the top 20 dominant land-cover transitions ranked by SWE RMSD changes. For each transition (Old LC to New LC), the domain-wide number and percentage of affected grid cells are reported, alongside the associated area-weighted reductions in SWE MB, RMSD and ubRMSD, in regions where snow is observed. Changes larger than 4 % are in bold. The remaining transitions are reported as “Other changes”. DBF and CNF stand for deciduous broadleaf forests and coniferous forests, respectively.
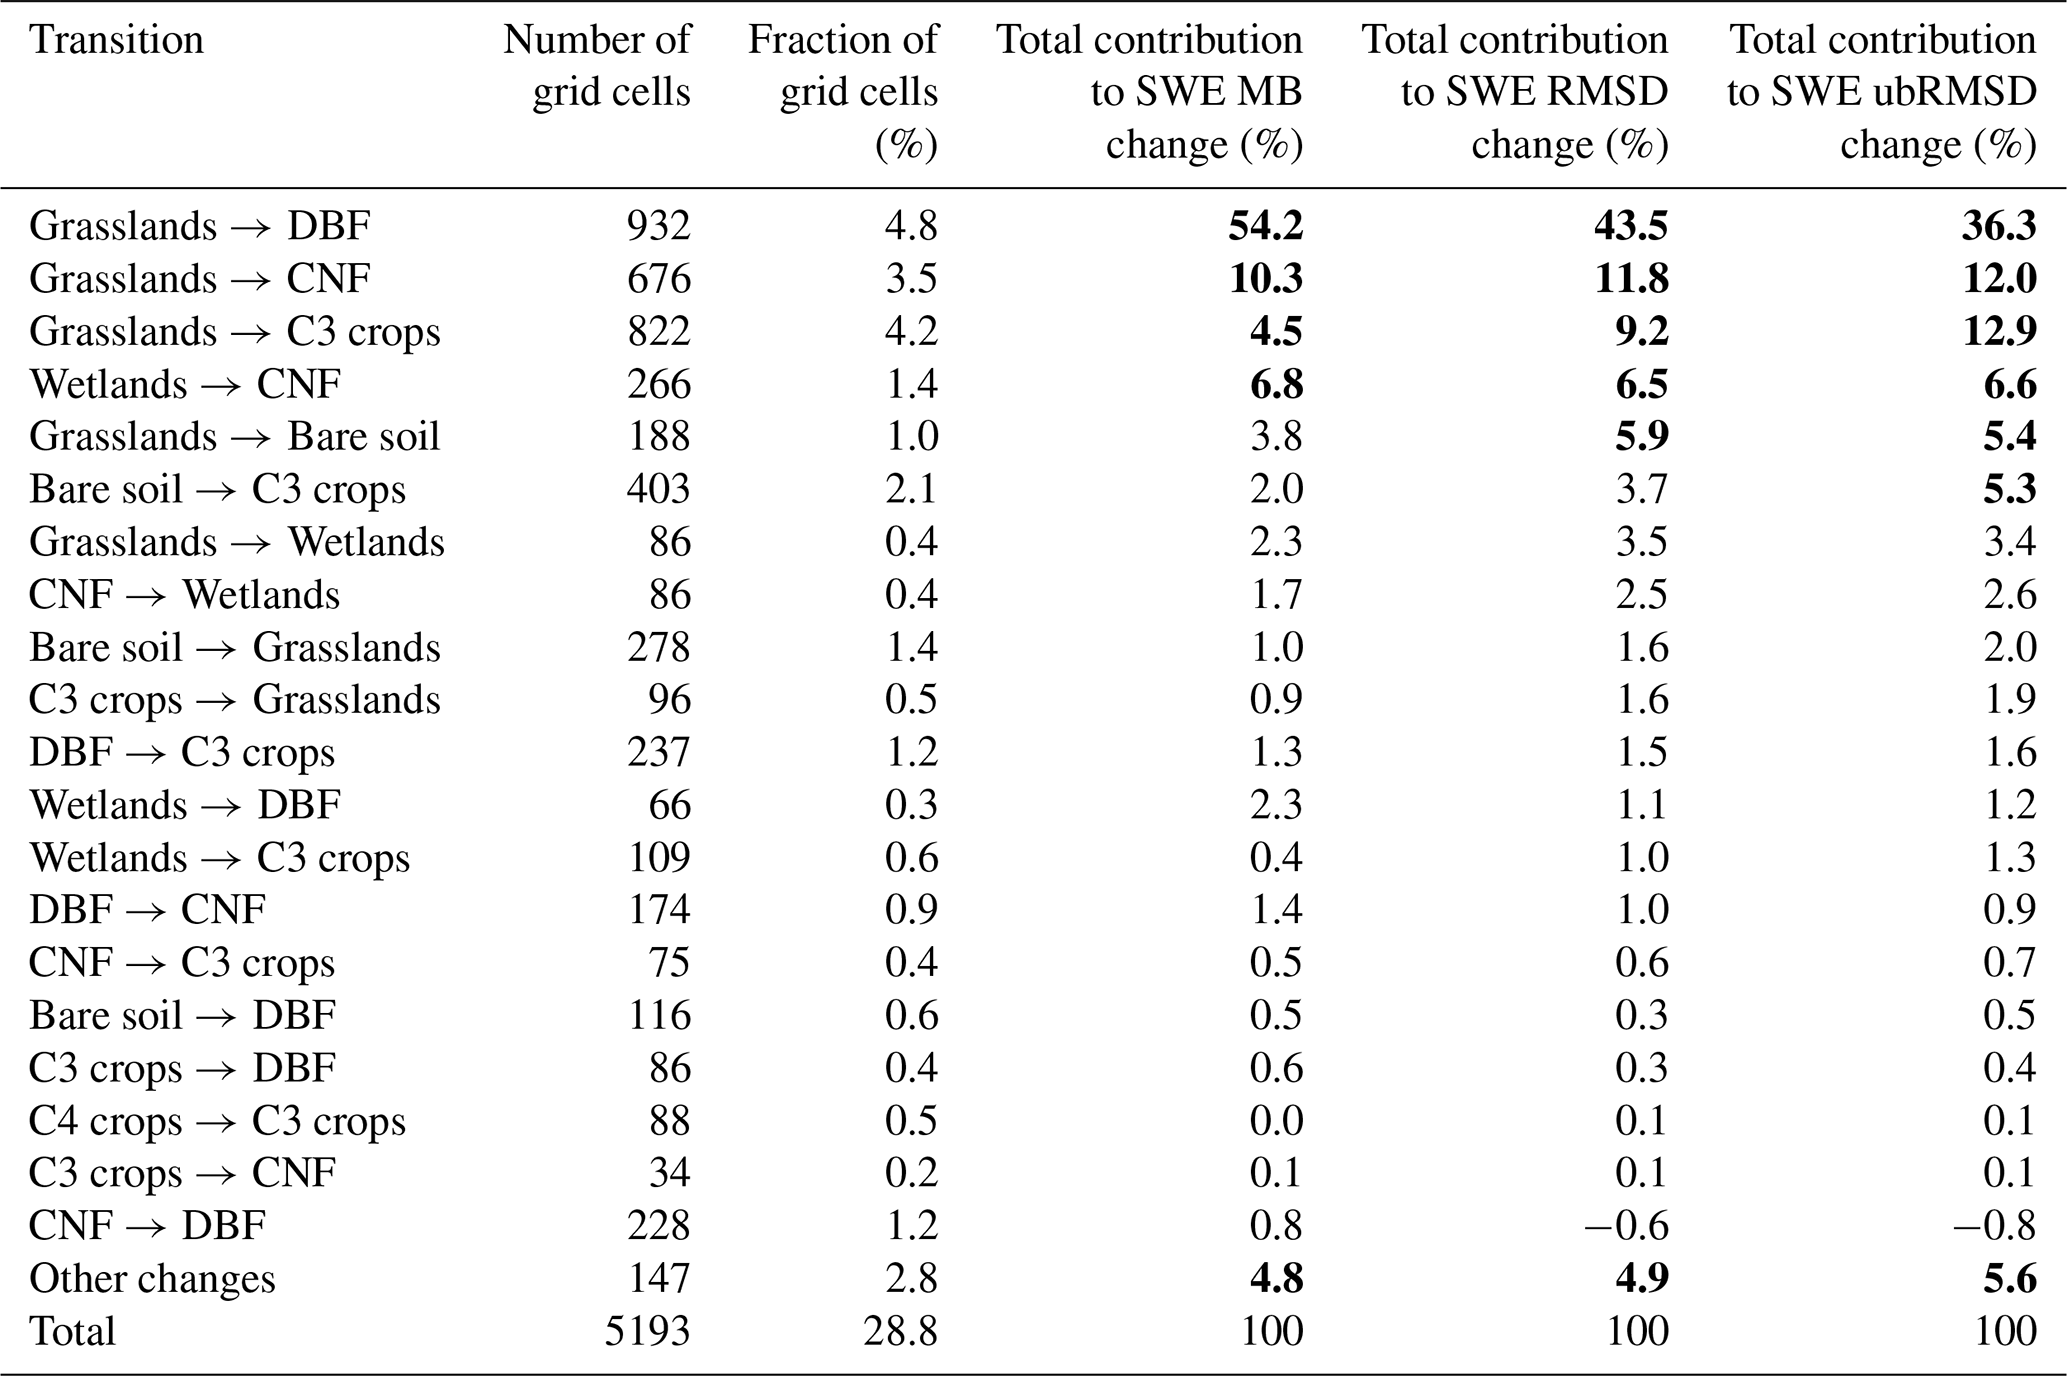
While not all areas experiencing an LC change lead to a significant change in SWE, some of these transitions can produce noticeable local changes in SWE despite their limited spatial extent. This is illustrated by the scatterplot in Fig. S1, which compares SWE values simulated with Old LC and New LC. The very high correlation (R=0.996) indicates that, at the domain scale, most grid cell values remain close to the 1:1 relationship. This indicates that a significant proportion of LC changes do not result in notable differences in SWE. This behaviour is consistent with the spatial analysis of changes in the fractions of dominant and non-dominant PFTs, as shown in Figs. S4 and S5, respectively. As Fig. S4 shows, only a subset of the snow-relevant domain exhibits a change in PFT, while large areas remain unchanged. Furthermore, Fig. S4 and Table 2 show that, although multiple LC transitions occur, their spatial extent and frequency vary considerably. The largest impacts, however, are associated with transitions from grasslands to forested classes (DBF and CNF), as these substantially modify vegetation structure and snow-vegetation interactions. These changes affect processes such as canopy interception, sublimation, and radiative exchanges, resulting in more pronounced differences in SWE. Importantly, Fig. S5 shows that changes in SWE are not restricted to areas where the dominant PFT changes. Significant variations can also occur where the dominant PFT remains unchanged, but sub-grid vegetation fractions are redistributed. In such cases, modifications in canopy density or vegetation mixture can alter snow-related processes and induce SWE changes independently of dominant LC transitions. Overall, these results suggest that SWE does not systematically respond to all changes in LC. Instead, its response depends on the type of transition and the extent of the associated structural changes to the vegetation.
The impact of LC change on SWE is strongly transition-dependent and certain LC changes were responsible for most of the change in MB. A small number of transitions dominate the overall signal, exhibiting both a relatively large spatial extent and a strong local effect on SWE (see Table 2). The largest SWE changes are associated with transitions from grasslands to forest types, particularly the transitions from grasslands to DBF and CNF. As shown in Table 2, these transitions produce the strongest area-weighted reduction in SWE RMSD in regions where snow is observed (43.5 % and 11.8 %, respectively), and are also associated with substantial improvements in mean bias (54.2 % and 10.3 %, respectively), and ubRMSD (36.3 % and 12 %, respectively). Transitions from grasslands to C3 crops, wetlands to CNF, grasslands to bare soil and bare soil to C3 crops also make a significant contribution to the area-weighted reduction in SWE ubRMSD, at 12.9 %, 6.6 %, 5.4 % and 5.3 % respectively. These transitions are widespread across the landscape (see Fig. S4) and occur in regions where increased vegetation density and canopy effects significantly modify snow accumulation and melt processes. Notably, the sign of SWE MB change (New LC – Old LC) is predominantly negative for these dominant transitions, indicating a systematic reduction in positive bias when using New LC. This suggests that New LC generally improves the representation of SWE magnitude in the affected regions compared to Old LC. Conversely, many other transitions exhibit only minor contributions, either because they affect a limited number of grid cells, or because their local impact on SWE is weak. These transitions can therefore be considered as having a negligible influence on the domain-scale bias. Overall, these results demonstrate that change in MB is largely controlled by a small number of meaningful vegetation transitions rather than being uniformly distributed across all LC changes.
Transitions from bare soil to DBF are present in the domain (see Fig. S4) and are associated with local changes in SWE that can be detected (see Table 2). These transitions are physically meaningful as they correspond to substantial modifications to surface properties, notably the introduction of vegetation where none was previously dominant. From a process-based perspective, the transition from bare soil to DBF affects several key mechanisms that control snow accumulation and ablation. Notably, the presence of a forest canopy results in the interception of snowfall, enhanced sublimation from the canopy and modifications to the surface energy balance through changes in albedo, longwave radiation and turbulent fluxes. These processes can lead to a reduction in snow accumulation on the ground and/or changes in melt dynamics, thereby impacting SWE. However, despite these clear local effects, these transitions only have a limited impact on the domain-wide SWE signal. As shown in Table 2, transitions involving bare soil (e.g. bare soil to DBF) account for only a small proportion of grid cells, contributing modestly to the total change in both RMSD and mean bias compared to more widespread transitions, such as grasslands to DBF or CNF. This suggests that, although bare soil to forest transitions can have a significant local impact on SWE, they do not dominate the large-scale response. Instead, overall SWE changes are primarily driven by extensive vegetation shifts that affect a larger portion of the snow-relevant domain.
Despite these local improvements, the overall impact of the updated LC on domain-averaged SWE performance remains modest. This reflects the highly heterogeneous spatial influence of LC updates: while some vegetation transitions substantially reduce SWE errors, many regions either exhibit no LC change or experience transitions with limited influence on snow simulations. Consequently, domain-averaged statistics improve only slightly, despite clear local improvements in specific regions. These results also suggest that land cover representation is just one factor influencing the accuracy of SWE simulations. The remaining SWE errors are influenced by uncertainties in atmospheric forcing, snowfall, precipitation phase partitioning, snow physical parameterisations, vegetation structural characteristics and topographic effects. Therefore, further improvements in SWE simulations will likely require a combination of updated LC information and advances in atmospheric forcing, snow process representation and satellite data assimilation rather than relying on LC improvements alone.
5.2 Do LST errors cause the models' SWE bias?
As shown in Table 1 and Fig. 3, both Old LC and New LC, as well as ERA5, tend to overestimate SWE with respect to the CCI SWE data. Using New LC reduces the mean SWE bias from 6.4 to 4.9 mm. As New LC has little impact on the daytime cold bias or the nighttime warm bias, the overestimation of SWE cannot be explained by mean LST biases alone. Figure 9 shows the daytime and nighttime LST bias of New LC over the westernmost part of the domain.
The cold bias in daytime LST is more pronounced in southern regions (North Africa and Spain) than in areas prone to snow. Conversely, the night-time warm bias is more pronounced in the north-eastern part of the domain, where snowfall is more frequent. These results suggest that improving LC is beneficial for representing SWE, but this improvement cannot be explained by a better representation of LST. The limited response of daytime and nighttime LST to New LC can be attributed to the structural aspects of the ISBA model. This likely reflects the complex interplay of vegetation, turbulent fluxes, solar radiation and soil heat storage. These factors go beyond static vegetation descriptors and cannot easily be corrected through land cover updates alone. For example, in many regions of Sweden and Finland, New LC introduces changes in the fractions of non-dominant PFTs (see Fig. S5). Interactions between snow cover and forests are complex and can lead to increased model errors (Deschamps-Berger et al., 2025). New LC may also affect LAI throughout the seasons. The effect of using New LC on LAI simulations is presented in the Supplement (Fig. S6). ERA5 also overestimates CCI SWE. Since ERA5 incorporates IMS snow observations, it is possible that the CCI SWE product itself may underestimate the actual SWE. A known limitation of the CCI SWE product is that the algorithm can only retrieve SWE data for snow packs with a thickness of less than 1 m. This is because the microwave brightness temperature signal saturates beyond a depth of 1 m or in the presence of wet snow (Barella et al., 2024). As Luojus et al. (2021) discuss, the passive microwave signal used in SWE retrievals progressively saturates for deep snowpacks, corresponding to SWE values greater than 150 mm. Such values typically occur for snow depths of more than ∼ 1 m, under conditions where the sensitivity of the signal to additional snow mass decreases. This results in a systematic underestimation of SWE and increased uncertainty in the satellite product. To better assess this issue in our study, we analysed the distribution of SWE values in the ESA CCI dataset over the evaluation domain (see Fig. S8 for the histogram). This analysis shows that the vast majority of SWE values are below 150 mm, with only a small fraction exceeding this threshold (approximately 3 % of the total valid points in this case). Therefore, although high SWE values (>150–200 mm) do occur, they represent only a small proportion of the dataset and do not dominate the overall statistics. As the passive microwave signal used in SWE retrievals saturates, the real proportion of SWE values above 150 mm is higher than in the CCI SWE. Therefore, this threshold should be interpreted as an approximate upper limit beyond which the reliability of satellite-derived SWE decreases.
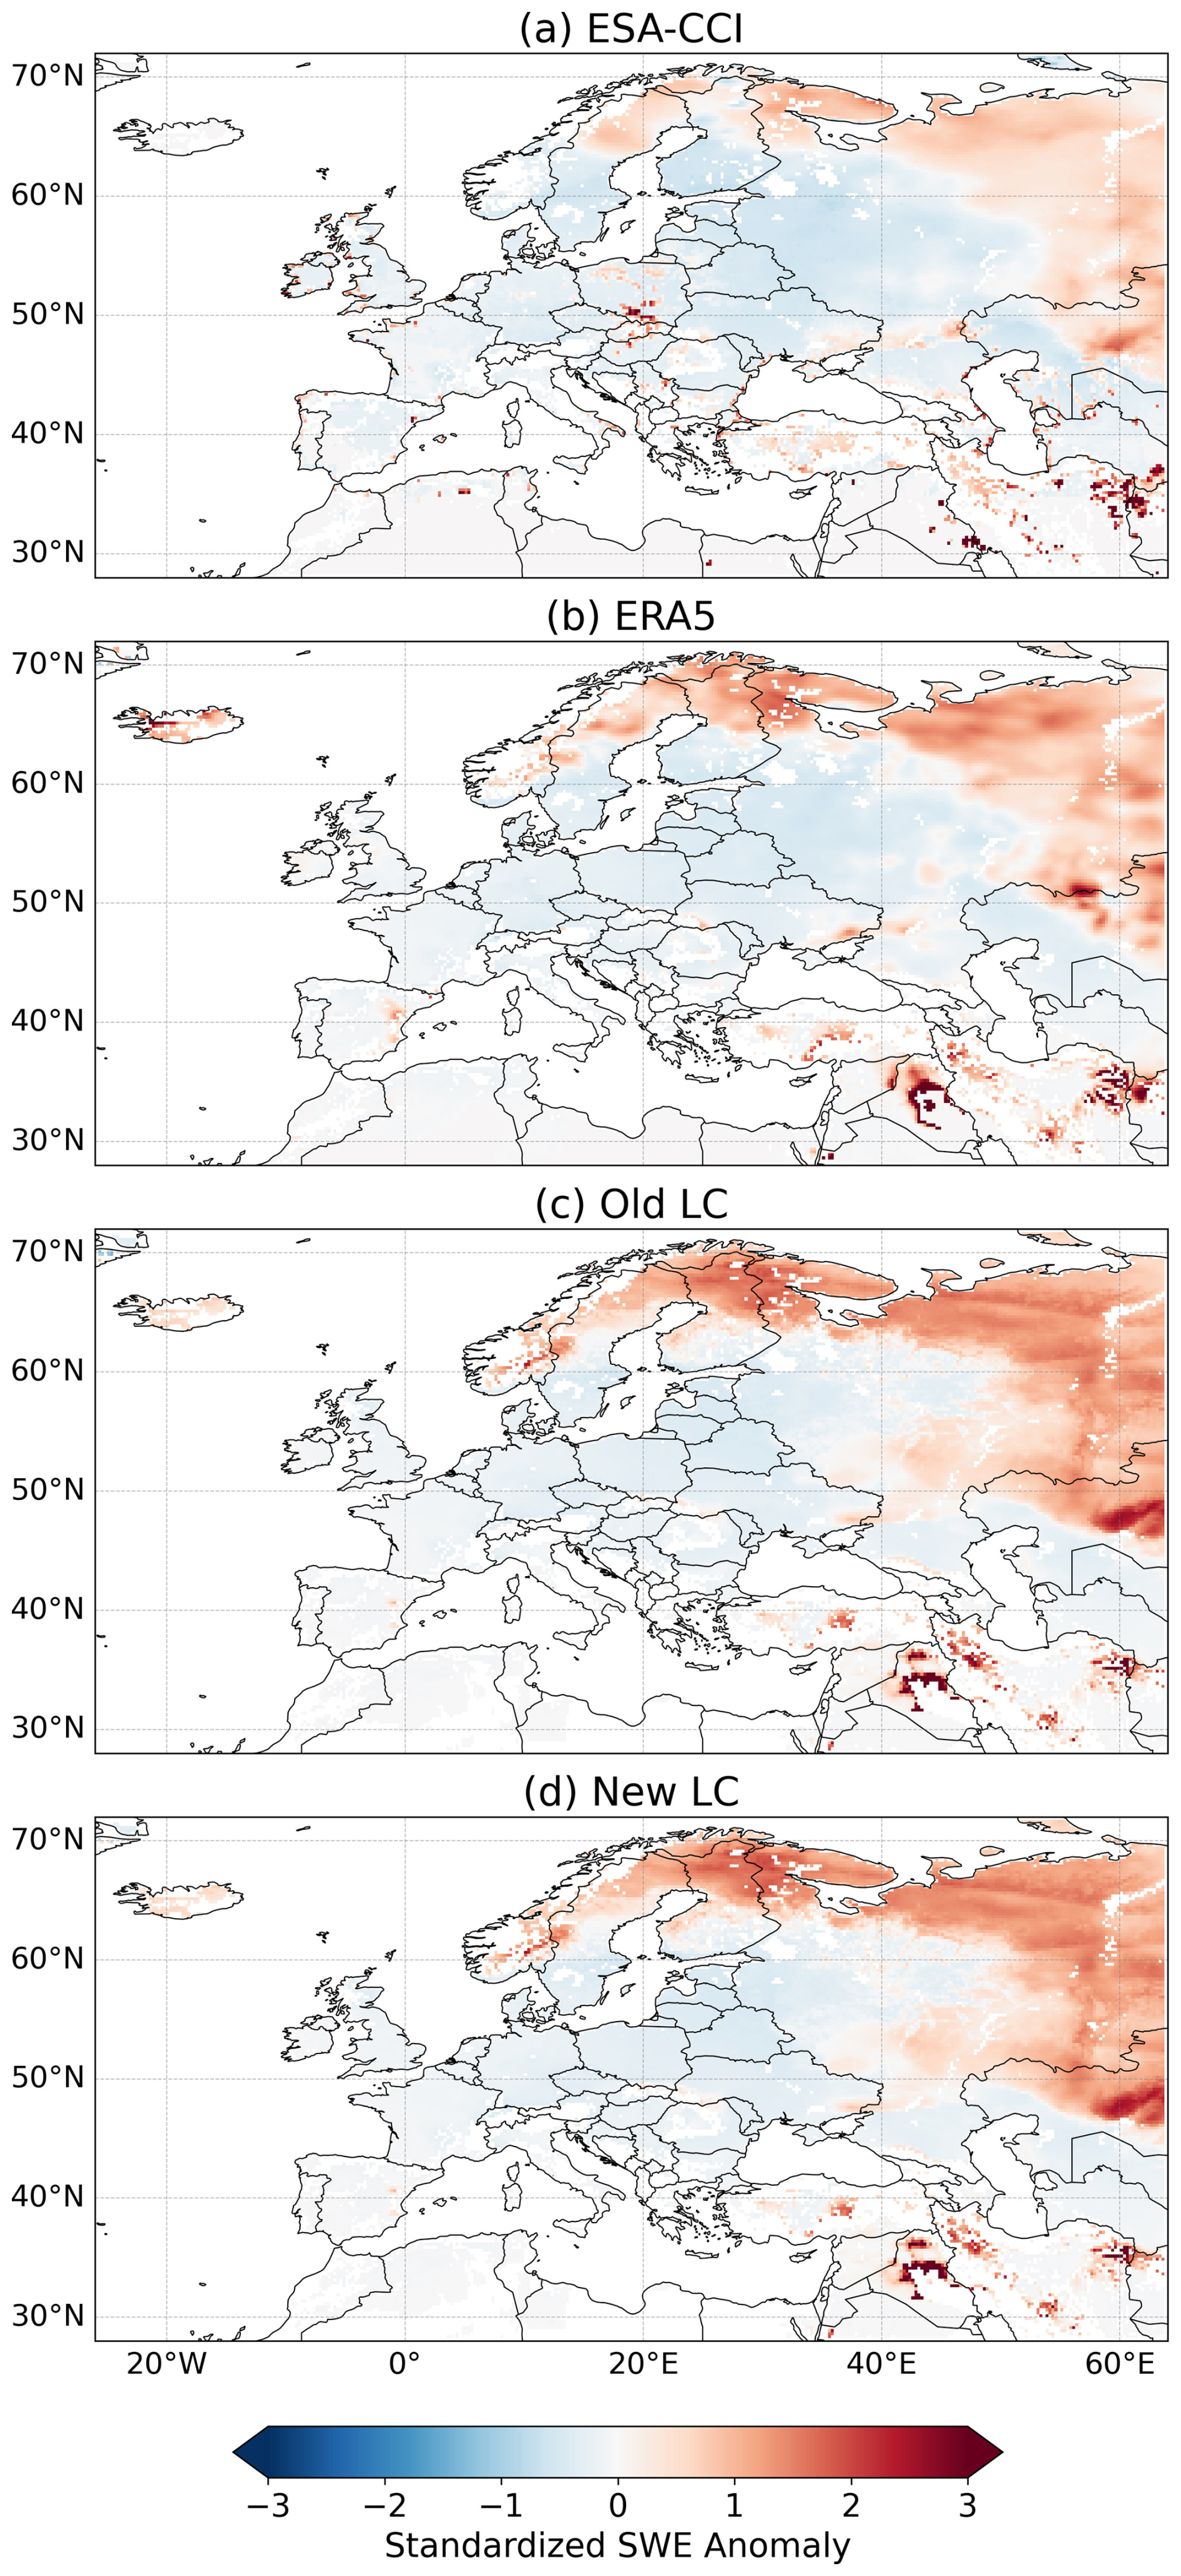
Figure 10Scaled (z-score) anomalies of SWE for winter 2020, relative to the 2010–2022 climatology: (a) CCI SWE, (b) ERA5 SWE, (c) Old LC SWE, and (d) New LC SWE. Red colours indicate positive anomalies (i.e. more snow than the climatological mean), and blue colours indicate negative anomalies (i.e. a snow deficit).
5.3 Are the SWE estimates from the warm winter of 2020 consistent?
Figure 10 shows the scaled anomalies (z-score) of SWE for winter 2019–2020, which was a particularly warm winter season over Europe. All datasets reveal predominantly negative SWE anomalies across much of Europe, which is consistent with the mild temperatures and reduced snow persistence reported for that winter in the mid-latitudes (Brown et al., 2020; Twardosz et al., 2021). Localised bands of positive anomalies appear in Russia, Kazakhstan, and Northern Scandinavia, which are likely to be associated with cold spells or above-average precipitation. The spatial patterns of the New LC and Old LC SWE anomalies show good agreement with the CCI SWE anomalies, particularly with regard to capturing the large-scale negative anomaly across central and western Europe. However, the simulations tend to overestimate the extent and magnitude of positive anomalies in the northern and eastern regions. ERA5 successfully reproduces the broad anomaly structure, although it shows slightly more widespread positive anomalies in these regions. Conversely, the weaker positive anomalies of CCI SWE in these regions could suggest microwave signal saturation.
This study assessed the impact of incorporating the ECOCLIMAP-SG land cover dataset (derived from the ESA CCI land cover) into the SURFEX version 9 ISBA land surface model across Europe between 2010 and 2022. The focus was on the simulation performance of snow water equivalent (SWE). Benchmarking against ESA CCI SWE and ERA5 revealed that the updated land cover slightly improved the ISBA model's performance, reducing the root mean square deviation (RMSD) by around 2 mm and marginally enhancing the correlation. Spatial analyses demonstrate that ECOCLIMAP-SG tended to enhance SWE simulation in central and south-eastern Europe. Conversely, performance slightly deteriorated in certain forested regions in the north, likely due to altered snow–vegetation interactions. ERA5 remains the best-performing dataset in terms of absolute error, but ISBA with ECOCLIMAP-SG more accurately captures the spatial variability of snow accumulation. Analysis of land-cover transitions shows that ECOCLIMAP-SG's impact on SWE is not uniform across space, but is largely determined by a small number of local changes in vegetation. Transitions from grasslands to forested areas, in particular, account for a significant proportion of the reduction in SWE bias. This confirms that changes in vegetation structure and snow–canopy interactions are key mechanisms through which updated land cover affects snow simulations. Additionally, changes in SWE are not confined to grid cells where the dominant land cover changes. They can also result from modifications in sub-pixel vegetation fractions, which affect canopy density, vegetation composition, and snow-canopy interactions. Although the updated land cover dataset improves SWE simulations slightly, remaining SWE errors suggest that land cover information alone is insufficient to resolve all model uncertainties. Further advances in atmospheric forcing, snow process representation and data assimilation will likely be required for future improvements. Beyond SWE, our analysis of land surface temperature (LST) revealed potential model biases that could affect snow simulations. Specifically, ISBA shows cold and warm biases during the daytime and nighttime, respectively, compared to ESA CCI LST. However, these biases alone cannot fully account for the overestimation of SWE. It is possible that the CCI SWE product itself underestimates the actual SWE.
SURFEX can be downloaded freely at https://www.umr-cnrm.fr/surfex/data/OPEN-SURFEX/open_surfex_v9_0_0_20231024.tar.gz (last access: July 2026; CNRM, 2023). It is provided under a CECILL-C License (French equivalent to the L-GPL licence).
ESA Land Cover Climate Change Initiative (Land_Cover_cci) Global Land Cover Maps, Version 2.0.7, are available from https://catalogue.ceda.ac.uk/uuid/b382ebe6679d44b8b0e68ea4ef4b701c (last access: July 2026), CCI global Aqua MODIS LST data (version 4) are available from https://catalogue.ceda.ac.uk/uuid/d56a6215ce394ddd8dff6bea5dbb0780/ (last access: July 2026) (https://doi.org/10.5285/d56a6215ce394ddd8dff6bea5dbb0780; Ghent et al, 2025), CCI global SWE data (version 3.1) are available from https://catalogue.ceda.ac.uk/uuid/9d9bfc488ec54b1297eca2c9662f9c81/ (last access: July 2026) (https://doi.org/10.5285/9d9bfc488ec54b1297eca2c9662f9c81; Luojus et al., 2024), ERA5 global SWE data are available from the C3S Climate Data Store https://cds.climate.copernicus.eu/datasets/reanalysis-era5-single-levels?tab=download (last access: July 2026).
The supplement related to this article is available online at https://doi.org/10.5194/tc-20-4099-2026-supplement.
The experiments were designed by ORM, BB and JCC. CA, DT, DG and CL provided recommendations on how to use the benchmarking datasets. ORM and BB performed the SURFEX version 9 simulations. ORM wrote the paper. All co-authors participated in analysing the results and revising the paper.
The contact author has declared that none of the authors has any competing interests.
Publisher's note: Copernicus Publications remains neutral with regard to jurisdictional claims made in the text, published maps, institutional affiliations, or any other geographical representation in this paper. The authors bear the ultimate responsibility for providing appropriate place names. Views expressed in the text are those of the authors and do not necessarily reflect the views of the publisher.
The authors would like to thank the Climate Change Initiative (CCI) Land Cover, Land Surface Temperature (LST) and Snow projects of the European Space Agency (ESA) for providing benchmarking data, the Copernicus Climate Change Service for providing ERA5 data, and two anonymous reviewers for their helpful comments.
This research has been supported by the European Space Agency (ESA Climate Change Initiative Climate Model User Group (ESA CCI CMUG), grant no. 4000125156/18/I-NB) and by the Copernicus Climate Change Service Evolution (CERISE) project. The CERISE project (grant no. 101082139) is funded by the European Union. Views and opinions expressed are however those of the author(s) only and do not necessarily reflect those of the European Union or the Commission. Neither the European Union nor the granting authority can be held responsible for them.
This paper was edited by Nora Helbig and reviewed by two anonymous referees.
Barella, R., Mortimer, C., Marin, C., Schwaizer, G., Mölg, N., Nagler, T., Wunderle, S., Xiao, X., Luojus, K., Venäläinen, P., Takala, M., Pulliainen, J., Lemmetyinen, J., Moisander, M., and Solberg R.: ESA CCI+ Snow ECV: Product User Guide, version 4.0, April 2024, http://snow-cci.enveo.at/documents/Snow_cci_D4.3_PUG_v4.0.pdf (last access: July 2026), 2024.
Barella-Ortiz, A., Quintana-Seguí, P., Dari, J., Brocca, L., Altés, V., Villar, J. M., Paolini, G., Escorihuela, M. J., Bonan, B., Calvet, J.-C., and Tzanos, D.: Improved SAFRAN forcing and ECOCLIMAP-SG datasets to simulate irrigation over the Ebro basin, EGU General Assembly 2022, Vienna, Austria, 23–27 May 2022, EGU22-7834, https://doi.org/10.5194/egusphere-egu22-7834, 2022.
Bélair, S., Crevier, L.-P., Mailhot, J., Bilodeau, B., and Delage, Y.: Operational Implementation of the ISBA Land Surface Scheme in the Canadian Regional Weather Forecast Model. Part I: Warm Season Results, J. Hydrometeorol., 4, 352–370, https://doi.org/10.1175/1525-7541(2003)4<352:OIOTIL>2.0.CO;2, 2003a.
Bélair, S., Brown, R., Mailhot, J., Bilodeau, B., and Crevier, L.-P.: Operational Implementation of the ISBA Land Surface Scheme in the Canadian Regional Weather Forecast Model. Part II: Cold Season Results, J. Hydrometeorol., 4, 371–386, https://doi.org/10.1175/1525-7541(2003)4<371:OIOTIL>2.0.CO;2, 2003b.
Blyth, E. M., Arora, V. K., Clark, D. B., Dadson, S. J., De Kauwe, M. G., Lawrence, D. M., Melton, J. R., Pongratz, J., Turton, R. H., Yoshimura, K., and Yuan, H.: Advances in Land Surface Modelling, Curr. Clim. Change Rep., 7, 45–71, https://doi.org/10.1007/s40641-021-00171-5, 2021.
Boone, A. and Etchevers, P.: An Intercomparison of Three Snow Schemes of Varying Complexity Coupled to the Same Land Surface Model: Local-Scale Evaluation at an Alpine Site, J. Hydrometeorol., 2, 374–394, https://doi.org/10.1175/1525-7541(2001)002<0374:AIOTSS>2.0.CO;2, 2001.
Boone, A., Masson, V., Meyers, T., and Noilhan, J.: The Influence of the Inclusion of Soil Freezing on Simulations by a Soil–Vegetation–Atmosphere Transfer Scheme, J. Appl. Meteor., 39, 1544–1569, https://doi.org/10.1175/1520-0450(2000)039<1544:TIOTIO>2.0.CO;2, 2000.
Bounoua, L., DeFries, R., Collatz, G. J., Sellers, P., and Khan, H.: Effects of Land Cover Conversion on Surface Climate, Climatic Change, 52, 29–64, https://doi.org/10.1023/A:1013051420309, 2002.
Brown, R., de Rosnay, P., Robinson, D., and Luojus, K.: Snow Assessments: Northern Hemisphere 2019–2020 Winter Snow Cover, WMO Global Cryosphere Watch, https://globalcryospherewatch.org/snow-assessments-2020 (last access: July 2026), 2020.
Calvet, J.-C. and Champeaux, J.-L.: L'apport de la télédétection spatiale à la modélisation des surfaces continentales, La Météorologie, 108, 52–58, https://doi.org/10.37053/lameteorologie-2020-0016, 2020.
Calvet, J.-C., Noilhan, J., Roujean, J.-L., Bessemoulin, P., Cabelguenne, M., Olioso, A., and Wigneron, J.-P.: An interactive vegetation SVAT model tested against data from six contrasting sites, Agr. Forest Meteorol., 92, 73–95, https://doi.org/10.1016/S0168-1923(98)00091-4, 1998.
Calvet, J.-C., Gibelin, A.-L., Roujean, J.-L., Martin, E., Le Moigne, P., Douville, H., and Noilhan, J.: Past and future scenarios of the effect of carbon dioxide on plant growth and transpiration for three vegetation types of southwestern France, Atmos. Chem. Phys., 8, 397–406, https://doi.org/10.5194/acp-8-397-2008, 2008.
Chiu, J., Paredes-Mesa, S., Lakhankar, T., Romanov, P., Krakauer, N., Khanbilvardi, R., and Ferraro, R.: Intercomparison and Validation of MIRS, MSPPS, and IMS Snow Cover Products, Adv. Meteorol., 2020, 4532478, https://doi.org/10.1155/2020/4532478, 2020.
CNRM: SURFEX code, CNRM, https://www.umr-cnrm.fr/surfex/data/OPEN-SURFEX/open_surfex_v9_0_0_20231024.tar.gz (last access: July 2026), 2023.
Crow, W. T., Kumar, S. V., and Bolten, J. D.: On the utility of land surface models for agricultural drought monitoring, Hydrol. Earth Syst. Sci., 16, 3451–3460, https://doi.org/10.5194/hess-16-3451-2012, 2012.
de Jeu, R. A. M., Wagner, W., Holmes, T. R. H., Dolman, A. J., van de Giesen, N. C., and Friesen, J.: Global Soil Moisture Patterns Observed by Space Borne Microwave Radiometers and Scatterometers, Surv. Geophys., 29, 399–420, https://doi.org/10.1007/s10712-008-9044-0, 2008.
Decharme, B., Brun, E., Boone, A., Delire, C., Le Moigne, P., and Morin, S.: Impacts of snow and organic soils parameterization on northern Eurasian soil temperature profiles simulated by the ISBA land surface model, The Cryosphere, 10, 853–877, https://doi.org/10.5194/tc-10-853-2016, 2016.
Decharme, B., Delire, C., Minvielle, M., Colin, J., Vergnes, J.-P., Alias, A., Saint-Martin, D., Séférian, R., Sénési, S., and Voldoire, A.: Recent changes in the ISBA‐CTRIP land surface system for use in the CNRM‐CM6 climate model and in global off‐line hydrological applications, J. Adv. Model. Earth Sy., 11, 1207–1252, https://doi.org/10.1029/2018MS001545, 2019.
Delire, C., Séférian, R., Decharme, B., Alkama, R., Calvet, J.-C., Carrer, D., Gibelin, A.-L., Joetzjer, E., Morel, X., Rocher, M., and Tzanos, D.: The global land carbon cycle simulated with ISBA-CTRIP: impro-vements over the last decade, J. Adv. Model. Earth Sy., 12, e2019MS001886, https://doi.org/10.1029/2019MS001886, 2020.
Deschamps-Berger, C., López-Moreno, J. I., Gascoin, S., Mazzotti, G., and Boone, A.: Where snow and forest meet: A global atlas, Geophys. Res. Lett., 52, e2024GL113684, https://doi.org/10.1029/2024GL113684, 2025.
Druel, A., Munier, S., Mucia, A., Albergel, C., and Calvet, J.-C.: Implementation of a new crop phenology and irrigation scheme in the ISBA land surface model using SURFEX_v8.1, Geosci. Model Dev., 15, 8453–8471, https://doi.org/10.5194/gmd-15-8453-2022, 2022.
Etchanchu, J., Rivalland, V., Gascoin, S., Cros, J., Tallec, T., Brut, A., and Boulet, G.: Effects of high spatial and temporal resolution Earth observations on simulated hydrometeorological variables in a cropland (southwestern France), Hydrol. Earth Syst. Sci., 21, 5693–5708, https://doi.org/10.5194/hess-21-5693-2017, 2017.
Faroux, S., Kaptué Tchuenté, A. T., Roujean, J.-L., Masson, V., Martin, E., and Le Moigne, P.: ECOCLIMAP-II/Europe: a twofold database of ecosystems and surface parameters at 1 km resolution based on satellite information for use in land surface, meteorological and climate models, Geosci. Model Dev., 6, 563–582, https://doi.org/10.5194/gmd-6-563-2013, 2013.
Gao, C., Jiang, X., Qian, Y., Qiu, S., Ma, L., and Li, Z.: A neural network based method for land surface temperature retrieval from AMSR-E passive microwave data, in: 2013 IEEE International Geoscience and Remote Sensing Symposium–IGARSS, 469–472, https://doi.org/10.1109/IGARSS.2013.6721194, 2013.
Ghent, D. J., Veal, K., and Perry, M.: ESA Land Surface Temperature Climate Change Initiative (LST_cci): Daily land surface temperature from MODIS (Moderate resolution Infra-red Spectroradiometer) on Terra, level 3 collated (L3C) global product (2000–2021), version 4.00, NERC EDS Centre for Environmental Data Analysis [data set], https://doi.org/10.5285/d56a6215ce394ddd8dff6bea5dbb0780, 2025.
Giard, D. and Bazile, E.: Implementation of a New Assimilation Scheme for Soil and Surface Variables in a Global NWP Model, Mon. Weather Rev., 128. 997–1015, https://doi.org/10.1175/1520-0493(2000)128<0997:IOANAS>2.0.CO;2, 2000.
Hersbach, H., Bell, B., Berrisford, P., Hirahara, S., Horányi, A., Muñoz-Sabater, J., Nicolas, J., Peubey, C., Radu, R., Schepers, D., Simmons, A., Soci, C., Abdalla, S., Abellan, X., Balsamo, G., Bechtold, P., Biavati, G., Bidlot, J., Bonavita, M., De Chiara, G., Dahlgren, P., Dee, D., Diamantakis, M., Dragani, R., Flemming, J., Forbes, R., Fuentes, M., Geer, A., Haimberger, L., Healy, S., Hogan, R. J., Hólm, E., Janisková, M., Keeley, S., Laloyaux, P., Lopez, P., Lupu, C., Radnoti, G., de Rosnay, P., Rozum, I., Vamborg, F., Villaume, S., and Thépaut, J.-N.: The ERA5 global reanalysis, Q. J. Roy. Meteor. Soc., 146, 1999–2049, https://doi.org/10.1002/qj.3803, 2020.
Jose, V., Chandrasekar, A., and Reddy Rodda, S.: Impact of Historical Land Cover Changes on Land Surface Characteristics over the Indian Region Using Land Information System, Pure Appl. Geophys., 181, 2561–2588, https://doi.org/10.1007/s00024-024-03523-y, 2024.
Kaptue, A., Roujean, J.-L., and Faroux, S.: ECOCLIMAP-II programme: A new land cover classification at 1 km from MODIS and vegetation data time series over the western Africa in the frame of AMMA project, in: 2009 IEEE International Geoscience and Remote Sensing Symposium, IV–1023–IV–1026, https://doi.org/10.1109/IGARSS.2009.5417555, 2009.
Kouki, K., Luojus, K., and Riihelä, A.: Evaluation of snow cover properties in ERA5 and ERA5-Land with several satellite-based datasets in the Northern Hemisphere in spring 1982–2018, The Cryosphere, 17, 5007–5026, https://doi.org/10.5194/tc-17-5007-2023, 2023.
Lawrence, P. J. and Chase, T. N.: Representing a new MODIS consistent land surface in the Community Land Model (CLM 3.0), J. Geophysical Res.-Biogeo., 112, G01023, https://doi.org/10.1029/2006JG000168, 2007.
Levis, S.: Modeling vegetation and land use in models of the Earth System, WIREs Clim. Change, 1, 840–856, https://doi.org/10.1002/wcc.83, 2010.
Li, W., MacBean, N., Ciais, P., Defourny, P., Lamarche, C., Bontemps, S., Houghton, R. A., and Peng, S.: Gross and net land cover changes in the main plant functional types derived from the annual ESA CCI land cover maps (1992–2015), Earth Syst. Sci. Data, 10, 219–234, https://doi.org/10.5194/essd-10-219-2018, 2018.
Ling, X., Huang, Y., Guo, W., Wang, Y., Chen, C., Qiu, B., Ge, J., Qin, K., Xue, Y., and Peng, J.: Comprehensive evaluation of satellite-based and reanalysis soil moisture products using in situ observations over China, Hydrol. Earth Syst. Sci., 25, 4209–4229, https://doi.org/10.5194/hess-25-4209-2021, 2021.
Liu, E., Zhu, Y., Lü, H., Bonan, B., Munier, S., and Calvet, J.-C.: Impact of leaf area index assimilation and gauge-corrected precipitation on land surface variables in LDAS-Monde: a case study over China, J. Hydrol., 133304, https://doi.org/10.1016/j.jhydrol.2025.133304, 2025.
Liu, S., Liu, X., Yu, L., Wang, Y., Zhang, G. J., Gong, P., Huang, W., Wang, B., Yang, M., and Cheng, Y.: Climate response to introduction of the ESA CCI land cover data to the NCAR CESM, Clim. Dynam., 56, 4109–4127, https://doi.org/10.1007/s00382-021-05690-3, 2021.
Luojus, K., Pulliainen, J., Takala, M., Lemmetyinen, J., Mortimer, C., Derksen, C., Mudryk, L., Moisander, M., Hiltunen, M., Smolander, T., Ikonen, J., Cohen, J., Salminen, M., Norberg, J., Veijola, K., and Venäläinen, P.: GlobSnow v3.0 Northern Hemisphere snow water equivalent dataset, Sci. Data, 8, 163, https://doi.org/10.1038/s41597-021-00939-2, 2021.
Luojus, K., Venäläinen, P., Moisander, M., Pulliainen, J., Takala, M., Lemmetyinen, J., Derksen, C., Mortimer, C., Mudryk, L., Schwaizer, G., and Nagler, T.: ESA Snow Climate Change Initiative (Snow_cci): Snow Water Equivalent (SWE) level 3C daily global climate research data package (CRDP) (1979–2022), version 3.1 [data set], https://dx.doi.org/10.5285/9d9b, 2024.
Maas, A. E., Rottensteiner, F., Alobeid, A., and Heipke, C.: Multitemporal Classification Under Label Noise Based on Outdated Maps, Photogramm. Eng. Rem. S., 84, 263–277, https://doi.org/10.14358/PERS.84.5.263, 2018.
Masson, V., Le Moigne, P., Martin, E., Faroux, S., Alias, A., Alkama, R., Belamari, S., Barbu, A., Boone, A., Bouyssel, F., Brousseau, P., Brun, E., Calvet, J.-C., Carrer, D., Decharme, B., Delire, C., Donier, S., Essaouini, K., Gibelin, A.-L., Giordani, H., Habets, F., Jidane, M., Kerdraon, G., Kourzeneva, E., Lafaysse, M., Lafont, S., Lebeaupin Brossier, C., Lemonsu, A., Mahfouf, J.-F., Marguinaud, P., Mokhtari, M., Morin, S., Pigeon, G., Salgado, R., Seity, Y., Taillefer, F., Tanguy, G., Tulet, P., Vincendon, B., Vionnet, V., and Voldoire, A.: The SURFEXv7.2 land and ocean surface platform for coupled or offline simulation of earth surface variables and fluxes, Geosci. Model Dev., 6, 929–960, https://doi.org/10.5194/gmd-6-929-2013, 2013.
Mishra, A. K., Dinesh, A. S., Kumari, A., and Pandey, L. K.: Precipitation Extremes over India in a Coupled Land–Atmosphere Regional Climate Model: Influence of the Land Surface Model and Domain Extent, Atmosphere, 15, 44, https://doi.org/10.3390/atmos15010044, 2024.
Muñoz-Sabater, J., Dutra, E., Agustí-Panareda, A., Albergel, C., Arduini, G., Balsamo, G., Boussetta, S., Choulga, M., Harrigan, S., Hersbach, H., Martens, B., Miralles, D. G., Piles, M., Rodríguez-Fernández, N. J., Zsoter, E., Buontempo, C., and Thépaut, J.-N.: ERA5-Land: a state-of-the-art global reanalysis dataset for land applications, Earth Syst. Sci. Data, 13, 4349–4383, https://doi.org/10.5194/essd-13-4349-2021, 2021.
Orsolini, Y., Wegmann, M., Dutra, E., Liu, B., Balsamo, G., Yang, K., de Rosnay, P., Zhu, C., Wang, W., Senan, R., and Arduini, G.: Evaluation of snow depth and snow cover over the Tibetan Plateau in global reanalyses using in situ and satellite remote sensing observations, The Cryosphere, 13, 2221–2239, https://doi.org/10.5194/tc-13-2221-2019, 2019.
Pérez-Planells, L., Ghent, D., Ermida, S., Martin, M., and Göttsche, F.-M.: Retrieval Consistency between LST CCI Satellite Data Products over Europe and Africa, Remote Sens., 15, 3281, https://doi.org/10.3390/rs15133281, 2023.
Quintana-Seguí, P., Barella-Ortiz, A., Regueiro-Sanfiz, S., and Miguez-Macho, G.: The Utility of Land-Surface Model Simulations to Provide Drought Information in a Water Management Context Using Global and Local Forcing Datasets, Water Resour. Manag., 34, 2135–2156, https://doi.org/10.1007/s11269-018-2160-9, 2020.
Raoult, N., Delorme, B., Bastrikov, V., Ottlé, C., and Peylin, P.: Global Comparison of Surface Soil Moisture from the ESA CCI Combined Product and the Orchidee Land-Surface Model, in: IGARSS 2018–2018 IEEE International Geoscience and Remote Sensing Symposium, 3711–3714, https://doi.org/10.1109/IGARSS.2018.8517696, 2018.
Reiners, P., Asam, S., Frey, C., Holzwarth, S., Bachmann, M., Sobrino, J., Göttsche, F.-M., Bendix, J., and Kuenzer, C.: Validation of AVHRR Land Surface Temperature with MODIS and In Situ LST—A TIMELINE Thematic Processor, Remote Sens., 13, 3473, https://doi.org/10.3390/rs13173473, 2021.
Saeedi, M., Sharafati, A., and Tavakol, A.: Evaluation of gridded soil moisture products over varied land covers, climates, and soil textures using in situ measurements: A case study of Lake Urmia Basin, Theor. Appl. Climatol., 145, 1053–1074, https://doi.org/10.1007/s00704-021-03678-x, 2021.
Seo, E. and Dirmeyer, P. A.: Improving the ESA CCI Daily Soil Moisture Time Series with Physically Based Land Surface Model Datasets Using a Fourier Time-Filtering Method, J. Hydrometeorol., 23, 473–489, https://doi.org/10.1175/JHM-D-21-0120.1, 2022.
Sun, H., Fang, Y., Margulis, S. A., Mortimer, C., Mudryk, L., and Derksen, C.: Evaluation of the Snow Climate Change Initiative (Snow CCI) snow-covered area product within a mountain snow water equivalent reanalysis, The Cryosphere, 19, 2017–2036, https://doi.org/10.5194/tc-19-2017-2025, 2025.
Twardosz, R., Walanus, A., and Guzik, I.: Warming in Europe: Recent Trends in Annual and Seasonal temperatures, Pure Appl. Geophys., 178, 4021–4032, https://doi.org/10.1007/s00024-021-02860-6, 2021.
Wang, L., Arora, V. K., Bartlett, P., Chan, E., and Curasi, S. R.: Mapping of ESA's Climate Change Initiative land cover data to plant functional types for use in the CLASSIC land model, Biogeosciences, 20, 2265–2282, https://doi.org/10.5194/bg-20-2265-2023, 2023.