
the Creative Commons Attribution 4.0 License.
the Creative Commons Attribution 4.0 License.
 | 21 Jul 2026
Brief communication: Temperature-driven shrinkage of a disappearing Himalayan glacier
Rijan B. Kayastha
Using drone and GNSS surveys, we updated the geodetic mass balance of Glacier AX010. This glacier has the oldest observational record in the Nepal Himalayas, showing mass loss rates of −1.2 over the last 15 years (2008–2023). We reconstructed 80 years of annual mass balance using a mass-balance model forced by calibrated reanalysis data. While rising temperatures drive shrinkage, changes in precipitation have neither accelerated nor mitigated mass loss. The glacier began losing mass in the early 1970s, accelerated in the early 2000s, and is projected to disappear within one to two decades.
- Article
(2786 KB) - Full-text XML
-
Supplement
(24917 KB) - BibTeX
- EndNote


Mass balance of glaciers is considered a reliable indicator of climate change (Braithwaite and Hughes, 2020). Since the mid-19th century Industrial Revolution, glaciers have been continuously retreating, with intermittent periods of stagnation (Zemp et al., 2015). In mountainous regions of the Northern Hemisphere at temperate latitudes, small glaciers, with areas smaller than 0.5 km2, are numerically dominant, and their retreat has progressed rapidly from the late 20th century to the early 21st century (Bahr and Radić, 2012; Zemp et al., 2015). A modeling study showed that most small glaciers in Switzerland were expected to disappear within the coming decades, with significant impacts on regional hydrology (Huss and Fischer, 2016), while it has also been estimated that “uncharted” small glaciers contributed non-negligibly to the 20th-century sea-level rise (Parkes and Marzeion, 2018). These studies demonstrate that although individually inconspicuous, the small glaciers are, owing to their sheer numbers, an essential subject for assessing the impacts of climate change. In recent years, disappearing glaciers have attracted social attention, with research reports emerging from various parts of the world (i.e. Vidaller et al., 2021; Raup et al., 2025; Purdie et al., 2025; Basantes-Serrano et al., 2026; Bello et al., 2026; McCerery et al., 2026).
In the Himalayas, small glaciers account for 76 % by number and 12 % by area (Nuimura et al., 2015; Sakai, 2019). Although the number of in-situ observations of glacier mass balance in the Himalayas has shown an increasing trend since the beginning of the 21st century, they cover only 0.5 % of the total glacier area (Azam et al., 2018). Satellite observations of glacier fluctuations have been actively conducted in recent years, revealing that the rate of glacier shrinkage varies by region (Hugonnet et al., 2021a). Regarding temporal changes in fluctuations, it has been shown that glacier shrinkage in the Himalayas has accelerated since 2000 (Maurer et al., 2019; Shean et al., 2020). This acceleration in mass loss has been attributed primarily to regional atmospheric warming (Maurer et al., 2019). However, this is constrained by the timing of the reference digital elevation models (DEMs), and it remains unclear when glaciers began to shrink. Regarding glacier disappearance, a comparison of inventories from 1992 to 2010 has revealed that 61 glaciers covering an area of 2.4 km2 have disappeared in eastern Nepal (Ojha et al., 2016).
This study aims to update the mass balance records of an iconic glacier in the Nepal Himalayas, for which intermittent observations have been conducted since the 1970s. Using geodetic mass-balance estimates derived from aerial photogrammetry, we reconstruct long-term annual glacier-wide balances with the GLIMB model (Fujita and Ageta, 2000; Fujita and Sakai, 2014). We estimate when this glacier began losing mass. Furthermore, we examine whether the mass loss is attributable to warming, whether other meteorological factors influence it, and whether the reduction in glacier size induces further shrinkage. We also estimate when this glacier will disappear by estimating the remaining volume.
2.1 Glaciers
Glaciers AX010 (27.725° N, 86.555° E) and AX000 (27.713° N, 86.542° E) are small glaciers located in the Shorong region of Nepal (Table 1 and inset in Fig. 1a). Glacier AX010 has been observed intermittently since 1978 (Fig. S1 in the Supplement), and its volume changes up to 2008 have been previously estimated as a geodetic mass balance (Ageta et al., 1980; Kadota and Ageta, 1992; Kadota et al., 1997; Fujita et al., 2001; Fujita and Nuimura, 2011).
Table 1Geographical information of Glaciers AX010 and AX000 in the Shorong region, Nepal Himalaya. Longitude, latitude, area, and mean elevation are obtained from the 2023 drone-based orthomosaic and DEMs. dh and Bgeod denote elevation change and estimated geodetic mass balance between 2008–2023.
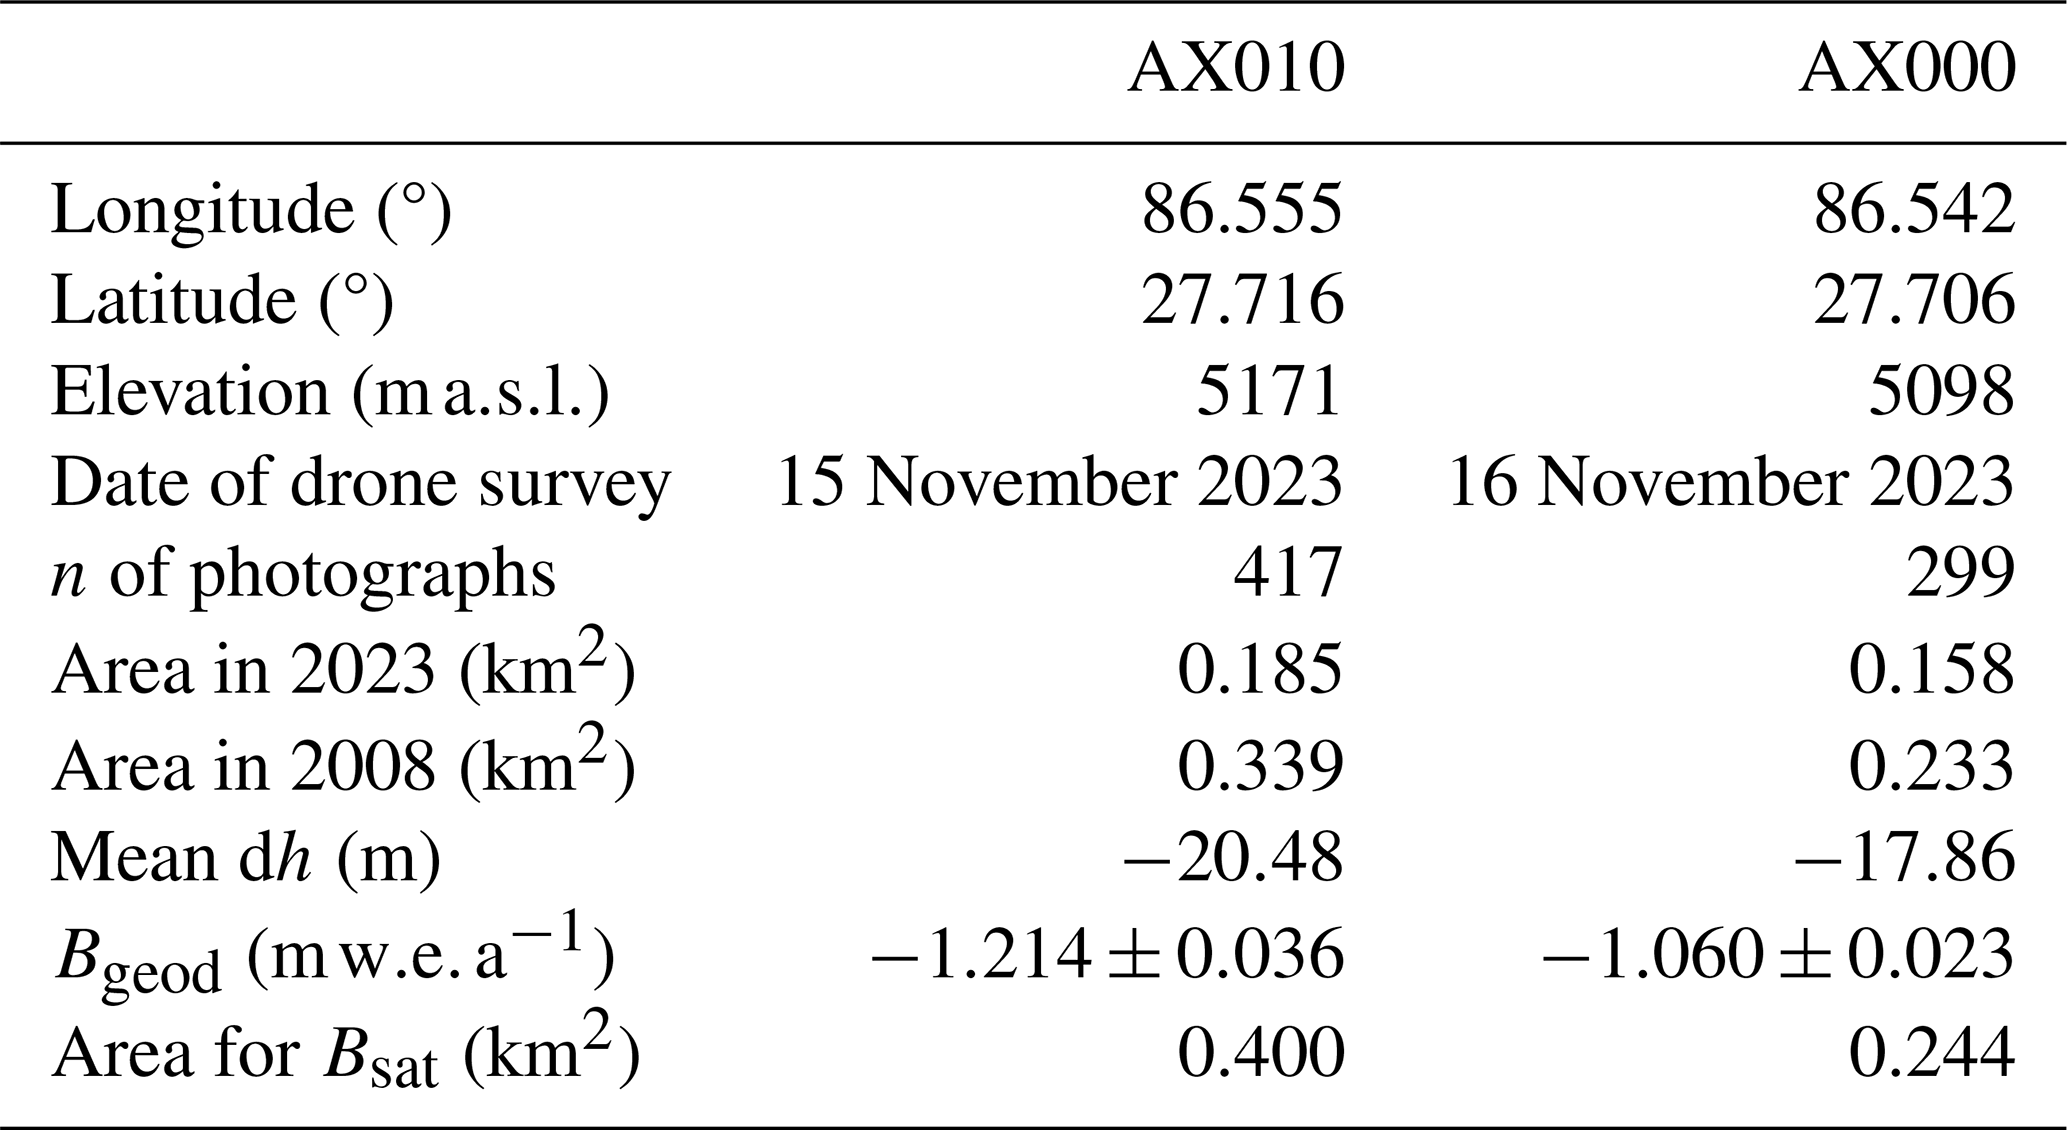
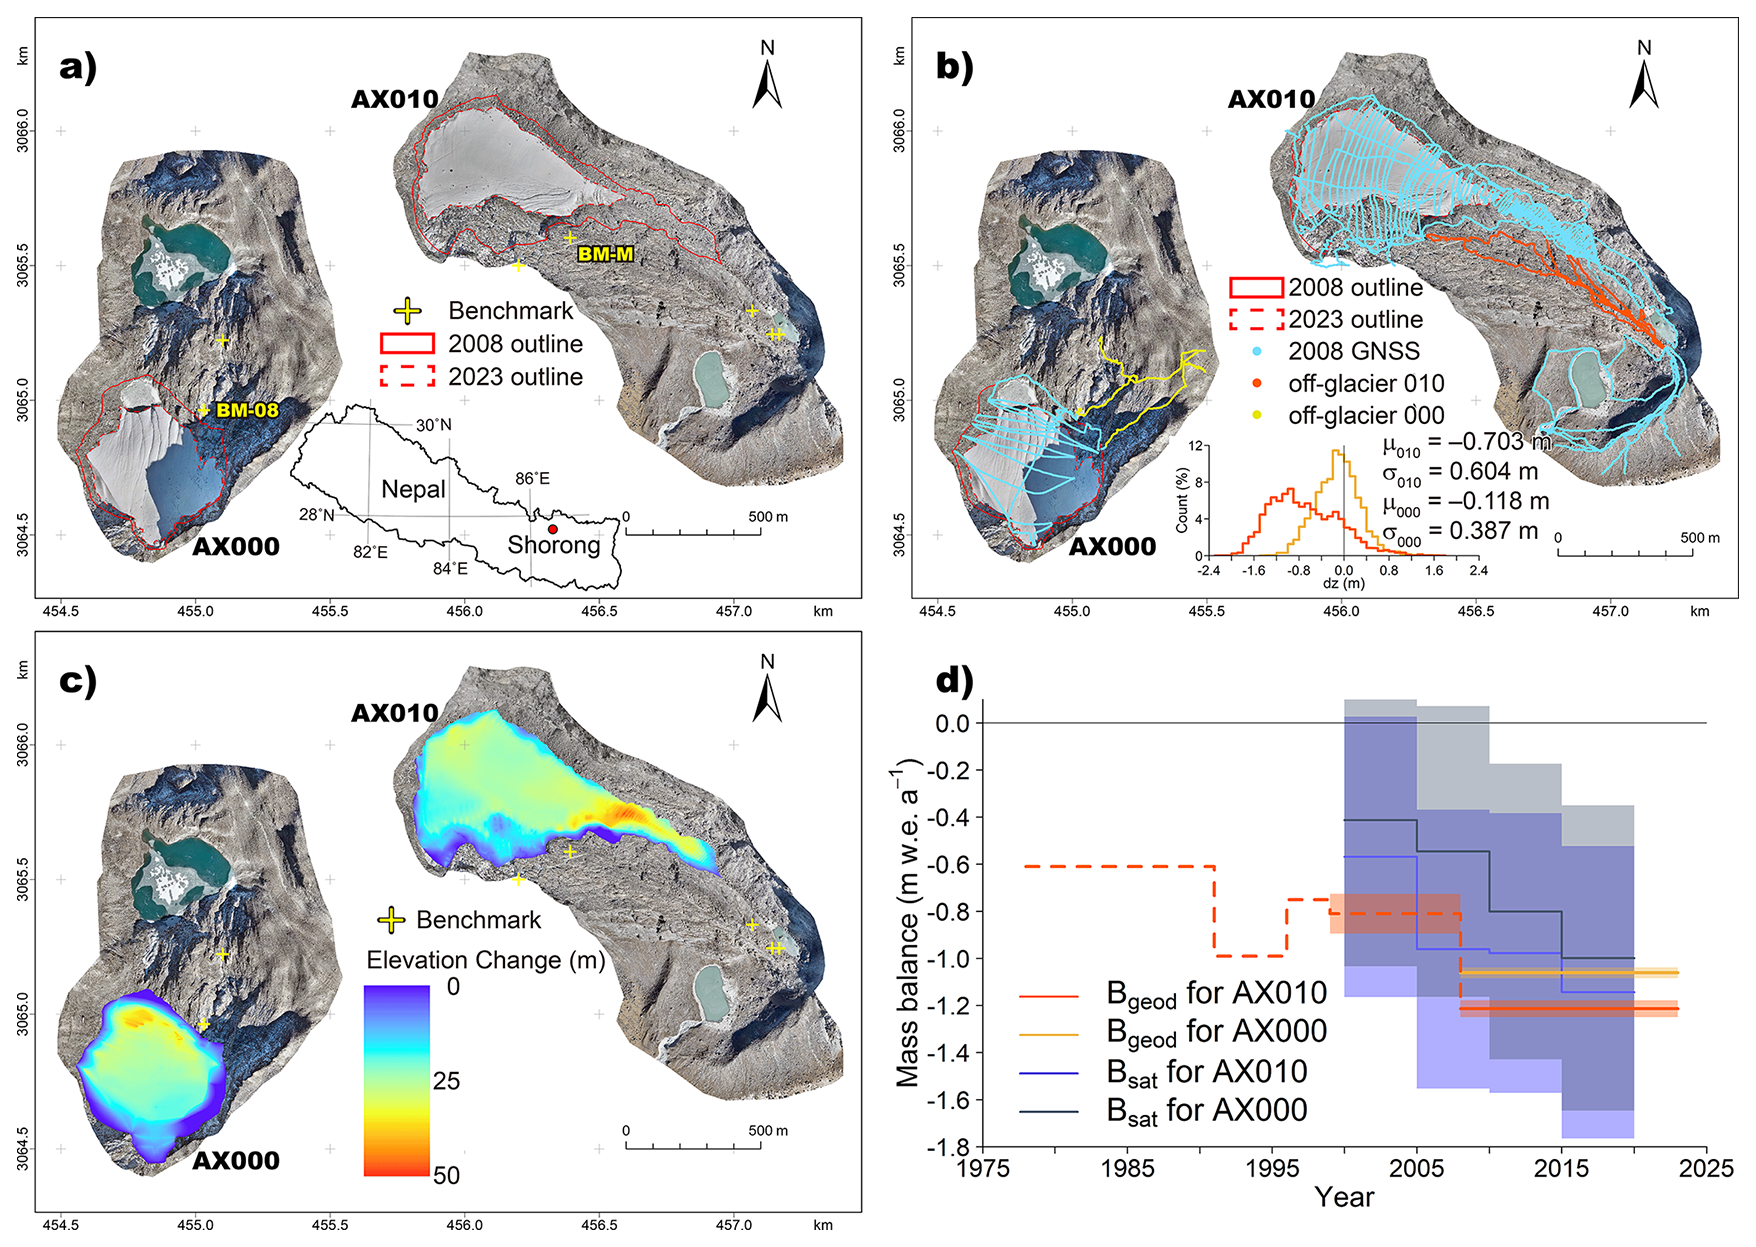
Figure 1Glaciers AX010 (right) and AX000 (left) in the Shorong region, Nepal Himalaya, showing (a) drone photogrammetry-based orthomosaic, (b) GNSS tracks in 2008, (c) elevation change for the period 2008–2023, and (d) glacier-wide geodetic mass balance (Bgeod). The inset figure in panel (a) shows the location of the Shorong region. BM-M and BM-08 in panel (a) denote the benchmarks for the drone surveys. The distance scale of the outer frame for panels (a)–(c) is based on WGS84 UTM Zone 45N. The inset figure in panel (b) shows the histogram of off-glacier elevation difference between the 2023-DEMs and the 2008 GNSS survey. μ and σ in panel (b) denote average and standard deviation of the off-glacier elevation difference, respectively. Bsat in panel (d) denotes remotely-sensed geodetic mass balances (Hugonnet et al., 2021a). Bgeod obtained in previous studies are also shown as dashed line (Fujita et al., 2001; Fujita and Nuimura, 2011). Subscripts 010 and 000 in panels (b) and (d) denote Glacier AX010 and AX000, respectively.
Glacier AX000 is located in a different catchment from Glacier AX010. However, because it is easily accessible from Glacier AX010 and isolated from other glaciers in the catchment, it was provisionally assigned the number “000”. Changes in the terminus position of this glacier have been observed from 1978 to 1989 (Yamada et al., 1992), but the ground-based volume change was not estimated so far. We conducted our GNSS observation in 2008, but the results were not published.
In this study, we conducted a drone photogrammetry survey for both glaciers in 2023, and obtained volume changes between 2008–2023.
2.2 Volume changes
In this study, we generated 1 m resolution DEMs from our global navigation satellite system (GNSS) survey data acquired in 2008, and derived the geodetic mass balance by extrapolating and interpolating the differences between the 2008-DEMs and the 2023-DEMs obtained from drone photogrammetry surveys within the 2008 glacier area.
2.2.1 GNSS surveys
The GNSS survey conducted in 2008 used single-frequency carrier-phase GPS (GEM-1, GNSS Technologies Inc.). The 2023 GNSS survey employed the same GEM series (Enabler Ltd.) but with dual-frequency carrier-phase GPS. The coordinates of the base station placed on the benchmarks for 31 h during three days (14–16 November) were determined by an online precise point positioning processing service (https://webapp.csrs-scrs.nrcan-rncan.gc.ca/geod/tools-outils/ppp.php?locale=en, last access: 20 January 2026). Coordinates of the 2008 data were subsequently corrected at benchmarks (Table S1 in the Supplement). The measurement points were converted into 1 m resolution DEMs using the inverse distance weighting interpolation method (Nuimura et al., 2012; Tshering and Fujita, 2016). Measurement points on the moraine ridges were used to evaluate the relative error with respect to the subsequent UAV-derived DEMs (Fig. 1b).
2.2.2 Drone aerial photogrammetry
The aerial images were acquired using a DJI MAVIC-3T with a multi-frequency GNSS antenna (DJI D-RTK2) for the RTK mode. The antenna was set on a benchmark (BM); BM-M for Glacier AX010 and BM-08 for Glacier AX000, respectively (Fig. 1a and Table S1). Aerial surveys were conducted for Glacier AX010 on 15 November 2023 and for Glacier AX000 on 16 November 2023, acquiring 417 and 299 photographs, respectively (Table 1). The aerial images were processed using structure-from-motion to generate orthomosaics and DEMs (Metashape, Agisoft).
2.2.3 Geodetic mass balance
For calculating the elevation difference between the 2008-DEM and the 2023-DEM, the elevation change at the glacier boundary was assumed to be zero. Ice density was assumed to be 890 kg m−3 because the field survey in 2008 confirmed that there was almost no snow at the upper part of the glacier, suggesting that the entire glacier was in the ice-composed ablation zone between 2008–2023. The uncertainty in volume change was estimated by comparing the 2008 GNSS data with the 2023 DEM over off-glacier areas with gentle slopes (Fig. 1b) and dividing the standard deviation of the elevation differences by the time interval (15 years). Uncertainty estimates in previous satellite-based studies primarily relied on elevation differences over off-glacier terrain. However, because the standard deviations of the elevation differences are too large to be used directly as errors, further processing, such as estimating the normalized median absolute deviation, is commonly applied (Shean et al., 2020; Hugonnet et al., 2021a).
2.2.4 Ice volume estimation
To estimate how many years it will take for Glacier AX010 to disappear, the distribution of current ice-thickness is required. We set transverse lines, orthogonal to the straight line connecting the terminus and the highest point, at 50 m intervals (Fig. S2a), and approximated the bedrock on both sides of the glacier with parabolic curves. We determined the range of bedrock used for the approximation subjectively, excluding inflection points. The overall ice-thickness distribution was obtained by interpolating the bedrock elevation along each transverse line and subtracting it from the 2023 DEM. The estimated bedrock elevation was evaluated by subtracting radar ice thickness measured at three locations in 1995 from the 1995 surface elevation, which was measured by the theodolite with a laser-distance finder (Kadota et al., 1997).
2.3 Glacier energy-mass balance model: GLIMB
To reconstruct the past annual mass balance, we adopted the GLacIer energy Mass Balance model (GLIMB) (Fujita and Ageta, 2000; Fujita and Sakai, 2014; Khalzan et al., 2022) that calculates the surface energy balance (Qm≥0) as:
where α is the surface albedo; RSd is the downward shortwave radiation, RLd and RLu are the downward and upward longwave radiations; HS and HL are the sensible and latent heat; Gg is the conductive heat flux into the glacier ice, respectively. Unit of all variables is W m−2 except for albedo (no dimension). The surface albedo is calculated using a scheme that applies an exponential, temperature-dependent attenuation with time after a fresh snowfall (Fujita and Sakai, 2014). Annual glacier mass balance at a given elevation (bz, ) is calculated as:
where Ps is the solid precipitation; td is the length of a day in seconds (86 400 s); lm it the latent heat for ice melt (); EV is the daily amount of evaporation (), which is estimated by a bulk method; RF is the daily amount of refreezing water (), which is estimated by calculating heat conduction and water percolation; and ρw is the water density (1000 kg m−3) for the unit conversion (mm to m). The daily mass balance is summed over a given period (an observation period or a year). The glacier-wide mass balance (B, ) is calculated using the hypsometry as:
where az is the glacier area for a given 20 m elevation band. Detailed descriptions of the model are available in Fujita and Ageta (2000) and Fujita and Sakai (2014). The glacier hypsometry was obtained from in-situ surveys (Fujita et al., 2001; Fujita and Nuimura, 2011) and the UAV photogrammetry of this study (Fig. S3). Elevations of the past hypsometry are calibrated using GNSS-collected benchmarks. The annual hypsometry was prepared by interpolating each elevation band. For the mass-balance reconstruction before 1978, we used the 1978 hypsometry. The effect of the changing glacier geometry is evaluated in the Sect. 3.5.
2.4 ERA5 reanalysis data
We extracted daily mean meteorological variables from the ERA5 reanalysis data (Hersbach et al., 2020) as model input. Besides the 2 m height temperature in the ERA5 data (T2 m, °C), air temperature at a given elevation (Tz, °C) was estimated from the pressure level temperatures at the closest geopotential heights containing the target elevation (Sakai et al., 2015; Khalzan et al., 2022). Downward longwave radiation (, W m−2) at a given elevation (z, ) was calibrated with the effective emissivity (εe, no dimension), which can be defined by the downward longwave radiation (, W m−2) and 2 m height temperature (T2 m) based on the Stefan–Boltzmann equation as:
where σ is the Stefan–Boltzmann constant ().
The variables were compared with those observed at a nearby site (Trakarding AWS, 16 km from the glacier, Fig. S4 and Table S2) for the period 2022–2023, and calibration equations were then obtained. The extracted ERA5 covers both the Trakarding AWS and the glacier in a single cell (0.25°×0.25°).
2.5 Calibration of precipitation
The ERA5 precipitation is also compared with the AWS data. However, it has the greatest uncertainty among the ERA5 variables, and the spatial differences between the Trakarding site and AX010 are unknown. Therefore, we estimated the precipitation parameter by applying a multiplier (rP, dimensionless) to the ERA5 precipitation (Sakai et al., 2015; Khalzan et al., 2022; Kondo and Fujita, 2026). We determined rP to yield the same value as the observed geodetic mass balance (Bgeod) by an iterative calculation (Fig. S5). A period-weighted rP was then obtained from five rP corresponding to the geodetic observations. Because the glacier's elevation range is so small (440 m, even at its maximum extent in 1978 during the observation period, Fig. S3), we did not account for the precipitation gradient with elevation in the simulation.
3.1 Geodetic mass balance
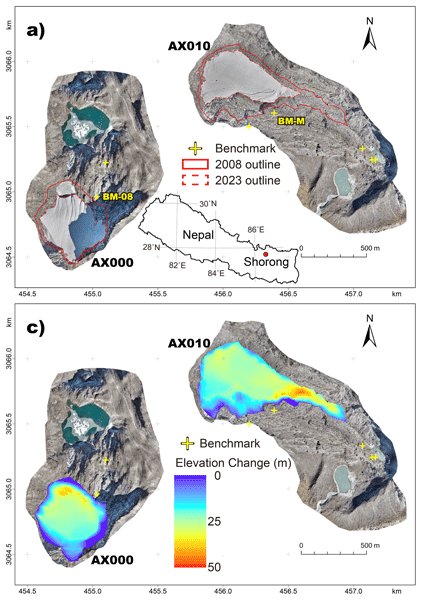
Figure 1a shows orthomosaics of Glaciers AX010 and AX000 generated from the 2023 drone photogrammetry. Figure 1b shows the same orthomosaic overlaid with the 2008 GNSS tracks. The elevations from the 2023DEM and 2008GNSS outside the glacier had biases of −0.703 m (AX010) and −0.118 m (AX000), respectively. Considering a 15-year duration and ice density, these biases (+0.042 for AX010 and +0.007 for AX000, respectively) were taken into account when calculating the volume changes of the glacier. The relative accuracy between the 2023 DEM and the 2008 DEM was estimated as 1 standard deviation; 0.604 m for Glacier AX010 and 0.387 m for Glacier AX000 by comparison with the 2008 GPS data on moraine ridges (inset in Fig. 1b). These values are comparable to those obtained in other UAV surveys (Sunako et al., 2023) and are more than two orders of magnitude lower than that derived from satellite observations (∼15 m) (Maurer et al., 2019; Shean et al., 2020; Hugonnet et al., 2021a).
By interpolating/extrapolating the elevation difference, the surface elevation changes in 2023 relative to 2008 were obtained (Fig. 1c). As results, we update the geodetic mass balance (Bgeod, for AX010 and for AX000, respectively) of the glaciers for the 15-year period from 2008 to 2023 (Fig. 1d and Table 1). The associated error (0.036 ) is substantially smaller than that of previous estimates derived from sparse survey points (0.084 ) and is also much smaller than those based on satellite observations (∼0.600 , Hugonnet et al., 2021a). For comparison, we also show mass balance changes from 2000 to 2020 based on ASTER data for the same glaciers (Fig. 1d) (Hugonnet et al., 2021a). While no large systematic bias is evident, the satellite-based results appear to slightly underestimate the negative mass balance, particularly during the period 2010–2014. This could be attributed to the fact that the glacier area treated by Hugonnet et al. (2021a) is much larger (0.400 km2) than those we observed (0.339 km2 in 2008 and 0.185 km2 in 2023), meaning that areas where ice had already been lost were included when calculating surface elevation changes from satellite-based DEMs.
3.2 Calibration of reanalysis variables
We first compared the daily mean variables in the ERA5 reanalysis data with those observed at the Trakarding AWS site (Fig. S6 and Table S3). The 2 m height temperature (T2 m) shows a bias (5.56 °C in Table S3) due to elevation setting in the ERA5 data (blue dots in Fig. S6a), while that derived from the pressure-level data (Tp) shows good consistency with the observational temperature (orange dots in Fig. S6a; bias of −1.07 °C in Table S3). The downward longwave radiation calibrated with Tp (, orange dots in Fig. S6c; bias of 0.2 W m−2 in Table S3) shows better consistency with the observed one though the coefficient of determination and root mean square error of the linear regression are slightly worse than those of the ERA5 longwave radiation (RLd, blue dots in Fig. S6c; bias of 25.6 W m−2 in Table S3). The ERA5 shortwave radiation shows the worse coefficient of determination among the variables (R2=0.533), probably due to inaccurate cloud representation in the reanalysis (Fig. S6d). The ERA5 wind speed is significantly underestimated (Fig. S6e), while both relative humidity and precipitation in the ERA5 data are overestimated (Fig. S6b and f). The regressions summarized in Table S3 are used to calibrate the variables for the mass balance simulation, whereas precipitation is estimated using the geodetic mass balance and the model. Similar biases and RMSEs of ERA5-Land have been confirmed through the comparison with the local meteorological variables observed in the Khumbu region, immediately east of the studied site (Khadka et al., 2022).
The air temperatures estimated using the pressure-level temperatures and geopotential heights applied in this study were compared with temperatures observed near Glacier AX010 in 1978 and in the 1990s, and were found to agree very well (Fig. S7). This consistency further supports the validity of the estimation method based on pressure-level data.
Precipitation parameters (rP) were estimated for each period over which geodetic mass balance was observed (Table S4). The parameters weighted by the length of each period yielded a value of 1.48±0.08. In comparison with the AWS near Trakarding Glacier, the precipitation parameter was 0.264 (Fig. S6f and Table S3), suggesting that ERA5 overestimates precipitation there. In contrast, at Glacier AX010, located 16 km to the southeast of the AWS site, ERA5 underestimates precipitation (3.49 at AX010 against 2.36 in ERA5 for 2023). There, precipitation is more than five times greater than at the Trakarding AWS site (0.62 for 2023). This implies that strong precipitation contrasts exist over short distances within a single ERA5 grid cell (0.25° resolution).
While the estimated temperature from pressure levels showed good agreement with observational data from both Trakarding and AX010 (Figs. S6 and S7), observational data for other variables from Glacier AX010 were unavailable, so the relational formulas from the Trakarding AWS were applied (Fig. S6 and Table S3). Therefore, site-to-site bias may remain in these variables. Although previous studies have shown that the mass balance is insensitive to changes in variables other than temperature (Fujita and Ageta, 2000; Khadka et al., 2024), the possibility that the bias correction is affecting the reconstructed precipitation parameters and mass balance cannot be ruled out.
3.3 Reconstructed mass balance
Figure 2a shows the annual mass balance from 1940 to 2023 reconstructed using GLIMB and the calibrated ERA5 data. For the period from 1978 to 2023, hypsometry derived from geodetic observations was interpolated and applied, thereby accounting for glacier-wide shrinkage into account. For the period prior to 1978, the 1978 hypsometry was applied without modification. Because the precipitation parameter was tuned to match the geodetic observations, the modeled results naturally show good agreement with the observations (Fig. S8a). On Glacier AX010, stake-based observations were conducted in 1978 and during 1995–1999 (Ageta et al., 1980; Fujita et al., 2001). Comparison of mass-balance profiles corresponding to these observation periods indicates that the model reproduces the observed profiles well (Fig. S9). Figure S8b shows the comparison of the glacier-wide mass balance based on the linear regressions of the stake-based mass balance profile and simulation (Table S5). In particular, the pronounced negative mass balance in 1998, estimated to be the most negative over the past 80 years, is also well captured by the simulation, suggesting that ERA5 temperature data and the adjusted precipitation are appropriate for reconstructing the glacier mass balance.
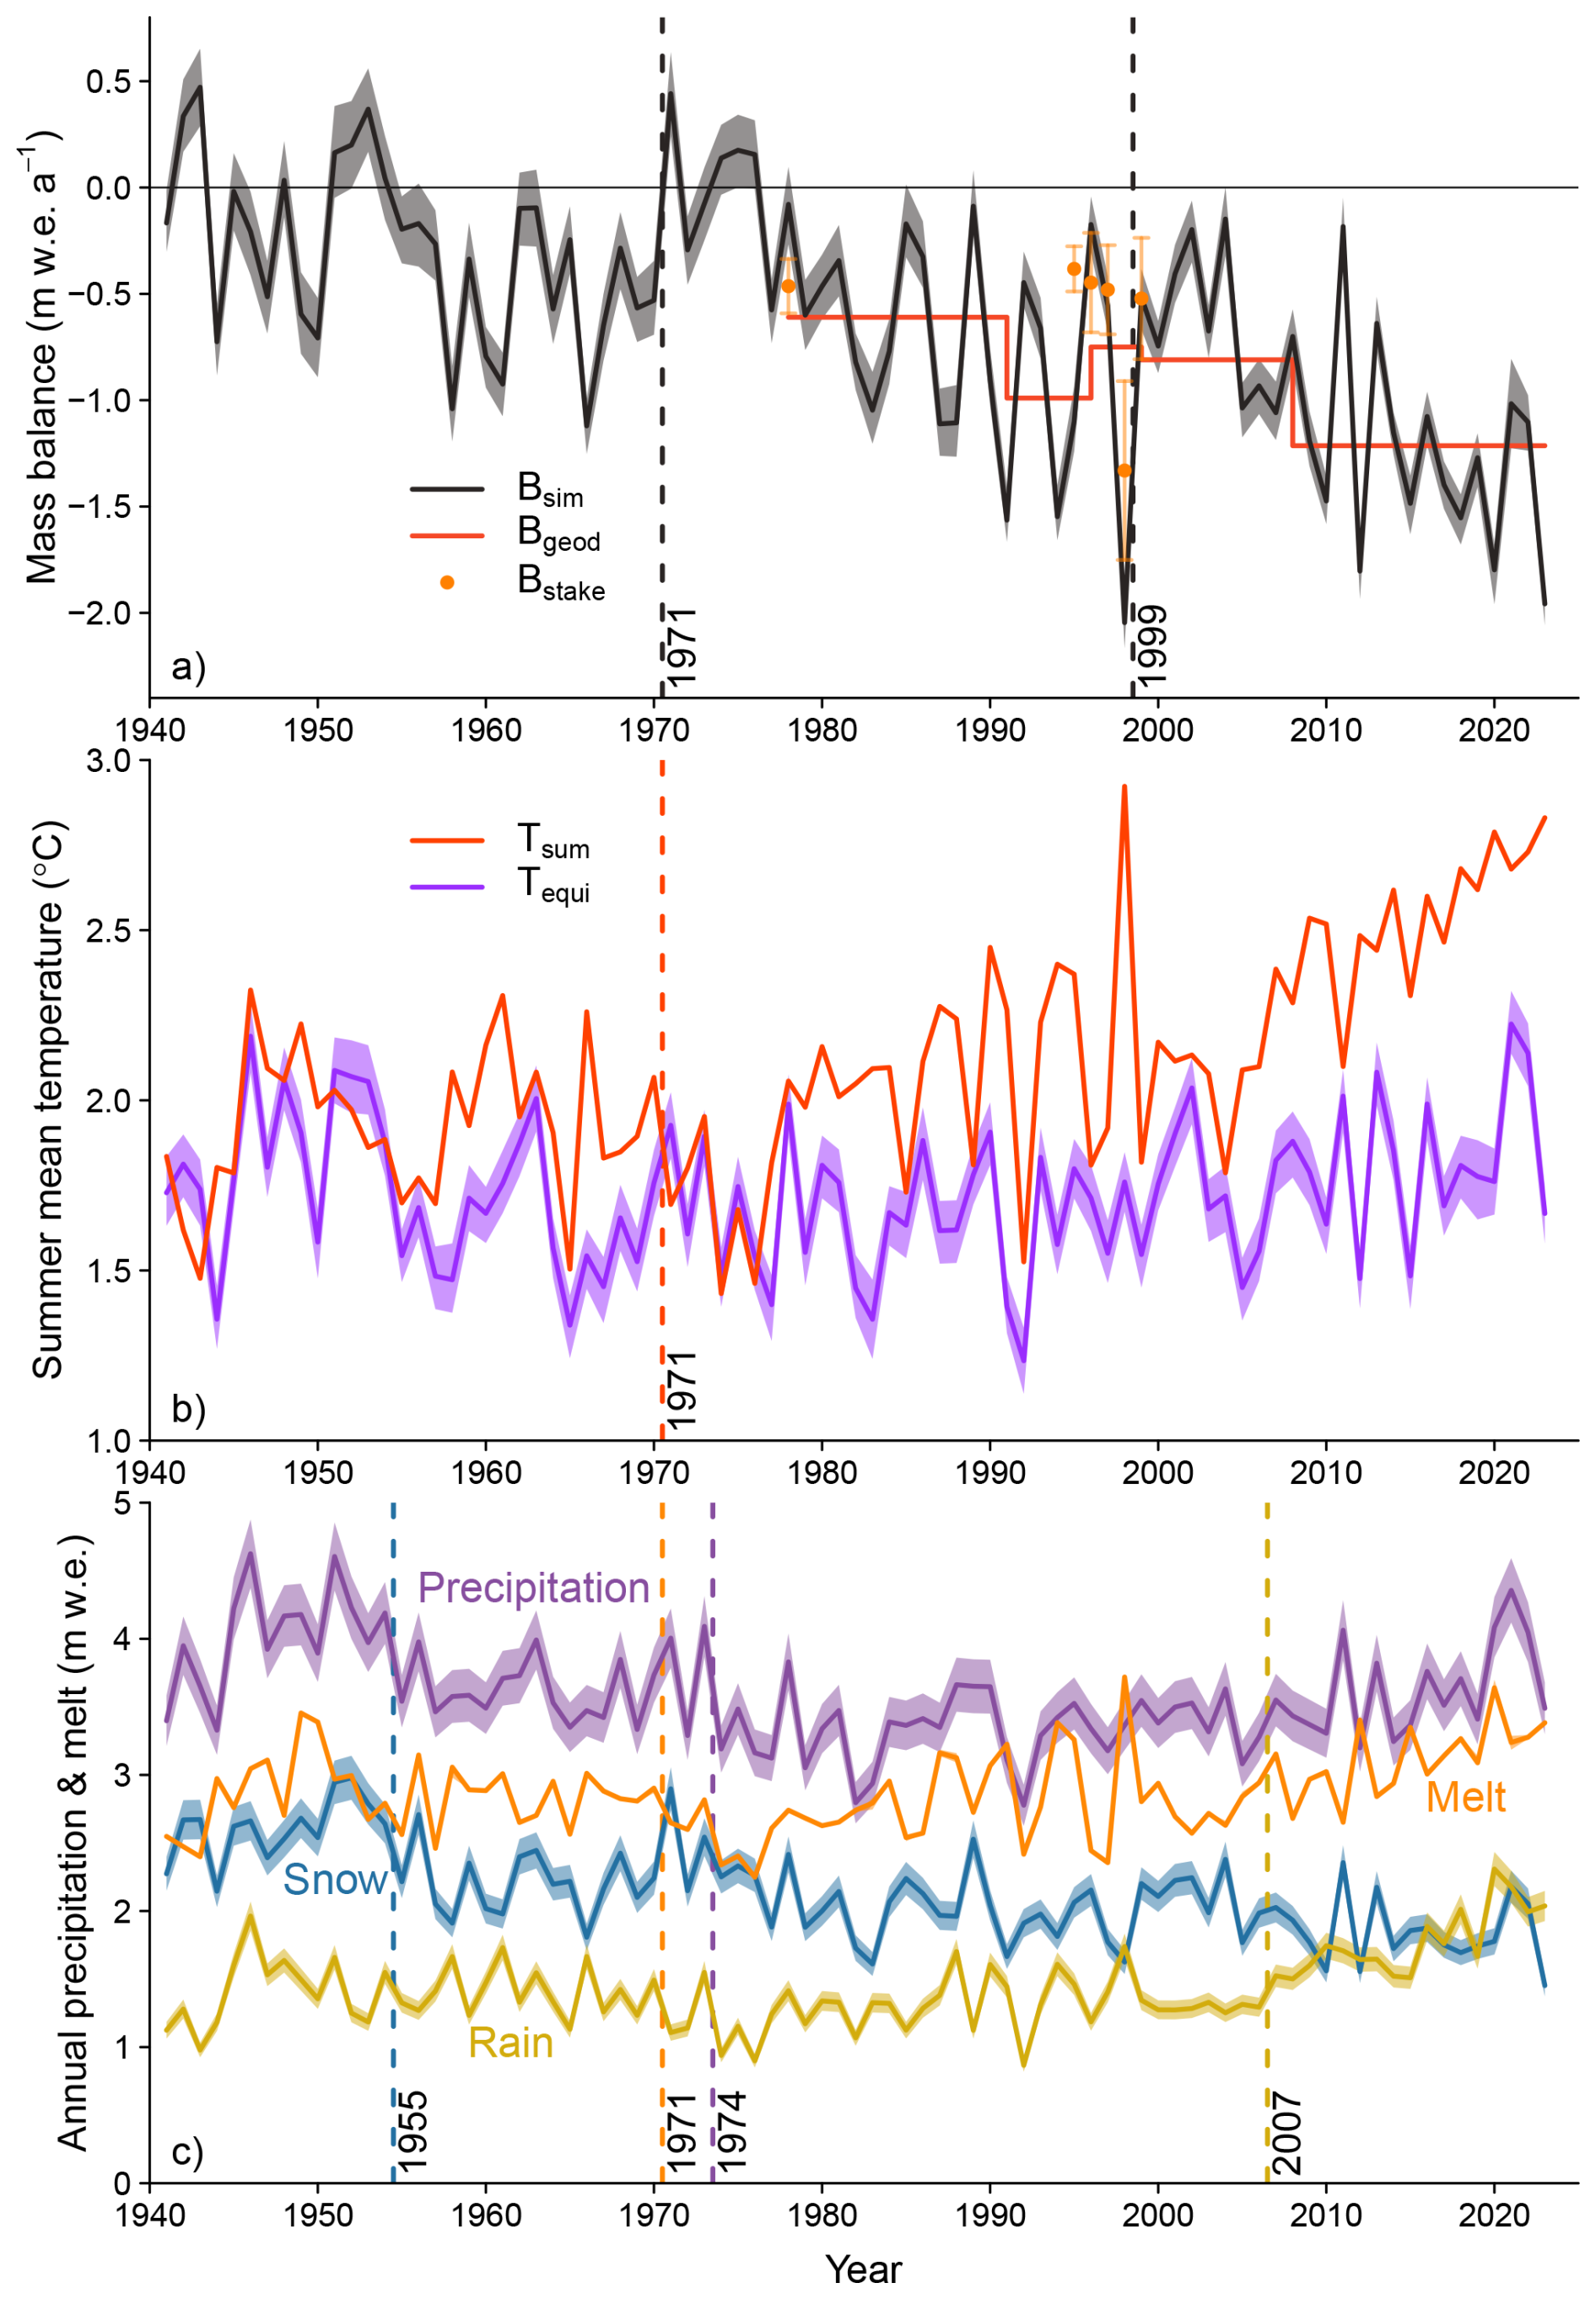
Figure 2Time series of (a) mass balance, (b) summer mean temperature, and (c) precipitation and melt for Glacier AX010 in the Shorong region, Nepal Himalaya. Black and red lines and orange dots in panel (a) denote the simulated annual (Bsim), ground-/drone-based geodetic (Bgeod), and stake-based (Bstake) mass balances, respectively. Red and purple lines in panel (b) denote area-weighted summer mean temperature (Tsum) and equilibrium temperature (Tequi) yielding a zero mass balance, respectively. Purple, blue, yellow, and orange lines in panel (c) denote annual amounts of precipitation, snow, rain, and melt, respectively. Vertical dashed lines with year numbers denote the break point of the trend for each variable.
In contrast, the mass balance calculated without adjusting precipitation became strongly negative (gray dots in Fig. S8a). This is because insufficient precipitation leads to inadequate accumulation, and at the same time, the surface albedo cannot be maintained at high values, which enhances melt. This can be regarded as a characteristic of glaciers influenced by the summer monsoon (Fujita and Ageta, 2000; Fujita, 2008). For more quantitative evaluation, we compared mass balance, accumulation, and melt averaged over the period from 1978 to 2023 (Table S6). Annual accumulation increased from 1.315 based on the ERA5 precipitation to 1.948 , an increase of 0.633 (exactly a factor of 1.48, which is the same value as the precipitation parameter used in the simulation), whereas the mass balance increased from −1.809 to −0.919 , an increase of 0.890 . The difference between these increases (0.257 ) can be interpreted as a melt-suppression effect, which is evaluated to be −0.187 , mediated through changes in albedo.
Because the observation periods of satellite-based geodetic mass balance (Bsat) do not coincide with those of the ground-based observations in this study (Bgeod), the satellite estimates were compared with the simulation results (Bsim) (Fig. S8c and Table S7). Bsat has increasingly overestimated ice mass loss in recent years. This is likely because, as glacier shrinkage has progressed, surface areas that have already become off-glacier are still included in estimates of surface lowering as addressed in Sect. 3.1. To accurately estimate mass changes of small glaciers, it is therefore essential to carefully track changes in glacier area. The bias in the satellite-based Bgeod due to glacier shrinkage has been pointed out for glaciers in Alaska and the US Rocky Mountains (Florentine et al., 2023).
3.4 Controlling factors for glacier shrinkage
Regarding long-term trends (1941–2023), both mass balance and air temperature exhibit clear decreasing and warming trends (−0.153 per decade and 0.089 °C per decade, both p<0.001), respectively (Fig. 2a and b, and Table S8). Breakpoint analysis (Zeileis et al., 2002) indicates a change point in 1971 for both variables (−0.245 per decade and 0.172 °C per decade for the period 1971–2023, both p<0.001). In addition, both variables shows another change point in 1999, revealing an acceleration of mass loss in more recent years (−0.473 per decade and 0.351 °C per decade for the period 1999–2023, both p<0.001). The melt amount (M) shows variations synchronized with summer mean temperature (Fig. 2c), including the break point in 1971 (0.126 per decade for the period 1971–2023, p<0.001) though the long-term trend is weak (0.039 per decade, p=0.012). The positive degree day (PDD), which is usually used in temperature-index models (Hock, 2003), also shows a significant increasing long-term trend (10.81 °C d per decade, p<0.001), with the rate of increase becoming particularly large since the beginning of the 21st century (50.67 °C d per decade, p<0.001 for the period 2001–2023) (Table S8). Interestingly, however, there is no significant long-term trend in the number of melt days per year (dmelt, 0.413 d per decade, p=0.299). This suggests that rising temperatures are accelerating glacier shrinkage, not by prolonging the melting period, but by increasing melt intensity. In contrast, precipitation shows little overall change (Fig. 2c). Although a slight decreasing long-term trend is evident over the entire period (−0.049 , p<0.007), precipitation has in fact shown an increasing tendency since 1974 (0.101 , p<0.004 for the period 1974–2023), after a weakly detected change point. However, snowfall and rainfall display statistically significant decreasing and increasing long-term trends (−0.095 per decade, p<0.001 and 0.046 per decade, p=0.001), respectively, with the increase in rainfall after 2007 being particularly pronounced (0.376 per decade, p<0.001 for the period 2007–2023). As a result, the snow accumulation has been consistently less than the melt amount since the late-1970s (Fig. 2c). This suggests that rising air temperatures promote glacier melt not only directly, but also indirectly by changing precipitation phase from snow to rain (Fujita, 2008; Jouberton et al., 2022). Likewise, winter snowfall has been reported to be decreasing in the neighbouring Khumbu region (Salerno et al., 2015). In contrast, future projections for the Langtang region suggest that increased precipitation may offset the reduction in river discharge that follows glacier shrinkage (Lutz et al., 2014). Taken together, over the past 45 years at Glacier AX010, there is little doubt that the primary driver of glacier shrinkage has been rising air temperatures. No long-term trend in precipitation is evident, and it is clear that precipitation has neither suppressed nor accelerated glacier shrinkage driven by temperature increases.
Nevertheless, for Trambau Glacier, which lies within the same ERA5 grid cell, the reconstructed mass balance consistently shows negative values but no clear trend despite being forced by the same meteorological data (Sunako et al., 2019). Moreover, while mass balance at Trambau Glacier shows no correlation with summer mean temperature () and a significantly positive correlation with annual precipitation (r=0.77, p<0.001), Glacier AX010 exhibits a strong correlation with summer mean temperature (, p<0.001) and weaker correlation with annual precipitation (r=0.33, p<0.003). These correlations indicate that the response of glacier mass balance to variations in temperature and precipitation can differ substantially even among neighboring glaciers. In addition, for Mera Glacier, which lies 33 km east of Glacier AX010, the mass-balance anomaly correlates significantly with the anomalies of annual mean temperature (, p<0.001) and annual precipitation (r=0.87, p<0.001) (Khadka et al., 2024). Although more detailed analyses are required to identify the causes of these differing responses and trends, our results suggest that it is problematic to naively extrapolate trends and climate-mass balance relationships derived for individual glaciers to the mountain-range scale.
We defined an air temperature at which the glacier mass balance becomes zero (Tequi), i.e. the glacier is in equilibrium, by iterative calculations using GLIMB (purple line in Fig. 2b). The variability and trend of Tequi reflect those of precipitation; however, no statistically significant trend was detected (Table S8). In recent years, air temperature has increased by nearly 1 °C above the level at which the glacier could be maintained in equilibrium.
3.5 Impact of shrinking glacier
To reconstruct the annual mass balance, interpolated hypsometries were used. To assess how changes in glacier size affect the reconstructed results, we recalculated the mass balance using hypsometry corresponding to the maximum (1978) and minimum (2023) glacier extents (Fig. S10). The results show that the impact of the hypsometry setting is comparable to the uncertainty in mass balance (±0.149 ) arising from the precipitation parameter (±0.08). This is because, even though the glacier has shrunk dramatically over the past 45 years, the medians of the two hypsometries differ by only 20 m in elevation (Fig. S3), which is equivalent to the mass-balance uncertainty due to the precipitation assumption.
3.6 When will Glacier AX010 disappear?
Figure S2b shows the spatial distribution of glacier ice thickness, which is derived from the cross section estimation (Fig. S11). Comparison with ice thickness measured by ice radar in 1995 (Kadota et al., 1997) indicates differences of +25 to −15 m relative to the 2023 bed elevation (Table S9). Given that the ice radar used in 1995 operated at 5 MHz, corresponding to a wavelength of approximately 60 m, these differences can be considered within the measurement uncertainty. Based on these results, the remaining ice volume in 2023 is estimated at 2.27×10⁶ m3, with a mean thickness of 13.7 m and a maximum thickness of 38.2 m. The ice loss from 2008 to 2023 is estimated at 7.17×10⁶ m3, indicating that only about one quarter of the 2008 ice volume remains. Assuming an ice density of 890 kg m−3, the maximum ice thickness corresponds to 34.0 If the geodetic mass balance observed from 2008 to 2023 () were to continue, the glacier would disappear by 2050. In contrast, if the pronounced acceleration in ice loss observed since 1999 persists (; yr denotes year), the glacier is estimated to be lost by 2040.
In this study, we updated the geodetic mass balance of AX010, the glacier with the oldest observational record in the Nepal Himalaya, using drone-based surveys, and demonstrated that glacier mass loss has been accelerating. By calibrating meteorological variables in the ERA5 reanalysis data against nearby in situ observations, and by using the observed mass balance together with an energy-mass balance model, we derived a calibration factor for ERA5 precipitation. We found that precipitation differs by a factor of 5 despite a separation of only 16 km. This indicates strong spatial heterogeneity in precipitation. Furthermore, with the recently developed global dataset of glacier change, our approach may enable estimation of precipitation heterogeneity on a glacier-by-glacier basis. However, a key challenge will be assessing uncertainties in the global dataset, particularly those arising from changing glacier extent.
Using the model with the calibrated meteorological data, we reconstructed the annual mass balance over eight decades. By comparing with meteorological variables, we concluded that glacier shrinkage at this site has been primarily driven by rising air temperature, while changes in precipitation have neither accelerated nor mitigated the mass loss. In contrast, neighboring Trambau Glacier within the same reanalysis grid does not exhibit accelerated ice loss, highlighting the need to clarify the causes of this contrasting behavior.
Mass loss of Glacier AX010 has accelerated since the beginning of the 21st century, and if this trend continues, the glacier is estimated to disappear completely within the next one to two decades. It would be advisable to conduct a final observation in the mid-2030s, both to document its disappearance and to verify whether estimates such as ice thickness were accurate.
Small glaciers serve as sensitive indicators of climate change due to their rapid response to environmental perturbations. These glaciers provide opportunities to detect and document early-stage responses to climate warming. As this study demonstrated, detailed studies of individual small glaciers enable the calibration and validation of reanalysis datasets, revealing critical limitations such as strong spatial heterogeneity in precipitation that may not be captured at coarser scales. In addition, contrasting behaviors among neighboring glaciers within the same climatic region highlight the importance of local and topographic controls, underscoring the need for glacier-specific investigations. Finally, monitoring disappearing small glaciers offers a unique chance to verify model predictions and ice thickness estimates, contributing to improved understanding of glacier dynamics and enhanced accuracy in future projections. Given their numerical dominance in many mountain regions and their vulnerability to ongoing warming, small glaciers warrant continued scientific attention.
Daily meteorological data of the Trakarding AWS for 2022–2023 (https://doi.org/10.5281/zenodo.18502771, Fujita, 2026a), temperature and mass balance observed at AX010 in 1978 and in the 1990s (https://doi.org/10.5281/zenodo.18503128, Fujita, 2026f), drone-based orthomosaic and DEM in 2023 (https://doi.org/10.5281/zenodo.18504092, Fujita, 2026b), GNSS data surveyed in 2008 (https://doi.org/10.5281/zenodo.18503873, Fujita, 2026c), hypsometry of Glacier AX010 (https://doi.org/10.5281/zenodo.18503308, Fujita, 2026d), and simulated mass balance of Glacier AX010 (https://doi.org/10.5281/zenodo.20945457, Fujita, 2026e) are available at Zenodo (note: for review, we provide private access links in a different file). The satellite-based geodetic mass balance data are extracted from https://doi.org/10.6096/13 (Hugonnet et al., 2021b). The ERA5 hourly reanalysis data (pressure and single levels) are obtained from Copernicus Climate Data Store (https://doi.org/10.24381/cds.bd0915c6, Hersbach et al., 2023a; https://doi.org/10.24381/cds.adbb2d47, Hersbach et al., 2023b.
The supplement related to this article is available online at https://doi.org/10.5194/tc-20-4005-2026-supplement.
KF designed the study, conducted field surveys, analyzed the data, and wrote the manuscript. RBK supported the fieldwork in Nepal, and commented the manuscript.
The contact author has declared that neither of the authors has any competing interests.
Publisher's note: Copernicus Publications remains neutral with regard to jurisdictional claims made in the text, published maps, institutional affiliations, or any other geographical representation in this paper. The authors bear the ultimate responsibility for providing appropriate place names. Views expressed in the text are those of the authors and do not necessarily reflect the views of the publisher.
We deeply thank Sherpa guides and porters arranged by Guide for All Seasons Trek for their dedicated logistic support. We also thank S. Sunako for his advice for the analysis of drone photogrammetry data. We would thank B. Noël and anonymous reviewers for their valuable inputs and reviews.
This research has been supported by the Japan Society for the Promotion of Promotion of Science (KAKENHI grant no. 22H00033).
This paper was edited by Brice Noël and reviewed by two anonymous referees.
Ageta, Y., Ohata, T., Tanaka, Y., Ikegami, K., and Higuchi, K.: Mass balance of Glacier AX010 in Shorong Himal, east Nepal during the summer monsoon season, Journal of the Japanese Society of Snow and Ice, 41, 34–41, 1980. a, b
Azam, M. F., Wagnon, P., Berthier, E., Vincent, C., Fujita, K., and Kargel, J. S.: Review of the status and mass changes of Himalayan-Karakoram glaciers, J. Glaciol., 64, 61–74, https://doi.org/10.1017/jog.2017.86, 2018. a
Bahr, D. B. and Radić, V.: Significant contribution to total mass from very small glaciers, The Cryosphere, 6, 763–770, https://doi.org/10.5194/tc-6-763-2012, 2012. a
Basantes-Serrano, R., Soria, A., Cusicanqui, D., Rojas, S., Torres, G., Rivadeneira, A., Jaramillo, N., Pilliza, E., and Calderon, L.: In memory of Kari-Huayra-Razu, a recently ice cap disappeared in the inner tropics, Ann. Glaciol., 67, e14, https://doi.org/10.1017/aog.2025.10036, 2026. a
Bello, C., Cashpa, V., Vilca, L., Cruz, R., Torres, C., and Rabatel, A.: Vanishing of the Glacier Yanamarey, one of the four glaciers with in situ measurements in the Cordillera Blanca, Peru, Ann. Glaciol., 67, e8, https://doi.org/10.1017/aog.2025.10035, 2026. a
Braithwaite, R. J. and Hughes, P. D.: Regional geography of glacier mass balance variability over seven decades 1946–2015, Front. Earth Sci., 8, 302, https://doi.org/10.3389/feart.2020.00302, 2020. a
Florentine, C., Sass, L., McNeil, C., Baker, E., and O'Neel, S.: How to handle glacier area change in geodetic mass balance, J. Glaciol., 69, 2169–2175, https://doi.org/10.1017/jog.2023.86, 2023. a
Fujita, K.: Influence of precipitation seasonality on glacier mass balance and its sensitivity to climate change, Ann. Glaciol., 48, 88–92, https://doi.org/10.3189/172756408784700824, 2008. a, b
Fujita, K.: Daily meteorological data observed at Trakarding Glacier AWS (2022-2023) in the Rolwaling region, Nepal Himalaya, Zenodo [data set], https://doi.org/10.5281/zenodo.18502771, 2026a. a
Fujita, K.: Drone-based orthomosaic and DEM of Glaciers AX010 and AX000 surveyed in 2023 in the Shorong region, Nepal Himalaya, Zenodo [data set], https://doi.org/10.5281/zenodo.18504092, 2026b. a
Fujita, K.: GNSS data around Glaciers AX010 and AX000 surveyed in 2008 and 2023 in the Shorong region, Nepal Himalaya, Zenodo [data set], https://doi.org/10.5281/zenodo.18503873, 2026c. a
Fujita, K.: Hypsometry of Glacier AX010 in the Shorong region, Nepal Himalaya, Zenodo [data set], https://doi.org/10.5281/zenodo.18503308, 2026d. a
Fujita, K.: Simulated annual mass balance of Glaciers AX010 in the Shorong region, Nepal Himalaya, Zenodo [data set], https://doi.org/10.5281/zenodo.20945457, 2026e. a
Fujita, K.: Daily temperature and stake-based mass balance observed at Glacier AX010 in 1978 and the 1990s in the Shorong region, Nepal Himalaya, Zenodo [data set], https://doi.org/10.5281/zenodo.18503128, 2026f. a
Fujita, K. and Ageta, Y.: Effect of summer accumulation on glacier mass balance on the Tibetan Plateau revealed by mass-balance model, J. Glaciol., 46, 244–252, https://doi.org/10.3189/172756500781832945, 2000. a, b, c, d, e
Fujita, K. and Nuimura, T.: Spatially heterogeneous wastage of Himalayan glaciers, P. Natl. Acad. Sci. USA, 108, 14011–14014, https://doi.org/10.1073/pnas.1106242108, 2011. a, b, c
Fujita, K. and Sakai, A.: Modelling runoff from a Himalayan debris-covered glacier, Hydrol. Earth Syst. Sci., 18, 2679–2694, https://doi.org/10.5194/hess-18-2679-2014, 2014. a, b, c, d
Fujita, K., Kadota, T., Rana, B., Kayastha, R. B., and Ageta, Y.: Shrinkage of Glacier AX010 in Shorong region, Nepal Himalayas in the 1990s, Bulletin of Glaciological Research, 18, 51–54, 2001. a, b, c, d
Hersbach, H., Bell, B., Berrisford, P., Hirahara, S., Horányi, A., Muñoz-Sabater, J., Nicolas, J., Peubey, C., Radu, R., Schepers, D., Simmons, A., Soci, C., Abdalla, S., Abellan, X., Balsamo, G., Bechtold, P., Biavati, G., Bidlot, J., Bonavita, M., De Chiara, G., Dahlgren, P., Dee, D., Diamantakis, M., Dragani, R., Flemming, J., Forbes, R., Fuentes, M., Geer, A., Haimberger, L., Healy, S., Hogan, R. J., Hólm, E., Janisková, M., Keeley, S., Laloyaux, P., Lopez, P., Lupu, C., Radnoti, G., de Rosnay, P., Rozum, I., Vamborg, F., Villaume, S., and Thépaut, J.-N.: The ERA5 global reanalysis, Q. J. Roy. Meteor. Soc., 146, 1999–2049, https://doi.org/10.1002/qj.3803, 2020. a
Hersbach, H., Bell, B., Berrisford, P., Biavati, G., Horányi, A., Muñoz Sabater, J., Nicolas, J., Peubey, C., Radu, R., Rozum, I., Schepers, D., Simmons, A., Soci, C., Dee, D., and Thépaut, J.-N.: ERA5 hourly data on pressure levels from 1940 to present, Copernicus Climate Change Service (C3S) Climate Data Store (CDS) [data set], https://doi.org/10.24381/cds.bd0915c6, 2023a. a
Hersbach, H., Bell, B., Berrisford, P., Biavati, G., Horányi, A., Muñoz Sabater, J., Nicolas, J., Peubey, C., Radu, R., Rozum, I., Schepers, D., Simmons, A., Soci, C., Dee, D., and Thépaut, J.-N.: ERA5 hourly data on single levels from 1940 to present, Copernicus Climate Change Service (C3S) Climate Data Store (CDS) [data set], https://doi.org/10.24381/cds.adbb2d47, 2023b. a
Hock, R.: Temperature index melt modelling in mountain areas, J. Hydrol., 282, 104–115, https://doi.org/10.1016/S0022-1694(03)00257-9, 2003. a
Hugonnet, R., McNabb, R., Berthier, E., Menounos, B., Nuth, C., Girod, L., Farinotti, D., Huss, M., Dussaillant, I., Brun, F., and Kääb, A.: Accelerated global glacier mass loss in the early twenty-first century, Nature, 592, 726–731, https://doi.org/10.1038/s41586-021-03436-z, 2021a. a, b, c, d, e, f, g
Hugonnet, R., McNabb, R., Berthier, E., Menounos, B., Nuth, C., Girod, L., Farinotti, D., Huss, M., Dussaillant, I., Brun, F., and Kääb, A.: Accelerated global glacier mass loss in the early twenty-first century – Dataset, Theia [data set], https://doi.org/10.6096/13, 2021b. a
Huss, M. and Fischer, M.: Sensitivity of very small glaciers in the Swiss Alps to future climate change, Front. Earth Sci., 4, 34, https://doi.org/10.3389/feart.2016.00034, 2016. a
Jouberton, A., Shaw, T. E., Miles, E., McCarthy, M., Fugger, S., Ren, S., Dehecq, A., Yang, W., and Pellicciotti, F.: Warming-induced monsoon precipitation phase change intensifies glacier mass loss in the southeastern Tibetan Plateau, P. Natl. Acad. Sci. USA, 119, e2109796119, https://doi.org/10.1073/pnas.2109796119, 2022. a
Kadota, T. and Ageta, Y.: On the relation between climate and retreat of Glacier AX010 in the Nepal Himalaya from 1978 to 1989, Bulletin of Glacier Research, 10, 1–10, 1992. a
Kadota, T., Fujita, K., Seko, K., Kayastha, R. B., and Ageta, Y.: Monitoring and prediction of shrinkage of a small glacier in the Nepal Himalaya, Ann. Glaciol., 24, 90–94, https://doi.org/10.3189/S0260305500011988, 1997. a, b, c
Khadka, A., Wagnon, P., Brun, F., Shrestha, D., Lejeune, Y., and Arnaud, Y.: Evaluation of ERA5-Land and HARv2 reanalysis data at high elevation in the upper Dudh Koshi basin (Everest region, Nepal), J. Appl. Meteorol., 61, 931–954, https://doi.org/10.1175/JAMC-D-21-0091.1, 2022. a
Khadka, A., Brun, F., Wagnon, P., Shrestha, D., and Sherpa, T. C.: Surface energy and mass balance of Mera Glacier (Nepal, Central Himalaya) and their sensitivity to temperature and precipitation, J. Glaciol., 70, e80, https://doi.org/10.1017/jog.2024.42, 2024. a, b
Khalzan, P., Sakai, A., and Fujita, K.: Mass balance of four Mongolian glaciers: in-situ measurements, long-term reconstruction and sensitivity analysis, Front. Earth Sci., 9, 785306, https://doi.org/10.3389/feart.2021.785306, 2022. a, b, c
Kondo, K. and Fujita, K.: Increasing glacier runoff in northwestern Greenland simulated from 1950 to 2023, Hydrol. Earth Syst. Sci., 30, 1849–1864, https://doi.org/10.5194/hess-30-1849-2026, 2026. a
Lutz, A., Immerzeel, W., Shrestha, A., and Bierkens, M.: Consistent increase in High Asia's runoff due to increasing glacier melt and precipitation, Nat. Clim. Change, 4, 587–592, https://doi.org/10.1038/nclimate2237, 2014. a
Maurer, J. M., Schaefer, J., Rupper, S., and Corley, A.: Acceleration of ice loss across the Himalayas over the past 40 years, Science Advances, 5, eaav7266, https://doi.org/10.1126/sciadv.aav7266, 2019. a, b, c
McCerery, R., Lovell, H., King, O., Davies, B. J., Boston, C. M., Małecki, J., Carrivick, J., and Woodward, J.: Retreat and volume loss of two rapidly vanishing Svalbard glaciers since 1938: Elsabreen and Ferdinandbreen, Petuniabukta, Ann. Glaciol., 67, e3, https://doi.org/10.1017/aog.2025.10034, 2026. a
Nuimura, T., Fujita, K., Yamaguchi, S., and Sharma, R. R.: Elevation changes of glaciers revealed by multitemporal digital elevation models calibrated by GPS survey in the Khumbu region, Nepal Himalaya, 1992–2008, J. Glaciol., 58, 648–656, https://doi.org/10.3189/2012JoG11J061, 2012. a
Nuimura, T., Sakai, A., Taniguchi, K., Nagai, H., Lamsal, D., Tsutaki, S., Kozawa, A., Hoshina, Y., Takenaka, S., Omiya, S., Tsunematsu, K., Tshering, P., and Fujita, K.: The GAMDAM glacier inventory: a quality-controlled inventory of Asian glaciers, The Cryosphere, 9, 849–864, https://doi.org/10.5194/tc-9-849-2015, 2015. a
Ojha, S., Fujita, K., Asahi, K., Sakai, A., Lamsal, D., Nuimura, T., and Nagai, H.: Glacier area shrinkage in eastern Nepal Himalaya since 1992 using high-resolution inventories from aerial photographs and ALOS satellite images, J. Glaciol., 62, 512–524, https://doi.org/10.1017/jog.2016.61, 2016. a
Parkes, D. and Marzeion, B.: Twentieth-century contribution to sea-level rise from uncharted glaciers, Nature, 563, 551–554, https://doi.org/10.1038/s41586-018-0687-9, 2018. a
Purdie, H., Kerr, T., Robson, B. A., Anderson, B., Lorrey, A., Rack, W., Brasington, J., and Bealing, P.: Mass balance characteristics of the “vanishing' Rolleston Glacier, New Zealand, Ann. Glaciol., 66, e31, https://doi.org/10.1017/aog.2025.10032, 2025. a
Raup, B., Andreassen, L. M., Boyer, D., Howe, C., Pelto, M., and Rabatel, A.: Tracking extinct glaciers in GLIMS, Ann. Glaciol., 66, e35, https://doi.org/10.1017/aog.2025.10027, 2025. a
Sakai, A.: Brief communication: Updated GAMDAM glacier inventory over high-mountain Asia , The Cryosphere, 13, 2043–2049, https://doi.org/10.5194/tc-13-2043-2019, 2019. a
Sakai, A., Nuimura, T., Fujita, K., Takenaka, S., Nagai, H., and Lamsal, D.: Climate regime of Asian glaciers revealed by GAMDAM glacier inventory, The Cryosphere, 9, 865–880, https://doi.org/10.5194/tc-9-865-2015, 2015. a, b
Salerno, F., Guyennon, N., Thakuri, S., Viviano, G., Romano, E., Vuillermoz, E., Cristofanelli, P., Stocchi, P., Agrillo, G., Ma, Y., and Tartari, G.: Weak precipitation, warm winters and springs impact glaciers of south slopes of Mt. Everest (central Himalaya) in the last 2 decades (1994–2013), The Cryosphere, 9, 1229–1247, https://doi.org/10.5194/tc-9-1229-2015, 2015. a
Shean, D. E., Bhushan, S., Montesano, P., Rounce, D. R., Arendt, A., and Osmanoglu, B.: A systematic, regional assessment of high mountain Asia glacier mass balance, Front. Earth Sci., 7, 363, https://doi.org/10.3389/feart.2019.00363, 2020. a, b, c
Sunako, S., Fujita, K., Sakai, A., and Kayastha, R. B.: Mass balance of Trambau Glacier, Rolwaling region, Nepal Himalaya: in-situ observations, long-term reconstruction and mass-balance sensitivity, J. Glaciol., 65, 605–616, https://doi.org/10.1017/jog.2019.37, 2019. a
Sunako, S., Fujita, K., Izumi, T., Yamaguchi, S., Sakai, A., and Kayastha, R. B.: Up-glacier propagation of surface lowering of Yala Glacier, Langtang Valley, Nepal Himalaya, J. Glaciol., 69, 425–432, https://doi.org/10.1017/jog.2022.118, 2023. a
Tshering, P. and Fujita, K.: First in situ record of decadal glacier mass balance (2003–2014) from the Bhutan Himalaya, Ann. Glaciol., 57, 289–294, https://doi.org/10.3189/2016AoG71A036, 2016. a
Vidaller, I., Revuelto, J., Izagirre, E., Rojas-Heredia, F., Alonso-González, E., Gascoin, S., René, P., Berthier, E., Rico, I., Moreno, A., Serrano, E., A. Serreta, A., and López-Moreno, J. I.: Toward an ice-free mountain range: demise of Pyrenean glaciers during 2011–2020, Geophys. Res. Lett., 48, e2021GL094339, https://doi.org/10.1029/2021GL094339, 2021. a
Yamada, T., Shiraiwa, T., Iida, H., Kadota, T., Watanabe, T., Rana, B., Ageta, Y., and Fushimi, H.: Fluctuation of the glaciers from the 1970s to 1989 in the Kumbu, Shorong and Langtang regions, Nepal Himalayas, Bulletin of Glacier Research, 10, 11–19, 1992. a
Zeileis, A., Leisch, F., Hornik, K., and Kleiber, C.: strucchange: an R package for testing for structural change in linear regression models, J. Stat. Softw., 7, 1–38, https://doi.org/10.18637/jss.v007.i02, 2002. a
Zemp, M., Frey, H., Gärtner-Roer, I., Nussbaumer, S. U., Hoelzle, M., Paul, F., Haeberli, W., Denzinger, F., Ahlstrøm, A. P., Anderson, B., Bajracharya, S., Baroni, C., Braun, L. N., Cáceres, B. E., Casassa, G., Cobos, G., Dávila, L. R., Delgado Granados, H., Demuth, M. N., Espizua, L., Fischer, A., Fujita, K., Gadek, B., Ghazanfar, A., Hagen, J. O., Holmlund, P., Karimi, N., Li, Z. Q., Pelto, M., Pitte, P., Popovnin, V. V., Portocarrero, C. A., Prinz, R., Sangewar, C. V., Severskiy, I., Sigurðsson, O., Soruco, A., Usubaliev, R., and Vincent, C.: Historically unprecedented global glacier decline in the early 21st century, J. Glaciol., 61, 745–762, https://doi.org/10.3189/2015JoG15J017, 2015. a, b