
the Creative Commons Attribution 4.0 License.
the Creative Commons Attribution 4.0 License.
 | 17 Jul 2026
Long-term InSAR and streamflow recession analysis reveal accelerated permafrost degradation in the mining area of the Qilian Mountains
Tian Chang
Yonghong Yi
Masato Furuya
Huiru Jiang
Youhua Ran
Rongxing Li
Permafrost underlies about 40 % of the Qinghai-Tibet Plateau (QTP), where climate warming and human activities increasingly threaten fragile alpine ecosystems, necessitating long-term permafrost monitoring. Interferometric Synthetic Aperture Radar (InSAR) enables precise detection of thaw-induced surface deformation, while streamflow recession helps reveal subsurface hydrological changes with permafrost degradation. This study performed a first-time joint analysis of decades-long InSAR surface deformation and streamflow recession to assess the trajectory of permafrost degradation in the source region of the Datong River, an area located in the Qilian Mountains of the northeastern QTP and subject to intensive mining during the 2000s and early 2010s. A data-constrained Small Baseline Subset (SBAS) method was proposed to improve the Sentinel-1 C-band deformation retrievals through integrating a linear–periodic temporal constraint model and using concurrent ALOS-2 retrieved deformation rate as a reference. A consistent long-term (1997–2023) deformation dataset was then generated through combining multi-sensor C- and L-band SAR retrievals. The results reveal minimal surface deformation before the mining, followed by sustained ground subsidence (−15 to ) and enhanced seasonal deformation () during and after mining, indicating accelerated permafrost degradation. This acceleration coincides with a marked slowdown in the post-mining streamflow recession rate derived from daily discharge data of the upper Datong River, likely driven by thaw-induced increases in basin subsurface water storage and flowpath connectivity. This study provides a first comprehensive assessment of permafrost degradation from both surface and subsurface perspectives, offering valuable insights for integrating remote sensing and hydrological observations to assess permafrost vulnerability.
- Article
(18565 KB) - Full-text XML
-
Supplement
(6096 KB) - BibTeX
- EndNote


Permafrost, a critical component of the cryosphere, plays a vital role in regulating hydrological, ecological, and geomorphological processes in cold regions (Biskaborn et al., 2019; Jin et al., 2021; Zou et al., 2017). The Qinghai-Tibet Plateau (QTP) has the most extensive permafrost coverage in the mid- and low-latitude regions (Zou et al., 2017). Compared with the northern high-latitude permafrost regions, permafrost on the QTP is generally warmer, with ground temperatures exceeding −1 °C in some regions and close to the freezing point, making it highly sensitive to climate change (Mu et al., 2017; Ran et al., 2018). In addition to climate warming, human activities such as mining, overgrazing, and infrastructure development have been exerting growing pressure on the QTP permafrost stability (Hjort et al., 2022; Ran et al., 2022). Under the combined pressure of climate warming and human disturbance, the QTP has undergone widespread permafrost degradation, including active layer deepening, near-surface permafrost loss, and more frequent thermokarst development (Murton, 2021; Yi et al., 2025). To better understand these degradation processes and their environmental impact, long-term monitoring of permafrost dynamics is essential.
Because permafrost is a subsurface feature, it has been challenging to detect its state and evolution using satellite remote sensing (Runge et al., 2022). Nonetheless, permafrost dynamics can be inferred indirectly from surface changes (Zhang et al., 2022). In permafrost regions, the melting of ground ice and the seasonal freeze–thaw cycle of the active layer can lead to long-term surface subsidence as well as periodic ground uplift and subsidence (Liu et al., 2012). Therefore, continuous monitoring of surface deformation can provide critical information for assessing permafrost conditions. Traditional methods, such as leveling and total station surveys, provide highly accurate deformation measurements but are labor-intensive and spatially limited (Tao et al., 2025). The Global Navigation Satellite System (GNSS) offers precise point-based monitoring, but high maintenance costs limit its applicability for large-scale observations (Liu et al., 2025). Recently, Interferometric Synthetic Aperture Radar (InSAR) has become an effective technique for detecting surface deformation in permafrost regions, offering millimeter precision, high spatial resolution, and broad coverage across large and often inaccessible areas (Chen et al., 2022; Liu et al., 2010). However, temporal decorrelation poses a major challenge for InSAR applications in permafrost environments, primarily due to rapid surface changes induced by freeze–thaw cycles, snow cover changes, and vegetation growth (Fan et al., 2025a; Zwieback et al., 2024). This makes it challenging for long-term and continuous monitoring of surface deformation, particularly using shorter wavelengths such as C-band. On the other hand, while long-wavelength SAR data (e.g., L-band) can maintain good coherence over long temporal baselines, the availability of historical satellite L-band data has been sparse, with longer revisit time and less frequent global coverage compared to C-band systems (Wang et al., 2017). Due to the above limitation, the majority of existing InSAR-based permafrost studies have been constrained to relatively short observation periods (<10 years). How to effectively combine the multi-frequency SAR data (e.g., L-band and C-band) to obtain reliable, long-term surface deformation and detect decades-long evolution of permafrost changes is now urgently needed but remains underinvestigated.
Beyond surface deformation, permafrost degradation also profoundly impacts subsurface hydrological processes. As a low-permeability layer, permafrost restricts downward water movement and regulates surface water infiltration and surface-subsurface water exchange (Walvoord and Kurylyk, 2016). With permafrost degradation, enhanced soil water storage and subsurface flowpath connectivity can reshape the subsurface flow production and alter the streamflow recession characteristics at the basin outlet (Bense et al., 2012). Therefore, the long-term streamflow recession process contains valuable information on the basin-wide permafrost state and changes. Previous studies have linked permafrost degradation with increasing winter baseflow, altered ratio of surface to subsurface runoff production, and slowdown in the streamflow recession (Fan et al., 2024; Feng et al., 2022; Walvoord and Kurylyk, 2016; Wang et al., 2018). These studies have revealed profound influences of progressive thawing of ground ice and deepening of the active layer on the river discharge and groundwater changes (Jorgenson et al., 2025). However, few studies have linked the hydrological indicators with InSAR-derived surface deformation to provide an integrated perspective on the permafrost change detection at the regional scale.
The source region of the Datong River, located in the Qilian Mountains of northeastern QTP, had undergone intensive mining activities in the early 2000s and 2010s (Fig. 1; Wang et al., 2022). This area has also experienced significant warming () in the past few decades (1973–2022). To what extent these changes have affected the alpine ecosystem and permafrost state has not been well investigated. Therefore, this study aims to provide a comprehensive assessment of the decades-long (>20 years) permafrost changes in this region from both surface and subsurface perspectives through integrated analysis of long-term InSAR deformation retrievals and the streamflow recession process. Multi-source C- and L-band SAR data were combined to derive a decades-long surface deformation dataset since the late 1990s. We improved the Sentinel-1 C-band InSAR time series inversion through integrating a linear–periodic temporal constraint model and incorporating L-band ALOS-2 deformation rates as a velocity reference to mitigate the influences of a disconnected interferogram network on the C-band deformation retrievals. Long-term daily discharge data at the outlet of the upper Datong River were used to characterize the streamflow recession dynamics and detect subsurface hydrological changes associated with permafrost degradation. By jointly analyzing long-term InSAR deformation and streamflow recession characteristics, this study provides valuable insights into the underlying processes driving permafrost vulnerability.
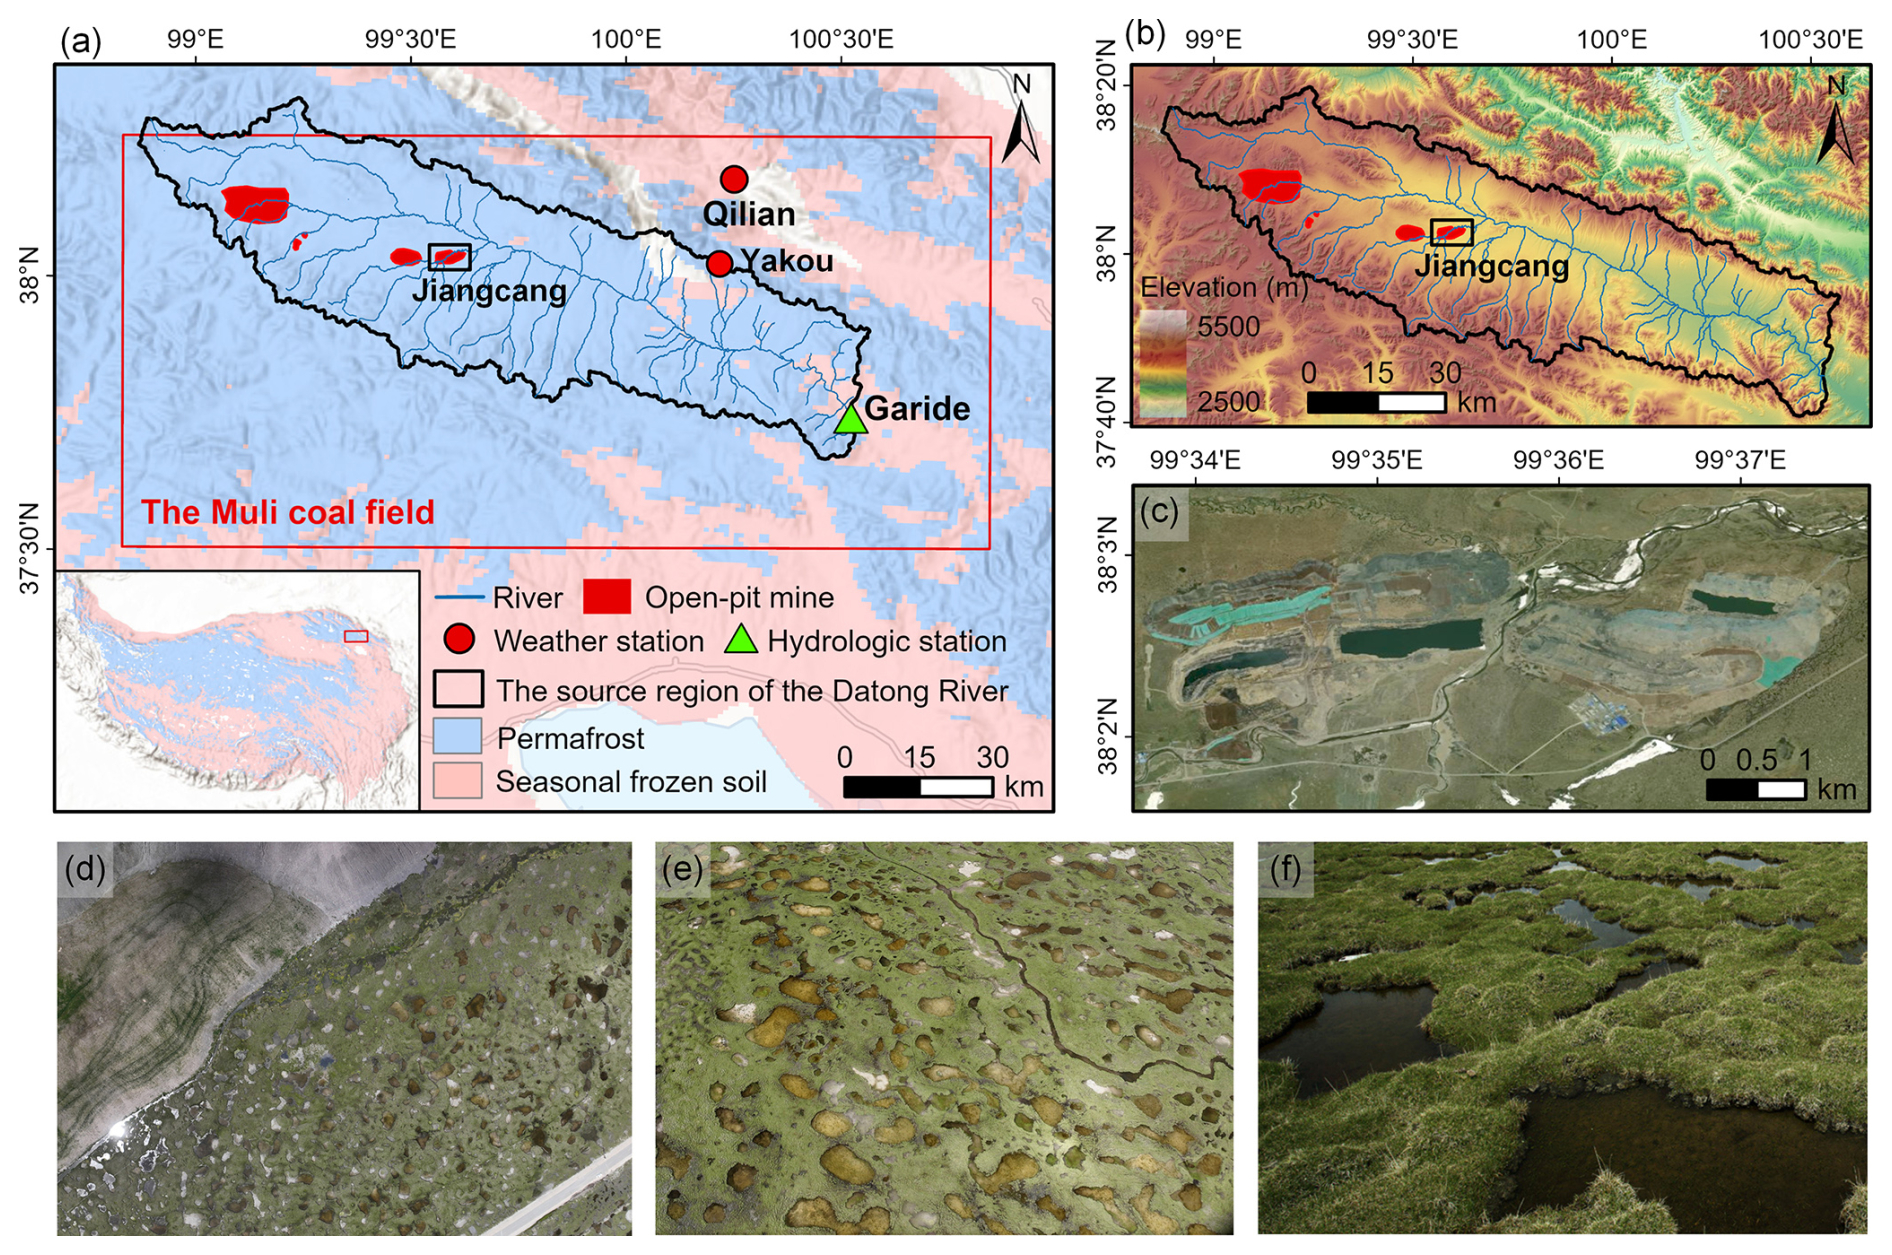
Figure 1Overview of the study area. (a) The location of the source region of the Datong River in the northeast Qinghai-Tibet Plateau (QTP) and the in-situ data distribution, overlain on the permafrost map from Zou et al. (2017). The red rectangle indicates the scope of the Muli mining, with the major open-pit mine sites shown as red polygons. The insert panel shows the location of the Datong River basin in the QTP. (b) Elevation map from Copernicus 30 m global Digital Elevation Model (GLO-30, © http://www.opentopography.org, last access: 10 July 2026). (c) Optical image of the Jiangcang open-pit coal mine from Esri | Powered by Esri, with the location indicated by the black rectangle in panel (a). (d–f) Small ponds with a few to ∼30 m in diameter were common in the eastern part of the Jiangcang open-pit mine, as indicated by the UAV images and field photo acquired in July 2025.
The study area is located in the source region of the Datong River, in the Qilian Mountains, the northeastern margin of the QTP. The Datong River flows through a broad, gently undulating valley extending from the northwest toward the southeast of the Qilian Mountains. The source region of the Datong River covers an area of ∼4576 km2, and is characterized by widespread (>90 %) permafrost (Fig. 1a). It belongs to the high-altitude permafrost zone of the Altun–Qilian Mountains system on the QTP. The ice-rich permafrost is mainly distributed across gentle slopes in front of mountain ranges (Wang et al., 2020). Permafrost thickness ranges from approximately 50–90 m (Cao et al., 2016), while the active layer thickness varies between 0.9 and 2.5 m (Wang et al., 2020). This area has a mean elevation of 3947±222 m (Fig. 1b) and experiences a continental alpine climate. The mean annual air temperature ranges from −5.25 to −2.19 °C, and annual mean precipitation ranges from 500–700 mm, based on the Third Pole meteorological forcing data (TPMFD, Yang, 2023). Vegetation is well developed, dominated by alpine meadow and alpine swamp meadow ecosystems (Li et al., 2011).
This area encompasses the resource-rich Muli coal field, as shown in Fig. 1a, with an estimated coal reserve of approximately 4.13 billion tons, being the largest coal deposit in Qinghai Province, China (Xiao et al., 2023). It hosts several open-pit coal mine sites (Fig. 1a and c), being the largest on the QTP. This area has undergone more than 10 years of excessive and illegal mining activities, starting around 2003. The completion and operation of the Haergai–Muli Railway in 2009 significantly enhanced coal transportation efficiency, which further accelerated the mining activities (Guo et al., 2023). In response to the severe environmental degradation, ecological restoration efforts were initiated in 2015 by the government. Afterwards, mining activities in the Muli area were gradually reduced and eventually ceased by ∼2020 (Wang et al., 2022).
The in-situ data used in this study include daily discharge and air temperature observations. Long-term daily discharge records covering the warm season (May–October) from 1973–2022 at the Garide hydrological station, the outlet of the Upper Datong River (Fig. 1a), were obtained from the Chinese Hydrological Yearbooks. These data were used to analyze long-term variations in streamflow recession. Without known dams or hydropower facilities in the upstream region, the discharge data at Garide station are minimally influenced by anthropogenic activities, making them a reliable proxy for climate variability and permafrost-related hydrological responses. Daily air temperature data were obtained from two sources: the Qilian County meteorological station (1973–2022), provided by the China Meteorological Administration (CMA), and the adjacent Yakou permafrost site (2016–2022), provided by the Heihe Integrated Observatory Network (Liu et al., 2018). These records were used to characterize the thermal conditions of the study area and to investigate their relationships with surface deformation and variations in the streamflow recession process.
A field survey was conducted in July 2025 to document surface features and changes in the study area using DJI Unmanned Aerial Vehicle (UAV) sensors and historical high-resolution images (Sect. 3.1.3). High-resolution (∼5 cm) multispectral imageries at the Green, Red, Red-Edge and Near-Infrared wavelengths were obtained using the DJI M3M sensor. The UAV images revealed a dense distribution of small ponds with low normalized difference vegetation index (NDVI) and high normalized difference water index (NDWI) values across the flat eastern area of the Jiangcang open-pit coal mine (Figs. 1d–f and S1 in the Supplement) and were used for comparison with the historical optical imagery to identify landform changes. In addition, GNSS interferometric reflectometry (GNSS-IR) data at the Yakou station from Zhang et al. (2021) were used to validate the InSAR-derived deformation time series.
This study leverages multi-frequency InSAR data and long-term stream discharge data to assess the severity and evolution of permafrost degradation in the Datong River source region. Multi-source SAR datasets were first processed to generate differential interferograms. For the Sentinel-1 C-band data, we derived deformation time series using the New Small Baseline Subset (NSBAS) InSAR framework (Doin et al., 2012) with a linear–periodic temporal constraint and an ALOS-2 L-band deformation rate reference to improve the stability of Sentinel-1 C-band inversion. We then generated a long-term InSAR deformation dataset through combining the multi-sensor C- and L-band retrievals to quantify the trends of both interannual deformation rates and thaw-season deformation. Furthermore, we conducted streamflow recession analysis using long-term daily discharge data to characterize variations in the recession time constant, an indicator of thaw-induced subsurface hydrological shift with permafrost degradation. To separate the influence of climate change from mining activities, a multiple linear regression model was developed to predict the climate-driven changes in the recession time constant. The integration of surface deformation retrievals and subsurface hydrological analyses provides an independent, multi-faceted assessment of permafrost degradation.
3.1 InSAR data processing and analysis
3.1.1 Multi-source InSAR data processing
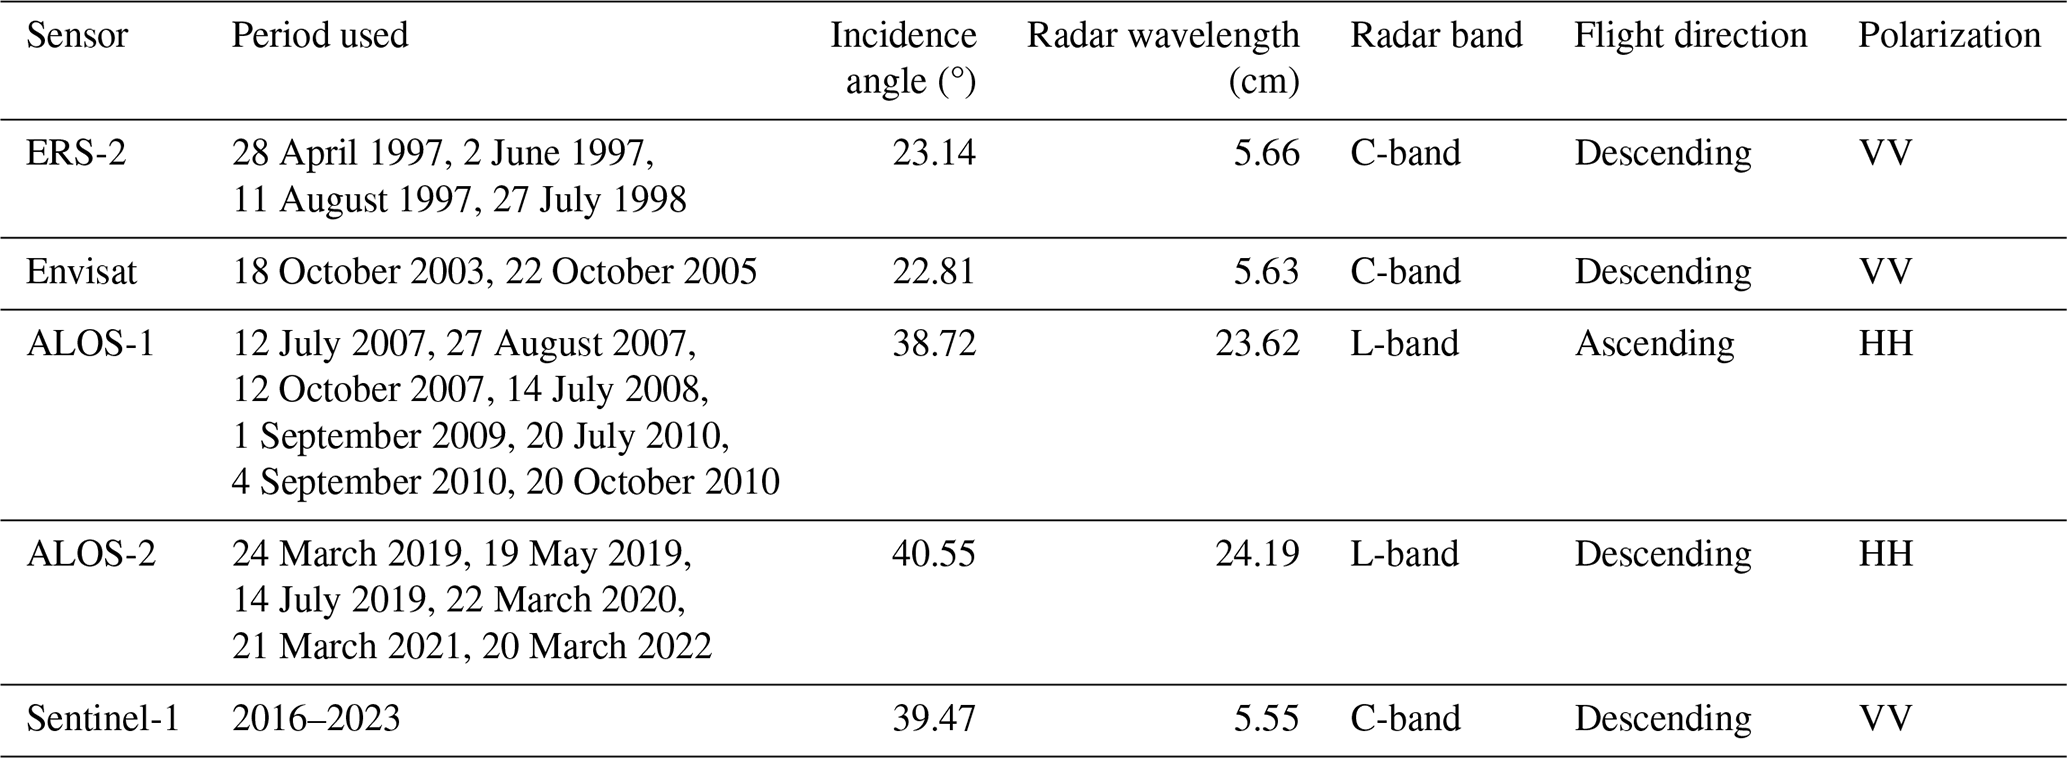
We used multi-source SAR data to derive decades-long (>20 years) surface deformation throughout different mining activity stages (Fig. 2). European Remote Sensing Satellite-2 (ERS-2) C-band SAR data from 1997–1998 captured the pre-mining phase, while C-band Envisat Advanced Synthetic Aperture Radar (ASAR) from 2003–2005 represented the early stage of mining. The intensified mining period was characterized using Advanced Land Observing Satellite (ALOS-1) Phased Array L-band Synthetic Aperture Radar (PALSAR) data from 2007–2010. Subsequent ecological restoration and late post-mining stages were tracked using Sentinel-1 data from 2016–2023 and ALOS-2 PALSAR-2 data from 2019–2022. The characteristics and temporal coverage of the SAR datasets used are presented in Table 1 and Fig. 2, respectively. Due to data availability for the early SAR data and ALOS-2 data in the study area, we prioritized selecting SAR images acquired during the thawing season and SAR images from different years with close acquisition dates to capture the seasonal and inter-annual changes in the surface deformation. For the later period, Sentinel-1 provides dense observations suitable for deformation time series inversion. Although both ascending and descending tracks are available over the study area, the descending track has more frequent acquisitions and shows better temporal continuity, whereas the ascending observations contain several extended temporal gaps (Fig. S2), which would reduce the stability of the time series inversion (Li et al., 2022a). The descending track was therefore selected to ensure better interferogram network connectivity.
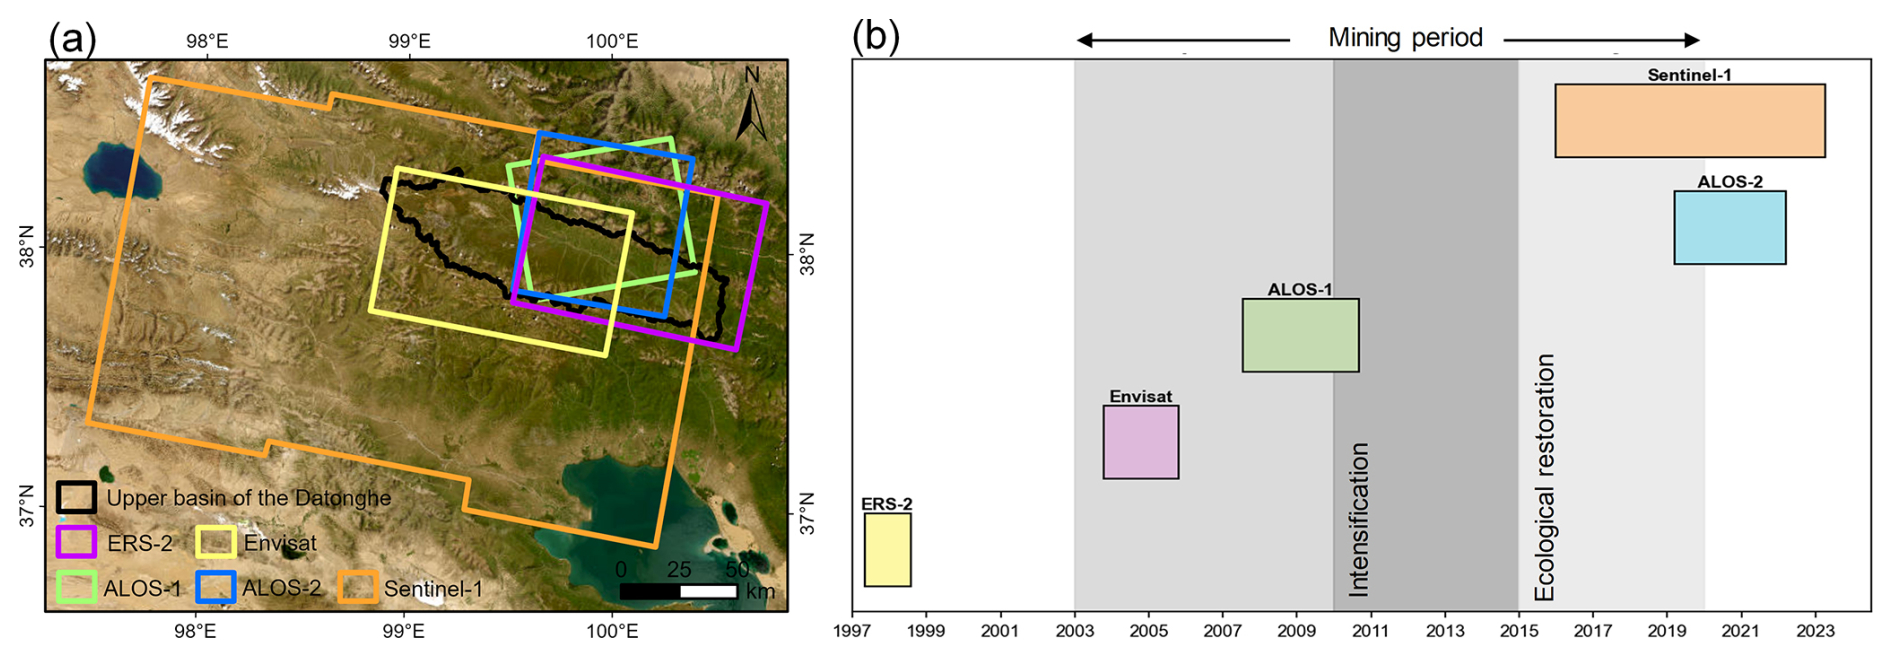
Figure 2SAR data (a) coverage and (b) time span. The optical basemap in panel (a) is from Esri | Powered by Esri.
Table 1Characteristics of the multi-source SAR data used in this study.
Differential interferograms were generated using the InSAR processing software GAMMA (Werner et al., 2020). The main procedures are shown in Fig. 3. Single Look Complex (SLC) images were co-registered to ensure sub-pixel alignment. All SLC images from different sensors were multilooked to a ground resolution of ∼30 m, consistent with the resolution of the Copernicus 30 m global Digital Elevation Model (GLO-30 DEM, European Space Agency, 2021), which was then used to estimate and remove the topographic phase component. Adaptive filtering was applied to interferograms to reduce phase noise (Goldstein and Werner, 1998). Coherence maps were then computed to assess the quality of each interferogram, and a threshold of 0.3 was applied to mask decorrelated, low-quality areas. Phase unwrapping was performed using the Minimum Cost Flow (MCF) algorithm (Costantini, 1998). Long-wavelength trends, typically arising from orbital ramps and atmospheric contamination, were removed by fitting a low-order polynomial (Yanagiya and Furuya, 2020). The Generic Atmospheric Correction Online Service for InSAR (GACOS) was employed to further mitigate tropospheric delays (Yu et al., 2018). All interferograms were manually checked to ensure high coherence and minimal unwrapping errors over the target area.
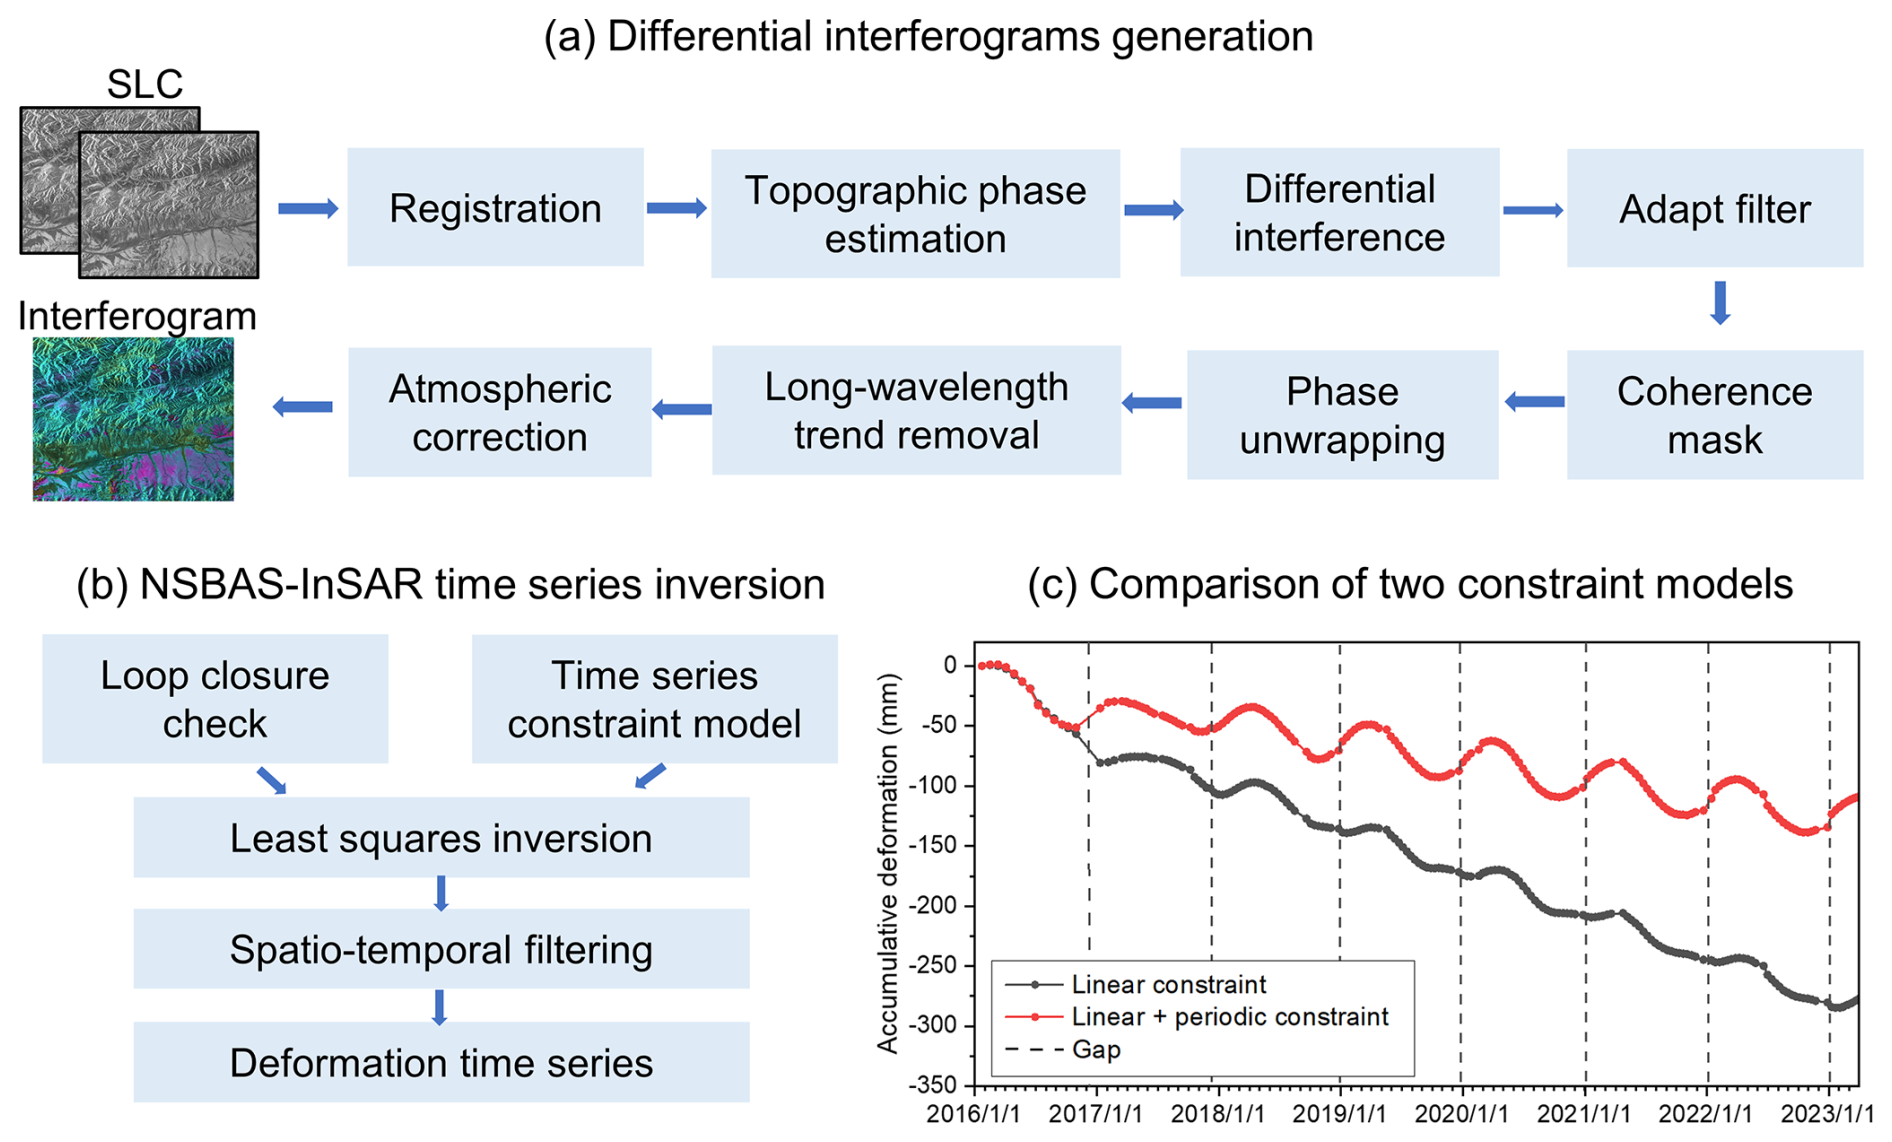
Figure 3Workflow for (a) differential interferogram generation and (b) deformation time series inversion based on the NSBAS-InSAR approach. (c) A comparison of the two data constraint models for the NSBAS framework to mitigate the influence of disconnected Sentinel-1 interferograms during the winter due to snow cover for a selected site (38.0363° N, 99.6344° E).
Different methods were used to retrieve surface deformation time series for different sensors. For SAR datasets with sparse temporal coverage over the study area, including ERS-2, Envisat, and ALOS-1/2, the unwrapped differential interferometric phase was directly converted to line-of-sight (LOS) surface deformation. Details of the used interferograms are provided in Table S1 in the Supplement. For the Sentinel-1 data with much higher temporal resolution, deformation time series were obtained using the NSBAS-InSAR based on the LiCSBAS package (Morishita et al., 2020). LiCSBAS conducts a loop closure check by calculating phase triplets to identify and remove bad interferograms with unwrapping errors (Biggs et al., 2007). A root mean square (RMS) threshold of 1.5 radians was used to reject unreliable interferometric links. After excluding low-quality interferograms, a refined InSAR network (Fig. S3a) with a high regional mean coherence (>0.8, Fig. S3b) was used to derive LOS deformation time series through least-squares inversion. A common reference point (38.0895° N, 99.7243° E) was used for all InSAR datasets to ensure the comparability of deformation estimates derived from different SAR sensors. The reference point was identified from Google Earth imagery as an exposed-bedrock surface outside the main deformation areas and exhibited high coherence (>0.95) and low temporal phase variability across the observation periods.
However, likely due to severe decorrelation caused by wet snow, the Sentinel-1 C-band interferogram network becomes disconnected each winter (Fig. S3a), causing a rank-deficiency problem in the inversion. The NSBAS approach solves this problem by imposing a temporal constraint on the SBAS inversion (Fan et al., 2025b; Morishita et al., 2020). While LiCSBAS defaults to a linear constraint, this is inadequate for permafrost regions dominated by periodic seasonal subsidence and uplift due to seasonal freeze–thaw cycles. We therefore tested two constraint models: a purely linear model Eq. (1) and a combined linear-periodic model Eq. (2) as shown below,
where u(t) is the deformation time series, c is a constant offset, v is the linear deformation rate, T is the deformation cycle, generally one year, A1 and A2 are the sine and cosine coefficients. The linear-periodic model was ultimately selected as it effectively recovers winter uplift signals within the seasonal data gaps, as shown in Fig. 3c. In contrast, the linear-only constraint misrepresents these gaps as continuous subsidence, introducing significant bias into the estimated deformation rates.
Nevertheless, substantial temporal gaps in the interferometric network during the Sentinel-1 period can still lead to uncertainties in derived deformation rates. To further stabilize the inversion, we developed a data-constrained NSBAS method that incorporates long-term deformation rate from ALOS-2. Because the L-band ALOS-2 data maintain high coherence over long temporal baselines, are less prone to unwrapping errors (Fan et al., 2025a), and provide reliable estimates of long-term deformation rates, the annual deformation rates derived from ALOS-2 were used as a reference for the Sentinel-1 inversion. As the spatial coverage of ALOS-2 is smaller than that of Sentinel-1, we first derived an initial Sentinel-1 deformation rate without applying any velocity reference. A cumulative distribution function (CDF) matching (Fig. S4) was then performed to match the Sentinel-1 rates with those from ALOS-2 over their overlapping areas. The derived correction was extended to the full Sentinel-1 coverage, producing a spatially consistent deformation-rate field that served as a velocity reference in the constrained inversion to obtain the Sentinel-1 deformation time series. The inversion is expressed as:
where is a stack of M unwrapped interferograms produced from N images acquired at time (), is the incremental displacement vector, G is an matrix of zeros and ones that links interferograms to incremental displacements, and Vref represents the reference deformation rate derived from the ALOS-2 data. γ is the regularization weight controlling the strength of the temporal constraint, which was set to 0.0001 in this study. With such a small value, solutions within the connected parts of the interferogram network are minimally affected by the temporal constraint, which primarily serves to stabilize connections across temporal gaps.
Finally, to reduce residual atmospheric and noise components in the deformation time series, we applied a high-pass temporal filter and a low-pass spatial filter using Gaussian kernels in the deformation time series, with widths of 3 times the average temporal interval and 100 m, respectively.
3.1.2 Developing a long-term surface deformation dataset
Based on the surface deformation time series generated using different SAR sensors, we developed a long-term surface deformation dataset, including the seasonal deformation and the interannual deformation rate. The separation of interannual trends and seasonal deformation was handled differently for different sensors. For Sentinel-1, the complete time series captures the full annual freeze–thaw cycle. Therefore, we derived the annual deformation rate by applying a linear regression to the cumulative deformation time series, while the thaw-season deformation was determined from the detrended deformation time series and calculated as the deformation changes between the onset of thawing (generally early May) and the end of the thawing season (early October).
For other SAR sensors, long-interval interferograms directly measure interannual deformation by comparing similar dates across different years. As the temporal coverage of each interferogram is not always identical, we normalized the deformation to an annual scale by dividing the deformation by the actual acquisition interval (in days) and scaling to one year. For interferograms spanning only a short period within the thawing season, the retrieved surface deformation may not fully represent the total thaw-season signal and thus needs to be scaled to the entire thawing period. However, the traditional scaling approach based on the thawing index (Chen et al., 2023) performs poorly in capturing the actual deformation pattern, as verified using Sentinel-1 data (Fig. S5). For example, scaling deformation from May–July 2019 to represent the whole thawing season significantly overestimated subsidence relative to the observed total subsidence. To obtain more reliable results, we developed a Sentinel-1-based temporal scaling method that directly relates partial-season deformation to the total thaw-season signal. The complete Sentinel-1 time series enables quantification of the proportion of deformation within different sub-periods relative to the total thaw-season deformation. Although the acquisition years differ between the Sentinel-1 and other SAR sensors, we assume the proportion of deformation within a given sub-period relative to the total thaw-season deformation remains stable. This scaling relationship is expressed as:
where Dscaled is the estimated full thaw-season deformation for the other sensor, is deformation measured by the other SAR sensor between t1 and t2, is the seasonal deformation from Sentinel-1, and is deformation from Sentinel-1 over the same period from t1 to t2.
3.1.3 Environmental drivers of surface deformation
To explore the environmental controls on the spatial variability of surface deformation, correlation analyses and Geodetector factor analysis (Wang et al., 2016) were performed between InSAR-derived mean seasonal deformation and selected environmental factors, including slope, ground ice content (Sheng, 2020), thawing index, growing-season average NDVI, and thawing season average shortwave infrared (SWIR) albedo. Geodetector is a spatially stratified heterogeneity analysis method to detect associations between a spatial response variable and potential driving factors, and the Geodetector statistic q was used to evaluate the explanatory power of each factor for the spatial heterogeneity of seasonal deformation. The q statistic ranges from 0 to 1, with higher values indicating stronger explanatory power, and is defined as (Wang et al., 2016):
where Y denotes the seasonal deformation, X represents an environmental factor and denotes the strata or classes of the variable Y or influencing factor X. Nh and are the number of spatial units and the variance of Y within stratum h, respectively, whereas N and σ2 are the total number of spatial units and the variance of Y over the entire study area.
The slope was derived from the GLO-30 DEM data. NDVI and SWIR albedo (band 7, 2105–2155 nm) were extracted from the MODIS daily Terra NDVI (derived from MOD09GA.006, Vermote and Wolfe, 2025) and MODIS daily albedo products (MCD43A3.061, Schaaf and Wang, 2025). The SWIR band is highly sensitive to surface water because liquid water strongly absorbs radiation in this wavelength range (Wang et al., 2008) and was therefore used as an indicator of surface moisture conditions. The thawing index, defined as the cumulative degree-days above 0 °C during the thawing season, was calculated using the MODIS daily land surface temperature (LST) dataset (MYD11A1.061, Wan et al., 2025) after temporal linear interpolation to fill missing LST data. While slope and ground ice content were treated as relatively static factors, NDVI, SWIR albedo, and the thawing index were derived as multi-year averages over 2016–2022, consistent with the temporal coverage of the Sentinel-1 derived seasonal deformation. All data, including the surface deformation, were aggregated to 1 km resolution before the analysis, and all statistical analyses were restricted to pixels within the study area boundary.
While correlation and Geodetector analyses quantify environmental controls, surface observations help identify localized geomorphic responses to permafrost thaw. Ice-rich permafrost thaw can induce rapid landform changes, often leading to the formation of thermokarst lakes and ponds in lowland areas (Jones et al., 2011; Nitzbon et al., 2020). Field observations in July 2025 revealed numerous small water bodies in the study area (Fig. 1d–f). To assess related surface changes, we analyzed historical and contemporary high-resolution optical imagery. Historical imagery was obtained from a declassified Hexagon Keyhole-9 scene acquired on 27 July 1984 (∼0.9 m resolution) from the United States Geological Survey (USGS) Earth Resources Observation and Science Center. The film data were geometrically registered, radiometrically normalized, mosaicked, and georeferenced using manually selected ground control points in ArcGIS Pro. Contemporary optical imagery was acquired using a DJI M3M sensor, which was orthorectified to produce a high-resolution (∼5 cm) orthoimage for comparison with the historical data.
3.2 Streamflow recession and hydrological analysis
The streamflow recession period, when the discharge declines without new water input, provides a valuable window to investigate potential subsurface hydrological changes induced by permafrost thaw (Cooper et al., 2023). As permafrost degrades, the thickened active layer and the thawing of permafrost enhance infiltration and hydraulic connectivity between supra- and sub-permafrost groundwater, leading to enhanced baseflow contributions to stream discharge (Walvoord and Kurylyk, 2016). Consequently, streamflow in degraded permafrost regions mostly exhibits slower recession rates, reflecting enhanced groundwater storage and prolonged subsurface drainage path compared with those in stable permafrost areas (Fig. 4a). To quantify potential subsurface changes in the study area, we analyzed the streamflow recession dynamics using the recession time constant (Ks), a parameter to describe the normalized streamflow recession rate (Gao et al., 2022). The Ks can be estimated from in-situ stream discharge time series by applying a power-law function that relates the change in discharge () to the mean stream discharge (Q) (Kirchner, 2009):
where a (units: d−1) is the recession rate coefficient associated with the streamflow recession time constant, for which we assume . b (dimensionless) is the recession shape index that reflects the shape and nonlinearity of the recession curve. Taking the natural logarithm of both sides linearizes this relationship as:
A linear regression can be performed on the log-transformed variables to obtain the intercept ln (a) and Ks, as illustrated in Fig. 4c.
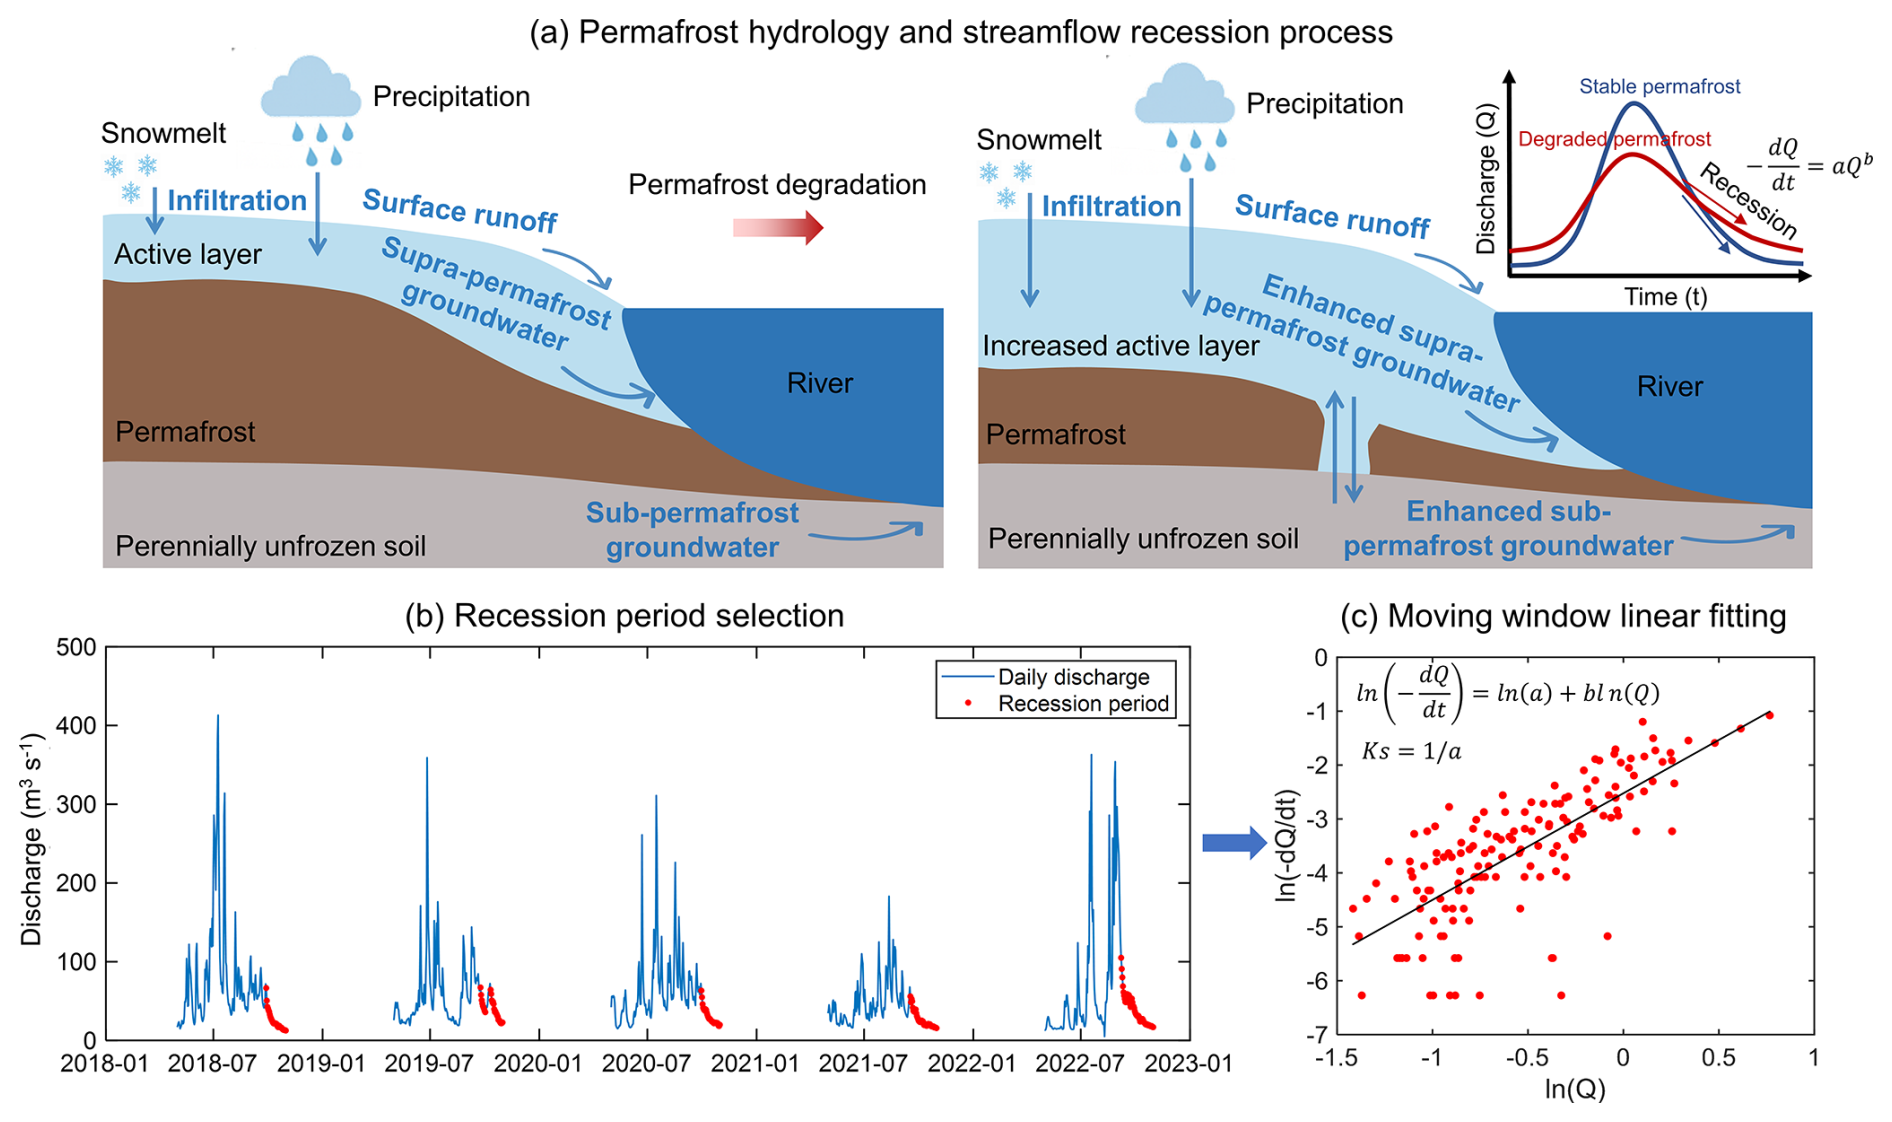
Figure 4Schematic illustration of the link between permafrost hydrology and streamflow recession analysis. (a) Conceptual model of permafrost hydrology and changes in the streamflow recession process with permafrost degradation. (b) Recession period selection based on the daily discharge time series. (c) Linear fitting used to derive the recession parameters.
Using the above methods, we generated a long-term (1973–2022) Ks dataset using the daily stream discharge data at the outlet station of the upper Datong River region (Garide in Fig. 1a). Recession periods were first identified from the daily discharge change series as intervals in which discharge declined continuously for at least seven consecutive days (). Due to a lack of discharge data during the winter months (November–April) in the upper Datong River basin (due to minimal flow), the analysis was restricted to the period between August and October. Since recession periods identified within a single year may be affected by limited data, hydrological anomalies, or an insufficient number of recession events, they may not reliably represent the streamflow recession behavior. A temporal window of multiple years was generally used for the data fitting. By comparing the Ks time series using 1-, 3-, and 5-year windows (Fig. S6), we adopted a five-year moving-window approach.
Figure 4b shows an example where the data points marked in red represent the selected recession period discharge values. All the discharge data during the recession period within the five-year sliding window are aggregated and used for the linear regression to estimate the mean Ks during this period (Fig. 4c). Since parameters a and b are jointly estimated in the power-law recession model in Eq. (7), a systematic shift in b can alter the magnitude of a and thus influence the interpretation of Ks as a recession timescale proxy. Therefore, the parameter b was also obtained from each regression window to examine its temporal variability and assess its potential impacts on Ks. We further performed a control analysis by refitting the recession model with b fixed at unity (b=1), corresponding to the linear reservoir assumption, to distinguish genuine changes in recession timescale from parameter-coupling effects.
To isolate the possible influence of mining activity from climate change on permafrost degradation, we established a multiple linear regression (MLR) model based on selected environmental variables to predict the streamflow recession time constant Ks under natural climate variation. The model was fitted exclusively using pre-mining data (1973–2002) to ensure that the derived relationships reflect natural climate-driven hydrological variability without anthropogenic influence. The fitted model was then applied to the post-mining period (2003–2022) to predict the Ks expected under climate influence alone. Comparison of these climate-based predictions with Ks values calculated from in-situ streamflow observations allowed us to assess whether the post-mining changes in recession dynamics could be fully explained by climate variability and to identify any remaining anomaly potentially associated with mining activity.
The Ks model predictors included air temperature, precipitation, evapotranspiration, surface net radiation, snow depth, and soil moisture. In situ daily air temperatures were used to calculate the annual mean temperature. The remaining variables were derived from the hourly ERA5-Land dataset (Muñoz-Sabater et al., 2021) and averaged over the study region. Specifically, precipitation and evapotranspiration were summed over the thawing season every year. Surface net radiation was calculated based on incoming solar and outgoing longwave radiation and averaged over the thawing season. Snow depth was averaged over the cold season (November to April). Soil moisture was represented as the thawing-season-average volumetric water content in the 0–7 cm soil layer. All climatic variables were smoothed using a five-year moving average, consistent with the Ks time series.
4.1 Spatial variability and long-term trends of surface deformation
4.1.1 Surface deformation retrievals from multi-source SAR data
No persistent or significant deformation within the study area during the early period (1997–2002) before the mining was identified from the deformation maps using ERS-2 and Envisat data (Fig. 5). The ERS-2 data captured ground deformation over two intervals: a short thaw-season period from 28 April–2 June 1997, and a longer one-year interval from 11 August 1997–27 July 1998 (Fig. 5a and c). The Envisat data reveal deformation over a two-year interval, from 18 October 2003–22 October 2005 (Fig. 5e). Although the early C-band SAR data are relatively sparse, favorable coherence was achieved in the flat areas, even with long temporal baselines. However, coherence was poor in mountainous regions and areas with steep terrain (Fig. 5b, d and f). The ability of the C-band data to maintain good coherence over extended periods – up to one to two years – further indicates that surface deformation during this period was relatively minor and stable.
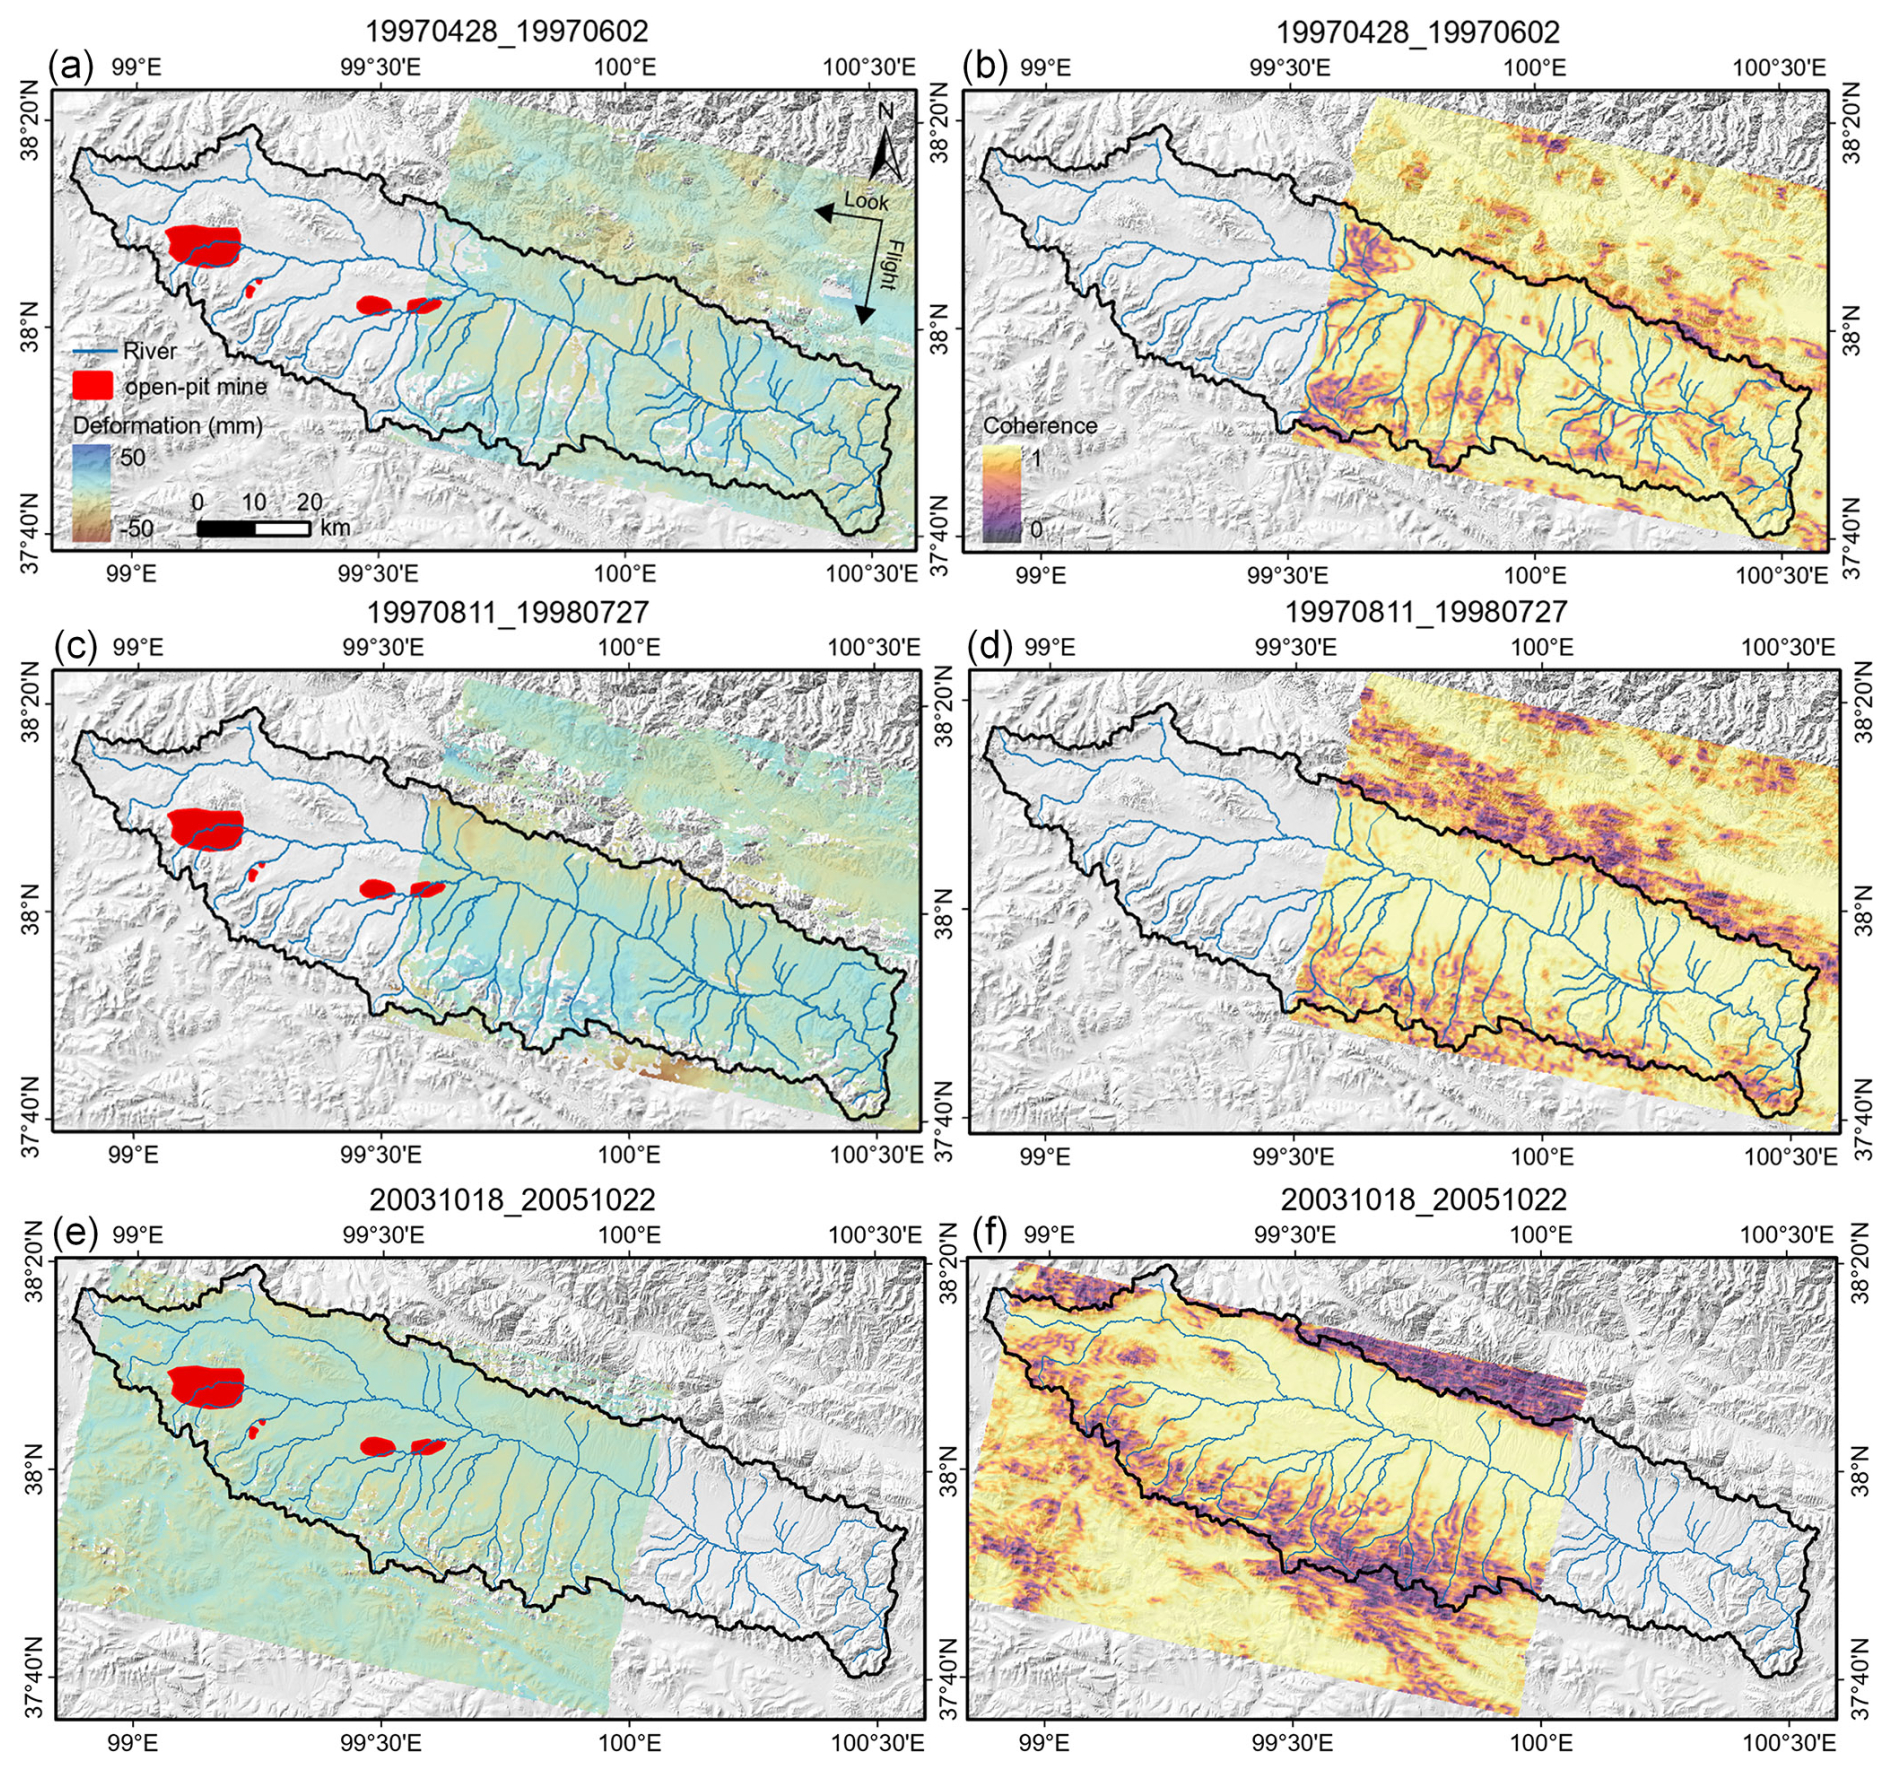
Figure 5Surface deformation and coherence maps from early-stage C-band SAR acquisitions: ERS-2 (a–d) and Envisat (e–f). Positive deformation represents uplift, and negative deformation represents subsidence.
ALOS-1 L-band SAR retrievals reveal consistent increases in both the seasonal and interannual changes in the surface deformation during the early and peak mining period from 2007–2010 (Fig. 6). ALOS-1 data captured surface deformation during the thawing seasons (July–October) in both 2007 and 2010, as well as cumulative long-term deformation spanning from 2007–2010. The derived interferograms exhibit high coherence across the study area (Fig. S7). The results reveal extensive surface subsidence occurring during both the thawing season and the multi-year period, predominantly concentrated around the open-pit mine and the relatively flat southern part of the basin, indicating permafrost instability likely exacerbated by mining activities. Notably, the thaw-season subsidence observed in 2010 was greater than that in 2007 (Fig. 6a and b), and a cumulative trend of subsidence becomes evident over the study period (Fig. 6c–e). These findings indicate intensified permafrost thaw and active layer deepening.
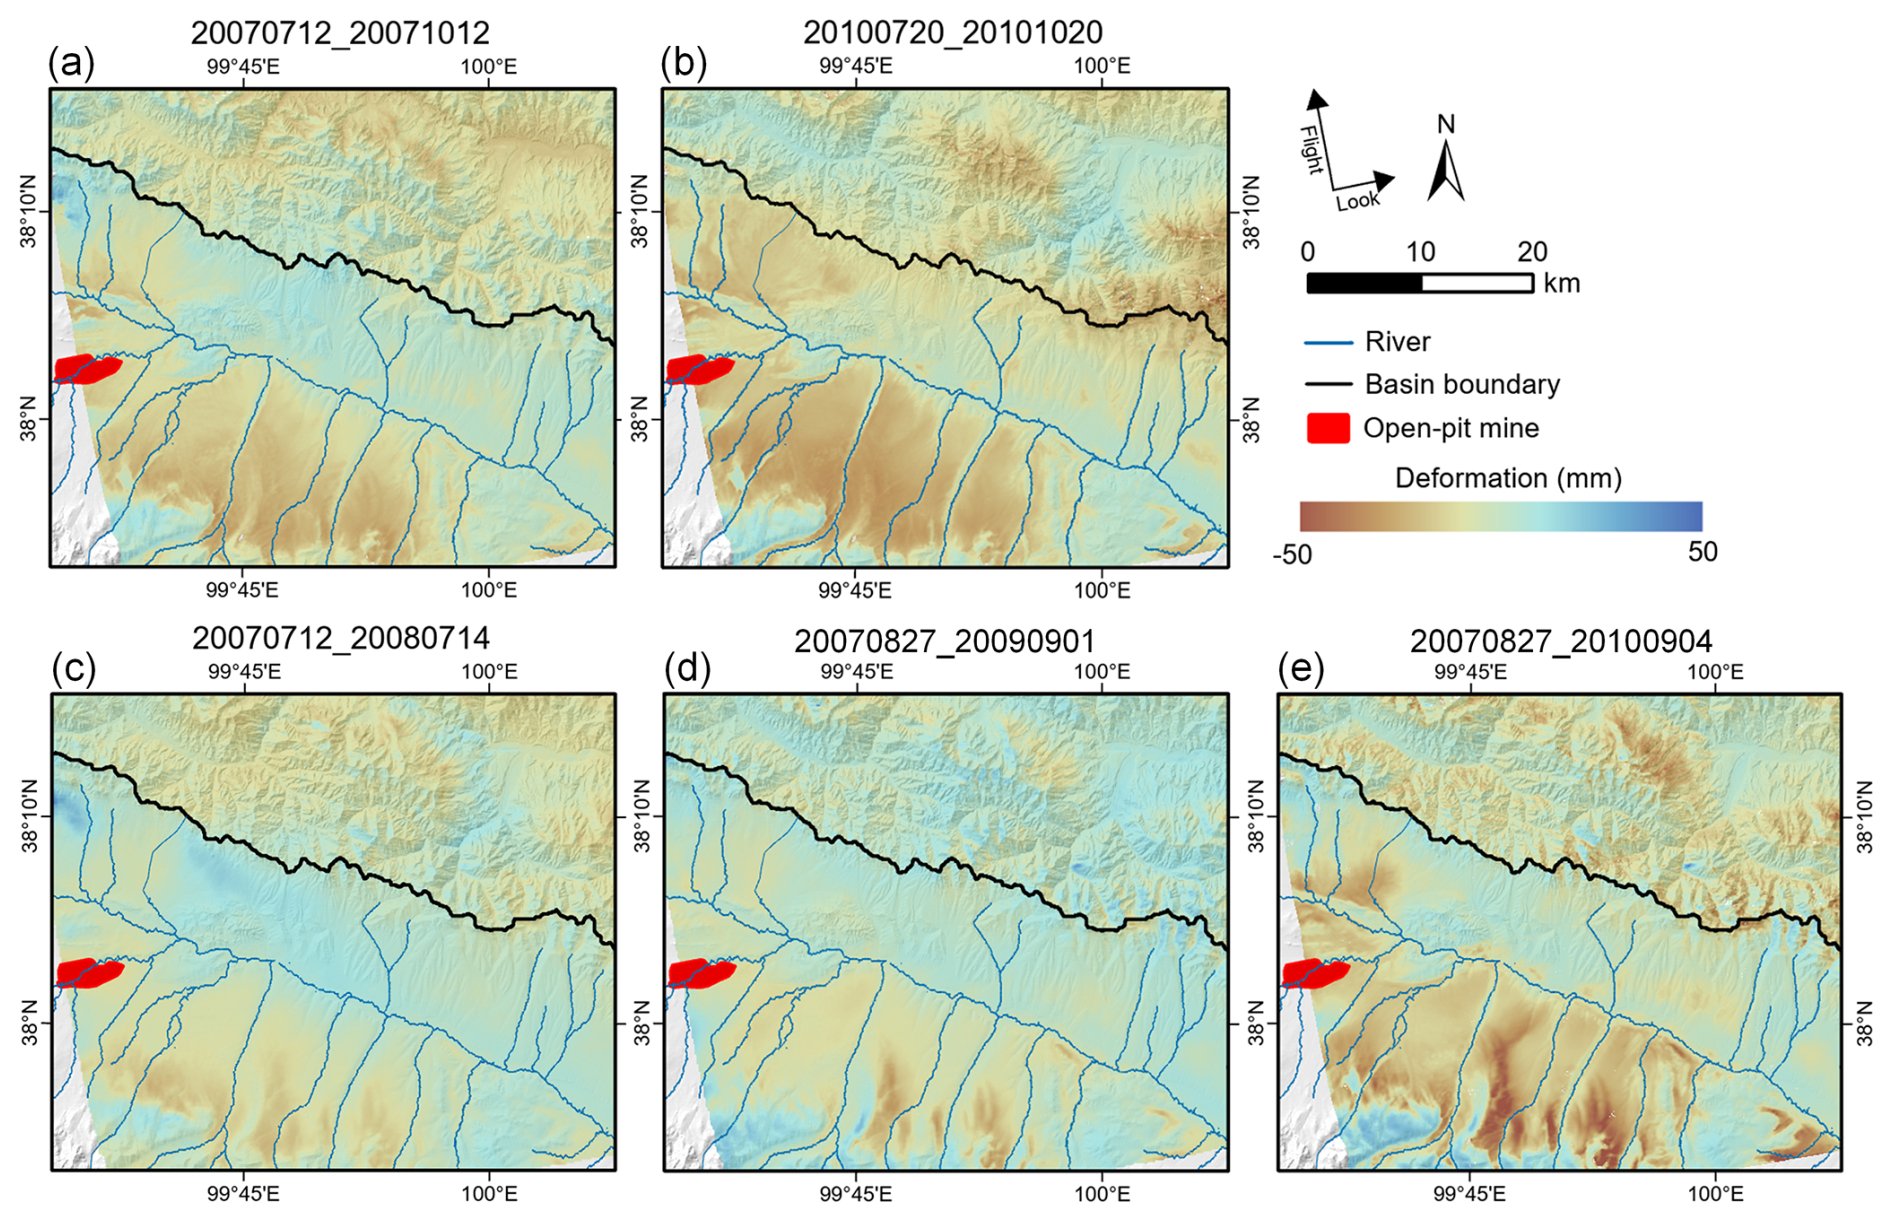
Figure 6Deformation maps derived from ALOS-1 L-band SAR data: thaw-season deformation from July–October in 2007 (a) and 2010 (b), respectively; interannual cumulative deformation over 1 to 3 years from 2007–2010 (c–e).
The deformation maps based on the ALOS-2 data indicate an even larger subsidence trend (Fig. 7). In addition to capturing thaw-season and interannual changes of surface deformation, ALOS-2 data also cover the freezing period, specifically from 14 July 2019–22 March 2020 (Fig. 7b). The ALOS-2 derived interferograms also exhibit high coherence (Fig. S8), demonstrating good performance. Consistent with the spatial patterns observed in the ALOS-1 retrievals, the southern part of the study area exhibits widespread and pronounced thaw-season subsidence (Fig. 7a), along with a persistent long-term subsidence trend (Fig. 7c–e), indicating ongoing permafrost degradation. Moreover, the deforming area shows a pronounced surface uplift during the winter season (Fig. 7b), which is consistent with ground heave caused by the refreezing of the active layer.
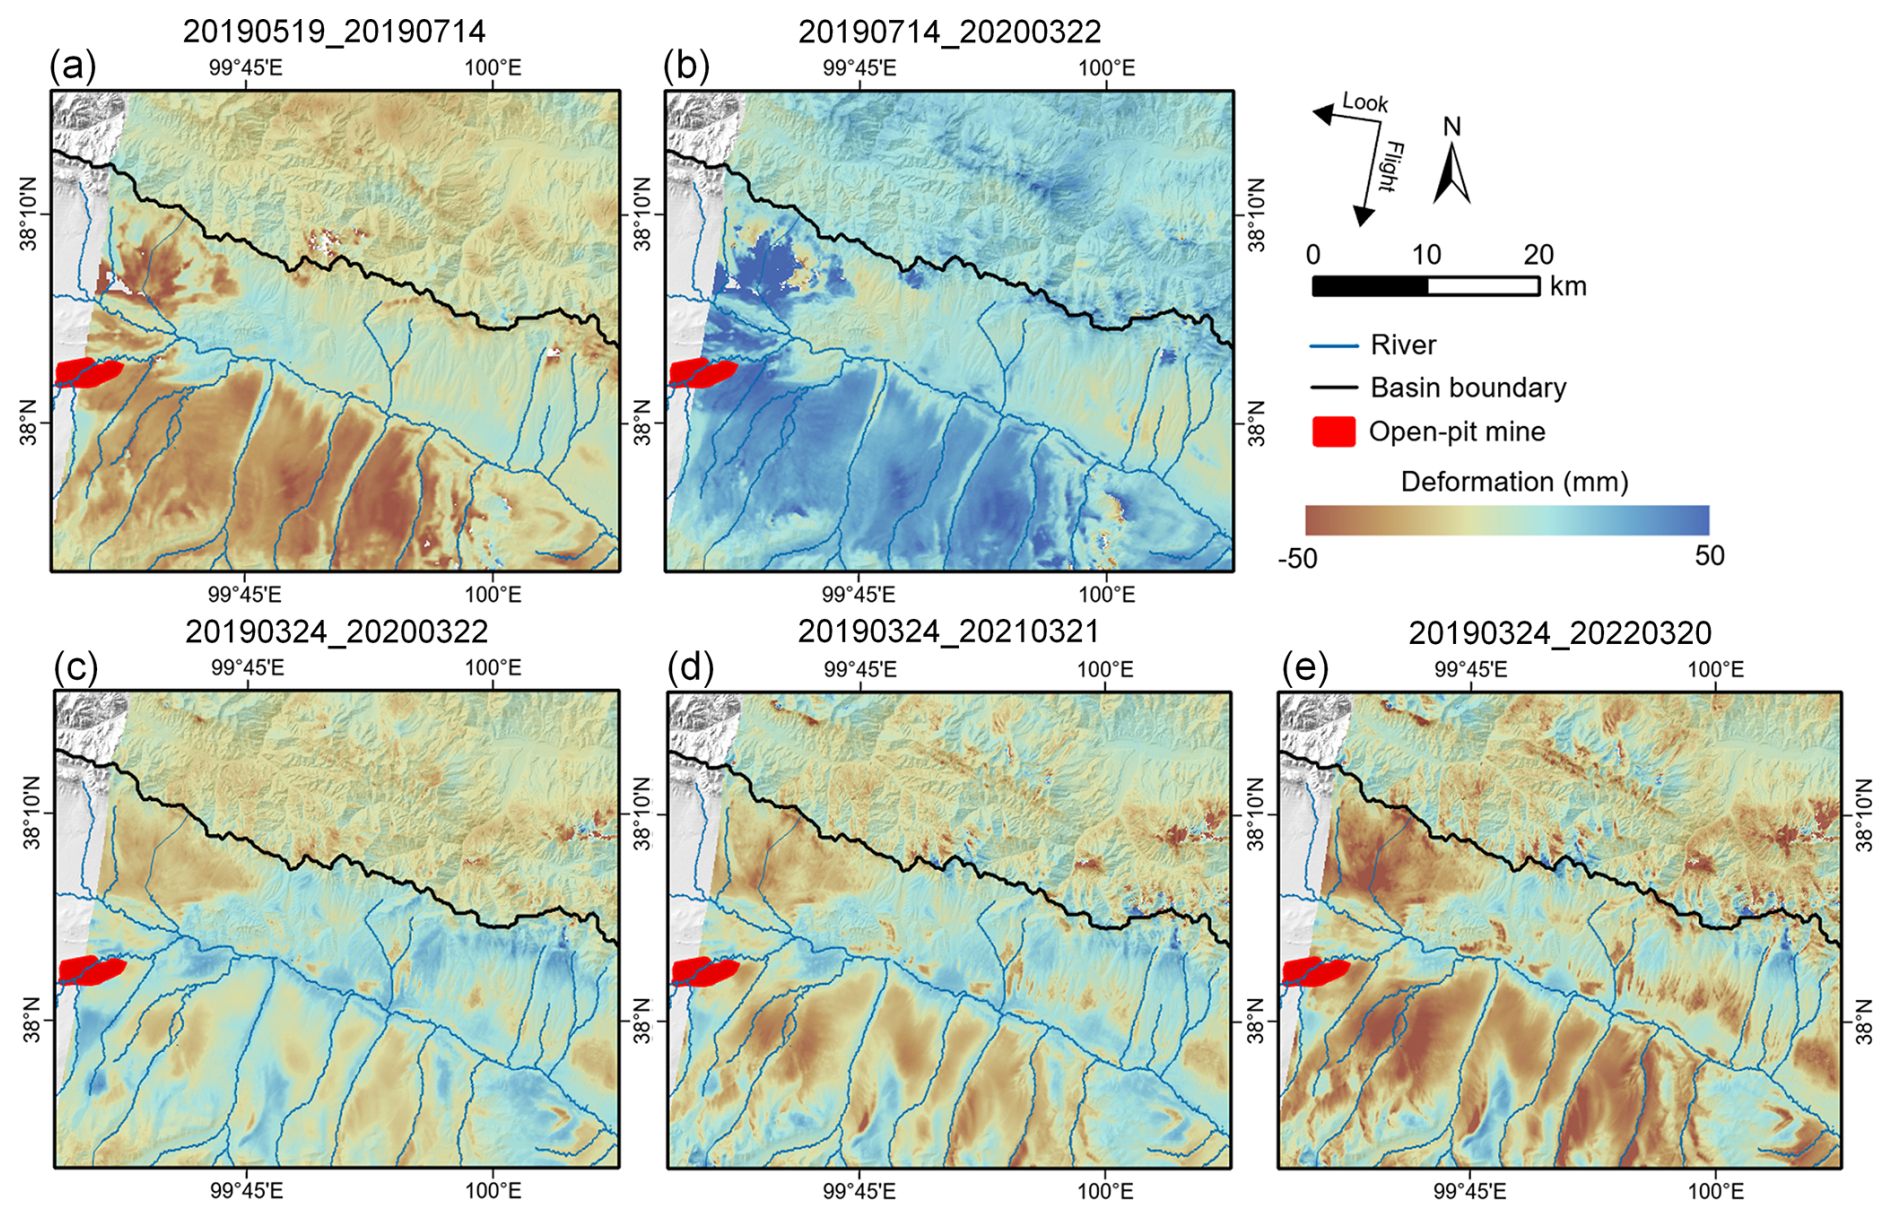
Figure 7Deformation maps derived from ALOS-2 L-band SAR data: seasonal deformation dynamics during the thawing and freezing periods (a, b) and interannual cumulative deformation over 1–3 years from 2019–2022 (c–e).
Using the proposed data-constrained NSBAS method, we generated Sentinel-1 deformation time series covering the period from January 2016 to April 2023 (Fig. S9). From these time series, we derived both the interannual deformation rates and the mean thaw-season deformation (Fig. 8a and b). Time-series deformation maps reveal a gradual increase in subsidence beginning in May and a subsequent uplift starting around October, corresponding to the progressive thawing and refreezing of the active layer (Fig. S9). At the two representative sites, P1, with ice-rich permafrost and widespread thermokarst ponds, shows higher subsidence and seasonal amplitude than the drier P2 site (Fig. 8c–e). The duration of subsidence and uplift at both sites follows air temperature changes, with P1 experiencing a longer thaw-season subsidence period (Fig. 8e). A comparison between Sentinel-1 derived deformation and GNSS-IR observations at Yakou station during the snow-free period of 2018 shows good agreement (Fig. S10), confirming the reliability of the Sentinel-1 time-series retrievals. The above results indicate that incorporating L-band ALOS-2 deformation rates as reference information in the inversion model ensured the temporal stability and consistency of the Sentinel-1 time series with ALOS-2 results.
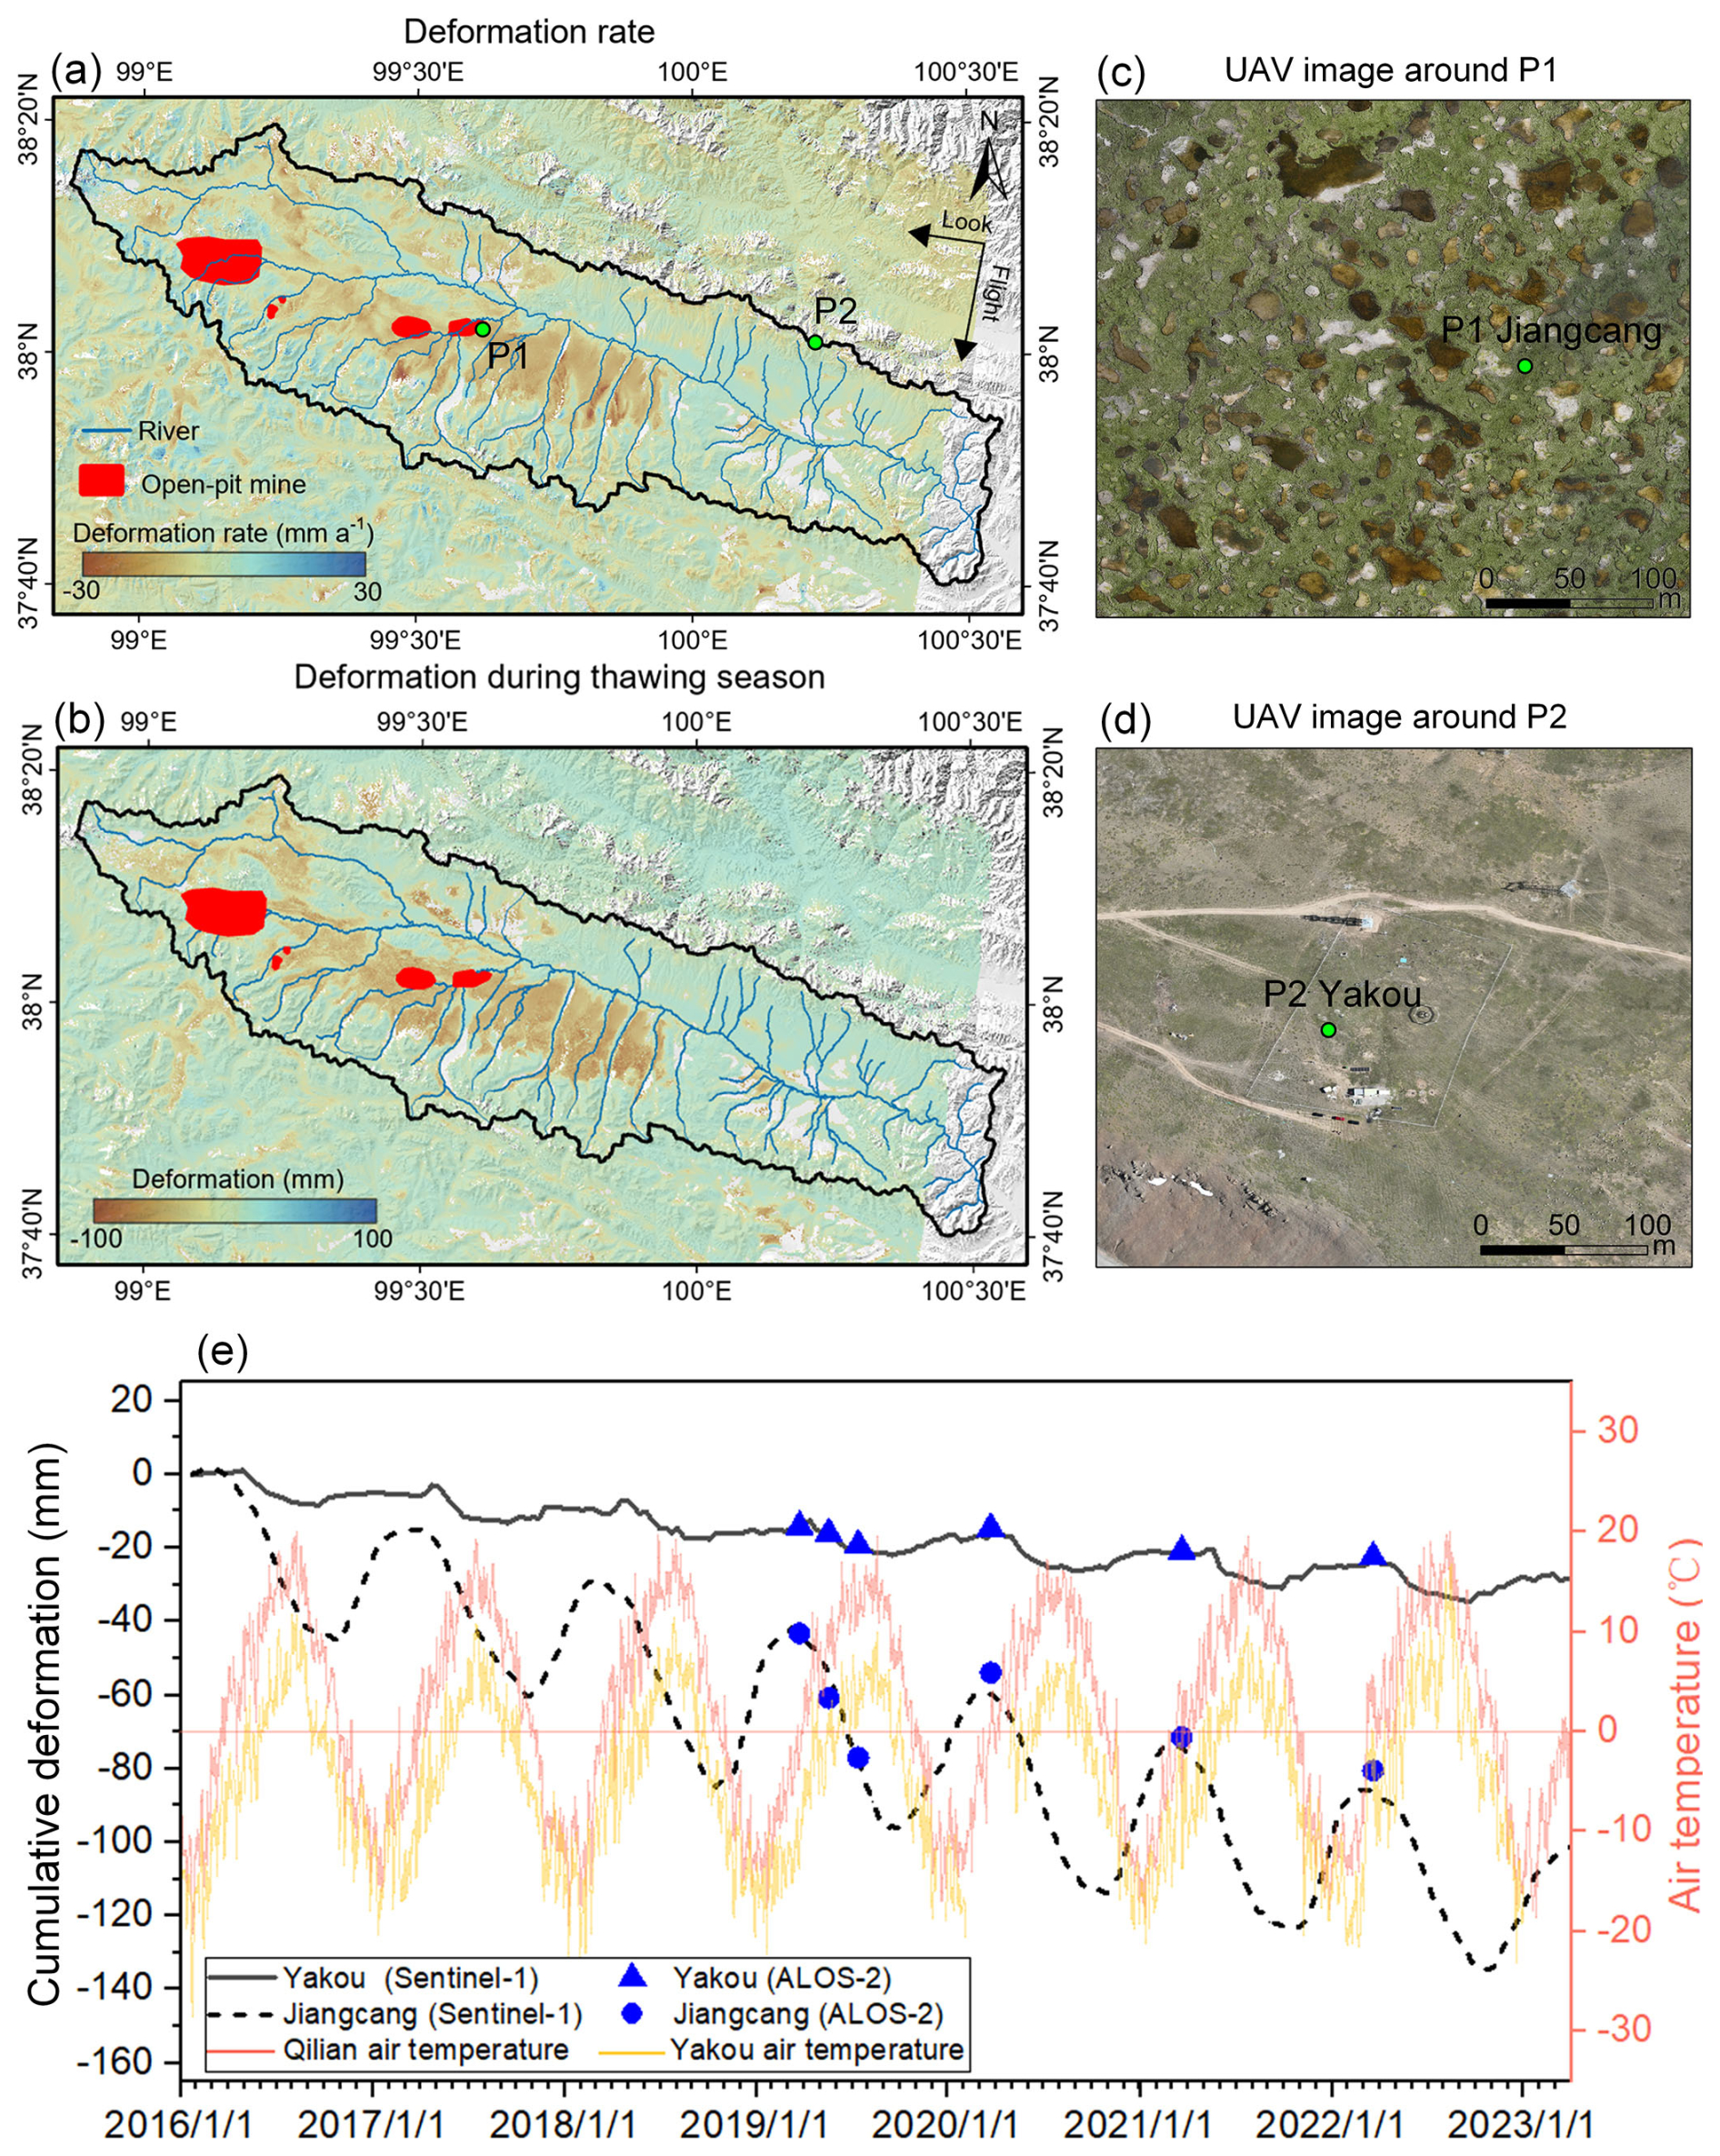
Figure 8Deformation derived from Sentinel-1 data: deformation rate from 2016–2022 (a); multi-year average deformation during the thawing season (May–October) from 2016–2022 (b); UAV images acquired by the authors in July of 2025 at selected sites: P1 near the Jiangcang open-pit mine with prominent thermokarst features (c) and P2 at the Yakou permafrost station with drier surface and sparse vegetation (d); and the derived cumulative deformation time series for the two sites from Sentinel-1 and ALOS-2 (e).
Spatially, the Sentinel-1 derived deformation rate (Fig. 8a) and the seasonal deformation (Fig. 8b) exhibit consistent patterns with those observed in the ALOS-1 and ALOS-2-based deformation maps. Significant subsidence occurs around the open-pit coal mine and in the adjacent low-lying terrain, where deformation rates range from −15 to . Thaw-season deformation generally ranges from 20–60 mm. Due to the large spatial extent of the map, detailed deformation features of the open-pit mine in the western part are not clearly visible; a zoomed-in view in Fig. S11 shows noticeable subsidence in the adjacent flat terrain. A direct comparison between the L-band ALOS-2 and C-band Sentinel-1 results over their same time period in 2019 further demonstrates strong spatial consistency (Fig. 9). Both maps capture similar spatial patterns of seasonal subsidence, while ALOS-2 shows slightly larger deformation magnitudes and greater spatial variability (Fig. 9a–c). The two maps correlate well (R=0.84; Fig. 9d), with a mean bias of −3.6 mm, a mean absolute difference of 6.5 mm, and a root mean square error (RMSE) of 9.3 mm. Given that the typical accuracy of InSAR-derived deformation is around 5 mm, the observed discrepancies between the two datasets are considered acceptable.
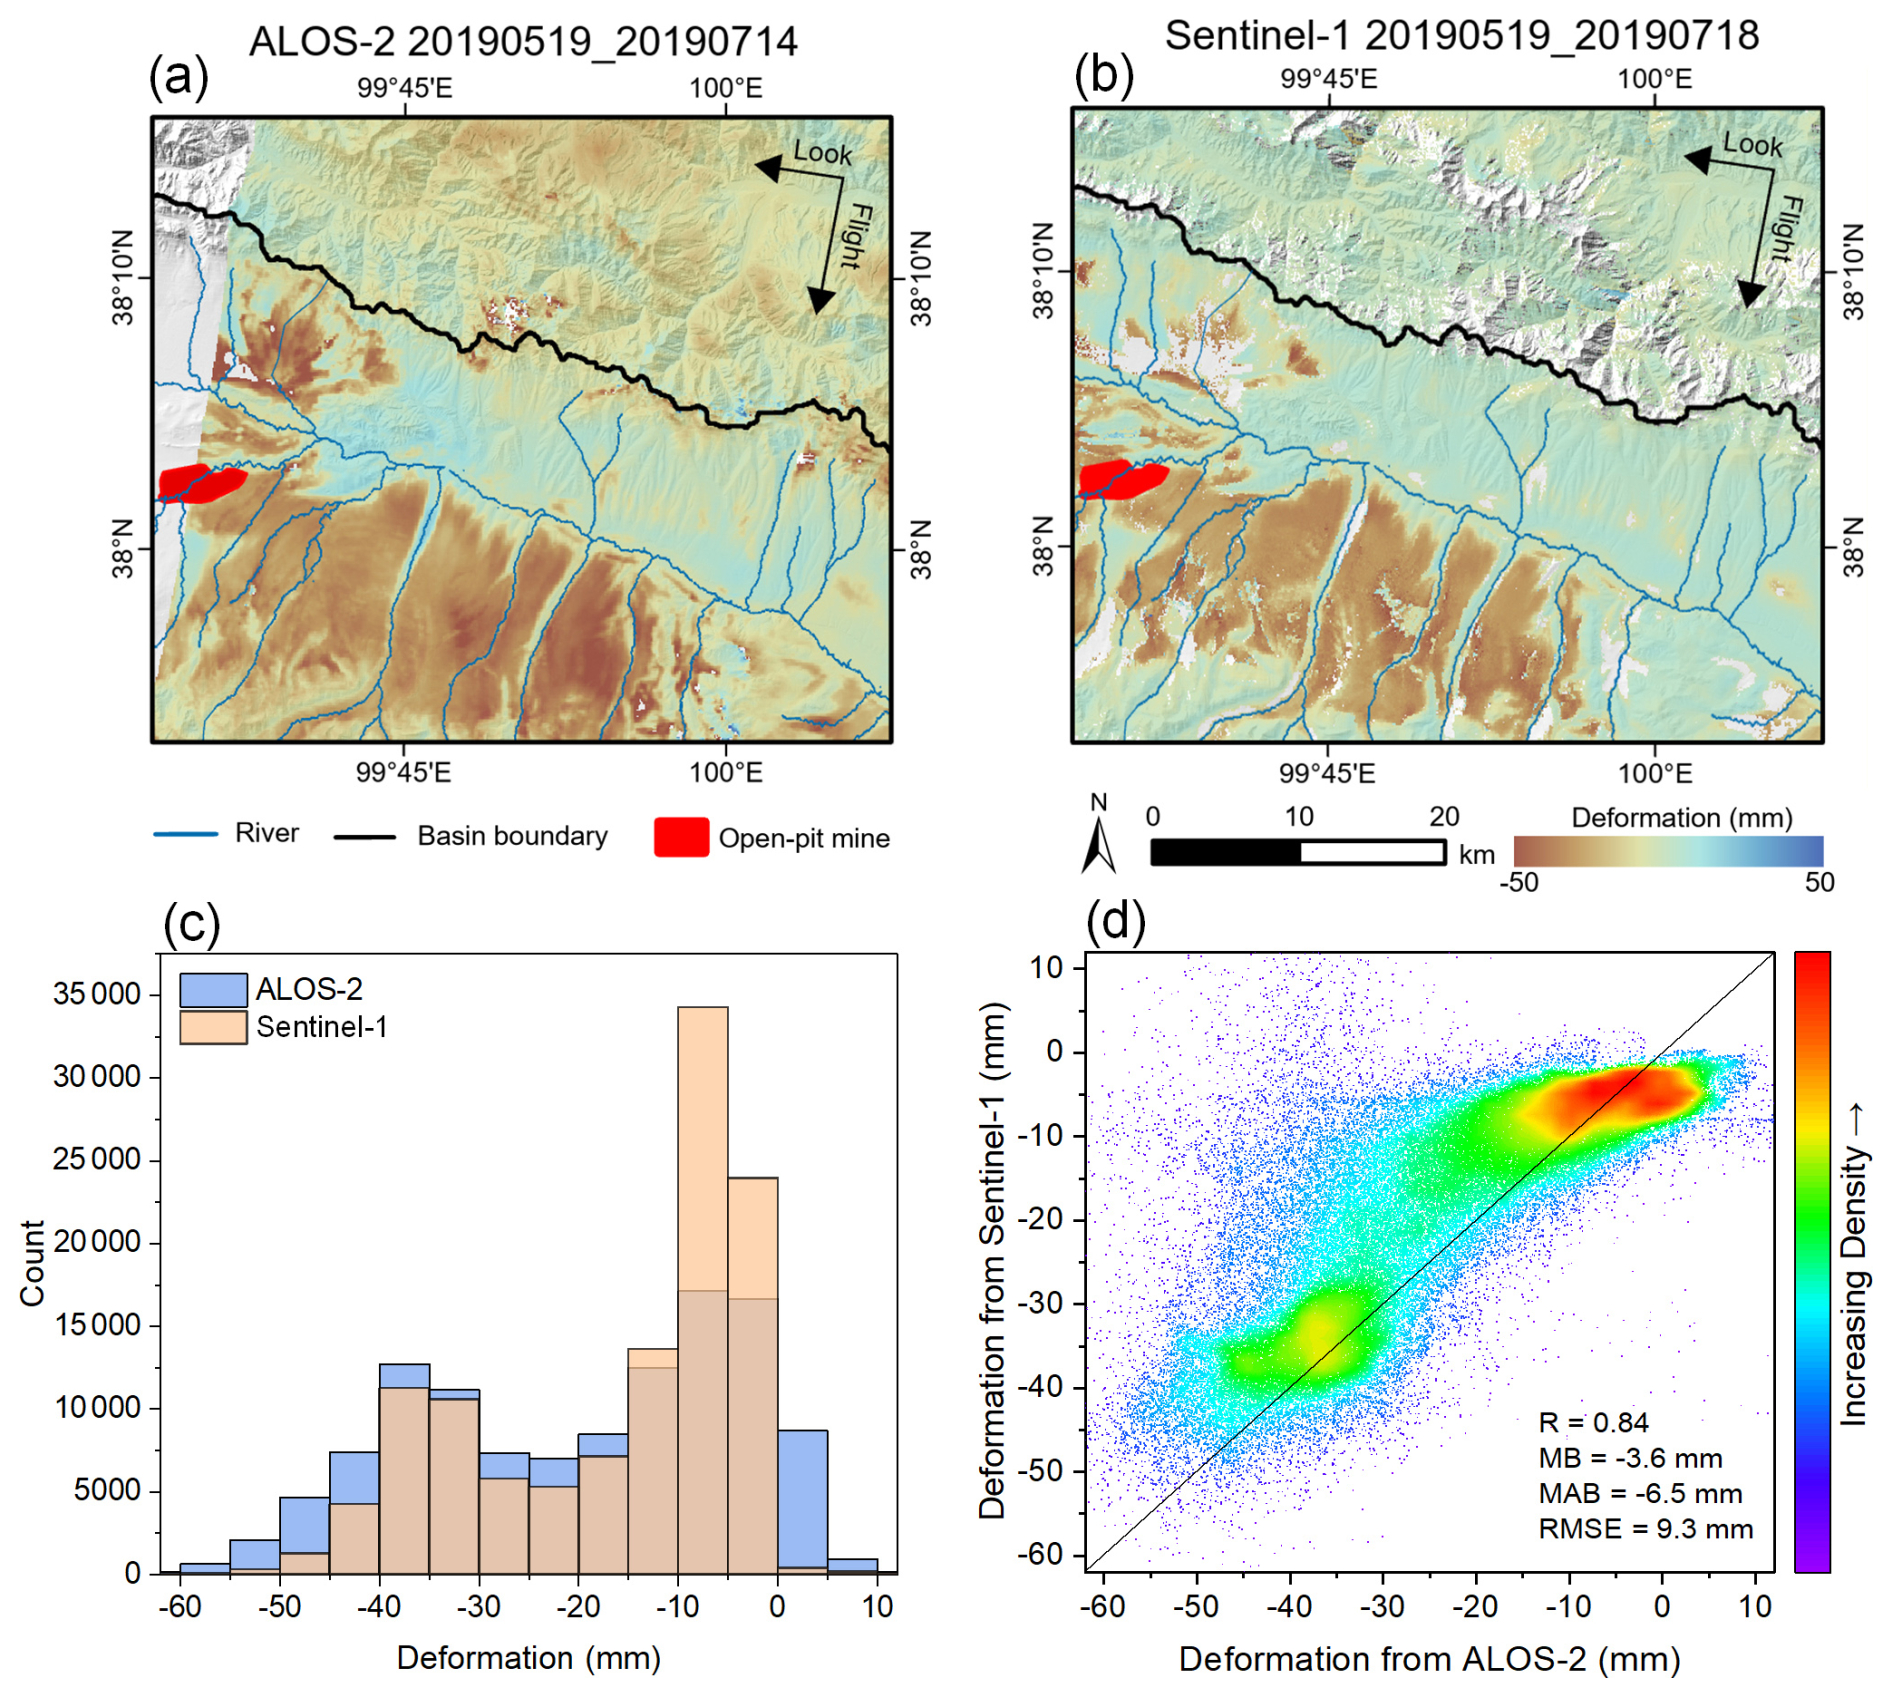
Figure 9Comparison of surface deformation derived from ALOS-2 L-band and Sentinel-1 C-band data during a similar period of the thawing season in 2019: (a) ALOS-2-derived deformation from 19 May–14 July 2019; (b) Sentinel-1-derived deformation from 19 May–18 July 2019; (c) histogram distributions of the two deformation maps; (d) density scatter plot of the two deformation maps with the correlation and difference statistics, including correlation coefficient (R), mean bias (MB), mean absolute bias (MAB), and RMSE.
4.1.2 Long-term deformation trends derived from multi-source SAR data
The deformation rate maps during different periods show no evident or widespread subsidence within the basin during 1997–1998 and 2003–2005 (Fig. 10a and b). A distinct subsidence trend ( to ) emerged in the flat area during 2007–2010 (Fig. 10c), marking the onset of notable ground subsidence. Subsidence intensified in subsequent years, ranging from −15 to during 2016–2023, as revealed by Sentinel-1 data (Fig. 10d). ALOS-2 results during 2019–2022 show a consistent pattern, further confirming the strong and spatially extensive subsidence during the recent period (Fig. 10e). Thaw-season deformation maps show that flat areas initially experienced relatively small seasonal subsidence ranging from about −20 to −10 mm (Fig. 11a), which intensified after 2007 ( to −20 mm; Fig. 11b) and further increased by 2010 ( to −40 mm; Fig. 11c). Subsequent thaw-season subsidence patterns derived from Sentinel-1 averaged from 2016–2022 (Fig. 11d) and ALOS-2 (2019; Fig. 11e) are broadly comparable to those observed in 2010, indicating the persistence of strong subsidence in the study area. These results suggest that significant permafrost degradation likely began between 2005 and 2007 and accelerated afterwards.
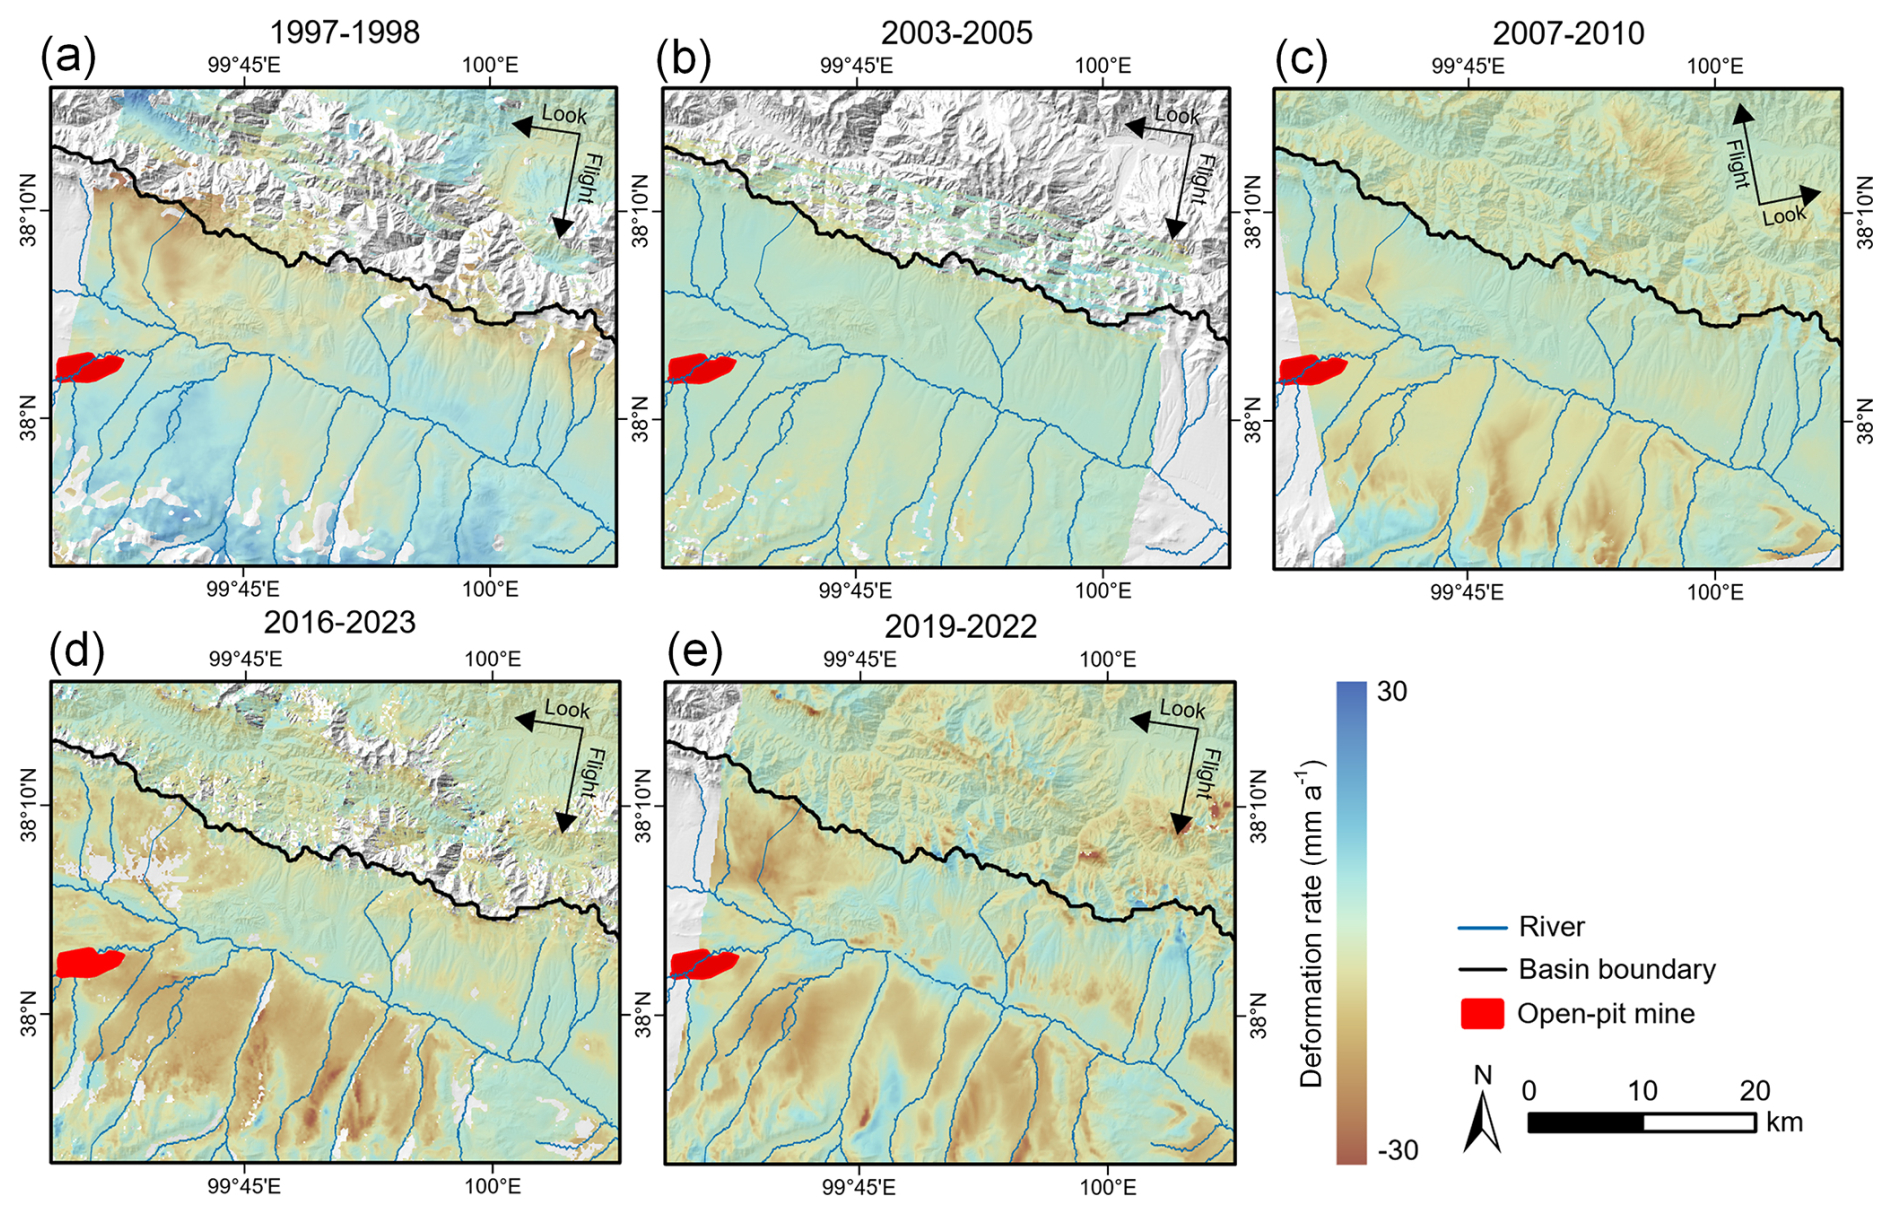
Figure 10Comparison of average deformation rates normalized to 1 year derived from multi-sensor SAR data across different periods.
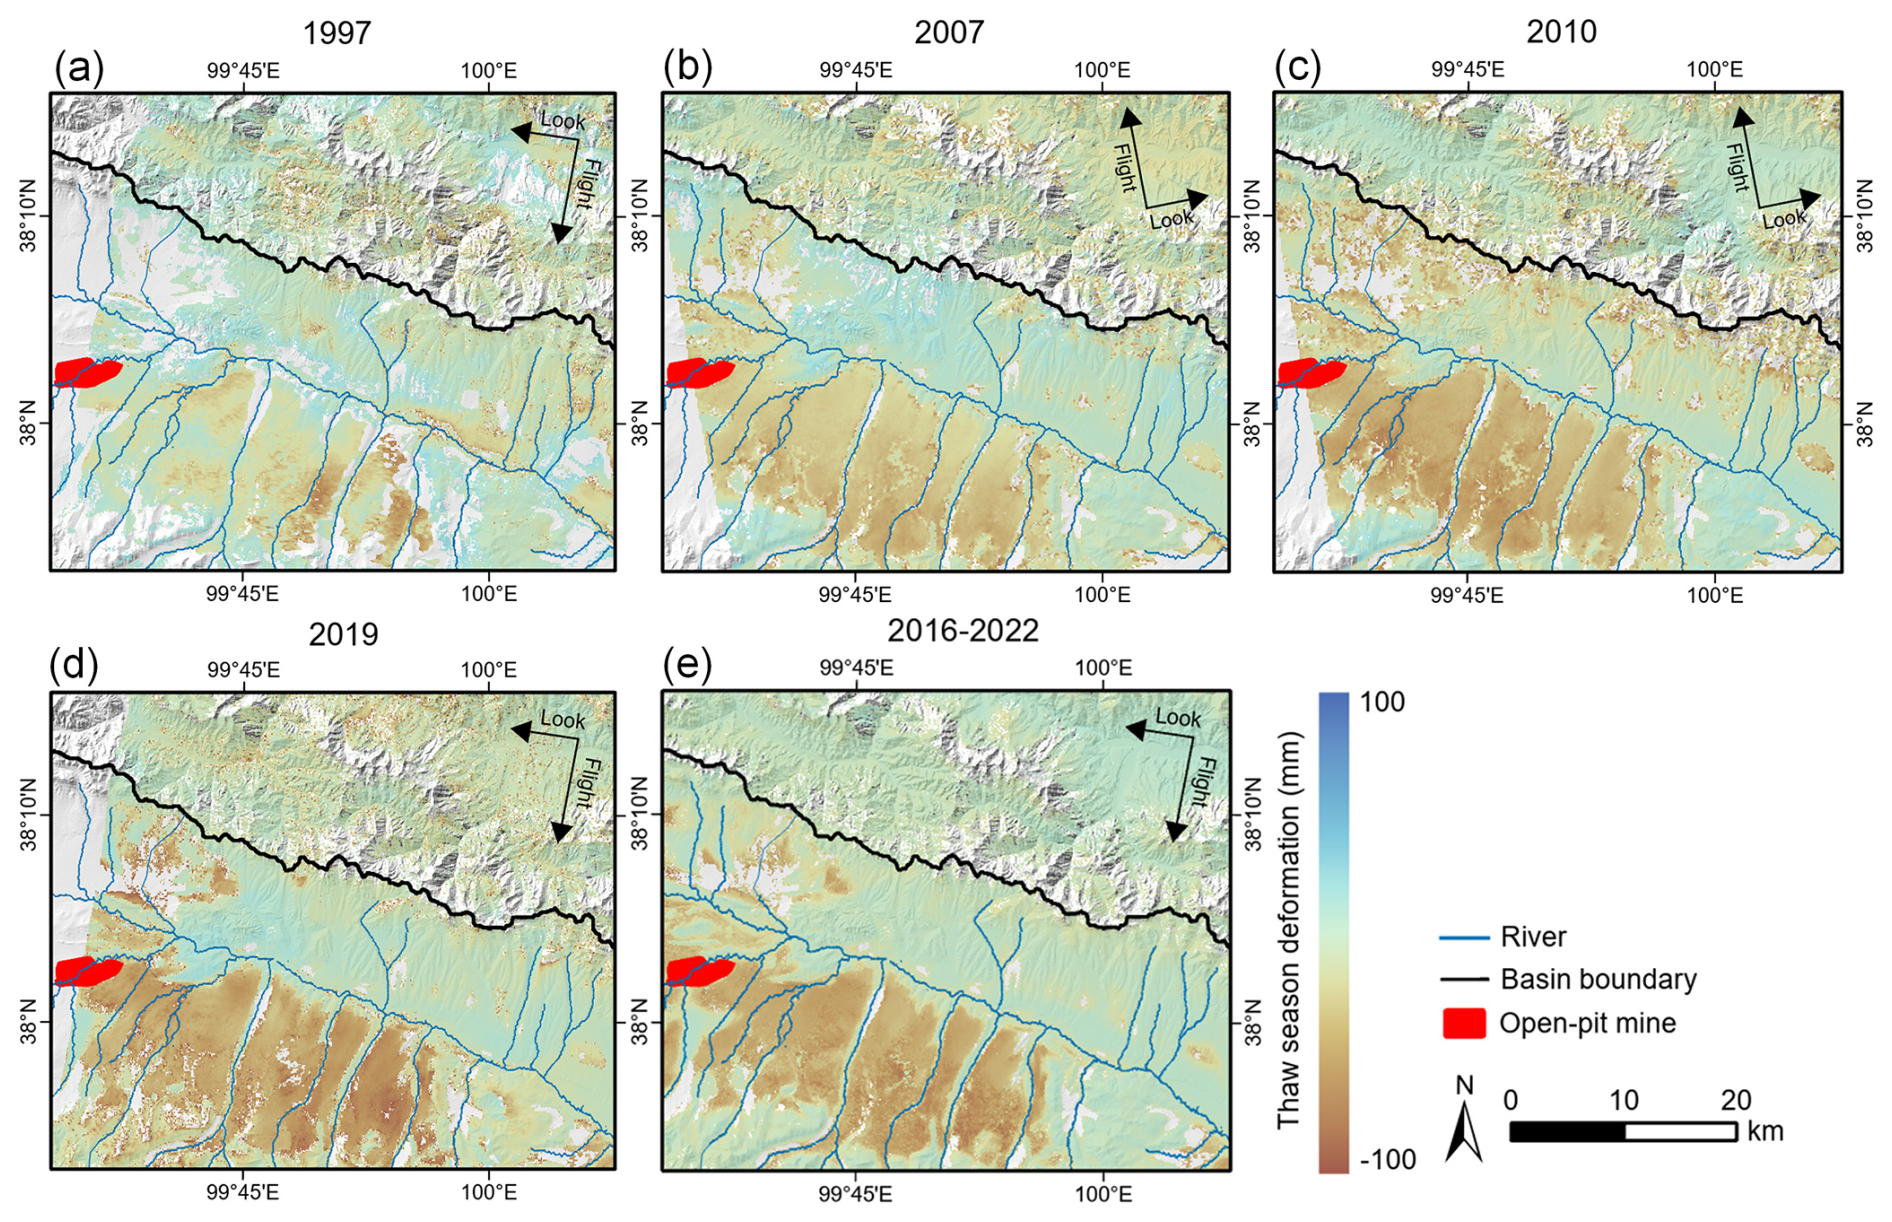
Figure 11Comparison of thaw-season deformation normalized to the full thawing season derived from multi-sensor SAR data across different periods.
4.1.3 Environmental drivers of seasonal deformation
The covariation between seasonal deformation and environmental factors indicates that areas with higher ground ice content, lower SWIR albedo, denser vegetation, gentler slopes, and larger thawing indices generally experience greater subsidence (Fig. 12). Among all the variables, SWIR albedo shows the strongest correlation with seasonal deformation (R=0.65), followed by ground ice content (R=0.60). Consistent with these correlation results, the Geodetector analysis identifies ground ice content (q=0.44) and SWIR albedo (q=0.42) as the dominant factors explaining the spatial variability of seasonal deformation, followed by slope (q=0.40), whereas NDVI (q=0.26) and thawing index (q=0.13) exhibit comparatively weaker explanatory power. The spatial distribution of surface deformation is closely associated with the distribution of surface moisture (indicated by SWIR albedo) and ground-ice conditions (Fig. 13), with significant subsidence generally observed in ice-rich permafrost areas showing densely distributed thermokarst ponds (Fig. 8). In ice-rich permafrost zones, phase transitions between ice and liquid water occur as both the active layer and underlying permafrost thaw, driving strong surface deformation (Chang et al., 2024; Liu et al., 2010).
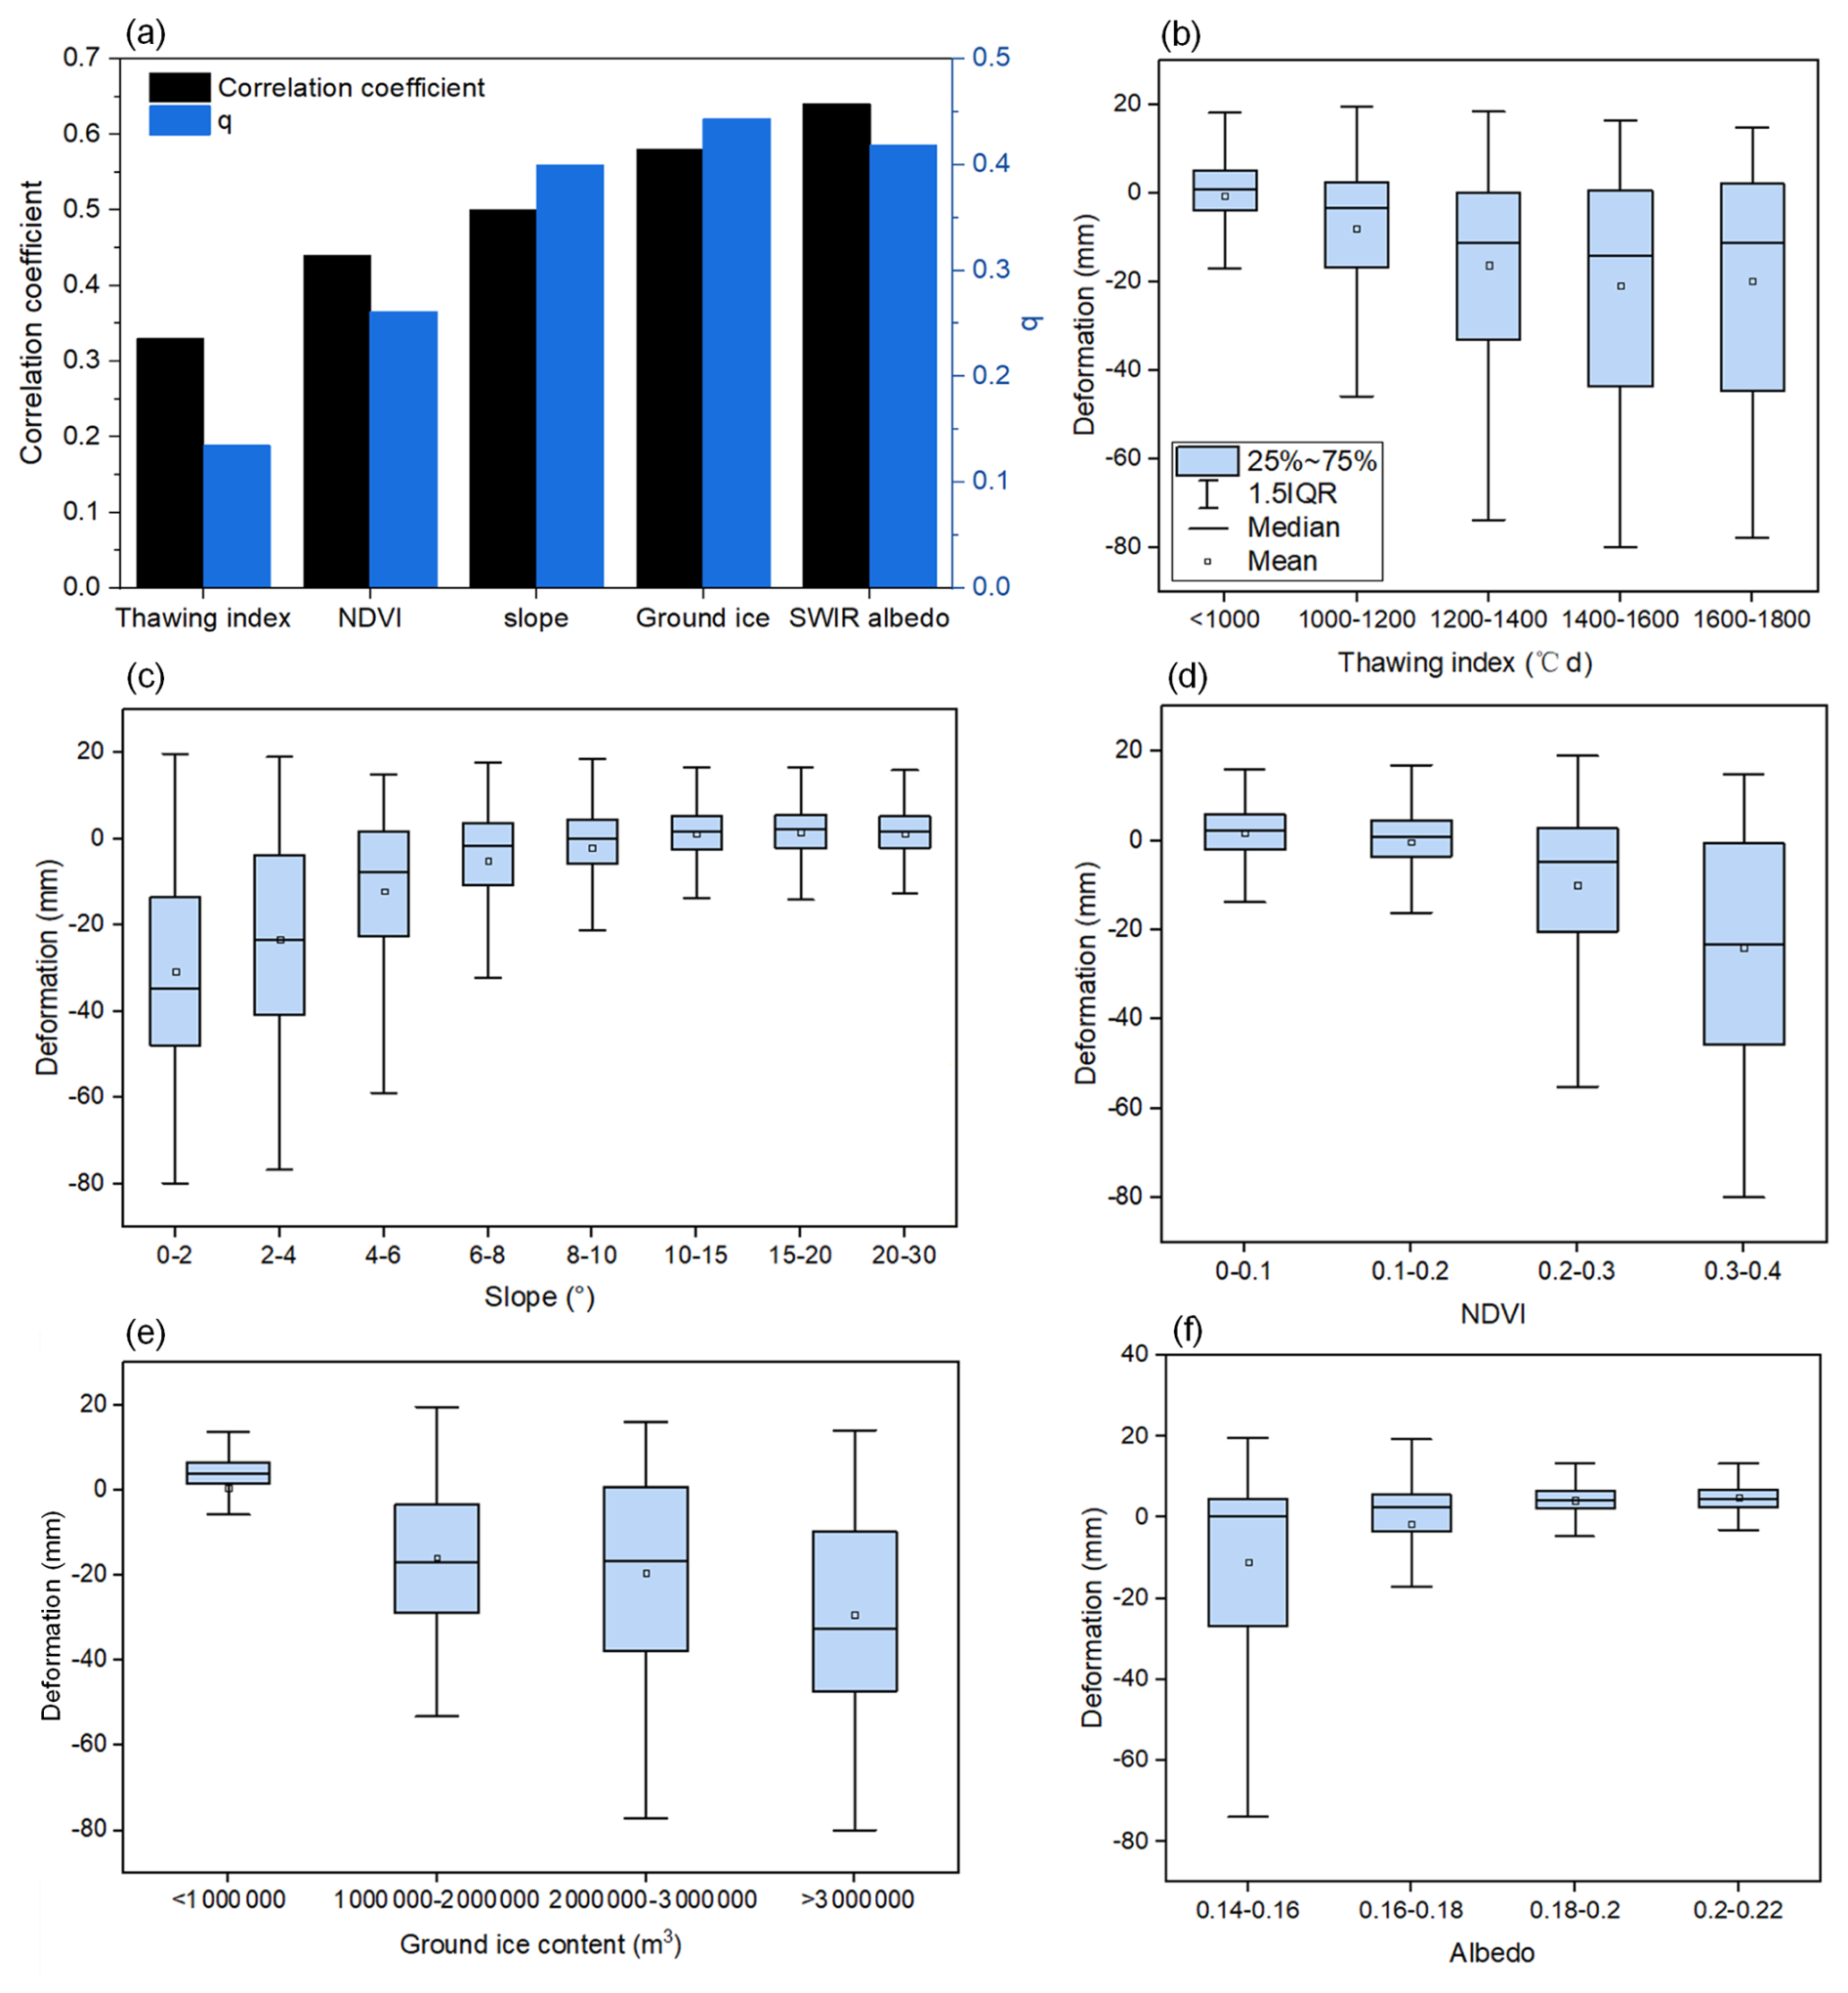
Figure 12Covariation of different environmental factors with seasonal surface deformation derived from Sentinel-1: (a) the absolute correlation coefficients and Geodetector statistic q value of different environmental factors with deformation; (b–f): the variation of seasonal deformation with different bins of environmental factors, including thawing index (b); slope (c); Normalized Difference Vegetation Index (NDVI) (d); ground ice content (e), and SWIR albedo (f).
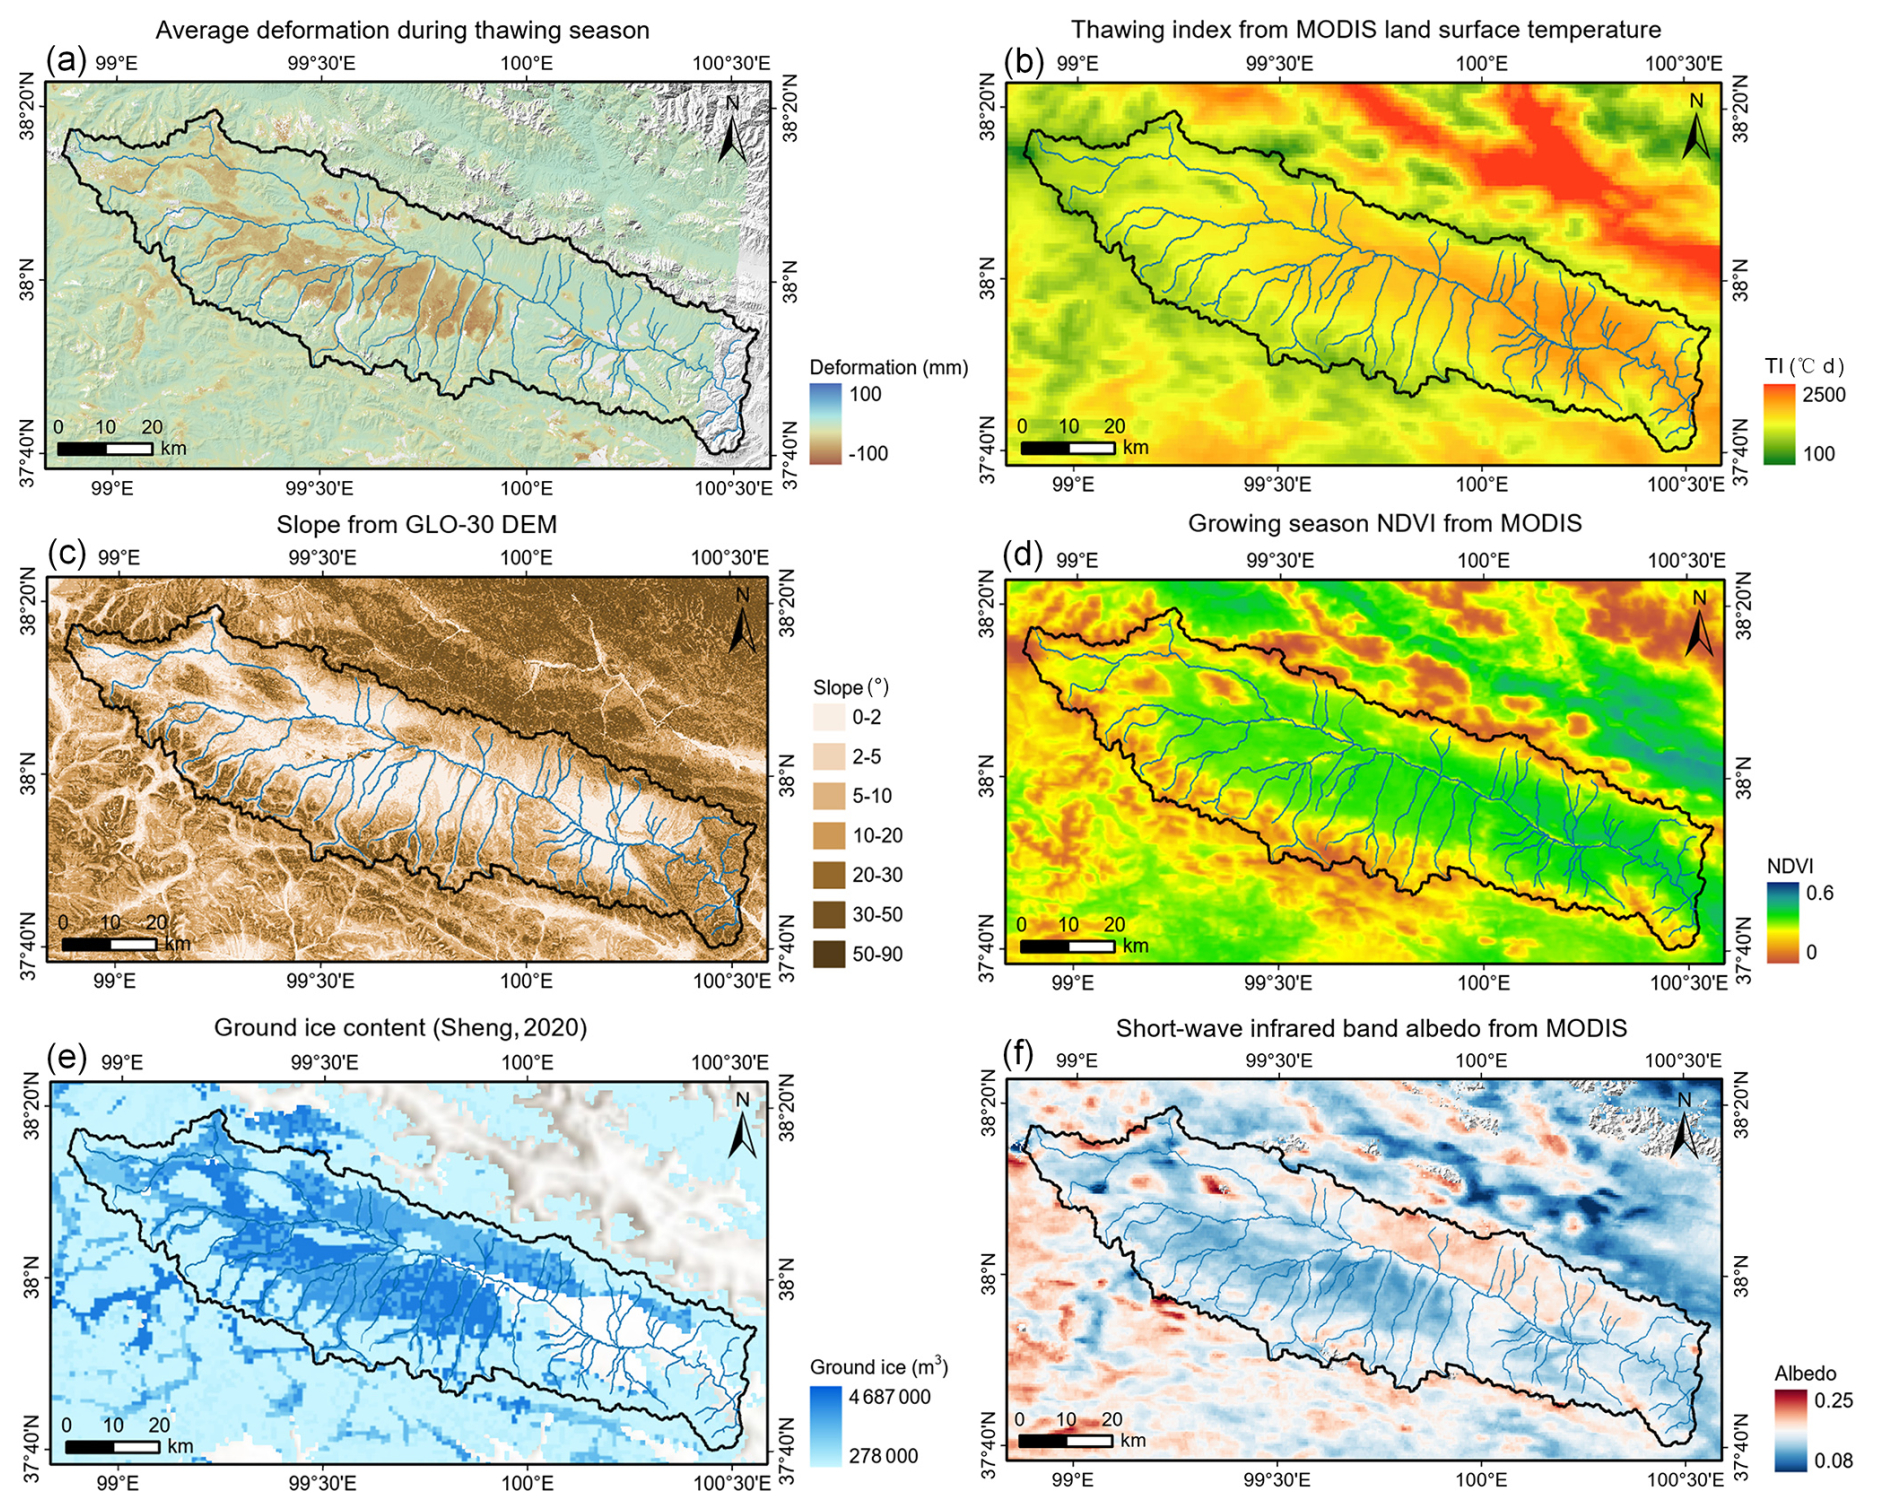
Figure 13Comparison of the spatial distribution of environmental factors and thaw season deformation: (a) seasonal deformation maps derived using Sentinel-1 SAR data; (b) thawing index; (c) slope; (d) NDVI; (e) ground ice content; (f) shortwave infrared albedo.
Thermokarst ponds or lakes may form in the low-lying areas with permafrost degradation. On the other hand, areas with more surface water have a lower surface albedo and can absorb more heat and continuously conduct heat to the surrounding permafrost, further accelerating permafrost degradation (Yi et al., 2025). This likely explains why areas with greater thawing-season subsidence generally correspond to areas with lower SWIR albedo, with a pronounced north–south contrast across the study area (Fig. 13). This is partly supported by our analysis using high-resolution optical imagery in the study area. For example, at one site near the Jiangcang open-pit mine (i.e., the P1 site shown in Fig. 8), the UAV optical imagery shows a remarkably dense distribution of small ponds with a size generally less than a few meters in the subsiding area. Comparison of the UAV image with the 1984 Keyhole imagery reveals that the presence of water bodies has expanded to some extent (Fig. S12), reflecting the enhanced development of thermokarst landforms in this area, associated with ongoing permafrost degradation.
4.2 Thaw-induced subsurface hydrological changes inferred from streamflow recession analysis
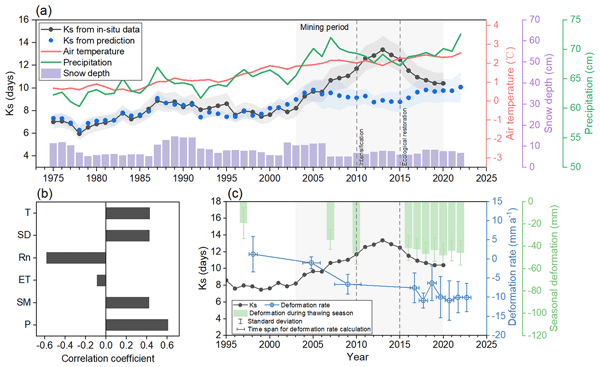
The recession time constant Ks derived from the in-situ discharge data exhibits an overall increasing trend from 1975–2020 (Fig. 14a). Before the mining started, the Ks remained relatively stable, with a slight increase observed during the 1980s and 1990s. However, during the mining period, the Ks increased rapidly and reached the peak around 2013, approximately doubling compared to pre-mining levels, indicating a substantial slowdown in the streamflow recession process. Following the government-initiated ecological restoration efforts starting around 2015, Ks gradually declined but remained higher than pre-mining values. The parameter b exhibited an overall increasing trend from 1975–2020, with the most pronounced increase occurring during 2009–2013 (Fig. S13), coinciding with the period of intensified mining disturbance. This suggests that the recession process likely became more nonlinear (Hinzman et al., 2022). When b was fixed at unity, the temporal variability of a was reduced, suggesting that part of the apparent trend in Ks was affected by the variability in b. Nevertheless, it still shows a similar trend as the original fitting, with a strong decrease in a (i.e., increase in Ks) during the intensified mining period. This confirms that the recession slowdown during this period reflects a substantive change rather than being entirely a mathematical artifact of shifting b.
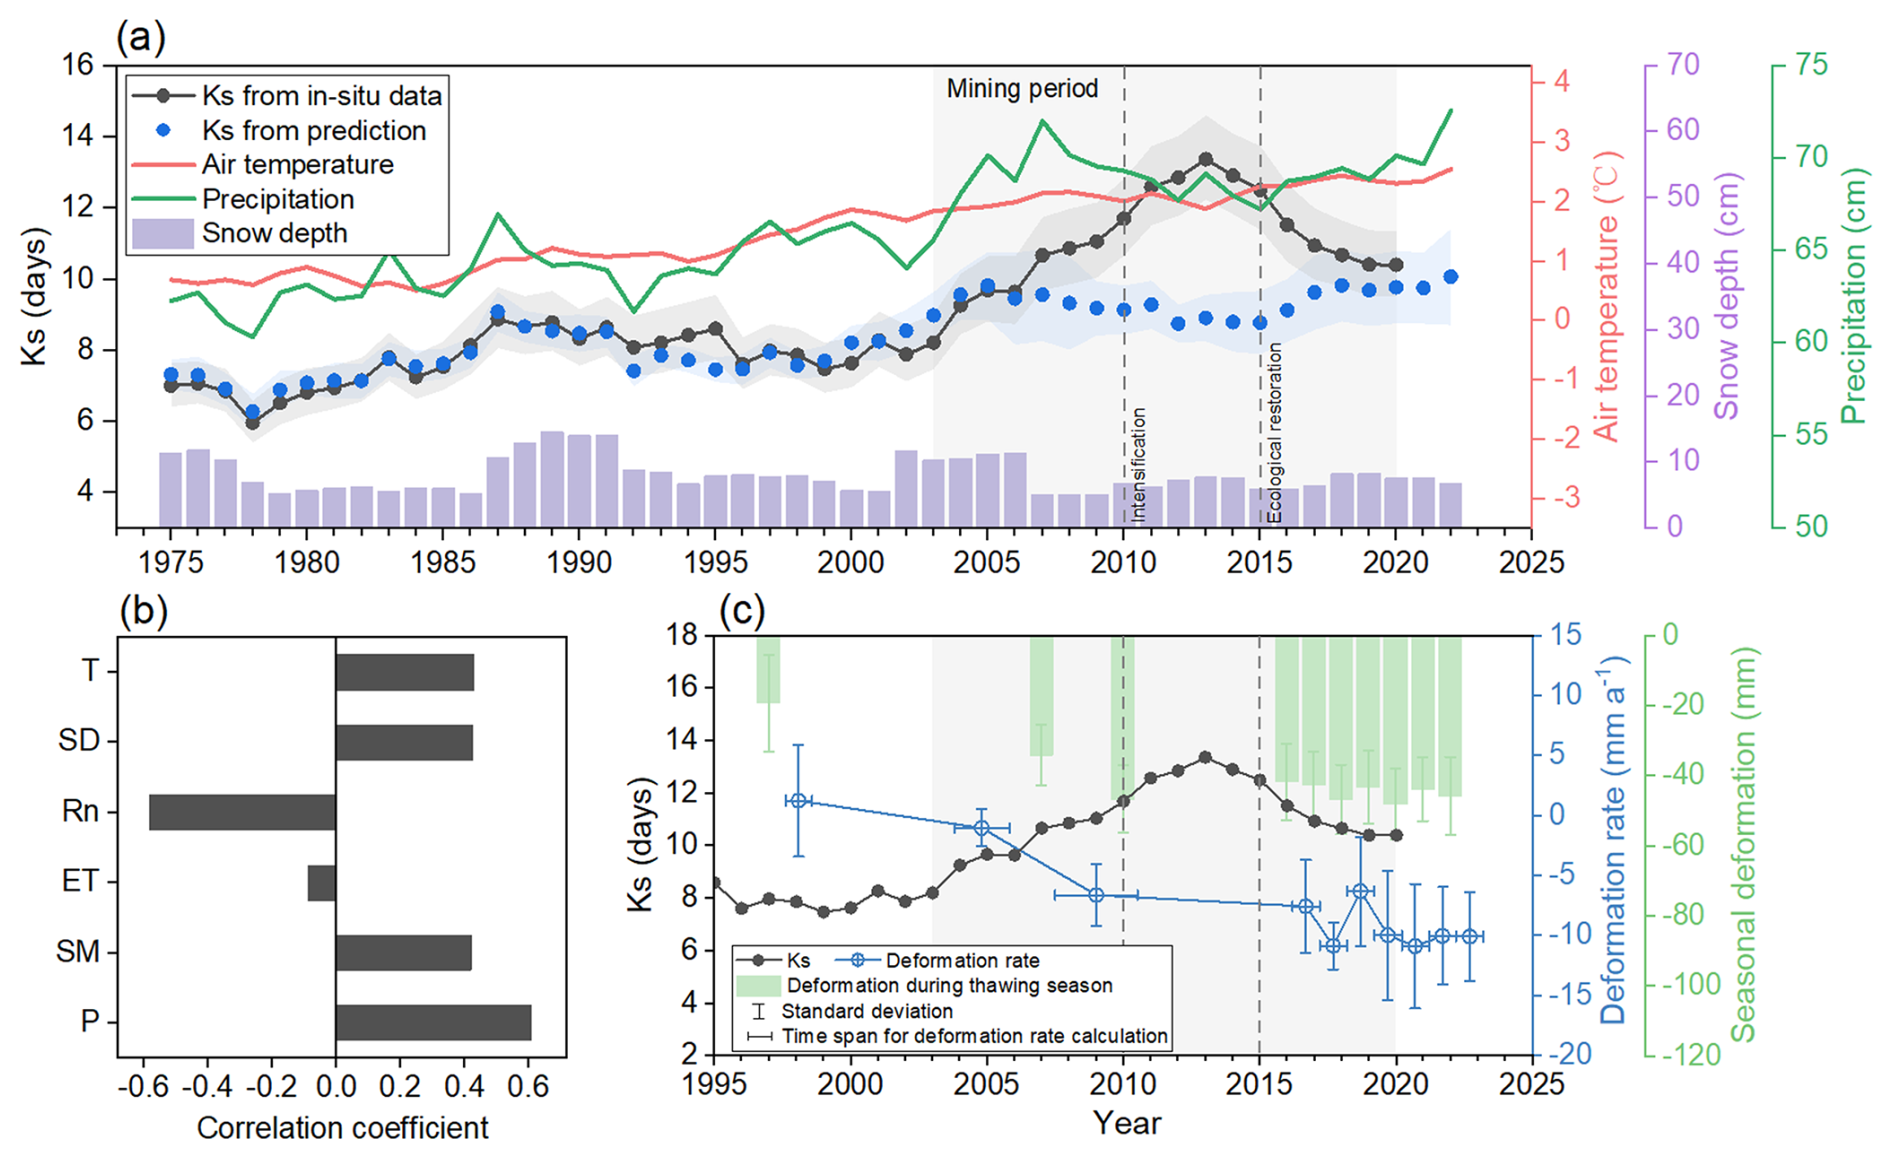
Figure 14Long-term variations in the streamflow recession constant (Ks) with the variations in deformation rate and thaw-season deformation during different periods: (a) Ks derived from in-situ streamflow data and predicted from climatic variables along with key climatic variables: air temperature, precipitation and snow depth. The shaded bands indicate the 95 % confidence intervals; (b) correlation between climatic factors and Ks before mining. Climatic factors including precipitation (P), soil moisture (SM), snow depth (SD), evapotranspiration (ET), net radiation (Rn) and air temperature (T); (c) regional mean deformation rate and thaw-season deformation within the overlapping deformation area observed by all sensors across the upper Datong River basin during different periods.
Analysis between Ks and key climatic variables before the mining period (Fig. 14b) reveals that Ks is positively correlated with air temperature, snow depth, soil moisture, and precipitation, and negatively correlated with net radiation and evapotranspiration. Using these climate variables, a multiple linear regression model was constructed for the pre-mining period, which effectively captured the majority of Ks variability (R2=0.73, p<0.001), indicating that Ks changes during this period were predominantly climate-controlled, with air temperature, precipitation, and snow depth showing strong influences. Model predictions during the mining period failed to capture the sharp increase in Ks and the climate-unexplained residual remained positive from 2009–2016, with its 95 % uncertainty interval entirely above zero, coinciding with intensified mining activity (Fig. S14). These results indicate that the observed Ks anomaly during this period cannot be fully explained by climate variability alone and imply an additional mining-related influence on streamflow recession dynamics.
When compared with InSAR-derived deformation (Fig. 14c), Ks shows a coherent evolution with both annual deformation rate and thaw-season subsidence, with correlation coefficients exceeding 0.8 (p<0.01). Before mining activities, seasonal deformation caused by active layer freeze–thaw processes was present (), but no long-term subsidence trend was detected (), indicating stable permafrost conditions. During the early stages of mining (2003–2005), there were limited changes in interannual deformation rates (). However, as mining intensified, both thaw-season subsidence and long-term subsidence rates increased significantly. The interannual deformation rate reached approximately between 2007 and 2010, with thaw-season deformation measuring in 2007 and in 2010, which coincided with a sharp increase in Ks, reflecting accelerated permafrost degradation. Ecological restoration after 2015 slowed subsidence acceleration. During 2016–2023, the interannual deformation rate ranged between −11 and , comparable to that of 2007–2010, with a slight increase after 2019. The thaw-season deformation ( mm) during this period also remained similar to that in 2010. The turning point of Ks occurred around 2013, but due to the lack of satellite deformation observations between 2010 and 2015, it is unclear whether subsidence followed a similar pattern of increase and subsequent decline. Nevertheless, the comparable magnitudes of deformation and Ks before and after this transition indicate an overall good consistency between surface and subsurface responses to permafrost thaw. The persistent subsidence trend after 2019 parallels the recent climate-driven increases in Ks, both responding to continued warming and increased precipitation, suggesting that mining-induced disturbances have amplified permafrost instability and heightened its sensitivity to climate change.
5.1 Accelerated permafrost degradation during the mining and post-mining period and potential drivers
A decades-long (1997–2023) surface deformation derived from multi-source SAR data reveals accelerated permafrost degradation in the upper Datong River basin, characterized by a significant increase in annual subsidence rates and thaw-season subsidence following the intensification of mining activities. The subsidence rate increased from a stable, pre-mining baseline to approximately −15 to during the post-mining period. These values are consistent with those reported by Wang et al. (2022), who observed accelerated permafrost degradation around Muli open-pit coal mines, with an average deformation rate of about in alpine swamp meadows during 2018–2020. Comparable rates have also been documented along the Qinghai–Tibet Engineering Corridor, where anthropogenic disturbances produce deformation of about −20 to (Lin et al., 2025). In contrast, natural permafrost areas on the northeastern QTP show relatively smaller deformation, averaging during 2003–2011 and during 2014–2019, primarily due to climate warming-induced gradual permafrost thaw (Daout et al., 2020). Overall, deformation rates across the QTP vary considerably depending on surface and subsurface conditions but are typically between −13 and (Liu et al., 2025). The thaw-season subsidence in the upper Datong River intensified markedly after 2007 and persisted through 2016–2022, with amplitudes ranging from 20–60 mm. These values are substantially higher than those in relatively arid QTP permafrost regions, where seasonal deformation typically remains below 10–20 mm, such as northwestern Tibet and the Hoh Xil area (Daout et al., 2017; Lu et al., 2023), but comparable to the wetter and ice-rich permafrost regions such as the thermokarst-prone area in the source region of the Yellow River (20–50 mm; Li et al., 2023) and the Heihe River Basin (10–60 mm; Peng et al., 2023).
The streamflow recession time constant (Ks) obtained from the long-term discharge data exhibited a rapid increase during the mining period, implying enhanced subsurface water storage and prolonged subsurface flow pathways (Fig. 14a). This response is closely associated with active layer deepening and permafrost thaw (Bense et al., 2012). Previous studies demonstrated that thickening of the active layer can significantly extend the average annual recession duration in the Tahe River Basin, northeastern China (Feng et al., 2022). In-situ active layer observations across four permafrost basins on the QTP demonstrate that supra-permafrost groundwater exhibits seasonal dynamics consistent with the freeze–thaw cycle of the active layer and contributes about 57 %–66 % of total streamflow during the summer period (Qin et al., 2024). Moreover, Evans et al. (2020) reported that in northern Eurasia, enhanced subsurface flow in continuous permafrost regions is primarily associated with active-layer deepening, whereas in areas with discontinuous permafrost, it results from extensive permafrost loss and vertical talik expansion. These processes can be explained by increased infiltration and improved hydraulic connectivity between supra- and sub-permafrost layers as the active layer thickens and permafrost degrades, allowing more water to be retained within the subsurface (Lin et al., 2020; Rogger et al., 2017). A deeper and more connected subsurface flow path also likely reduces the contribution of supra-permafrost groundwater but enhances the contribution of sub-permafrost groundwater to the river discharge, ultimately delaying streamflow recession (Meng et al., 2019). The increase in b during the mining period indicates that the recession process became more nonlinear, further supporting a change in subsurface flow pathways. Permafrost thaw-induced increases in subsurface hydraulic connectivity and drainage heterogeneity may alter the contribution of supra- and sub-permafrost groundwater to baseflow (Hinzman et al., 2022). The interaction of these flow components with different drainage timescales results in a more nonlinear storage–discharge relationship.
The strong coherence between accelerated subsidence and the rapid slowdown in the streamflow recession (i.e., increase in Ks value) during the mining and post-mining period provides compelling evidence that permafrost degradation intensified after the mining activities and is consistent with mining-amplified degradation (Fig. 14c). Before mining, variations in Ks were mainly driven by climatic factors, particularly air temperature, precipitation, and snow depth. Rising air temperatures directly affect the thermal regime of the active layer, thickening the active layer. In addition, thicker snow cover in winter helps maintain warmer soil temperatures, which may promote a thicker active layer in the subsequent thawing season. A thicker active layer enhances the infiltration of meltwater and precipitation, while increased rainfall contributes additional water percolating into deeper soil layers, thereby increasing subsurface water storage and consequently slowing streamflow recession (Jiang et al., 2024; Walvoord and Kurylyk, 2016). Following ecological restoration, Ks began to decline, yet both Ks and surface subsidence remained above pre-mining levels, indicating partial subsurface recovery but persistent thaw influence. Continued increases in temperature and precipitation in recent years may have sustained the slow recession behavior and high subsidence trend. Similar slowdowns in streamflow recession have been observed in many permafrost river basins with recent warming (Jiang et al., 2024; Liu et al., 2024; St. Jacques and Sauchyn, 2009). Moreover, since permafrost degradation had already accelerated after the intensified mining activities, the resulting instability may have increased the sensitivity of permafrost to ongoing climate change.
In addition, areas with greater surface subsidence in the upper Datong River are associated with high ground ice and surface moisture conditions. Based on our field survey, densely distributed thermokarst ponds were widespread in those areas (Fig. 1). Comparison between the historical high-resolution optical imagery and the UAV imagery obtained during our field survey at one of the sites close to the mining area showed the expansion of thermokarst ponds during the past several decades (Fig. S12). Rapid permafrost degradation induced by climate warming and mining activities very likely contributes to the formation and expansion of thermokarst ponds in the low-lying ice-rich permafrost areas, which can absorb more heat and further accelerate permafrost degradation (Yi et al., 2025). This is supported by a close negative correlation between surface SWIR albedo and seasonal subsidence (Fig. 12). However, a further process-based understanding of the link between surface changes and permafrost degradation is still needed. While any surface disturbances, either anthropogenic operations or natural wildfires, can clearly degrade the underlying permafrost, the post-fire degradations seem to be recovered within three to four decades (Cao and Furuya, 2025). It remains to be explored if the degraded permafrost can recover to the original pre-mining state in the future.
5.2 Uncertainties in the data processing and analysis
The long-term deformation results derived from multi-source SAR datasets effectively capture the spatiotemporal deformation patterns associated with mining activities and demonstrate strong consistency with changes in subsurface hydrological processes inferred from in-situ streamflow data. However, certain limitations and uncertainties remain in this study. While multi-source SAR data allow for long-term trend detection, the inherent differences in radar wavelengths (C-band vs. L-band), acquisition geometries (including incidence angles and orbital directions), temporal coverage and observation periods might introduce uncertainties into the derived long-term deformation trends to some extent.
L-band SAR data maintain high coherence over complex terrain and long temporal baselines due to their stronger penetration, producing more reliable deformation retrievals (Abe et al., 2022). In contrast, shorter wavelengths, such as C-band, are more sensitive to surface changes, which can induce temporal decorrelation and unwrapping errors (Fan et al., 2025a). For the C-band Sentinel-1 data, to compensate for interferometric network gaps caused by decorrelation and to enhance the stability of the time-series inversion, we implemented a data-constrained NSBAS approach that incorporated ALOS-2 L-band deformation rates as reference information. This approach takes advantage of the high and spatially continuous coherence of the L-band observations to constrain the long-term deformation trend. Nevertheless, the ALOS-2 reference represents a long-term mean deformation rate, and the linear–periodic temporal constraint may not fully resolve interannual or transient deformation variability within the Sentinel-1 network gaps. The deformation rate derived from the sparse D-InSAR pairs may also be susceptible to local noise and atmospheric effects (Li et al., 2022b). Moreover, ALOS-2 covers only part of the Sentinel-1 study area, and the reference velocity outside the overlapping region was obtained by extending the CDF matching correction, which may not fully represent local deformation variability. An alternative strategy is to connect annual thaw-season networks using interannual Sentinel-1 interferograms acquired near the end of the thawing season (Guan et al., 2024). This approach avoids cross-frequency inconsistencies and requires no additional data. In our study area, these interferograms achieved moderate spatially averaged coherence (0.4–0.7, Fig. S15). Some interferograms, such as the 2019–2020 interferogram (Fig. S16), retained relatively high coherence and spatially continuous deformation signals, demonstrating the potential feasibility of this strategy. However, the coherence maps show strong heterogeneity within most interferograms, and fragmented low-coherence areas can reduce the spatial continuity of reliable phase retrieval and increase susceptibility to phase unwrapping errors (Oliver-Cabrera et al., 2022). For example, localized unwrapping errors were evident even in a relatively high coherence interferogram, appearing as abrupt deformation jumps relative to the surrounding deformation field, as shown in Fig. S16. In contrast, the ALOS-2 L-band interferograms maintained high and spatially continuous coherence (>0.95, Fig. S8) over long temporal baselines, providing a more stable and reliable reference for the long-term deformation trend.
The sensitivity of InSAR-derived phase change to surface deformation is influenced by radar incidence angles and satellite orbit direction. In this study, ERS-2 and Envisat SAR data have relatively small incidence angles (∼23°), whereas ALOS-1/2 and Sentinel-1 data have larger incidence angles (39–40°). Smaller incidence angles generally provide higher sensitivity to vertical deformation (Hu et al., 2024). However, deformation derived from the small-incidence-angle ERS-2 and Envisat data is still substantially smaller than that obtained from the larger-incidence-angle ALOS-1/2 and Sentinel-1 datasets. This suggests that the pronounced subsidence captured by the ALOS-1/2 and Sentinel-1 during the mining and post-mining period is robust and not an artifact of incidence angle differences, supporting the reliability of the observed long-term deformation trends. Assuming negligible horizontal deformation in the study area, we projected the line-of-sight deformation into the vertical direction using the local incidence angles. The resulting vertical deformation trends remain consistent with the line-of-sight deformation patterns, showing significantly greater subsidence during the post-mining period than during the pre-mining stage (Figs. S17 and S18). Moreover, the influence of orbit direction is most pronounced in areas with steep slopes, where horizontal displacements contribute more to line-of-sight measurements. In our study area, the subsiding regions are relatively flat, with slopes generally less than 2°. Therefore, the impact of orbital geometry on the derived deformation changes is considered negligible.
The ERS-2, Envisat, and ALOS-1/2 results were derived from sparse interferograms and therefore represent interval-averaged deformation rates. These observations remain suitable for identifying broad stage-scale deformation differences but provide less information on short-term or nonlinear variations and the precise identification of abrupt deformation changes. In addition, temporal gaps between SAR observation periods leave deformation during these intervals unobserved. The combined results are regarded as a sequence of period-specific estimates rather than a fully continuous deformation record referenced to a common epoch. The incomplete seasonal coverage also introduces uncertainty into the thaw-season deformation estimates. To scale early SAR data to represent the entire thawing season, we assumed that the proportion of deformation occurring within a given sub-period relative to the total thaw-season deformation remains consistent across different years. We evaluated this assumption using the Sentinel-1 time series from 2016–2022 by calculating the standard deviation (STD) and coefficient of variation (CV, defined as the ratio of STD to the mean) of the scaling factor for each sub-period (Fig. S19 and Table S2). Across the four sub-periods, the spatially averaged STD ranged from 0.16–0.23, while the corresponding CV ranged from 0.08–0.11. These relatively low values support the overall validity and robustness of the scaling assumption, particularly within the main subsiding regions. Nevertheless, year-to-year differences in climatic conditions may still affect the relative contribution of deformation during different stages to some extent.
Moreover, our analysis interprets the observed deformation and recession changes as primarily reflecting intensified permafrost degradation after the mining activities. However, mining operations themselves can also cause additional ground movement through confined groundwater leakage or the redistribution of rock mass stresses (Bazaluk et al., 2023), yet such influences remain difficult to quantify in the study area. Additional uncertainties are likely associated with the streamflow recession analyses. While the changes in the recession behavior primarily indicate changes in the subsurface flow production, the lack of winter discharge data restricts a full-year evaluation of subsurface hydrological processes, which dominate in the winter baseflow production. Future studies will extend to other permafrost regions and incorporate continuous year-round streamflow observations to provide a more complete understanding of hydrological responses to permafrost change.
This study integrates multi-source InSAR retrievals with long-term streamflow recession analysis to comprehensively assess the decades-long permafrost changes in the source region of the Datong River, an area in the northeastern Qinghai-Tibet Plateau subject to extensive mining in the 2000s and early 2010s. A refined NSBAS-InSAR inversion framework was developed through incorporating a linear–periodic constraint model and ALOS-2 L-band deformation rates as the reference to improve Sentinel-1 C-band time-series retrievals strongly affected by temporal decorrelation during winter. A long-term (1997–2023) deformation dataset was then developed through combining multi-sensor C- and L-band SAR data, including ERS-2, Envisat, ALOS-1/2, and Sentinel-1, to capture both seasonal and interannual variations in the surface deformation. The long-term InSAR deformation retrievals reveal significant subsidence after intensified mining activities, with rates of −15 to and enhanced thaw-season deformation (−60 to −20 mm), especially in the ice-rich permafrost areas of the upper Datong River basin, indicating accelerated permafrost degradation during the mining and post-mining period. Streamflow recession analysis also demonstrates a pronounced increase in the recession time constant, suggesting recession slowdown following the onset of mining, likely induced by thaw-driven changes in subsurface water storage and flowpath connectivity. The concurrent increase in surface subsidence and streamflow recession time constant during the mining and post-mining periods provides strong evidence of widespread permafrost degradation associated with anthropogenic disturbances. The accelerated permafrost degradation trends revealed by the integrated analysis of InSAR deformation and hydrological data underscore the long-lasting impacts of human activities on permafrost environments and highlight the potential permafrost ecosystem vulnerability under continued strong warming trends in the alpine region.
The ERS-2 and Envisat Level 1 SLC data are available through the European Space Agency (ESA) SAR Online Dissemination Service (https://esar-ds.eo.esa.int/oads/access/collection/SAR_IMS_1P, last access: 10 July 2026). Sentinel-1 Level-1 SLC data and ALOS-1 PALSAR Level 1.1 SLC data are available at the Alaska Satellite Facility (https://search.asf.alaska.edu/, last access: 10 July 2026). The GLO-30 DEM data is distributed by OpenTopography (https://doi.org/10.5069/G9028PQB, European Space Agency, 2021). The ground ice content map and in situ air temperature data from the Yakou station can be downloaded from the National Tibetan Plateau Data Center (https://doi.org/10.11888/Geocry.tpdc.270933, Sheng, 2020; https://doi.org/10.11888/Atmos.tpdc.300652, Liu et al., 2023). The ERA5-Land reanalysis data are available and can be downloaded from the Copernicus Climate Data Store (https://doi.org/10.24381/cds.e2161bac, Copernicus Climate Change Service (C3S), 2019). MODIS NDVI, albedo, and LST data are from Google Earth Engine at https://developers.google.com/earth-engine/datasets/catalog/MODIS_MOD09GA_006_NDVI (last access: 10 July 2026), https://developers.google.com/earth-engine/datasets/catalog/MODIS_061_MCD43A3 (last access: 10 July 2026), and https://developers.google.com/earth-engine/datasets/catalog/MODIS_061_MYD11A1 (last access: 10 July 2026). The deformation data for this study are available by contacting the corresponding author upon request.
The supplement related to this article is available online at https://doi.org/10.5194/tc-20-3933-2026-supplement.
TC, YY and MF designed the study. TC, YY, MF and HJ developed the methodology. TC performed the data processing and analysis. YY and MF supervised the study. TC and YY wrote the paper. MF, HJ, YR, TC, LL and RL analyzed the results and edited the paper.
At least one of the (co-)authors is a member of the editorial board of The Cryosphere. The peer-review process was guided by an independent editor, and the authors also have no other competing interests to declare.
Publisher's note: Copernicus Publications remains neutral with regard to jurisdictional claims made in the text, published maps, institutional affiliations, or any other geographical representation in this paper. The authors bear the ultimate responsibility for providing appropriate place names. Views expressed in the text are those of the authors and do not necessarily reflect the views of the publisher.
We thank Fang Wang at the China Institute of Water Resources and Hydropower Research for providing discharge observations in the Datong River basin. ALOS-2 PALSAR-2 data are provided within a framework of the ALOS4ice group under a cooperative research contract with the Japan Aerospace Exploration Agency (JAXA), which is JAXA's EORA3 and EORA4. The ownership of ALOS-2 data belongs to JAXA.
This work is supported by the National Key Research and Development Program of China (grant no. 2024YFF0808304), the National Natural Science Foundation of China (grant nos. 42371355 and 42525105), and Future Disciplines of Shanghai Municipal Education Commission: Construction in Extreme Environments. This work was also supported by the Special Collaboration Project (B24-01) at the International Polar and Earth Environmental Research Center, National Institute of Polar Research, Japan.
This paper was edited by Heather Reese and reviewed by Neelarun Mukherjee and one anonymous referee.
Abe, T., Iwahana, G., Tadono, T., and Iijima, Y.: Ground Surface Displacement After a Forest Fire Near Mayya, Eastern Siberia, Using InSAR: Observation and Implication for Geophysical Modeling, Earth and Space Science, 9, e2022EA002476, https://doi.org/10.1029/2022EA002476, 2022.
Bazaluk, O., Kuchyn, O., Saik, P., Soltabayeva, S., Brui, H., Lozynskyi, V., and Cherniaiev, O.: Impact of ground surface subsidence caused by underground coal mining on natural gas pipeline, Sci. Rep., 13, 19327, https://doi.org/10.1038/s41598-023-46814-5, 2023.
Bense, V. F., Kooi, H., Ferguson, G., and Read, T.: Permafrost degradation as a control on hydrogeological regime shifts in a warming climate, J. Geophys. Res.-Earth, 117, https://doi.org/10.1029/2011JF002143, 2012.
Biggs, J., Wright, T., Lu, Z., and Parsons, B.: Multi-interferogram method for measuring interseismic deformation: Denali Fault, Alaska, Geophys. J. Int., 170, 1165–1179, https://doi.org/10.1111/j.1365-246X.2007.03415.x, 2007.
Biskaborn, B. K., Smith, S. L., Noetzli, J., Matthes, H., Vieira, G., Streletskiy, D. A., Schoeneich, P., Romanovsky, V. E., Lewkowicz, A. G., Abramov, A., Allard, M., Boike, J., Cable, W. L., Christiansen, H. H., Delaloye, R., Diekmann, B., Drozdov, D., Etzelmüller, B., Grosse, G., Guglielmin, M., Ingeman-Nielsen, T., Isaksen, K., Ishikawa, M., Johansson, M., Johannsson, H., Joo, A., Kaverin, D., Kholodov, A., Konstantinov, P., Kröger, T., Lambiel, C., Lanckman, J.-P., Luo, D., Malkova, G., Meiklejohn, I., Moskalenko, N., Oliva, M., Phillips, M., Ramos, M., Sannel, A. B. K., Sergeev, D., Seybold, C., Skryabin, P., Vasiliev, A., Wu, Q., Yoshikawa, K., Zheleznyak, M., and Lantuit, H.: Permafrost is warming at a global scale, Nat. Commun., 10, 264, https://doi.org/10.1038/s41467-018-08240-4, 2019.
Cao, W., Sheng, Y., Wu, J., Li, J., Li, J., and Chou, Y.: Simulation analysis of the impact of excavation backfill on permafrost recovery in an opencast coal-mining pit, Environ. Earth Sci., 75, 837, https://doi.org/10.1007/s12665-016-5659-5, 2016.
Cao, Z. and Furuya, M.: Decades-Long Evolution of Post-Fire Permafrost Deformation Detected by InSAR: Insights From Chronosequence in North Yukon, AGU Advances, 6, e2025AV001849, https://doi.org/10.1029/2025AV001849, 2025.
Chang, T., Yi, Y., Jiang, H., Li, R., Lu, P., Liu, L., Wang, L., Zhao, L., Zwieback, S., and Zhao, J.: Unraveling the non-linear relationship between seasonal deformation and permafrost active layer thickness, npj Clim. Atmos. Sci., 7, 308, https://doi.org/10.1038/s41612-024-00866-0, 2024.
Chen, J., Wu, T., Zou, D., Liu, L., Wu, X., Gong, W., Zhu, X., Li, R., Hao, J., Hu, G., Pang, Q., Zhang, J., and Yang, S.: Magnitudes and patterns of large-scale permafrost ground deformation revealed by Sentinel-1 InSAR on the central Qinghai-Tibet Plateau, Remote Sens. Environ., 268, 112778, https://doi.org/10.1016/j.rse.2021.112778, 2022.
Chen, R. H., Michaelides, R. J., Zhao, Y., Huang, L., Wig, E., Sullivan, T. D., Parsekian, A. D., Zebker, H. A., Moghaddam, M., and Schaefer, K. M.: Permafrost Dynamics Observatory (PDO): 2. Joint Retrieval of Permafrost Active Layer Thickness and Soil Moisture From L-Band InSAR and P-Band PolSAR, Earth and Space Science, 10, e2022EA002453, https://doi.org/10.1029/2022EA002453, 2023.
Cooper, M. G., Zhou, T., Bennett, K. E., Bolton, W. R., Coon, E. T., Fleming, S. W., Rowland, J. C., and Schwenk, J.: Detecting Permafrost Active Layer Thickness Change From Nonlinear Baseflow Recession, Water Resour. Res., 59, e2022WR033154, https://doi.org/10.1029/2022WR033154, 2023.
Copernicus Climate Change Service (C3S): ERA5-Land hourly data from 1950 to present, Copernicus Climate Change Service (C3S) Climate Data Store (CDS) [data set], https://doi.org/10.24381/cds.e2161bac, 2019.
Costantini, M.: A novel phase unwrapping method based on network programming, IEEE T. Geosci. Remote, 36, 813–821, https://doi.org/10.1109/36.673674, 1998.
Daout, S., Doin, M.-P., Peltzer, G., Socquet, A., and Lasserre, C.: Large-scale InSAR monitoring of permafrost freeze–thaw cycles on the Tibetan Plateau, Geophys. Res. Lett., 44, 901–909, https://doi.org/10.1002/2016GL070781, 2017.
Daout, S., Dini, B., Haeberli, W., Doin, M.-P., and Parsons, B.: Ice loss in the Northeastern Tibetan Plateau permafrost as seen by 16 yr of ESA SAR missions, Earth Planet. Sc. Lett., 545, 116404, https://doi.org/10.1016/j.epsl.2020.116404, 2020.
Doin, M.-P., Lodge, F., Guillaso, S., Jolivet, R., Lasserre, C., Ducret, G., Grandin, R., Pathier, E., and Pinel, V.: Presentation of the Small Baseline NSBAS Processing Chain on a Case Example: The Etna Deformation Monitoring from 2003 to 2010 Using ENVISAT Data, in: Proceedings of the Fringe 2011 Workshop, Frascati, Italy, 19–23 September 2011, ESA SP-697, European Space Agency, ISBN 978-92-9092-261-2, https://www.geologie.ens.fr/~jolivet/Publications_files/PDFs/Proceedings_of_the_Fringe_symposium_2011_Doin.pdf (last access: 10 July 2026), 2012.
European Space Agency: Copernicus Global Digital Elevation Model, OpenTopography [data set], https://doi.org/10.5069/G9028PQB, 2021.
Evans, S. G., Yokeley, B., Stephens, C., and Brewer, B.: Potential mechanistic causes of increased baseflow across northern Eurasia catchments underlain by permafrost, Hydrol. Process., 34, 2676–2690, https://doi.org/10.1002/hyp.13759, 2020.
Fan, C., Liu, L., Zhao, Z., and Mu, C.: Pronounced Underestimation of Surface Deformation Due To Unwrapping Errors Over Tibetan Plateau Permafrost by Sentinel-1 InSAR: Identification and Correction, J. Geophys. Res.-Earth, 130, e2024JF007854, https://doi.org/10.1029/2024JF007854, 2025a.
Fan, C., Mu, C., Liu, L., Zhang, T., Jia, S., Wang, S., Sun, W., and Zhao, Z.: Time-Series models for ground subsidence and heave over permafrost in InSAR Processing: A comprehensive assessment and new improvement, ISPRS J. Photogramm., 222, 167–185, https://doi.org/10.1016/j.isprsjprs.2025.02.019, 2025b.
Fan, L., Ji, F., Kuang, X., Guo, Z., Zhang, R., and Zheng, C.: Impacts of permafrost degradation on streamflow in the northern Himalayas, Sci. China Earth Sci., 67, 1990–2000, https://doi.org/10.1007/s11430-023-1297-4, 2024.
Feng, X., Duan, L., Kurylyk, B. L., and Cai, T.: Impacts of permafrost thaw on streamflow recession in a discontinuous permafrost watershed of northeastern China, Sci. Total Environ., 847, 157624, https://doi.org/10.1016/j.scitotenv.2022.157624, 2022.
Gao, H., Han, C., Chen, R., Feng, Z., Wang, K., Fenicia, F., and Savenije, H.: Frozen soil hydrological modeling for a mountainous catchment northeast of the Qinghai–Tibet Plateau, Hydrol. Earth Syst. Sci., 26, 4187–4208, https://doi.org/10.5194/hess-26-4187-2022, 2022.
Goldstein, R. M. and Werner, C. L.: Radar interferogram filtering for geophysical applications, Geophys. Res. Lett., 25, 4035–4038, https://doi.org/10.1029/1998GL900033, 1998.
Guan, S., Wang, C., Tang, Y., Zou, L., Yu, P., Li, T., and Zhang, H.: North American Circum-Arctic Permafrost Degradation Observation Using Sentinel-1 InSAR Data, Remote Sens-Basel, 16, 2809, https://doi.org/10.3390/rs16152809, 2024.
Guo, J., Qi, Y., Wang, H., Zhang, J., Yang, R., and Cao, Y.: Variation of land surface temperature and its influencing factors in Muli Coalfield, Qinghai Province, Journal of Glaciology and Geocryology, 45, 980–992, https://doi.org/10.7522/j.issn.1000-0240.2023.0074, 2023.
Hinzman, A. M., Sjöberg, Y., Lyon, S., Schaap, P., and van der Velde, Y.: Using a mechanistic model to explain the rising non-linearity in storage discharge relationships as the extent of permafrost decreases in Arctic catchments, J. Hydrol., 612, 128162, https://doi.org/10.1016/j.jhydrol.2022.128162, 2022.
Hjort, J., Streletskiy, D., Doré, G., Wu, Q., Bjella, K., and Luoto, M.: Impacts of permafrost degradation on infrastructure, Nat. Rev. Earth Environ., 3, 24–38, https://doi.org/10.1038/s43017-021-00247-8, 2022.
Hu, L., Tang, X., Tomás, R., Li, T., Zhang, X., Li, Z., Yao, J., and Lu, J.: Monitoring surface deformation dynamics in the mining subsidence area using LT-1 InSAR interferometry: A case study of Datong, China, Int. J. Appl. Earth Obs., 131, 103936, https://doi.org/10.1016/j.jag.2024.103936, 2024.
Jiang, H., Yi, Y., Yang, K., Zhao, L., Chen, D., Kimball, J. S., and Lu, F.: Soil freeze/thaw dynamics strongly influences runoff regime in a Tibetan permafrost watershed: Insights from a process-based model, CATENA, 243, 108182, https://doi.org/10.1016/j.catena.2024.108182, 2024.
Jin, X., Jin, H., Iwahana, G., Marchenko, S. S., Luo, D., Li, X., and Liang, S.: Impacts of climate-induced permafrost degradation on vegetation: A review, Advances in Climate Change Research, 12, 29–47, https://doi.org/10.1016/j.accre.2020.07.002, 2021.
Jones, B. M., Grosse, G., Arp, C. D., Jones, M. C., Walter Anthony, K. M., and Romanovsky, V. E.: Modern thermokarst lake dynamics in the continuous permafrost zone, northern Seward Peninsula, Alaska, J Geophys. Res.-Biogeo., 116, https://doi.org/10.1029/2011JG001666, 2011.
Jorgenson, K. L., Douglas, T. A., Jorgenson, M. T., Pastick, N. J., and Harms, T. K.: Permafrost and Rain Influence Summer Hydrologic Flowpaths in Boreal Catchments, Water Resour. Res., 61, e2024WR039024, https://doi.org/10.1029/2024WR039024, 2025.
Kirchner, J. W.: Catchments as simple dynamical systems: Catchment characterization, rainfall–runoff modeling, and doing hydrology backward, Water Resour. Res., 45, https://doi.org/10.1029/2008WR006912, 2009.
Li, C., Zhao, L., Wang, L., Liu, S., Zhou, H., Li, Z., Liu, G., Du, E., Zou, D., and Hou, Y.: Ground Deformation and Permafrost Degradation in the Source Region of the Yellow River, in the Northeast of the Qinghai-Tibet Plateau, Remote Sens.-Basel, 15, 3153, https://doi.org/10.3390/rs15123153, 2023.
Li, J., Sheng, Y., Chen, J., Zhang, X., Zhang, B., Wu, J., and Cao, Y.: Modeling permafrost distribution using remote sensing-derived vegetation data in the source region of the Datong River in the northwestern China, in: 2011 IEEE International Geoscience and Remote Sensing Symposium, Vancouver, British Columbia, Canada, 24–29 July 2011, 2225–2228, https://doi.org/10.1109/IGARSS.2011.6049611, 2011.
Li, S., Xu, W., and Li, Z.: Review of the SBAS InSAR Time-series algorithms, applications, and challenges, Geodesy and Geodynamics, 13, 114–126, https://doi.org/10.1016/j.geog.2021.09.007, 2022a.
Li, Y., Yang, K., Zhang, J., Hou, Z., Wang, S., and Ding, X.: Research on time series InSAR monitoring method for multiple types of surface deformation in mining area, Nat. Hazards, 114, 2479–2508, https://doi.org/10.1007/s11069-022-05476-8, 2022b.
Lin, L., Gao, M., Liu, J., Wang, J., Wang, S., Chen, X., and Liu, H.: Understanding the effects of climate warming on streamflow and active groundwater storage in an alpine catchment: the upper Lhasa River, Hydrol. Earth Syst. Sci., 24, 1145–1157, https://doi.org/10.5194/hess-24-1145-2020, 2020.
Lin, X., Wu, T., Chen, J., Chen, J., Li, R., Zhu, X., and Lou, P.: Revealing the impacts of environmental and anthropogenic factors on permafrost deformation in the central Qinghai-Tibet Plateau using InSAR and interpretable machine learning, Ecol. Indic., 178, 113977, https://doi.org/10.1016/j.ecolind.2025.113977, 2025.
Liu, L., Zhang, T., and Wahr, J.: InSAR measurements of surface deformation over permafrost on the North Slope of Alaska, J. Geophys. Res.-Earth, 115, https://doi.org/10.1029/2009JF001547, 2010.
Liu, L., Schaefer, K., Zhang, T., and Wahr, J.: Estimating 1992–2000 average active layer thickness on the Alaskan North Slope from remotely sensed surface subsidence, J. Geophys. Res.-Earth, 117, https://doi.org/10.1029/2011JF002041, 2012.
Liu, L., Yi, Y., Jiang, H., Ran, Y., and Chen, D.: ERA5-Land overestimates runoff coefficient but underestimates runoff recession rate in the central Tibetan permafrost region, Journal of Hydrology: Regional Studies, 53, 101792, https://doi.org/10.1016/j.ejrh.2024.101792, 2024.
Liu, S., Li, X., Xu, Z., Che, T., Xiao, Q., Ma, M., Liu, Q., Jin, R., Guo, J., Wang, L., Wang, W., Qi, Y., Li, H., Xu, T., Ran, Y., Hu, X., Shi, S., Zhu, Z., Tan, J., Zhang, Y., and Ren, Z.: The Heihe Integrated Observatory Network: A Basin-Scale Land Surface Processes Observatory in China, Vadose Zone J., 17, 1–21, https://doi.org/10.2136/vzj2018.04.0072, 2018.
Liu, S., Che, T., Xu, Z., Zhang, Y., Tan, J., Ren, Z., and Li, X.: Dataset of Heihe integrated observatory network: automatic weather station of Yakou station, 2022, National Tibetan Plateau/Third Pole Environment Data Center [data set], https://doi.org/10.11888/Atmos.tpdc.300652, 2023.
Liu, S., Zhao, L., Wang, L., Liu, L., Zou, D., Hu, G., Sun, Z., Zhang, Y., Chen, W., Wang, X., Wang, M., Zhou, H., and Qiao, Y.: Ground surface deformation in permafrost region on the Qinghai-Tibet Plateau: A review, Earth-Sci. Rev., 265, 105109, https://doi.org/10.1016/j.earscirev.2025.105109, 2025.
Lu, P., Han, J., Yi, Y., Hao, T., Zhou, F., Meng, X., Zhang, Y., and Li, R.: MT-InSAR Unveils Dynamic Permafrost Disturbances in Hoh Xil (Kekexili) on the Tibetan Plateau Hinterland, IEEE T. Geosci. Remote, 61, 1–16, https://doi.org/10.1109/TGRS.2023.3253937, 2023.
Meng, F., Su, F., Li, Y., and Tong, K.: Changes in Terrestrial Water Storage During 2003–2014 and Possible Causes in Tibetan Plateau, J. Geophys. Res.-Atmos., 124, 2909–2931, https://doi.org/10.1029/2018JD029552, 2019.
Morishita, Y., Lazecky, M., Wright, T. J., Weiss, J. R., Elliott, J. R., and Hooper, A.: LiCSBAS: An Open-Source InSAR Time Series Analysis Package Integrated with the LiCSAR Automated Sentinel-1 InSAR Processor, Remote Sens.-Basel, 12, 424, https://doi.org/10.3390/rs12030424, 2020.
Mu, C., Wu, X., Zhao, Q., Smoak, J. M., Yang, Y., Hu, L., Zhong, W., Liu, G., Xu, H., and Zhang, T.: Relict Mountain Permafrost Area (Loess Plateau, China) Exhibits High Ecosystem Respiration Rates and Accelerating Rates in Response to Warming, J. Geophys. Res.-Biogeo., 122, 2580–2592, https://doi.org/10.1002/2017JG004060, 2017.
Muñoz-Sabater, J., Dutra, E., Agustí-Panareda, A., Albergel, C., Arduini, G., Balsamo, G., Boussetta, S., Choulga, M., Harrigan, S., Hersbach, H., Martens, B., Miralles, D. G., Piles, M., Rodríguez-Fernández, N. J., Zsoter, E., Buontempo, C., and Thépaut, J.-N.: ERA5-Land: a state-of-the-art global reanalysis dataset for land applications, Earth Syst. Sci. Data, 13, 4349–4383, https://doi.org/10.5194/essd-13-4349-2021, 2021.
Murton, J. B.: Permafrost and climate change, Chapt. 14, in: Climate Change, 3rd edn., edited by: Letcher, T. M., Elsevier, 281–326, https://doi.org/10.1016/B978-0-12-821575-3.00014-1, 2021.
Nitzbon, J., Westermann, S., Langer, M., Martin, L. C. P., Strauss, J., Laboor, S., and Boike, J.: Fast response of cold ice-rich permafrost in northeast Siberia to a warming climate, Nat. Commun., 11, 2201, https://doi.org/10.1038/s41467-020-15725-8, 2020.
Oliver-Cabrera, T., Jones, C. E., Yunjun, Z., and Simard, M.: InSAR Phase Unwrapping Error Correction for Rapid Repeat Measurements of Water Level Change in Wetlands, IEEE T. Geosci. Remote, 60, 1–15, https://doi.org/10.1109/TGRS.2021.3108751, 2022.
Peng, S., Peng, X., Frauenfeld, O. W., Yang, G., Tian, W., Tian, J., and Ma, J.: Using InSAR for Surface Deformation Monitoring and Active Layer Thickness Retrieval in the Heihe River Basin on the Northeast Qinghai-Tibet Plateau, J. Geophys. Res.-Earth, 128, e2022JF006782, https://doi.org/10.1029/2022JF006782, 2023.
Qin, J., Ding, Y., Shi, F., Cui, J., Chang, Y., Han, T., and Zhao, Q.: Links between seasonal suprapermafrost groundwater, the hydrothermal change of the active layer, and river runoff in alpine permafrost watersheds, Hydrol. Earth Syst. Sci., 28, 973–987, https://doi.org/10.5194/hess-28-973-2024, 2024.
Ran, Y., Li, X., and Cheng, G.: Climate warming over the past half century has led to thermal degradation of permafrost on the Qinghai–Tibet Plateau, The Cryosphere, 12, 595–608, https://doi.org/10.5194/tc-12-595-2018, 2018.
Ran, Y., Cheng, G., Dong, Y., Hjort, J., Lovecraft, A. L., Kang, S., Tan, M., and Li, X.: Permafrost degradation increases risk and large future costs of infrastructure on the Third Pole, Commun. Earth Environ., 3, 1–10, https://doi.org/10.1038/s43247-022-00568-6, 2022.
Rogger, M., Chirico, G. B., Hausmann, H., Krainer, K., Brückl, E., Stadler, P., and Blöschl, G.: Impact of mountain permafrost on flow path and runoff response in a high alpine catchment, Water Resour. Res., 53, 1288–1308, https://doi.org/10.1002/2016WR019341, 2017.
Runge, A., Nitze, I., and Grosse, G.: Remote sensing annual dynamics of rapid permafrost thaw disturbances with LandTrendr, Remote Sens. Environ., 268, 112752, https://doi.org/10.1016/j.rse.2021.112752, 2022.
Schaaf, C. and Wang, Z.: MODIS/Terra + Aqua BRDF/Albedo Daily L3 Global – 500 m V061, NASA Land Processes Distributed Active Archive Center, https://doi.org/10.5067/MODIS/MCD43A3.061, 2025.
Sheng, Y.: Distribution data of underground ice in permafrost regions of Qilian Mountains (2013–2015), National Tibetan Plateau/Third Pole Environment Data Center [data set], https://doi.org/10.11888/Geocry.tpdc.270933, 2020.
St. Jacques, J.-M. and Sauchyn, D. J.: Increasing winter baseflow and mean annual streamflow from possible permafrost thawing in the Northwest Territories, Canada, Geophys. Res. Lett., 36, https://doi.org/10.1029/2008GL035822, 2009.
Tao, R., Lau, A., Mossefin, M. E., Kong, G., Nordal, S., and Pan, Y.: Monitoring of ground displacement-induced railway anomalies using PS-InSAR techniques, Measurement, 248, 116863, https://doi.org/10.1016/j.measurement.2025.116863, 2025.
Vermote, E. and Wolfe, R.: MODIS/Terra Surface Reflectance Daily L2G Global 1 km and 500 m SIN Grid V006, NASA Land Processes Distributed Active Archive Center, https://doi.org/10.5067/MODIS/MOD09GA.006, 2025.
Walvoord, M. A. and Kurylyk, B. L.: Hydrologic Impacts of Thawing Permafrost – A Review, Vadose Zone J., 15, vzj2016.01.0010, https://doi.org/10.2136/vzj2016.01.0010, 2016.
Wan, Z., Hook, S., and Hulley, G.: MODIS/Aqua Land Surface Temperature/Emissivity Daily L3 Global 1 km SIN Grid V061, NASA Land Processes Distributed Active Archive Center, https://doi.org/10.5067/MODIS/MYD11A1.061, 2025.
Wang, H., Qi, Y., Zhang, J., Zhang, J., Yang, R., Guo, J., Luo, D., Wu, J., and Zhou, S.: Influence of Open-Pit Coal Mining on Ground Surface Deformation of Permafrost in the Muli Region in the Qinghai-Tibet Plateau, China, Remote Sens.-Basel, 14, 2352, https://doi.org/10.3390/rs14102352, 2022.
Wang, J., Zhang, T., and Fu, B.: A measure of spatial stratified heterogeneity, Ecol. Indic., 67, 250–256, https://doi.org/10.1016/j.ecolind.2016.02.052, 2016.
Wang, L., Qu, J. J., Hao, X., and Zhu, Q.: Sensitivity studies of the moisture effects on MODIS SWIR reflectance and vegetation water indices, Int. J. Remote Sens., 29, 7065–7075, https://doi.org/10.1080/01431160802226034, 2008.
Wang, L., Marzahn, P., Bernier, M., Jacome, A., Poulin, J., and Ludwig, R.: Comparison of TerraSAR-X and ALOS PALSAR Differential Interferometry With Multisource DEMs for Monitoring Ground Displacement in a Discontinuous Permafrost Region, IEEE J.-STARS, 10, 4074–4093, https://doi.org/10.1109/JSTARS.2017.2707337, 2017.
Wang, S., Sheng, Y., Wu, J., Li, J., and Huang, L.: Based on geomorphic classification to estimate the permafrost ground ice reserves in the source area of the Datong River, Qilian Mountains, Journal of Glaciology and Geocryology, 42, 1186–1194, https://doi.org/10.7522/j.issn.1000-0240.2018.0305, 2020.
Wang, T., Yang, H., Yang, D., Qin, Y., and Wang, Y.: Quantifying the streamflow response to frozen ground degradation in the source region of the Yellow River within the Budyko framework, J. Hydrol., 558, 301–313, https://doi.org/10.1016/j.jhydrol.2018.01.050, 2018.
Werner, C., Wegmüller, U., Strozzi, T., and Wiesmann, A.: GAMMA SAR and interferometric processing software, in: Proceedings of the ERS–ENVISAT Symposium, Gothenburg, Sweden, 16–20 October 2000, Gamma Remote Sensing AG, https://www.gamma-rs.ch/uploads/media/2000-1_GAMMA_Software.pdf (last access: 10 July 2026), 2000.
Xiao, W., Guo, J., He, T., Lei, K., and Deng, X.: Assessing the ecological impacts of opencast coal mining in Qinghai-Tibet Plateau – a case study in Muli coal field, China, Ecol. Indic., 153, 110454, https://doi.org/10.1016/j.ecolind.2023.110454, 2023.
Yanagiya, K. and Furuya, M.: Post-Wildfire Surface Deformation Near Batagay, Eastern Siberia, Detected by L-Band and C-Band InSAR, J. Geophys. Res.-Earth, 125, e2019JF005473, https://doi.org/10.1029/2019JF005473, 2020.
Yang, K.: A high-resolution near-surface meteorological forcing dataset for the Third Pole region (TPMFD, 1979–2022), https://doi.org/10.11888/Atmos.tpdc.300398, 2023.
Yi, Y., Wu, T., Wu, M., Jiang, H., Yang, Y., and Rogers, B. M.: Abrupt thaw and its effects on permafrost carbon emissions in the Tibetan Plateau: A remote sensing and modeling perspective, Earth-Sci. Rev., 261, 105020, https://doi.org/10.1016/j.earscirev.2024.105020, 2025.
Yu, C., Li, Z., Penna, N. T., and Crippa, P.: Generic Atmospheric Correction Model for Interferometric Synthetic Aperture Radar Observations, J. Geophys. Res.-Sol. Ea., 123, 9202–9222, https://doi.org/10.1029/2017JB015305, 2018.
Zhang, J., Liu, L., Su, L., and Che, T.: Three in one: GPS-IR measurements of ground surface elevation changes, soil moisture, and snow depth at a permafrost site in the northeastern Qinghai-Tibet Plateau, The Cryosphere, 15, 3021–3033, https://doi.org/10.5194/tc-15-3021-2021, 2021.
Zhang, Z., Lin, H., Wang, M., Liu, X., Chen, Q., Wang, C., and Zhang, H.: A Review of Satellite Synthetic Aperture Radar Interferometry Applications in Permafrost Regions: Current status, challenges, and trends, IEEE Geoscience and Remote Sensing Magazine, 10, 93–114, https://doi.org/10.1109/MGRS.2022.3170350, 2022.
Zou, D., Zhao, L., Sheng, Y., Chen, J., Hu, G., Wu, T., Wu, J., Xie, C., Wu, X., Pang, Q., Wang, W., Du, E., Li, W., Liu, G., Li, J., Qin, Y., Qiao, Y., Wang, Z., Shi, J., and Cheng, G.: A new map of permafrost distribution on the Tibetan Plateau, The Cryosphere, 11, 2527–2542, https://doi.org/10.5194/tc-11-2527-2017, 2017.
Zwieback, S., Liu, L., Rouyet, L., Short, N., and Strozzi, T.: Advances in InSAR Analysis of Permafrost Terrain, Permafrost Periglac., 35, 544–556, https://doi.org/10.1002/ppp.2248, 2024.