
the Creative Commons Attribution 4.0 License.
the Creative Commons Attribution 4.0 License.
 | 15 Jul 2026
Climate controls on snowfall at coastal West Antarctic ice rises – potential ice core sites
Julia R. Andreasen
Peter D. Neff
The West Antarctic Ice Sheet (WAIS) is a dynamic system where interactions between ice, ocean, and atmosphere drive significant ice mass loss, raising concerns of irreversible retreat and sea-level rise. Long-term observational records of variability and change along the WAIS coast are largely restricted to satellite observations, but more direct observations are needed, given this region's present and future societal impact. Coastal ice rises, grounded domes of ice embedded in or along the margins of ice shelves, preserve in their accumulated snowfall high-resolution records of past climate variability that can be recovered by ice coring. These potential ice core sites offer unique opportunities to reconstruct key drivers of regional change, including modes of atmosphere-ocean variability described by the Southern Annular Mode (SAM), the Amundsen Sea Low (ASL), and El Niño–Southern Oscillation (ENSO) – and warrant exploration via climate reanalysis to assess the current relative balance of climate controls at any potential ice core site. This study uses ERA5 and MERRA-2 reanalysis to evaluate the climate controls on interannual snowfall variability at thirteen WAIS coastal ice rises over the satellite era (1979–2022). Results highlight longitudinal differences in how interannual snowfall variability at coastal ice rises is influenced by SAM, ENSO, and Bellingshausen Sea atmospheric pressure anomalies. Snow accumulation (precipitation) as resolved in atmospheric reanalysis suggests that, as potential ice core sites, Dean Island and Guest Peninsula, located in the West Sector of the WAIS coast, are strongly influenced by broad Southern Hemisphere westerly wind anomalies suppressing local precipitation, making them ideal for isolating this mode of variability in paleoclimate reconstructions. In contrast, Farwell Island in the East Sector exhibits a positive relationship between precipitation and cyclonic activity associated with Bellingshausen Sea pressure variability, making it a key site for reconstructing the influence of synoptic-scale pressure systems on coastal accumulation in this region. These findings inform future ice core studies aimed at understanding WAIS climate dynamics, with implications for projections of Antarctic stability and global sea-level rise.
- Article
(7707 KB) - Full-text XML
- BibTeX
- EndNote


1.1 Significance of the WAIS Coast and its Data Gap
The West Antarctic Ice Sheet (WAIS) is a pivotal region in the global climate system due to its vulnerability to ice loss, possible tipping-point behavior, and its potential to drive substantial sea-level rise in coming decades and centuries (Bamber et al., 2009; Mercer, 1978). Rapid ice discharge from notable Amundsen Sea outlet glaciers, including Thwaites and Pine Island Glaciers, is in response to a complex confluence of interactions between atmospheric, oceanic, and ice-sheet processes (Joughin and Alley, 2011). These dynamics are amplified by the WAIS's bed geometry: much of its ice rests below sea level, making it prone to instability and irreversible retreat. Understanding both present and past ice-ocean-atmosphere interactions is critical to predicting future changes in this region (Joughin et al., 2014; Shepherd et al., 2018; Steig and Neff, 2018).
Observations since the mid-20th century reveal increasing air temperatures (Bromwich et al., 2013; Li et al., 2021; Steig et al., 2009) and variable snow accumulation trends across WAIS, in addition to substantial spatial and interannual variability that remains poorly constrained due to the scarcity of direct observations in coastal West Antarctica (Medley and Thomas, 2019; Thomas et al., 2017). Ice cores have long been the cornerstone of Antarctic paleoclimate reconstruction, preserving high-resolution records of accumulation, proxy temperature, atmospheric composition, and synoptic variability through a wide range of geochemical proxy approaches (Banta et al., 2008; Orsi et al., 2012; Steig et al., 2013). These stratigraphic climate archives are primarily recovered from the cold, stable interior of the East and West Antarctic Ice Sheets and have been instrumental in reconstructing late 20th-century climate conditions. Sites such as WAIS Divide, Siple Dome, and South Pole have yielded important insights into regional climate variability and accumulation changes in West Antarctica (Mayewski et al., 2004; Orsi et al., 2012; Steig et al., 2013; Winski et al., 2019). Additionally, the US ITASE project (1999–2003) established a decadal to multi-century ice core network across the Pine Island–Thwaites drainage system, the Ross drainage basin, and the central West Antarctic ice divide and revealed the sensitivity of snow accumulation to regional climate drivers, including cyclone frequency and intensity, wind direction, and topographic influence (Kaspari et al., 2004).
However, the most coastal WAIS ITASE site is 295 km inland at 1353 m elevation (Kaspari et al., 2004), and WAIS firn cores range from 180 km inland (DIV2010) to 500 km inland (UPT2009) and above 1300 m elevation (Criscitiello et al., 2014). While conditions at these distances favor long-term stratigraphic preservation and old ice ages at depth, they are limited in their ability to capture the distinct coastal climate processes and strong spatial gradients relevant to more specific regions like the Amundsen Sea coast. This leaves a critical observational gap along the WAIS coast, one of the most climatically dynamic and glaciologically vulnerable regions of Antarctica (Scambos et al., 2017). Here, processes such as atmospheric river landfalls, the Amundsen Sea Low, and ocean-atmosphere coupling strongly modulate accumulation and ice dynamics (Smith et al., 2020; Turner et al., 2017; Wille et al., 2019). Yet, this region remains poorly sampled by ice cores, and instrumental records only extend back to the International Geophysical Year (1957–1958) in locations particularly distant from coastal West Antarctica (Byrd Station, approximately 500 km inland; e.g. Bromwich et al., 2013). To better characterize the spatial and temporal variability of snow accumulation and other environmental variables in response to synoptic climate drivers such as cyclonic activity and atmospheric rivers, we are in critical need of longer and more spatially distributed records along the WAIS coast (Neff, 2020; Wille et al., 2019).
1.2 Climatological Drivers and Oceanic Interactions Along the WAIS Coast
The WAIS coast faces the Ross, Amundsen, and Bellingshausen Seas in the broader Pacific sector of the Southern Ocean, where diverse interactions between the atmosphere, ocean, and ice sheet shape snow accumulation and ice loss. North of the WAIS coast, a primary driver of regional climate is the Southern Annular Mode (SAM). SAM describes the position and intensity of Southern Hemisphere westerly winds, which interact with the Amundsen Sea Low (ASL), a quasi-stationary low-pressure region (Lee et al., 2019; Marshall, 2003; Thompson and Wallace, 2001) between the Ross and Amundsen Seas. SAM's negative phase weakens both westerly winds and the Amundsen Sea Low, whereas its positive (current) phase enhances cyclonic activity and modulates snowfall patterns, including possible increased precipitation over Ellsworth Land and reduced accumulation near the Ross Ice Shelf over the 20th century (Medley and Thomas, 2019; Winstrup et al., 2019).
El Niño–Southern Oscillation (ENSO) conditions further modulate ASL activity, with El Niño phase of ENSO occurring when warmer tropical Pacific waters send atmospheric teleconnections that weaken the ASL (Cook et al., 2016; Ding et al., 2011), modify wind stress and sea level pressure patterns, and drive northwest-to-southeast winds that transport warm, moist air to the WAIS coast and increase snow accumulation (Karoly, 1989; Paolo et al., 2018). These circulation changes also facilitate Circumpolar Deep Water (CDW) transport onto the Antarctic continental shelf, facilitating its movement via bathymetric troughs along the Bellingshausen and Amundsen Sea margins into regions like Pine Island Bay, raising subsurface ocean temperatures to approximately +1 °C (Petty et al., 2013). These upwelled waters drive basal ice shelf melt, ice shelf thinning, and play a role in WAIS outlet glacier grounding-line retreat (Pritchard et al., 2012; Dutrieux et al., 2014; Steig et al., 2012).
In contrast, cool tropical Pacific temperatures during La Niña phase deepen the ASL. This drives southeast-to-northwest winds and brings cold, dry air from the interior, which reduces snowfall, limits basal melt and CDW upwelling, and promotes sea ice growth. The interplay between ENSO and SAM introduces additional complexity, as particular combinations of the phases of these indices can amplify or mitigate snow accumulation and oceanic heat fluxes in coastal WAIS (Fogt et al., 2011). Understanding these coupled processes, including before the satellite era (∼1979) via ice core paleoclimate reconstruction, is critical for improving reconstructions of WAIS coastal regions (Dalaiden et al., 2021) and projections of WAIS response to ice–ocean–atmosphere interactions and global sea-level rise.
1.3 The Role of Ice Rises
Although inland ice cores and reanalysis datasets cannot fully capture the dynamic coastal climate, particularly localized processes like synoptic-scale atmospheric forcing (O'Connor et al., 2025), ice rises offer a unique opportunity to address the paucity of climate records in coastal WAIS. These stable features are grounded on bedrock, embedded within or at the margin of ice shelves, and characterized by local snow accumulation and slow horizontal ice flow in their summit regions – ideal characteristics essentially identical to those of inland ice sheet divide locations (Dansgaard et al., 1969). Ice rises preserve high-resolution climate records via chemical impurities in annual snow layers that can be used to reconstruct past interactions between atmospheric, oceanic, and ice-sheet processes (Matsuoka et al., 2015; Rowell et al., 2023). Many ice cores have already been recovered from Antarctic ice rises, as seen in Fig. 1.
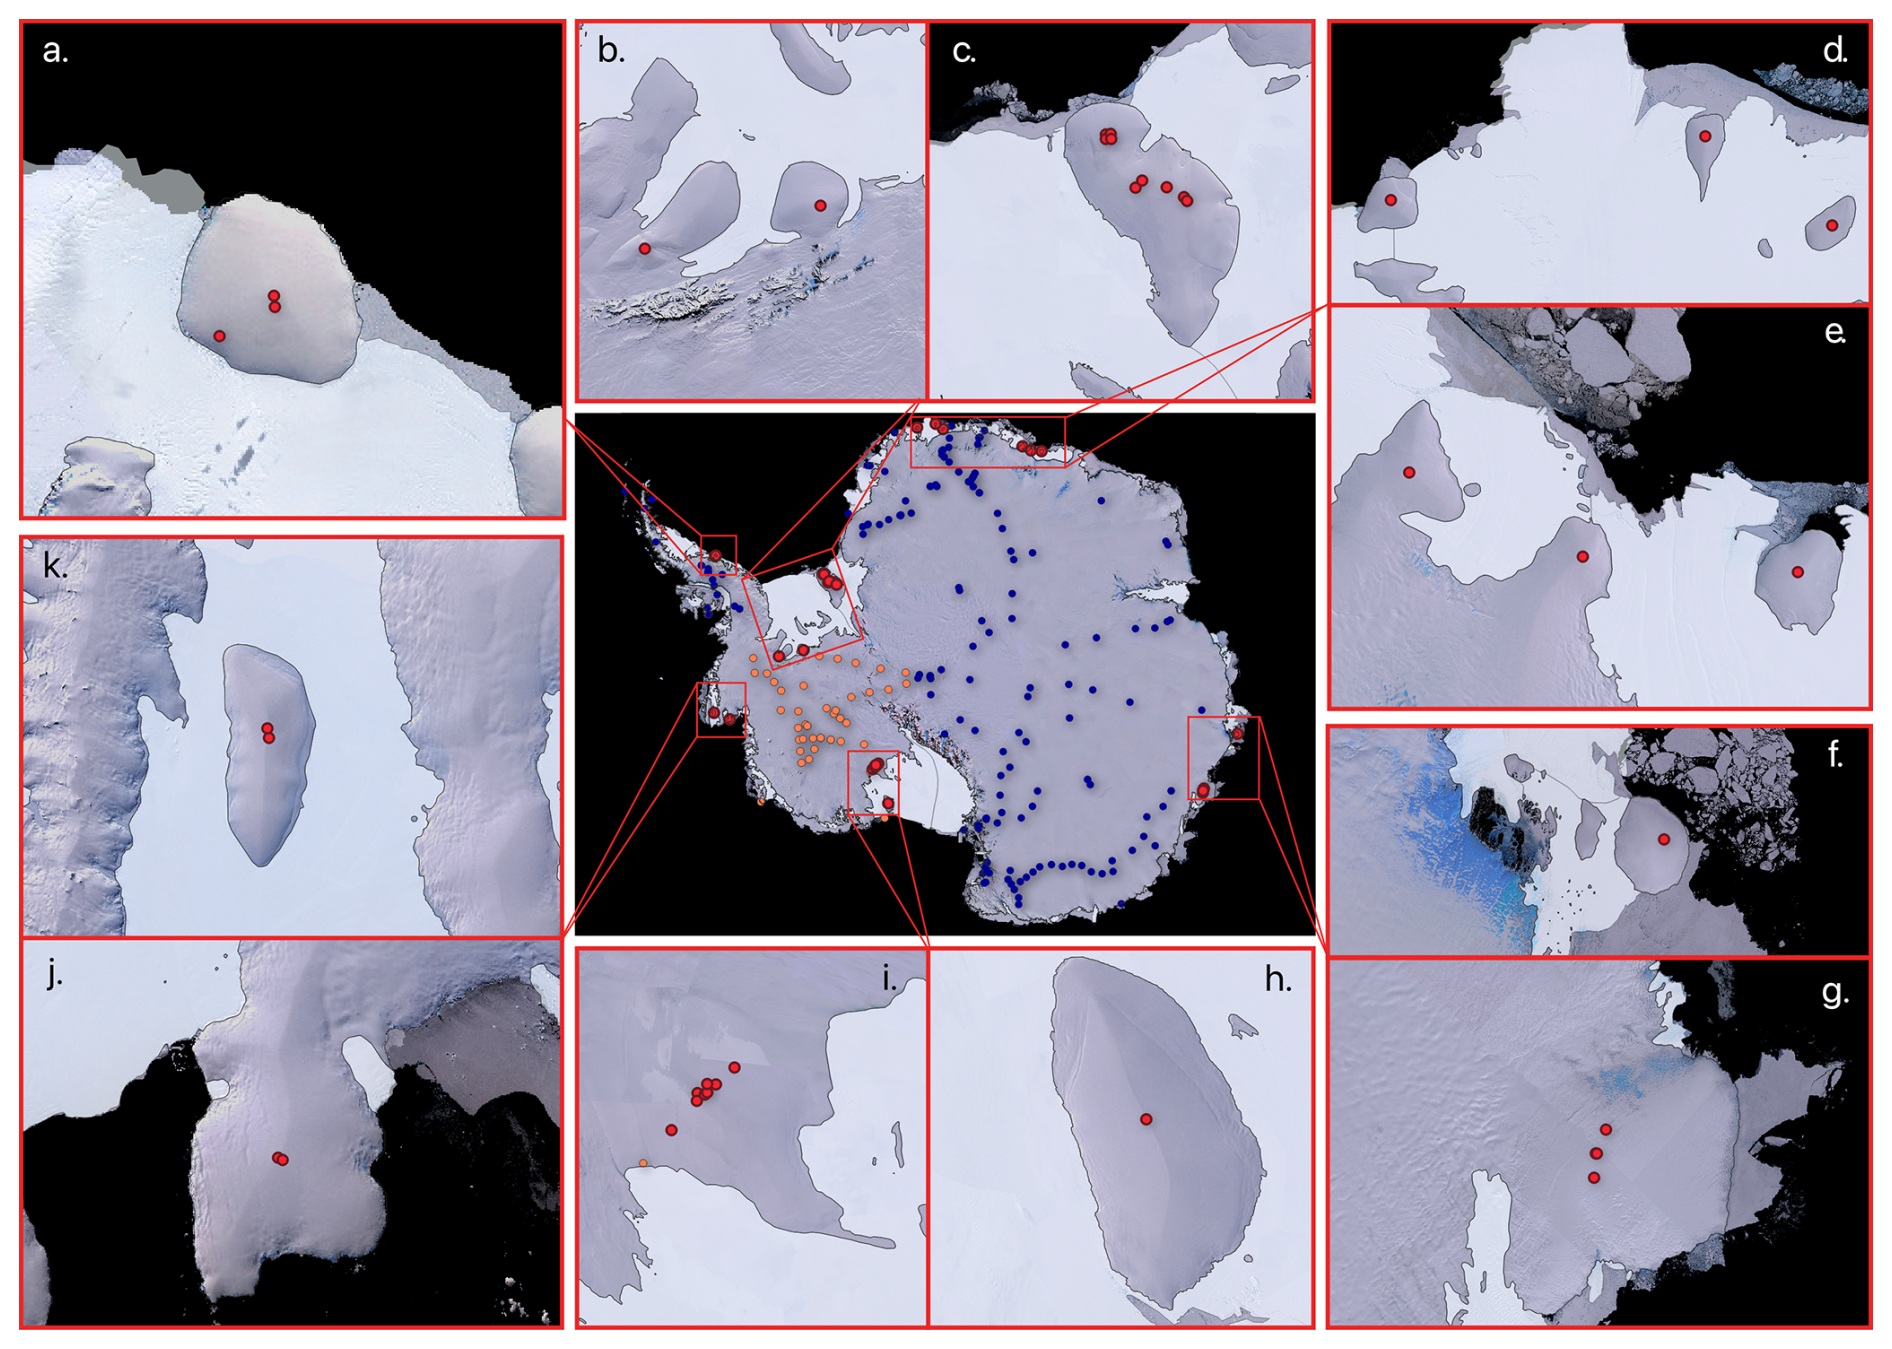
Figure 1Antarctic ice core map featuring ice rises: red dots indicate ice rise locations where ice cores have previously been recovered; orange dots indicate previously drilled ice core sites at non-ice-rise WAIS locations; and blue dots indicate previously drilled ice core sites at Antarctic Peninsula and East Antarctic Ice Sheet locations; (a) Dolleman Island, (b) Fletcher Promontory (left) and Skytrain Ice Rise (right), (c) Berkner Island, (d) Blåskimen Island (left), Kupol Moskovskij (center), and Kupol Ciolkovskogo (right), (e) Hammarryggen ice rise (left), Lokeryggen ice rise (center), and Derwael ice rise (right), (f) Mill Island, (g) Law Dome, (h) Roosevelt Island, (i) Siple Dome, (j) Canisteo Peninsula, and (k) Sherman Island. The background map is the Landsat Image of Antarctica (LIMA) mosaic (Bindschadler et al., 2008).
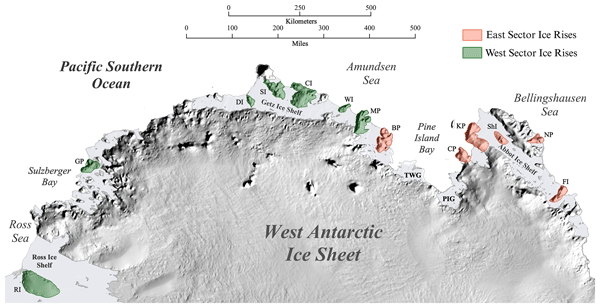
The significance of ice rises lies in their ability to bridge the spatial and temporal gaps in existing datasets, particularly in coastal WAIS, where few climate observations or annually resolved ice core records have been recovered or developed – in fact, the WAIS coast is notably underrepresented in sustained human observations relative to other Antarctic sectors. Ice rises naturally preserve the integrated effects of atmospheric and oceanic variability in the thickness of and chemical impurities contained within annual snow layers (hereafter snow accumulation). Of the continent's 124 ice rises (with individual areas of at least 90 km2), 30 of them line the WAIS coast (Matsuoka et al., 2015). These WAIS ice rises span approximately 2600 km of coastline and 75° of longitude (156 to 82° W) from Ellsworth Land and the southern extent of the Antarctic Peninsula to the eastern Ross Sea and King Edward VII Land (Fig. 2). From this inventory of 30 ice rises, we selected 13 sites for this study based on three criteria. First, we applied a minimum total area threshold; Dean Island (∼699 km2) is the smallest included site, to ensure sites are large enough to sustain a stable summit divide over the timescales relevant to paleoclimate reconstruction (millennia). Second, we required sufficient elevation above the surrounding ice shelf to ensure the ice rise developed independent flow divides with slow horizontal ice flow (which is necessary for undisturbed stratigraphic layer preservation and ice core paleoclimate reconstruction). Also, adiabatic cooling dictates that ice rise summits elevated several hundred meters above sea level will be several degrees Celsius cooler and thus less likely to experience significant surface melting than surrounding ice shelves (the lowest elevation ice rise summit is Dean Island at 395 m). Third, we selected sites to span the full longitudinal range of coastal WAIS (∼91 to ∼162° W), since one aim of the study is to characterize how climate controls on snowfall vary across this sector. We split the larger ice rises (20 km by 40 km at smallest; Dean Island) into an East Sector, which includes Farwell Island (FI), Noville Peninsula (NP), Sherman Island (ShI), King Peninsula (KP), Canisteo Peninsula (CP), and Bear Peninsula (BP), and a West Sector, which includes Martin Peninsula (MP), Wright Island (WI), Carney Island (CI), Siple Island (SI), Dean Island (DI), Guest Peninsula (GP), and Roosevelt Island (RI) (Fig. 2). Utilizing ice rises as ice core sites to reconstruct past climate variability along the coast would provide an ideal range of direct and proxy observations for understanding recent WAIS climate history that short, sparse observations and climate model datasets cannot currently address (Steig and Neff, 2018; Neff, 2020).
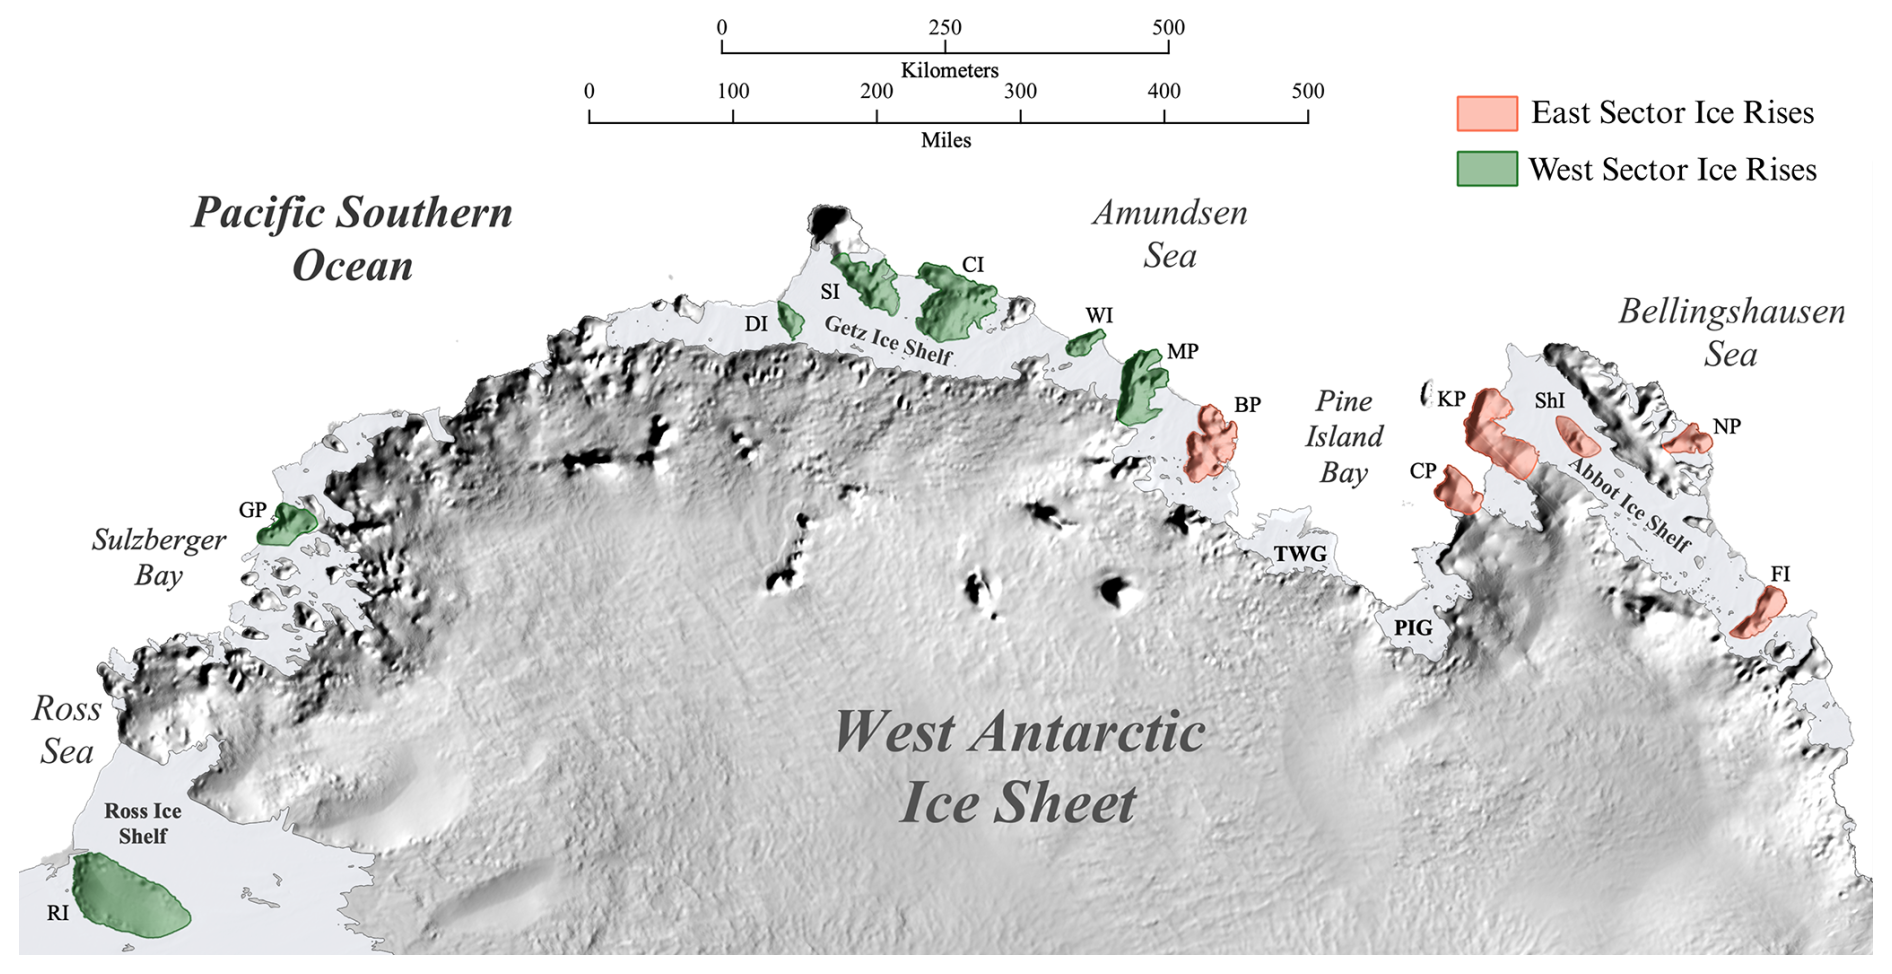
Figure 2East and west sector ice rises along the WAIS coast, facing the Ross, Amundsen, and Bellingshausen seas, with East Sector ice rises highlighted in orange, and West Sector ice rises highlighted in green; the background map is Bedmap-2 surface topography (Fretwell et al., 2013).
2.1 Reanalysis Datasets and Site Selection
To investigate drivers of snowfall variability across coastal West Antarctica, we utilize European Centre for Medium Range Weather Forecasts (ECMWF) Re-analysis (ERA5, resolution 35 km; Hersbach et al., 2020) data for most climate assessments and include a comparison to NASA's Modern-Era Retrospective analysis for Research and Applications, Version 2 (MERRA-2, resolution 0.625° × 0.5° or ∼50 km; Gelaro et al., 2017) data, focusing on precipitation (m w.e. yr−1), surface air temperature (°C), wind (U and V components), geopotential height (hPa), sea surface temperature (SST, °C), sea ice concentration (SIC), and large-scale climate indices. The thirteen coastal ice rises across the Amundsen Sea sector serve as our fixed observation sites, each defined by precise latitude and longitude. We calculate the maximum height of each ice rise across its full area, as defined by the ice rise boundaries from Matsuoka et al. (2015), using MEaSUREs BedMachine Version 3 (Morlighem, 2022; Morlighem et al., 2020), with a spatial resolution of 500 m, to reflect the topographical range across the coast. Annual precipitation and temperature time series from 1979 to 2022 are extracted for each site at the single nearest reanalysis grid cell (ERA5: ∼0.25°, MERRA-2: ∼ 0.5°), without bilinear interpolation or spatial averaging. Additionally, the domain for broader atmospheric and oceanic averaging, the “Amundsen Sea box”, is consistently defined as 55–72° S latitude and 105–150° W longitude, unless otherwise specified. This domain captures the influence of the ASL and its surrounding westerly flow, based on the climatological position and variability of low-pressure centers that frequently pass through the Amundsen Sea sector (Assmann et al., 2005; Hosking et al., 2013; Turner et al., 2013). It lies within the broader region (50–180° W, 60–75° S) commonly used to track the ASL in prior studies (Turner et al., 2013).
Before presenting results, we note that ice cores record surface mass balance (SMB) rather than precipitation directly. SMB integrates precipitation, surface sublimation, drifting snow erosion and redeposition, surface melt, and refreezing (Lenaerts et al., 2019). However, at the high-accumulation coastal ice rises studied here (mean annual accumulation 0.58–1.06 m w.e. yr−1; Table 1), precipitation is the dominant SMB term and non-precipitation losses are small in relative terms. Surface sublimation is suppressed by persistently moist near-surface conditions maintained by frequent precipitation and proximity to the Southern Ocean (Lenaerts et al., 2019). Drifting snow sublimation removes approximately 6 % of annually precipitated snow integrated across the ice sheet (Lenaerts and Van Den Broeke, 2012), a fraction further reduced in high-accumulation coastal regions where near-surface air is frequently near saturation (Lenaerts et al., 2012b). Runoff is negligible at these sites because nearly all meltwater refreezes (Lenaerts and Van Den Broeke, 2012). As a consequence, interannual SMB variability at these sites largely tracks interannual snowfall variability (Lenaerts et al., 2012a), supporting the use of ERA5 precipitation as the primary variable of interest. Consistent with this, Medley and Thomas (2019) use reanalysis P−E as a proxy for snow accumulation across the grounded Antarctic Ice Sheet, restricted to regions of positive SMB, the same regime characterizing all sites studied here. We additionally compute ERA5 P−E at each site and confirm that the correlation structure with climate indices is not meaningfully altered by inclusion of the evaporation term (see Sect. 3.1.1), providing further support that precipitation captures the dominant interannual SMB signal at these locations.
Surface melt is similarly negligible at these sites: a high-resolution RACMO2 simulation finds that melt is largely confined to low-lying ice shelves and does not frequently occur over the grounded ice sheet in this region (Lenaerts et al., 2018), and satellite-based estimates show the Amundsen Sea and Marie Byrd Land coast experiences among the lowest surface melt rates on the continent (Trusel et al., 2013). The elevated summits studied here (395–832 m) are well above documented melt zones, mean annual temperatures at the warmest sites range from −8.3 to −12.6 °C (Table 1), and field observations by the authors at Canisteo Peninsula (RAICA project, January 2024, unpublished) found limited evidence of significant melt in the recovered core stratigraphy.
2.2 ERA5 and MERRA-2 Temperature and Precipitation Comparison
To evaluate consistency between reanalysis datasets, we compare annual 2 m air temperature and total precipitation from ERA5 and MERRA-2 at all 13 ice rise locations. We exclude 1979 in this comparison due to MERRA-2 constraints and omit earlier years to avoid the lack of observational constraints due to sparse pre-satellite observations in the Antarctic (Bromwich et al., 2007). Pearson correlation coefficients (r) and p values are computed for both variables at each site. To visualize spatial agreement, we expand the comparison to a gridded analysis over 60–90° S and 170–90° W. For each MERRA-2 grid cell, we locate the nearest ERA5 grid cell using great-circle distance, extract annual temperature and precipitation time series, and compute correlation statistics. Seasonal climatologies for austral summer (December–February, DJF) and winter (June–August, JJA) are also compared.
2.3 Regional Correlations
We assess how regional wind patterns influence local snowfall by correlating ERA5 precipitation with zonal (U-wind) and meridional (V-wind) wind fields averaged over two domains, the broad Amundsen box (72–55° S, 150–105° W) and the so-called “S12 box” (68–72° S, 100–125° W, Steig et al., 2012). The S12 box is a localized domain originally defined to capture pressure and wind anomalies relevant to Circumpolar Deep Water (CDW) upwelling onto the Antarctic continental shelf (Steig et al., 2012), but here we also use it to assess more localized synoptic wind variability near the coast. Wind variables are averaged annually within each box and correlated with site-specific precipitation. This dual-box approach captures both large-scale circulation (e.g., westerly flow surrounding the Amundsen Sea Low, ASL) and more localized wind and pressure variability nearer to sensitive ice-shelf outlet regions of the Antarctic ice sheet. Correlation strength and significance (p<0.05 threshold) are visualized using scaled markers.
To evaluate vertical atmospheric influences, we correlate annual site precipitation with ERA5 geopotential height anomalies at four pressure levels: mean sea level pressure (MSLP), 850, 500, and 200 hPa (z850, z500, z200). Geopotential height fields are spatially averaged over the Amundsen Sea box each year, and Pearson r and p values are computed relative to local precipitation time series at each ice rise. This vertical framework allows us to assess the role of both surface and upper-level atmospheric circulation in modulating snowfall.
We then investigate oceanic and sea ice forcing of precipitation by analyzing ERA5-derived SST and SIC fields in the Amundsen Sea box. Annual mean SST and SIC are computed by spatially averaging the fields within the domain. Pearson correlations are calculated between each site's annual precipitation and the regional SST or SIC time series. This allows us to distinguish the effects of oceanic heat content and sea ice coverage on coastal moisture delivery (Holland and Kwok, 2012; Schwanck et al., 2017). To facilitate comparison between oceanic and cryospheric controls, we compare SST-precipitation and SIC-precipitation correlations to highlight spatial differences in the magnitude and significance of each forcing, as well as to assess whether SST and SIC exert coherent or contrasting influences on local snowfall across the WAIS coast.
2.4 Large-Scale Climate Indices and Snowfall Correlations
To evaluate the influence of large-scale atmospheric and oceanic variability on precipitation across coastal West Antarctica, we reconstruct three key climate indices from ERA5 reanalysis fields: the Southern Annular Mode (SAM), Amundsen Sea Low (ASL), and Niño 3.4 (ENSO) indices. Each index is computed using annually averaged ERA5 single-variable fields (MSLP or SST) and then correlated with ERA5-derived annual precipitation at each of our 13 ice rises.
Following Marshall (2003), we calculate the SAM index as the difference in zonal-mean MSLP between mid-latitudes (40° S) and polar latitudes (65° S). This ERA5-derived SAM index closely matches Marshall (2003) (Fig. A1). For each year, we average MSLP across all longitudes within these bands and subtract the polar average from the mid-latitude average. The resulting time series is then standardized (mean-zero, unit-variance). We compute Pearson correlation coefficients between this SAM index and the precipitation time series at each site, with significance assessed via corresponding p values.
To represent variability in ASL strength, we average annual MSLP over the Amundsen Sea sector (60–80° S, 170–62° W) and compute correlations between this calculated ASL (MSLP) and precipitation at each site. While Hosking et al. (2013) characterize the ASL using the relative central pressure of the low-pressure minimum, we find that regional MSLP averages better capture the relationship between synoptic-scale pressure variability and local precipitation at our coastal ice rise sites. This suggests that the spatial distribution of the pressure field, rather than just the intensity of the central low, is a key control on precipitation variability along the WAIS coast, consistent with recent findings emphasizing the importance of local atmospheric circulation patterns in this region (O'Connor et al., 2025). It also captures interannual shifts in the strength of the low-pressure anomaly over the Amundsen–Bellingshausen Seas.
Lastly, to quantify ENSO variability, we derive a Niño 3.4 index from ERA5 SST fields averaged over 5° S–5° N and 170–120° W (Bamston et al., 1997; Trenberth, 1997). This ERA5-derived Niño 3.4 index also closely matches the values published by Trenberth (2025) (Fig. A2). The resulting annual SST time series serves as our ENSO proxy, capturing both El Niño and La Niña phases. We again correlate this index with precipitation time series at each ice rise to assess tropical–polar teleconnections (Ding et al., 2011; Li et al., 2021). Together, these analyses provide a model-based assessment of how large-scale circulation modes influence precipitation at potential ice core sites along the WAIS coast. Future ice core records from these locations will allow validation of these reanalysis-derived climate relationships and enable reconstruction of these modes beyond the satellite era.
3.1 Reanalysis Datasets
3.1.1 Precipitation and Temperature Correlations
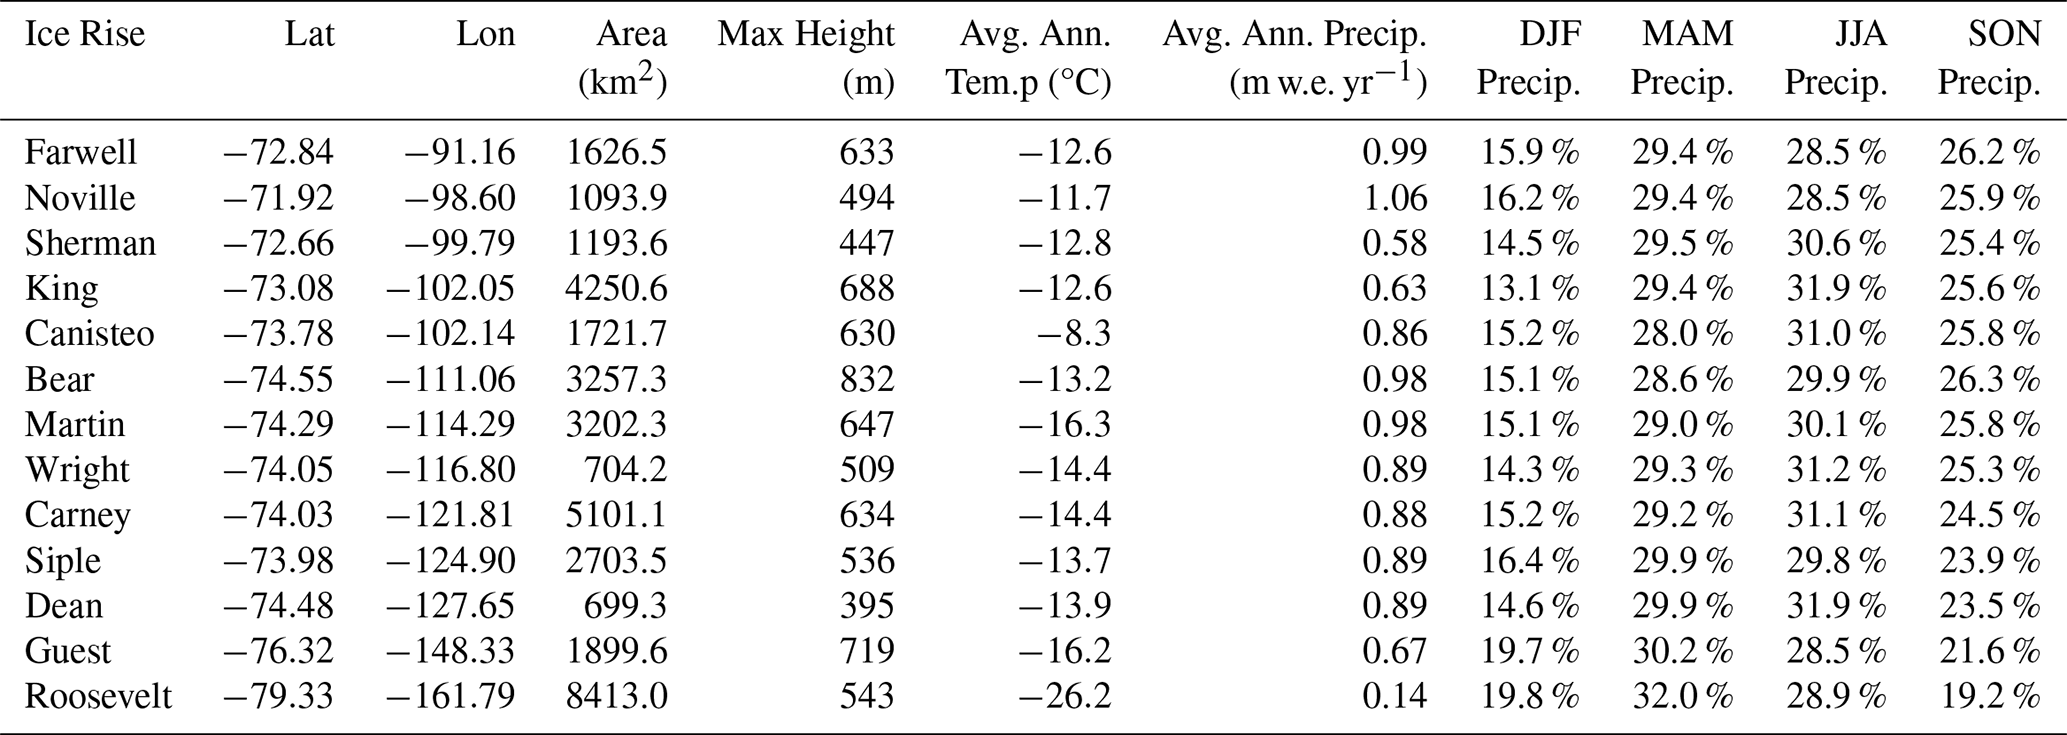
ERA5 data (1979–2022) show that the East Sector exhibits slightly warmer temperatures than the West Sector, with Noville Peninsula displaying the warmest and wettest annual average temperatures, while Bear Peninsula is the coldest and Sherman Island the driest (Table 1).
In the West Sector, Martin Peninsula experiences the coolest annual average temperatures and the highest average precipitation, while Siple Island is the warmest, and Guest Peninsula has the least precipitation. Seasonally, both sectors share similar trends: January is the warmest and driest month, while August is the coldest, and May is the wettest on average.
Table 1Key characteristics for each ice rise, including latitude, longitude, total area, maximum height (MEaSUREs BedMachine Version 3 at 500 m resolution, Morlighem, 2022), average annual temperature (ERA5 at 2 m), and total precipitation with seasonal distribution percentages (ERA5, surface level).
To assess consistency between reanalysis datasets used for Antarctic climate reconstruction, we compare ERA5 and MERRA-2 average temperature and precipitation data from 1979 to 2022 across our WAIS ice rise locations (Fig. 3). While both datasets generally agree, important spatial and temporal discrepancies emerge. For precipitation, correlations between the two products are consistently high across all sites (Fig. 3d), with coefficients ranging from 0.82 at Siple Island (SI) to 0.92 at Dean Island (DI). The spatial map (Fig. 3e) confirms this strong agreement across West Antarctica. While high inter-product correlation suggests both reanalyses respond similarly to synoptic-scale forcing, it does not independently verify accuracy, as both products could share similar biases. Future ice core records from these sites will provide observational constraints on reanalysis precipitation estimates. We also compute ERA5 P−E at each site and find that annual P−E and annual precipitation are nearly identical in their interannual variability, with Pearson correlations between the two time series ranging from r=0.987 at Bear Peninsula to r=0.999 at Noville Peninsula across all 13 sites. This confirms that evaporation is a negligible term in the interannual SMB budget at these high-accumulation coastal locations, and that the correlation structure between precipitation and climate indices reported here is not meaningfully affected by the inclusion of the evaporation term.
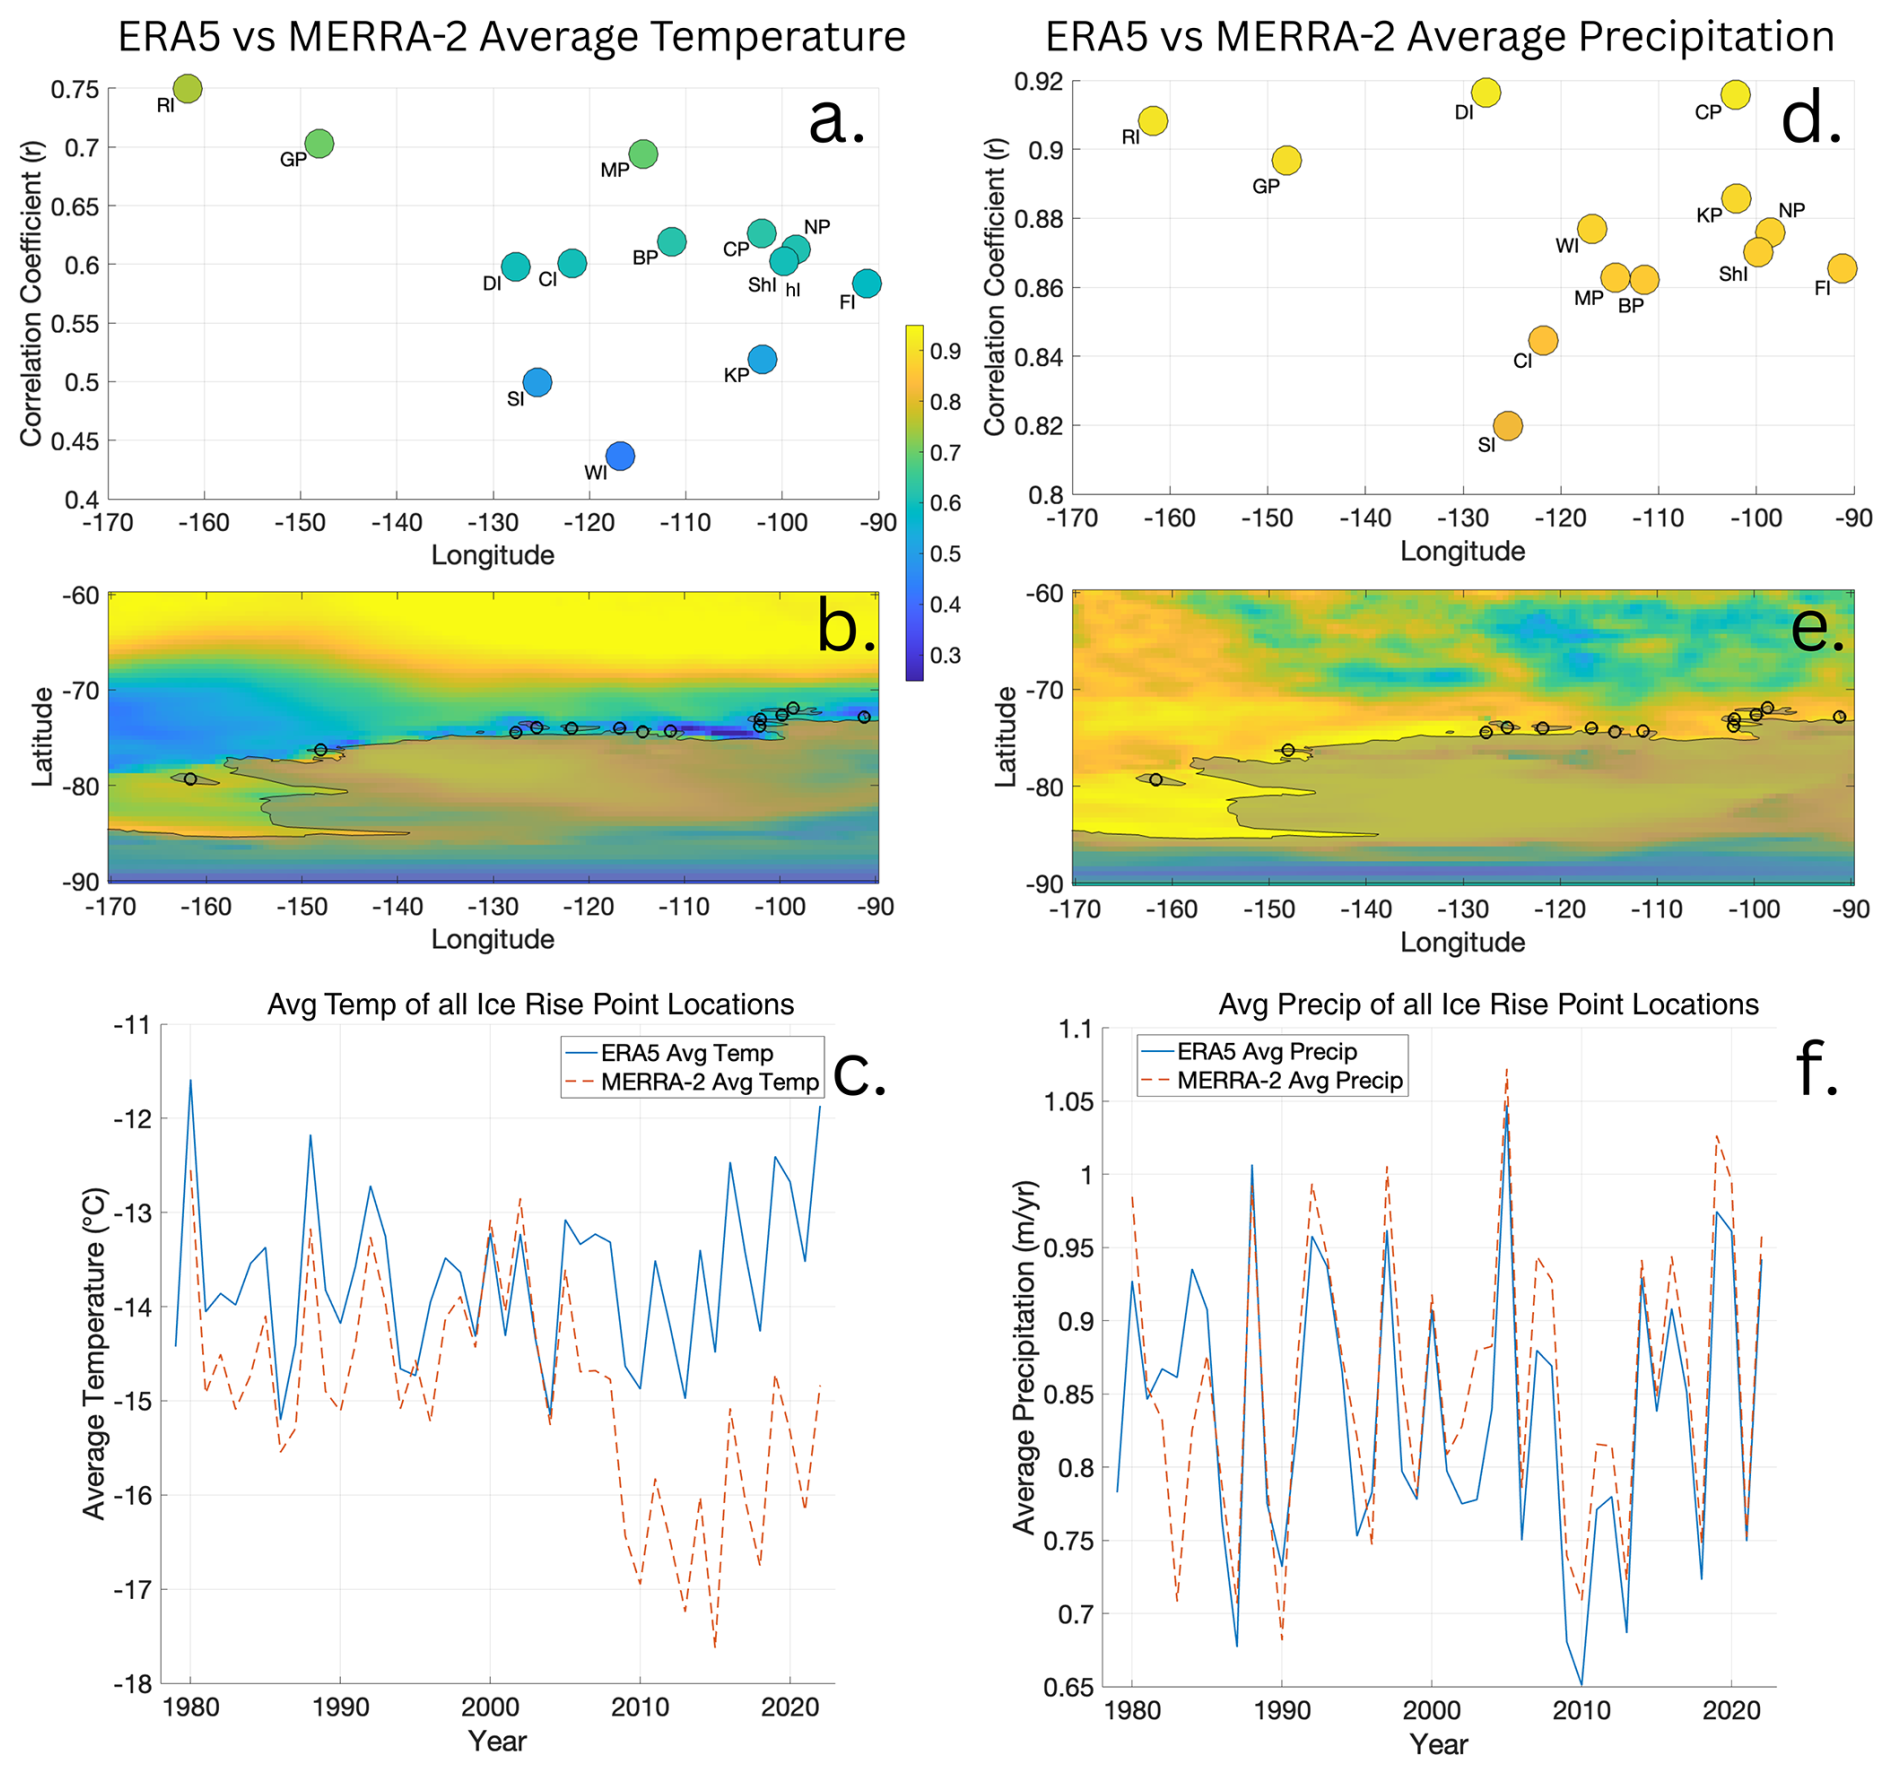
Figure 3Correlation between ERA5 and MERRA-2 reanalysis datasets for temperature (a–c) and precipitation (d–f) at each ice rise for the 1979–2022 period. Panels (a), (b), (d), and (e) show a correlation field visualized with a color-coded heatmap (higher correlation coefficients in yellow, lower coefficients in blue) and the 13 ice rise locations plotted. Statistical significance of the ERA5 and MERRA-2 comparison is indicated by marker size. Panels (c) and (f) average the temperature (c) and precipitation (f) for all the ice rise point locations annually for ERA5 (blue line) and MERRA-2 (dotted orange line).
In contrast, temperature correlations between reanalyses vary more widely, from 0.44 at Wright Island (WI) to 0.75 at Roosevelt Island (RI) (Fig. 3a). This weaker agreement is evident in both the spatial correlation (Fig. 3b) and in the time series (Fig. 3c), where post-2005 MERRA-2 temperatures show a systematic cooling bias relative to ERA5. The low ERA5–MERRA-2 temperature correlations are spatially coherent along ∼70–75° S, corresponding directly to the coastal strip where all 13 ice rise locations sit (Fig. 3b) and suggesting that this divergence reflects a regional reanalysis artifact rather than a site-specific issue. This coastal disagreement is consistent with broader documented inter-reanalysis discrepancies in Antarctic temperature; Wang et al. (2025) show that ERA5 and MERRA-2 can give substantially contrasting temperature signals in coastal Antarctic regions. Additionally, as Zhu et al. (2021) note, while MERRA-2 can capture monthly temperature variability over inland Antarctic stations, its correlations are generally lower than those of ERA5, possibly due to differences in sensor transitions and the dimensionality and input data of the assimilation systems used. Bromwich et al. (2024) further demonstrate that ERA5 successfully captures interannual temperature variability at Antarctic station locations after 1979, the period central to our analyses.
Given the stronger consistency and better alignment with independent datasets, as well as its widespread use and evaluation in Antarctic climate studies (e.g. Bromwich et al., 2007, 2024), ERA5 is used for all subsequent analyses in this work. However, the inter-dataset differences, especially for temperature, highlight the ongoing challenges of using reanalysis in Antarctic climate studies and caution against over-interpreting absolute values or trends without observational validation, which is particularly challenging along the remote coastline of West Antarctica.
3.1.2 Wind Correlations
To evaluate the role of atmospheric circulation in driving precipitation variability at WAIS coastal ice rises, we correlate precipitation at each location with ERA5 10 m surface winds: zonal wind (U-wind, east–west) and meridional wind (V-wind, north–south), averaged across the broader Amundsen Sea box (55–72° S, 105–150° W) and the narrower S12 box (68–72° S, 100–125° W, Steig et al., 2012) (Fig. 4c, f). These analyses capture the influence of both broad-scale circulation regimes, such as the Southern Annular Mode (SAM), and more localized synoptic activity.
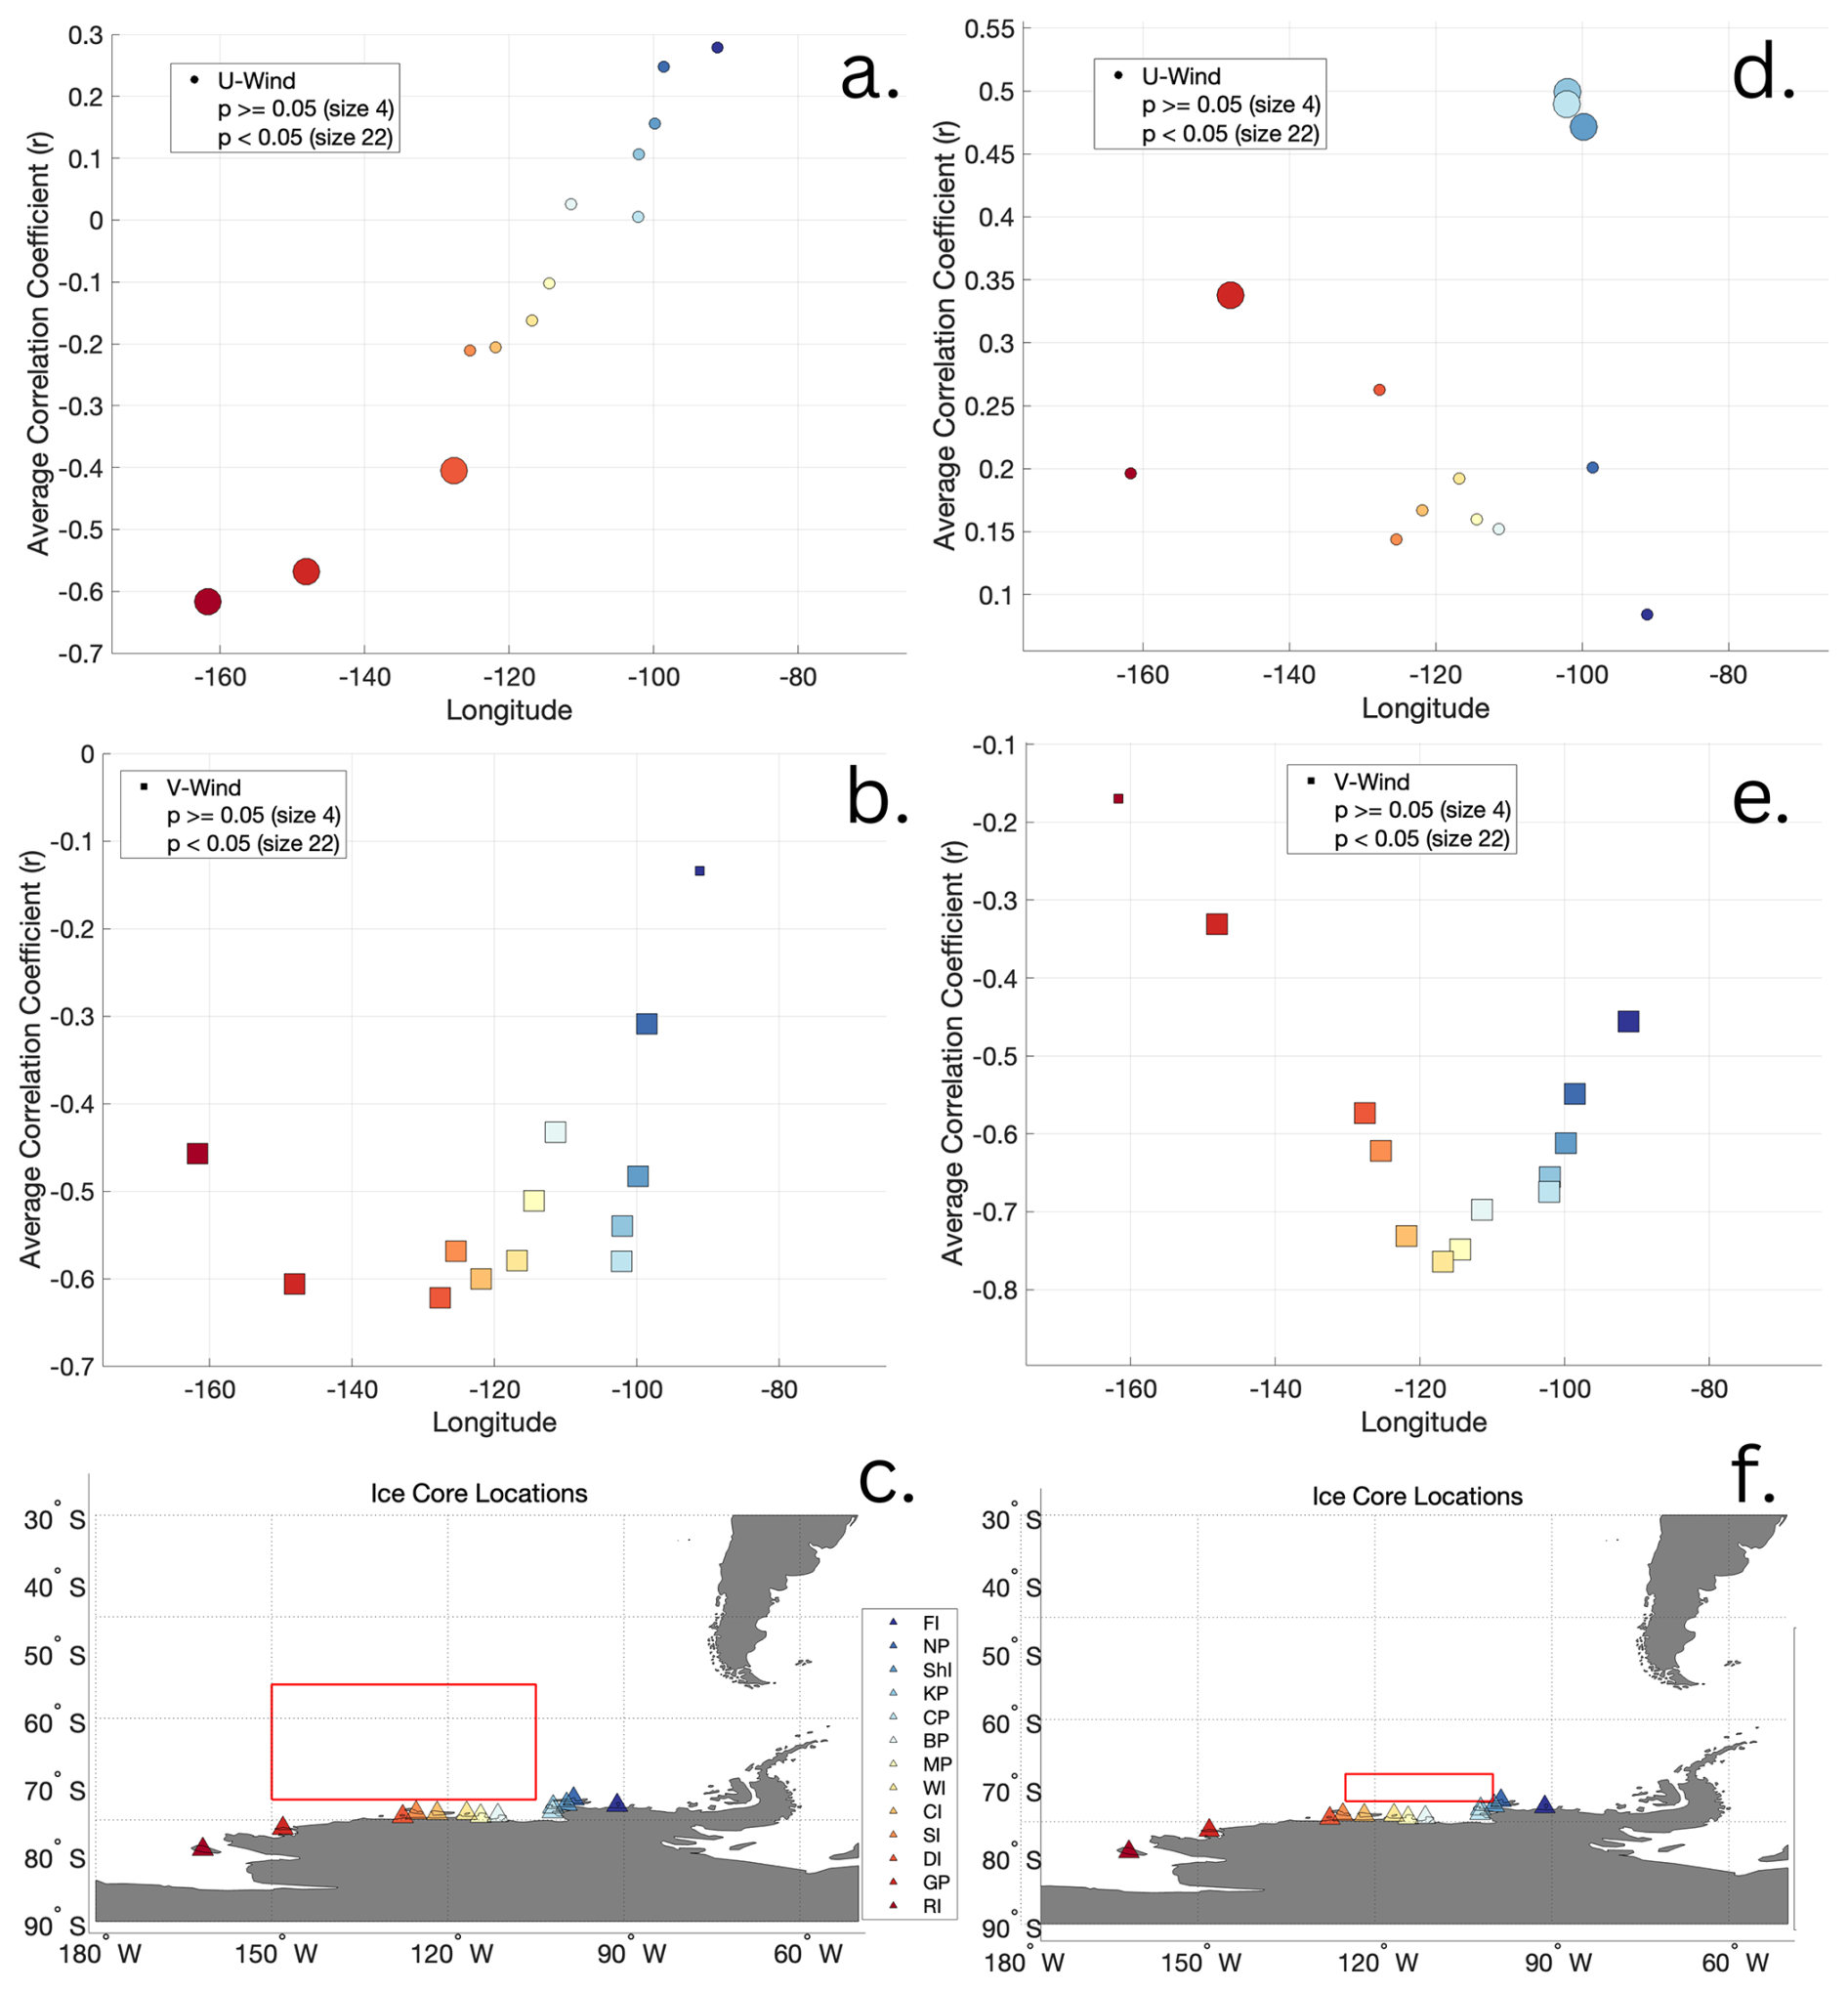
Figure 4Correlation analysis between snowfall and zonal winds and meridional winds within a broad Amundsen Sea box (a–c) and the Steig et al. (2012) coastal box (d–f).
The zonal (U-wind) results over the Amundsen Sea box (Fig. 4a) reveal a clear correlation dipole: West Sector ice rises (Roosevelt Island, Guest Peninsula, and Dean Island) exhibit statistically significant negative correlations with U-wind, while East Sector sites show only insignificant and slightly positive correlations. This result likely reflects the dominance of high-pressure systems during strong zonal wind regimes and broadly mirrors the influence of SAM. During positive SAM phases, westerly winds intensify and shift poleward (Marshall, 2003), promoting high-pressure ridging associated with positive geopotential height anomalies and subsidence over the WAIS coast. This increased atmospheric stability suppresses convection and decreases precipitation, consistent with the negative U-wind correlations observed in Fig. 4a (Hosking et al., 2013; Marshall, 2003).
The strength and spatial coherence of these negative U-wind–precipitation correlations across the West Sector, particularly at Guest Peninsula and Roosevelt Island, suggest that these sites are highly sensitive to changes in Southern Hemisphere westerly wind intensity and position. As such, they represent strong candidates for reconstructing past variability in zonal circulation regimes, including SAM-linked westerly wind behavior, an important signal in Antarctic paleoclimate records. Enhanced westerly winds may also influence local atmospheric stability, potentially suppressing vertical mixing and convection that would otherwise generate precipitation. Their position at the western end of the study region makes Dean Island and Guest Peninsula particularly well-suited for reconstructing broad Southern Hemisphere westerly wind variability, while ice rises positioned closer to specific regions of interest, such as Thwaites Glacier or Pine Island Bay, are better suited to capture more localized atmospheric conditions.
When U-wind is averaged over the more focused S12 box domain (Fig. 4d), the pattern shifts and significant positive zonal correlations appear at East Sector ice rises nearest Pine Island Bay, including Canisteo Peninsula, where ice cores were collected as part of the Ross-Amundsen Ice Core Array (RAICA) initiative in January 2024 (Elliott, 2024). This reversal in significance suggests that under more localized conditions, westerly flow in this narrower band may be associated with enhanced moisture delivery or lifting and precipitation. Additionally, during negative SAM phases, weakened and equatorward-shifted westerlies allow greater cyclonic intrusion and moisture delivery, which may also contribute to the positive U-wind-precipitation relationships observed at ice rises in the Pine Island region (Fig. 4d). The broader Amundsen Sea box (55–72° S, 105–150° W) extends well into the mid-latitude westerly belt where the climatological mean U-wind is positive, so the negative U-wind correlations in Fig. 4a reflect suppression of precipitation by stronger westerlies at West Sector sites. We note that the S12 box averaging approach has limitations near the coast, where the domain may simultaneously capture westerly open-ocean flow and easterly coastal surface winds, potentially complicating the correlation signal; a full spatial correlation analysis would be a more robust approach for disentangling these competing wind directions and represents a natural avenue for future work.
Both West Sector and East Sector sites show negative correlations with meridional wind (V-wind, Fig. 4b–e), indicating that stronger northerly flow (negative V) is associated with drier conditions at the ice rises. Notably, Canisteo Peninsula, Bear Peninsula, Martin Peninsula, Wright Island, and Carney Island exhibit the strongest negative correlations, particularly when V-wind is averaged over the S12 box, suggesting these sites may be especially sensitive to synoptically driven meridional flow. The mean V-wind is northerly (negative) in both the S12 box (−0.11 m s−1) and the broader Amundsen Sea box (−0.39 m s−1), consistent with the negative correlations observed across both sectors. The mechanism linking northerly flow anomalies to precipitation suppression at these coastal sites remains an open question that future ice core records from these locations will be well positioned to address, though the broader regional importance of meridional winds is well established. Recent work by O'Connor et al. (2025) demonstrates that persistent northerly wind anomalies over the Amundsen Sea continental shelf are a key driver of ice shelf melting through their effects on coastal polynya formation and ocean heat transport. Their proxy reconstructions show significant northerly wind trends over the 20th century, highlighting meridional winds as an important component of regional climate variability with implications for outlet glaciers and ice shelves. The strong meridional wind sensitivity we observe at sites like Canisteo Peninsula and other East Sector ice rises positions these locations to potentially record this important atmospheric signal that influences both precipitation patterns and ice-ocean interactions.
We expanded on these interpretations by computing a SAM index based on the zonal mean sea-level pressure difference between 40 and 65° S, following the method of Marshall (2003). The resulting SAM–precipitation correlation map (Fig. 5) closely resembles the patterns seen in our U- and V-wind analyses, reinforcing the conclusion that SAM modulates wind–precipitation coupling, especially in the West Sector. However, as shown by Tsukernik and Lynch (2013), SAM alone cannot explain all meridional moisture transport variability, highlighting the role of transient synoptic systems and localized dynamics in shaping coastal West Antarctic accumulation.
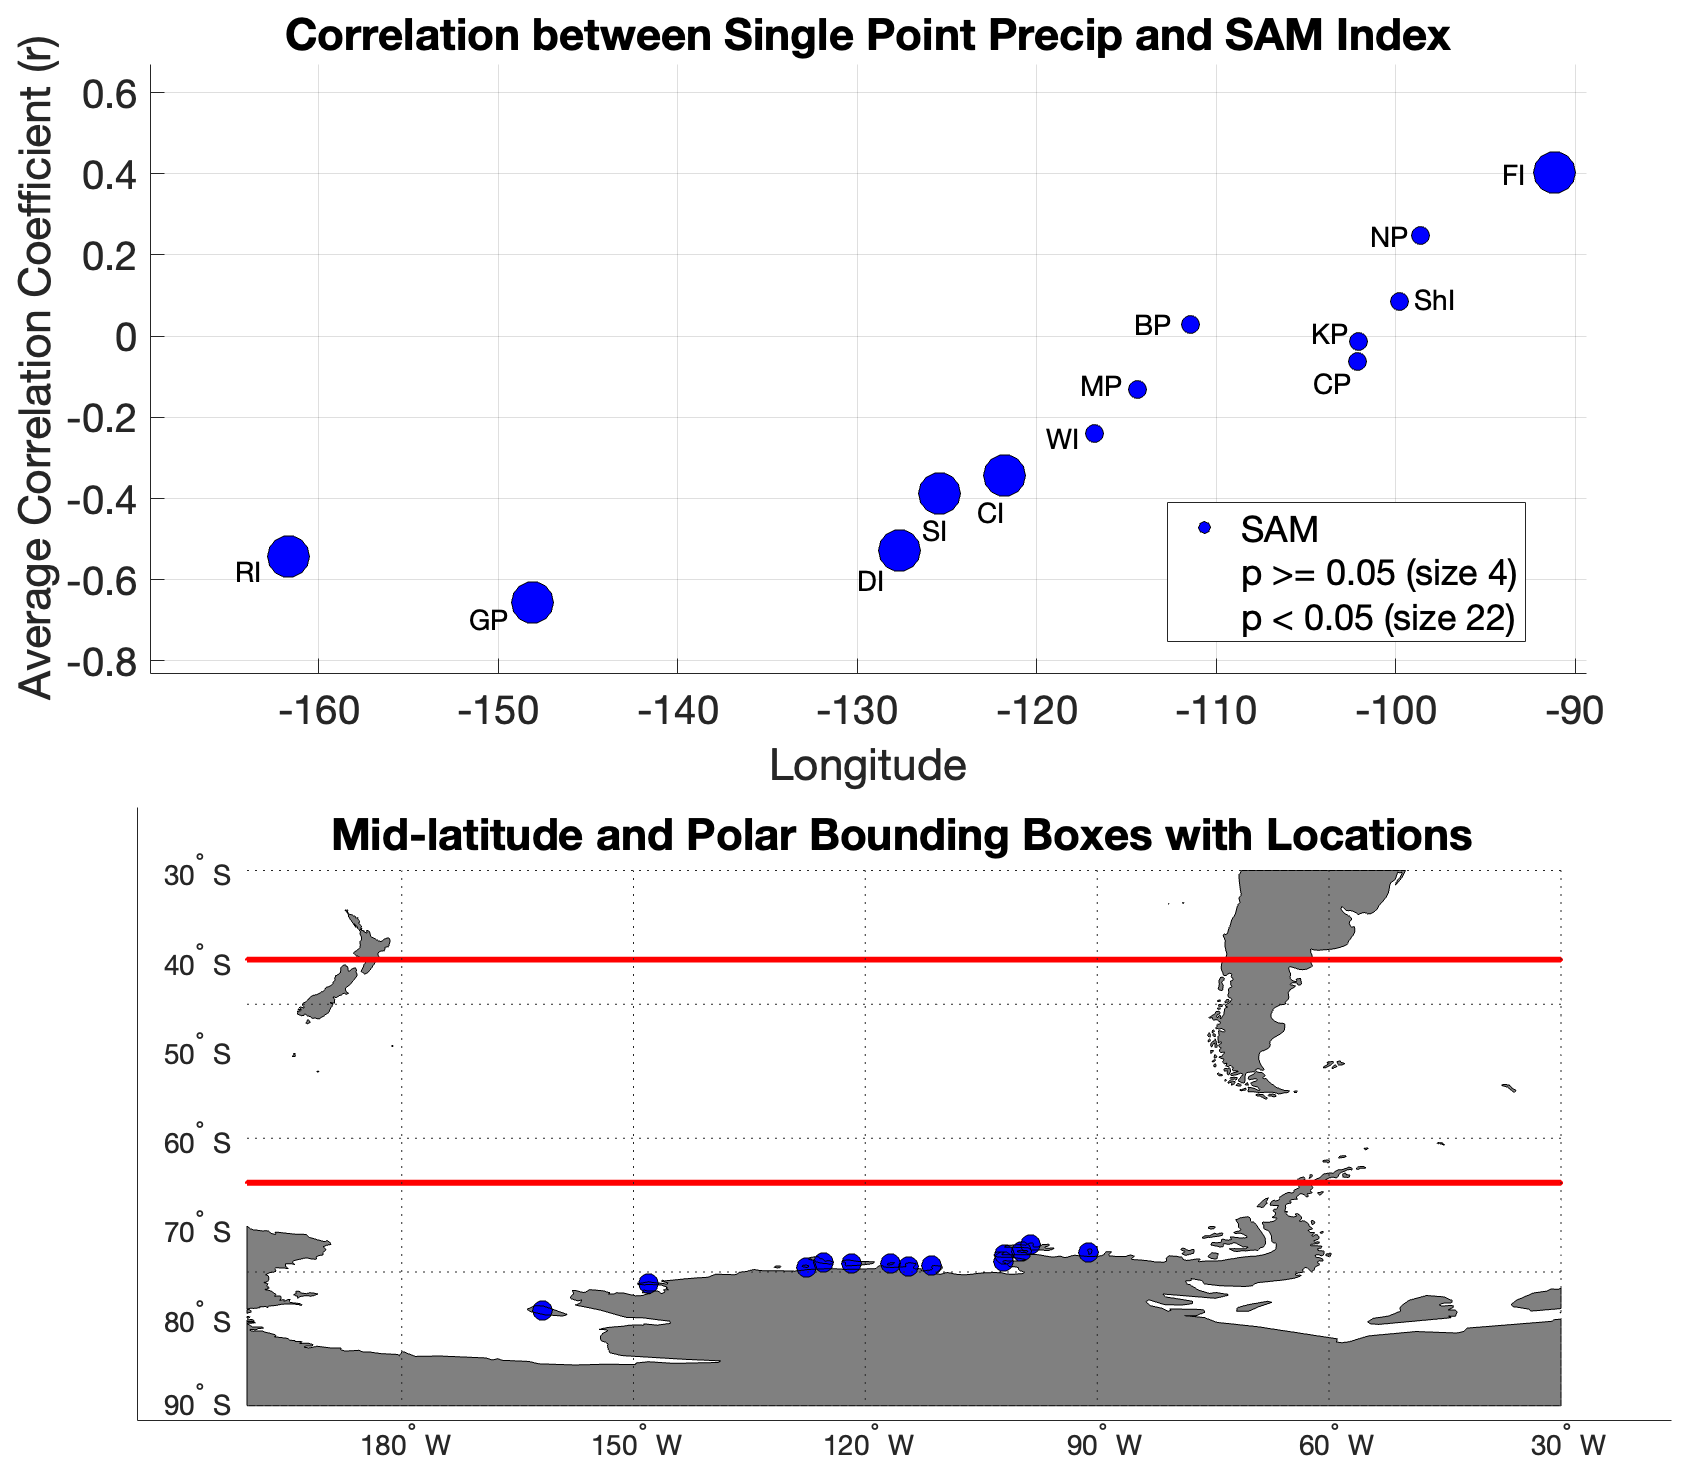
Figure 5Correlation between precipitation at each ice rise and the Southern Annular Mode Index (Marshall, 2003). The index is defined by averaging MSLP across narrow latitude bands centered on −40 and −65° (red lines) and calculating the difference.
3.1.3 Geopotential Height Correlations
Geopotential height indices of the mean sea level pressure (MSL), z850, z500, and z200 reveal how atmospheric variability at different altitudes impacts local precipitation variability at WAIS ice rises. We average these variables over the Amundsen Sea box (55 to 72° S and 105 to 150° W) and find positive correlations between geopotential height at all levels and localized precipitation at ice rises in the West Sector (Fig. 6).
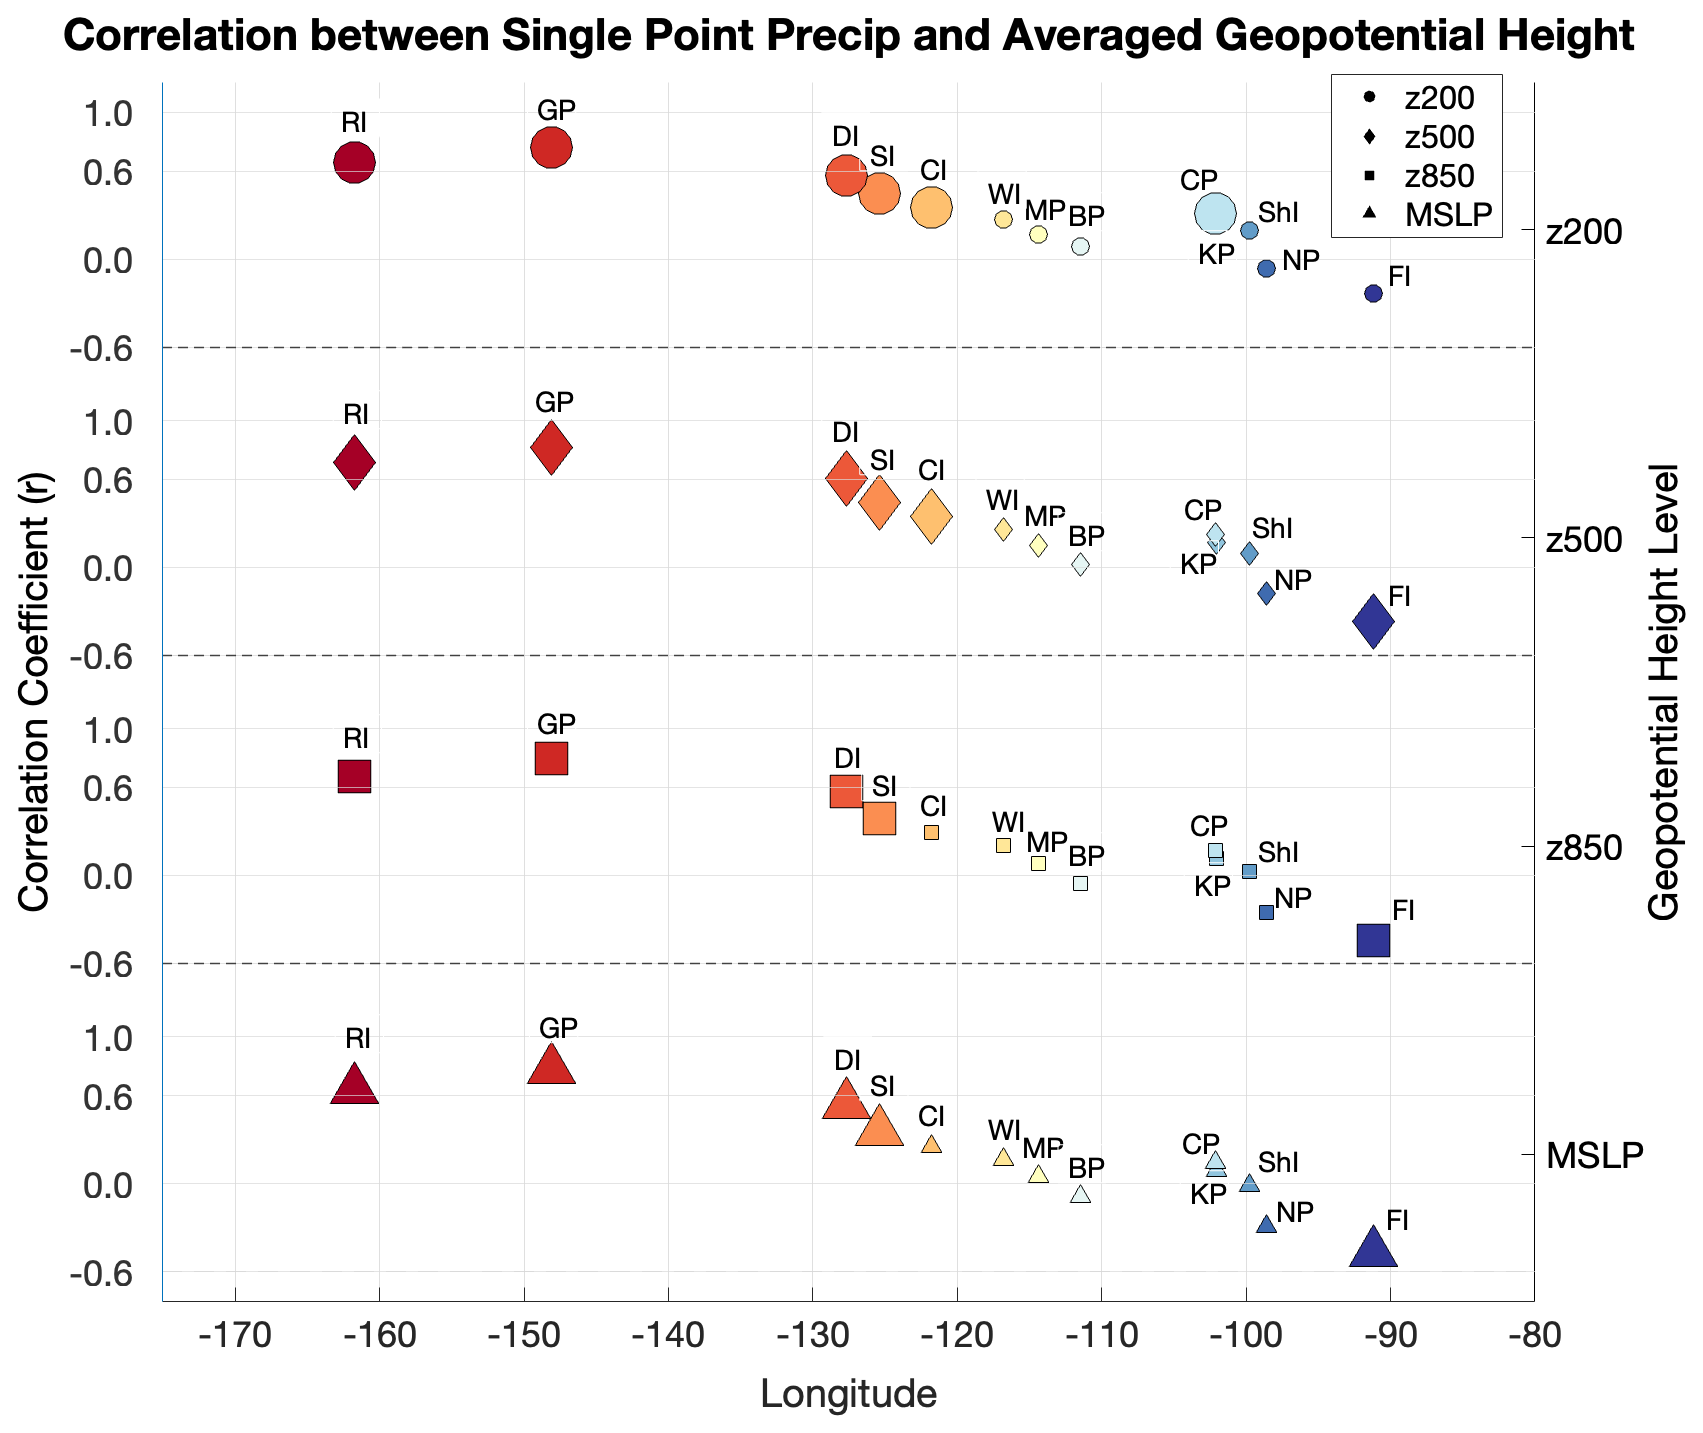
Figure 6Correlation analysis between precipitation at individual ice rises (indicated by the color gradient from red to blue) and geopotential heights (indicated by shape: triangle is mean sea level pressure, square is z850, diamond is z500, and circle is z200) averaged across the broad Amundsen Sea box. Significant correlations (p<0.05) are larger-sized markers.
This strong correlation between geopotential height and precipitation has been identified before, specifically while investigating Atmospheric River (AR) behavior in this region. Maclennan et al. (2023) found that high-pressure systems over the Antarctic Peninsula can act as blocking highs and prevent low-pressure systems and their associated moisture from moving away, similar to previous work (e.g. Emanuelsson et al., 2018). Blocking highs positioned over the Antarctic Peninsula, coupled with low-pressure systems in the Amundsen Sea Low region, redirect ARs to make landfall along the Amundsen Sea Embayment and Marie Byrd Land – the exact longitude of landfall is generally determined by the relative location of the pressure gradient. All surface-to-mid-troposphere correlations weaken moving eastward along the coast towards the Bellingshausen Sea. However, Farwell Island, the easternmost ice rise, has a statistically significant negative correlation with MSLP, z850, and z500. This makes Farwell an intriguing location to reconstruct Bellingshausen Sea pressure variability. The negative correlation between these geopotential heights and precipitation at Farwell suggests that lower geopotential height anomalies are associated with increased precipitation in the Bellingshausen Sea region. We also analyzed MSLP correlations within the ASL index region (170 to 298° E, 80 to 60° S; geographic domain following Hosking et al., 2013) with precipitation at each ice rise (Fig. 7). This regional MSLP average captures the broad pressure field variability associated with ASL activity. Here we see a similar trend to our Amundsen Sea box analysis, with statistically significant and higher correlations along the West Sector and at Farwell Island, further supporting the importance of regional pressure variability for precipitation at these coastal sites.
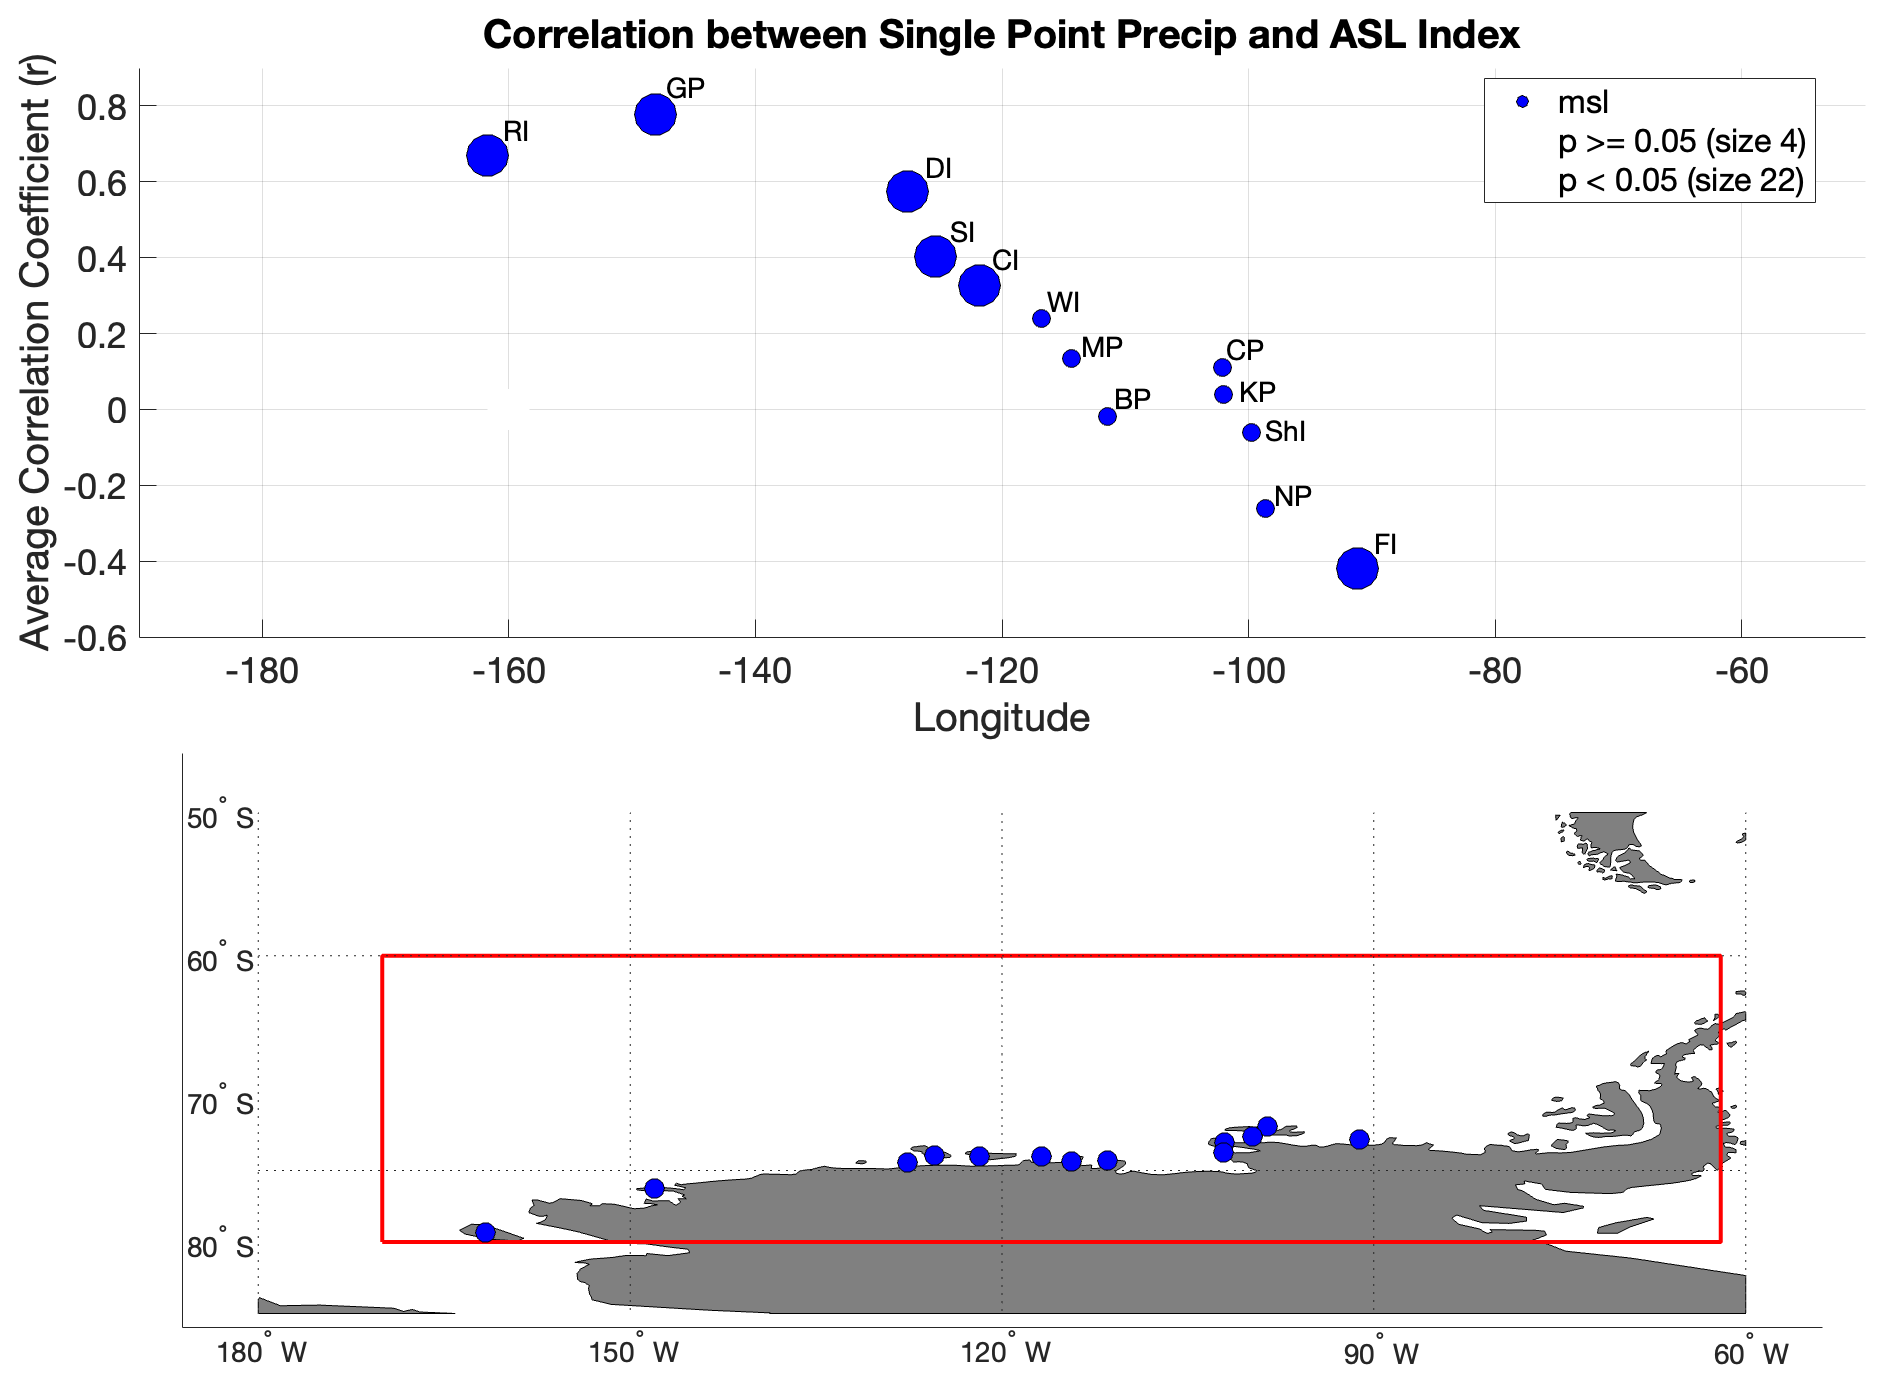
Figure 7Correlation between precipitation at each ice rise and regional MSLP averaged over the Amundsen Sea Low index region (170 to 298° E, 80 to 60° S; Hosking et al., 2013). Marker size indicates statistical significance (p<0.05 for larger markers).
3.1.4 Sea Surface Temperature Correlations
To assess the influence of Pacific Ocean variability on WAIS coastal precipitation, we examine correlations between snowfall and Niño 3.4 sea surface temperature (SST) anomalies in the central tropical Pacific. The Niño 3.4 region (5° N–5° S, 120–170° W) is a widely used SST-based proxy for El Niño-Southern Oscillation (ENSO) variability, capturing oceanic thermal conditions that are closely linked to the coupled ocean-atmosphere processes defining ENSO, but alone it does not represent the full atmosphere-ocean index (Jones et al., 2014; Turner, 2004). SST anomalies in this region have been shown to modulate the strength and position of the Amundsen Sea Low (ASL), Southern Hemisphere westerly wind strength, and other aspects of West Antarctic climate via atmospheric teleconnections (Ding et al., 2011; Turner, 2004). Positive SST anomalies in the Niño 3.4 region (Fig. 8) correspond to El Niño conditions (Trenberth, 1997) and are associated with a weakened ASL, while negative anomalies, corresponding to La Niña, deepen the ASL, enhancing onshore moisture transport toward the WAIS coast (Clem et al., 2016; Fogt et al., 2011). Our results show strong positive precipitation-SST correlations in the West Sector, particularly for the Roosevelt Island and Guest Peninsula sites (Fig. 8). These relationships reflect the West Sector's sensitivity to ENSO-driven atmospheric circulation changes, including the modification of wind patterns and moisture transport toward the WAIS coast (Karoly, 1989; Paolo et al., 2018).
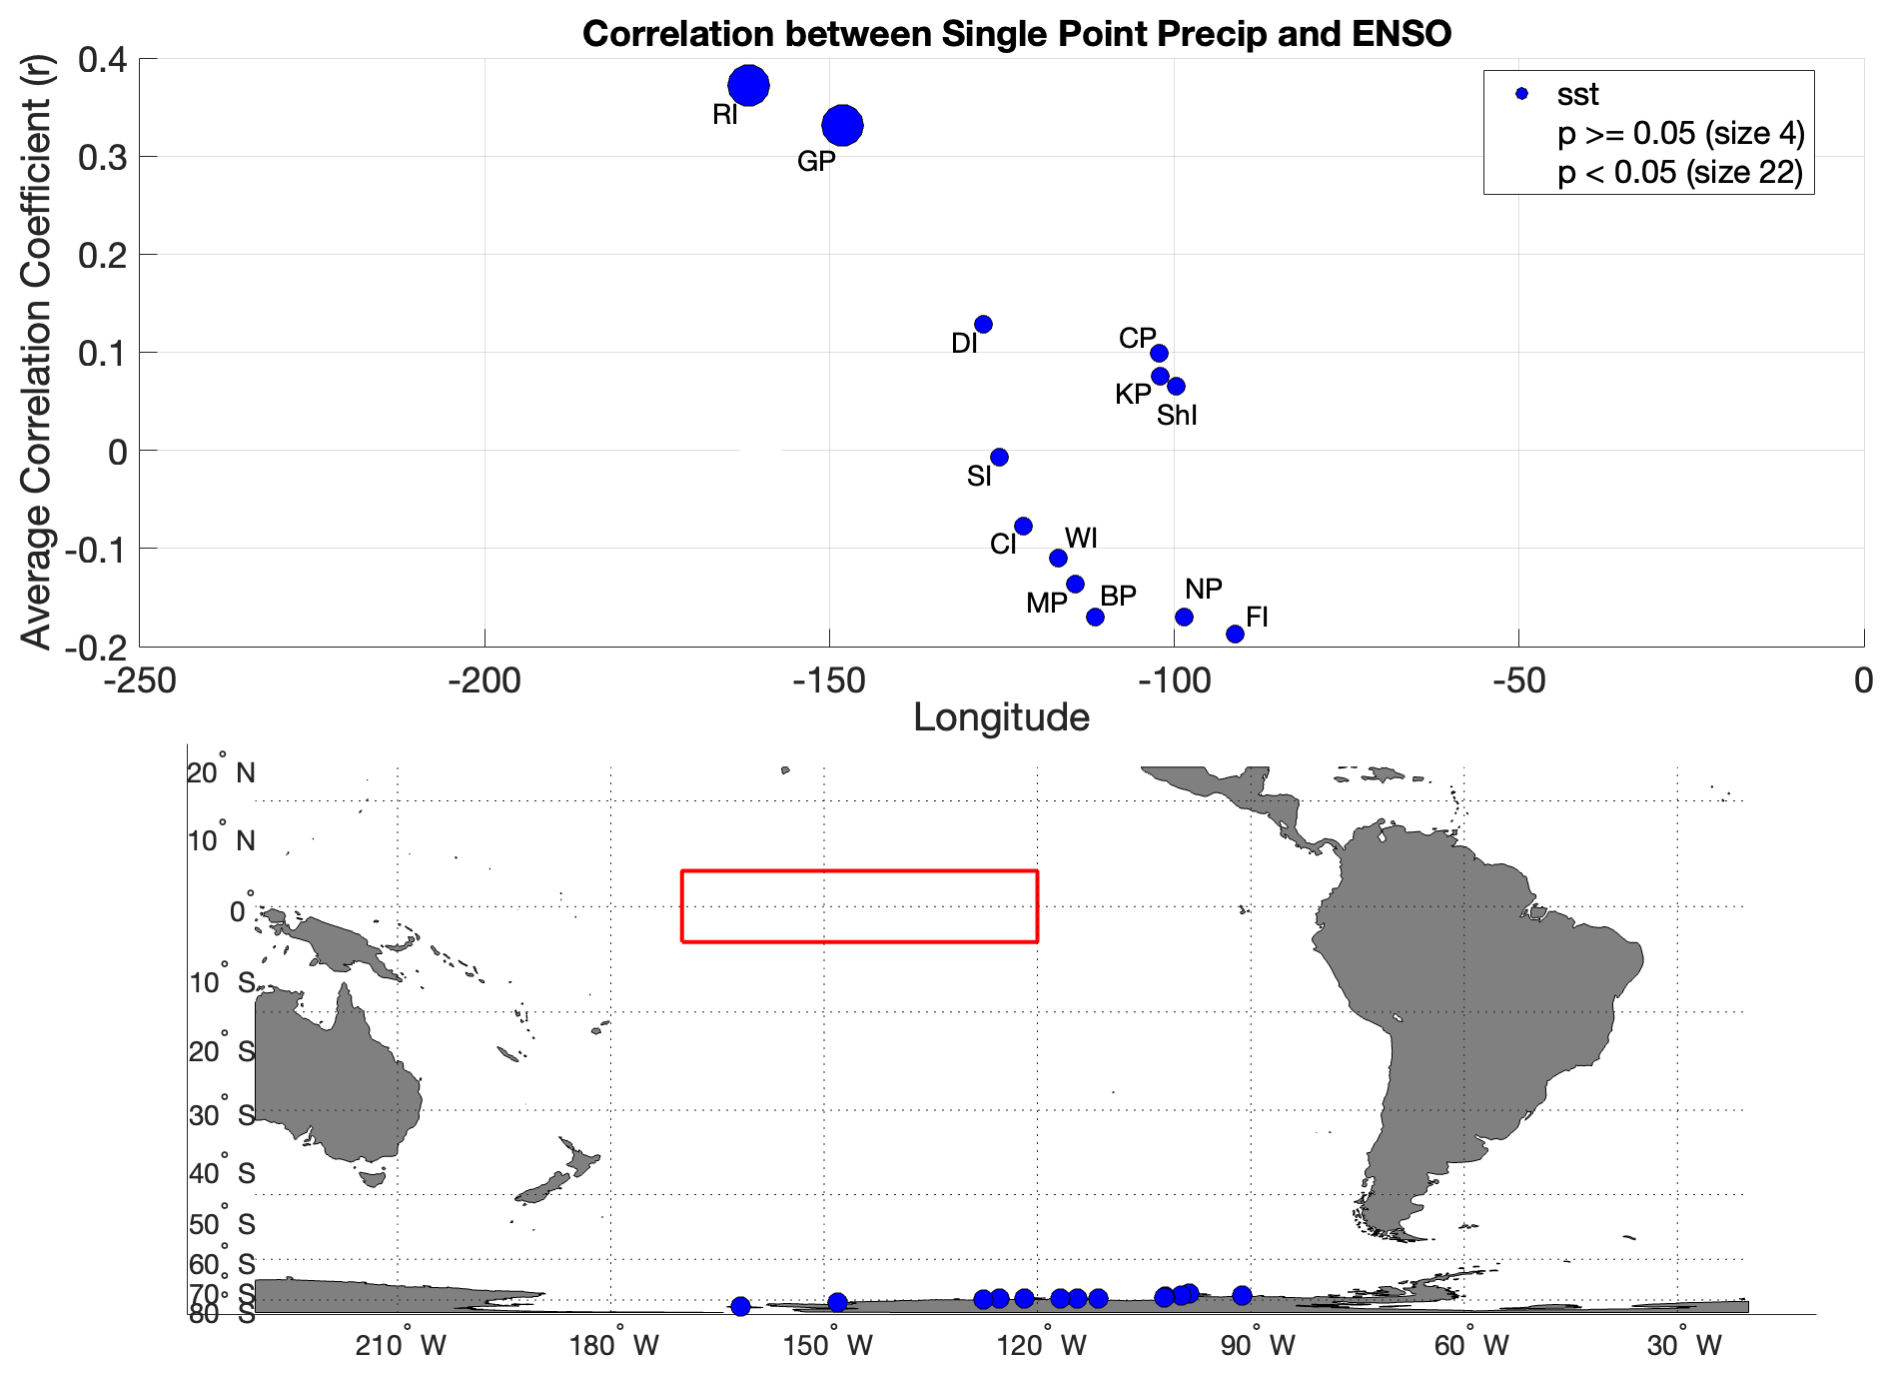
Figure 8Correlation between precipitation at each ice rise and El Niño-Southern Oscillation. The index is defined by averaging SST across the ENSO box bounded by 5° N to 5° S and 120 to 170° W.
In contrast, ice rises in the East Sector exhibit weak and not statistically significant correlations with Niño 3.4 SST, suggesting more localized atmospheric processes dominate precipitation variability there, including Bellingshausen Sea pressure variability and the relative positioning of high- and low-pressure systems in the Amundsen Sea region (Fig. 8). This spatial pattern supports previous findings by Thomas et al. (2013), who showed that interannual variability at the Ferrigno (F10) ice core site (on the ice divide between the Ferrigno and Pine Island Glaciers in Ellsworth Land, West Antarctica, nearest to Farwell Island ice rise) was poorly correlated with ENSO indices. Instead, they linked precipitation variability to subtropical SST anomalies in the South Pacific Convergence Zone (SPCZ), consistent with different teleconnection mechanisms (Bromwich et al., 2013). Together, these results emphasize the heterogeneous influences of tropical Pacific Ocean SST on snowfall along the WAIS coast as seen in ERA5: large-scale ENSO-driven atmospheric circulation changes play a statistically significant role in modulating snowfall in the West Sector, while eastern sites are influenced by a more complex combination of processes, possibly including subtropical interactions outside the canonical tropical ENSO framework.
3.1.5 Sea Ice Concentrations
Sea ice concentration (SIC) variability along the WAIS coast serves as an indicator of large-scale atmospheric circulation, particularly SAM, ENSO, and the Atlantic Multidecadal Oscillation (AMO), which also modulate precipitation and surface conditions across seasonal to decadal timescales (Kohyama and Hartmann, 2016). SIC is also shaped by wind-driven dynamic transport, atmospheric thermal advection, and oceanic currents (Holland and Kwok, 2012; Schwanck et al., 2017). Coastal ice rises themselves can also influence local sea ice distributions by altering wind flow, sometimes supporting coastal polynyas on their western flanks and multi-year land-fast ice on the eastern side (Matsuoka et al., 2015).
To assess the relationship between sea ice and WAIS ice rise snowfall, we correlate 1979–2022 averaged ERA5 SIC with precipitation at each of the 13 ice rise locations. SIC values are averaged over a bounding box spanning the eastern Amundsen Sea sector (68–72° S, 100–125° W), consistent with the domain used for wind and SST analyses (Sect. 2.3). We find that ice rises in the West Sector exhibit strong, statistically significant negative correlations between precipitation and SIC, particularly near Guest Peninsula, the westernmost WAIS ice rise located at the northern margin of Sulzberger Ice Shelf near the Ford Ranges. In contrast, East Sector sites such as Noville and Farwell ice rises show weak or insignificant correlations. This spatial pattern again highlights the West Sector's stronger coupling to synoptic-scale atmospheric dynamics, especially the Amundsen Sea Low (ASL), which governs much of the heat and moisture advection into the region. The similarity between SIC–precipitation correlations and wind field patterns (Sect. 3.1.2) underscores the interconnectedness of ocean–atmosphere processes in this region.
In particular, the ice rises in the West Sector offer a strong observational window into regional sea ice variability. For example, Dean Island shows a pronounced negative correlation between local precipitation and sea ice concentration immediately offshore in the Amundsen Sea (Fig. 9b), indicating that ice core–derived precipitation variability may capture dynamic interactions between the ocean–atmosphere system. In contrast, sites in the East Sector, such as King Peninsula, show much weaker and more spatially diffuse correlations with SIC (Fig. 9a), suggesting limited coupling between local accumulation and sea ice anomalies in that region. This spatial gradient highlights the potential for more reliable sea ice reconstructions from West Sector ice rise ice core sites, where precipitation is more directly modulated by atmospheric circulation patterns like the ASL, and where regional sea ice is more sensitive to variability in wind and heat transport.
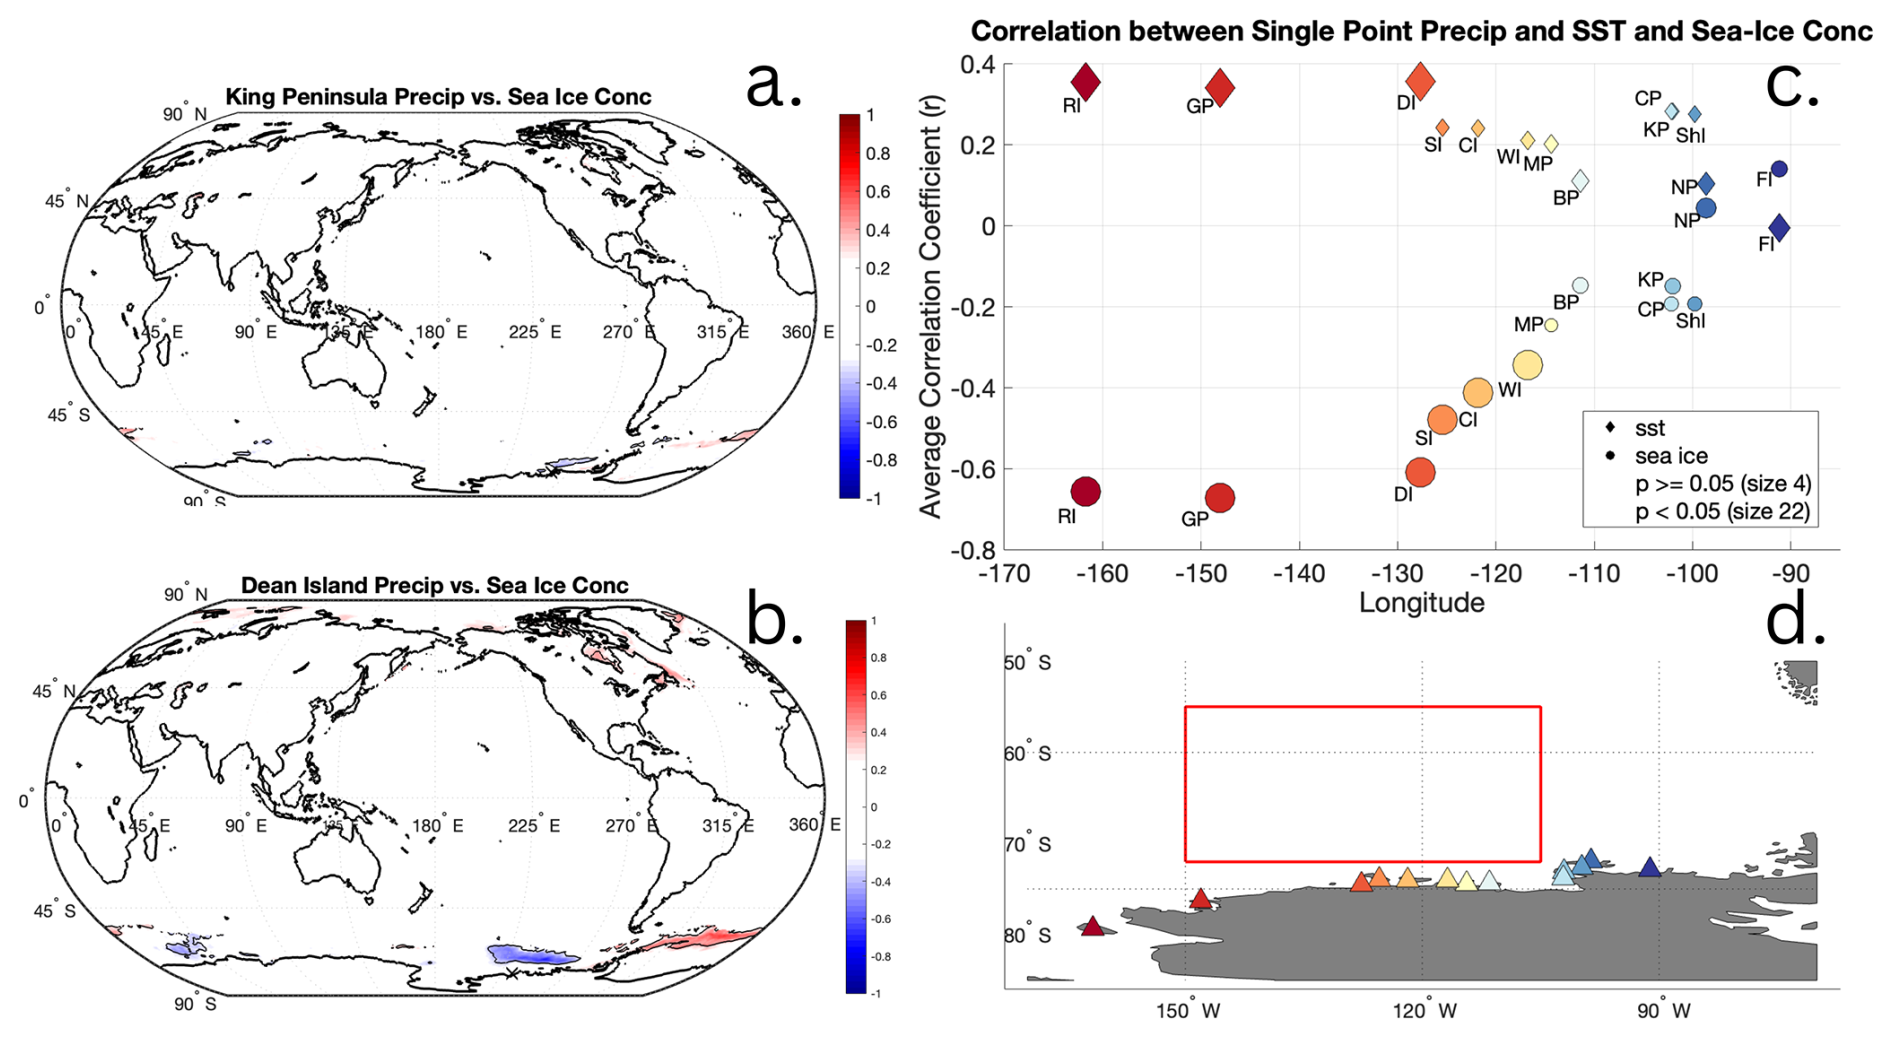
Figure 9Sea surface temperature and sea ice concentration comparison. (a, b) Correlation between precipitation at each ice rise and global sea ice concentration at King Peninsula (a) and Dean Island (b). (c) Correlation between precipitation at each ice rise and sea surface temperature (SST, diamond) as well as sea ice concentration (SIC, circle) averaged over the Amundsen Sea box (d).
In contrast, precipitation covaries positively with sea surface temperatures (SST) in the same Amundsen Sea box (Fig. 9c and d). Higher SSTs here are associated with increased precipitation and decreased SIC, reflecting possible enhanced ocean–atmosphere coupling, when warmer ocean surfaces promote atmospheric instability, increased evaporation, and moisture flux toward the WAIS coast (Steig et al., 2012). Lower SSTs, on the other hand, reflect more stable conditions with colder and weaker ocean-atmosphere coupling, suppressed precipitation, and increased SIC.
Coastal ice rises along the West Antarctic Ice Sheet (WAIS) are ideal locations to record key climate variability driven by dynamic ice, ocean, and atmosphere interactions. From glaciological and climatological perspectives, their preservation of high snow accumulation rates and exposure to marine and atmospheric influences make ice rises valuable sites for future ice core drilling and paleoclimate reconstruction (Steig and Neff, 2018; Neff, 2020). Despite the scarcity of direct ground observations at WAIS ice rises, this study leverages ERA5 and MERRA-2 reanalysis datasets to assess the climate drivers of precipitation variability across the WAIS coast from 1979 to 2022.
Our results demonstrate that interannual snowfall variability at these sites is strongly influenced by major climate drivers and indices, including ENSO, SAM, ASL, and regional wind fields. SAM and ENSO modulate both zonal (U-wind) and meridional (V-wind) circulation patterns across the Amundsen Sea sector, and these in turn control moisture delivery and precipitation. For instance, SAM–precipitation correlations extend across nearly all West Sector sites, from Roosevelt Island to Carney Island, highlighting their potential to reconstruct Southern Hemisphere westerly wind variability. Additionally, strong and consistent negative correlations with V-wind across all sites demonstrate that each ice rise is sensitive to meridional flow from the north, the primary direction of moisture transport.
Looking at how these correlations evolve across the coast, clear spatial distinctions emerge between West and East Sector ice rises. In the West Sector, sites such as Roosevelt Island, Guest Peninsula, and Dean Island exhibit strong positive correlations between precipitation and SST, and strong negative correlations with SIC, reflecting a dynamic feedback in which reduced sea ice and warmer ocean surfaces enhance atmospheric moisture availability and snowfall. These sites also exhibit strong negative correlations with U-wind in the broader Amundsen Sea box, consistent with the influence of SAM and ASL-driven subsidence during periods of strong westerlies. Guest Peninsula shows especially strong precipitation–SIC and wind relationships, suggesting strong potential for reconstructing broader circulation regimes, including the Southern Hemisphere westerlies and Amundsen Sea conditions. This finding represents a significant step toward developing paleoclimate records of broad-scale westerly wind behavior, a key component of Antarctic climate variability.
In the East Sector, Canisteo Peninsula and neighboring ice rises in the Pine Island Bay region show significant positive correlations between U-wind and precipitation when averaged over the S12 box – a region chosen for its possible significance in wind-driven advection of CDW onto the Antarctic continental shelf. This contrasts with the more common negative correlations westward and suggests that these sites are uniquely positioned to record zonal wind variability at Thwaites and Pine Island glaciers within this narrower sector. These Pine Island Bay ice rises also exhibit strong sensitivity to meridional winds, which recent work has identified as important drivers of regional ice-ocean interactions (O'Connor et al., 2025), highlighting the value of recently collected ice cores at Canisteo Peninsula (Elliott, 2024; Neff, unpublished). This dual sensitivity to both zonal and meridional wind variability positions these sites as particularly valuable for reconstructing the atmospheric conditions that influence precipitation patterns as well as broader ice sheet dynamics in this critical region. Further east, Farwell Island stands out for its significant negative correlation with 500 hPa geopotential height, indicating sensitivity to Bellingshausen Sea pressure variability, a key regional pressure system affecting snowfall. Unlike West Sector sites, East Sector ice rises show weaker connections to ENSO and SST/SIC, suggesting a stronger influence from localized synoptic-scale pressure and wind variability.
Underpinning each of these spatial patterns, ERA5 precipitation serves as a robust proxy for interannual SMB variability at all sites. This is supported by the negligible role of non-precipitation SMB terms at these high-accumulation, elevated coastal locations, confirmed by the near-unity correlations (r=0.987–0.999) between annual precipitation and P−E at all 13 sites, and by modeled and satellite-based evidence that surface melt is minimal at grounded ice rises in this region (Lenaerts et al., 2018; Trusel et al., 2013). Evaluating absolute SMB magnitudes and site-specific surface processes using regional climate models such as RACMO (van Dalum et al., 2025) or MAR (Agosta et al., 2019) represents a valuable next step for extending the framework developed here.
Taken together, these results confirm that WAIS coastal ice rises serve as spatially distributed, climatically sensitive archives. Their relationships with westerly winds, meridional moisture transport, sea ice extent, and geopotential height anomalies strengthen the value of a multi-site approach. Future ice core records from these ice rises hold significant potential for reconstructing past variability in ocean-atmosphere circulation relevant to the broader Amundsen Sea sector and the stability of outlet glaciers such as Pine Island and Thwaites.
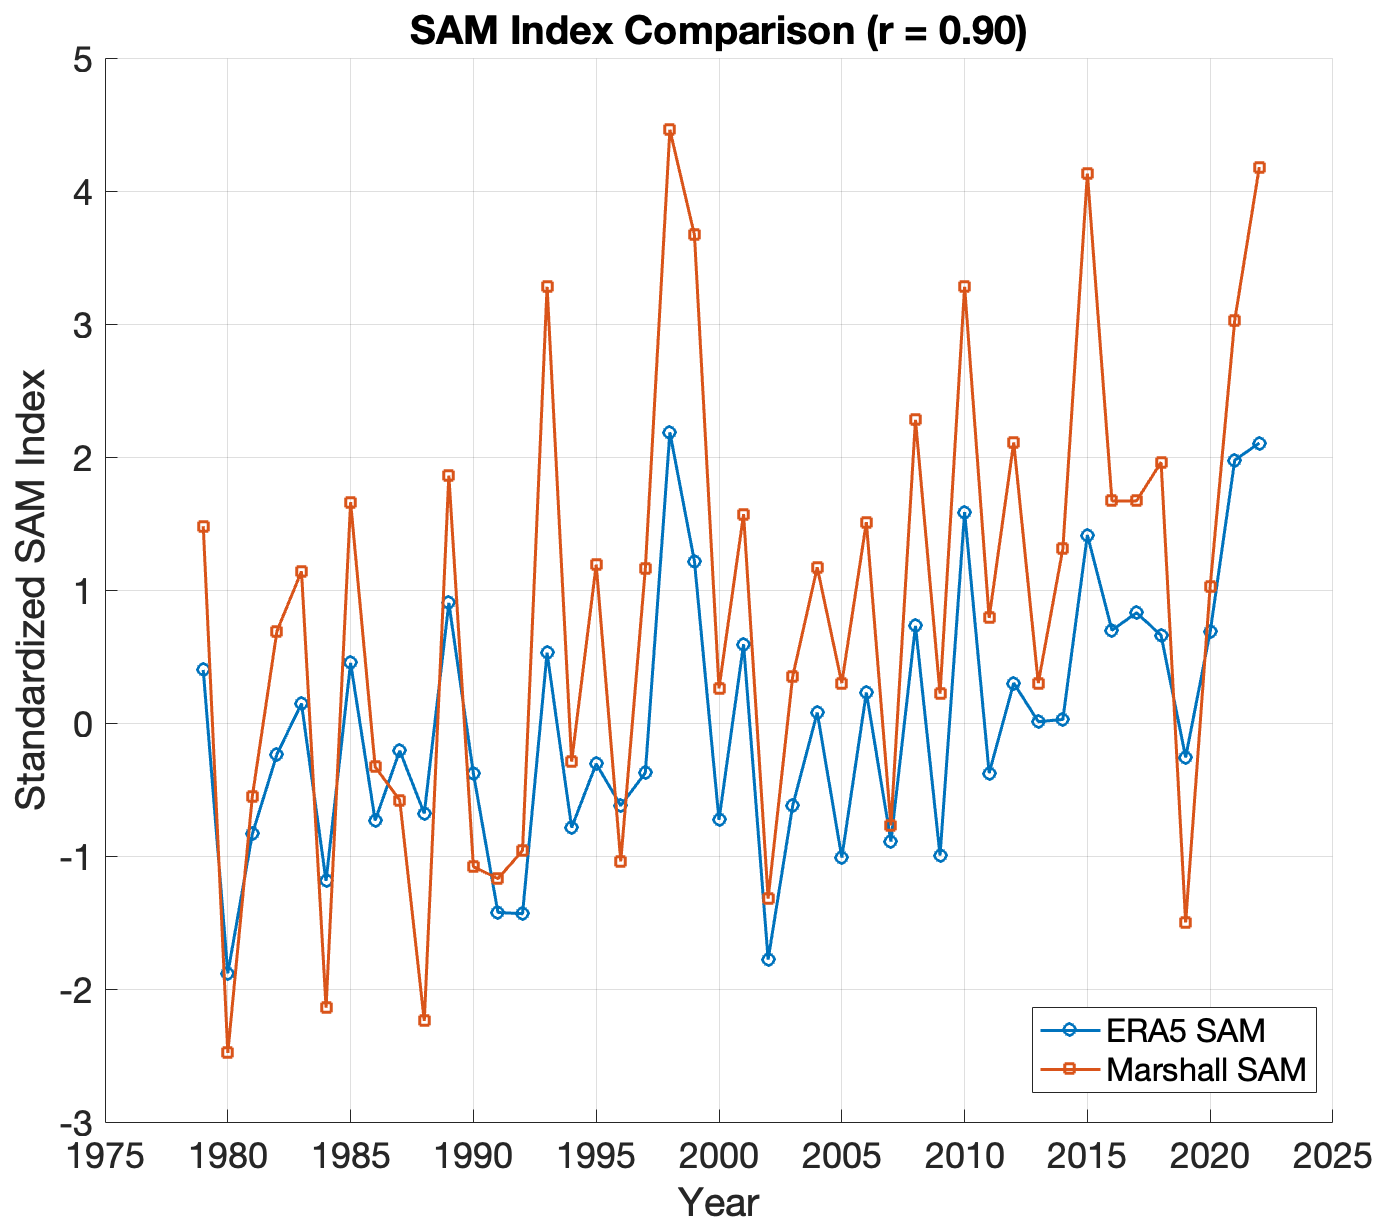
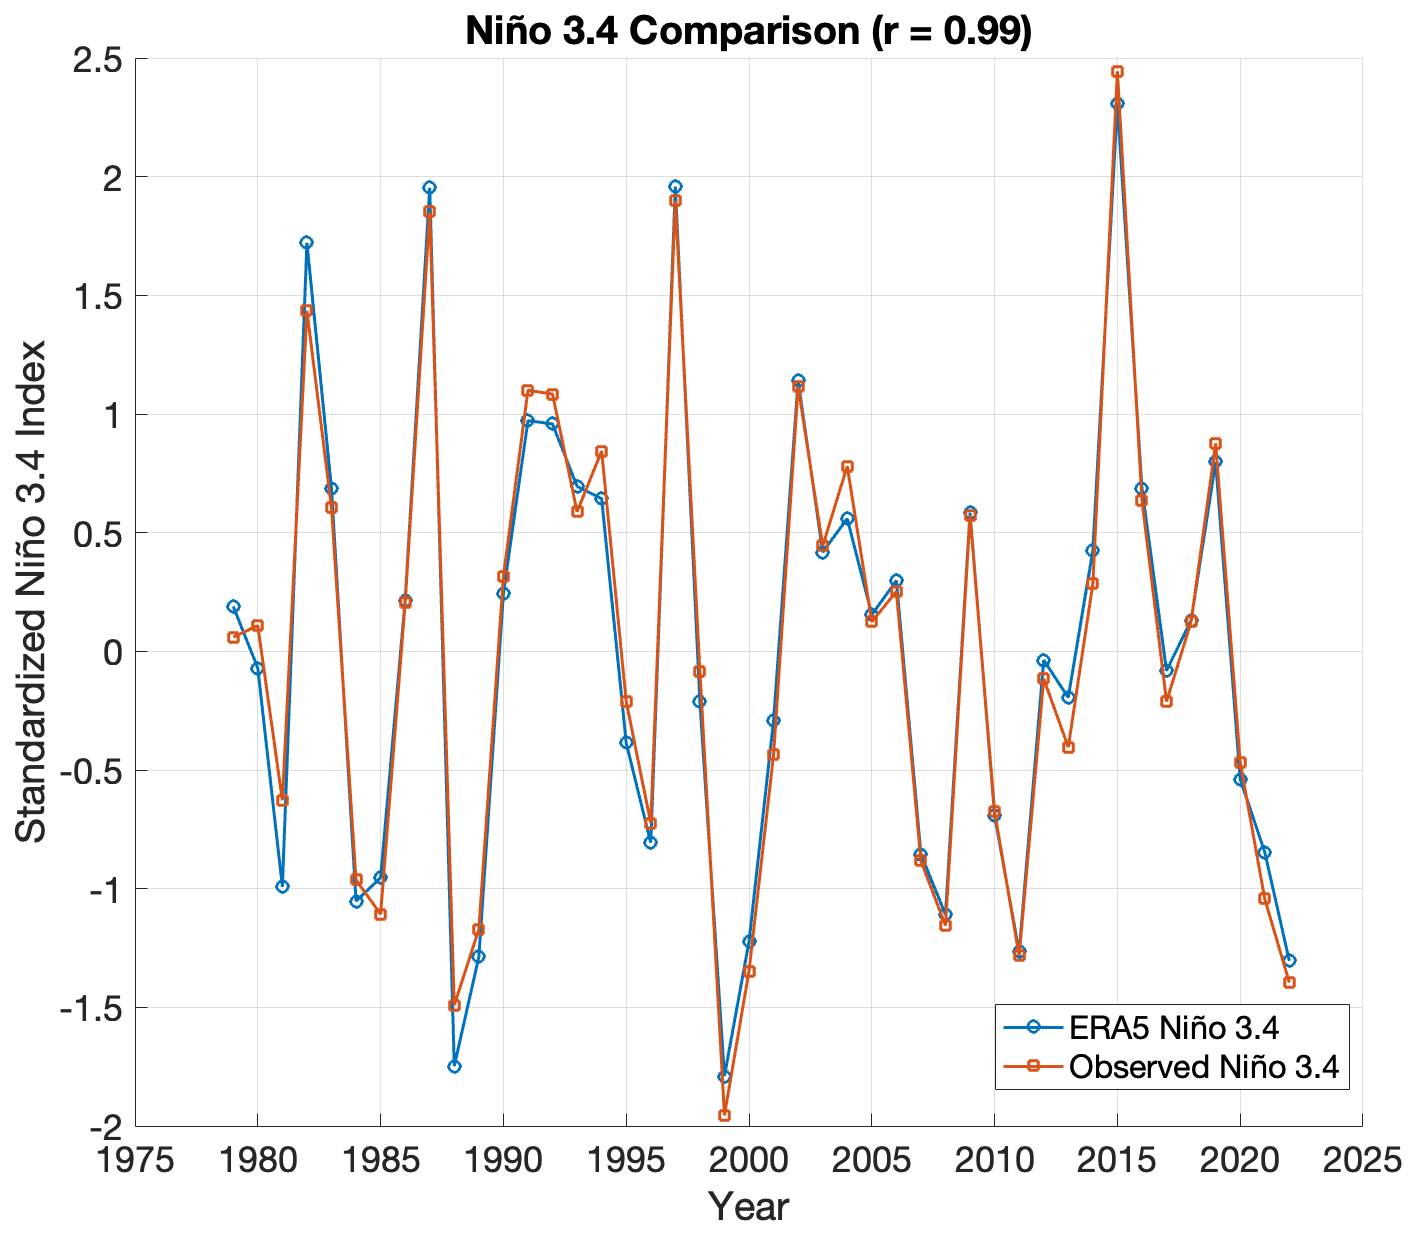
The Marshall (2003) SAM index used for Fig. A1 validation is available from the British Antarctic Survey at https://legacy.bas.ac.uk/met/gjma/sam.html (last access: 15 July 2025). The observed Niño 3.4 index used for Fig. A2 validation is from the NCAR Climate Data Guide (Trenberth, 2025). ERA5-derived fields are available through the Copernicus Climate Data Store (Copernicus Climate Change Service, Climate Data Store, https://doi.org/10.24381/cds.adbb2d47). All additional raw data can be provided by the corresponding authors upon request.
JRA and PDN planned the research; JRA led the data analysis and made the figures, with support from PDN; JRA wrote the manuscript draft; JRA and PDN reviewed and edited the manuscript.
The contact author has declared that neither of the authors has any competing interests.
Publisher's note: Copernicus Publications remains neutral with regard to jurisdictional claims made in the text, published maps, institutional affiliations, or any other geographical representation in this paper. The authors bear the ultimate responsibility for providing appropriate place names. Views expressed in the text are those of the authors and do not necessarily reflect the views of the publisher.
This work was led by Julia R. Andreasen while at the University of Alaska Fairbanks' International Arctic Research Center and the University of Minnesota's Department of Soil, Water, and Climate. The authors gratefully acknowledge the European Centre for Medium-Range Weather Forecasts (ECMWF) for producing the ERA5 reanalysis dataset, made available through the Copernicus Climate Data Store, as well as NASA's Global Modeling and Assimilation Office (GMAO) for producing the MERRA-2 reanalysis dataset. We also acknowledge the field and logistical support provided through the Ross–Amundsen Ice Core Array (RAICA) initiative, which facilitated ice-core recovery at the Canisteo Peninsula and contributed to the broader research context motivating this study. Lastly, we acknowledge the use of institutional computing resources at the University of Minnesota, as well as the broader research infrastructure supporting reanalysis production and distribution.
Julia R. Andreasen was supported by the NASA Future Investigators in NASA Earth and Space Science and Technology (FINESST) Award (grant no. 80NSSC21K1615). Julia R. Andreasen and Peter D. Neff were supported by the RAICA project with funding from the National Science Foundation Office of Polar Programs (Award 2304836).
This paper was edited by Lei Geng and reviewed by two anonymous referees.
Agosta, C., Amory, C., Kittel, C., Orsi, A., Favier, V., Gallée, H., van den Broeke, M. R., Lenaerts, J. T. M., van Wessem, J. M., van de Berg, W. J., and Fettweis, X.: Estimation of the Antarctic surface mass balance using the regional climate model MAR (1979–2015) and identification of dominant processes, The Cryosphere, 13, 281–296, https://doi.org/10.5194/tc-13-281-2019, 2019.
Assmann, K. M., Hellmer, H. H., and Jacobs, S. S.: Amundsen Sea ice production and transport, J. Geophys. Res., 110, https://doi.org/10.1029/2004jc002797, 2005.
Bamber, J. L., Riva, R. E. M., Vermeersen, B. L. A., and LeBrocq, A. M.: Reassessment of the Potential Sea-Level Rise from a Collapse of the West Antarctic Ice Sheet, Science, 324, 901–903, https://doi.org/10.1126/science.1169335, 2009.
Bamston, A. G., Chelliah, M., and Goldenberg, S. B.: Documentation of a highly ENSO-related sst region in the equatorial pacific: Research note, Atmosphere-Ocean, 35, 367–383, https://doi.org/10.1080/07055900.1997.9649597, 1997.
Banta, J. R., McConnell, J. R., Frey, M. M., Bales, R. C., and Taylor, K.: Spatial and temporal variability in snow accumulation at the West Antarctic Ice Sheet Divide over recent centuries, J. Geophys. Res., 113, https://doi.org/10.1029/2008jd010235, 2008.
Bindschadler, R., Vornberger, P., Fleming, A., Fox, A., Mullins, J., Binnie, D., Paulsen, S., Granneman, B., and Gorodetzky, D.: The Landsat Image Mosaic of Antarctica, Remote Sens. Environ., 112, 4214–4226, https://doi.org/10.1016/j.rse.2008.07.006, 2008.
Bromwich, D. H., Fogt, R. L., Hodges, K. I., and Walsh, J. E.: A tropospheric assessment of the ERA-40, NCEP, and JRA-25 global reanalyses in the polar regions, J. Geophys. Res., 112, 2006JD007859, https://doi.org/10.1029/2006JD007859, 2007.
Bromwich, D. H., Nicolas, J. P., Monaghan, A. J., Lazzara, M. A., Keller, L. M., Weidner, G. A., and Wilson, A. B.: Central West Antarctica among the most rapidly warming regions on Earth, Nat. Geosci., 6, 139–145, https://doi.org/10.1038/ngeo1671, 2013.
Bromwich, D. H., Ensign, A., Wang, S., and Zou, X.: Major Artifacts in ERA5 2-m Air Temperature Trends Over Antarctica Prior to and During the Modern Satellite Era, Geophys. Res. Lett., 51, https://doi.org/10.1029/2024gl111907, 2024.
Clem, K. R., Renwick, J. A., McGregor, J., and Fogt, R. L.: The relative influence of ENSO and SAM on Antarctic Peninsula climate, J. Geophys. Res.-Atmos., 121, 9324–9341, https://doi.org/10.1002/2016jd025305, 2016.
Cook, A. J., Holland, P. R., Meredith, M. P., Murray, T., Luckman, A., and Vaughan, D. G.: Ocean forcing of glacier retreat in the western Antarctic Peninsula, Science, 353, 283–286, https://doi.org/10.1126/science.aae0017, 2016.
Copernicus Climate Change Service, Climate Data Store: ERA5 hourly data on single levels from 1940 to present, Copernicus Climate Change Service (C3S) Climate Data Store (CDS) [data set], https://doi.org/10.24381/cds.adbb2d47, 2023.
Criscitiello, A. S., Das, S. B., Karnauskas, K. B., Evans, M. J., Frey, K. E., Joughin, I., Steig, E. J., McConnell, J. R., and Medley, B.: Tropical Pacific Influence on the Source and Transport of Marine Aerosols to West Antarctica, J. Climate, 27, 1343–1363, https://doi.org/10.1175/jcli-d-13-00148.1, 2014.
Dalaiden, Q., Goosse, H., Rezsöhazy, J., and Thomas, E. R.: Reconstructing atmospheric circulation and sea-ice extent in the West Antarctic over the past 200 years using data assimilation, Clim. Dynam., 57, 3479–3503, https://doi.org/10.1007/s00382-021-05879-6, 2021.
Dansgaard, W., Johnsen, S. J., Møller, J., and Langway, C. C.: One Thousand Centuries of Climatic Record from Camp Century on the Greenland Ice Sheet, Science, 166, 377–381, https://doi.org/10.1126/science.166.3903.377, 1969.
Ding, Q., Steig, E. J., Battisti, D. S., and Küttel, M.: Winter warming in West Antarctica caused by central tropical Pacific warming, Nat. Geosci., 4, 398–403, https://doi.org/10.1038/ngeo1129, 2011.
Dutrieux, P., De Rydt, J., Jenkins, A., Holland, P. R., Ha, H. K., Lee, S. H., Steig, E. J., Ding, Q., Abrahamsen, E. P., and Schröder, M.: Strong Sensitivity of Pine Island Ice-Shelf Melting to Climatic Variability, Science, 343, 174–178, https://doi.org/10.1126/science.1244341, 2014.
Elliott, C.: Drilling on the edge, Science, 384, 262–266, https://doi.org/10.1126/science.ziof373, 2024.
Emanuelsson, B. D., Bertler, N. A. N., Neff, P. D., Renwick, J. A., Markle, B. R., Baisden, W. T., and Keller, E. D.: The role of Amundsen–Bellingshausen Sea anticyclonic circulation in forcing marine air intrusions into West Antarctica, Clim. Dynam., 51, 3579–3596, https://doi.org/10.1007/s00382-018-4097-3, 2018.
Fogt, R. L., Bromwich, D. H., and Hines, K. M.: Understanding the SAM influence on the South Pacific ENSO teleconnection, Clim. Dynam., 36, 1555–1576, https://doi.org/10.1007/s00382-010-0905-0, 2011.
Fretwell, P., Pritchard, H. D., Vaughan, D. G., Bamber, J. L., Barrand, N. E., Bell, R., Bianchi, C., Bingham, R. G., Blankenship, D. D., Casassa, G., Catania, G., Callens, D., Conway, H., Cook, A. J., Corr, H. F. J., Damaske, D., Damm, V., Ferraccioli, F., Forsberg, R., Fujita, S., Gim, Y., Gogineni, P., Griggs, J. A., Hindmarsh, R. C. A., Holmlund, P., Holt, J. W., Jacobel, R. W., Jenkins, A., Jokat, W., Jordan, T., King, E. C., Kohler, J., Krabill, W., Riger-Kusk, M., Langley, K. A., Leitchenkov, G., Leuschen, C., Luyendyk, B. P., Matsuoka, K., Mouginot, J., Nitsche, F. O., Nogi, Y., Nost, O. A., Popov, S. V., Rignot, E., Rippin, D. M., Rivera, A., Roberts, J., Ross, N., Siegert, M. J., Smith, A. M., Steinhage, D., Studinger, M., Sun, B., Tinto, B. K., Welch, B. C., Wilson, D., Young, D. A., Xiangbin, C., and Zirizzotti, A.: Bedmap2: improved ice bed, surface and thickness datasets for Antarctica, The Cryosphere, 7, 375–393, https://doi.org/10.5194/tc-7-375-2013, 2013.
Gelaro, R., McCarty, W., Suárez, M. J., Todling, R., Molod, A., Takacs, L., Randles, C. A., Darmenov, A., Bosilovich, M. G., Reichle, R., Wargan, K., Coy, L., Cullather, R., Draper, C., Akella, S., Buchard, V., Conaty, A., Da Silva, A. M., Gu, W., Kim, G.-K., Koster, R., Lucchesi, R., Merkova, D., Nielsen, J. E., Partyka, G., Pawson, S., Putman, W., Rienecker, M., Schubert, S. D., Sienkiewicz, M., and Zhao, B.: The Modern-Era Retrospective Analysis for Research and Applications, Version 2 (MERRA-2), J. Climate, 30, 5419–5454, https://doi.org/10.1175/JCLI-D-16-0758.1, 2017.
Hersbach, H., Bell, B., Berrisford, P., Hirahara, S., Horányi, A., Muñoz-Sabater, J., Nicolas, J., Peubey, C., Radu, R., Schepers, D., Simmons, A., Soci, C., Abdalla, S., Abellan, X., Balsamo, G., Bechtold, P., Biavati, G., Bidlot, J., Bonavita, M., De Chiara, G., Dahlgren, P., Dee, D., Diamantakis, M., Dragani, R., Flemming, J., Forbes, R., Fuentes, M., Geer, A., Haimberger, L., Healy, S., Hogan, R. J., Hólm, E., Janisková, M., Keeley, S., Laloyaux, P., Lopez, P., Lupu, C., Radnoti, G., De Rosnay, P., Rozum, I., Vamborg, F., Villaume, S., and Thépaut, J.: The ERA5 global reanalysis, Q. J. Roy. Meteor. Soc., 146, 1999–2049, https://doi.org/10.1002/qj.3803, 2020.
Holland, P. R. and Kwok, R.: Wind-driven trends in Antarctic sea-ice drift, Nat. Geosci., 5, 872–875, https://doi.org/10.1038/ngeo1627, 2012.
Hosking, J. S., Orr, A., Marshall, G. J., Turner, J., and Phillips, T.: The Influence of the Amundsen–Bellingshausen Seas Low on the Climate of West Antarctica and Its Representation in Coupled Climate Model Simulations, J. Climate, 26, 6633–6648, https://doi.org/10.1175/JCLI-D-12-00813.1, 2013.
Jones, T. R., White, J. W. C., and Popp, T.: Siple Dome shallow ice cores: a study in coastal dome microclimatology, Clim. Past, 10, 1253–1267, https://doi.org/10.5194/cp-10-1253-2014, 2014.
Joughin, I. and Alley, R. B.: Stability of the West Antarctic ice sheet in a warming world, Nat. Geosci., 4, 506–513, https://doi.org/10.1038/ngeo1194, 2011.
Joughin, I., Smith, B. E., and Medley, B.: Marine Ice Sheet Collapse Potentially Under Way for the Thwaites Glacier Basin, West Antarctica, Science, 344, 735–738, https://doi.org/10.1126/science.1249055, 2014.
Karoly, D. J.: Southern Hemisphere Circulation Features Associated with El Niño-Southern Oscillation Events, J. Climate, 2, 1239–1252, https://doi.org/10.1175/1520-0442(1989)002<1239:SHCFAW>2.0.CO;2, 1989.
Kaspari, S., Mayewski, P. A., Dixon, D. A., Spikes, V. B., Sneed, S. B., Handley, M. J., and Hamilton, G. S.: Climate variability in West Antarctica derived from annual accumulation-rate records from ITASE firn/ice cores, Ann. Glaciol., 39, 585–594, https://doi.org/10.3189/172756404781814447, 2004.
Kohyama, T. and Hartmann, D. L.: Antarctic Sea Ice Response to Weather and Climate Modes of Variability, J. Climate, 29, 721–741, https://doi.org/10.1175/jcli-d-15-0301.1, 2016.
Lee, D. Y., Petersen, M. R., and Lin, W.: The Southern Annular Mode and Southern Ocean Surface Westerly Winds in E3SM, Earth Space Sci., 6, 2624–2643, https://doi.org/10.1029/2019EA000663, 2019.
Lenaerts, J. T. M. and Van Den Broeke, M. R.: Modeling drifting snow in Antarctica with a regional climate model: 2. Results, J. Geophys. Res., 117, 2010JD015419, https://doi.org/10.1029/2010JD015419, 2012.
Lenaerts, J. T. M., Van Den Broeke, M. R., Déry, S. J., Van Meijgaard, E., Van De Berg, W. J., Palm, S. P., and Sanz Rodrigo, J.: Modeling drifting snow in Antarctica with a regional climate model: 1. Methods and model evaluation, J. Geophys. Res., 117, 2011JD016145, https://doi.org/10.1029/2011JD016145, 2012a.
Lenaerts, J. T. M., Van Den Broeke, M. R., Van De Berg, W. J., Van Meijgaard, E., and Kuipers Munneke, P.: A new, high-resolution surface mass balance map of Antarctica (1979–2010) based on regional atmospheric climate modeling, Geophys. Res. Lett., 39, 2011GL050713, https://doi.org/10.1029/2011GL050713, 2012b.
Lenaerts, J. T. M., Ligtenberg, S. R. M., Medley, B., Van De Berg, W. J., Konrad, H., Nicolas, J. P., Van Wessem, J. M., Trusel, L. D., Mulvaney, R., Tuckwell, R. J., Hogg, A. E., and Thomas, E. R.: Climate and surface mass balance of coastal West Antarctica resolved by regional climate modelling, Ann. Glaciol., 59, 29–41, https://doi.org/10.1017/aog.2017.42, 2018.
Lenaerts, J. T. M., Medley, B., Van Den Broeke, M. R., and Wouters, B.: Observing and Modeling Ice Sheet Surface Mass Balance, Rev. Geophys., 57, 376–420, https://doi.org/10.1029/2018rg000622, 2019.
Li, X., Cai, W., Meehl, G. A., Chen, D., Yuan, X., Raphael, M., Holland, D. M., Ding, Q., Fogt, R. L., Markle, B. R., Wang, G., Bromwich, D. H., Turner, J., Xie, S.-P., Steig, E. J., Gille, S. T., Xiao, C., Wu, B., Lazzara, M. A., Chen, X., Stammerjohn, S., Holland, P. R., Holland, M. M., Cheng, X., Price, S. F., Wang, Z., Bitz, C. M., Shi, J., Gerber, E. P., Liang, X., Goosse, H., Yoo, C., Ding, M., Geng, L., Xin, M., Li, C., Dou, T., Liu, C., Sun, W., Wang, X., and Song, C.: Tropical teleconnection impacts on Antarctic climate changes, Nat. Rev. Earth Environ., 2, 680–698, https://doi.org/10.1038/s43017-021-00204-5, 2021.
Maclennan, M. L., Lenaerts, J. T. M., Shields, C. A., Hoffman, A. O., Wever, N., Thompson-Munson, M., Winters, A. C., Pettit, E. C., Scambos, T. A., and Wille, J. D.: Climatology and surface impacts of atmospheric rivers on West Antarctica, The Cryosphere, 17, 865–881, https://doi.org/10.5194/tc-17-865-2023, 2023.
Marshall, G. J.: Trends in the Southern Annular Mode from Observations and Reanalyses, J. Climate, 16, 4134–4143, https://doi.org/10.1175/1520-0442(2003)016<4134:TITSAM>2.0.CO;2, 2003.
Matsuoka, K., Hindmarsh, R. C. A., Moholdt, G., Bentley, M. J., Pritchard, H. D., Brown, J., Conway, H., Drews, R., Durand, G., Goldberg, D., Hattermann, T., Kingslake, J., Lenaerts, J. T. M., Martín, C., Mulvaney, R., Nicholls, K. W., Pattyn, F., Ross, N., Scambos, T., and Whitehouse, P. L.: Antarctic ice rises and rumples: Their properties and significance for ice-sheet dynamics and evolution, Earth-Sci. Rev., 150, 724–745, https://doi.org/10.1016/j.earscirev.2015.09.004, 2015.
Mayewski, P. A., Maasch, K. A., White, J. W. C., Steig, E. J., Meyerson, E., Goodwin, I., Morgan, V. I., Van Ommen, T., Curran, M. A. J., Souney, J., and Kreutz, K.: A 700 year record of Southern Hemisphere extratropical climate variability, Ann. Glaciol., 39, 127–132, https://doi.org/10.3189/172756404781814249, 2004.
Medley, B. and Thomas, E. R.: Increased snowfall over the Antarctic Ice Sheet mitigated twentieth-century sea-level rise, Nat. Clim. Change, 9, 34–39, https://doi.org/10.1038/s41558-018-0356-x, 2019.
Mercer, J. H.: West Antarctic ice sheet and CO2 greenhouse effect – A threat of disaster, Nature, 271, 321–325, 1978.
Morlighem, M.: MEaSUREs BedMachine Antarctica. (NSIDC-0756, Version 3), Boulder, Colorado USA, NASA National Snow and Ice Data Center Distributed Active Archive Center [data set], https://doi.org/10.5067/FPSU0V1MWUB6, 2022.
Morlighem, M., Rignot, E., Binder, T., Blankenship, D., Drews, R., Eagles, G., Eisen, O., Ferraccioli, F., Forsberg, R., Fretwell, P., Goel, V., Greenbaum, J. S., Gudmundsson, H., Guo, J., Helm, V., Hofstede, C., Howat, I., Humbert, A., Jokat, W., Karlsson, N. B., Lee, W. S., Matsuoka, K., Millan, R., Mouginot, J., Paden, J., Pattyn, F., Roberts, J., Rosier, S., Ruppel, A., Seroussi, H., Smith, E. C., Steinhage, D., Sun, B., van den Broeke, M. R., van Ommen, T. D., van Wessem, M., and Young, D. A.: Deep glacial troughs and stabilizing ridges unveiled beneath the margins of the Antarctic ice sheet, Nat. Geosci., 13, 132–137, https://doi.org/10.1038/s41561-019-0510-8, 2020.
Neff, P.: Amundsen Sea Coastal Ice Rises: Future Sites for Marine-Focused Ice Core Records, Oceanography, 33, https://doi.org/10.5670/oceanog.2020.215, 2020.
O'Connor, G. K., Nakayama, Y., Steig, E. J., Armour, K. C., Thompson, L., Hyogo, S., Berdahl, M., and Shimada, T.: Enhanced West Antarctic ice loss triggered by polynya response to meridional winds, Nat. Geosci., 18, 840–847, https://doi.org/10.1038/s41561-025-01757-6, 2025.
Orsi, A. J., Cornuelle, B. D., and Severinghaus, J. P.: Little Ice Age cold interval in West Antarctica: Evidence from borehole temperature at the West Antarctic Ice Sheet (WAIS) Divide: WAIS DIVIDE TEMPERATURE, Geophys. Res. Lett., 39, https://doi.org/10.1029/2012GL051260, 2012.
Paolo, F. S., Padman, L., Fricker, H. A., Adusumilli, S., Howard, S., and Siegfried, M. R.: Response of Pacific-sector Antarctic ice shelves to the El Niño/Southern Oscillation, Nat. Geosci., 11, 121–126, https://doi.org/10.1038/s41561-017-0033-0, 2018.
Petty, A. A., Feltham, D. L., and Holland, P. R.: Impact of Atmospheric Forcing on Antarctic Continental Shelf Water Masses, J. Phys. Oceanogr., 43, 920–940, https://doi.org/10.1175/JPO-D-12-0172.1, 2013.
Pritchard, H. D., Ligtenberg, S. R. M., Fricker, H. A., Vaughan, D. G., van den Broeke, M. R., and Padman, L.: Antarctic ice-sheet loss driven by basal melting of ice shelves, Nature, 484, 502–505, https://doi.org/10.1038/nature10968, 2012.
Rowell, I., Martin, C., Mulvaney, R., Pryer, H., Tetzner, D., Doyle, E., Talasila, H. M., Li, J., and Wolff, E.: An age scale for new climate records from Sherman Island, West Antarctica, Clim. Past, 19, 1699–1714, https://doi.org/10.5194/cp-19-1699-2023, 2023.
Scambos, T. A., Bell, R. E., Alley, R. B., Anandakrishnan, S., Bromwich, D. H., Brunt, K., Christianson, K., Creyts, T., Das, S. B., DeConto, R., Dutrieux, P., Fricker, H. A., Holland, D., MacGregor, J., Medley, B., Nicolas, J. P., Pollard, D., Siegfried, M. R., Smith, A. M., Steig, E. J., Trusel, L. D., Vaughan, D. G., and Yager, P. L.: How much, how fast?: A science review and outlook for research on the instability of Antarctica's Thwaites Glacier in the 21st century, Glob. Planet. Change, 153, 16–34, https://doi.org/10.1016/j.gloplacha.2017.04.008, 2017.
Schwanck, F., Simões, J. C., Handley, M., Mayewski, P. A., Auger, J. D., Bernardo, R. T., and Aquino, F. E.: A 125-year record of climate and chemistry variability at the Pine Island Glacier ice divide, Antarctica, The Cryosphere, 11, 1537–1552, https://doi.org/10.5194/tc-11-1537-2017, 2017.
Shepherd, A., Fricker, H. A., and Farrell, S. L.: Trends and connections across the Antarctic cryosphere, Nature, 558, 223–232, https://doi.org/10.1038/s41586-018-0171-6, 2018.
Smith, B., Fricker, H. A., Gardner, A. S., Medley, B., Nilsson, J., Paolo, F. S., Holschuh, N., Adusumilli, S., Brunt, K., Csatho, B., Harbeck, K., Markus, T., Neumann, T., Siegfried, M. R., and Zwally, H. J.: Pervasive ice sheet mass loss reflects competing ocean and atmosphere processes, Science, 368, 1239–1242, https://doi.org/10.1126/science.aaz5845, 2020.
Steig, E. J. and Neff, P. D.: The prescience of paleoclimatology and the future of the Antarctic ice sheet, Nat. Commun., 9, https://doi.org/10.1038/s41467-018-05001-1, 2018.
Steig, E. J., Schneider, D. P., Rutherford, S. D., Mann, M. E., Comiso, J. C., and Shindell, D. T.: Warming of the Antarctic ice-sheet surface since the 1957 International Geophysical Year, Nature, 457, 459–462, https://doi.org/10.1038/nature07669, 2009.
Steig, E. J., Ding, Q., Battisti, D. S., and Jenkins, A.: Tropical forcing of Circumpolar Deep Water Inflow and outlet glacier thinning in the Amundsen Sea Embayment, West Antarctica, Ann. Glaciol., 53, 19–28, https://doi.org/10.3189/2012AoG60A110, 2012.
Steig, E. J., Ding, Q., White, J. W. C., Küttel, M., Rupper, S. B., Neumann, T. A., Neff, P. D., Gallant, A. J. E., Mayewski, P. A., Taylor, K. C., Hoffmann, G., Dixon, D. A., Schoenemann, S. W., Markle, B. R., Fudge, T. J., Schneider, D. P., Schauer, A. J., Teel, R. P., Vaughn, B. H., Burgener, L., Williams, J., and Korotkikh, E.: Recent climate and ice-sheet changes in West Antarctica compared with the past 2,000 years, Nat. Geosci., 6, 372–375, https://doi.org/10.1038/ngeo1778, 2013.
Thomas, E. R., Bracegirdle, T. J., Turner, J., and Wolff, E. W.: A 308 year record of climate variability in West Antarctica, Geophys. Res. Lett., 40, 5492–5496, https://doi.org/10.1002/2013gl057782, 2013.
Thomas, E. R., van Wessem, J. M., Roberts, J., Isaksson, E., Schlosser, E., Fudge, T. J., Vallelonga, P., Medley, B., Lenaerts, J., Bertler, N., van den Broeke, M. R., Dixon, D. A., Frezzotti, M., Stenni, B., Curran, M., and Ekaykin, A. A.: Regional Antarctic snow accumulation over the past 1000 years, Clim. Past, 13, 1491–1513, https://doi.org/10.5194/cp-13-1491-2017, 2017.
Thompson, D. W. J. and Wallace, J. M.: Regional Climate Impacts of the Northern Hemisphere Annular Mode, Science, 293, 85–89, https://doi.org/10.1126/science.1058958, 2001.
Trenberth, K. E.: The Definition of El Niño, B. Am. Meteorol. Soc., 78, 2771–2777, https://doi.org/10.1175/1520-0477(1997)078<2771:TDOENO>2.0.CO;2, 1997.
Trenberth, K.: The Climate Data Guide: Niño SST Indices (Niño 1+2, 3, 3.4, 4; ONI and TNI), National Center for Atmospheric Research, Boulder, CO, USA, https://climatedataguide.ucar.edu/climate-data/nino-sst-indices-nino-12-3-34-4-oni-and-tni (last access: 15 July 2025), 2025.
Trusel, L. D., Frey, K. E., Das, S. B., Munneke, P. K., and Van Den Broeke, M. R.: Satellite-based estimates of Antarctic surface meltwater fluxes, Geophys. Res. Lett., 40, 6148–6153, https://doi.org/10.1002/2013GL058138, 2013.
Tsukernik, M. and Lynch, A. H.: Atmospheric Meridional Moisture Flux over the Southern Ocean: A Story of the Amundsen Sea, J. Climate, 26, 8055–8064, https://doi.org/10.1175/JCLI-D-12-00381.1, 2013.
Turner, J.: The El Niño–southern oscillation and Antarctica, Int. J. Climatol., 24, 1–31, https://doi.org/10.1002/joc.965, 2004.
Turner, J., Phillips, T., Hosking, J. S., Marshall, G. J., and Orr, A.: The Amundsen Sea low, Int. J. Climatol., 33, 1818–1829, https://doi.org/10.1002/joc.3558, 2013.
Turner, J., Orr, A., Gudmundsson, G. H., Jenkins, A., Bingham, R. G., Hillenbrand, C. D., and Bracegirdle, T. J.: Atmosphere–ocean–ice interactions in the Amundsen Sea Embayment, West Antarctica, Rev. Geophys., 55, 235–276, https://doi.org/10.1002/2016RG000532, 2017.
van Dalum, C. T., van de Berg, W. J., van den Broeke, M. R., and van Tiggelen, M.: The surface mass balance and near-surface climate of the Antarctic ice sheet in RACMO2.4p1, The Cryosphere, 19, 4061–4090, https://doi.org/10.5194/tc-19-4061-2025, 2025.
Wille, J. D., Favier, V., Dufour, A., Gorodetskaya, I. V., Turner, J., Agosta, C., and Codron, F.: West Antarctic surface melt triggered by atmospheric rivers, Nat. Geosci., 12, 911–916, https://doi.org/10.1038/s41561-019-0460-1, 2019.
Winski, D. A., Fudge, T. J., Ferris, D. G., Osterberg, E. C., Fegyveresi, J. M., Cole-Dai, J., Thundercloud, Z., Cox, T. S., Kreutz, K. J., Ortman, N., Buizert, C., Epifanio, J., Brook, E. J., Beaudette, R., Severinghaus, J., Sowers, T., Steig, E. J., Kahle, E. C., Jones, T. R., Morris, V., Aydin, M., Nicewonger, M. R., Casey, K. A., Alley, R. B., Waddington, E. D., Iverson, N. A., Dunbar, N. W., Bay, R. C., Souney, J. M., Sigl, M., and McConnell, J. R.: The SP19 chronology for the South Pole Ice Core – Part 1: volcanic matching and annual layer counting, Clim. Past, 15, 1793–1808, https://doi.org/10.5194/cp-15-1793-2019, 2019.
Winstrup, M., Vallelonga, P., Kjær, H. A., Fudge, T. J., Lee, J. E., Riis, M. H., Edwards, R., Bertler, N. A. N., Blunier, T., Brook, E. J., Buizert, C., Ciobanu, G., Conway, H., Dahl-Jensen, D., Ellis, A., Emanuelsson, B. D., Hindmarsh, R. C. A., Keller, E. D., Kurbatov, A. V., Mayewski, P. A., Neff, P. D., Pyne, R. L., Simonsen, M. F., Svensson, A., Tuohy, A., Waddington, E. D., and Wheatley, S.: A 2700-year annual timescale and accumulation history for an ice core from Roosevelt Island, West Antarctica, Clim. Past, 15, 751–779, https://doi.org/10.5194/cp-15-751-2019, 2019.
Wang, S., Li, G.-C., Zhang, Z.-H., Zhang, W.-Q., Wang, X., Chen, D., Chen, W., and Ding, M.-H.: Recent warming trends in Antarctica revealed by multiple reanalysis, Adv. Clim. Change Res., 16, 447–459, https://doi.org/10.1016/j.accre.2025.03.003, 2025.
Zhu, J., Xie, A., Qin, X., Wang, Y., Xu, B., and Wang, Y.: An Assessment of ERA5 Reanalysis for Antarctic Near-Surface Air Temperature, Atmosphere, 12, 217, https://doi.org/10.3390/atmos12020217, 2021.
Coastal ice domes in West Antarctica preserve snowfall records that reflect past climate conditions. Using weather reanalysis from 1979 to 2022, this study identifies which domes best capture different climate drivers affecting the region. Western sites respond mainly to hemisphere-wide wind shifts, while eastern sites reflect regional storm patterns. These results guide where future ice cores should be drilled to reconstruct past atmospheric and oceanic changes in this vulnerable region.
Coastal ice domes in West Antarctica preserve snowfall records that reflect past climate...