the Creative Commons Attribution 4.0 License.
the Creative Commons Attribution 4.0 License.
 | 26 Jun 2026
Comparing calving laws at Greenland's three largest ice shelves
Felicity A. Holmes
Sarah L. Greenwood
Mathieu Morlighem
Nina Kirchner
Martin Jakobsson
The retreat of Greenlandic glaciers through calving has major implications for the ice sheet's mass balance and future sea-level rise contributions. Despite its importance, the implementation of calving in ice sheet models remains contested, with several calving laws suggested to parametrise this process. While the performance of some of these calving laws has been tested for Antarctic ice shelves and Greenland's grounded outlet glaciers, it is unclear which calving law would best capture the observed behaviour of Greenland's ice shelves. Petermann, Ryder, and Nioghalvfjerdsbræ (79N) glaciers terminate as Greenland's three largest ice shelves, accounting for 90 % of the remaining floating ice and buttressing ∼ 15 % of the ice sheet's mass. Here we build on other systematic calving studies by comparing five calving laws at Greenland's three largest ice shelves using the Ice-sheet and Sea-level System Model (ISSM). We begin by constraining the performance of each law against observed terminus fluctuations between 2008 and 2024, and continue with projections to 2300 under various climate forcings. When evaluated against observed terminus changes, we recommend the use of a von Mises or Crevasse Depth calving law owing to their consistent performance and similar tuning parameters across the three ice shelves. However, in our extended projection runs, we find that calving parametrisations have little influence on grounding line discharge rates, which are instead driven by the choice of climate forcings. Large ice shelf calving or collapse events are scarce, and only in these rare cases do we find any pronounced increase in ice discharge. Our results indicate either continued buttressing potential from Greenland's ice shelves into the coming centuries or fundamental flaws in the current set of calving laws when calibrated to contemporary ice-shelf behaviour.
- Article
(16224 KB) - Full-text XML
-
Supplement
(13035 KB) - BibTeX
- EndNote


The acceleration of mass loss from the Greenland Ice Sheet (GrIS), now the single largest cryospheric contributor to sea-level rise (Otosaka et al., 2023), has coincided with the near universal retreat of Greenland's marine outlet glaciers (Greene et al., 2024). The increase of solid ice discharge from these marine termini, driven by submarine melt and iceberg calving (together termed frontal ablation), is expected to accelerate and become the dominant form of mass loss from the ice sheet this century (Choi et al., 2021; Kochtitzky et al., 2022). However, accounting for interactions at the ice-ocean interface, in particular the mechanisms of calving, remains one of the key uncertainties in ice sheet modelling (Goelzer et al., 2020). Terminus retreat through calving not only directly contributes to mass loss, but also has indirect impacts on ice sheet dynamics, where a reduction in resistive stresses can provoke an acceleration in discharge and interior ice sheet thinning, thereby also negatively affecting the ice sheet's surface mass balance (SMB) through increased ablation (King et al., 2020; Box et al., 2022). As such, there is a distinct need for robust models that capture calving dynamics of marine-terminating glaciers to make realistic projections of future sea-level rise.
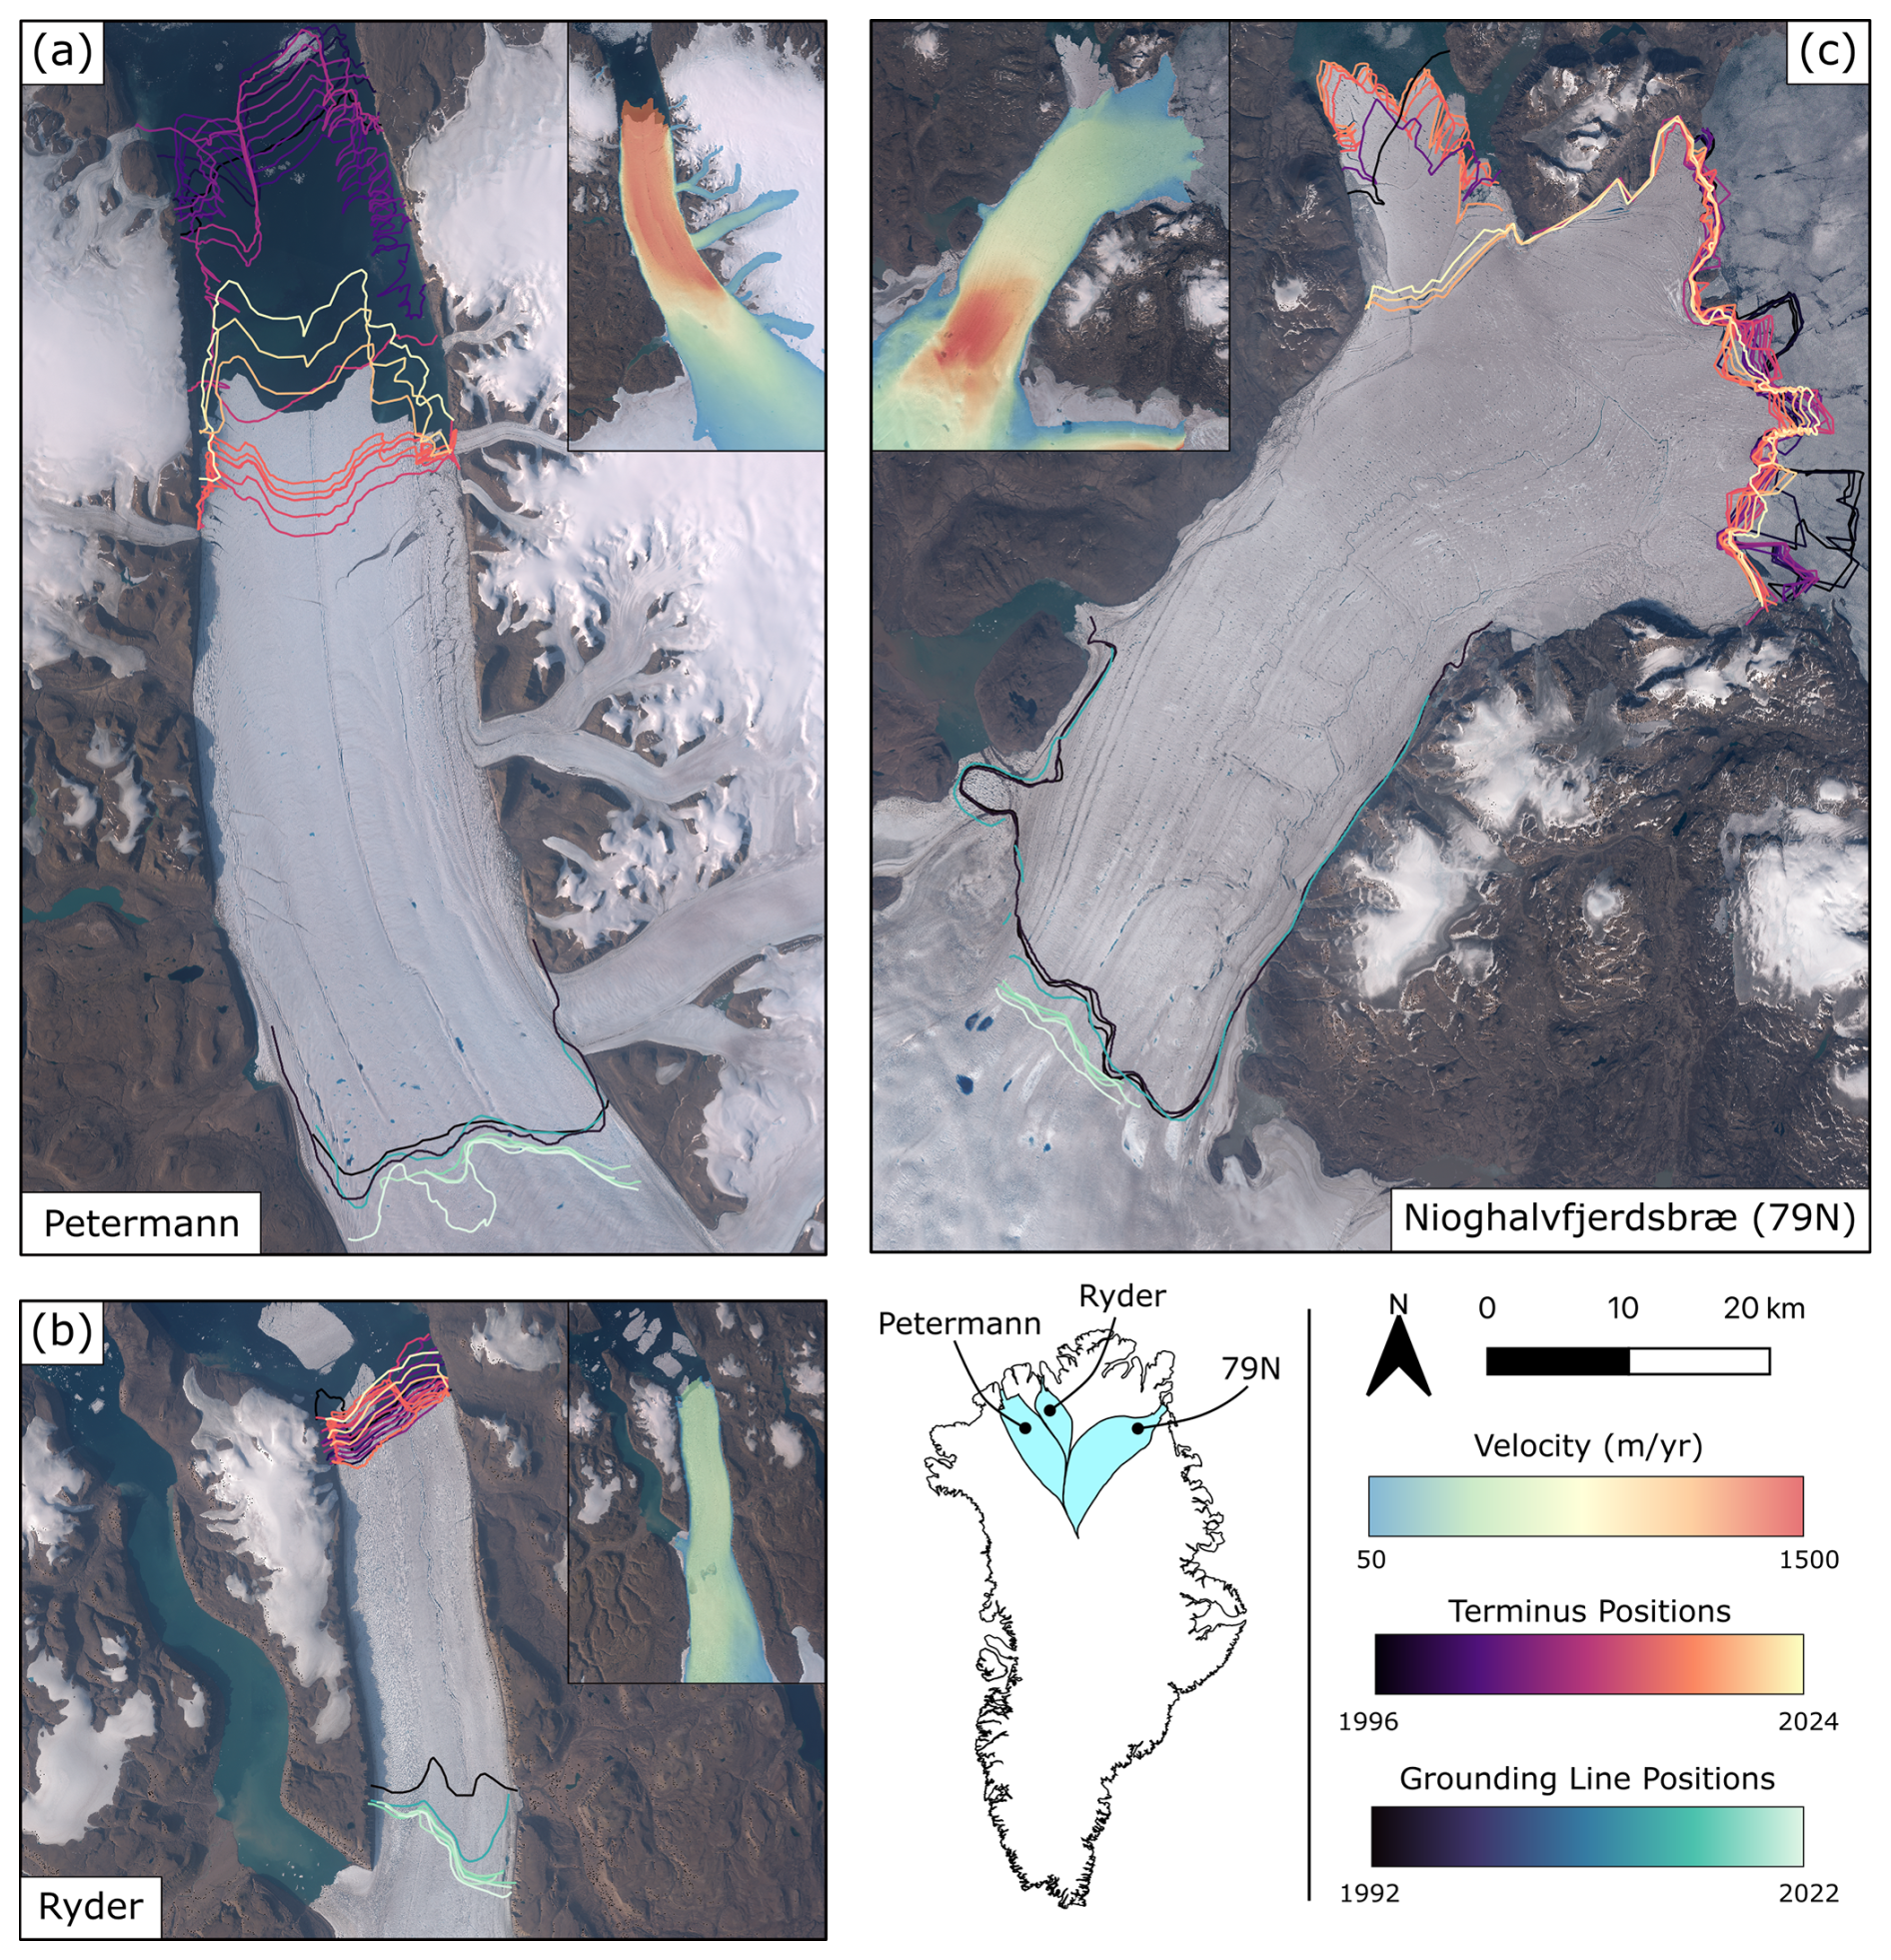
Figure 1Satellite images of the last three remaining large ice shelves in Greenland: (a) Petermann Glacier, (b) Ryder Glacier, and (c) 79N taken in August 2019 (MacGregor et al., 2020). Observed grounding line and terminus positions show recent changes to the ice shelves since the 1990s (Millan et al., 2023). Ice velocities for each glacier are shown in an smaller embedded satellite image taken from MEaSUREs (Joughin et al., 2016).
The majority of Greenland's marine outlet glaciers calve from near vertical ice cliffs grounded on the seafloor, with only a few terminating in large floating ice shelves. These floating extensions are confined to the northern regions of the ice sheet, where the three largest, those extending from the Petermann, Ryder, and Nioghalvfjerdsbræ (79N) glaciers (Fig. 1), account for ∼ 90 % of the remaining floating ice (Millan et al., 2023). Together, these three glacier catchments contain ∼ 15 % of the ice sheet's mass, equivalent to about 1.1 m of global sea-level, but currently contribute only ∼ 5 % of the GrIS's total discharge (Mouginot et al., 2019); critically, the ice shelves buttress the flow of ice and suppress discharge. Observations and transient modelling studies have shown that when these ice shelves are lost, discharge may increase owing to a reduction in lateral friction causing an acceleration of ice velocities (Joughin et al., 2012; Khan et al., 2014; Mouginot et al., 2015; Hill et al., 2018b, 2021; Humbert et al., 2023). Furthermore, a shift in calving regime occurs, from floating ice shelves that calve large tabular icebergs at intermittent intervals to a grounded front that calves smaller icebergs at a greater frequency (Kehrl et al., 2017; Bézu and Bartholomaus, 2024). Constraining the evolution of these remaining floating shelves and possible shifts in calving regimes is pressing as accelerated thinning at Greenland's ice shelves could lead to future collapse events (Millan et al., 2023).
The calving behaviour of the three largest Greenlandic ice shelves is heterogeneous. Petermann Glacier lost 40 km of its shelf between 2012 and 2013 through a series of large calving events, as ice velocities at the grounding line accelerated by 10 % (Fig. 1a; Hill et al., 2017). In the following decade, no major calving has occurred and the shelf has re-advanced toward its previous position, now measuring 60 km in length (Millan et al., 2023). In contrast, the neighbouring Ryder Glacier has undergone a cyclic calving pattern for numerous decades, where the terminus gradually advances for 10 years until it reaches a widening section of Sherard Osborn Fjord, at which point it calves back 3–4 km (Fig. 1b; Holmes et al., 2021). Tabular iceberg calving at Ryder and Petermann occurs through a similar mode, where crevasses are initiated by friction against the fjord walls and extend laterally across the shelf (Hill et al., 2018a; Miele et al., 2023). At 79N, the largest ice shelf in Greenland at 70 km in length, calving is largely dictated by ice rises at the main eastern terminus. Although these bedrock highs have acted as pinning points for the ice shelf, which has remained stable for several decades, they are also points of initiation for crevasse propagation (Fig. 1c; Humbert et al., 2023). In 2020, the smaller northern terminus of 79N calved and retreated ∼ 15 km, while recent crevasse propagation at the main eastern terminus has extended and likely represents a precursor to the future disintegration of the shelf (Humbert et al., 2023). 79N forms part of the Northeast Greenland Ice Stream (NEGIS) with its neighbour Zachariae Isstrøm. The collapse of the latter's shelf in 2012 and subsequent acceleration did not influence the dynamics of 79N. Grounding-line retreat and ice-shelf thinning has been observed at all three glaciers, explicitly linked to the presence of warm Atlantic Waters (AW) entering the ice cavities, driving increased sub-shelf melting and weakening the floating extensions (Jakobsson et al., 2020; Millan et al., 2023; Wekerle et al., 2024).
Although calving is critical to mass loss from GrIS, and the behaviour of outlet glaciers, its implementation in ice-sheet models remains unclear. The process is often parametrised through calving laws at the ice-ocean boundary. Therein, position-based calving laws capture calving through a change in terminus position at discrete intervals, while rate-based calving laws parametrise calving continuously through a rate function. Currently, a universal law that has the required fidelity to predict all types of calving events, whether at a grounded front or an ice shelf, remains sought-after.
A systematic investigation into the performance of five calving laws at nine grounded Greenlandic glaciers was carried out by Choi et al. (2018). Therein, the von Mises law (VM; Morlighem et al., 2016), where calving is expressed as a rate through a function of tensile stresses and frontal velocities, performed best. In contrast, Amaral et al. (2020) found that the position-based Crevasse Depth law (CD, Benn et al., 2007; Nick et al., 2010) best replicated observed terminus fluctuations of fifty outlet glaciers in Greenland, including Petermann Glacier. In this law, the position of the calving front is defined where surface crevasses reach the water line or where they join with basal crevasses through the entire ice thickness. The discrepancy between the studies may lie in their contrasting approaches, with Amaral et al. (2020) employing a simple 1-D flowline model, while the former used the vertically integrated 2-D Shelf-Stream Approximation (SSA; Morland and Zainuddin, 1987; MacAyeal, 1989). For floating ice shelves in Antarctica, Wilner et al. (2023) used a similar 2-D SSA model setup and found the von Mises law to be most successful. Additionally, an eigencalving law (EC; Levermann et al., 2012), another rate based law that expresses calving through a product of strain rates both parallel and perpendicular to ice flow, performed well. However, it remains unclear whether the conclusions for broad Antarctic ice shelves can be applied to the thinner, fragmented, fjord-confined ice shelves in Greenland, commonly referred to as ice tongues.
Here, we aim to build on previous studies by assessing the performance of calving laws in capturing calving dynamics at Greenland's three largest remaining ice shelves: Petermann, Ryder and 79N Glaciers. Our model set-up is similar to that used in Choi et al. (2018) and Wilner et al. (2023), employing the Ice-sheet and Sea-level System Model (ISSM; Larour et al., 2012) to evaluate five different calving laws: Von Mises (VM), Crevasse Depth (CD), Eigencalving (EC), a further position-based law that defines the terminus position based on a minimum thickness (MT) of the ice shelf, and a rate-based Crevasse Depth law (PD) originally introduced by Pollard et al. (2015). Each calving law has a tuning parameter that, owing to the unique setting of each glacier, requires calibration. Following Choi et al. (2018), we calibrate each calving law against satellite observations (2008 to 2024), after which we extend our simulations to 2300 to assess whether the choice of parameterisation at the ice-ocean boundary influences the future shelf evolution and discharge rates.
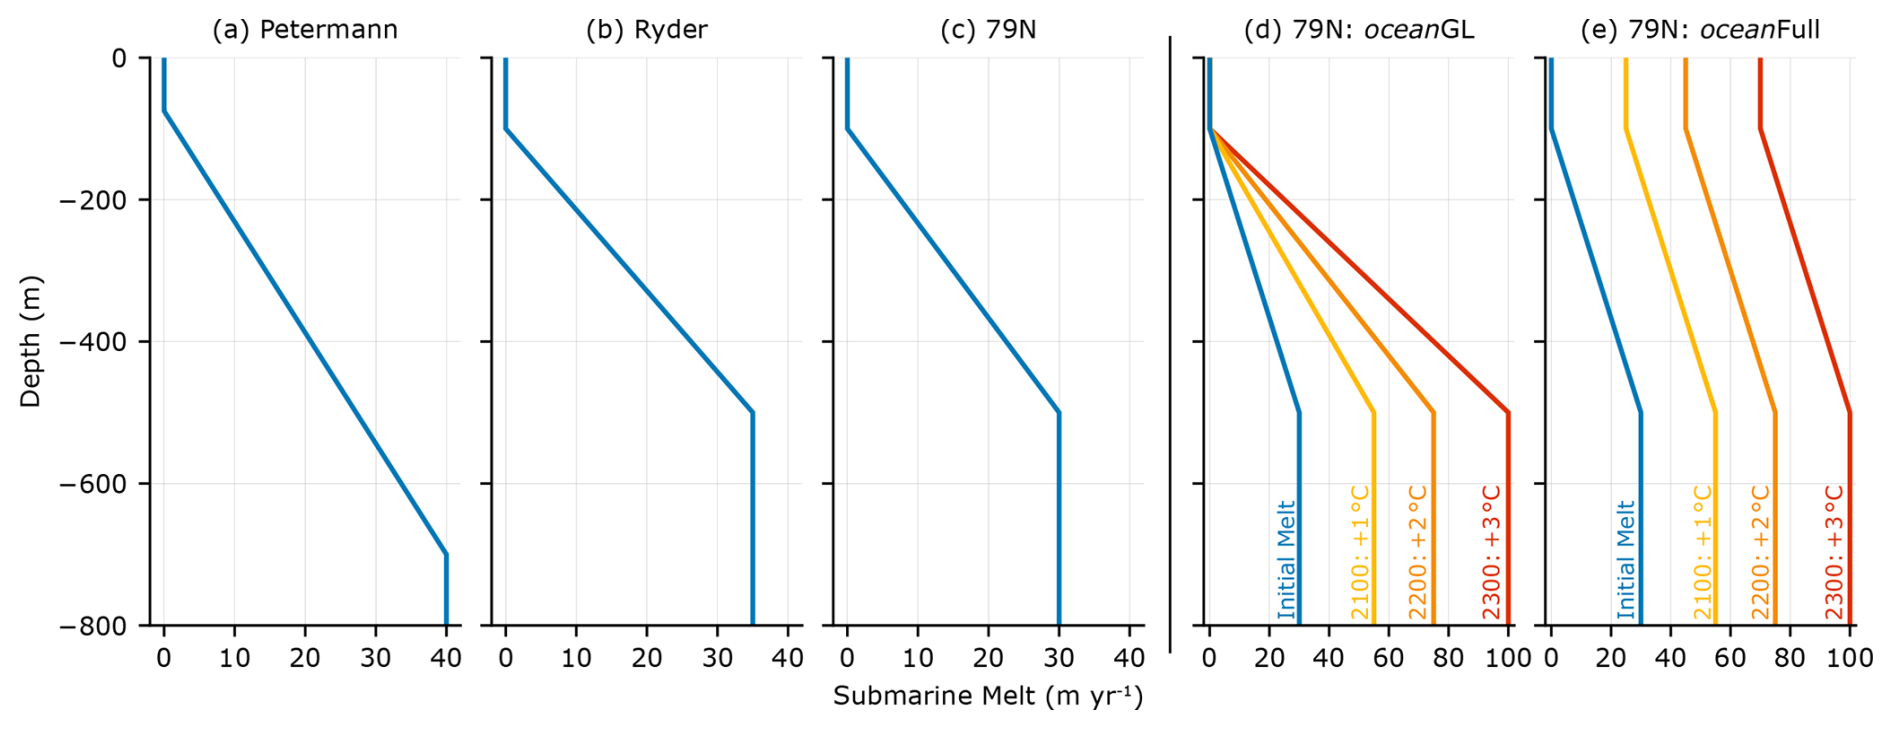
Figure 2Initial ocean melt profiles underneath (a) Petermann, (b) Ryder and (c) 79N ice shelves used. Perturbed ocean melt rates for the (d) oceanGL and (e) oceanFull scenarios are shown for 79N.
We use ISSM together with the 2-D SSA equations to model the ice flow (Morland and Zainuddin, 1987; MacAyeal, 1989) and investigate the five aforementioned calving laws (VM, EC, MT, CD and PD) at the three remaining major ice shelves in Greenland. Mesh resolution for each glacier varies from 100 m at fast-moving ice near the grounding line to 5 km for slow-moving ice in the interior, according to ice velocities from the NASA programme Making Earth System Data Records for Use in Research Environments (MEaSUREs; Joughin et al., 2016). Furthermore, we set a fixed resolution of 100 m for regions of floating ice. Surface velocities are also used to invert for ice viscosity prefactor on the floating ice, B, followed by the basal friction of the grounded ice areas, which is applied through a linear viscous Budd law (Budd et al., 1979). The initial ice surface and fixed bedrock topography are taken from BedMachine Greenland version 5 (Morlighem et al., 2022), with its nominal date of 2008. The surface mass balance (SMB) input is taken from RACMOv2.3 (Noël et al., 2022) and is interpolated onto mesh nodes using a nearest-neighbour approach. The SMB is averaged over the years 2008 to 2024 and is kept constant during the model relaxation and calving calibrations. All simulations are run with adaptive time stepping, between 0.72 and 7.2 d, satisfying the Courant–Friedrichs–Lewy condition (Courant et al., 1928; LeVeque, 2007).
Before introducing calving into our model we first run a relaxation for 10 years where the terminus position remains fixed, but the grounding line and ice surface are free to evolve. This allows our model to adjust to any inconsistencies in our starting geometry and provides an opportunity to calibrate the ocean melt boundary condition beneath the ice shelf. Ocean melt is prescribed such that it varies linearly with depth, consistent with observations in Greenland (Wilson et al., 2017; Slater and Straneo, 2022; Millan et al., 2023), where the highest melt rates occur at the deepest part of the ice shelf before decreasing in shallower waters towards the terminus. Ocean melt is only applied under fully floating elements (Seroussi and Morlighem, 2018). The calibrated melt profiles for each glacier are shown in Fig. 2. We find these melt profiles satisfy three criteria: (1) capture the shape of the ice shelf, (2) reproduce a grounding line position that is similar to present day and is not advancing, and (3) provide ice velocities near the grounding line and across the ice shelf that are similar to observations from 2008. In the event of an ice shelf collapse, the highest melt rates from the defined profiles are applied uniformly to the grounded ice front. Ryder Glacier has a second calving terminus that is grounded, diverging westward upstream of the present-day grounding line, and calving into Hartz Sound (Fig. 1b). However, as our study focuses on the interactions between floating ice and the ocean, we keep the position of Ryder's second terminus fixed during all simulations.
2.1 Calving Laws
Here we implement three rate-based calving laws (VM, EC and PD) and two position-based laws (CD and MT) using a level-set method to track the evolution of the calving front (Bondzio et al., 2016). A positive calving rate value, c, retreats the ice and is applied perpendicular to the calving front (following level-set gradients). We impose a maximum migration rate, , of 10 km yr−1 to prevent unrealistic terminus fluctuations during our simulations. This value is consistent with all calving laws, with the exception of PD where is used as a tuning parameter.
2.1.1 Von Mises (VM)
A calving rate, c, in the VM law is a function of the Von Mises tensile stress, , at the ice terminus:
where σmax is the tensile stress threshold and the tuning parameter of the law, and v is the ice velocity at the ice front (Morlighem et al., 2016). The Von Mises stress, , is defined as:
where, n=3 is Glen's exponent, B is the ice viscosity parameter, and is the effective tensile strain rate comprised of the eigenvalues of the horizontal strain rate tensor, and :
2.1.2 Eigencalving (EC)
EC defines c as being proportional to both across-flow and along-flow strain rates:
where is the along flow and across flow strain rate eigenvalues associated with horizontal flow at the ice front (Levermann et al., 2012). K is a proportionality constant that encapsulates certain material properties of ice that are relevant for calving and is used as the tuning parameter for the EC law.
2.1.3 Crevasse Depth (CD and PD)
The CD law defines the calving front where surface crevasses reach the water line or join with basal crevasses and extend throughout the glacier thickness. Following Nye (1957), surface crevasses penetrate to a depth ds where the tensile strain rate exactly balances the creep closure rate from ice overburden pressure:
where g is the gravitational acceleration, ρi is ice density, A and n are Glen's flow parameters and is the tensile strain rate. The presence of water in surface crevasses can cause greater penetration through added downward pressure (van der Veen, 1998). Following Benn et al. (2007), the effect of water in surface crevasses is accounted for by modifying Eq. (5) as follows:
where ρw and dw are the pressure and depth of water in the crevasse, respectively. Basal crevasse propagation follows Nick et al. (2010):
where ρsw is the density of ocean water and Hab is height above floatation. As such, crevasse propagation in the CD law is defined through Eqs. (6) and (7), and we assume that crevasses occur in response to stress only in the direction of ice-flow (Nick et al., 2010; Otero et al., 2017). The tuning parameter for the CD law is taken as the water depth in surface crevasses (dw).
We explore an additional Crevasse Depth law (PD) that was originally developed by Pollard et al. (2015) for large floating ice shelves in Antarctica and later modified by Wilner et al. (2023). The law expresses calving as a rate based on a series of crevasse depth components. This includes dry-surface crevasses, ds (Eq. 5), and basal crevasses, db (Eq. 7), where fracture growth occurs under any tensile stress. Unlike the CD law, the presence of surface water is accounted for using an additional crevasse depth competent, df, to parametrise hydrofracturing:
where R is the total surface melt and rainfall available after re-freezing (m yr−1), which is taken directly from our SMB scheme. A velocity dependent term, da, parametrises further crevasse deepening as:
where h is ice thickness and v is ice velocity in m yr−1. Pollard et al. (2015) calibrated the constants to match velocity observations at the Ross and Ronne ice shelves. For velocities up to 1600 m yr−1, da is zero. We note here that none of the contemporary three ice shelves investigated here reach this speed, with the highest velocities of ∼ 1400 m yr−1 observed at 79N (Fig. 1). Finally, the crevasse depth component, dt, removes thin ice between 100 and 150 m thick:
As Greenlandic ice shelves are significantly thinner than those found in Antarctica, often < 100 m thick at the terminus, we choose to ignore this component of the PD law. The crevasse depth components taken together are then expressed as a ratio to ice thickness:
with the final calving rate defined as:
where is the maximum migration rate (m yr−1) of the ice front and rc is a critical threshold at which calving begins, between 0 and 1. The use of min and max ensures that the calving rate does not become negative or exceed the maximum migration rate. Both and rc are taken as the tuning parameters for the PD law.
2.1.4 Minimum Thickness (MT)
Finally, the MT law simply dictates that calving occurs when h ≤ hmin, where h is the local ice thickness and hmin is a pre-defined minimum thickness at which the ice shelf will calve and is taken as the law's tuning parameter.
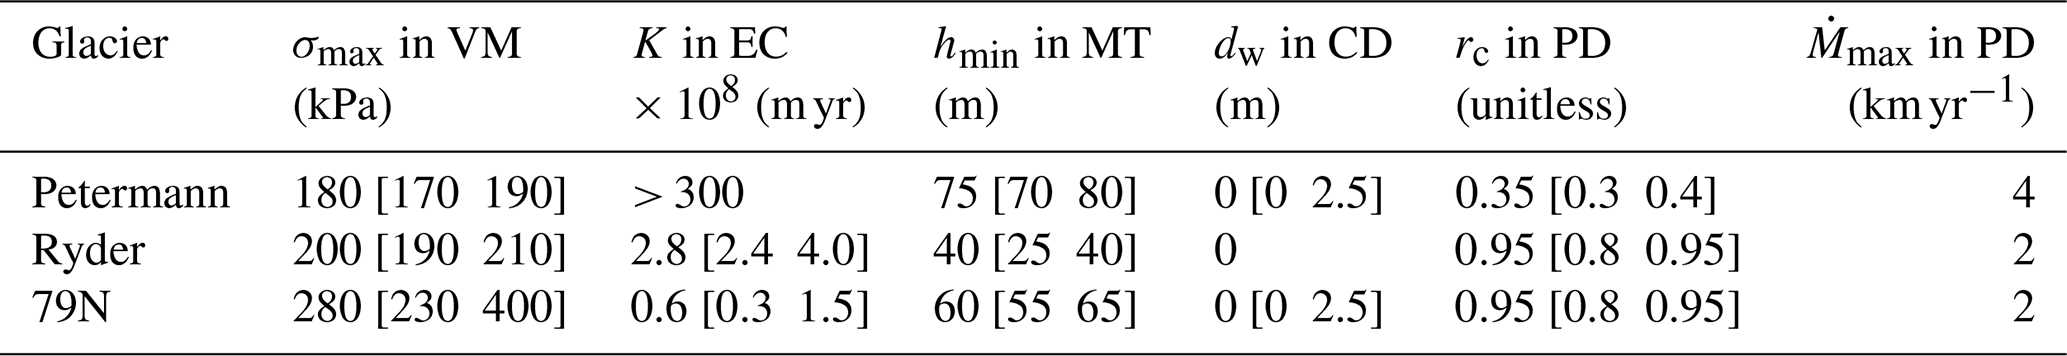
Table 1Chosen calibration parameters for the five different calving laws that provide the best fit to the observed ice-shelves in 2024. The values in brackets are the range of calibration parameters that produce a both quantitatively and qualitatively similar ice shelf to the chosen calibration parameter.
2.1.5 Grounded Calving
In this study, we specifically focus on evaluating calving laws at floating ice shelves. However, in the case where we simulate a shelf collapse and the transition to a grounded glacier front, some of our calving laws require adjustment for the grounded condition. The VM law in ISSM discriminates explicitly between floating and grounded ice, and we set the tensile stress threshold (σmax) for grounded termini to be 1 MPa (Choi et al., 2018). In the PD law, hydrofracture-driven calving at floating ice shelves was originally paired with the theory of Marine Ice Cliff Instability (MICI) at grounded termini in Pollard et al. (2015). We do not include the mechanics of MICI in this study and instead end our simulations if floating ice is lost when using the PD law. For all other calving laws, the tuning parameters are kept consistent between grounded and floating termini.
2.2 Tuning and Transient Simulations
We calibrate each calving law by running a series of simulations for each glacier for 17 years from 2008 until the end of 2024. The tuning parameter of each law is varied systematically across ranges of values found appropriate in previous studies (Choi et al., 2018; Amaral et al., 2020; Wilner et al., 2023), at intervals of 10 kPa for σmax, 2.5 m for dw, 0.05 for rc across values of between 2 and 10 km at 2 km intervals, and finally 5 m for hmin. For the EC law, it became apparent that we need greatly different tuning values of K for different glaciers. We therefore vary K at intervals of 0.1 × 10⁸ m yr for Ryder and 79N, and at intervals of 10 and then 100 × 108 m yr−1 for Petermann Glacier. To quantitatively assess the performance of each simulation we compare the area difference between the observed terminus position at the end of 2024 and that produced by the calving law. This area difference is then divided by the length of the 2024 calving front, producing misfit values that are consistent between all three ice shelves of different sizes (Wilner et al., 2023). We note that this gives an absolute misfit value and does not consider the sign of misfit. For 79N, the quantitative misfit is based on the main eastern terminus.
For each calving law, we select the simulations in which the misfit with the observed calving front is minimised, and continue these experiments from 2025 to 2300. We also conduct additional transient simulations where calving fronts are kept fixed in our model (NO). Our transient simulations do not constitute future projections of the ice shelves, but are instead intended to assess if ice shelf evolution differs between the calving parametrisations under a warming atmosphere or ocean. We first complete a control run, in which SMB and ocean melt forcing remain unchanged from the initial calibration simulations, hereby referred to as the static scenario. We then perform a series of transient runs with perturbed climatic forcings. We begin by varying the atmospheric forcing with a high-emission SMB scenario SSP5-8.5 (CMIP6 forced ensemble mean RACMO ensemble), prescribed at monthly intervals (Noël et al., 2022), hereby referred smb8.5. Separately, the ocean melt rate is increased under the ice shelf, which has been the key driver of ice-shelf thinning in recent decades (Millan et al., 2023). We perturb ocean melt in accordance with results from ocean modelling simulations at Petermann's ice shelf by Cai et al. (2017), where raising ocean temperatures by 1, 2 and 3 °C results in increased sub-shelf melt by 25, 45 and 70 m yr−1, respectively. For our transient runs, we increase ocean melt rates in-line with ocean temperatures being 1 °C warmer by 2100, 2 °C by 2200 and 3 °C by 2300. We apply this increase linearly but through two different experiments. Firstly, to isolate the effects of increased melt near the grounding line, the highest melt rates in the linear depth profile are increased while maintaining zero melt in shallow waters. Secondly, the entire melt profile beneath the shelf is increased uniformly. These scenarios are referred to as oceanGL and oceanFull, respectively (Fig. 2d and e).
3.1 Calving Calibrations
Calibrating each calving law to observations exposes distinct sensitivities to its respective tuning parameters, which can vary between the three glaciers (Table 1). Calibration values for EC, MT, and PD are different across the three glaciers, whereas values for the VM and CD laws are similar. Here we examine the sensitivity of simulations to tuning parameters, and further assess the performance of each calving law on a glacier-by-glacier basis using the quantitative misfit values and the qualitative shape of the modelled terminus. As only minor differences in ice shelf and grounding line velocities are observed between the parametrisations (Figs. S1–S3 in the Supplement), ice dynamics are not included in the assessment of each law's performance.
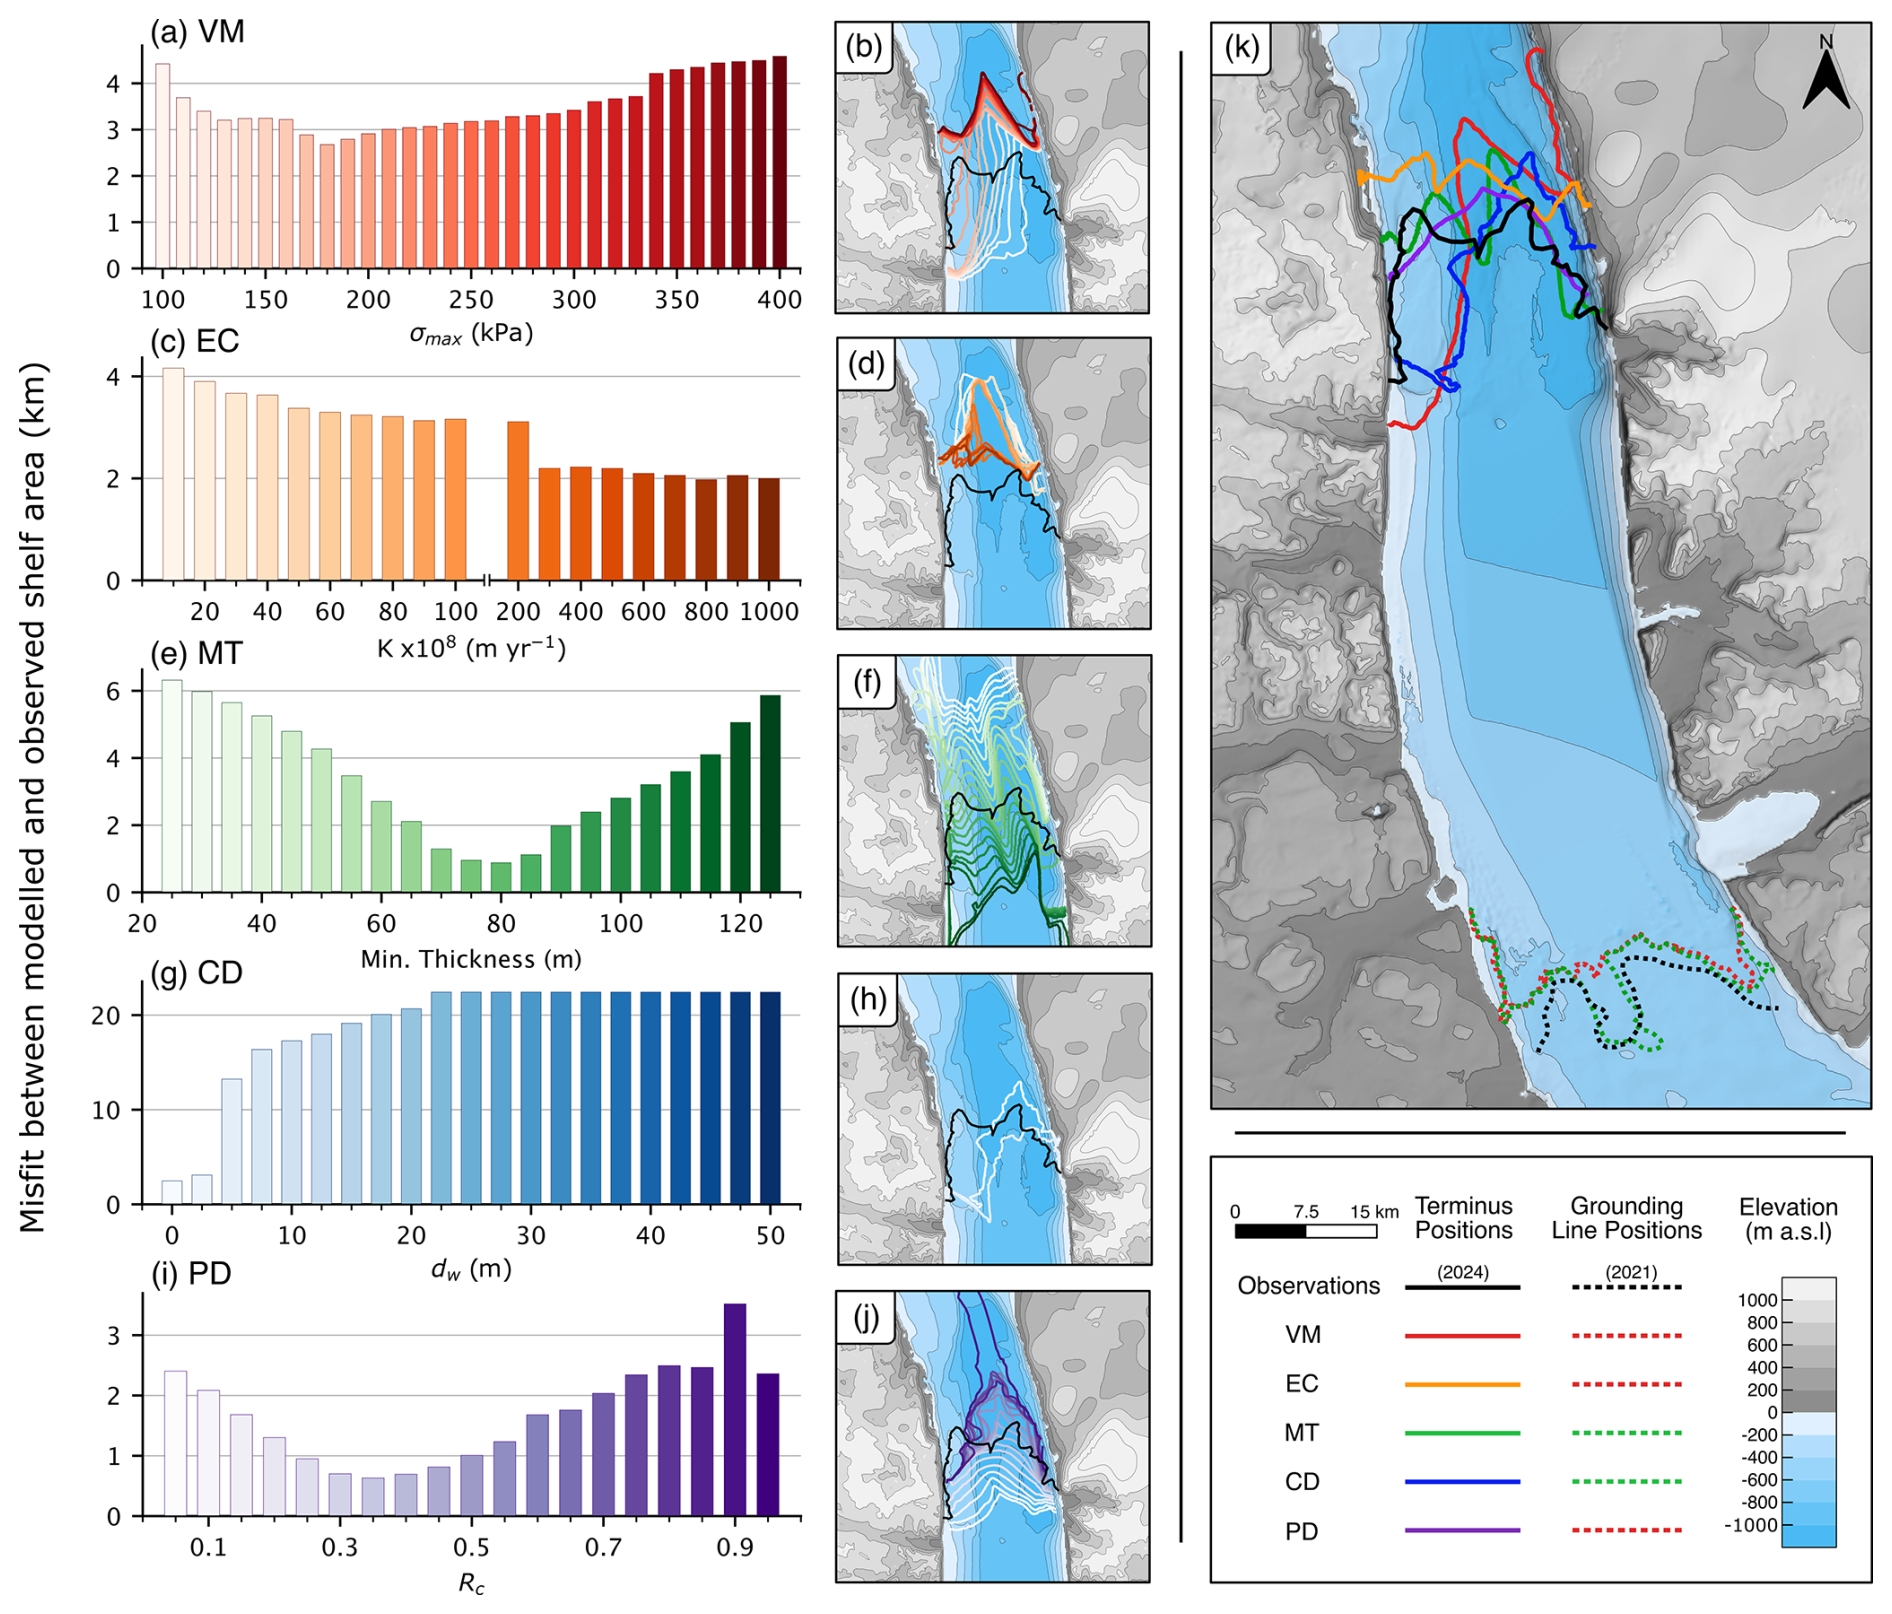
Figure 3Calving calibrations for Petermann Glacier. (a b) Results from the Von Mises calving law: (a) showing the quantitative misfit between the observed ice shelf area in 2024 against that produced by varying the law's tuning parameter and (b) final terminus positions of the various tuning runs against the 2024 terminus in black. Equivalent results for calving laws EC (c, d), MT (e, f) and CD (g, h) and PD (i, j). Only two modelled fronts are shown in panel (h), owing to exaggerated retreat from dw values greater than 2.5 m. (i, j) use = 4 km yr−1 for the PD law, other values of shown in Fig. S4 in the Supplement. (k) Comparison of final terminus and grounding lines positions for the chosen best-fit calibration values (Table 1) as well as the 2024 terminus position and 2021 grounding line (Millan et al., 2023). Note that grounding line positions for VM, EC and PD are consistent, as are grounding line positions for MT and CD.
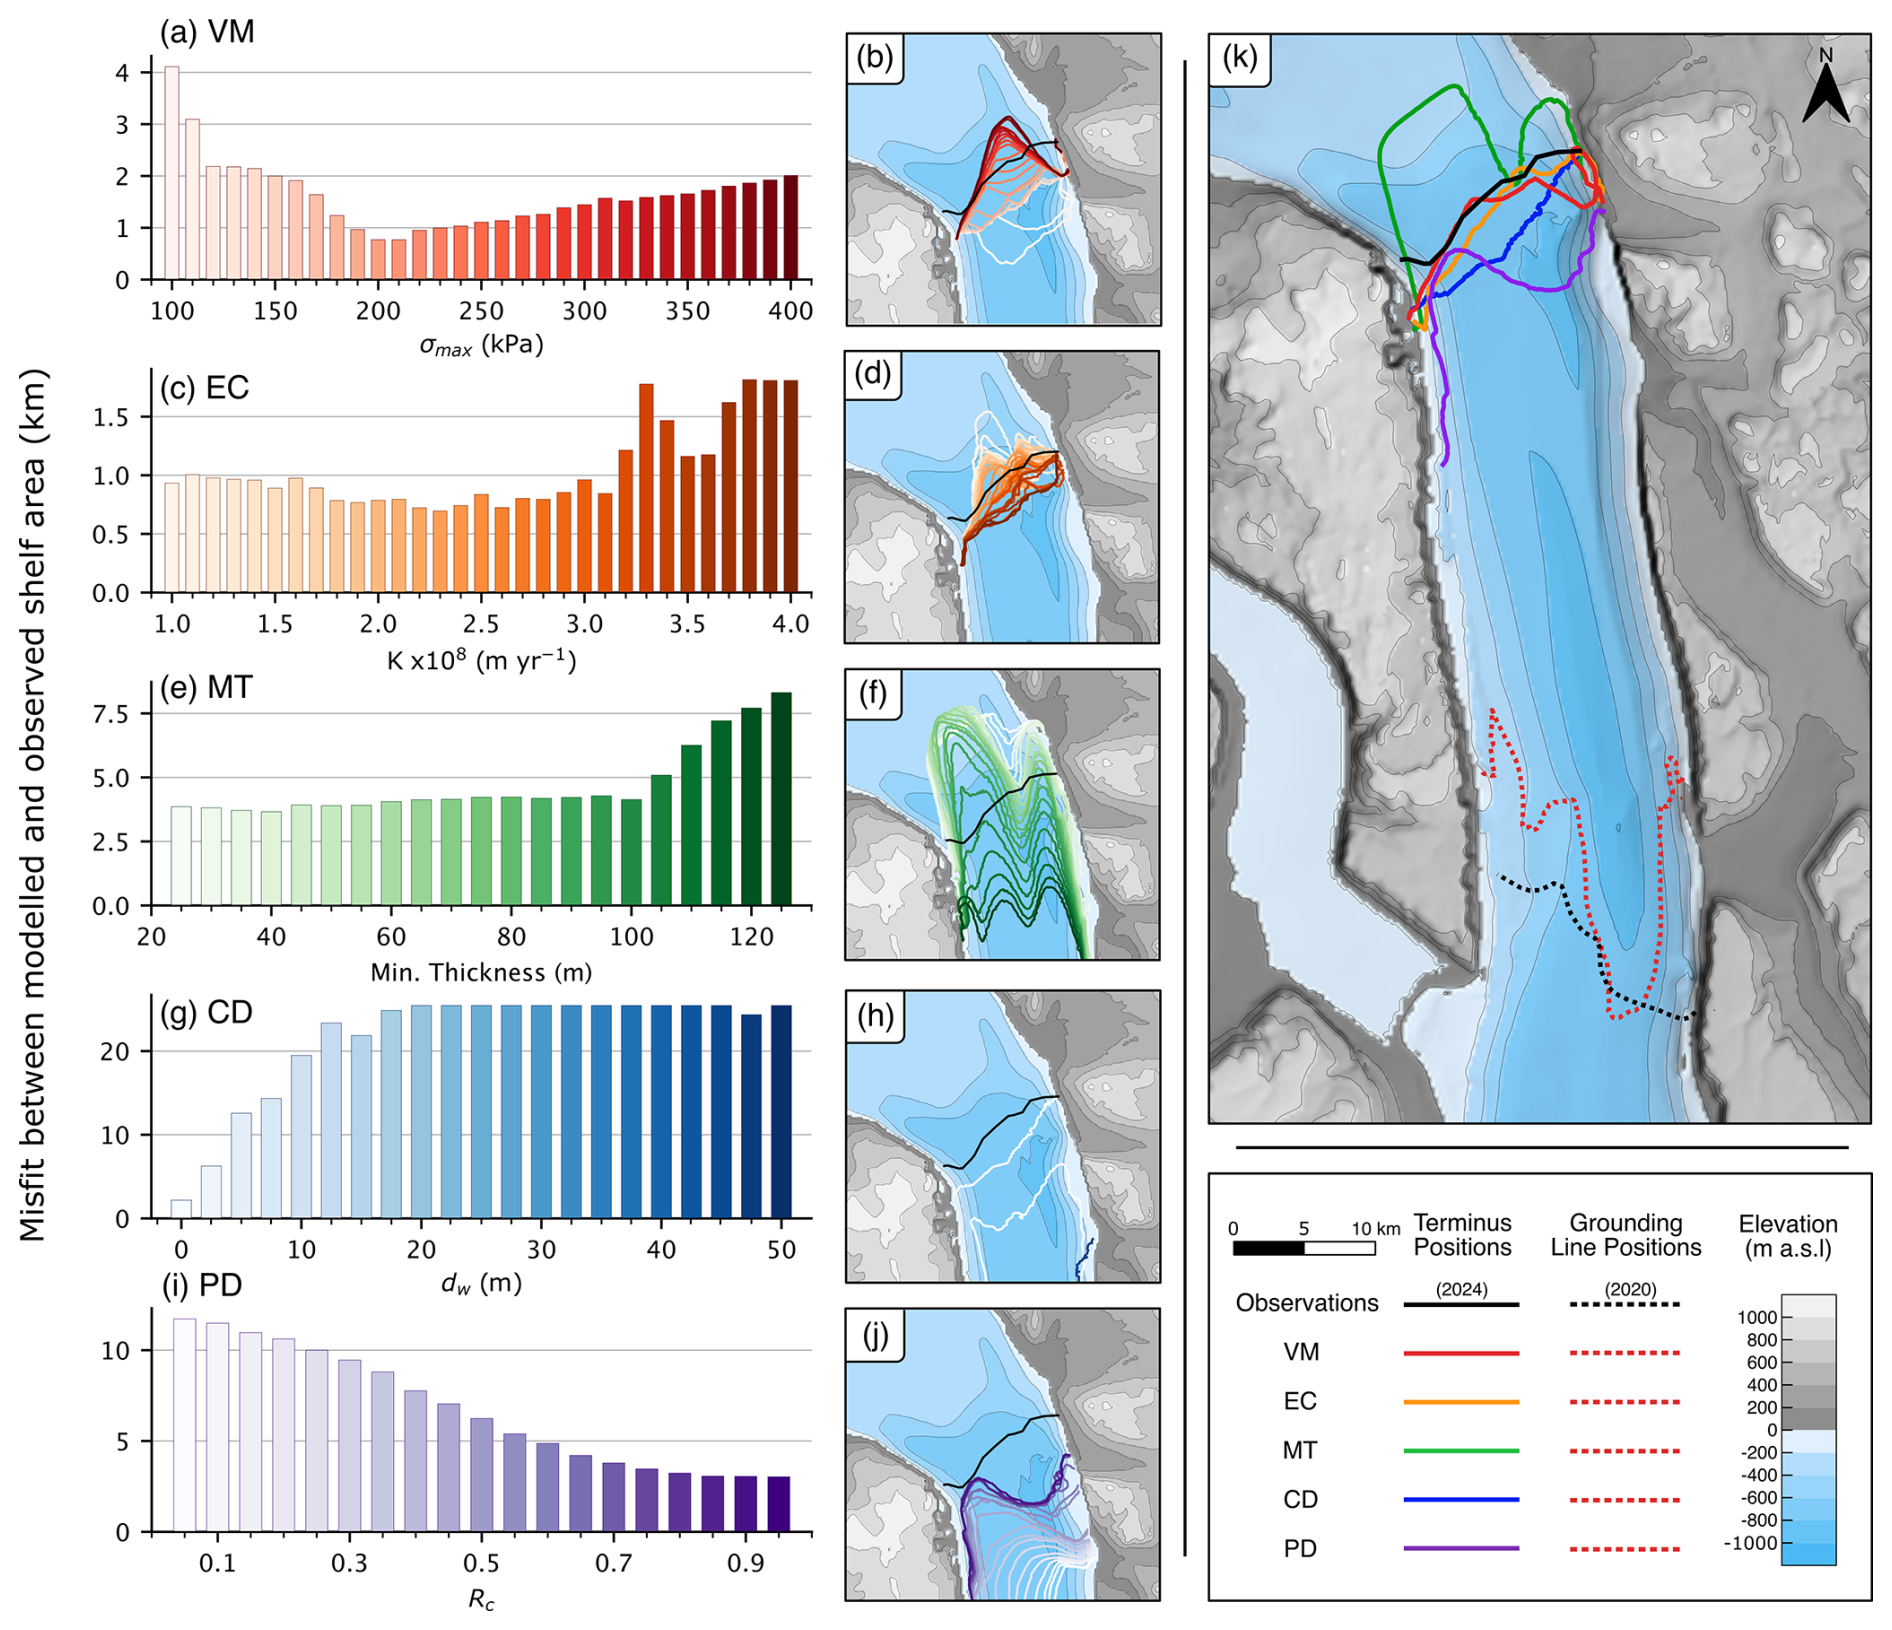
Figure 4Calving calibrations for Ryder Glacier. (a, b) Results from the Von Mises calving law: (a) showing the quantitative misfit between the observed ice shelf area in 2024 against that produced by varying the law's tuning parameter and (b) final terminus positions of the various tuning runs against the 2024 terminus in black. Equivalent results for calving laws EC (c, d), MT (e, f) and CD (g, h) and PD (i, j). Only two modelled fronts are shown in panel (h), owing to exaggerated retreat from dw values greater than 2.5 m. (i, j) use = 2 km yr−1 for the PD law, other values of shown in Fig. S4. (k) Comparison of final terminus and grounding lines positions for the chosen best-fit calibration values (Table 1) as well as the 2024 terminus position and 2021 grounding line (Millan et al., 2023). Note that grounding line positions are consistent across all calving laws.
At Petermann Glacier, two large calving events in 2010 and 2012 caused the ice shelf to retreat ∼ 40 km. Modest regrowth by 2024 has left Petermann's ice shelf extending ∼ 60 km from the grounding line, with the final ∼ 15 km of the ice tongue detached from the fjord walls (Figs. 1a and 3k). Retreat of the ice front using the VM calving law only occurs with values of σmax below 300 kPa, and only on the western side of the ice shelf (Fig. 3a and b), producing an adequate magnitude of ice front change but a poor match to its shape. The EC law struggles to produce the observed retreat the ice front at Petermann, requiring values of K above 300 × 108 m yr (Fig. 3c and d), which is of orders of magnitude larger than for Ryder and 79N (Table 1). For MT, the choice of hmin can cause a substantial advance or retreat of the terminus (Fig. 3e and f). The shape of the ice front is, however, consistent across all tuning values of MT and, of all calving laws, is most akin to the observed 2024 front. The CD law is especially sensitive to the prescribed water in crevasses (dw), with values above 2.5 m resulting in excessive retreat of the ice shelf (Fig. 3g and h). No values of dw allow Petermann's shelf to advance. Finally, the PD law is sensitive to both the values of rc and (Figs. 3i, j and S4a), with greater retreat at the edges of the ice shelf compared to the central section.
To simulate a retreating shelf front requires an increased calving flux, and we find that the thresholds to calve for the VM, MT and PD laws are lower than required at the other glaciers (Table 1). The smallest quantitative misfits to the observed ice shelf front are simulated using the laws PD (0.6 km) and MT (0.8 km), matching the detached shape of the observed shelf on the eastern fjord wall, although it remains entirely connected to the western fjord wall (Fig. 3k). This is contrasted by the CD (2.4 km) and VM (2.5 km) laws, which fail to match the shape of Petermann's terminus due to excessive calving on the western side of the ice shelf. Nonetheless, the sensitivity to different tuning values in the VM law is low compared to the other laws. The EC law (1.9 km) is unable to retreat the ice front to Petermann's 2024 position.
Ryder Glacier's ice shelf has terminated at a widening section of Sherard Osborn Fjord for several decades, where it remains connected to the fjord walls on both sides (Fig. 1b). Both VM and EC laws produce small misfits across our full range of tuning values (Fig. 4a–d); sensitivity to these tuning parameters is low. The choice of thickness threshold in the MT law again allows for ice front retreat or advance, producing large variability in ice front position across our range of tuning values. Owing to thickness differences at Ryder's shelf the single thickness-to-calve threshold produces an unevenly shaped terminus (Fig. 4e and f) and a pronounced mismatch from the observed frontal shape. The CD law has the same impact as seen at Petermann Glacier, where only retreat of the ice shelf is simulated and dw values greater than 2.5 m cause excessive retreat (Fig. 4g and h). The shelf also retreats for all values of rc in the PD law, with lower values promoting retreat on the western side of the shelf after it detaches from the fjord walls (Fig. 4i and j).
The shape and position of the shelf front is best matched by the EC (0.7 km) and VM (0.8 km) laws (Fig. 4k), although the latter calves to a greater extent than observed on the eastern side of the terminus. Despite a greater quantitative misfit for the CD law (2.1 km), the simulated ice front is uniform in shape and terminates near the widening of Sherard Osborn Fjord, as observed. The MT law (3.6 km) and PD law (3 km) both fail to match Ryder's 2024 position.
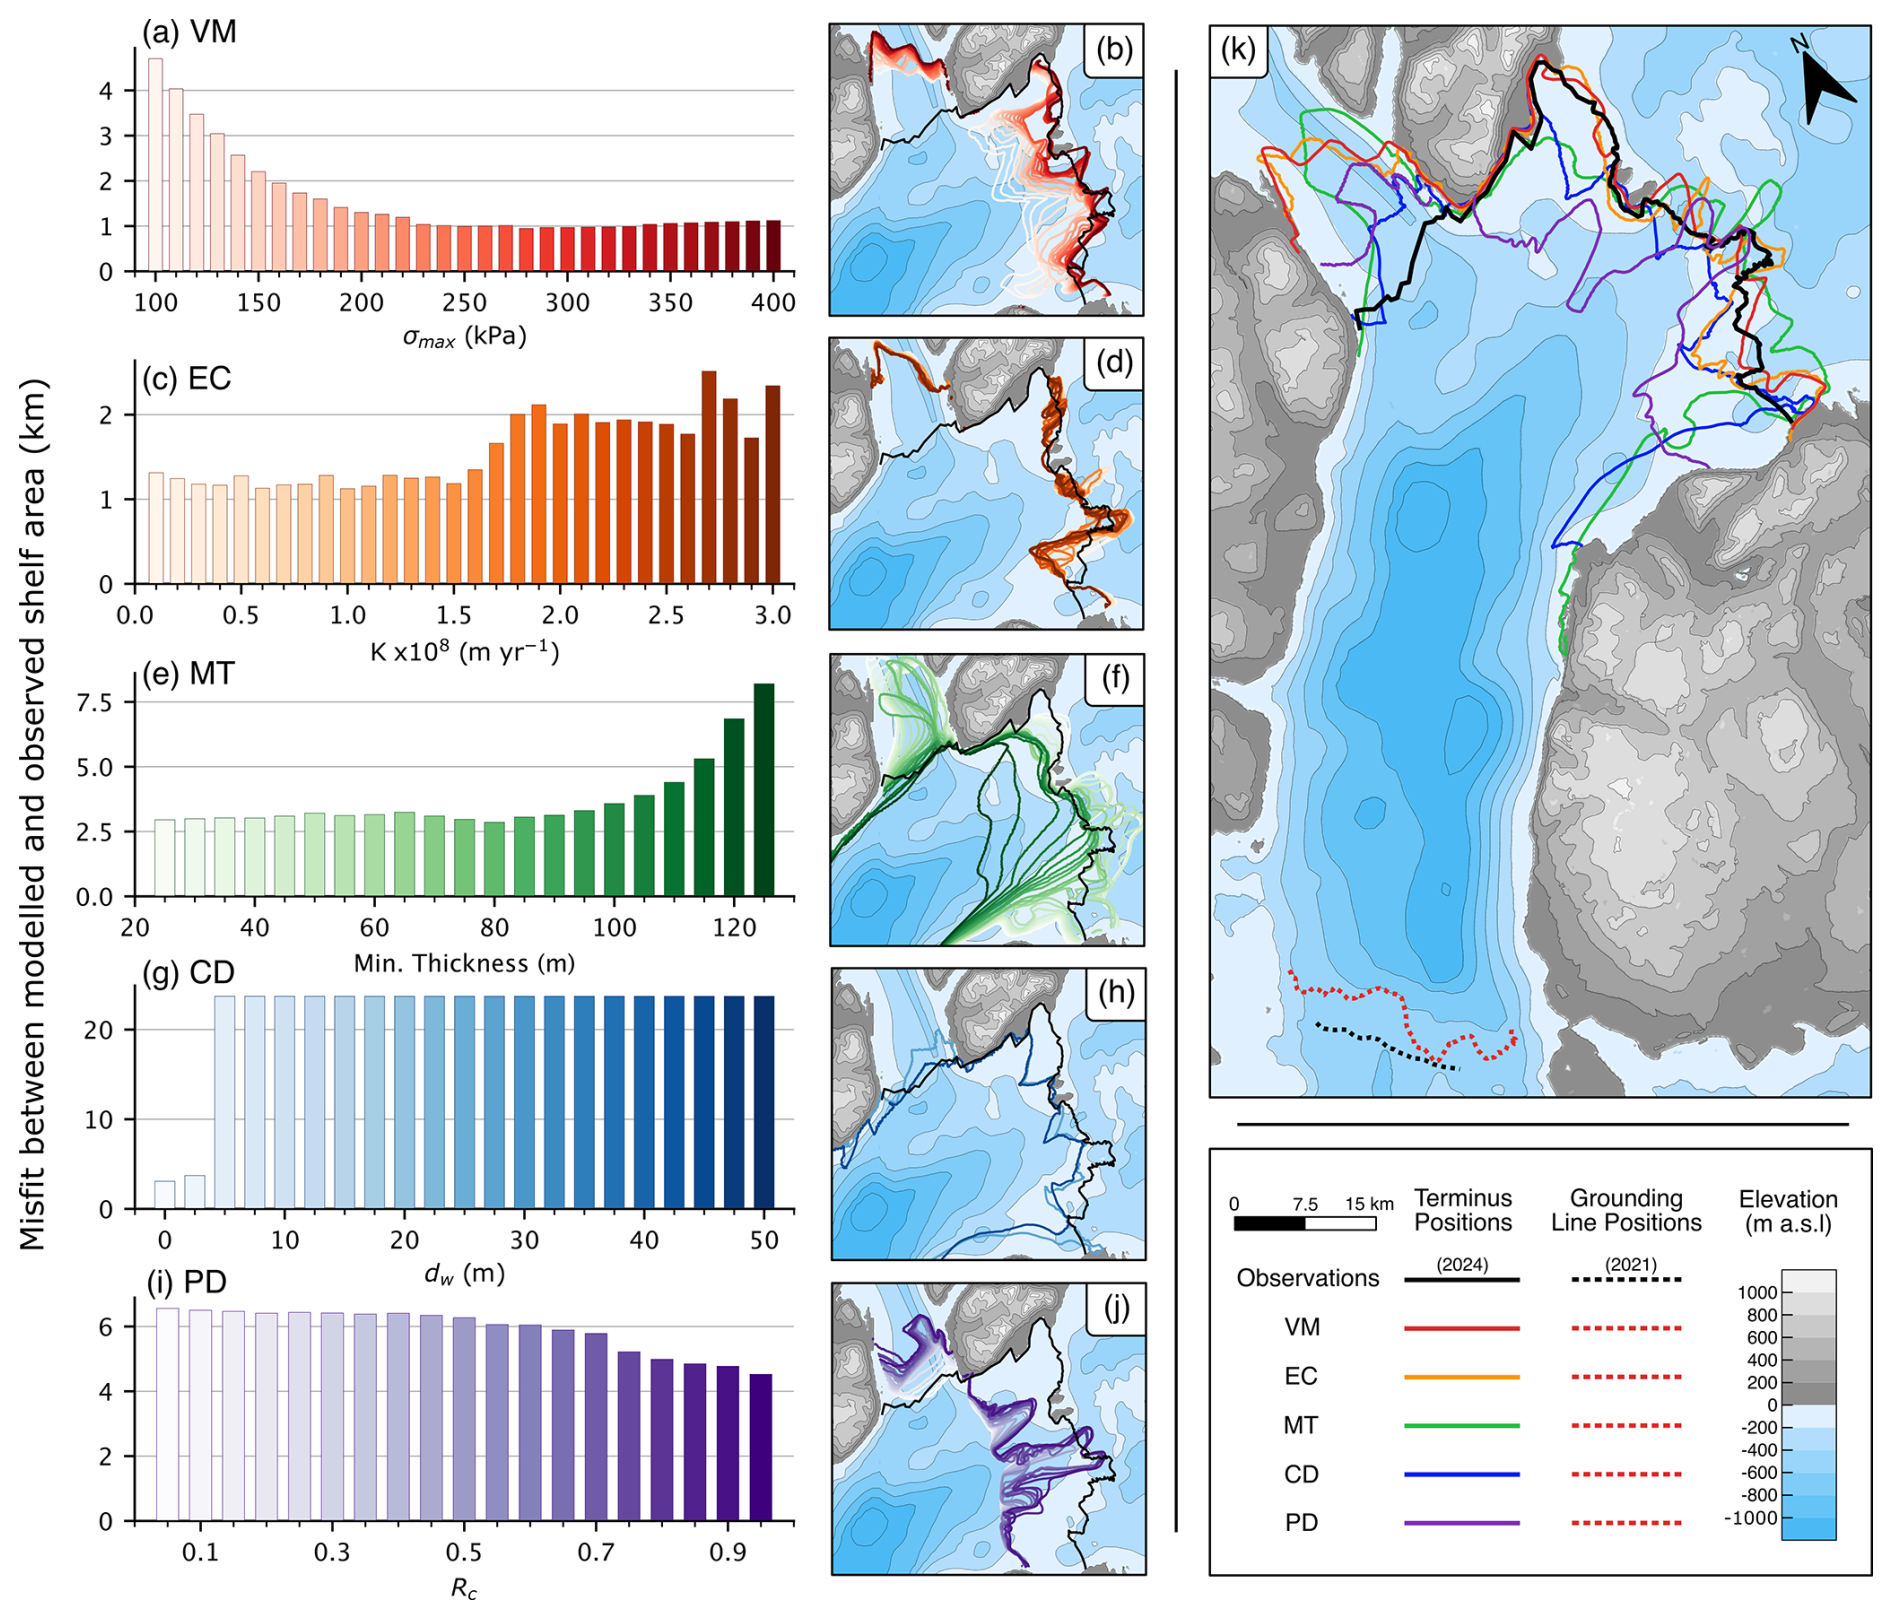
Figure 5Calving calibrations for 79N. (a, b) Results from the Von Mises calving law: (a) showing the quantitative misfit between the observed ice shelf area in 2024 against that produced by varying the law's tuning parameter and (b) final terminus positions of the various tuning runs against the 2024 terminus in black. Equivalent results for calving laws EC (c, d), MT (e, f) and CD (g, h) and PD (i, j). Only two modelled fronts are shown in panel (h), owing to exaggerated retreat from dw values greater than 2.5 m. (i, j) use = 2 km yr−1 for the PD law, other values of shown in Fig. S4. (k) Comparison of final terminus and grounding lines positions for the chosen best-fit calibration values (Table 1) as well as the 2024 terminus position and 2021 grounding line (Millan et al., 2023). Note that grounding line positions are consistent across all calving laws.
79N's main terminus has remained stable for several decades, grounded on ice rises that act to both stabilise the ice shelf and initiate crevasse propagation. The ice shelf's smaller northern terminus calved away in 2020 (Fig. 1c). Both the VM and EC laws give small misfits against the 2024 position of 79N across a range of calibration values (Fig. 5a–d); the performance of VM is near-identical at values of σmax > 200 kPa. Despite this, neither law produces a retreat of 79N's smaller northern shelf terminus across all calibration values tested here. Using a threshold of hmin = 90 m for the MT law does cause retreat of the northern terminus, although at the expense of greater retreat of the main terminus away from the bedrock highs (Fig. 5e and f). Only the CD law captures the retreat of the northern terminus while also maintaining the position of the main shelf edge, yet similar to Petermann and Ryder glaciers, the law is extremely sensitive to dw, with values greater than 2.5 m causing the shelf to collapse (Fig. 5g and h). For PD, the choice of rc has relatively little impact on the ice front, with a large retreat of up to 10 km occurring across all calibration values (Fig. 5i and j). This insensitivity is consistent across all values (Fig. S4).
The position of the main terminus is best matched using the VM (0.9 km) and EC (1.1 km) laws (Fig. 5k). Both laws are capable of matching the extent and shape of the ∼ 50 km long main terminus, although they fail to retreat the smaller northern ice front. The position-based MT (2.8 km) and CD (3.0 km) laws also simulate a main terminus that is similar to observations, albeit with exaggerated calving in the southeastern section of the ice shelf which is heavily fractured, resembling a matrix of sea ice and icebergs (Fig. 1c; Humbert et al., 2023). The largest misfit comes from the PD law (4.4 km), where the ice shelf retreats at an uneven rate, with large regions entirely detached from the ice rise pinning points and retreated 10 km behind the 2024 position.
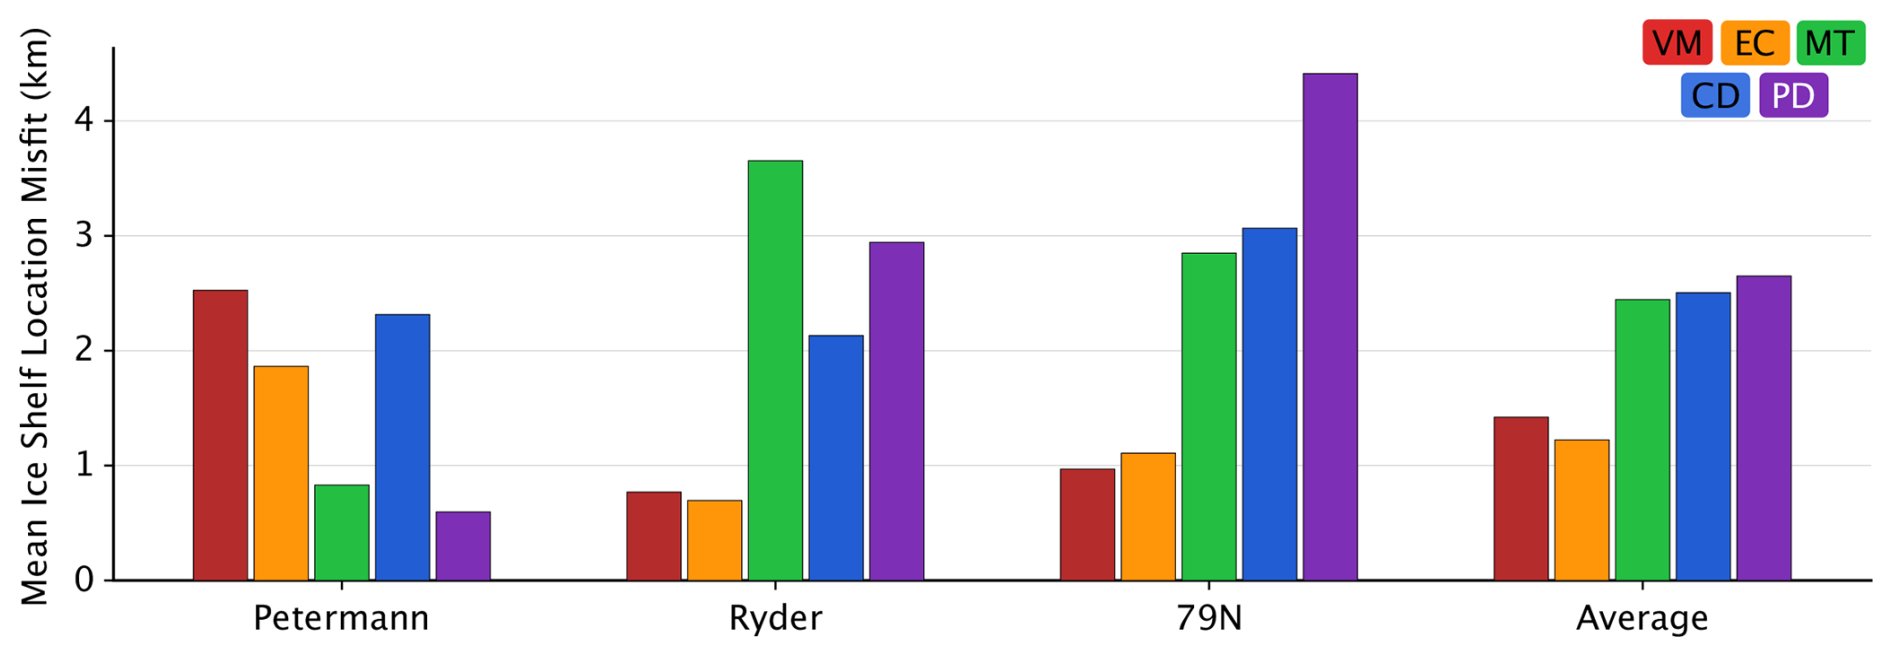
Figure 6Misfit between modelled and observed shelf locations at the end of the calibration simulations for each calving law using tuning values that provide the best fit to terminus observations in 2024 (Table 1).
We find that, on average across our three glacier experiments, the VM and EC laws produce the smallest quantitative misfit between modelled and observed front positions, with MT, CD and PD all exhibiting slightly larger misfits (Fig. 6). However, the performance of these calving laws varies between glaciers. VM and EC produce the smallest misfit at Ryder and 79N yet relatively larger misfits at Petermann Glacier. In contrast, MT and PD performed best at Petermann, while relative misfits for CD were consistent across all three glaciers.
3.2 Transient Results
With the five calving laws now calibrated to the recent behaviour of the three ice shelves (Table 1), we continue these simulations until the year 2300 to understand if the choice of calving parameterisation impacts future ice shelf evolution and discharge rates, given different climate forcings. Four different transient climate forcings are applied: static, where ocean melt and SMB are kept unchanged from the calibration simulation, smb8.5, where the SMB is perturbed in accordance with the high-emission SSP5-8.5 from the RACMO ensemble (Noël et al., 2022), oceanGL, where sub-shelf melt rates are increased only toward the grounding line, and oceanFull, where sub-shelf melt rates rise across the entire melt-profile (Cai et al., 2017).
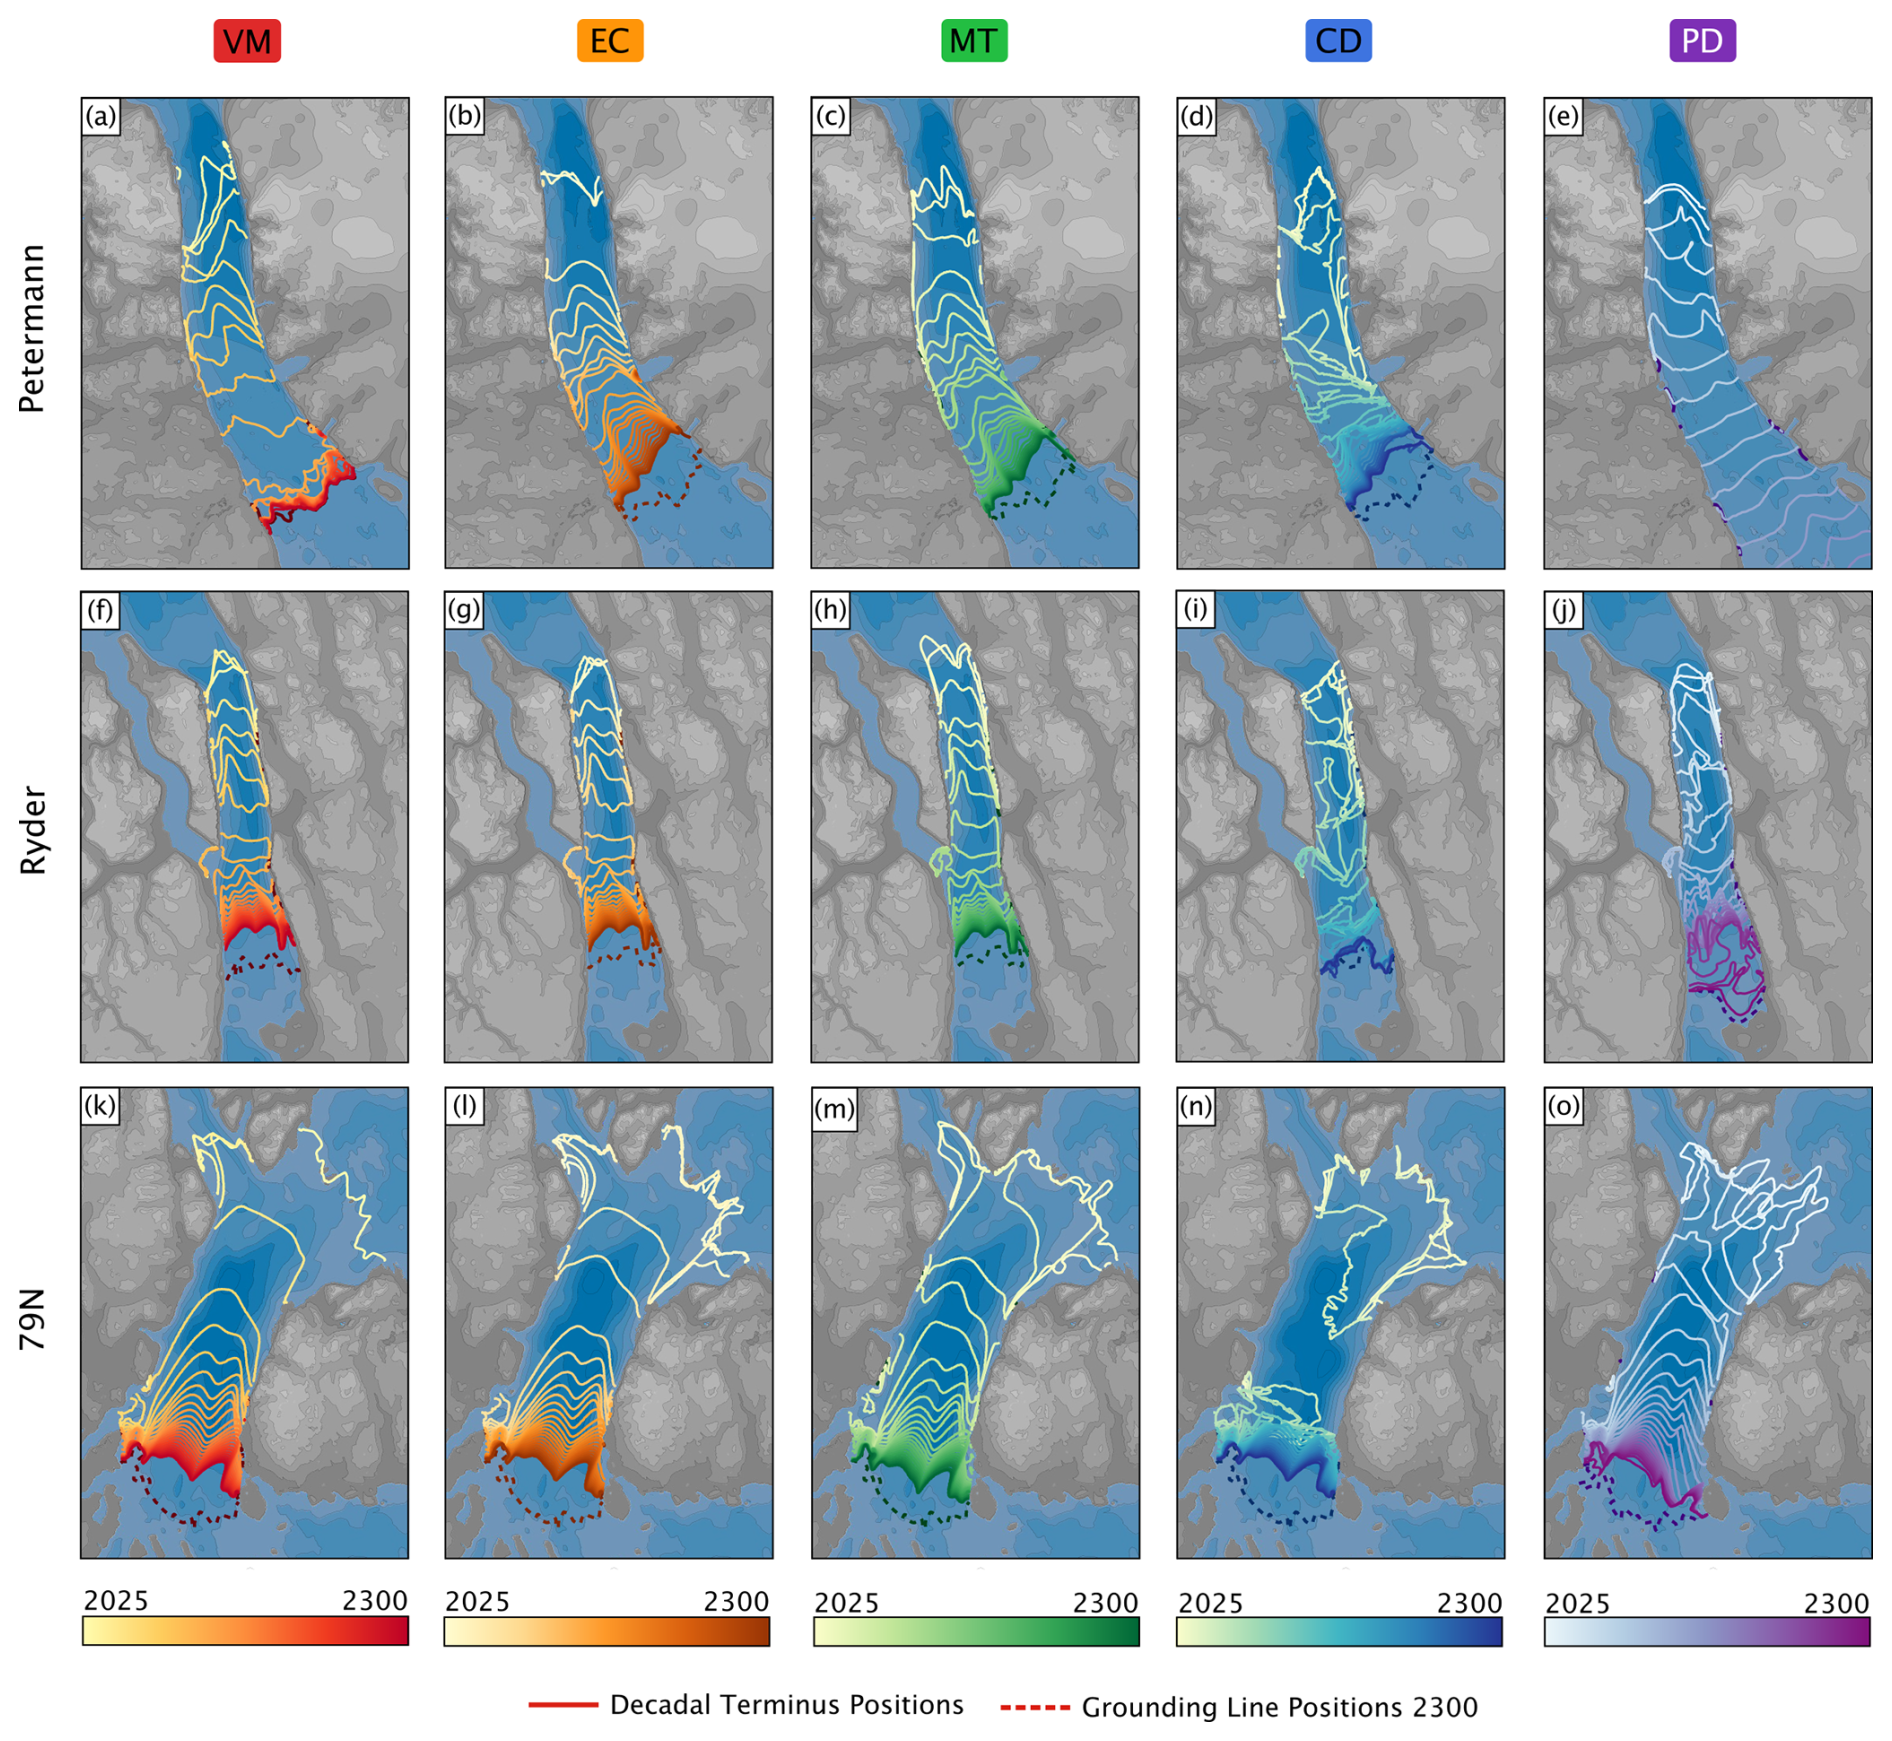
Figure 7Evolution of the three remaining Greenlandic floating ice shelves from 2025 to 2300 under the oceanFull scenario using the five different calving laws. Terminus positions at the end of every 10 years, and including 2300, are shown with solid lines while the grounding line position in 2300 is shown with a dashed line.
The choice of calving parametrisation produces contrasting calving styles and ice-shelf evolution in transient simulations (Figs. 7 and S5–S7 in the Supplement). Taking oceanFull forcings simulations as an example (Fig. 7), we find that across all three ice shelves the rate-based VM and EC laws consistently produce a smooth shaped ice front that spans the fjord width. The rate of retreat is similar to that in the position-based MT law (Fig. 7c, h and m). CD and PD laws induce different behaviour of the ice shelf. For CD, the position-based calving style produces irregularly shaped, crenulate termini, with uneven retreat rates across the width of the ice shelf (e.g. 7i). Furthermore, retreat using CD occurs faster than the aforementioned laws, simulating large calving events that remove substantial parts of the ice shelf (e.g. Fig. 7n). The PD law produces calving styles and an ice-front shape that are, at some time steps and in some settings, similar to the rate-based VM and EC laws (e.g. Fig. 7o), and in other intervals comparable to the crenulate shelf front seen in CD (e.g. Fig. 7j). The PD law also produces the greatest magnitude and speed of retreat.
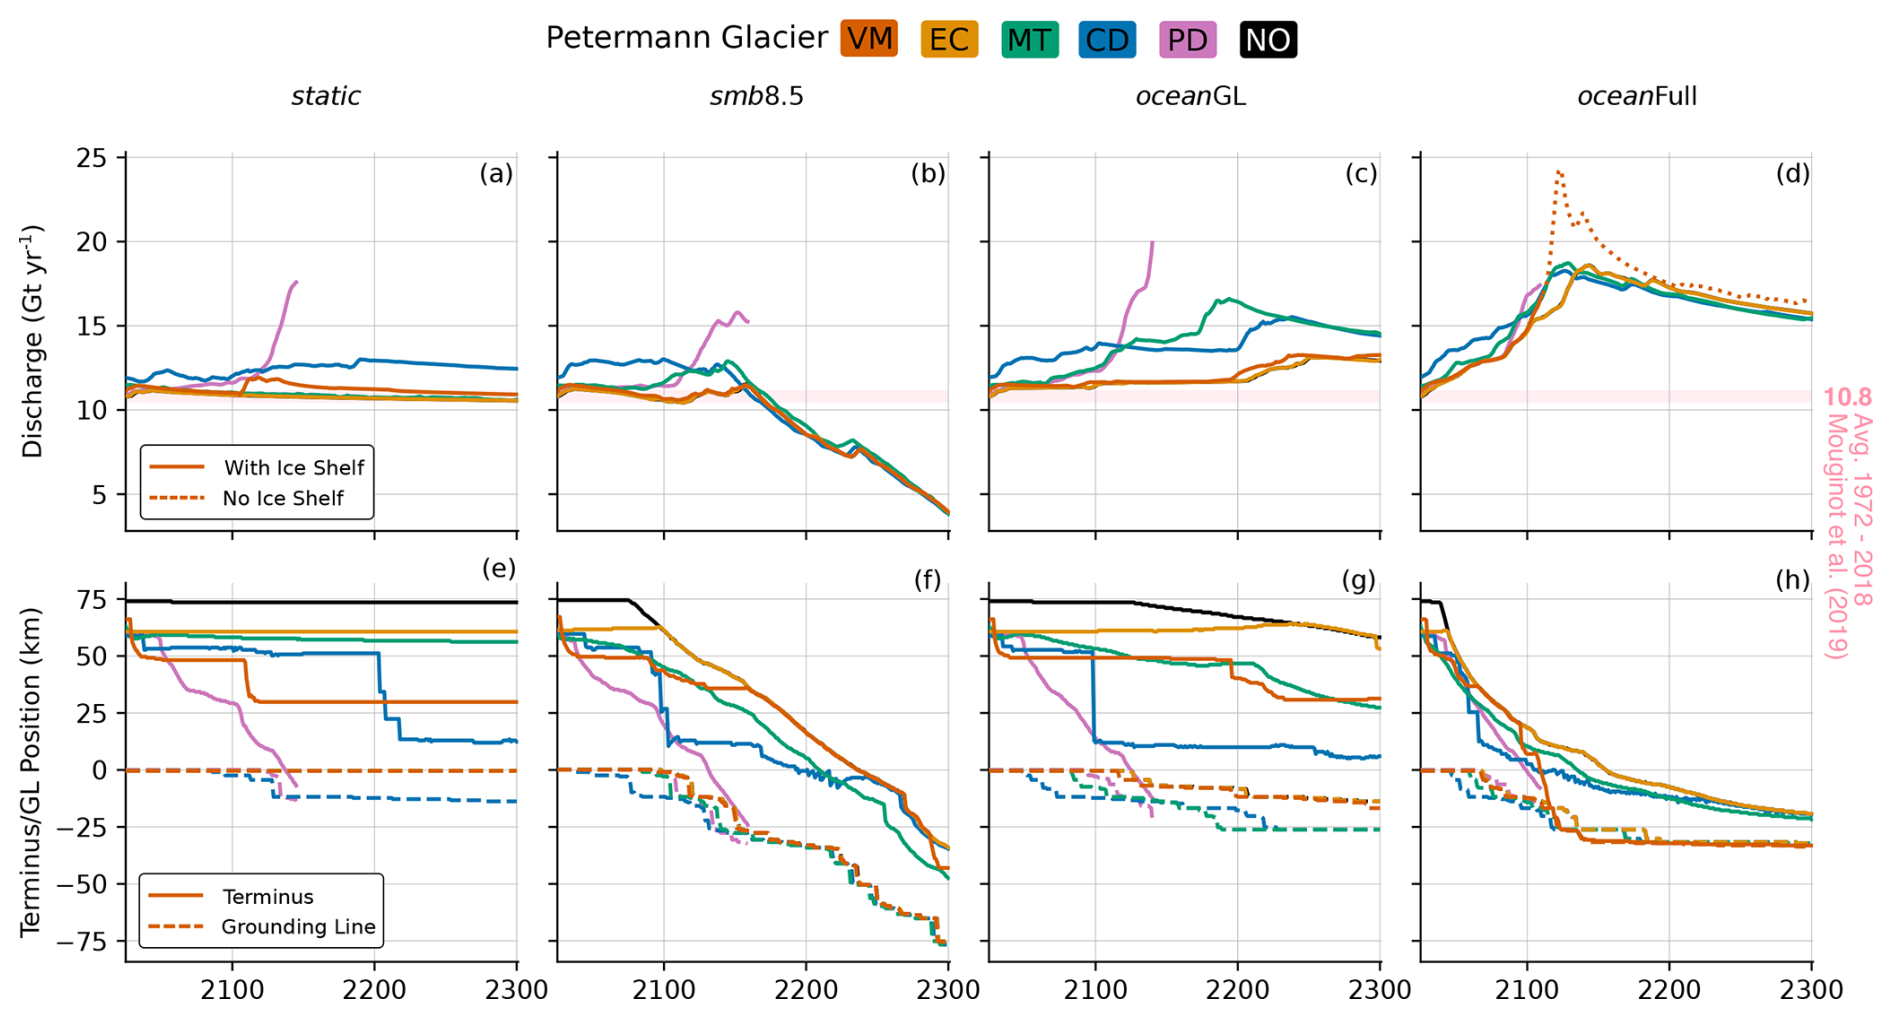
Figure 8Model results for transient simulations of Petermann Glacier to 2300 across different calving laws; VM (red), EC (orange), MT (green), CD (blue), PD (purple) and a simulation with calving turned off (NO, black). (a–d) Annual discharge rates, the transition from a solid to dotted line represents the collapse of the ice tongue to grounded calving front. (e–h) Changes in terminus (solid) and grounding line (dashed) positions with respect to their observed positions at Petermann Glacier in 2024 along a central flowline.
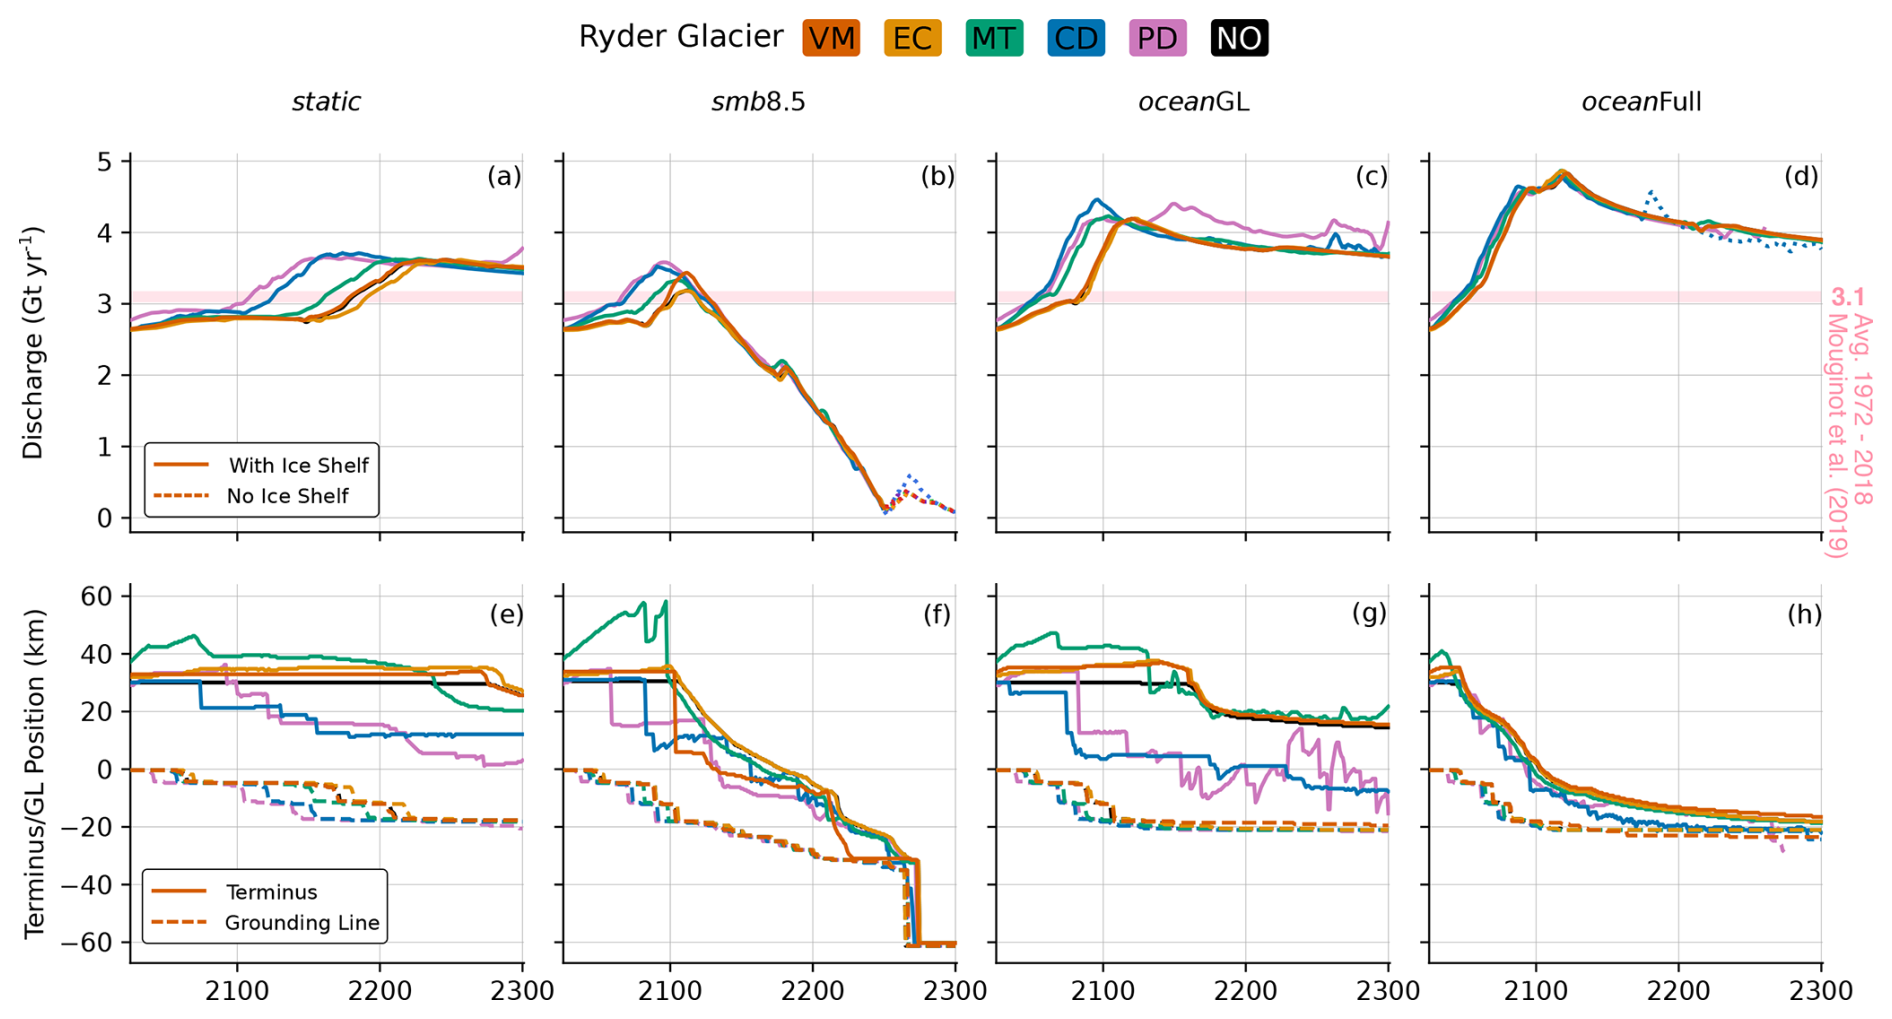
Figure 9Model results for transient simulations of Ryder Glacier to 2300 across different calving laws; VM (red), EC (orange), MT (green), CD (blue), PD (purple) and a simulation with calving turned off (NO, black). (a–d) Annual discharge rates, the transition from a solid to dotted line represents the collapse of the ice tongue to grounded calving front. (e–h) Changes in terminus (solid) and grounding line (dashed) positions with respect to their observed positions at Ryder Glacier in 2024 along a central flowline.
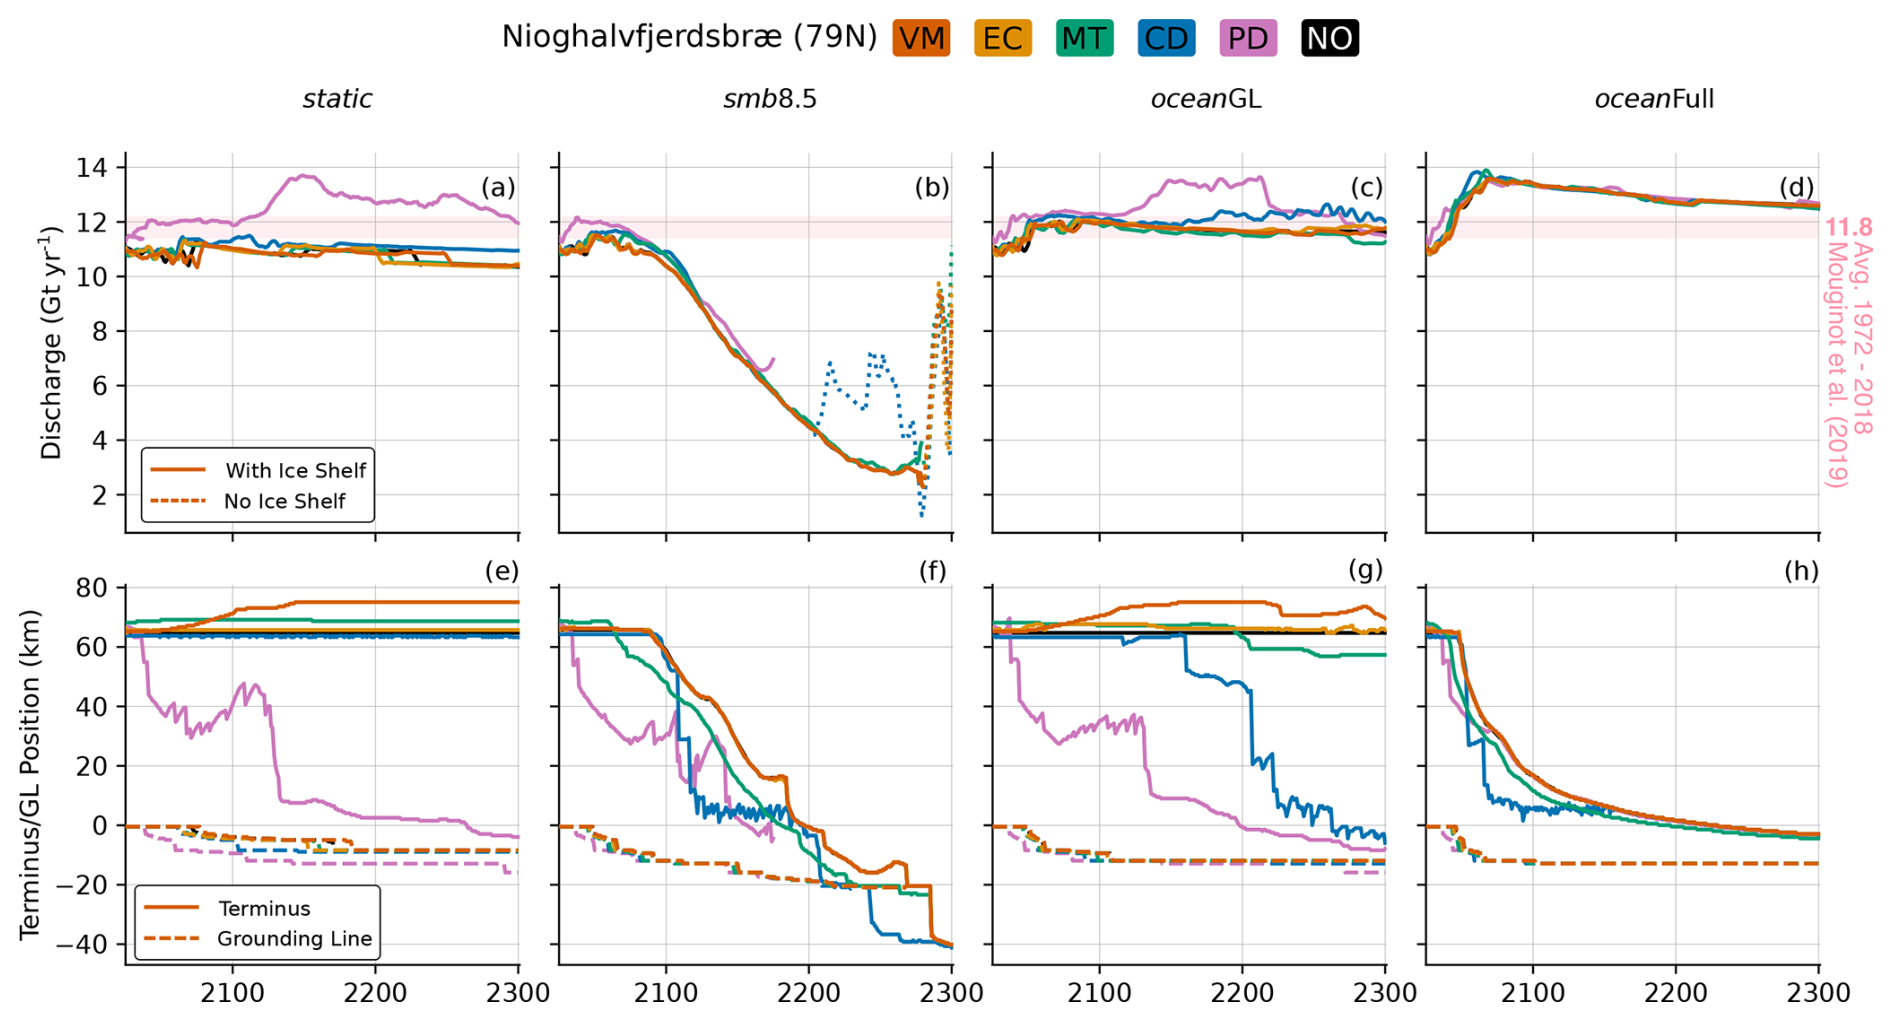
Figure 10Model results for transient simulations of 79N to 2300 across different calving laws; VM (red), EC (orange), MT (green), CD (blue), PD (purple) and a simulation with calving turned off (NO, black). (a–d) Annual discharge rates, the transition from a solid to dotted line represents the collapse of the ice tongue to grounded calving front. (e–h) Changes in terminus (solid) and grounding line (dashed) positions with respect to their observed positions at 79N in 2024 along a central flowline.
Despite variations in calving styles and transient ice shelf extents, we find that fluctuations in discharge rates, the flux of ice over the grounding line, and grounding line evolution, are largely dictated by the choice of climate forcing (Figs. 8, 9 and 10). In summary, the static forcing maintains discharge rates at approximately contemporary levels and the grounding line position is mostly stable; smb8.5 drives a decline in discharge rates after 2100 due to ice thinning and a reduction in ice flux across the grounding line, while the grounding line retreats. In both oceanGL and oceanFull scenarios, discharge increases above contemporary levels, with the latter causing the largest increase in discharge rates and the largest ice shelf retreat; both forcings drive modest retreat of the grounding line. Within each climate scenario, while the ice shelf evolution is variable (e.g. Fig. 7), the choice of calving law brings only minor differences in discharge rate and grounding line positions.
The different calving laws at Petermann Glacier largely follow the same trend in grounding line behaviour and discharge within each climate scenario, yet there are subtle differences in discharge rates between the position and rate-based laws. The position-based laws (CD and MT) exhibit elevated (10 %–20 %) discharge rates and earlier or faster grounding line retreat. In both cases, we attribute this to detachment of the shelf from the fjord walls and loss of lateral friction, due to excessive calving on the eastern side of Peterman's shelf early in the simulations for CD law (Figs. 7d, S5d and S6d in the Supplement) or due to calving of thin ice on the shelf edge for MT (Fig. 8c). Discharge rates are, for the most part, lower for the two rate-based laws (Fig. 8), where a connection to both fjord walls is maintained. For EC, ice shelf evolution is inline with our simulations without calving (NO). For VM, the ice shelf calves back either gradually or through larger events (e.g. Fig. 8g), resulting in a shorter ice shelf compared to EC. Despite the eventual contrasts in shelf length (e.g. Fig. 8e and g), and while calving events may induce a small immediate response in discharge rates, there is little to no difference in discharge rates between the two laws.
At Ryder Glacier, there is less variation in discharge rates and in grounding line positions between the calving laws than at Petermann Glacier. A step increase in discharge occurs across all climate forcings, from ∼ 3 to at least ∼ 3.5 Gt yr−1 (Fig. 9a–d), reflecting the retreat of Ryder's grounding line into deeper waters on the western side of the fjord (Fig. 4k). Thereafter, the trajectories of the discharge rate differ according to climate forcing, whereas the choice of calving law produces even less variation in discharge rates and grounding line position than at Petermann Glacier. This retreat occurs first when using the PD law, followed by position laws CD and MT, and then rate laws VM and EC. The magnitude of grounding line retreat and increase in discharge does not differ between the parametrisations and after 2100 show near-identical trajectories within a given climate scenario, despite contrasting shelf extent.
At 79N, rate-based VM and EC laws as well as position-based MT, produce near-identical discharge rates and grounding line positions under a given climate scenario. The shelf front position is also similar between these laws, whether retreating (smb8.5, oceanFull; Fig. 10f and h) or stable, grounded on ice rises (static, oceanGL; Fig. 10e and g). For the most part, the CD law produces similar grounding line responses to the other laws, despite larger calving events and shelf front retreat; there is a minor increase in discharge under oceanGL forcing when the CD law triggers shelf retreat from Hovgaard Island (Fig. 10c and g).
The only pronounced deviations in discharge trends – in magnitude, timing, and between calving laws – occur in association with major calving events or complete loss of the ice shelf. Such events are rare. Most often, these calving or collapse events occur in the PD law. At Petermann Glacier, simulations using the PD law follow the same behaviour independent of climate forcing, where Petermann's ice shelf retreats at a consistent rate until it is entirely lost shortly after 2100 (Fig. 8e–h). An acceleration in ice discharge rates occurs only once the shelf is shorter than ∼ 10 km in length. Petermann's ice shelf also collapses under the oceanFull scenario and the VM law, as ice discharge at the grounded front accelerate to ∼ 24 Gt yr−1 (Fig. 8. Again, discharge rates only diverge from the other calving laws when the shelf is almost lost. At 79N, the PD law produces two large-scale (20–40 km) and abrupt shelf retreats under static and oceanGL scenarios, where the ice shelf detaches from ice rises and from Hovgaard Island (e.g Fig 10e–g). Retreat from Hovgaard Island under static and oceanGL causes a modest increase in discharge from ∼ 12 to ∼ 14 Gt yr−1.
4.1 Ice Shelves and Calving Calibrations
The current calving laws used in ice-sheet modelling contain a tuning parameter to bridge the gap between simplified models and complex real-world processes that cause calving events. By performing an ensemble of calibration simulations, where each calving law investigated here is tuned to Petermann, Ryder, and 79N's recent behaviour, we complement and expand on previous studies that have assessed the performance of calving laws at marine-terminating outlet glaciers (Choi et al., 2018; Amaral et al., 2020; Wilner et al., 2023). When assessing a law's performance we have taken into account both the quantitative and qualitative misfits from observations, as well as the law's sensitivity to its respective tuning parameters, which would influence its suitability in large continental-scale ice sheet modelling studies.
The two best performing laws in our quantitative assessment were VM and EC (Fig. 6). The former is a common choice in many ice sheet modelling studies (e.g. Morlighem et al., 2016; Choi et al., 2021; Åkesson et al., 2021), and has performed well in other systematic calving comparison studies, both at grounded Greenlandic outlet glaciers (Choi et al., 2018) and Antarctic ice shelves (Wilner et al., 2023). Despite proving functional across a wide range of glacial settings, VM requires tuning on a glacier-by-glacier basis with bespoke values of σmax needed to achieve optimal performance. This may impede its use in continental-scale ice-sheet studies that often employ uniform calving parameter values (e.g. Delhasse et al., 2025). Choi et al. (2018) found values of σmax required to match recent terminus fluctuations of grounded Greenlandic ice fronts varied from 500–3000 kPa (Choi et al., 2018), while Wilner et al. (2023) find that a narrower range of smaller values between 150–400 kPa were suitable for Antarctic ice shelves. For the three Greenlandic ice shelves explored here, required σmax values are even more concentrated, between 180–280 kPa (Table 1), and the differences in performance across our tested range of VM thresholds are small (Figs. 3, 4 and 5). Therefore, the law appears suitable for continental-scale ice-sheet simulations, provided that the model can discriminate between grounded and floating ice.
The EC law was designed to capture the calving dynamics of large ice shelves that terminate in unconfined embayments (Levermann et al., 2012). With a first-order dependency on strain rate tensor, the law naturally performed well at Ryder Glacier and 79N, which both have terminated at the head of an embayment for several decades (Figs. 4 and 5). However, at Petermann Glacier, where the importance of lateral strain rates is reduced owing to retreat through a narrowing section of the fjord, the law struggled (Fig. 3c and d). Our findings align with results from other systematic calving studies. For Antarctic ice shelves, which predominantly terminate at the opening of embayments where lateral support is lost, Wilner et al. (2023) found the law performed well, requiring values of K between 0.2 and 4 × 10⁸ m yr (with the exception of Larsen C that required a K of 300 × 108 m yr) in-line with our calibrations at Ryder and 79N (Table 1). At grounded Greenlandic glaciers, which have often begun to retreat into confined in narrow fjords where perpendicular strain-rates are small, Choi et al. (2018) highlights how the EC law struggles to match terminus position changes. Even though the EC law performed well in our simulations over the tuning period, with future retreat of Ryder Glacier and 79N set to occur in a narrowed fjord environment, akin to Petermann Glacier, the EC parameterisation would likely be unsuitable for Greenlandic ice shelves.
Thin ice at the termini of Greenlandic ice shelves means that the required hmin threshold in the MT law (40–75 m) is an order of magnitude smaller than that required for the corresponding Antarctic floating ice masses (215–410 m, except 55 m for Shackleton ice shelf; Wilner et al., 2023). The law performed best at Petermann Glacier, where ice thickness variations across the shelf produce a terminus shape similar to observations (Fig. 3). This spatial variability in ice thickness is driven by a number of sub-shelf melt plumes that produce channels of concentrated high melt rates (Wilson et al., 2017; Prakash et al., 2025). A similar melt plume likely exists at Ryder Glacier, reflected by thin ice in the centre of the ice shelf and the presence of a large supra-glacial meltwater stream at the same location (Fig. 1b). Yet, unlike at Petermann Glacier, the MT law cannot match Ryder's observed terminus shape (Fig. 4). Thickness variations at 79N's terminus also cause a mismatch with terminus shape using MT, causing retreat and advance on opposite sides of the shelf. Failure to replicate ice-shelf shape, due to the direct control of ice thickness in the MT law, was similarly found by Wilner et al. (2023) in their Antarctic study.
The CD calving law performed well at Greenland's three largest ice shelves, but only in the absence of water in surface crevasses (Figs. 3, 4 and 5). This result is consistent, independent of setting, and could indicate the law's suitability for floating ice in continental-scale studies of GrIS. Interestingly, our results contrast other studies in which the CD law under-predicted crevasse depth, thus requiring the additional downward force of water in crevasses (Choi et al., 2018; Amaral et al., 2020; Enderlin and Bartholomaus, 2020), or altering the threshold of crevasse propagation required for a calving event (Wheel et al., 2024), in order to match observed calving behaviour. Required dw values at grounded glaciers have ranged from 0 to 100 m (Otero et al., 2017; Choi et al., 2018; Amaral et al., 2020), with values often diverging from real-world observations of water depth in crevasses, indicating dw is a heuristic parameter (Amaral et al., 2020). To address this, recent studies have revised the classic implementation of the CD law to account for the concentration of stress in non-fractured ice, which indicates tuning through dw may not be necessary (Coffey et al., 2024; Slater and Wagner, 2025).
For the Greenlandic ice shelves investigated here, the success of the CD law, contingent on there being no additional water pressure in the crevasses, reflects a greater propagation of basal crevasses in floating ice and a shallow free board of the ice shelves. For grounded Greenlandic termini, a greater emphasis is placed on surface crevasse extent, owing to Hab > 0 in Eq. (7) which limits the extent of basal crevasse propagation. In contrast, Hab = 0 for floating termini means sea water can fully fill basal crevasses and cause these to penetrate further. Furthermore, Greenlandic ice shelves are composed of thin ice, at around 100 m thick near the terminus, which can extend for tens of km toward the grounding line and results in relatively shallow free board compared to grounded termini. As such, values of dw approaching as little as 10 m would result in surface crevasses reaching the water line (Eq. 6) and thus result in excessive calving of the ice shelf (e.g. Fig. 3g and h). To that extent, our results demonstrate extreme sensitivity to the choice of dw, which is echoed by other studies at grounded tidewater margins (Otero et al., 2017; Choi et al., 2018; Amaral et al., 2020).
The PD law consistently retreats the three ice shelves across all values of rc and tested here (Figs. 3–5 and S4). Although this behaviour aids in reproducing the retreat at Petermann Glacier, the law is unable to match the observed ice shelf stability at Ryder and 79N. Wilner et al. (2023) found similar results when the law was tested on Antarctic ice shelves, where PD often produced the largest misfit due to excessive retreat. These findings likely reflect the law's original purpose; developed out of the need to satisfy palaeo eustatic sea-level high stands through greater retreat of the East Antarctic Ice Sheet that was not possible without additional mass loss mechanisms (Pollard et al., 2015). Given that the original CD, in our experiments, was able to reproduce contemporary calving behaviour at the ice shelves simply through dry surface crevasses and basal crevasses alone, the explicit inclusion of hydrofracturing, with its heightened influence in Greenland due to greater surface melt than in Antarctica, is likely responsible for the exaggerated retreat seen with the PD law.
While it is possible to tune a calving law on a glacier-by-glacier basis for large ice sheet simulations (e.g. Choi et al., 2021), it is preferable to use a parameterisation that performs well across different glacial settings with a single, consistent calibration value. For this reason, we would recommend either the VM or the CD calving law. Both performed well in our calibration simulations and can utilise similar tuning values across three remaining Greenlandic ice shelves, assuming that the ice sheet model is able to discriminate between floating and grounded ice.
4.2 Ice Shelves and Transient Simulations
While our calibrations suggest that one calving law may be better suited than another, different calving laws produce only subtle differences in discharge rates during simulated climate forcing to 2300 (with the exception of the PD law at Petermann Glacier; Figs. 8–10). Instead, ice discharge is largely dictated by the applied climate forcings. Rising sub-shelf melt rates cause an increase in discharge over the grounding line, while greater ablation from SMB processes decrease discharge through ice thinning. Furthermore, large calving (ice-shelf collapse) events are rare, triggering only isolated occurrences of rapid discharge acceleration due to a loss of buttressing from the ice shelf – such as at Petermann Glacier using the oceanFull scenario and the VM calving law (Fig. 8d and and h). Our transient simulations do not constitute explicit future projections of the three ice glaciers, and should instead be viewed as a sensitivity test of the calving laws under different climate forcings. However, they do raise questions regarding the evolution of Greenlandic ice shelves and our ability to accurately constrain future behaviours. Our transient runs can be interpreted in two ways: (1) Greenlandic ice shelves may continue to provide a buttressing force into the coming centuries despite shelf retreat, suggesting that the role of calving in future ice discharge is limited, and discharge is instead dictated by SMB or ocean melt fluctuations; or (2) our calibrated calving laws, which rely on static tuning parameters, are inadequate when parametrising future ice-shelf evolution and their likely collapse in a warming climate.
Continued buttressing potential of these ice shelves may reflect their inherent characteristics that have, so far, endured climatic changes despite the collapse of other floating extensions in Greenland (Millan et al., 2023). Ryder Glacier's ice shelf, for example, has been contained in a bottleneck in Sherard Osborn fjord for a several decades, where the narrowing fjord walls increase lateral friction and stabilise the ice shelf (Holmes et al., 2021; Frank et al., 2022). In our transient simulations, Ryder Glacier's floating extension remains supported by this ∼ 30 km long narrow fjord section until at least 2200 across all calving laws and climate simulations with the exception of oceanFull. This persistent presence of the ice shelf is consistent with the findings of Holmes et al. (2025), where numerical simulations of Ryder Glacier under various climate warming scenarios find a continued ice-shelf presence into the coming century, despite specific experiments that increased the calving rate.
Similarly, the ice shelf at 79N, which has remained stable for several decades, is supported by Hovgaard Island and a number of ice rises at the terminus, as well as a fjord bottleneck ∼ 40 km from the grounding that allows the majority of the inner ice shelf to be buttressed (Humbert et al., 2023). As such, retreat from Hovgaard island and the ice rises does not necessarily stimulate a major acceleration in ice discharge (e.g. CD in Fig. 10c and g). At Petermann Glacier, where the fjord widens inland of the terminus, modelling studies have shown that the majority of buttressing occurs within 10 km of the grounding line (Hill et al., 2021). Our results reinforce this, and highlight that across all three glaciers, ice shelf retreat does not necessarily entail an acceleration in discharge rates if a strong connection between the fjord walls and ice shelf is maintained.
Nevertheless, in calibrating the calving laws against recent observations, we have assumed that the underlying physical processes that govern calving will remain consistent and unchanged. This is unlikely to remain true, and may bias any future evolution to behaviour inherited from the calibration period. Here we have calibrated five calving laws over an observation period from 2008 to 2024, during which Ryder Glacier and 79N maintained stable shelf fronts, while Petermann Glacier retreated by ∼ 20 km. At Ryder and 79N, a higher calving threshold (σmax) for the VM law, compared to Petermann Glacier (Table 1), could explain why terminus retreat occurs at the same rates as simulations without calving, controlled instead by surface and ocean ablation (Figs. 9 and 10). In contrast, the lower VM threshold at Petermann Glacier produces a greater realtive retreat of the ice shelf as well as a collapse event in oceanFull scenario (Fig. 8d and h). Such inherent behaviours are further emphasised in all Petermann simulations using the PD law. Therein a lower critical calving threshold (rc) and higher max migration () value (relative to Ryder and 79N) result in continuous ice shelf retreat independent of climate forcings (Fig. 8). If the same tuning parameters for PD that suited the stable ice shelves at Ryder and 79N are used, ice shelf evolution and discharge falls in-line with the other calving laws (Fig. S8 in the Supplement).
The often unique tuning parameters required by calving laws to match specific glacial behaviour during a specific time period naturally imply that a static value may not be suitable for prognostic modelling simulations (Amaral et al., 2020; Lippert et al., 2025). Future retreat of Greenland's ice shelves will occur into a changing fjord geometry or away from stabilising pinning points, see a decrease in sea-ice that has acted to suppress calving (Meng et al., 2025), retreat of the terminus towards thicker ice nearer the grounding line, while also confronted with higher sub-shelf and surface melt rates (Slater et al., 2020; Noël et al., 2022). As such, the current set of calving laws evaluated here, which rely on static tuning parameters, may become inaccurate to model the future evolution of Greenland's remaining ice shelves. While it is not plausible to expect a calving law to capture all individual calving events, future calving laws should be able parameterise terminus fluctuations at a variety of glacial settings through a single set of parameters (Benn et al., 2026). We therefore suggest that Greenland's remaining floating shelves serve as ideal candidates to explore new paramerisations, in order to best constrain future discharge rates from the currently buttressed outlet glaciers.
Here we have evaluated the performance of five calving laws at the three largest remaining ice shelves of the Greenland Ice Sheet: Petermann, Ryder and 79N. We have tested a Von Mises calving law (VM), along side an eigencalving law (EC), a minimum thickness to calve threshold (MT), and two crevasse depth parametrisations: one position-based (CD) and one rate-based (PD). The performance of these laws are evaluated against ice shelf terminus changes from 2008 to 2024, from which we recommend using the rate-based von Mises (VM) or position-based Crevasse Depth (CD) laws for modelling the floating extensions of the Greenland Ice Sheet. Both laws performed well when constrained against recent observations of ice-front fluctuations and, crucially, require similar tuning parameters across the three ice shelves, making them well-suited for large-scale continental modelling studies. However, we note that these tuning parameters differ from grounded glaciers, making it important for modelling studies of the Greenland Ice Sheet to discriminate between floating and grounded ice.
Despite this recommendation, we find little difference in future discharge rates from our transient simulations that employ calibrated calving laws to explore ice-shelf evolution to 2300. Discharge and grounding line retreat is instead primarily driven by the applied climatic forcing. Furthermore, our transient results reveal a scarcity of ice-shelf collapse events, which would lead to an acceleration of ice discharge. Similarities in discharge rates between the different calving laws possibly indicate inherent flaws in the current set of parametrisations that rely on tuning parameters calibrated to contemporary, often stable, ice shelf behaviours. Alternatively, our results may point to continued buttressing potential from Greenlandic ice shelves into the future.
ISSM is open source and freely available at https://issm.jpl.nasa.gov/download/ (last access: 23 June 2026). Code for model simulations and data export can be found at https://doi.org/10.5281/zenodo.20813386 (Barnett, 2026).
The supplement related to this article is available online at https://doi.org/10.5194/tc-20-3599-2026-supplement.
The study was conceived by JB and FAH. JB ran all model simulations with technical advice from FAH and MM. JB completed data analysis on all simulations with the interpretation of results discussed amongst all authors. The manuscript was written by JB with input from all authors.
The contact author has declared that none of the authors has any competing interests.
Publisher's note: Copernicus Publications remains neutral with regard to jurisdictional claims made in the text, published maps, institutional affiliations, or any other geographical representation in this paper. The authors bear the ultimate responsibility for providing appropriate place names. Views expressed in the text are those of the authors and do not necessarily reflect the views of the publisher.
All simulation were conducted using resources provided by the National Academic Infrastructure for Supercomputing in Sweden (NAISS) at the National Supercomputer Centre at Linköping University, Sweden, partially funded by the Swedish Research Council through grant agreement no. 2022-06725.
Jamie Barnett was funded by VR grant no. 2021-04512 and Felicity A. Holmes was funded by Formas grant no. 2021-01590, both awarded to Martin Jakobsson.
The publication of this article was funded by the Swedish Research Council, Forte, Formas, and Vinnova.
This paper was edited by Alexander Robinson and reviewed by Ellyn Enderlin and one anonymous referee.
Åkesson, H., Morlighem, M., O'Regan, M., and Jakobsson, M.: Future Projections of Petermann Glacier Under Ocean Warming Depend Strongly on Friction Law, J. Geophys. Res.-Earth, 126, e2020JF005921, https://doi.org/10.1029/2020JF005921, 2021. a
Amaral, T., Bartholomaus, T. C., and Enderlin, E. M.: Evaluation of Iceberg Calving Models Against Observations From Greenland Outlet Glaciers, J. Geophys. Res.-Earth, 125, e2019JF005444, https://doi.org/10.1029/2019JF005444, 2020. a, b, c, d, e, f, g, h, i
Barnett, J.: Comparing calving laws at Greenland's three largest ice shelves, Zenodo [data set], https://doi.org/10.5281/zenodo.20813386, 2026.
Benn, D. I., Warren, C. R., and Mottram, R. H.: Calving processes and the dynamics of calving glaciers, Earth-Sci. Rev., 82, 143–179, https://doi.org/10.1016/j.earscirev.2007.02.002, 2007. a, b
Benn, D. I., Wheel, I., Christoffersen, P., Åström, J., Cook, S. J., Luckman, A., Nick, F., Hulton, N., Hewitt, I., and Bassis, J.: Calving laws and where to find them, J. Glaciol., 72, e22, https://doi.org/10.1017/jog.2026.10128, 2026. a
Bézu, C. and Bartholomaus, T. C.: Greenland Ice Sheet's Distinct Calving Styles Are Identified in Terminus Change Timeseries, Geophys. Res. Lett., 51, e2024GL110224, https://doi.org/10.1029/2024GL110224, 2024. a
Bondzio, J. H., Seroussi, H., Morlighem, M., Kleiner, T., Rückamp, M., Humbert, A., and Larour, E. Y.: Modelling calving front dynamics using a level-set method: application to Jakobshavn Isbræ, West Greenland, The Cryosphere, 10, 497–510, https://doi.org/10.5194/tc-10-497-2016, 2016. a
Box, J. E., Hubbard, A., Bahr, D. B., Colgan, W. T., Fettweis, X., Mankoff, K. D., Wehrlé, A., Noël, B., van den Broeke, M. R., Wouters, B., Bjørk, A. A., and Fausto, R. S.: Greenland ice sheet climate disequilibrium and committed sea-level rise, Nat. Clim. Change, 12, 808–813, https://doi.org/10.1038/s41558-022-01441-2, 2022. a
Budd, W. F., Keage, P. L., and Blundy, N. A.: Empirical Studies of Ice Sliding, J. Glaciol., 23, 157–170, https://doi.org/10.3189/S0022143000029804, 1979. a
Cai, C., Rignot, E., Menemenlis, D., and Nakayama, Y.: Observations and modeling of ocean-induced melt beneath Petermann Glacier Ice Shelf in northwestern Greenland, Geophys. Res. Lett., 44, 8396–8403, https://doi.org/10.1002/2017GL073711, 2017. a, b
Choi, Y., Morlighem, M., Wood, M., and Bondzio, J. H.: Comparison of four calving laws to model Greenland outlet glaciers, The Cryosphere, 12, 3735–3746, https://doi.org/10.5194/tc-12-3735-2018, 2018. a, b, c, d, e, f, g, h, i, j, k, l, m
Choi, Y., Morlighem, M., Rignot, E., and Wood, M.: Ice dynamics will remain a primary driver of Greenland ice sheet mass loss over the next century, Commun. Earth Environ., 2, 26, https://doi.org/10.1038/s43247-021-00092-z, 2021. a, b, c
Coffey, N. B., Lai, C.-Y., Wang, Y., Buck, W. R., Surawy-Stepney, T., and Hogg, A. E.: Theoretical stability of ice shelf basal crevasses with a vertical temperature profile, J. Glaciol., 70, e64, https://doi.org/10.1017/jog.2024.52, 2024. a
Courant, R., Friedrichs, K., and Lewy, H.: Über die partiellen Differenzengleichungen der mathematischen Physik, Math. Ann., 100, 32–74, https://doi.org/10.1007/BF01448839, 1928. a
Delhasse, A., Kittel, C., and Beckmann, J.: Exploring the Greenland Ice Sheet's response to future atmospheric warming-threshold scenarios over 200 years, The Cryosphere, 19, 4459–4469, https://doi.org/10.5194/tc-19-4459-2025, 2025. a
Enderlin, E. M. and Bartholomaus, T. C.: Sharp contrasts in observed and modeled crevasse patterns at Greenland's marine terminating glaciers, The Cryosphere, 14, 4121–4133, https://doi.org/10.5194/tc-14-4121-2020, 2020. a
Frank, T., Åkesson, H., de Fleurian, B., Morlighem, M., and Nisancioglu, K. H.: Geometric controls of tidewater glacier dynamics, The Cryosphere, 16, 581–601, https://doi.org/10.5194/tc-16-581-2022, 2022. a
Goelzer, H., Nowicki, S., Payne, A., Larour, E., Seroussi, H., Lipscomb, W. H., Gregory, J., Abe-Ouchi, A., Shepherd, A., Simon, E., Agosta, C., Alexander, P., Aschwanden, A., Barthel, A., Calov, R., Chambers, C., Choi, Y., Cuzzone, J., Dumas, C., Edwards, T., Felikson, D., Fettweis, X., Golledge, N. R., Greve, R., Humbert, A., Huybrechts, P., Le clec'h, S., Lee, V., Leguy, G., Little, C., Lowry, D. P., Morlighem, M., Nias, I., Quiquet, A., Rückamp, M., Schlegel, N.-J., Slater, D. A., Smith, R. S., Straneo, F., Tarasov, L., van de Wal, R., and van den Broeke, M.: The future sea-level contribution of the Greenland ice sheet: a multi-model ensemble study of ISMIP6, The Cryosphere, 14, 3071–3096, https://doi.org/10.5194/tc-14-3071-2020, 2020. a
Greene, C. A., Gardner, A. S., Wood, M., and Cuzzone, J. K.: Ubiquitous acceleration in Greenland Ice Sheet calving from 1985 to 2022, Nature, 625, 523–528, https://doi.org/10.1038/s41586-023-06863-2, 2024. a
Hill, E. A., Carr, J. R., and Stokes, C. R.: A Review of Recent Changes in Major Marine-Terminating Outlet Glaciers in Northern Greenland, Front. Earth Sci., 4, https://www.frontiersin.org/articles/10.3389/feart.2016.00111 (last access: 23 June 2026), 2017. a
Hill, E. A., Carr, J. R., Stokes, C. R., and Gudmundsson, G. H.: Dynamic changes in outlet glaciers in northern Greenland from 1948 to 2015, The Cryosphere, 12, 3243–3263, https://doi.org/10.5194/tc-12-3243-2018, 2018a. a
Hill, E. A., Gudmundsson, G. H., Carr, J. R., and Stokes, C. R.: Velocity response of Petermann Glacier, northwest Greenland, to past and future calving events, The Cryosphere, 12, 3907–3921, https://doi.org/10.5194/tc-12-3907-2018, 2018b. a
Hill, E. A., Gudmundsson, G. H., Carr, J. R., Stokes, C. R., and King, H. M.: Twenty-first century response of Petermann Glacier, northwest Greenland to ice shelf loss, J. Glaciol., 67, 147–157, https://doi.org/10.1017/jog.2020.97, 2021. a, b
Holmes, F., Kirchner, N., Prakash, A., Stranne, C., Dijkstra, S., and Jakobsson, M.: Calving at Ryder Glacier, Northern Greenland, J. Geophys. Res.-Earth, 126, https://doi.org/10.1029/2020JF005872, 2021. a, b
Holmes, F. A., Barnett, J., Åkesson, H., Morlighem, M., Nilsson, J., Kirchner, N., and Jakobsson, M.: Sea level rise contribution from Ryder Glacier in northern Greenland varies by an order of magnitude by 2300 depending on future emissions, The Cryosphere, 19, 2695–2714, https://doi.org/10.5194/tc-19-2695-2025, 2025. a
Humbert, A., Helm, V., Neckel, N., Zeising, O., Rückamp, M., Khan, S. A., Loebel, E., Brauchle, J., Stebner, K., Gross, D., Sondershaus, R., and Müller, R.: Precursor of disintegration of Greenland's largest floating ice tongue, The Cryosphere, 17, 2851–2870, https://doi.org/10.5194/tc-17-2851-2023, 2023. a, b, c, d, e
Jakobsson, M., Mayer, L. A., Nilsson, J., Stranne, C., Calder, B., O'Regan, M., Farrell, J. W., Cronin, T. M., Brüchert, V., Chawarski, J., Eriksson, B., Fredriksson, J., Gemery, L., Glueder, A., Holmes, F. A., Jerram, K., Kirchner, N., Mix, A., Muchowski, J., Prakash, A., Reilly, B., Thornton, B., Ulfsbo, A., Weidner, E., Åkesson, H., Handl, T., Ståhl, E., Boze, L.-G., Reed, S., West, G., and Padman, J.: Ryder Glacier in northwest Greenland is shielded from warm Atlantic water by a bathymetric sill, Commun. Earth Environ., 1, 45, https://doi.org/10.1038/s43247-020-00043-0, 2020. a
Joughin, I., Smith, B. E., Howat, I. M., Floricioiu, D., Alley, R. B., Truffer, M., and Fahnestock, M.: Seasonal to decadal scale variations in the surface velocity of Jakobshavn Isbrae, Greenland: Observation and model-based analysis, J. Geophys. Res.-Earth, 117, https://doi.org/10.1029/2011JF002110, 2012. a
Joughin, I., Smith. B., Howat, I., and Scambos, T.: MEaSUREs multi-year greenland ice sheet velocity mosaic, version 1, NASA National Snow and Ice Data Center Distributed Active Archive Center [data set], https://doi.org/10.5067/QUA5Q9SVMSJG, 2016. a, b
Kehrl, L. M., Joughin, I., Shean, D. E., Floricioiu, D., and Krieger, L.: Seasonal and interannual variabilities in terminus position, glacier velocity, and surface elevation at Helheim and Kangerlussuaq Glaciers from 2008 to 2016: Helheim and Kangerlussuaq Glaciers, J. Geophys. Res.-Earth, 122, 1635–1652, https://doi.org/10.1002/2016JF004133, 2017. a
Khan, S. A., Kjeldsen, K. K., Kjær, K. H., Bevan, S., Luckman, A., Aschwanden, A., Bjørk, A. A., Korsgaard, N. J., Box, J. E., van den Broeke, M., van Dam, T. M., and Fitzner, A.: Glacier dynamics at Helheim and Kangerdlugssuaq glaciers, southeast Greenland, since the Little Ice Age, The Cryosphere, 8, 1497–1507, https://doi.org/10.5194/tc-8-1497-2014, 2014. a
King, M. D., Howat, I. M., Candela, S. G., Noh, M. J., Jeong, S., Noel, B. P. Y., van den Broeke, M. R., Wouters, B., and Negrete, A.: Dynamic ice loss from the Greenland Ice Sheet driven by sustained glacier retreat, Commun. Earth Environ., 1, 1, https://doi.org/10.1038/s43247-020-0001-2, 2020. a
Kochtitzky, W., Copland, L., Van Wychen, W., Hugonnet, R., Hock, R., Dowdeswell, J. A., Benham, T., Strozzi, T., Glazovsky, A., Lavrentiev, I., Rounce, D. R., Millan, R., Cook, A., Dalton, A., Jiskoot, H., Cooley, J., Jania, J., and Navarro, F.: The unquantified mass loss of Northern Hemisphere marine-terminating glaciers from 2000–2020, Nat. Commun., 13, 5835, https://doi.org/10.1038/s41467-022-33231-x, 2022. a
Larour, E., Seroussi, H., Morlighem, M., and Rignot, E.: Continental scale, high order, high spatial resolution, ice sheet modeling using the Ice Sheet System Model (ISSM), J. Geophys. Res.-Earth, 117, https://doi.org/10.1029/2011JF002140, 2012. a
LeVeque, R. J.: Finite Difference Methods for Ordinary and Partial Differential Equations: Steady-State and Time-Dependent Problems, Society for Industrial and Applied Mathematics, https://doi.org/10.1137/1.9780898717839, 2007. a
Levermann, A., Albrecht, T., Winkelmann, R., Martin, M. A., Haseloff, M., and Joughin, I.: Kinematic first-order calving law implies potential for abrupt ice-shelf retreat, The Cryosphere, 6, 273–286, https://doi.org/10.5194/tc-6-273-2012, 2012. a, b, c
Lippert, E. Y. H., Morlighem, M., Cheng, G., Berg, D. L., Hassan, J., and Khan, S. A.: Ice Front and Mélange Dynamics at Kangerlussuaq Glacier, Eastern Greenland, Since 1981, and Future Stability, Geophys. Res. Lett., 52, e2024GL113982, https://doi.org/10.1029/2024GL113982, 2025. a
MacAyeal, D.: Large-scale ice flow over a viscous basal sediment: Theory and application to ice stream B, Antarctica, J. Geophys. Res., 94, 4071–4087, 1989. a, b
MacGregor, J. A., Fahnestock, M. A., Colgan, W. T., Larsen, N. K., Kjeldsen, K. K., and Welker, J. M.: The age of surface-exposed ice along the northern margin of the Greenland Ice Sheet, J. Glaciol., 66, 667–684, https://doi.org/10.1017/jog.2020.62, 2020. a
Meng, Y., Lai, C.-Y., Culberg, R., Shahin, M. G., Stearns, L. A., Burton, J. C., and Nissanka, K.: Seasonal changes of mélange thickness coincide with Greenland calving dynamics, Nat. Commun., 16, 573, https://doi.org/10.1038/s41467-024-55241-7, 2025. a
Miele, C., Bartholomaus, T. C., and Enderlin, E. M.: Marginal Detachment Zones: The Fracture Factories of Ice Shelves?, J. Geophys. Res.-Earth, 128, e2022JF006959, https://doi.org/10.1029/2022JF006959, 2023. a
Millan, R., Jager, E., Mouginot, J., Wood, M. H., Larsen, S. H., Mathiot, P., Jourdain, N. C., and Bjørk, A.: Rapid disintegration and weakening of ice shelves in North Greenland, Nat. Commun., 14, 6914, https://doi.org/10.1038/s41467-023-42198-2, number: 1, 2023. a, b, c, d, e, f, g, h, i, j, k
Morland, L. and Zainuddin, R.: Plane and radial ice-shelf flow with prescribed temperature profile, in: Dynamics of the west antarctic ice sheet: Proceedings of a workshop held in Utrecht, 6–8 May 1985, https://doi.org/10.1007/978-94-009-3745-1_7, 1987. a, b
Morlighem, M., Bondzio, J., Seroussi, H., Rignot, E., Larour, E., Humbert, A., and Rebuffi, S.: Modeling of Store Gletscher's calving dynamics, West Greenland, in response to ocean thermal forcing, Geophys. Res. Lett., 43, 2659–2666, https://doi.org/10.1002/2016GL067695, 2016. a, b, c
Morlighem, M., Williams, C. N., Rignot, E., An, L., Arndt, J. E., Bamber, J. L., Catania, G., Chauché, N., Dowdeswell, J. A., Dorschel, B., Fenty, I., Hogan, K., Howat, I., Hubbard, A., Jakobsson, M., Jordan, T. M., Kjeldsen, K. K., Millan, R., Mayer, L., Mouginot, J., Noël, B. P. Y., O'Cofaigh, C., Palmer, S., Rysgaard, S., Seroussi, H., Siegert, M. J., Slabon, P., Straneo, F., van den Broeke, M. R., Weinrebe, W., Wood, M., and Zinglersen, K. B.: IceBridge BedMachine Greenland, Version 5, NASA National Snow and Ice Data Center Distributed Active Archive Center [data set], https://doi.org/10.5067/GMEVBWFLWA7X, 2022. a
Mouginot, J., Rignot, E., Scheuchl, B., Fenty, I., Khazendar, A., Morlighem, M., Buzzi, A., and Paden, J.: Fast retreat of Zachariae Isstrom, northeast Greenland, Science, 350, 1357–1361, https://doi.org/10.1126/science.aac7111, 2015. a
Mouginot, J., Rignot, E., Bjork, A. A., Broeke, M. v. d., Millan, R., Morlighem, M., Noel, B., Scheuchl, B., and Wood, M.: Forty-six years of Greenland Ice Sheet mass balance from 1972 to 2018, P. Natl. Acad. Sci. USA, 116, 9239–9244, https://doi.org/10.1073/pnas.1904242116, 2019. a
Nick, F., Van Der Veen, C., Vieli, A., and Benn, D.: A physically based calving model applied to marine outlet glaciers and implications for the glacier dynamics, J. Glaciol., 56, 781–794, https://doi.org/10.3189/002214310794457344, 2010. a, b, c
Noël, B., Lenaerts, J. T. M., Lipscomb, W. H., Thayer-Calder, K., and van den Broeke, M. R.: Peak refreezing in the Greenland firn layer under future warming scenarios, Nat. Commun., 13, 6870, https://doi.org/10.1038/s41467-022-34524-x, number: 1, 2022. a, b, c, d
Nye, J.: The distribution of stress and velocity in glaciers and ice-sheets, P. R. Soc. S. A. 239, 113–133, https://doi.org/10.1098/rspa.1957.0026, 1957. a
Otero, J., Navarro, F. J., Lapazaran, J. J., Welty, E., Puczko, D., and Finkelnburg, R.: Modeling the Controls on the Front Position of a Tidewater Glacier in Svalbard, Front. Earth Sci., 5, https://doi.org/10.3389/feart.2017.00029, 2017. a, b, c
Otosaka, I. N., Shepherd, A., Ivins, E. R., Schlegel, N.-J., Amory, C., van den Broeke, M. R., Horwath, M., Joughin, I., King, M. D., Krinner, G., Nowicki, S., Payne, A. J., Rignot, E., Scambos, T., Simon, K. M., Smith, B. E., Sørensen, L. S., Velicogna, I., Whitehouse, P. L., A, G., Agosta, C., Ahlstrøm, A. P., Blazquez, A., Colgan, W., Engdahl, M. E., Fettweis, X., Forsberg, R., Gallée, H., Gardner, A., Gilbert, L., Gourmelen, N., Groh, A., Gunter, B. C., Harig, C., Helm, V., Khan, S. A., Kittel, C., Konrad, H., Langen, P. L., Lecavalier, B. S., Liang, C.-C., Loomis, B. D., McMillan, M., Melini, D., Mernild, S. H., Mottram, R., Mouginot, J., Nilsson, J., Noël, B., Pattle, M. E., Peltier, W. R., Pie, N., Roca, M., Sasgen, I., Save, H. V., Seo, K.-W., Scheuchl, B., Schrama, E. J. O., Schröder, L., Simonsen, S. B., Slater, T., Spada, G., Sutterley, T. C., Vishwakarma, B. D., van Wessem, J. M., Wiese, D., van der Wal, W., and Wouters, B.: Mass balance of the Greenland and Antarctic ice sheets from 1992 to 2020, Earth Syst. Sci. Data, 15, 1597–1616, https://doi.org/10.5194/essd-15-1597-2023, 2023. a
Pollard, D., DeConto, R. M., and Alley, R. B.: Potential Antarctic Ice Sheet retreat driven by hydrofracturing and ice cliff failure, Earth Pl. Sc. Lett., 412, 112–121, https://doi.org/10.1016/j.epsl.2014.12.035, 2015. a, b, c, d, e
Prakash, A., Zhou, Q., Hattermann, T., and Kirchner, N.: Enhanced subglacial discharge amplifies Petermann Ice Shelf melting when ocean thermal forcing saturates, Nat. Commun., 16, 4213, https://doi.org/10.1038/s41467-025-59469-9, 2025. a
Seroussi, H. and Morlighem, M.: Representation of basal melting at the grounding line in ice flow models, The Cryosphere, 12, 3085–3096, https://doi.org/10.5194/tc-12-3085-2018, 2018. a
Slater, D. A. and Straneo, F.: Submarine melting of glaciers in Greenland amplified by atmospheric warming, Nat. Geosci., 15, 794–799, https://doi.org/10.1038/s41561-022-01035-9, 2022. a
Slater, D. A. and Wagner, T. J. W.: Calving driven by horizontal forces in a revised crevasse-depth framework, The Cryosphere, 19, 2475–2493, https://doi.org/10.5194/tc-19-2475-2025, 2025. a
Slater, D. A., Felikson, D., Straneo, F., Goelzer, H., Little, C. M., Morlighem, M., Fettweis, X., and Nowicki, S.: Twenty-first century ocean forcing of the Greenland ice sheet for modelling of sea level contribution , The Cryosphere, 14, 985–1008, https://doi.org/10.5194/tc-14-985-2020, 2020. a
van der Veen, C.: Fracture mechanics approach to penetration of surface crevasses on glaciers, Cold Regions Science and Technology, 27, 31–47, https://doi.org/10.1016/S0165-232X(97)00022-0, 1998. a
Wekerle, C., McPherson, R., von Appen, W.-J., Wang, Q., Timmermann, R., Scholz, P., Danilov, S., Shu, Q., and Kanzow, T.: Atlantic Water warming increases melt below Northeast Greenland's last floating ice tongue, Nat. Commun., 15, 1336, https://doi.org/10.1038/s41467-024-45650-z, 2024. a
Wheel, I., Crawford, A. J., and Benn, D. I.: Calving dynamics at Jakobshavn Isbrae (Sermeq Kujalleq) controlled by local geometry: insights from a 3D Stokes calving model, J. Glaciol., 70, e7, https://doi.org/10.1017/jog.2024.77, 2024. a
Wilner, J. A., Morlighem, M., and Cheng, G.: Evaluation of four calving laws for Antarctic ice shelves, The Cryosphere, 17, 4889–4901, https://doi.org/10.5194/tc-17-4889-2023, 2023. a, b, c, d, e, f, g, h, i, j, k, l
Wilson, N., Straneo, F., and Heimbach, P.: Satellite-derived submarine melt rates and mass balance (2011–2015) for Greenland's largest remaining ice tongues, The Cryosphere, 11, 2773–2782, https://doi.org/10.5194/tc-11-2773-2017, 2017. a, b