the Creative Commons Attribution 4.0 License.
the Creative Commons Attribution 4.0 License.
 | 17 Jun 2026
Airborne lidar and machine learning reveal decreased snow depth in burned forests
Arielle Koshkin
Adrienne M. Marshall
Wildfires are increasingly burning higher in elevations well into the seasonal snow zone, altering snow accumulation and melt dynamics. However, limited spatially distributed observations throughout the full snow season have constrained our understanding of how these changes vary across space and time. Here, we assess the impacts of fire on snow depth across nine basins in California's Sierra Nevada using a machine learning (ML) algorithm, Extreme Gradient Boosting (XGBoost), trained on 114 airborne lidar snow depth acquisitions with 50 m resolution in partially burned basins. We develop and apply an explainable ML framework by fitting an ML algorithm on snow depth for each flight as a function of spatial attributes including burn status. We then predict snow depth for counterfactual burned and unburned conditions for each flight to assess the ML-derived impact of fire on snow depth. Fire impact on snow depth evolved throughout the season, with slightly deeper predicted snow in burned forests in the accumulation season (56 % of acquisitions), and shallower predicted snow in burned forests in the ablation season (83 % of acquisitions) compared to unburned forests. Post-fire snow depth differences were smaller in the accumulation than in the ablation season. Lower elevations (< 2000 m) consistently exhibited smaller, near-zero changes in post-fire snow depth compared to higher elevations (> 2000 m). South- facing slopes experienced the largest negative post-fire snow depth changes. These results illustrate a new approach to assessing fire impacts on snow using lidar-derived snow depth and provide insights into snowpack dynamics in burned forests that are novel in their spatial extent and resolution, as well as their ability to discern fire impacts throughout the snow season.
- Article
(3258 KB) - Full-text XML
-
Supplement
(2130 KB) - BibTeX
- EndNote


Wildfires are increasingly burning in snow-dominated regions and can alter the timing and magnitude of snowmelt in ways that vary spatially (Koshkin et al., 2025; Giovando and Niemann, 2022; Smoot and Gleason, 2021). Wildfires in the seasonal snow zone raise concerns for water management because of the potential for long-lasting impacts of large fires on mountainous snowpacks and snow-dominated water resources (Boardman et al., 2025; Gleason et al., 2019). While recent work has evaluated fire effects on snow disappearance timing (Koshkin et al., 2025), we currently lack an understanding of how these effects vary throughout the water year across location, elevation, and aspect.
In the western US, the majority of water originates from winter snowpacks (Li et al., 2017). Snowmelt runoff provides water for downstream users in the spring and early summer when societal, ecological, and atmospheric demands are the greatest (Bales et al., 2006; Immerzeel et al., 2020; Mankin et al., 2015; Mote et al., 2018). With climate warming, snow-water storage is declining across the West, threatening water availability (Marshall et al., 2019a; Mote et al., 2018). Mid-century warming is expected to cause spring runoff to be less reliable, earlier, and more episodic, disrupting the predictability of reservoir inflows and water management (Hale et al., 2022; Livneh and Badger, 2020). With increasing pressure on snow-derived water resources, understanding seasonal snowmelt timing and magnitude changes are essential for effective water management in the western US.
At the same time, wildfires have increased in size, duration, and severity, and advanced upslope well into the seasonal snow zone (Alizadeh et al., 2021; Hatchett, Koshkin et al., 2023; Koshkin et al., 2022; Williams et al., 2022). In the western US, 13 % of the land area has burned since 1984 (Kampf et al., 2022). In California, there was nearly 10 times more satellite-observed wildfire activity in the seasonal snow zone in 2020 and 2021 compared to 2001–2019 mean annual fire detections (Hatchett, Koshkin et al., 2023). It is therefore critical to understand how snow accumulation and melt dynamics change in burned conditions to inform adaptive watershed management.
Post-fire snow accumulation and melt are influenced by countervailing impacts on energy balance and interception dynamics (Koshkin et al., 2022). Fire can alter net shortwave radiation – often a major contributor to the snow energy balance (Musselman et al., 2017) – in two ways. First, charred woody debris and black carbon are shed from burned trees onto the snow surface, decreasing the albedo and increasing the energy absorbed by the snowpack (Gleason et al., 2013, 2019). Second, more shortwave radiation reaches the snow surface due to reduced canopy shading (Dickerson-Lange et al., 2021). These dual impacts increase energy inputs to the snow, which increases melt (Kampf et al., 2022; Molotch et al., 2004; Wiscombe and Warren, 1980). This mechanism of post-fire energy balance is thought to be most prominent in warm, maritime snowpacks already ripe for melting or during the spring when temperatures and solar radiation increase (Koshkin et al., 2025; Smoot and Gleason, 2021). However, post-fire canopy loss can also increase snow depth. In an unburned forest, canopy interception can reduce snow accumulation by up to 40 % relative to non-forested areas because the snow intercepted by the canopy sublimates into the atmosphere (Harpold et al., 2014; Lundquist et al., 2013, 2021; Roth and Nolin, 2017), but the importance of this effect can vary widely (Harpold et al., 2014; Lundquist et al., 2013, 2021; Roth and Nolin, 2017). Similarly, canopy removal in burned forests can reduce interception, potentially increasing post-fire snow depth (Burles and Boon, 2011; Harpold et al., 2014). At high elevations, snow disappearance date (SDD) is delayed post-fire (Koshkin et al., 2025) with deeper peak snow depth and snow water equivalent (SWE) (Giovando and Niemann, 2022; Maxwell et al., 2019), suggesting that the interception effect may dominate. However, in climatically warmer regions, SDD is earlier (Koshkin et al., 2025), suggesting that increased net shortwave may be more important.
Longwave radiation and turbulent fluxes also affect the post-fire snow energy balance. In unburned forests, longwave radiation inputs to the snow surface come from both trees and the atmosphere. After a fire, the loss of tree cover reduces longwave radiation from trees, which may partially offset the increase in net shortwave radiation, especially under clear-sky conditions (Burles and Boon, 2011; Seyednasrollah et al., 2013). Post-fire environments also increase snowpack exposure to wind, increasing turbulent heat fluxes (Boon, 2009; Gelfan et al., 2004). Forests help protect snow from wind redistribution, retaining more snow within the forest. Wind can scour snow from open areas without tree cover, reducing post-fire snow depths or increasing their variability (Broxton et al., 2015; Dickerson-Lange et al., 2021; Lundquist et al., 2013; Marshall et al., 2019b). These changes in energy balance affect seasonal snow accumulation and melt patterns, complicating the prediction and modeling of snowmelt timing and magnitude for water resources, especially after a fire.
Most previous research focuses on a single metric to quantify post-fire snowpack effects each winter, such as peak SWE, the date on which peak SWE occurs, or SDD (Giovando and Niemann, 2022; Koshkin et al., 2022; Smoot and Gleason, 2021). When temporal observations are available, they are located at one site or at SNOTEL stations (Broxton et al., 2015; Gleason et al., 2013; McGrath et al., 2023), which are at the point scale only and do not fully represent the surrounding terrain (Herbert et al., 2024). Therefore, there is a need for spatially and temporally distributed data to capture seasonal variability and identify conditions in which snow depth is increased, decreased, or unchanged in burned conditions. Understanding the inter- and intra-annual variability in snow depth is crucial for modeling post-fire snowpacks, predicting snowmelt timing, and assessing the vulnerability of different basins to loss of snowpack post-fire.
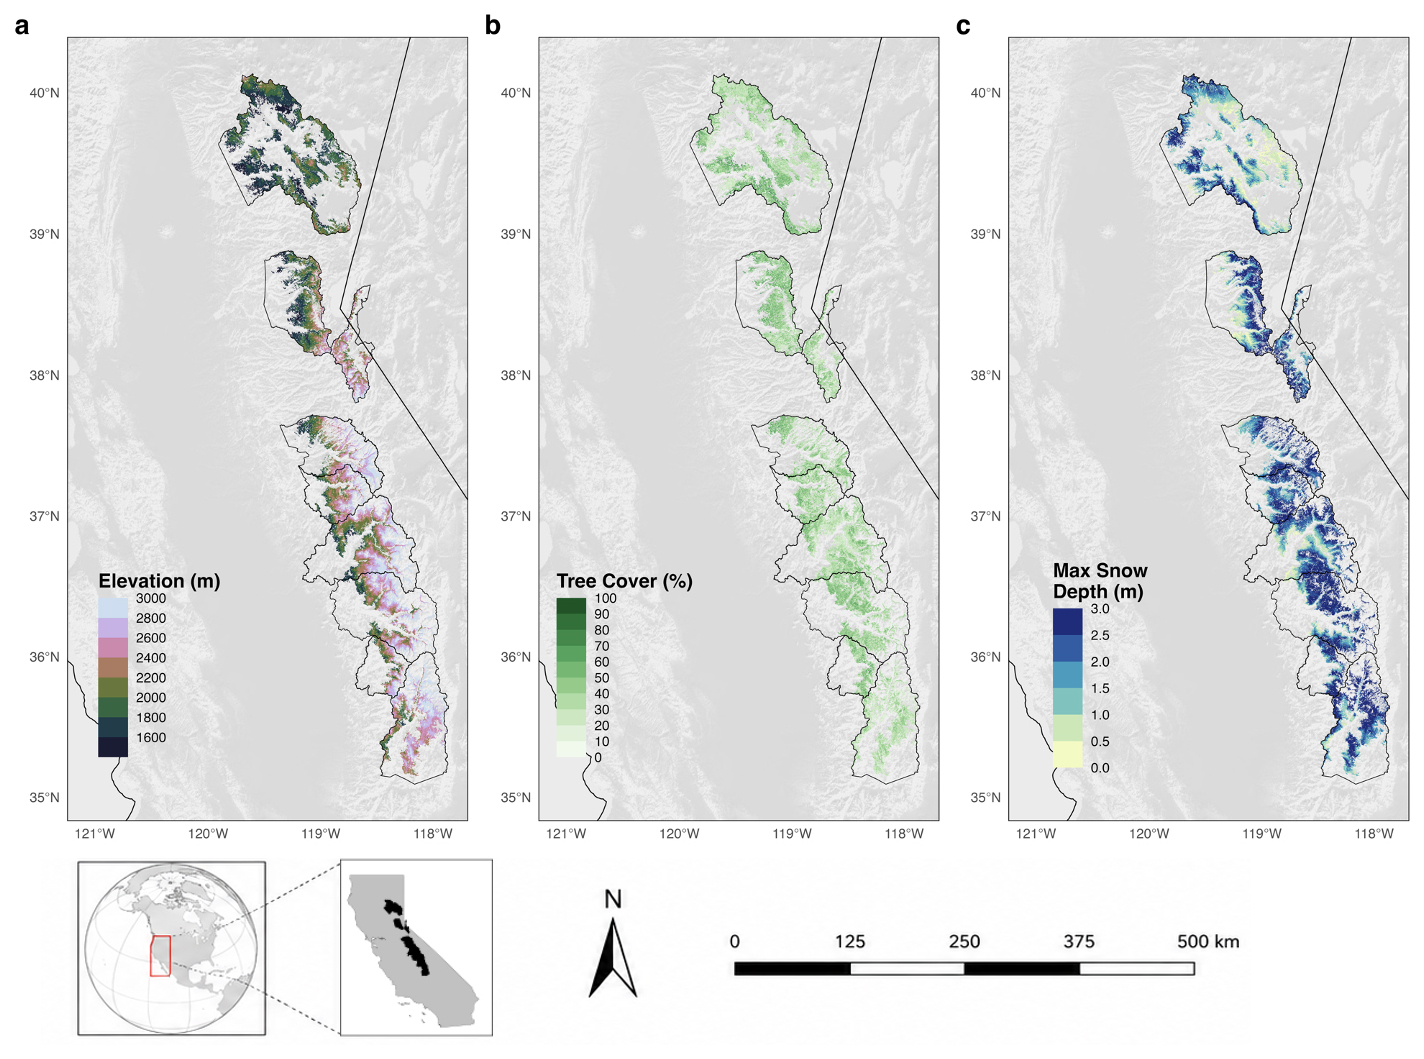
Figure 1Map of (a) elevation, (b) tree cover, and (c) mean snow depth across the Sierra Nevada. The basins shown are the nine basins used in this study based on the criteria stated above and variables are constrained to the domain range of the modelling.
To date, machine learning algorithms and airborne lidar have been underutilized to assess wildfire impacts on snow. In the Sierra Nevada, California, airborne lidar acquisitions of snow depth are increasingly available at multiple points throughout the snow accumulation and melt season, providing relatively accurate observations of snow depth at 3 m (aggregated to 50 m) resolution across major watersheds (Painter et al., 2016, p. 201). These data are increasingly used in the evaluation of snow models and data products (Behrangi et al., 2018; Broxton et al., 2019; Yang et al., 2023). Empirically evaluating fire effects on snow in these watersheds using traditional methods typically requires pre- and post-fire data, and existing methods are challenged by the irregular timing of acquisitions throughout the snow season and interannual weather variability. Here, we apply a new statistical framework to avoid both of these problems: we train a machine learning (ML) model on each acquisition to reproduce spatial patterns of snow depth at the time of the acquisition based on underlying topography, land cover, and burn status. We then use the trained model to predict spatially distributed snow depth for each acquisition under counterfactual burned and unburned conditions, differencing these two predicted maps to discern what the model “learned” about the impact of fire on snow for that acquisition. This method is an example of “explainable artificial intelligence” (XAI), specifically Individual Conditional Expectation (ICE), in which the values of one input feature are varied to assess the impacts on model predictions (Dwivedi et al., 2023). Although prior ICE applications have focused on modifying continuous model features and visualizing the resulting ensemble of predictions (Goldstein et al., 2015), here we instead modify a categorical feature (burn) and assess its effect on model predictions across space. Our approach requires the ML algorithm to accurately reflect the impacts of fire on snow depth within each acquisition but does not rely on pre- and post-burn data, annual summary statistics, climate forcings, or temporally continuous snow data.
In this study, we use the percent difference in ML-predicted snow depth values for burned and unburned conditions to understand variability in post-wildfire impacts on snowpacks: (1) across the accumulation to ablation seasons, (2) spatially across the Sierra Nevada range, and (3) with elevation and aspect. The results will provide new insight into the spatially and temporally varying influences of fire on snow accumulation and melt dynamics, leveraging airborne lidar data in a new statistical framework to provide an unprecedented combination of spatial resolution and extent in estimates of post-fire changes in snowpack.
This study includes nine snow-dominated basins in the Sierra Nevada, California (Fig. 1). These basins were selected based on available lidar data from the Airborne Snow Observatory (ASO) and the occurrence of at least one wildfire between 2015 and 2024. Each basin had at least 1 year in which lidar was acquired between 2020 and 2024. The basins ranged from 300 to 3600 m in elevation. Forests are predominantly coniferous, extending from lower elevation ponderosa pine forest beginning at 300–900 m of elevation through mixed conifers, a belt dominated by fir, and the subalpine zone in the highest forested elevations (SNEP, 1994). Historical fire intervals varied as a function of sociocultural conditions and climate, with recent fire suppression preceded by four centuries with mean fire return intervals around 17.7 years (Taylor et al., 2016). In the Sierra Nevada, water years 2020–2024 captured a wide range of hydroclimate conditions, ranging from snow drought in 2021 (McEvoy and Hatchett, 2023) to deluge in 2023 (Marshall et al., 2024).
2.1 Data
2.1.1 Snow Depth
We obtained spatially distributed airborne lidar-derived snow depths from ASO. ASO uses a lidar differencing approach to calculate snow depth by subtracting “snow-off” and subsequent “snow-on” co-located digital elevation models extracted from lidar point clouds. The method produces snow depth rasters at 3 m resolution, which are then aggregated to 50 m resolution (Painter et al., 2016). ASO is flown when water managers request flights; the temporal resolutions and extents are therefore irregular, with flight frequency ranging from one to six or more flights per season in each watershed. Here, we use a total of 114 ASO flights over the five-year study period from January to May, totalling more than 32 000 km2 (Table S1 in the Supplement). The reported mean absolute error (MAE) of the 3 m ASO snow depth product relative to in situ observations is less than 8 cm over flat terrain (Painter et al., 2016). To account for higher uncertainties in steep terrain due to uncertainties in the viewing angle (Bui and Glennie, 2023), we removed pixels with greater than 30° slopes. This resulted in a loss of 14.5 % of pixels.
2.1.2 Fire Data
Burned pixels were identified using the Monitoring Trends in Burn Severity (MTBS) dataset, an interagency dataset produced by the United States Geological Survey (USGS), United States Forest Service (USFS), and United States Department of Agriculture (USDA) to construct a long-term dataset of burn severity and extent of large fires (> 4 km2) across the US from 1984–2024. Fire perimeters are derived from NASA Landsat data at 30 m resolution by calculating the difference in the Normalized Burn Ratio (dNBR) using a normalized band ratio of TM 4 and 7 (Eidenshink et al., 2007). We used data from 2015 (5 years before the first flight) through 2024 for 10 years of burn data. Previous studies have shown that the effects of fire on snowpack diminish within 10 years following a fire, recovering back to pre-fire conditions (Gersh et al., 2022; Koshkin et al., 2025). We considered a pixel burned if it was labelled as low, moderate or high burn severity and resampled the rasters to 50 m resolution using the nearest neighbor method. We used burn severity of low, moderate and high as an input into the machine learning algorithm and 0 if unburned.
2.1.3 Forest Cover
We used the National Land Cover Database (NLCD) Tree Canopy Cover produced by the USDA Forest Service to capture year-to-year changes in canopy cover (Fleckenstein et al., 2026). This is a multi-spectral satellite-based 30 m pixel time series (1985–2023) of percent tree cover (0 %–100 %) for the western US The nearest neighbor method was used to resample the rasters to 50 m resolution to match the ASO data. Pixels were filtered to those between 10 %–100 % tree cover to constrain the analysis to solely forested areas. A 10 % threshold was selected to exclude sparsely vegetated pixels and isolated trees and ensure we are capturing forest stands.
2.1.4 Peak SWE
Basin-wide peak SWE was calculated to determine whether each ASO flight was acquired during the snow accumulation (before peak SWE) or ablation season (after peak SWE). For the purpose of calculating peak SWE date, we used daily SWE data from Snow Data Assimilation System (SNODAS), a 1 km daily product derived from modeling and data assimilation produced by the NOAA National Operational Hydrological Remote Sensing Center (NOHRSC) (National Operational Hydrologic Remote Sensing Center, 2004). SNODAS provides a physically consistent framework that integrates airborne, satellite, and ground station observations to estimate snow variables, including SWE. Compared to ASO flights from 2014–2024, SNODAS performed well among SWE products, providing confidence in its ability to capture peak SWE across basins (Ritchie et al., 2025). To calculate basin-wide peak SWE, we summed daily SWE within each basin and found the date when basin SWE was at its maximum. For each lidar acquisition, we then calculated the difference between the acquisition date and the date of peak SWE, binning these differences into 30 d periods to approximate months before or after the date of peak SWE. One limitation is that peak SWE timing varies within each basin and year, but the simplification to a basin-wide peak SWE date facilitates analysis of results for each acquisition.
2.2 Machine Learning
We used a machine learning approach called Extreme Gradient Boosting (XGBoost) to predict snow depth across nine basins in California under hypothetical burned and unburned conditions. This method was selected to develop a framework in which we could isolate the effect of burn on snowpack dynamics while holding other variables constant. XGBoost was trained separately on each ASO acquisition, using UTM x and y to capture otherwise unobserved synoptic-scale patterns, elevation, aspect, slope, topographical roughness, topographical position, burn severity based on MTBS from 2015–2024, year since burn, and percent tree cover to predict snow depth at 50 m resolution (Fig. S1 in the Supplement). Areas that burned before 2015 were treated as unburned, given the average recovery time at mid-elevations for post-fire snow depth is around 5 years (Koshkin et al., 2025). Crucially, our approach requires XGBoost to capture the spatial patterns of snow depth within each flight, but not to simulate snow accumulation and melt based on climate inputs, nor to have pre- and post-burn data.
XGBoost is an ensemble supervised machine learning approach that applies a gradient-boosting decision tree. The model iteratively builds decision trees and learns from the previous iteration to minimize error and converge towards an optimal set of predictive trees (Chen and Guestrin, 2016). Each tree is learned to minimize the regularized loss and improve the model's predictions while preventing overfitting (Chen and Guestrin, 2016). This approach has become common in remote sensing (Arabameri et al., 2021; Karthikeyan and Mishra, 2021; Kavzoglu and Teke, 2022) and, more recently, has been applied to develop a daily SWE product (Sun et al., 2024). XGBoost performs well with large datasets that exhibit complex non-linear relationships, is highly robust to outliers, and is less computationally intensive than other machine learning algorithms (Chen and Guestrin, 2016). This algorithm was applied using the “mlr3verse” and “XGBoost” packages in R (Chen et al., 2024; Lang et al., 2025).
We applied random search optimization to each model to calibrate the hyperparameters in the XGBoost model. Random Search optimization is based on decision theory with similar principles to the grid search, but is more time-efficient and easily parallelizable (Kavzoglu and Teke, 2022; Yang and Shami, 2020). The random search selects optimal hyperparameter values to train on within a given configured space until the predetermined threshold value is exhausted (Kavzoglu and Teke, 2022; Yang and Shami, 2020). The hyperparameter optimization was applied to the learning rate, maximum depth of the decision tree, subsampling rate, a fraction of features to be evaluated at each split, and the number of iterations (to increase training speed and reduce overfitting) (Bentéjac et al., 2021). This method was selected because of the high optimization performance compared to four other optimization approaches (Kavzoglu and Teke, 2022).
This optimization approach was applied to all 114 flights individually before running the XGBoost model using the “mlr3randomsearch” in the “mlr3verse” packages in R (Lang et al., 2025). To avoid spatial autocorrelation, the test/train datasets were split into 1 km blocks of training and testing pixels, equally sampled between burned and unburned pixels. We used a 5-fold cross-validation to select the parameters for the model with the lowest out-of-sample cross-validated root mean squared error (CV-RMSE). CV-RMSE was calculated by comparing the predicted pixels under baseline conditions (empirically observed) to the training data (Bentéjac et al., 2021).
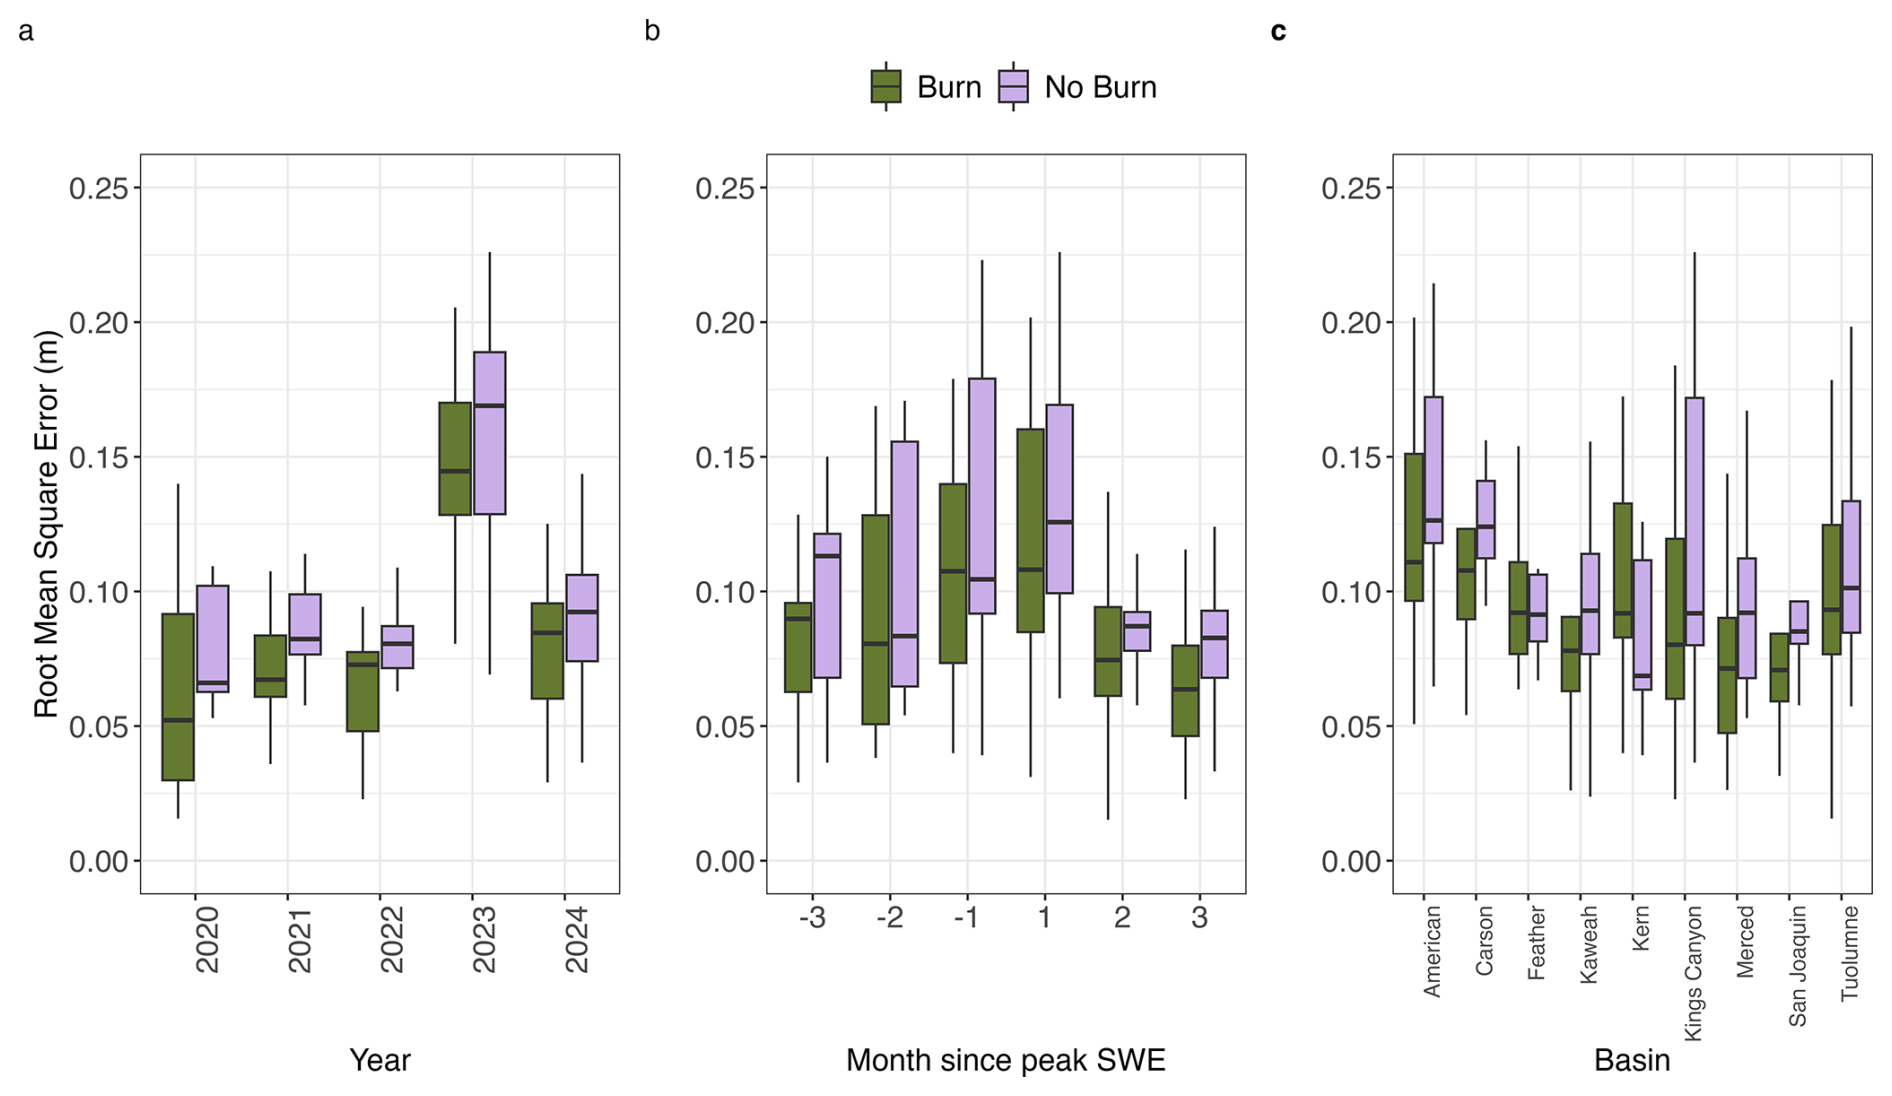
Figure 2Cross-validated root mean squared error (CV-RMSE) for burned (green) and unburned (purple) pixels for every acquisition by (a) year of flight, (b) month since peak SWE, and (c) basin.
2.3 Estimating Snow Depth Differences in Burned vs Unburned Forests
We used the fitted models to predict snow depths for unburned conditions and counterfactual burned conditions for all pixels, where the year since burn was set to 1, burn severity was set to 4 (high burn), and canopy cover was set to 10 % for burned pixels. We evaluated the difference between predicted hypothetical burned and unburned values by calculating the percent difference in predicted snow depth:
where ΔSD is the percent difference in snow depth, pSDUB is the predicted snow depth if the pixel was unburned, and pSDB is the predicted snow depth if the pixel was burned. This approach assumes that the model learned the post-fire snow depth variability accurately, which we evaluate by comparing RMSE in burned and unburned conditions (Fig. 2). Variations in ΔSD were qualitatively compared based on the elevation, aspect, and month since peak SWE on both basin-wide and 50 m spatial scales. Basin-wide averages within the forest region (SDBW) were calculated by summing burned and unburned snow depth values separately across all pixels for each acquisition within the seasonal snow zone and calculating the basin-wide percent difference; this method was selected rather than averaging pixelwise percent differences to avoid the influence of pixels with small denominators that could result in anomalously large percentage values. The seasonal snow zone was defined by pixels that had more than 30 consecutive days of SWE in each of the 5 acquisition years.
3.1 Model validation results
The median cross-validated (5-fold) CV-RMSE across all flights was 0.09 m (IQR: 0.06 m). Burned pixels had a lower CV-RMSE with a smaller interquartile range (IQR) compared to unburned pixels (Fig. 2). Specifically, the median CV-RMSE for burned pixels was 0.08 m (IQR: 0.06 m), whereas unburned pixels have a median CV-RMSE of 0.09 m (IQR: 0.06 m). These results may occur because deeper snowpacks tend to be associated with larger RMSE – the overall correlation between basin-wide mean snow depth and RMSE was 0.79. This was consistent across water years as well: 2023 accounted for 38 % of pixels and had the largest magnitude and variability in CV-RMSE (median = 0.16 m; IQR: 0.05 m) (Fig. 2a). Model performance for burned and unburned pixels increased during the accumulation season and gradually improved during the ablation season, with the largest model uncertainty around peak SWE (Fig. 2b). The basin size did not appear to strongly influence model performance. For example, the Feather basin, which has the largest area, exhibited relatively low RMSE, while smaller basins such as the Kaweah showed comparable performance to several mid- and large-sized basins (Fig. 2c).
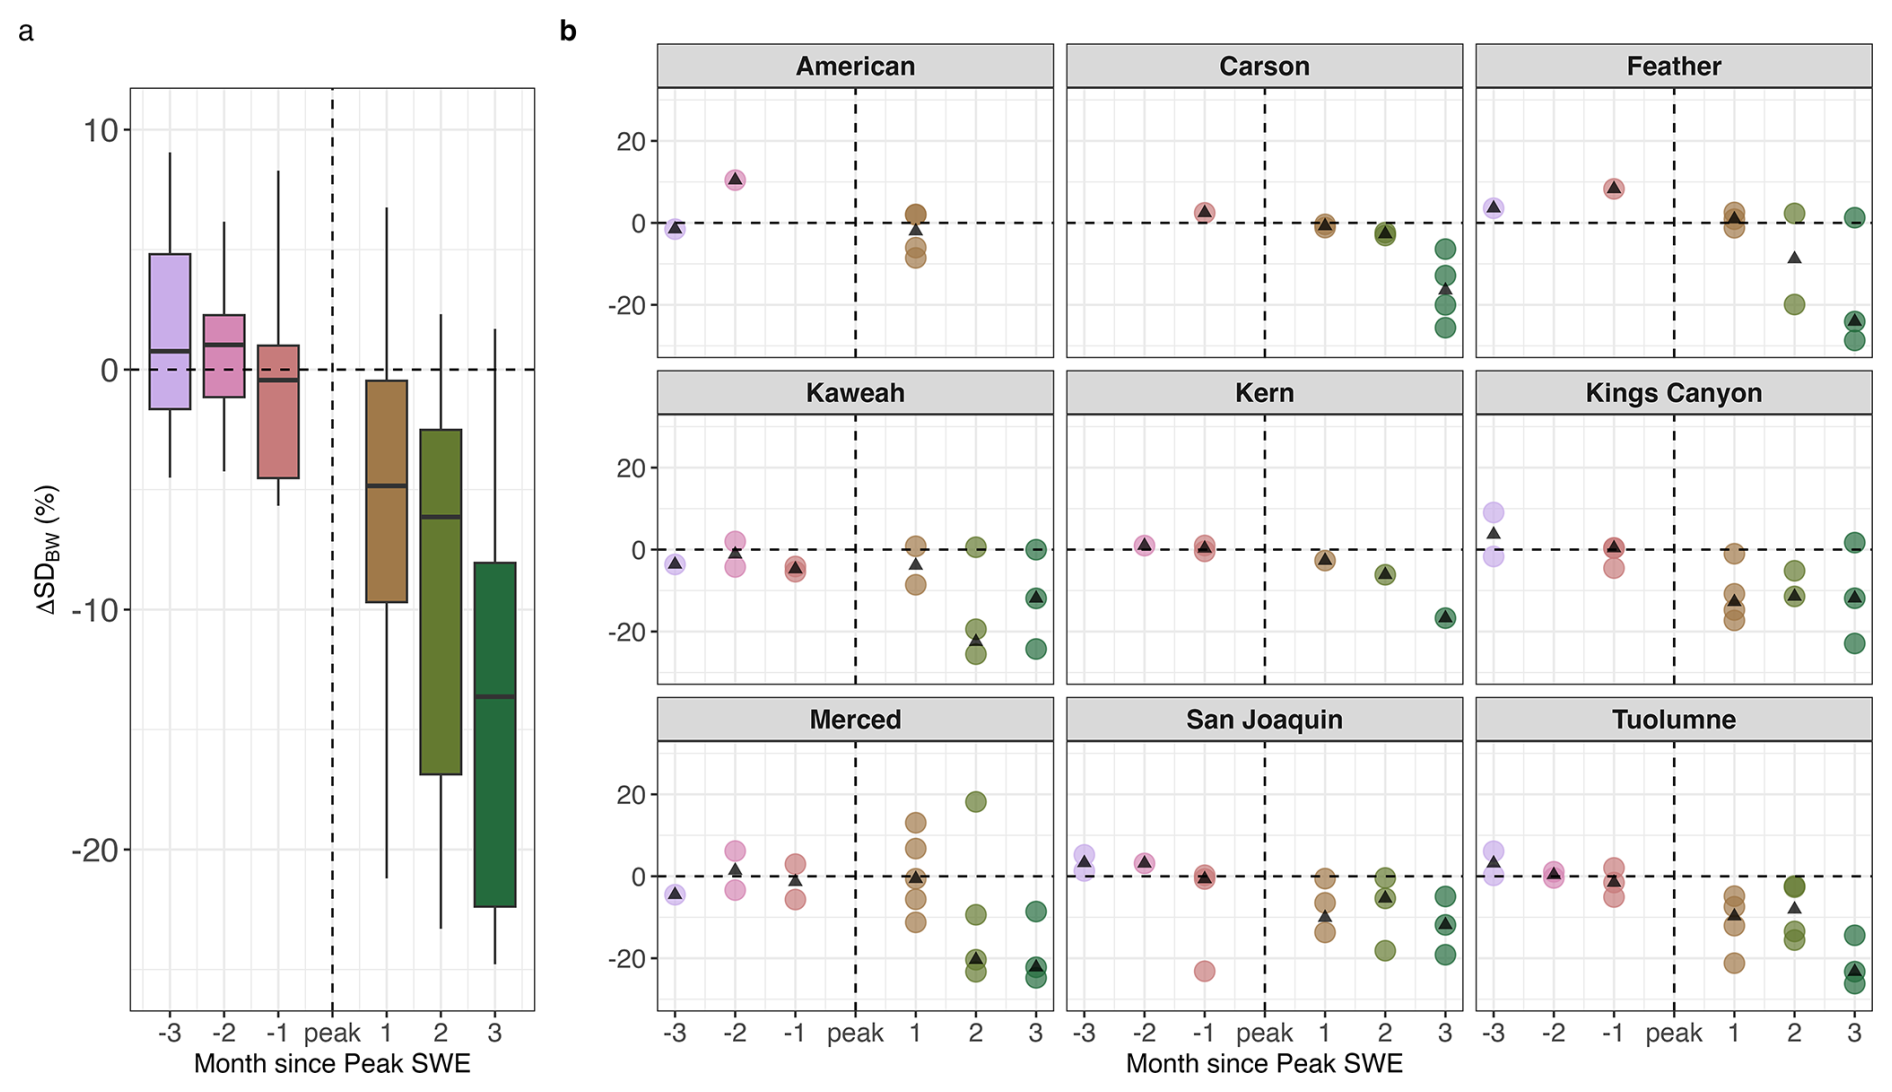
Figure 3(a) Basin-wide average percent difference in snow depth (ΔSDBW) by month relative to peak SWE. (b) ΔSDBW by basin and month relative to peak SWE. Each point represents one acquisition. Black triangles are the median ΔSDBW for each month since peak SWE for each basin. Negative values on the x-axis indicate acquisitions before peak SWE; positive values indicate acquisitions after. Months are binned in 30 d intervals.
3.2 Post-fire snow depth changes increase during accumulation and decrease during melt
Machine learning simulations of snow depth for predicted burned and unburned conditions indicated that the basin-wide percent difference in post-fire snow depth (ΔSDBW) was nearly unchanged in the accumulation season (before peak SWE) while predominantly negative in the ablation season (after peak SWE). The variability of change was much larger in the ablation season compared to the accumulation season (Figs. 3 and S2 in the Supplement). Across all 114 acquisitions, 44 % of accumulation acquisitions had a lower basin-wide average predicted snow depth in burned than unburned conditions, compared to 83 % during melt. The median ΔSDBW was −4.51 % (IQR: 14.8) across all seasons but was 0.31 % (IQR: 6.0) in the accumulation season, compared to −9.0 % (IQR: 18.6) during the melt season. The accumulation seasons overall positive ΔSDBW and less variability compared to the ablation season, with more gradual increases compared to the ablation season. About half (53 %) of melt-season acquisitions had ΔSDBW values lower than −10 %, while only 5 % of accumulation season ΔSDBW values exceeded ± 10 % (Figs. 3 and S2).
The contrast between accumulation and ablation season effects is further emphasized in individual months. The largest ΔSDBW occurred two and 3 months after peak SWE, with median values across all basins and years of −10.4 % (IQR:17.8) and −16.7 % (IQR:13.4), respectively. In contrast, the difference was minimal 2 months (1.10 %; IQR:3.55) and 1 month before peak SWE (−0.44 %; IQR: 5.52). During accumulation, ΔSDBW stayed consistent from 3 months to 1 month prior to peak SWE, while in the ablation season, ΔSDBW declined each month following peak SWE. Variability was substantially higher in the ablation season and increased throughout the snow season (Fig. 3). Basin-wide average interannual temperature and snowfall variability did not appear to be a large driver of this heterogeneity (Fig. S3 in the Supplement).
Within individual basins, ΔSDBW patterns are more variable, suggesting local topographic or climatic factors influence post-fire snowpack response (Figs. 3b and S2). The Kings Canyon and Kaweah basins exhibited the strongest seasonal contrast in ΔSDBW, with smaller losses during accumulation and the largest losses during melt (median ΔSDBW was 13 %–17 % across ablation months in the two basins). In contrast, the Kern showed little median seasonal change (± 1 % difference). During accumulation, all basins, except the Kaweah and Merced, had positive ΔSDBW with a median of +0.31 %. During ablation, the Kaweah, Kings Canyon, Merced, San Joaquin, and Tuolumne all exceeded a median of −10 % ΔSDBW during the ablation season.
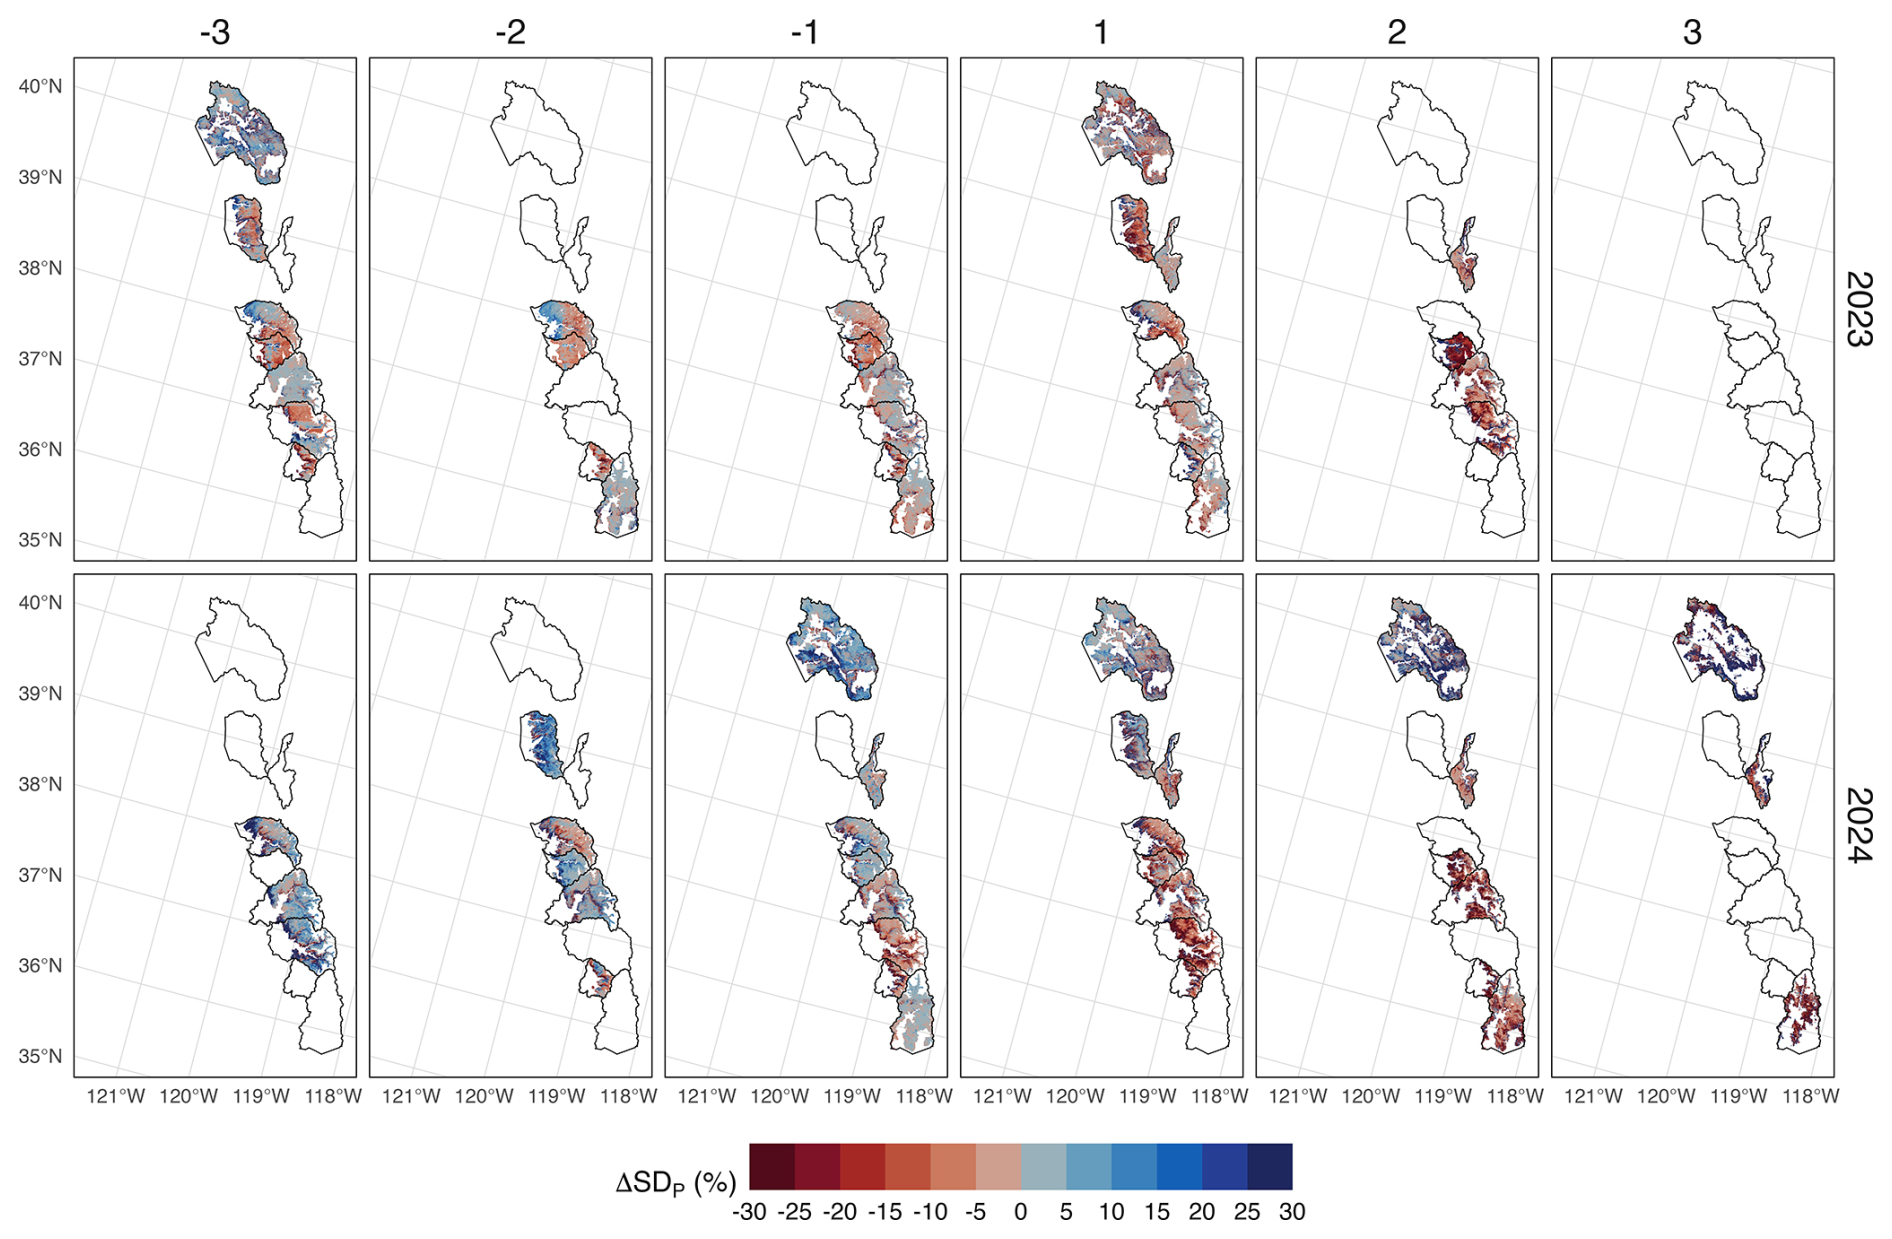
Figure 4Maps of post-fire snow depth percent difference (ΔSDP) for water years 2023 and 2024 – the years with the most lidar acquisitions – across nine study basins by month since peak SWE. See Fig. S4 for maps from other years.
By 3 months post-peak SWE, the Kern showed a 16.7 % increase in basin-wide snow depth under burned conditions, while the Feather showed a 24 % decline. These patterns highlight the large spatial variability in post-fire snowpack response, which is not clearly explained by latitude or timing alone (Figs. 3, 4, S2, and S4 in the Supplement).
3.3 Post-fire snow depth varies spatially
Post-fire changes in ΔSDBW show substantial spatial heterogeneity across basins, years, and months since peak SWE, particularly at the 50 m scale (Figs. 4 and S4). Across all acquisitions, the median ΔSDBW for the northern basins (American, Carson, Feather) was nearly four times that of the southern basins (Tuolumne, Merced, Kings Canyon, San Joaquin, Kern, Kaweah), with ΔSDBW values of −5.06 % and −1.20 %, respectively. However, when broken down by season, the median ΔSDBW becomes more exacerbated, especially during the ablation season, with ΔSDBW values of −2.72 % for the northern basins and −11.6 % for the southern basins. The accumulation season, however, exhibits a smaller discrepancy between the two regions: median ΔSDBW in the northern basins is 3.57 %, compared to 0.22 % in the southern basins.
At the 50 m scale, pixel-wise median percent difference in post-fire snow depth (ΔSDP) variability is heterogeneous across each acquisition for each basin. Flights in the ablation season had larger spatial variability (IQR: 18.6 %) compared to those in the accumulation season (IQR: 6.0 %). Out of 114 flights, 15 had more than 90 % of ΔSDp with the same sign, with all but two of these flights occurring in the ablation season. Not all pixels exhibited the same patterns within a given basin or season (Figs. 4 and S4 ). For example, many acquisitions had evidence of more positive ΔSDp estimated along rivers, while others had clear elevation gradients within the acquisition.
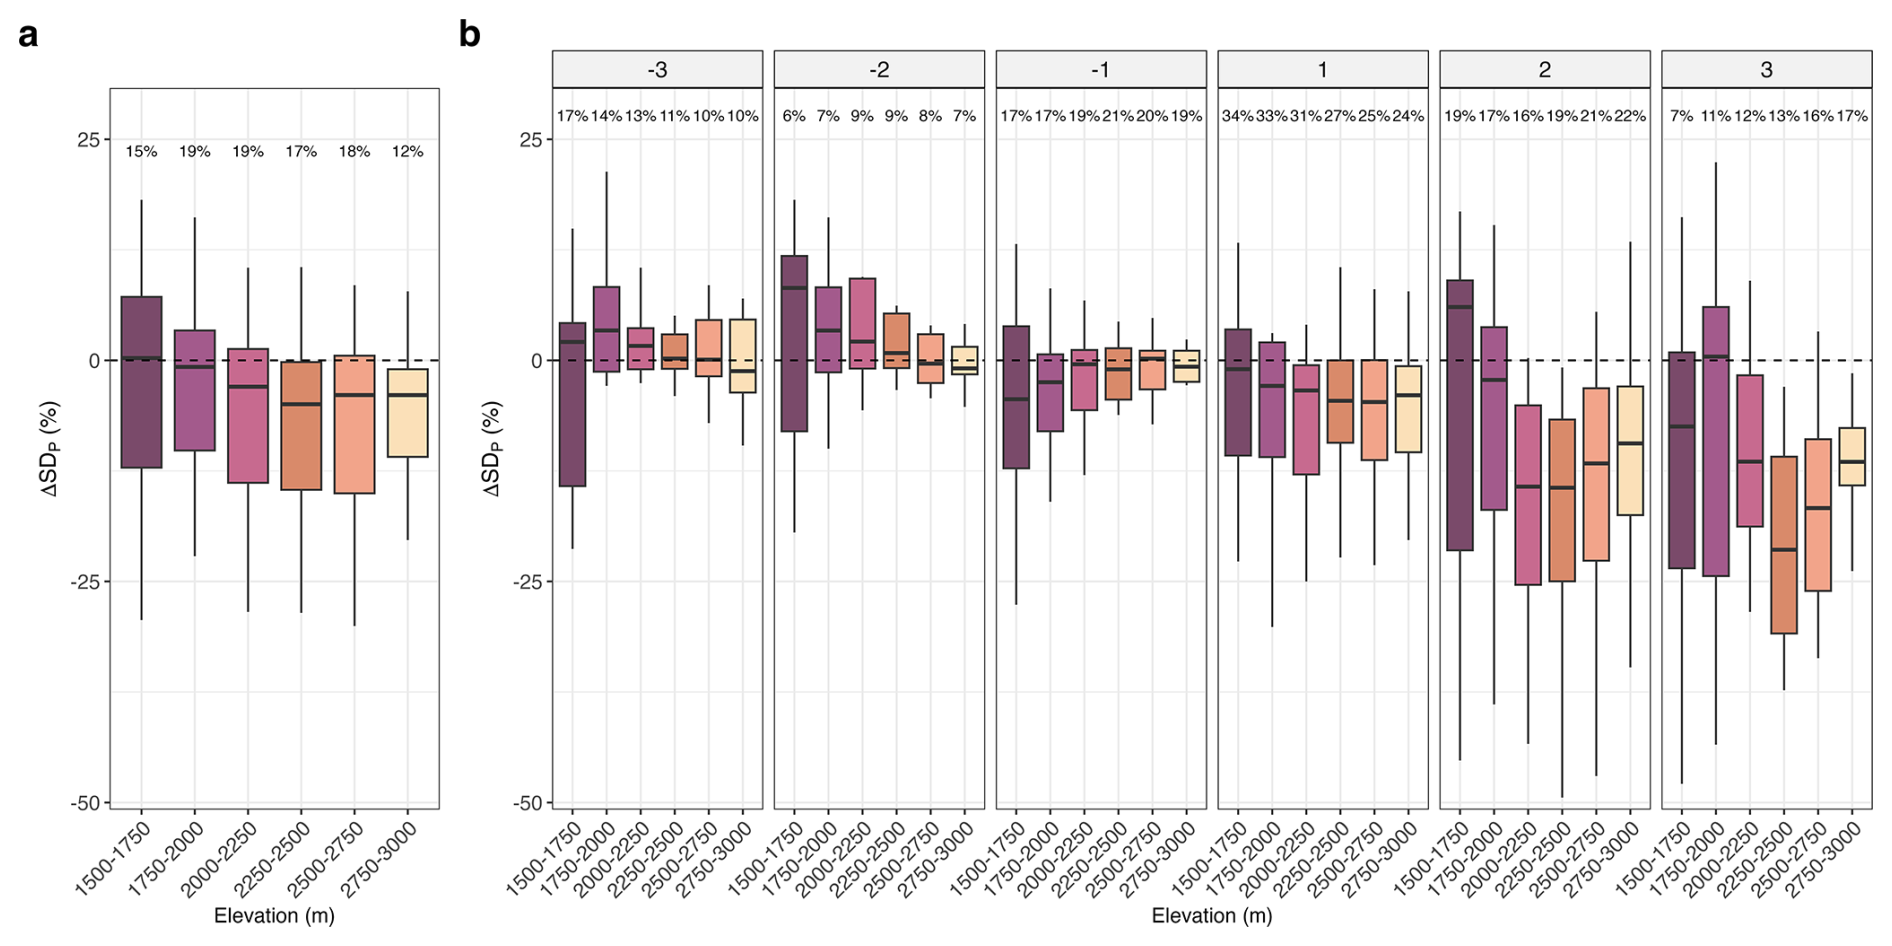
Figure 5(a) Interquartile range of post-fire snow depth percent difference (ΔSDP) by elevation band across all basins; text denotes fraction of basin area within each elevation band. The black line indicates the median. (b) Same as in (a) but split out by month since peak SWE.
3.4 Elevation and aspect influence heterogeneous post-fire snow depth changes
Despite large variability within elevation bands, lower elevations (< 2000 m) consistently exhibited smaller and near-zero ΔSDP compared to higher elevations (> 2000 m), where ΔSDP was more strongly negative (Fig. 5a). Low elevations had greater variability in DeltaSDP, and the spread in ΔSDP narrowed as elevation increased. Seasonal patterns further highlight elevation-driven trends, with larger variability during the ablation season compared to the accumulation season, especially at lower elevation (Fig. 5b). During the accumulation season, especially 2–3 months before peak SWE, ΔSDP at low elevations was often positive, whereas moderate to high elevations were more near zero during the accumulation. At the low elevation (< 2000 m), 38 % of ΔSDP during the accumulation season were negative compared to 55 % during ablation. At high elevation, 75 % of ΔSDP were negative during ablation compared to only 48 % during accumulation. The magnitude of negative ΔSDP increased with elevation, particularly during the ablation season, with the largest negative ΔSDP occurring above 2000 m 3 months after peak SWE. However, the largest seasonal shift in median ΔSDP occurred at high elevation (2000–3000 m), where median ΔSDP changed from 0.17 % in accumulation to −6.81 % in ablation. Low elevation (< 2000 m) had nearly no seasonal change, from 2.5 % in accumulation to −1.36 % in ablation. Mid-high elevations exhibited large seasonal shifts in ΔSDP, often transitioning from near positive to negative ΔSDP around peak SWE. However, 1 month after peak SWE, all elevations had more consistent ΔSDP (Fig. 3b). The proportion of the basin area at high or low elevation was not correlated with ΔSDBW. The Feather is the lowest elevation basin with 80 % of the forested area falling below 2000 m, while Kings Canyon is among the highest with 54 % of the forest area above 2500 m. Neither of these extreme elevation gradients shows a large trend in ΔSDBW (Fig. S5 in the Supplement).
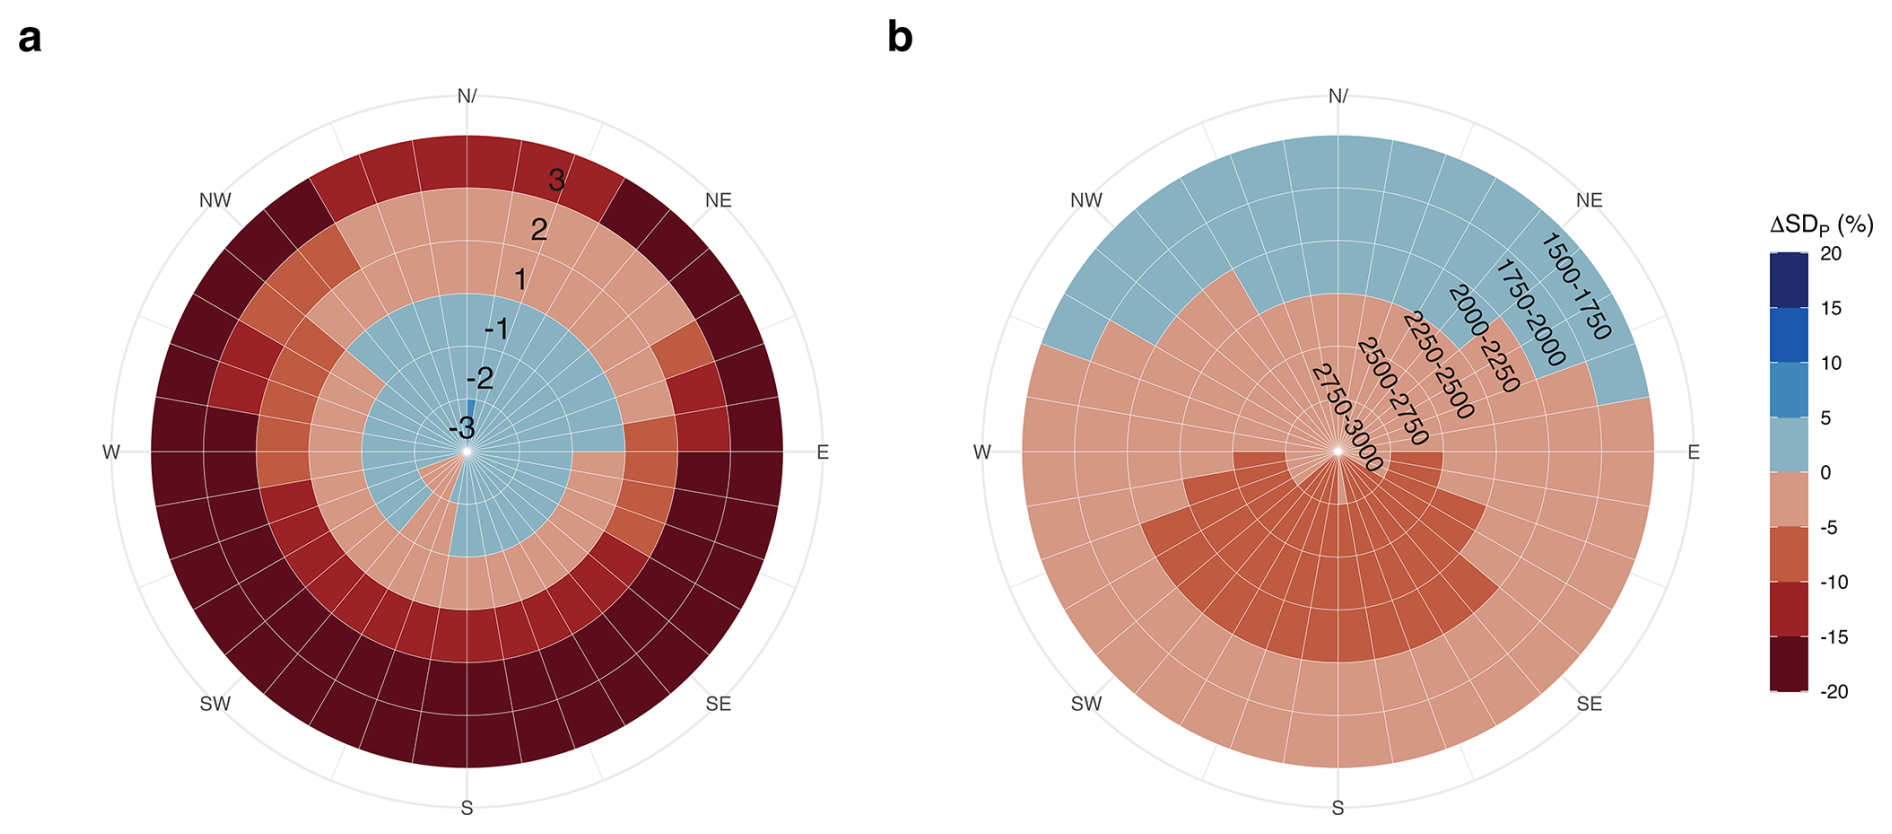
Figure 6Median post-fire snow depth percent difference (ΔSDP) by aspect. (a) ΔSDP by aspect for each month relative to peak SWE. (b) As in (a), shown by elevation band (m).
Aspect also influences ΔSDP heterogeneity, particularly at high elevation and during the ablation season (Fig. 6). During the accumulation season, ΔSDP were generally positive and especially on north-facing slopes, although the magnitude of change was small. After peak SWE, the median ΔSDP across all aspects remained negative, ranging from −5.0 % (north) to −20.4 % (south). During the ablation season, aspect had a strong influence on ΔSDP. South-, west-, and east-facing slopes had more negative ΔSDP, with median ΔSDP ranging from −12 % to 20 %, whereas northern slopes had a median of −5.0 % (Fig. 6a). The largest median ΔSD occurred 2–3 months post-peak SWE on south-west and east-facing slopes, exceeded −25 %, while north-facing slopes had a median of −3.7 % throughout the ablation season. The smallest median ΔSDP was observed two months prior to peak SWE on south-facing slopes (+0.07 % and −0.19 %, respectively), with western and easter slopes ranging from −1.7 % to −3 %. Overall, non north-facing slopes drove the largest snow reductions during ablation, whereas north-facing slopes were less affected, until 3 months after peak SWE.
Aspect and elevation also interacted to affect ΔSD, although with a smaller magnitude than seasonality. South- facing slope exhibited the largest negative ΔSDP, especially above 2000 m, with median ΔSDP ranging from −9.0 % to −12.5 %. North-facing slopes had a positive median ΔSDP at elevations below 2000 m, ranging from −0.2 % to 3.1 % (Fig. 6b). Aspect influence drives a dichotomy where the largest influence is either positive snow retention on low elevation north-facing slopes and the largest snow loss is at high elevation south-facing slopes.
4.1 Fire effects on snow depth vary throughout the snow season and across elevation and aspect
ML-predicted snow depth is lower in burned compared to unburned forests during the ablation season, with much larger impacts late in the season (3 months after peak SWE). These differences vary spatially across elevation bands, aspects, and basins, with the largest effects at southern aspects. During the accumulation season, burned areas retained more snow depth than unburned areas. This pattern suggests an increased rate of snowmelt under burned conditions after peak SWE and reflects a seasonally dependent shift in dominant snowpack energy balance processes following wildfire.
The variability in post-fire snowpack changes is likely driven by a trade-off between increased accumulation from reduced canopy interception and enhanced melt from lower albedo and greater shortwave radiation. During accumulation, reduced canopy interception in burned forests mitigates snow loss, especially when snowpacks are cold and storms are frequent (Hatchett, Koshkin et al., 2023). These conditions help retain snow depth in burned forests and mitigate substantial losses. Our analyses suggest smaller losses in snow depth during the accumulation season. Conversely, during spring melt, when solar radiation is higher and albedo resets occur less frequently, burned snowpacks absorb more energy due to black carbon deposition from charred trees, leading to accelerated melt (Gleason et al., 2013). These observations support the idea that small shifts in energy balance in snowpacks with minimal cold content can rapidly initiate melt (Jennings et al., 2018; Lundquist et al., 2013), consistent with previous findings of earlier snow disappearance and predominantly lower, earlier peak SWE post-fire (Giovando and Niemann, 2022; Kampf et al., 2022; Koshkin et al., 2025; McGrath et al., 2023; Smoot and Gleason, 2021). This energy balance trade-off could explain why there is more snow retained in burned forests during accumulation, while a large loss in snow depth occurred during the ablation season.
This seasonal contrast is further enhanced by elevation. The largest post-fire snow loss occurred at higher elevations, particularly 2–3 months post-peak SWE, well into spring months. These areas also retain snow the longest, extending ablation into a period of high solar radiation when melt is accelerated (Musselman et al., 2017). Reduced albedo in a burned forest, combined with increased incoming solar radiation, may cause these snowpacks to absorb more energy, accelerating melt and, in turn, snow loss compared to unburned forests. The effect is especially pronounced on south- and east-facing slopes, which receive greater solar exposure. In contrast, lower-elevation areas melt earlier in the season, when solar radiation is less intense, so the differences between burned and unburned forests are smaller; this potential mechanism is supported by the observation that elevation differences are relatively minimal earliest in the accumulation season and is consistent with similar findings evaluating the impact of dust-on-snow (Réveillet et al., 2022). However, these findings at high elevation are inconsistent with previous work that found that high elevation burned forests had smaller changes in snow disappearance timing compared to low elevation (Koshkin et al., 2025). This contrast could be an artifact of the definitions of high elevation, as Koshkin et al. (2025) found a larger advance in post-fire snowmelt timing in the Sierra Nevada, which are lower elevation compared with the Rocky Mountains, especially in the northern basins of the Sierra Nevada, which is consistent with our findings. This finding may also be subject to uncertainty among different datasets and statistical methods and should be examined further in future work.
Aspect further exacerbates differences in accumulation and melt season dynamics following fire – a finding that is novel to this study, given the advantages of high-resolution, spatially distributed data used here. North-facing slopes, which generally have higher snow retention due to low radiation loads (Blanken and Barry, 2016), retained more snow in burned forests during the accumulation season and had the smallest loss in burned forest during ablation Snow accumulation from canopy loss in these areas may insulate the snowpack from substantial albedo-driven energy degradation when cold contents are negative (Dickerson-Lange et al., 2021; Harpold et al., 2014; Lundquist et al., 2013), leading to smaller snowpack losses. Conversely, south-facing slopes experienced the largest snow depth reductions in burned forests, consistent with higher radiation loads and more rapid energy gain from albedo degradation (Blanken and Barry, 2016; Wiscombe and Warren, 1980). This is especially true at high elevation, 2–3 months after peak SWE (well into spring). This is congruent with previous findings of high-elevation south-facing burned slopes in the Colorado Rocky Mountains reaching peak SWE 22 ds earlier than north-facing slopes (Reis et al., 2024). The results imply that post-fire changes on north- facing slopes may be mitigated by canopy change, particularly early in the season, while south- and east-facing aspects may be more dominated by albedo change exacerbated by high radiation loads.
4.2 Methodological innovations
Our results provide a quantitative analysis of seasonal, spatial and topographic variability in post-fire snow, using a predictive machine learning algorithm and explainable AI methods that are novel in snow hydrology. The XGBoost algorithm used has become common in remote sensing gap-filling applications (Arabameri et al., 2021; Karthikeyan and Mishra, 2021; Kavzoglu and Teke, 2022) and has recently been applied to create a daily reanalysis SWE product (Sun et al., 2024). Our method is an ML-based alternative to statistical approaches that have previously been used in snow hydrology, for example, to examine snowfall intensity impacts on snow storage (Marshall et al., 2020) and to quantify changes in post-fire snow disappearance date across the western US (Koshkin et al., 2025). Some other hydrology studies have used variants of explainable AI to understand flooding characteristics (Schmidt et al., 2020) and flash-flood susceptibility (Abedi et al., 2022). Using a neural network and random forest, Schmidt et al. (2020) showed that inferential ML had higher predictive accuracy than a linear regression and reflected physical hydrological principles accurately, which generally aligns with our findings. However, they also identified differences in the results from two ML algorithms (analogous to equifinality issues in process-based models), suggesting a potential need for future work examining the robustness of our more detailed results to the choice of ML algorithm or input variables. It may be particularly valuable to investigate the impact of spatially-aware ML models (Goel et al., 2023).
Our approach used ML to provide a new understanding of the relative influence of topography and seasonality on post-fire snow changes, while not being limited by the need for pre-and post-fire snow data. While classical statistical approaches inspect regression slopes to obtain effect sizes (Luce et al., 2014), we identify the effect size by comparing model-predicted values in counterfactual burned and unburned conditions. Our framework demonstrates that predictive machine learning can complement process-based modeling, particularly in cases where observational data for model evaluation are sparse. On average, our models had a median RMSE of 0.09 m (ranging from 0.02 to 0.28 m) of snow depth. Previous work has assessed the error of model products based on SWE, rather than snow depth, and generally targets generalizable predictability across space and time, while we aimed only for predictability within each flight, which is ultimately an easier machine learning task. A rough conversion of our snow depth RMSE to SWE based on modeled density derived from ASO SWE data suggests a median SWE RMSE of 0.05 m across all 114 flights. This is comparable to model errors from SNODAS (0.159 m), REC-Parbal (0.082), and National Water Model SWE (0.175 m) (Yang et al., 2023). Our RMSE values were similar to or lower than previous ML-based efforts to simulate snow depth (Cartwright et al., 2022; Daudt et al., 2023; Herbert et al., 2025), though each of these studies has slightly different aims and training data provided to the models.
The machine learning approach applied here is functionally an extension of classical statistical methods, with an additional level of flexibility to take advantage of modern large datasets. Classical statistical models, such as linear regression or generalized additive models, require more pre-determined assumptions about data structures and interactions among variables (Wood, 2017). In contrast, XGBoost and other machine learning algorithms can flexibly model nonlinearities and higher-order interactions without pre-specifying functional forms and are robust to outliers. These strengths are particularly valuable in studies assessing wildfire impacts on snow, where the effects of burn severity, canopy loss, and terrain features on snow depth are spatially heterogeneous and interact in non-linear ways. Using high-resolution ML predictions, we bridge a methodological gap in snow hydrology, allowing for robust assessment of the relative influence of topography, seasonality, and fire on snowpack loss in areas where pre-fire observational data may be unavailable or not comparable to post-fire data. Future work should explore how burn severity impacts post-fire snow loss.
4.3 Hydrologic consequences of fire impacts on snow accumulation and melt
Although not evaluated in this study, the fraction of the basin that burns could influence the hydrologic significance of post-fire snow depth changes, especially at the basin scale. In this study, basin-wide averages in forested areas are calculated by treating the entire forested area in a basin as hypothetically burned. The San Joaquin basin, where the Creek Fire burned over 40 % of the basin in 2020 (CAL FIRE – California Open Data, 2024) also had some of the largest post-fire snow depth changes in this study. The magnitude of these changes is an important consideration for water managers when a burn occurs in the sub-alpine portion of their basin, where impacts are disproportionately concentrated. However, downstream hydrologic effects may be partially mitigated by unburned or low-elevation areas within the watershed, which can provide a spatial counterbalance to the most impacted areas.
Understanding topographic and seasonal controls on snow loss in burned forests is crucial for assessing impacts on water availability, runoff timing, and flood risk. Following a wildfire, evapotranspiration often decreases (Roche et al., 2018), while annual and peak streamflow often increase (Abolafia-Rosenzweig et al., 2024; Boisramé et al., 2019; Williams et al., 2022), with peak streamflow occurring 1–50 ds earlier (Pirani and Coulibaly, 2025). High-elevation snowpacks act as natural water storage and contribute disproportionately to the snowmelt hydrograph, accounting for up to 70 % of streamflow generation during the melt period (Sprenger et al., 2024). In burned forests, accelerated snow loss at high elevations decreases snow storage and shifts melt contributions earlier in the season. Earlier peak SWE (Smoot and Gleason, 2021) and snow disappearance date (Koshkin et al., 2025) in burned forests, combined with reduced snow depth, push melt earlier in the season when we expect snowpacks to yield less-concentrated streamflow pulses (Bazlen, 2025). However, in burned forests, the lower albedo could drive faster melt, potentially producing a concentrated spring melt pulse resulting in increased post-fire peak flow. This elevation-driven acceleration of post-fire snowmelt alters both the timing and magnitude of runoff, creating challenges for water managers reliant on predictable high-elevation snowmelt to sustain water supply through summer. This challenge may be further exacerbated by the fact that the largest observed increase in burned area is above 2500 m (Alizadeh et al., 2021), where snow may be particularly difficult to monitor (Serreze et al., 1999).
The effects of fire can persist for up to 6–10 years following a fire before albedo and energy balance processes stabilize (Gersh et al., 2022; Koshkin et al., 2025). In the short term, burned forests may gain snow depth during the accumulation season, but melt faster, driven by the post-fire albedo changes exacerbated in the spring. This is congruent with our findings from the ML-predicted snow depth 1 year after a fire. However, in the long term, as albedo effects wane, the legacy of canopy loss may lead to sustained increases in snow accumulation post-fire, particularly in deeper snowpack in high-elevation areas (Harpold et al., 2014). Future work could expand our methods to evaluate trajectories of post-fire snow impacts across multiple years.
Wildfires disrupt patterns of snow accumulation and melt, challenging our ability to predict water availability in burned watersheds. The direction of change is predominantly negative during ablation, but the magnitude varies by season, aspect, elevation and basin characteristics. The decrease in snow depth post-fire after peak SWE could lead to earlier runoff timing, especially in high-elevation basins. Since basin topography is a compilation of different elevations and aspects, the consequences of burned forests for snowpack dynamics on a basin-wide scale could be impacted by where the fire occurs in the basin. Increased snow depths in one part of a burn scar could counterbalance sharp declines in another, potentially evening out basin-wide effects. Wildfire impacts on snowpack dynamics are complex and highly variable, highlighting the need to continue to leverage different methods (machine learning, statistical and process-based models, in situ observations) and datasets (field campaigns, airborne lidar, satellites) to evaluate the impacts of wildfire on snowpacks on relevant spatial (plot, basin-wide, mountain range) and temporal (daily, monthly, yearly) scales.
All code used to produce the machine learning models and analysis is available at https://zenodo.org/records/14728778 (last access: May 2026). We used R programming language version 4.3.1. for all data processing, analysis, and graphical representation.
All data used in this project are publicly available and accessible. The data used in this work came from SNODAS, https://nsidc.org/data/g02158/versions/1 (last access: May 2026), the monitoring trends in burn severity (MTBS) https://www.mtbs.gov/ (last access: February 2024), Airborne Snow Observatory, Inc. https://data.airbornesnowobservatories.com/ (last access: February 2024).
The supplement related to this article is available online at https://doi.org/10.5194/tc-20-3467-2026-supplement.
AK: conceptualization, data curation, formal analysis, methodology, code development, validation, visualization, writing – original draft, writing – review and editing. AM: conceptualization, funding acquisition, methodology, writing – review and editing, supervision.
The contact author has declared that neither of the authors has any competing interests.
Publisher's note: Copernicus Publications remains neutral with regard to jurisdictional claims made in the text, published maps, institutional affiliations, or any other geographical representation in this paper. The authors bear the ultimate responsibility for providing appropriate place names. Views expressed in the text are those of the authors and do not necessarily reflect the views of the publisher.
This work used Jetstream2 GPU at Indiana University through allocation EES250101 from the Advanced Cyberinfrastructure Coordination Ecosystem: Services & Support (ACCESS) program, which is supported by U.S. National Science Foundation grants #2138259, #2138286, #2138307, #2137603, and #2138296 (Boerner et al., 2023). Comments from Jessica Lundquist and an anonymous reviewer improved an earlier version of this manuscript. Additionally, thoughtful reviews from Eli Boardman and César Deschamps-Berger greatly strengthened the final manuscript.
AK and AM were funded by Dr. Marshall's start-up funding at the Colorado School of Mines.
This paper was edited by Franziska Koch and reviewed by Elijah Boardman and César Deschamps-Berger.
Abedi, R., Costache, R., Shafizadeh-Moghadam, H., and Pham, Q. B.: Flash-flood susceptibility mapping based on XGBoost, random forest and boosted regression trees, Geocarto Int., 37, 5479–5496, https://doi.org/10.1080/10106049.2021.1920636, 2022.
Abolafia-Rosenzweig, R., Gochis, D., Schwarz, A., Painter, T. H., Deems, J., Dugger, A., Casali, M., and He, C.: Quantifying the Impacts of Fire-Related Perturbations in WRF-Hydro Terrestrial Water Budget Simulations in California's Feather River Basin, Hydrol. Process., 38, e15314, https://doi.org/10.1002/hyp.15314, 2024.
Alizadeh, M. R., Abatzoglou, J. T., Luce, C. H., Adamowski, J. F., Farid, A., and Sadegh, M.: Warming enabled upslope advance in western US forest fires, P. Natl. Acad. Sci. USA, 118, e2009717118, https://doi.org/10.1073/pnas.2009717118, 2021.
Arabameri, A., Chandra Pal, S., Costache, R., Saha, A., Rezaie, F., Seyed Danesh, A., Pradhan, B., Lee, S., and Hoang, N.-D.: Prediction of gully erosion susceptibility mapping using novel ensemble machine learning algorithms, Geomat. Nat. Hazards Risk, 12, 469–498, https://doi.org/10.1080/19475705.2021.1880977, 2021.
Bales, R. C., Molotch, N. P., Painter, T. H., Dettinger, M. D., Rice, R., and Dozier, J.: Mountain hydrology of the western United States: MOUNTAIN HYDROLOGY OF THE WESTERN US, Water Resour. Res., 42, https://doi.org/10.1029/2005WR004387, 2006.
Bazlen, K., Marshall, A. M., Smith, S. M., and Koshkin, A.: Hydrograph Spread Increases as Snow Declines Across the Western U.S., Geophys. Res. Lett., 52, e2025GL116816, https://doi.org/10.1029/2025GL116816, 2025.
Behrangi, A., Bormann, K. J., and Painter, T. H.: Using the Airborne Snow Observatory to Assess Remotely Sensed Snowfall Products in the California Sierra Nevada, Water Resour. Res., 54, 7331–7346, https://doi.org/10.1029/2018WR023108, 2018.
Bentéjac, C., Csörgő, A., and Martínez-Muñoz, G.: A comparative analysis of gradient boosting algorithms, Artif. Intell. Rev., 54, 1937–1967, https://doi.org/10.1007/s10462-020-09896-5, 2021.
Blanken, P. D. and Barry, R. G. (Eds.): Topoclimatic Effects on Microclimate, in: Microclimate and Local Climate, Cambridge University Press, Cambridge, 261–274, https://doi.org/10.1017/CBO9781316535981.014, 2016.
Boardman, E. N., Boisramé, G. F. S., Wigmosta, M. S., Shriver, R. K., and Harpold, A. A.: Improving model calibrations in a changing world: controlling for nonstationarity after mega disturbance reduces hydrological uncertainty, Hydrol. Earth Syst. Sci., 29, 6333–6352, https://doi.org/10.5194/hess-29-6333-2025, 2025.
Boerner, T. J., Deems, S., Furlani, T. R., Knuth, S. L., and Towns, J.: ACCESS: Advancing Innovation: NSF's Advanced Cyberinfrastructure Coordination Ecosystem: Services & Support, in: Practice and Experience in Advanced Research Computing 2023: Computing for the Common Good (PEARC '23), Association for Computing Machinery, New York, NY, USA, 173–176, https://doi.org/10.1145/3569951.3597559, 2023.
Boisramé, G. F. S., Thompson, S. E., Tague, C. (Naomi), and Stephens, S. L.: Restoring a Natural Fire Regime Alters the Water Balance of a Sierra Nevada Catchment, Water Resour. Res., 55, 5751–5769, https://doi.org/10.1029/2018WR024098, 2019.
Boon, S.: Snow ablation energy balance in a dead forest stand, Hydrol. Process., 23, 2600–2610, https://doi.org/10.1002/hyp.7246, 2009.
Broxton, P. D., Harpold, A. A., Biederman, J. A., Troch, P. A., Molotch, N. P., and Brooks, P. D.: Quantifying the effects of vegetation structure on snow accumulation and ablation in mixed-conifer forests, Ecohydrology, 8, 1073–1094, https://doi.org/10.1002/eco.1565, 2015.
Broxton, P. D., van Leeuwen, W. J. D., and Biederman, J. A.: Improving Snow Water Equivalent Maps With Machine Learning of Snow Survey and Lidar Measurements, Water Resour. Res., 55, 3739–3757, https://doi.org/10.1029/2018WR024146, 2019.
Bui, L. K. and Glennie, C. L.: Estimation of lidar-based gridded DEM uncertainty with varying terrain roughness and point density, ISPRS Open J. Photogramm. Remote Sens., 7, 100028, https://doi.org/10.1016/j.ophoto.2022.100028, 2023.
Burles, K. and Boon, S.: Snowmelt energy balance in a burned forest plot, Crowsnest Pass, Alberta, Canada, Hydrol Process, 18, https://doi.org/10.1002/hyp.8067, 2011.
CAL FIRE: California Open Data, California Department of Forestry and Fire Protection, https://data.ca.gov/dataset/cal-fire (last access: 19 December 2024).
Cartwright, K., Mahoney, C., and Hopkinson, C.: Machine Learning Based Imputation of Mountain Snowpack Depth within an Operational LiDAR Sampling Framework in Southwest Alberta, Can. J. Remote Sens., 48, 107–125, https://doi.org/10.1080/07038992.2021.1988540, 2022.
Chen, T. and Guestrin, C.: XGBoost: A Scalable Tree Boosting System, in: Proceedings of the 22nd ACM SIGKDD International Conference on Knowledge Discovery and Data Mining, 785–794, https://doi.org/10.1145/2939672.2939785, 2016.
Chen, T., He, T., Benesty, M., Khotilovich, V., Tang, Y., Cho, H., Chen, K., Mitchell, R., Cano, I., Zhou, T., Li, M., Xie, J., Lin, M., Geng, Y., Li, Y., Yuan, J., and Cortes, D.: xgboost: Extreme Gradient Boosting. R package version 3.3.0.0, https://github.com/dmlc/xgboost (last access: May 2026), 2024.
Daudt, R. C., Wulf, H., Hafner, E. D., Bühler, Y., Schindler, K., and Wegner, J. D.: Snow depth estimation at country-scale with high spatial and temporal resolution, ISPRS J. Photogramm., 197, 105–121, https://doi.org/10.1016/j.isprsjprs.2023.01.017, 2023.
Dickerson-Lange, S. E., Vano, J. A., Gersonde, R., and Lundquist, J. D.: Ranking Forest Effects on Snow Storage: A Decision Tool for Forest Management, Water Resour. Res., 57, e2020WR027926, https://doi.org/10.1029/2020WR027926, 2021.
Dwivedi, R., Dave, D., Naik, H., Singhal, S., Omer, R., Patel, P., Qian, B., Wen, Z., Shah, T., Morgan, G., and Ranjan, R.: Explainable AI (XAI): Core Ideas, Techniques, and Solutions, ACM Comput. Surv., 55, 194:1-194:33, https://doi.org/10.1145/3561048, 2023.
Eidenshink, J., Schwind, B., Brewer, K., Zhu, Z.-L., Quayle, B., and Howard, S.: A Project for Monitoring Trends in Burn Severity, Fire Ecol., 3, 3–21, https://doi.org/10.4996/fireecology.0301003, 2007.
Fleckenstein, R., Wellington, D., Jin, S., Tollerud, H., Brown, J. F., Dewitz, J., Pastick, N. J., Barber, C. P., O'Brien, A., and Spanier, M.: A framework for integrating spatiotemporal deep learning methods with landsat for annual land cover and impervious surface mapping, Remote Sens. Environ., 338, 115347, https://doi.org/10.1016/j.rse.2026.115347, 2026.
Gelfan, A. N., Pomeroy, J. W., and Kuchment, L. S.: Modeling Forest Cover Influences on Snow Accumulation, Sublimation, and Melt, J. Hydrometeorol., 5, 785–803, https://doi.org/10.1175/1525-7541(2004)005%3C0785:MFCIOS%3E2.0.CO;2, 2004.
Gersh, M., Gleason, K. E., and Surunis, A.: Forest Fire Effects on Landscape Snow Albedo Recovery and Decay, Remote Sens., 14, 4079, https://doi.org/10.3390/rs14164079, 2022.
Giovando, J. and Niemann, J. D.: Wildfire Impacts on Snowpack Phenology in a Changing Climate Within the Western U. S., Water Resour. Res., 58, https://doi.org/10.1029/2021WR031569, 2022.
Gleason, K. E., Nolin, A. W., and Roth, T. R.: Charred forests increase snowmelt: Effects of burned woody debris and incoming solar radiation on snow ablation: CHARRED FORESTS INCREASE SNOWMELT, Geophys. Res. Lett., 40, 4654–4661, https://doi.org/10.1002/grl.50896, 2013.
Gleason, K. E., McConnell, J. R., Arienzo, M. M., Chellman, N., and Calvin, W. M.: Four-fold increase in solar forcing on snow in western U. S. burned forests since 1999, Nat. Commun., 10, 2026, https://doi.org/10.1038/s41467-019-09935-y, 2019.
Goel, A., Goel, A. K., and Kumar, A.: The role of artificial neural network and machine learning in utilizing spatial information, Spat. Inf. Res., 31, 275–285, https://doi.org/10.1007/s41324-022-00494-x, 2023.
Goldstein, A., Kapelner, A., Bleich, J., and Pitkin, E.: Peeking Inside the Black Box: Visualizing Statistical Learning With Plots of Individual Conditional Expectation. Journal of Computational and Graphical Statistics, 24, 44–65, https://doi.org/10.1080/10618600.2014.907095, 2015.
Hale, K. E., Wlostowski, A. N., Badger, A. M., Musselman, K. N., Livneh, B., and Molotch, N. P.: Modeling streamflow sensitivity to climate warming and surface water inputs in a montane catchment, J. Hydrol. Reg. Stud., 39, 100976, https://doi.org/10.1016/j.ejrh.2021.100976, 2022.
Harpold, A. A., Biederman, J. A., Condon, K., Merino, M., Korgaonkar, Y., Nan, T., Sloat, L. L., Ross, M., and Brooks, P. D.: Changes in snow accumulation and ablation following the Las Conchas Forest Fire, New Mexico, USA: CHANGES IN SNOW FOLLOWING FIRE, Ecohydrology, 7, 440–452, https://doi.org/10.1002/eco.1363, 2014.
Hatchett, B. J., Koshkin, A., Guirguis, K., Rittger, K., Nolin, A. W., Heggli, A., Rhoades, A. M., East, A. E., Siirila-Woodburn, E. R., Brandt, W. T., Gershunov, A., and Haleakala, K.: Midwinter Dry Spells Amplify Post-Fire Snowpack Decline, Geophys. Res. Lett., 50, e2022GL101235, https://doi.org/10.1029/2022GL101235, 2023.
Herbert, J. N., Raleigh, M. S., and Small, E. E.: Reanalyzing the spatial representativeness of snow depth at automated monitoring stations using airborne lidar data, The Cryosphere, 18, 3495–3512, https://doi.org/10.5194/tc-18-3495-2024, 2024.
Herbert, J. N., Raleigh, M. S., and Small, E. E.: Using a Random Forest Model to Combine Airborne Lidar and Snotel Data for Daily Estimates of Snow Depth Across Mountain Drainage Basins of Colorado, Water Resour. Res., 61, e2024WR039775, https://doi.org/10.1029/2024WR039775, 2025.
Immerzeel, W. W., Lutz, A. F., Andrade, M., Bahl, A., Biemans, H., Bolch, T., Hyde, S., Brumby, S., Davies, B. J., Elmore, A. C., Emmer, A., Feng, M., Fernández, A., Haritashya, U., Kargel, J. S., Koppes, M., Kraaijenbrink, P. D. A., Kulkarni, A. V., Mayewski, P. A., Nepal, S., Pacheco, P., Painter, T. H., Pellicciotti, F., Rajaram, H., Rupper, S., Sinisalo, A., Shrestha, A. B., Viviroli, D., Wada, Y., Xiao, C., Yao, T., and Baillie, J. E. M.: Importance and vulnerability of the world's water towers, Nature, 577, 364–369, https://doi.org/10.1038/s41586-019-1822-y, 2020.
Jennings, K. S., Winchell, T. S., Livneh, B., and Molotch, N. P.: Spatial variation of the rain–snow temperature threshold across the Northern Hemisphere, Nat. Commun., 9, 1148, https://doi.org/10.1038/s41467-018-03629-7, 2018.
Kampf, S. K., McGrath, D., Sears, M. G., Fassnacht, S. R., Kiewiet, L., and Hammond, J. C.: Increasing wildfire impacts on snowpack in the western U. S., P. Natl. Acad. Sci. USA, 119, e2200333119, https://doi.org/10.1073/pnas.2200333119, 2022.
Karthikeyan, L. and Mishra, A. K.: Multi-layer high-resolution soil moisture estimation using machine learning over the United States, Remote Sens. Environ., 266, 112706, https://doi.org/10.1016/j.rse.2021.112706, 2021.
Kavzoglu, T. and Teke, A.: Advanced hyperparameter optimization for improved spatial prediction of shallow landslides using extreme gradient boosting (XGBoost), Bull. Eng. Geol. Environ., 81, 201, https://doi.org/10.1007/s10064-022-02708-w, 2022.
Koshkin, A., Hatchett, B. J., and Nolin, A. W.: Wildfire impacts on western United States snowpacks, Front. Water, 4, https://doi.org/10.3389/frwa.2022.971271, 2022.
Koshkin, A., Marshall, A. M., and Rittger, K.: Impact of current and warmer climate conditions on snow cover loss in burned forests, Sci. Adv., 11, https://doi.org/10.1126/sciadv.adt9866, 2025.
Lang, M., Schratz, P., and Becker, M.: mlr3verse: Easily Install and Load the “mlr3” Package Family, R package version 0.3.1, https://mlr3verse.mlr-org.com (last access: May 2026), 2025.
Li, D., Wrzesien, M. L., Durand, M., Adam, J., and Lettenmaier, D. P.: How much runoff originates as snow in the western United States, and how will that change in the future?, Geophys. Res. Lett., 44, 6163–6172, https://doi.org/10.1002/2017GL073551, 2017.
Livneh, B. and Badger, A. M.: Drought less predictable under declining future snowpack, Nat. Clim. Change, 10, 452–458, https://doi.org/10.1038/s41558-020-0754-8, 2020.
Luce, C. H., Lopez-Burgos, V., and Holden, Z.: Sensitivity of snowpack storage to precipitation and temperature using spatial and temporal analog models, Water Resour. Res., 50, 9447–9462, https://doi.org/10.1002/2013WR014844, 2014.
Lundquist, J. D., Dickerson-Lange, S. E., Lutz, J. A., and Cristea, N. C.: Lower forest density enhances snow retention in regions with warmer winters: A global framework developed from plot-scale observations and modeling: Forests and Snow Retention, Water Resour. Res., 49, 6356–6370, https://doi.org/10.1002/wrcr.20504, 2013.
Lundquist, J. D., Dickerson-Lange, S., Gutmann, E., Jonas, T., Lumbrazo, C., and Reynolds, D.: Snow interception modelling: Isolated observations have led to many land surface models lacking appropriate temperature sensitivities, Hydrol. Process., 35, e14274, https://doi.org/10.1002/hyp.14274, 2021.
Mankin, J. S., Viviroli, D., Singh, D., Hoekstra, A. Y., and Diffenbaugh, N. S.: The potential for snow to supply human water demand in the present and future, Environ. Res. Lett., 10, 114016, https://doi.org/10.1088/1748-9326/10/11/114016, 2015.
Marshall, A. M., Abatzoglou, J. T., Link, T. E., and Tennant, C. J.: Projected Changes in Interannual Variability of Peak Snowpack Amount and Timing in the Western United States, Geophys. Res. Lett., 46, 8882–8892, https://doi.org/10.1029/2019GL083770, 2019a.
Marshall, A. M., Link, T. E., Abatzoglou, J. T., Flerchinger, G. N., Marks, D. G., and Tedrow, L.: Warming Alters Hydrologic Heterogeneity: Simulated Climate Sensitivity of Hydrology-Based Microrefugia in the Snow-to-Rain Transition Zone, Water Resour. Res., 55, 2122–2141, https://doi.org/10.1029/2018WR023063, 2019b.
Marshall, A. M., Link, T. E., Robinson, A. P., and Abatzoglou, J. T.: Higher Snowfall Intensity is Associated with Reduced Impacts of Warming Upon Winter Snow Ablation, Geophys. Res. Lett., 47, e2019GL086409, https://doi.org/10.1029/2019GL086409, 2020.
Marshall, A. M., Abatzoglou, J. T., Rahimi, S., Lettenmaier, D. P., and Hall, A.: California's 2023 snow deluge: Contextualizing an extreme snow year against future climate change, P. Natl. Acad. Sci. USA, 121, e2320600121, https://doi.org/10.1073/pnas.2320600121, 2024.
Maxwell, J. D., Call, A., and St. Clair, S. B.: Wildfire and topography impacts on snow accumulation and retention in montane forests, Forest. Ecol. Manag., 432, 256–263, https://doi.org/10.1016/j.foreco.2018.09.021, 2019.
McEvoy, D. J. and Hatchett, B. J.: Spring heat waves drive record western United States snow melt in 2021, Environ. Res. Lett., 18, 014007, https://doi.org/10.1088/1748-9326/aca8bd, 2023.
McGrath, D., Zeller, L., Bonnell, R., Reis, W., Kampf, S., Williams, K., Okal, M., Olsen-Mikitowicz, A., Bump, E., Sears, M., and Rittger, K.: Declines in Peak Snow Water Equivalent and Elevated Snowmelt Rates Following the 2020 Cameron Peak Wildfire in Northern Colorado, Geophys. Res. Lett., 50, e2022GL101294, https://doi.org/10.1029/2022GL101294, 2023.
Molotch, N. P., Fassnacht, S. R., Bales, R. C., and Helfrich, S. R.: Estimating the distribution of snow water equivalent and snow extent beneath cloud cover in the Salt–Verde River basin, Arizona, Hydrol. Process., 18, 1595–1611, https://doi.org/10.1002/hyp.1408, 2004.
Mote, P. W., Li, S., Lettenmaier, D. P., Xiao, M., and Engel, R.: Dramatic declines in snowpack in the western US, npj Clim. Atmos. Sci., 1, 2, https://doi.org/10.1038/s41612-018-0012-1, 2018.
Musselman, K. N., Clark, M. P., Liu, C., Ikeda, K., and Rasmussen, R.: Slower snowmelt in a warmer world, Nat. Clim. Change, 7, 214–219, https://doi.org/10.1038/nclimate3225, 2017.
National Operational Hydrologic Remote Sensing Center: Snow Data Assimilation System (SNODAS) Data Products at NSIDC, Version 1, National Aeronautic and Space Agency (NASA), https://doi.org/10.7265/N5TB14TC, 2004.
Painter, T. H., Berisford, D. F., Boardman, J. W., Bormann, K. J., Deems, J. S., Gehrke, F., Hedrick, A., Joyce, M., Laidlaw, R., Marks, D., Mattmann, C., McGurk, B., Ramirez, P., Richardson, M., Skiles, S. M., Seidel, F. C., and Winstral, A.: The Airborne Snow Observatory: Fusion of scanning lidar, imaging spectrometer, and physically-based modeling for mapping snow water equivalent and snow albedo, Remote Sens. Environ., 184, 139–152, https://doi.org/10.1016/j.rse.2016.06.018, 2016.
Pirani, F. J. and Coulibaly, P.: Survey of Wildfire Effects on the Peak Flow Characteristics, Water Resour. Manag., 39, 2943–2969, https://doi.org/10.1007/s11269-025-04207-5, 2025.
Reis, W., McGrath, D., Elder, K., Kampf, S., and Rey, D.: Quantifying Aspect-Dependent Snowpack Response to High-Elevation Wildfire in the Southern Rocky Mountains, Water Resour. Res., 60, e2023WR036539, https://doi.org/10.1029/2023WR036539, 2024.
Réveillet, M., Dumont, M., Gascoin, S., Lafaysse, M., Nabat, P., Ribes, A., Nheili, R., Tuzet, F., Ménégoz, M., Morin, S., Picard, G., and Ginoux, P.: Black carbon and dust alter the response of mountain snow cover under climate change, Nat. Commun., 13, 5279, https://doi.org/10.1038/s41467-022-32501-y, 2022.
Ritchie, E., Wood, A. W., Johnson, R., Marshall, A., Sturtevant, J., Liljestrand, D., and Golitzin, E.: Benchmarking Catchment-Scale Snow Water Equivalent Datasets and Models in the Western United States, EGUsphere [preprint], https://doi.org/10.5194/egusphere-2025-5514, 2025.
Roche, J. W., Goulden, M. L., and Bales, R. C.: Estimating evapotranspiration change due to forest treatment and fire at the basin scale in the Sierra Nevada, California, Ecohydrology, 11, e1978, https://doi.org/10.1002/eco.1978, 2018.
Roth, T. R. and Nolin, A. W.: Forest impacts on snow accumulation and ablation across an elevation gradient in a temperate montane environment, Hydrol. Earth Syst. Sci., 21, 5427–5442, https://doi.org/10.5194/hess-21-5427-2017, 2017.
Schmidt, L., Heße, F., Attinger, S., and Kumar, R.: Challenges in Applying Machine Learning Models for Hydrological Inference: A Case Study for Flooding Events Across Germany, Water Resour. Res., 56, e2019WR025924, https://doi.org/10.1029/2019WR025924, 2020.
Serreze, M. C., Clark, M. P., Armstrong, R. L., McGinnis, D. A., and Pulwarty, R. S.: Characteristics of the western United States snowpack from snowpack telemetry (SNOTEL) data, Water Resour. Res., 35, 2145–2160, https://doi.org/10.1029/1999WR900090, 1999.
Seyednasrollah, B., Kumar, M., and Link, T. E.: On the role of vegetation density on net snow cover radiation at the forest floor, J. Geophys. Res.-Atmos., 118, 8359–8374, https://doi.org/10.1002/jgrd.50575, 2013.
Smoot, E. E. and Gleason, K. E.: Forest Fires Reduce Snow-Water Storage and Advance the Timing of Snowmelt across the Western U. S., Water, 13, 3533, https://doi.org/10.3390/w13243533, 2021.
SNEP: Sierra Nevada Ecosystems, United States Forest Service (USFS), https://research.fs.usda.gov/download/treesearch/6664.pdf (last access: May 2026), 1994.
Sprenger, M., Carroll, R. W. H., Marchetti, D., Bern, C., Beria, H., Brown, W., Newman, A., Beutler, C., and Williams, K. H.: Stream water sourcing from high-elevation snowpack inferred from stable isotopes of water: a novel application of d-excess values, Hydrol. Earth Syst. Sci., 28, 1711–1723, https://doi.org/10.5194/hess-28-1711-2024, 2024.
Sun, L., Zhang, X., Xiao, P., Wang, H., Wang, Y., and Zheng, Z.: Fusing daily snow water equivalent from 1980 to 2020 in China using a spatiotemporal XGBoost model, J. Hydrol., 632, 130876, https://doi.org/10.1016/j.jhydrol.2024.130876, 2024.
Taylor, A. H., Trouet, V., Skinner, C. N., and Stephens, S.: Socioecological transitions trigger fire regime shifts and modulate fire–climate interactions in the Sierra Nevada, USA, 1600–2015 CE, P. Natl. Acad. Sci. USA, 113, 13684–13689, https://doi.org/10.1073/pnas.1609775113, 2016.
Williams, A. P., Livneh, B., McKinnon, K. A., Hansen, W. D., Mankin, J. S., Cook, B. I., Smerdon, J. E., Varuolo-Clarke, A. M., Bjarke, N. R., Juang, C. S., and Lettenmaier, D. P.: Growing impact of wildfire on western US water supply, P. Natl. Acad. Sci. USA, 119, e2114069119, https://doi.org/10.1073/pnas.2114069119, 2022.
Wiscombe, W. J. and Warren, S. G.: A model for the spectral albedo of snow, J. Atmos. Sci., 37, 2712–2733, 1980.
Wood, S. N.: Generalized Additive Models: An Introduction with R, 2nd ed., Chapman and Hall/CRC, Boca Raton, 496 pp., https://doi.org/10.1201/9781315370279, 2017.
Yang, K., Rittger, K., Musselman, K. N., Bair, E. H., Dozier, J., Margulis, S. A., Painter, T. H., and Molotch, N. P.: Intercomparison of snow water equivalent products in the Sierra Nevada California using airborne snow observatory data and ground observations, Front. Earth Sci., 11, https://doi.org/10.3389/feart.2023.1106621, 2023.
Yang, L. and Shami, A.: On hyperparameter optimization of machine learning algorithms: Theory and practice, Neurocomputing, 415, 295–316, https://doi.org/10.1016/j.neucom.2020.07.061, 2020.