the Creative Commons Attribution 4.0 License.
the Creative Commons Attribution 4.0 License.
 | 16 Jun 2026
Thinning-induced glacier deceleration in the Zanskar Himalayas
Tirthankar Ghosh
RAAJ Ramsankaran
Felicity S. McCormack
Andrew N. Mackintosh
Trends in surface velocity provide insight into glacier response to climate change as well as local drivers of ice dynamics. The Zanskar Himalayas are heavily glacierised, and retreating glaciers pose a threat to local and regional water security. Satellite image correlation provides a tool for observing surface velocity over multiple glaciers in a remote and challenging area for field work, providing key observations for tracking changes in this important region. This study provides a comprehensive analysis of long-term (1992–2023) interannual glacier surface velocity and elevation change for 12 selected glaciers with varied morphological characteristics in the Zanskar Basin of the Ladakh Himalayas. We show a statistically significant, region-wide deceleration in glacier flow, with a mean rate of 2.43 m yr−1 per decade. This slowdown is accompanied by progressively increasing surface thinning, from ∼ 0.22 m yr−1 between 2000 and 2005 to ∼ 0.57 m yr−1 by 2015 and 2020, with the strongest thinning and velocity reductions occurring at lower elevations. The spatial and temporal agreement between thinning and velocity decline, together with the expected reduction in driving stress associated with thinning, suggests that ice mass loss is the dominant control on the observed deceleration. Glacier-specific characteristics such as geometry, topography, debris cover, and terminus type further influenced glacier response. For example, lake-terminating glaciers exhibited local increases in ice velocity near their termini. Overall, our results demonstrate a sustained multi-decadal slowdown in glacier flow that is closely linked to ice mass loss, providing new insight into the mechanisms governing glacier dynamics in the Zanskar Himalaya under ongoing climatic change.
- Article
(18256 KB) - Full-text XML
-
Supplement
(4171 KB) - BibTeX
- EndNote


Climate change has severely impacted glaciers across the planet (Bolch et al., 2012a; Hugonnet et al., 2021a; Immerzeel et al., 2010; The GlaMBIE Team et al., 2025) as they are highly sensitive to climate forcings and thus serve as a significant indicator of climate change (Mackintosh et al., 2017; Oerlemans, 1989). Globally, glacier mass outside of Greenland and Antarctic Ice Sheets is projected to decline by 26 ± 6 % to 41 ± 11 % by the end of the 21st century (relative to 2015), under emission scenarios that correspond to +1.5 and 4 °C warming, respectively (Rounce et al., 2023). The Himalayan-Karakoram region, which is often called the Third Pole or the Water Tower of Asia (Immerzeel et al., 2010; Viviroli et al., 2011), hosts one of the largest volumes of glacierized regions outside of Greenland and Antarctica (Wester et al., 2019). As with glaciers worldwide, Himalayan glaciers have also experienced accelerated glacier mass loss over the last few decades (Brun et al., 2017; Maurer et al., 2019; Shean et al., 2020). They serve as a source of fresh water and play an important role in the global water cycle. For example, the meltwater generated from Himalayan glaciers and snow modulates the discharge of major river systems such as the Indus, Ganges, and Brahmaputra (Pritchard, 2019). While the glacial contribution to total runoff varies across the catchments, it underpins the water security of upstream populations and the broader hydrological systems upon which over a billion people downstream depend, recharges river-fed aquifers, and contributes to global sea level rise (Azam et al., 2021; Barnett et al., 2005; Bolch, 2017; Bolch et al., 2012b; Immerzeel et al., 2010).
As the glaciers retreat and thin, ice flow velocities can reduce (Dehecq et al., 2019). Recent studies indicate that many mountain glaciers are experiencing significant deceleration (Dehecq et al., 2019; Wu et al., 2020; Zhou et al., 2021). As glaciers flow due to their weight and gravity, by the processes of internal deformation and sliding at the bed, basal hydrology can substantially complicate this relationship (Bindschadler, 1983; Minchew and Joughin, 2020). Variations in meltwater supply to the bed modify the basal water pressure, which in turn regulates basal sliding (Bindschadler, 1983). As a result, many mountain glaciers exhibit pronounced seasonal velocity cycles, with speed-ups during periods of enhanced surface meltwater input to the bed (Greene and Gardner, 2025). These short-term hydrologically driven fluctuations can obscure longer-term dynamic trends if not carefully accounted for. Such effects can be mitigated using long time series spanning multiple decades, which average out seasonal variability and highlight persistent interannual to decadal trends. Furthermore, glacier-specific, process-based understanding can also help better interpret these results. These flow processes are also influenced by other factors, such as ice temperature, glacier geometry, bed characteristics, air temperature and precipitation (Cuffey and Paterson, 2010; Iken and Bindschadler, 1986). It follows that glacier velocity estimates are a key proxy for understanding the mass balance of a glacier, where few or no direct measurements are available (Millan et al., 2022; World Glacier Monitoring Service (WGMS), 2023).
Historically, glacier velocity has been monitored through the simultaneous development of on-field and satellite remote sensing-based measurements, both of which are established standards in glaciology (Hooke et al., 1989; Stevens et al., 2023; Vincent et al., 2022). For example, Differential Global Navigation Satellite Systems (DGNSS) can be used to track the position of ground stakes on a glacier over time, from which ice surface velocity can be estimated (Azam et al., 2012; Sugiyama et al., 2013). This method is reliable, but logistically expensive and time-consuming, and is generally limited to accessible areas. Most importantly, this method returns only point-based measurements, which limits both the spatial extent and temporal coverage that is needed to characterise the evolution of a glacier system, particularly mountain glaciers, which are remote and difficult to access (Azam et al., 2014; Dematteis et al., 2021; Patel et al., 2022; Sugiyama et al., 2013; Wagnon et al., 2007). By contrast, satellite-based remote sensing methods, such as feature tracking, provide a wide spatial coverage and an easy-to-access dataset. Such methods can be used to estimate glacier-wide surface velocity at a variety of scales from regional to global, and are efficient and robust (Li et al., 1998; Scherler et al., 2008; Scherler and Strecker, 2012; Satyabala, 2016; Bhushan et al., 2017; Dehecq et al., 2019; Millan et al., 2022).
With the availability of more satellite datasets, many ice velocity studies have been carried out in the Himalayas, providing critical insights into glacier spatio-temporal patterns and evolution. Several studies have revealed heterogeneous patterns in the velocity of the Himalayan glaciers (Bhambri et al., 2011; Dehecq et al., 2019; Garg et al., 2025; Tripathi et al., 2023). Findings from these studies show that glacier velocity varies spatially and temporally, region-wise and within the same glacier, depending on factors such as elevation, slope, size, debris cover fraction, land vs lake terminating, mass budget and other local conditions such as ice thickness and basal conditions (Agarwal et al., 2023; Bhushan et al., 2018; Dehecq et al., 2019). Recent studies integrating glacier surface velocity and elevation changes in the Himalayas found substantial heterogeneity in their pattern and trends (Bhambri et al., 2023; Garg et al., 2025). Glaciers in the Garhwal Himalayas exhibited significant surface lowering, associated with a reduction in glacier surface velocity, with Gangotri glacier being one exception with an active terminus (Bhambri et al., 2023). Debris-covered glacier in the region was found to have a heterogeneous effect on ice melt. In another study, focused on glaciers in the Chenab basin in the Western Himalaya, researchers reported a significant slowdown by 54 % and 20 % in Bhut and Warwan sub-basins, respectively (Garg et al., 2025).
Ladakh is located between the Himalayas and the Karakoram, known as the Trans-Himalayan region. Due to its high elevation and position in the lee of several mountain ranges, it has a semi-arid climate, with lower precipitation than many other Himalayan regions (Archer and Fowler, 2004). Most glaciers are relatively small glaciers (< 0.75 km2) and high in elevation (Schmidt and Nüsser, 2017; Soheb et al., 2022), but due to low precipitation, they play a crucial role in water and food security (Nüsser et al., 2012; Schmidt and Nüsser, 2017). For example, in drought years, glaciers and snowmelt may become the only source of water for the region (Thayyen and Gergan, 2010). Various in-situ mass balance measurements suggest these glaciers are losing mass (Azam et al., 2025; Mehta et al., 2021; Shrivastava et al., 1999; Soheb et al., 2020). The implications for regional water security from this ice loss are governed by the timing of 'peak water'- the tipping point where annual meltwater discharge reaches its maximum before declining due to reduced glacier volume (Huss and Hock, 2018). With peak water for the region projected to occur around ∼ 2028, as reported by Huss and Hock, (2018), the current acceleration in mass loss represents a critical transition from a short-term increase in water availability to a long-term reduction of streamflow, making this region extremely vulnerable to water shortages.
Even though many glacier velocity studies are focused on the Western Himalaya (Bhambri et al., 2011; Garg et al., 2025; Satyabala, 2016; Tripathi et al., 2023), the Ladakh region remains understudied, especially regarding long-term dynamic changes in glaciers. Previous studies are restricted to short-term velocity assessment or comparison of velocity with data from two different periods with a significant gap (Bhushan et al., 2018; Rana et al., 2023; Singh Jasrotia et al., 2024). Despite the insights these studies provide into discrete periods of glacier surface velocity, gaps remain in our understanding of continuous, long-term velocity evolution and thinning. Thus, a comprehensive analysis of the glacier dynamics in the Ladakh region is still missing.
The overall aim of this study is to understand the evolution of glacier velocity and its controlling factors. In particular, we consider the following specific objectives:
-
Characterise the long-term (1992–2023) glacier surface velocity trend for selected glaciers in the Zanskar basin, Western Ladakh and evaluate the glacier surface elevation change using the existing dataset by Hugonnet et al. (2021a).
-
Investigate the factors influencing glacier velocity evolution, including changes in surface elevation, glacier morphology and extent, and assess whether glacier velocity is linked to a single climatic factor or a combination of interacting factors.
The Zanskar Basin is a high-altitude, cold desert in the Ladakh region of the Western Himalayas (Fig. 1). The region can be generally classified as a cold-arid climate, as it is in the dry trans-Himalayan region, where the penetration of the Indian Summer Monsoon is very weak. The majority of the precipitation occurs during winter in the form of snowfall (Kamp et al., 2011; Lee et al., 2014).
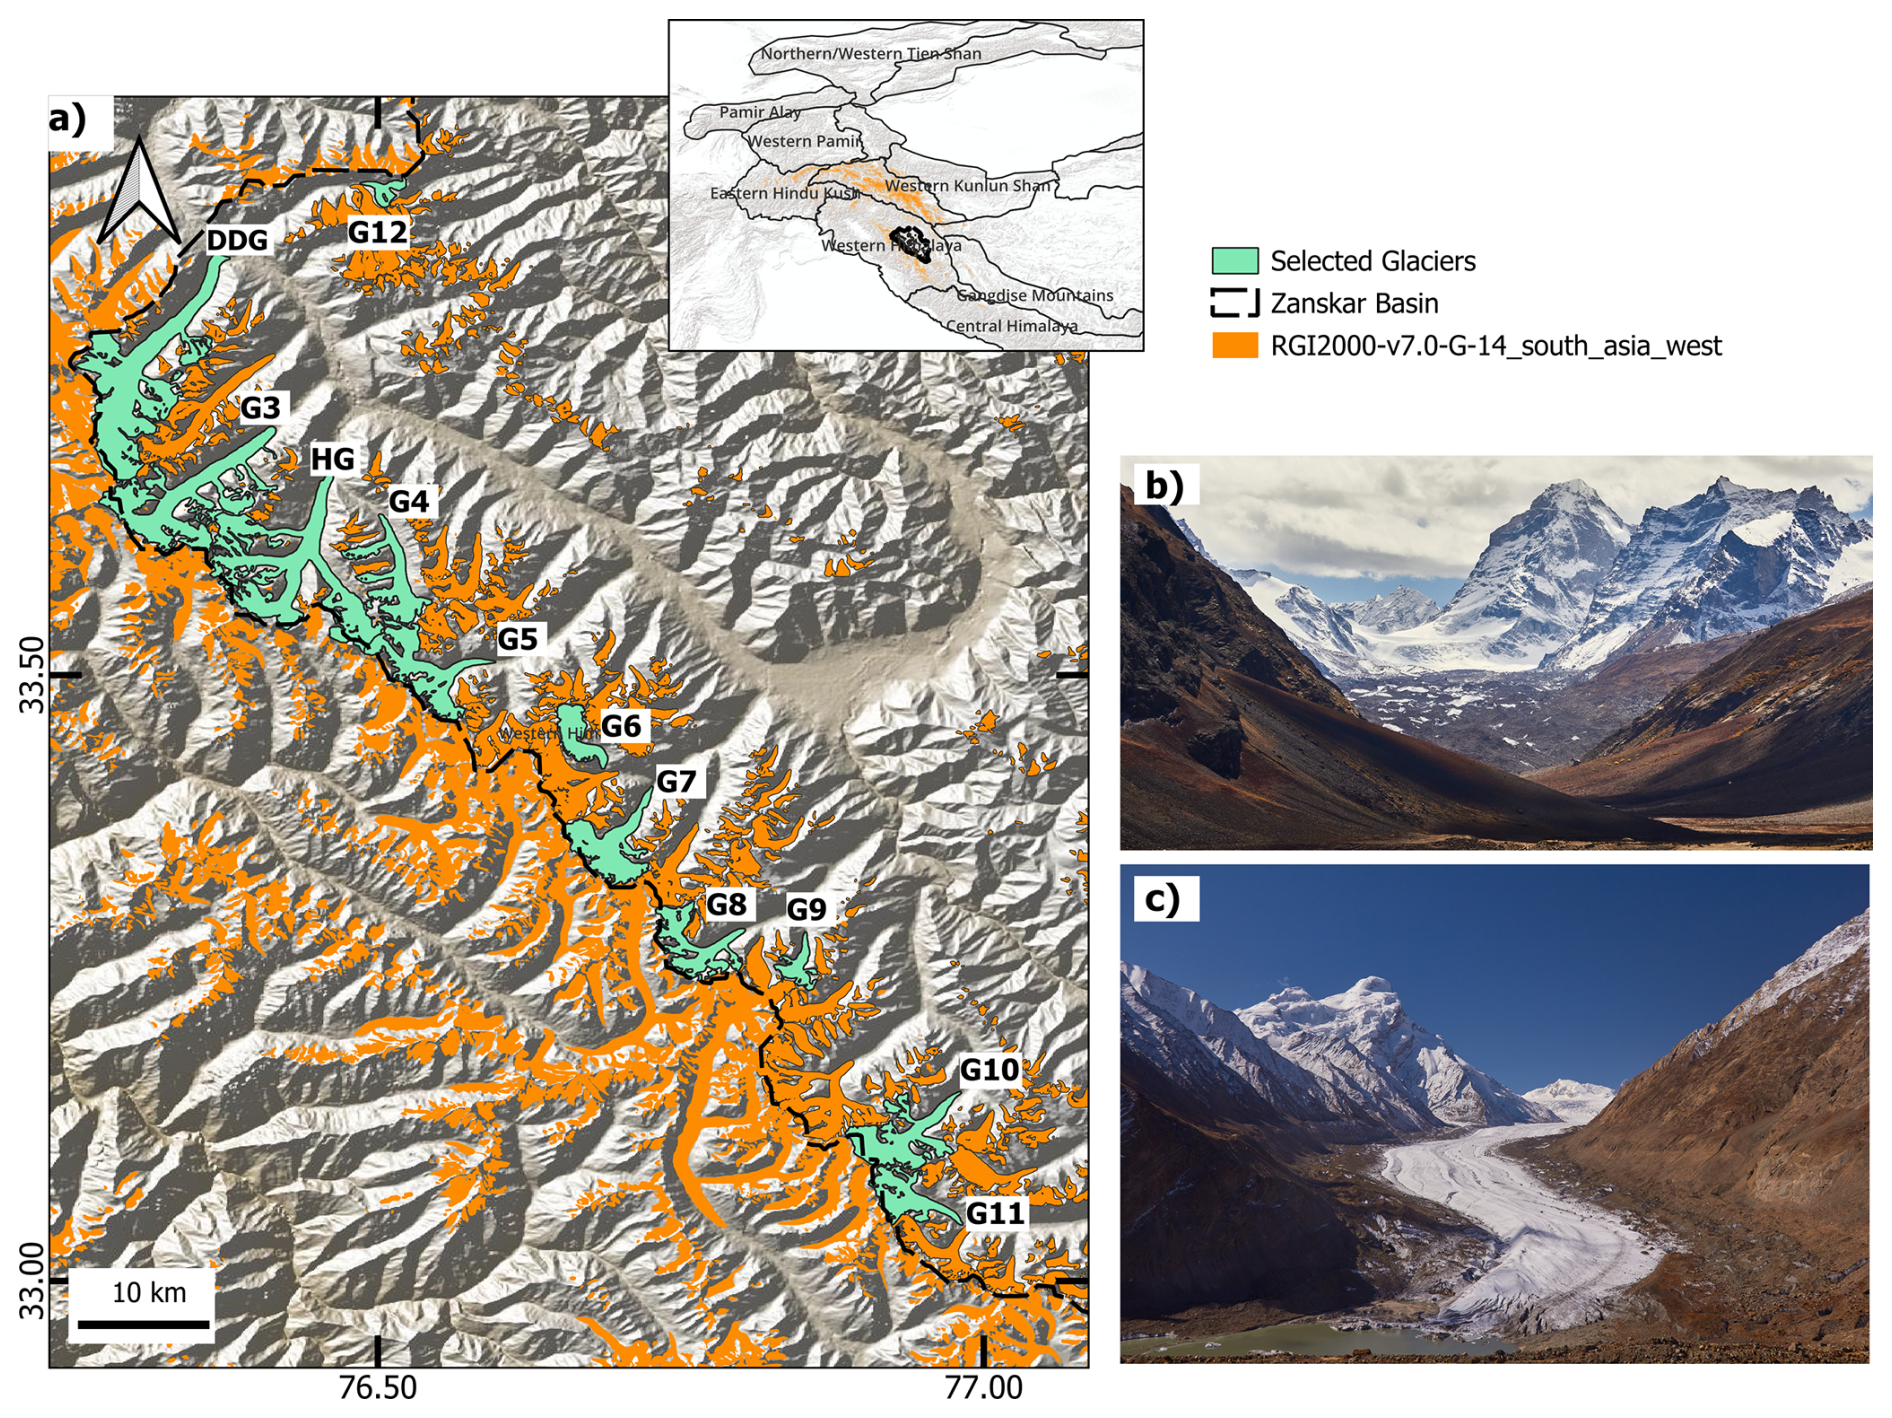
Figure 1(a) Study area map of Zanskar Basin in the Ladakh Himalaya (black dashed lines showing the boundary), highlighting the glaciers selected for this study (in green) labelled as DDG (Drang Drung Glacier), HG (Hagshu Glacier) and other unnamed glaciers as G3–G12. Neighbouring glaciers around the region are shown in orange and are taken from Randolph Glacier Inventory (RGI) version 7. The inset map shows the sub-regions of High Mountain Asia (HMA) in black outline. (b) shows the field photo of Hagshu Glacier, and (c) shows the field photo of Drang Drung Glacier taken during October 2023.
The glacierised area within the basin is approximately ∼ 1700 km2, comprising around ∼ 1755 glaciers (Randolph Glacier Inventory V7; RGI v7.0; (RGI Consortium, 2023). Most of the glaciers in this basin are small cirque glaciers (< 0.75 km2), although several valley-type glaciers with larger areas are also present (RGI Consortium, 2023). As a significant sub-basin of the Indus River system, the Zanskar Basin plays an important role in regional water resources and is therefore a key site for understanding the impacts of climate change on future Himalayan water availability. For example, one of the major rivers in this basin is the Doda River, which originates from the Drang Drung Glacier and flows into the Zanskar River, a major tributary of the Indus River.
In this study, we have selected 12 glaciers to study the evolution of inter-annual glacier surface velocity and surface elevation change. We selected the glaciers to capture morphological and glaciological diversity in the region based on their size, elevation, degree of debris cover, terminus type, orientation, and slope. From small mountain glaciers (G12; 3 km2) to large valley glaciers (DDG; 68 km2) and a mean elevation ranging from 4800 to 5400 m (Table 1). The glaciers are given unique IDs based on their known name (DDG- Drang Drung Glacier, HG- Hagshu Glacier); the remainder are denoted G3 to G12 (shown in Fig. 1). Refer to Table 1 for further details.
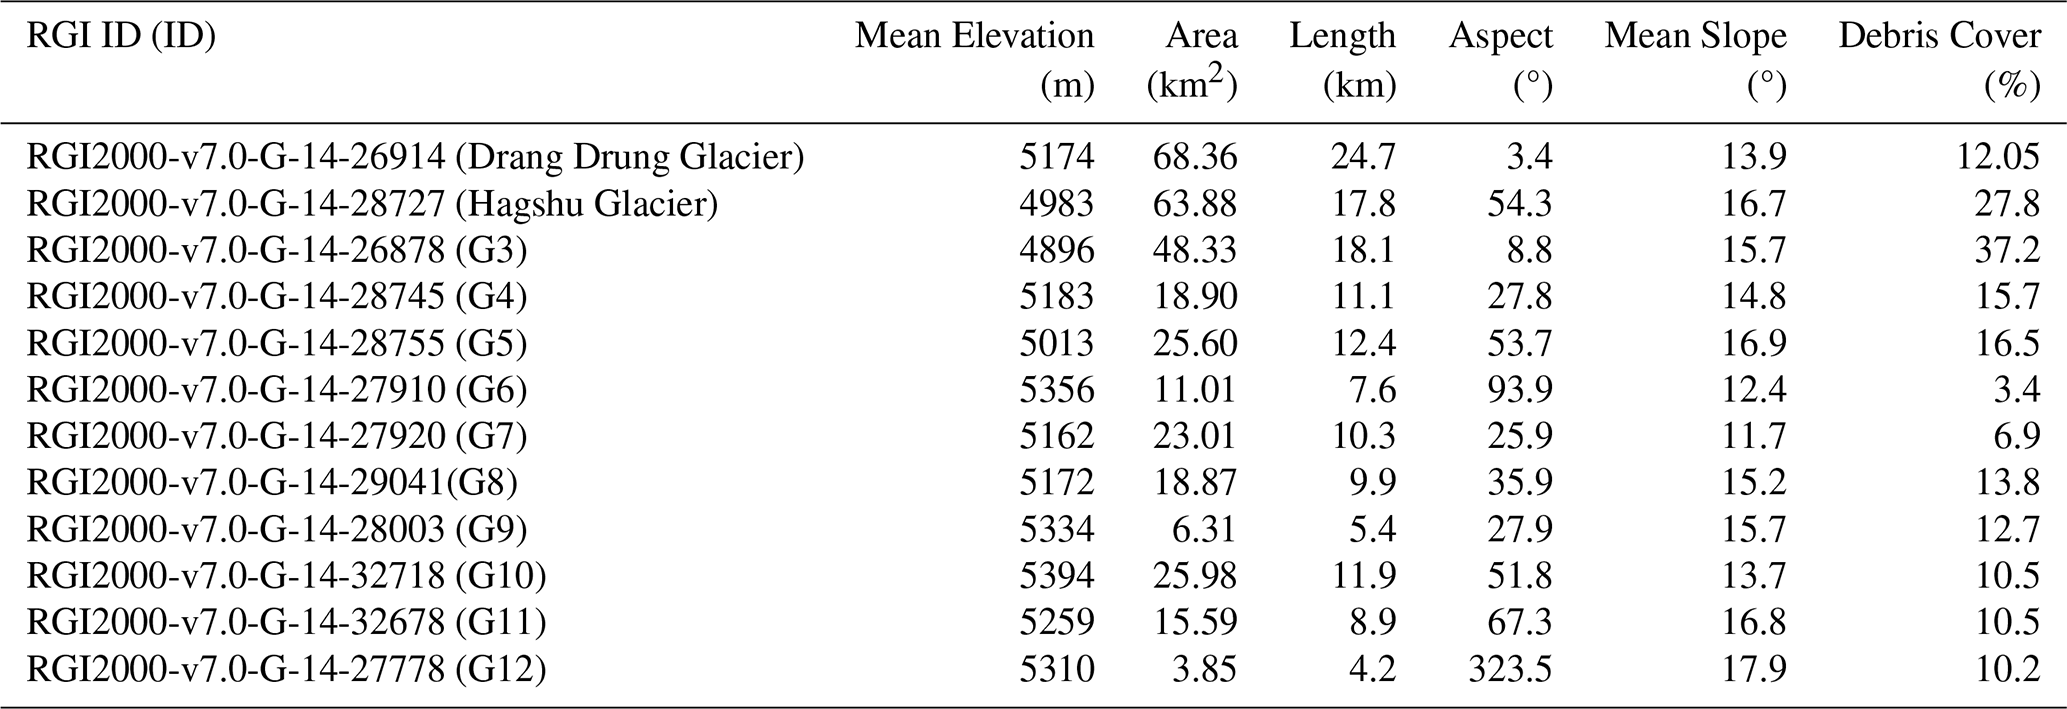
Table 1Characteristics of the 12 selected glaciers in our region. We detail the: mean elevation (m), area (km2), length of the glacier (km), mean aspect (°), mean slope (°) and whether the glacier is debris covered or not. The debris cover percentage presented here is estimated from the Supraglacial debris cover dataset v1.0 (Scherler et al., 2018a), based on linear spectral unmixing-derived fractional debris cover (FDC). All the information is from RGI v7.
3.1 Satellite Data
We selected satellite images from the Landsat series of sensors to generate annual velocity fields from 1992 to 2023, downloaded from the United States Geological Survey (USGS) EarthExplorer: https://earthexplorer.usgs.gov/ (last access: 25 February 2025). In this study, we used the panchromatic band (B8) of the Landsat series 7 Enhanced Thematic Mapper Plus (ETM+), Landsat 8 and 9 Operational Land Imager (OLI) and the Green (B2) band from Landsat 5 Thematic Mapper (TM), which is closest to the wavelength range of the panchromatic band. Previously, various studies have used Landsat images for velocity field estimation (Altena et al., 2019; Bhambri et al., 2023; Dehecq et al., 2015; Garg et al., 2025; Nanni et al., 2023). 24 pairs of satellite images for inter-annual velocity (Supplement Table S1) from Landsat 5, 7, 8 and 9 were manually selected based on the quality of the image available (minimum cloud cover with a 20 % threshold, minimum snow cover over glaciers) to reduce noise in the results. Satellite images were selected mostly in the months of September and October, as the end of the melting season (the melt season is generally from May–September) is typically followed by minimal snow cover and less cloud cover fraction and is a consistent season that satisfies the image quality conditions mentioned above. The presence of heterogeneous snow cover over two images may reduce or enhance the textural features and induce a mismatch in the correlation algorithm, leading to erroneous results. A previous study reported the horizontal accuracy of the Landsat sensors to be < 6 m (Tucker et al., 2004), which is within the expected range of observation uncertainty; i.e., uncertainty associated with glacier surface features introduces errors at or above the observational horizontal accuracy (Bhattacharya et al., 2016).
3.2 Glacier Velocity Estimation
3.2.1 Image Correlation
We used a pairwise image correlation algorithm to generate all the annual velocity fields from the satellite images. Horizontal displacement between a pair of images was estimated using ENVI's plugin software package COSI-Corr (freely available at http://www.tectonics.caltech.edu/slip_history/spot_coseis/, last access: 24 October 2024) (Leprince et al., 2007b). This software utilises a cross-correlation feature tracking algorithm in the frequency domain. The algorithm performs sub-pixel correlation of remote sensing datasets to capture all kinds of displacement on the Earth's surface (Leprince et al., 2007a). The phase correlation in the frequency domain was used to estimate the relative shift between the time gaps in the image pairs. Selecting an appropriate window size for feature tracking is often challenging, as it involves balancing noise suppression with spatial details. After multiple iterations and careful visual inspection of the results- particularly assessing the presence of noise, we determined that using an initial window size of 64×64 pixels and a final window of 32×32 pixels provided the most reliable outcomes, which was also found to be used by previous studies (Kraaijenbrink et al., 2016; Nanni et al., 2023; Bhushan et al., 2018). A larger initial search window is used to find a rough match between the pixel displacement with less noise and finally refined with a smaller window size. A step size (refers to the spatial resolution or the distance between the centres of the image patches) of 4×4 pixels for all except for Landsat 5 (30 m spatial resolution), where a 2×2 pixel step size was set, resulting in a resultant output of 60 m spatial resolution velocity fields. Step sizes smaller than the search window size may introduce redundancy in measurement (Leprince et al., 2007a, b), thereby improving the accuracy of the velocity estimates compared to steps that are of a similar magnitude to the search window (Fahnestock et al., 2016). The outputs from the COSI-Corr algorithm consist of 3 images: N–S (North–South) displacement component, E–W (East–West) displacement component and SNR (Signal to Noise ratio), which assesses the quality of correlation for each pixel (Leprince et al., 2007a).
3.2.2 Filtering Process
To minimize the effect of noise, which impacts the accuracy of the correlation outputs, we applied basic filtering to the N–S and E–W surface displacement components. To remove unwanted correlation results, a threshold of 0.9 was set for the Signal-to-Noise (SNR) ratio (Scherler et al., 2008). The Robustness iteration, which is a quality control loop that ensures the derived displacement or velocity vectors are consistent and robust against errors or noise, was set to 4. First, an initial displacement is calculated from image matching, followed by outlier removal. This process is repeated for the number of iterations defined. 2–4 iterations were found to be working well in most cases of glacier velocity estimation (Leprince et al., 2007a). As the three outputs are generated (N–S, E–W displacement and SNR) we used a replace/discard tool in the COSI-Corr algorithm, which removes unwanted pixel values if the velocities defined at these pixels exceeds a threshold. Here, a value of 200 m was set based on existing literature and the maximum glacier velocity in the Western Himalayan region, which is estimated to be approximately ranging from ∼ 50–90 m yr−1, with a few exceptions in our case (Bhushan et al., 2018).
Finally, the resultant displacement was calculated using Eq. (1), based on the N–S and E–W velocity components for each image pair, and the final velocity was evaluated using Eq. (2).
Here, Dxy is the horizontal resultant displacement (meters), V is the final surface velocity (m yr−1), and t is the time (years) between the two image acquisitions.
The final velocity maps are produced at 60 m resolution. The same parameter values were maintained throughout all the image pair processing to ensure the velocity outputs are consistent. Finally, we used a 3-pixel × 3-pixels median filter on the velocity maps to remove any outliers (noise) within the maps and to smooth the velocity outputs with an acceptable loss of details. Due to poor correlation in some of the pair-wise correlation processes, data gaps exist in the velocity outputs from 2003–2007 and 2011–2012.
3.2.3 Uncertainty Estimation
The uncertainty in the velocity field obtained from remote sensing could be influenced by several factors, including satellite scene characteristics (e.g., cloud cover over the region of interest, shadow, etc.), surface heterogeneity (difference in snow cover), image co-registration error, and performance of the feature-tracking algorithm. To minimise the error due to the first two factors, we selected images with a minimal cloud cover fraction < 20 %, and snow cover over the glacier surface by manually checking the scenes (September–October). Due to a lack of in situ data, it was not possible to validate our results with GNSS measurements.
Ideally, the ice-free ground (off-glacier) should have a zero vertical or horizontal displacement, which is an indicator of no errors produced in the processing. However, we observed that due to limitations in the algorithm, these ice-free areas exhibited certain displacements. For example, it may arise due to a change in surface characteristics between the two images, such as snow cover change, varying sun angles and shadows, and also due to a horizontal shift in the two images. Hence, we used the displacement in ice-free areas as a measure of uncertainty in our processing. The uncertainty was estimated based on the following method (Koblet et al., 2010; Zhang et al., 2020).
Here, σoff is the uncertainty in the velocity (m yr−1), which is the mean of the velocity of pixels extracted from the off-glacier area, where Noff= 100 is the number of off-glacier pixel measurements. SE is the Standard Error of the mean velocity taken across the off-glacier points (m yr−1), and SD is the standard deviation (m yr−1). This method was applied to all the velocity datasets generated. The uncertainties range from 0.85 to 5.49 m yr−1, which are of similar magnitude to previous studies (Bhushan et al., 2018; Das and Sharma, 2021; Shukla and Garg, 2020). All the pair-wise uncertainty is listed under Table S2. To show the reliability of the data generated, we compared it with the ITS_LIVE velocity dataset, as shown in Fig. S2 in the Supplement.
3.3 Glacier Surface Elevation Change
We utilised the open-access available global glacier elevation change datasets from Hugonnet et al. (2021b; accessed from https://doi.org/10.6096/13). The dataset is available for the period of 2000 and 2019, with the mean glacier surface elevation change rate data generated using ASTER (Advanced Spaceborne Thermal Emission and Reflection Radiometer) stereo pairs calculated across four different timeframes: 2000–2005, 2005–2010, 2010–2015 and 2015–2019, at a spatial resolution of 100 m.
We analyzed the glacier surface elevation change rate dataset using a widely used method of binning the data into multiple elevation bins (dh = 50 m). Bin-wise elevation change analysis is an effective approach for capturing the spatial heterogeneity of glacier responses to climate forcing, revealing how processes operating at different elevations shape overall surface elevation change and dynamics. Aggregating the data into elevation bins acts as a form of suppressing spatial noise while preserving the dominant elevation-dependent signals for better interpretations. Bin-wise analysis reveals where the most pronounced thinning or thickening occurs, often highlighting elevation-dependent feedback in melt, accumulation, and ice flow. For example, as surface elevation lowers and ice thins, the gravitational driving force decreases, leading to a progressive slowdown of ice flow (Cuffey and Paterson, 2010). However, there could be some exceptions, for example, differential surface thinning rate, leading to increased surface slope, may increase the driving stress or some complex feedback mechanisms from proglacial lake-ice interaction. Mathematically, the driving stress τ(x) is expressed as,
In this equation, τ(x) is the driving stress, ρ is the density of ice, g is the acceleration due to gravity, H(x) is ice thickness, and S(x) refers to the ice surface at position x and represents the surface slope of the glacier at position x along a given flow line.
By contrast, sliding at the bed of the glacier can also play a significant role in ice flow, but sliding is poorly constrained due to a lack of observations. It depends on bed roughness, thermal regime of the glacier and subglacial hydrology (Bindschadler, 1983; Weertman, 1957).
3.4 Data analysis and supporting datasets
The central flowlines of the glaciers were manually delineated from high-resolution satellite data for the analysis of velocity profiles. For all other analyses, including glacier elevation changes vs glacier velocity, the datasets were resampled to the spatial resolution of elevation change data (100 m), and a reference DEM (Digital Elevation Model) was used to make all the elevation-wise analyses, such as binning the data into different elevation zones. Additionally, we used the Hypsometric Index to calculate and classify the glaciers as very bottom-heavy (HI > 1.5), bottom-heavy geometries (1.2 < HI ≤ 1.5), very top-heavy (HI < −1.5), top-heavy (−1.5 < HI < −1.2), and equidimensional glaciers (−1.2 < HI < 1.2) following Jiskoot et al. (2009). While top-heavy glaciers concentrate their mass at higher elevations within expansive accumulation zones, bottom-heavy glaciers feature a disproportionately large area at lower elevations. The glacier boundary from RGI Version 7 (Randolph Glacier Inventory V7) was used for the glacier extents and for calculating all the geospatial statistics. A T-statistic test that compares the means of two groups while considering how much the data “spreads” (variance) was used to calculate the p-value in our data analysis (Kim, 2015). The p-value, derived from this statistic, represents the probability of observing results as extreme as the sample, assuming the null hypothesis. A p-value below 0.05 generally indicates statistically significant results (rejecting the null hypothesis).
For analysing the climate trend (temperature and precipitation) of the region, we utilised the ERA5-Land Reanalysis climate dataset. ERA5-Land has a spatial resolution of ∼ 9 km, and temporally it provides an hourly dataset from 1950 to the present (Copernicus Climate Change Service, 2019). Data from the nearest grid to the study location were extracted for further analysis. The uncertainty was estimated based on the 1σ (standard deviation) of the data.
4.1 Glacier Velocity Trends
We analysed interannual glacier surface velocity changes across 12 glaciers using the satellite-derived datasets described in section 3, with some data gaps. A spatial map of glacier velocity for the year 2020–2021 is shown in Fig. 2. Overall, the glacier flow speeds were generally greater in larger glaciers than in smaller ones. We observed a typical velocity distribution, where ice flow increased from the margins toward the centreline and decreased from the accumulation area towards the terminus. In addition, all glaciers demonstrated a very similar pattern of low glacier velocity near the terminus (∼ < 15 m yr−1). In general, the velocity gradually increased with the surface slope, at times by as much as 50 % around sudden changes in slope, also coincident with crevassing.
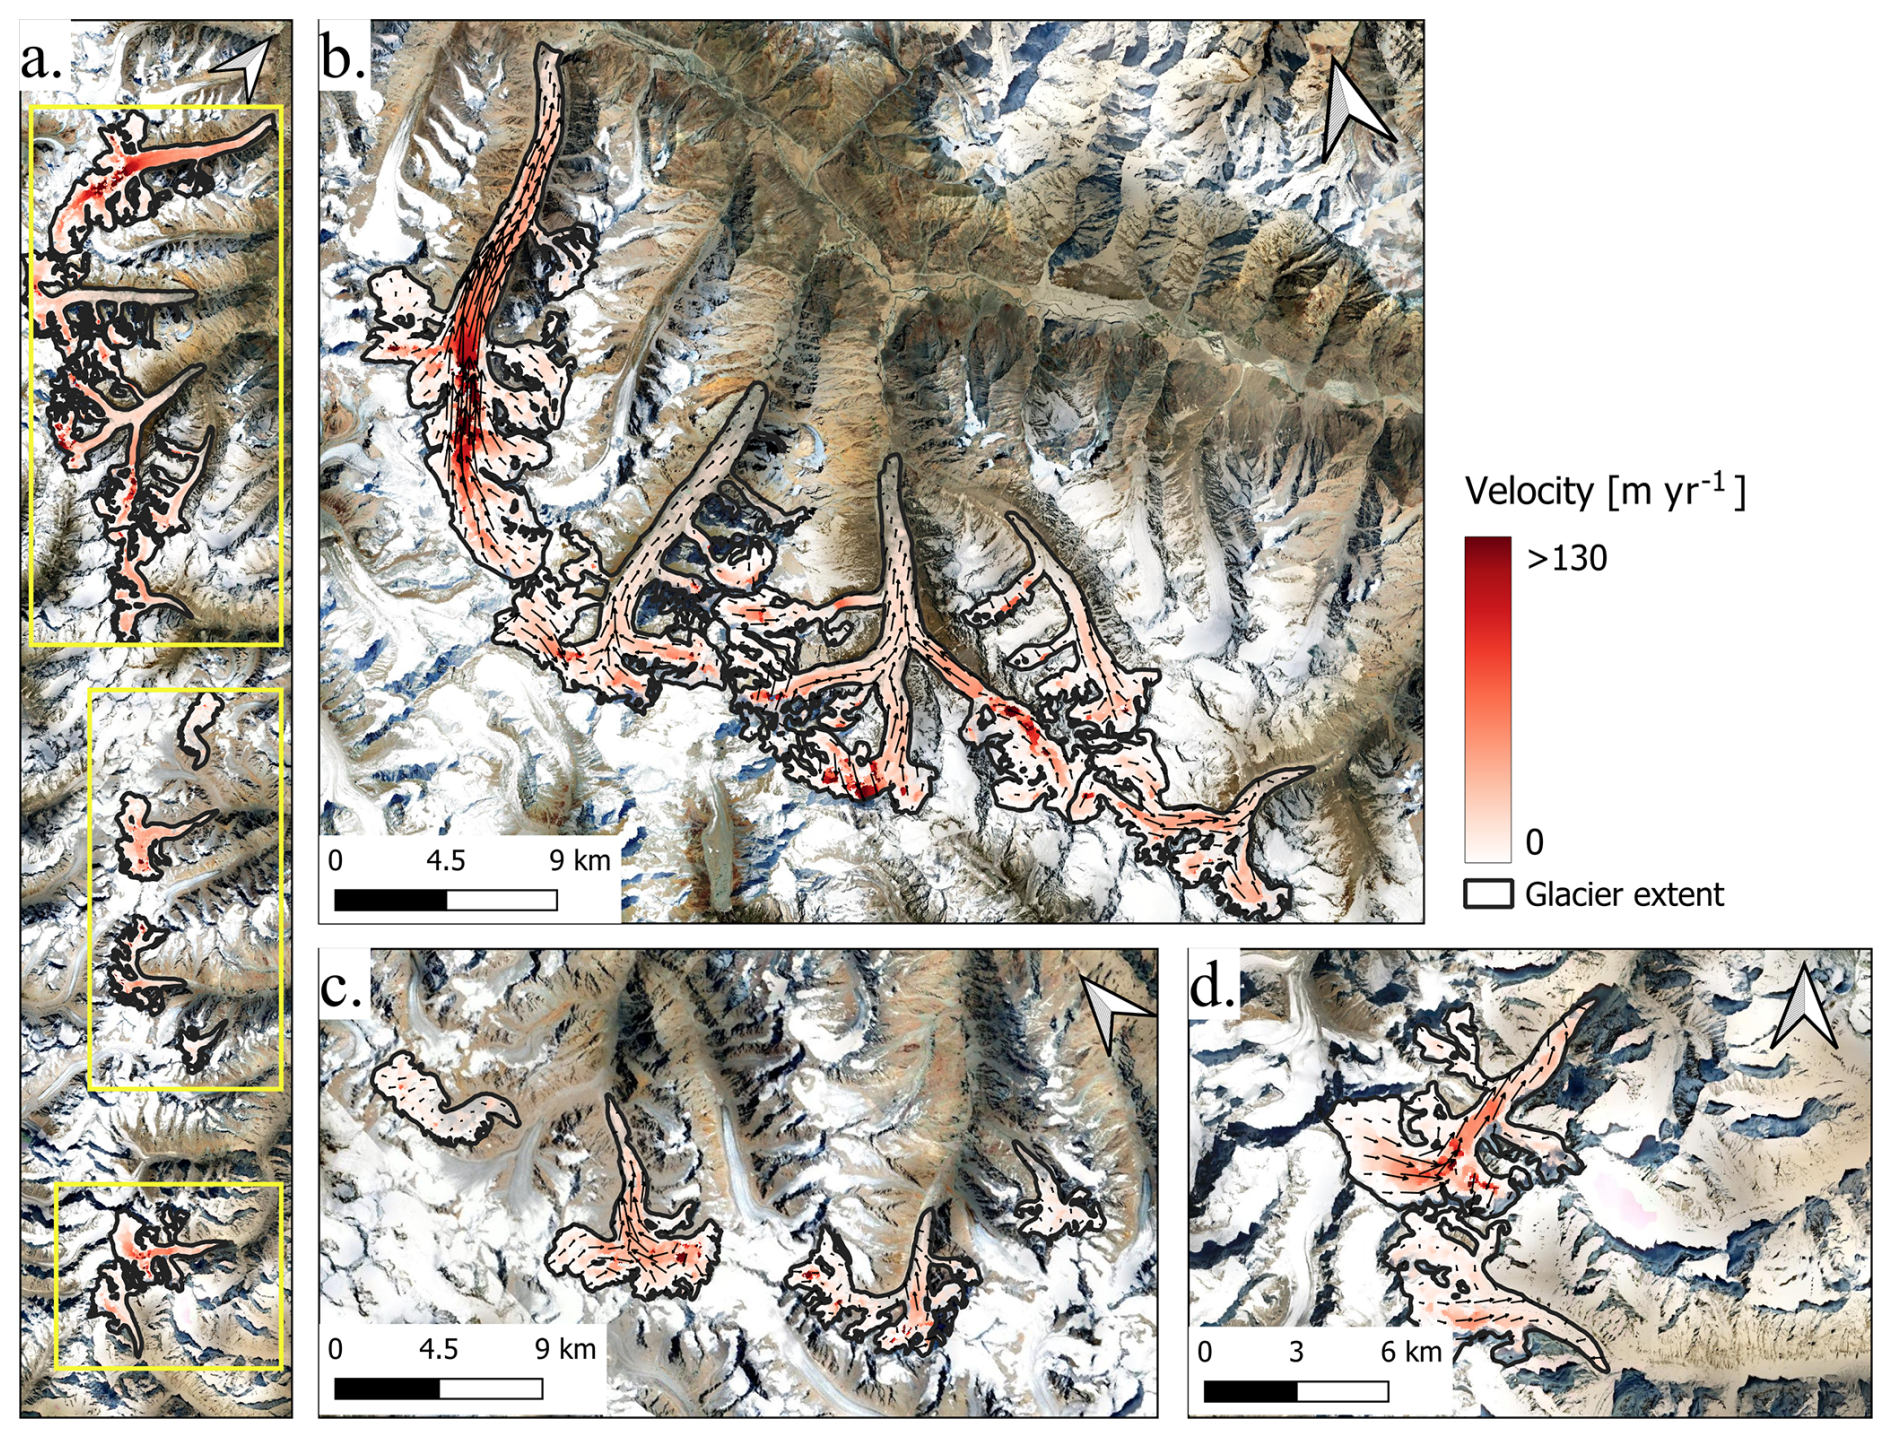
Figure 2Glacier velocity in m yr−1 from 2020–2021 for the selected glaciers (with extents outlined in black), subdivided into three different groups. The left vertical panel (a) shows all the glaciers investigated with insets on the right outlined by yellow boxes; (b) velocity for glaciers DDG, HG, G3, G4 and G5; (c) velocity for glaciers G6, G7 and G8; (d) velocity for glaciers G10 and G11.
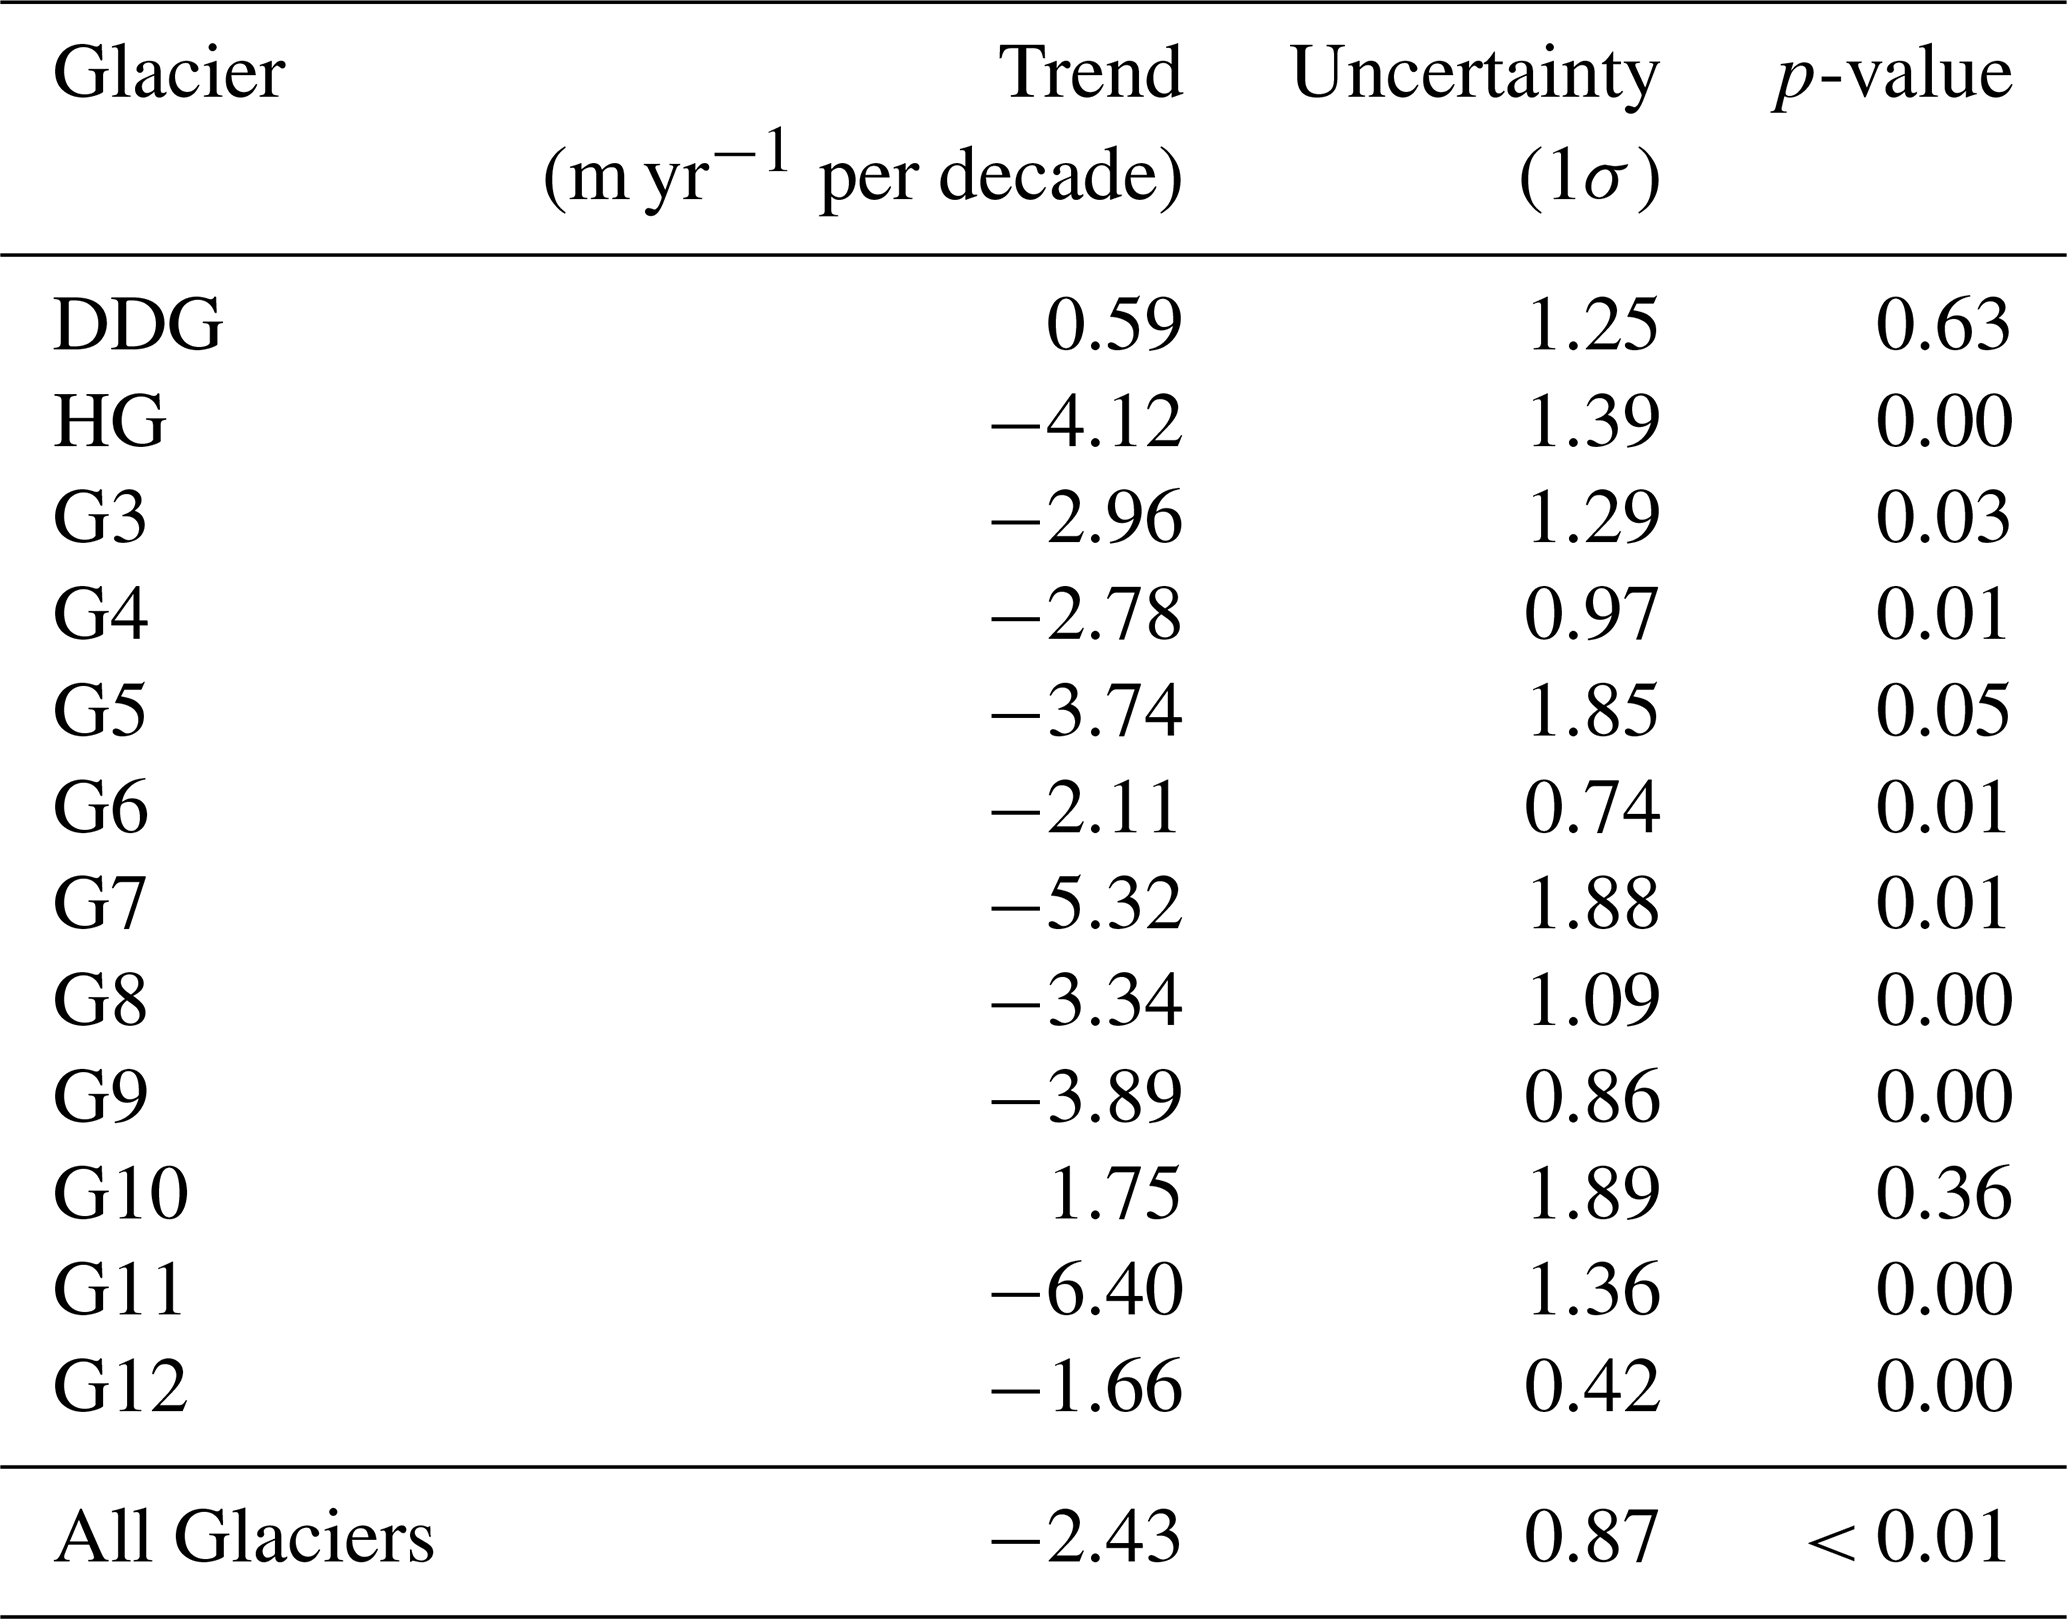
The results reveal temporal and spatial heterogeneities in ice flow. That is, while some glaciers exhibited a marked deceleration over time, others maintained a relatively constant velocity or showed inter-annual accelerations during specific periods. Despite interannual velocity variations, the mean flow speed over the central flowline across all the glaciers varied from 31.1±8.5 m yr−1 in 1992 to 26.2±1.0 m yr−1 in 2023 (∼ −16 %), with a minimum mean velocity of 24.5±5.7 m yr−1 during 2010, and a maximum of 46±5.1 m yr−1 from 2000 and 2002. The overall region-wide analysis for all the selected glaciers showed a statistically significant decrease in mean glacier flow speed over the study period (p < 0.01, estimated using the t-statistic test; Kim, 2015), at a rate of −2.43 m yr−1 per decade (Fig. 3). The fastest flowing glacier is the Drang Drung Glacier (DDG) with a mean velocity of ∼ 57.9 m yr−1 along the flowline during 1992 and 2023, followed by G10 with a mean velocity of 38.5 m yr−1. Interestingly, both glaciers are lake-terminating (discussed more in Sect. 5.3). By contrast, the slowest-flowing glacier is G12 with a mean velocity of ∼ 9.6 m yr−1, which could be related to the glacier geometry and ice thickness.
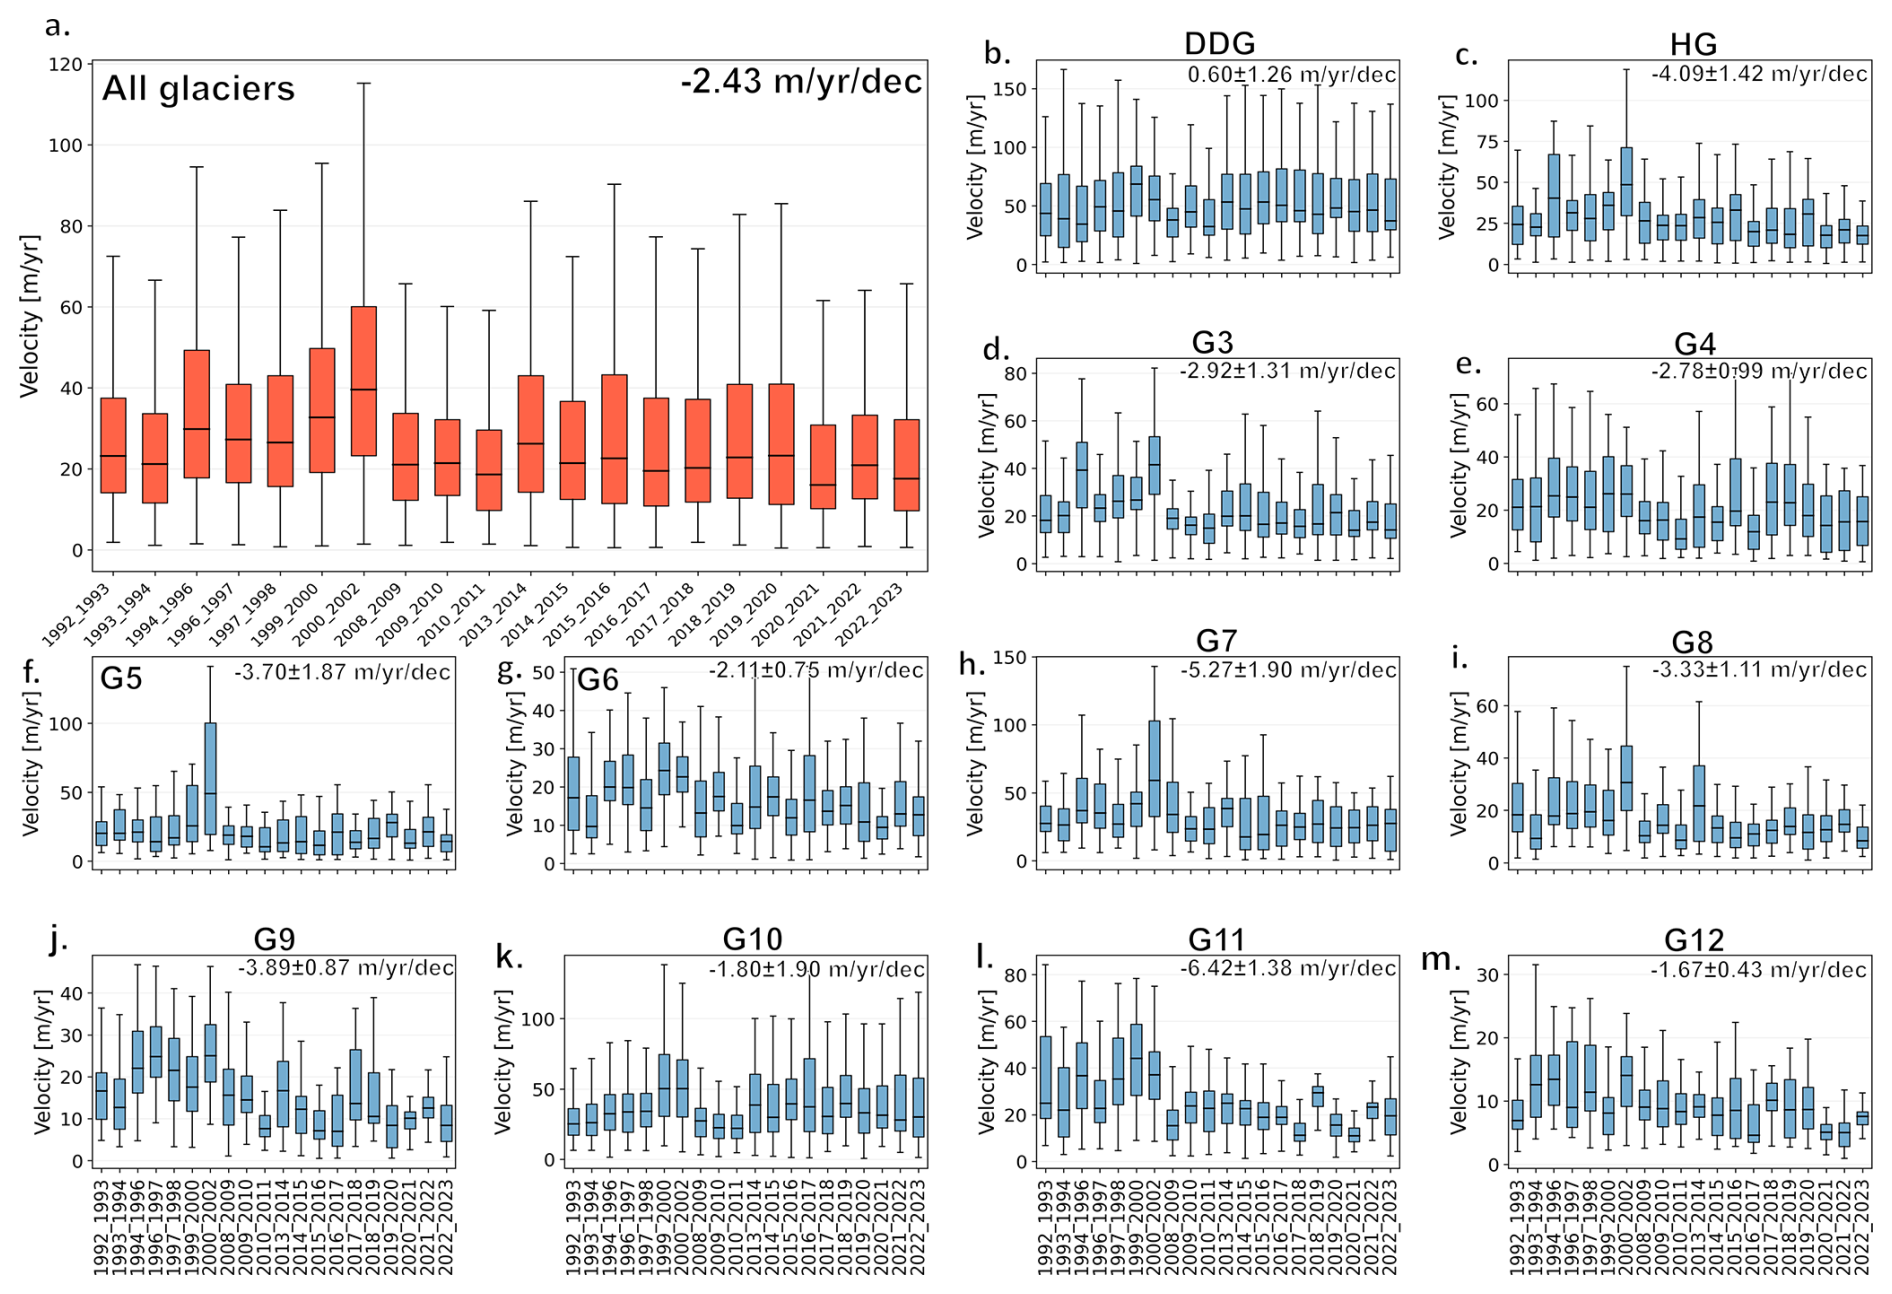
Figure 3a) Mean velocity (m yr−1) for all the glaciers. (b–m) Mean velocities (m yr−1) for individual glaciers from DDG to G12. Each panel shows the interquartile range (shaded orange and blue box) with the median denoted by the black horizontal line, lines and whiskers denote the maximum value (upper) and minimum value (lower), excluding the outliers. The trend is reported in the upper right corner of each panel (which considers the data gap).
Although the overall regional slowdown in glacier velocity is statistically significant, not all individual glaciers exhibit significant trends. In particular, DDG, G5, and G10 show statistically non-significant velocity trends (Fig. 3).
We considered three decades from our study period (1992–2000, 2001–2010, 2011–2023) to understand decadal flow pattern changes. Despite the data gaps between 2001 and 2010, we can discern a broad understanding of changes in the flow trend over this 31-year period. From 1992 to 2000, all glaciers exhibited an increase in velocity. In contrast, from 2001 to 2010 and 2011 to 2023, the glaciers generally show reduced flow speeds. To analyze the relationship between ice velocity trend and elevation, we categorized the glaciers into two elevational zones based on the regional mean elevation: a lower-elevation zone (< 5000 m) and an upper-elevation zone (> 5000 m). It is important to note that this 5000 m threshold was chosen to represent the average elevational distribution of the glaciers in our study area and is not intended to represent the Equilibrium Line Altitude (ELA). The mean velocities within both elevation groups showed a declining trend at rates of −4.6 and −1.7 m yr−1 per decade, respectively. This suggests the glacier velocity declined faster near the lower elevation zone (< 5000 m) compared to the higher elevation zone (Fig. 4), which is consistent with other studies (Wu et al., 2020).
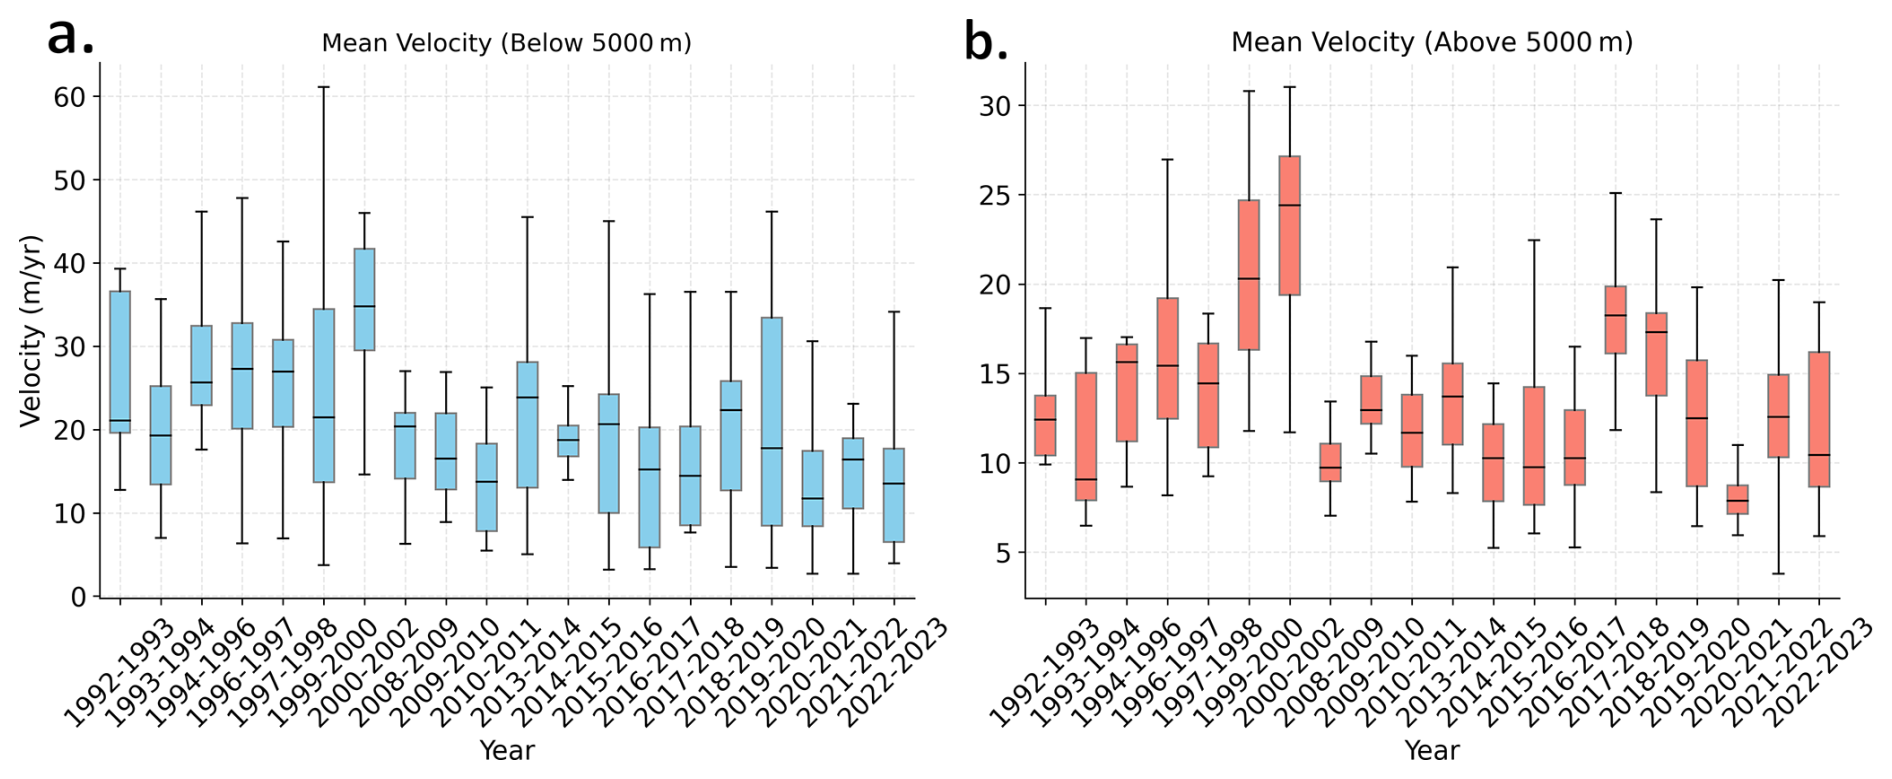
Figure 4Box plots for the mean velocity (m yr−1) for the region of glaciers with elevation (a) below 5000 m; and (b) above 5000 m. In each panel, the median velocity trend is denoted by the black horizontal line, the interquartile range is shown in the coloured box, and the lines and whiskers denote the maximum value (upper) and minimum value (lower), excluding the outliers. Outliers are not included in the plot.
Velocity profiles along the central flowline are shown in Fig. 5. The patterns correspond with glacier hypsometry. Glaciers like G4, G8, and G11 exhibited a bottom-heavy geometry, while HG and G3 are very bottom-heavy (HI > 1.5), with a larger share of area at lower elevations. Such geometries can enhance driving stress in the ablation zone due to thinning-induced surface steepening and increased ice mass concentrated at lower elevations (Bhushan et al., 2018; Sam et al., 2018).
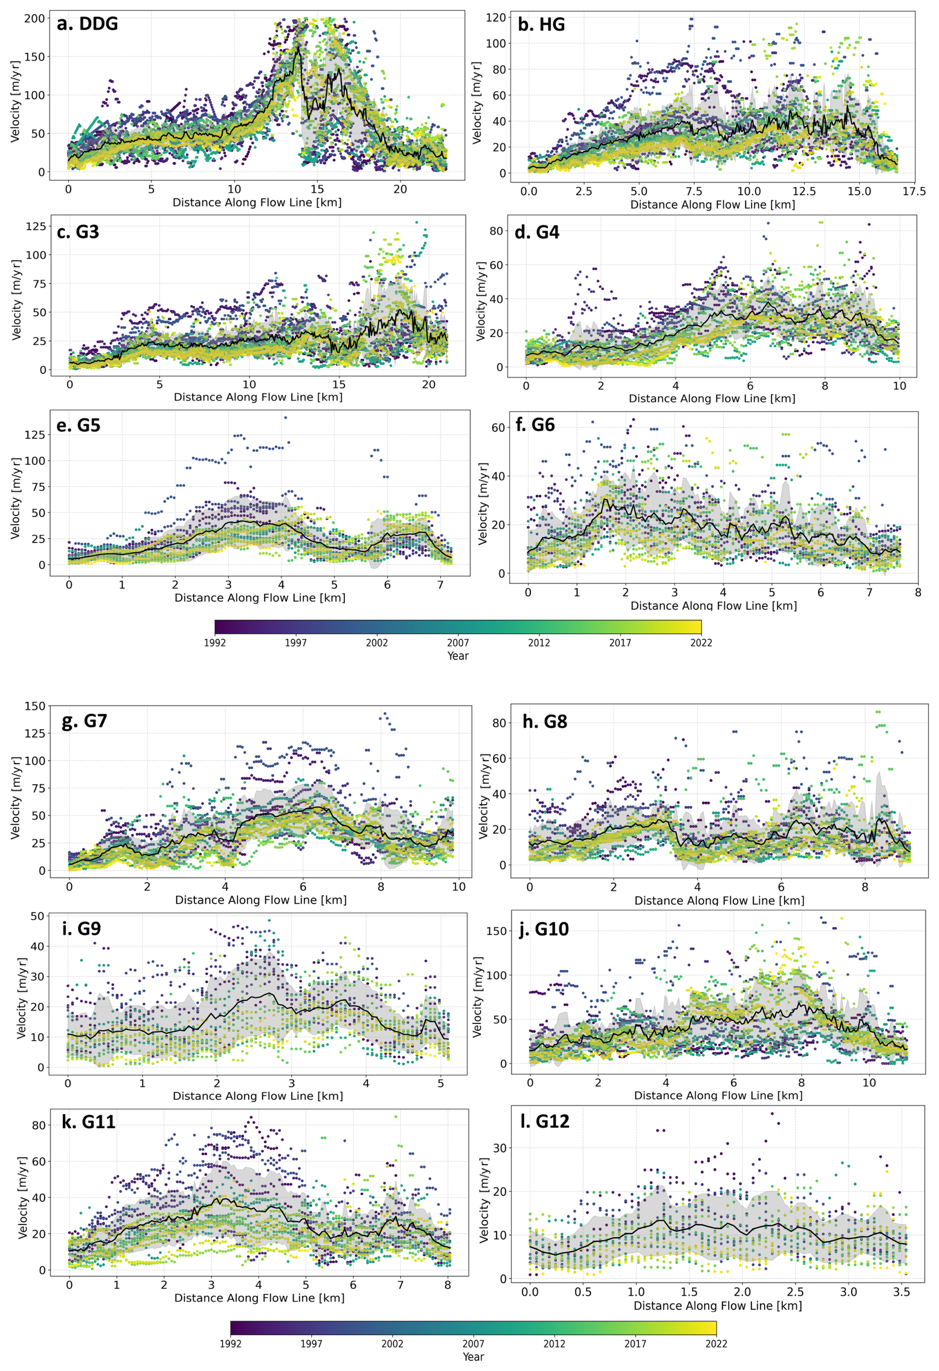
Figure 5(a–l) Scatter plots showing the glacier velocity profile along the central flowline for all the glaciers from 1992–2023. The x-axis represents the distance along the flowline (km) from the start of the terminus (marked by the origin). The different colours represent data points from different years. The black thick line refers to the mean velocity across the time period.
Elevation bin-wise velocity analysis also revealed inter-glacier variability associated with glacier geometry changes and surface elevation lowering. We evaluated elevation bin-wise (bin size = 50 m) velocity evolution across different periods (1999–2000, 2009–2010, 2014–2015 and 2019–2020), finding velocity trends that coincided with specific elevation bands, which sheds light on the underlying dynamics influencing the trends. We found that most glaciers in our study exhibited similar patterns of glacier slowdown across the glacier, with the greatest reductions occurring near the ablation zone (Fig. S3). For instance, in DDG (panel b), the peak velocity during the 2000 and 2005 period exceeds 40 m yr−1, while in the most recent period between 2015 and 2020), velocities have significantly reduced across the entire elevation range. In other cases (e.g., panels c, g, l), the velocity profiles exhibited a marked shift in both the peak magnitude and elevation position, suggesting changes in flow dynamics, which could be potentially driven by mass loss and evolving ice geometry. Some glaciers, such as G9 (panel f) and HG (panel h), exhibited more complex or less consistent trends, possibly reflecting the interplay of local topography, debris cover, and variations in surface elevation change. Several glaciers, such as HG, G4, and G5, showed velocity increases at their lower elevations in 2019–2020.
Table 2Overall mean velocity trend (m yr−1) for individual glaciers over the period 1992–2023. Uncertainty is calculated as one standard deviation (m yr−1) and the p-value denotes a statistically significant trend, as calculated using the t statistic-test.
4.2 Glacier Surface Elevation Change
Glacier surface elevation change revealed a clear altitudinal dependency, with consistent thinning patterns within each elevation bin over the period 2000–2020. Across the 12 glaciers analyzed, thinning generally increased in the lower elevation bins, particularly below ∼ 4700 m, indicating stronger ablation and dynamic thinning towards glacier termini (Fig. 6). This pattern persisted across the period (2000–2020), with the lowest elevation bands consistently exhibiting the greatest thinning rate (dh dt) of ∼ −1.3 m yr−1. While high-elevation regions (> 5000 m) also experienced surface lowering, the rates were relatively lower, likely reflecting reduced melt and less dynamic thinning at those elevations.
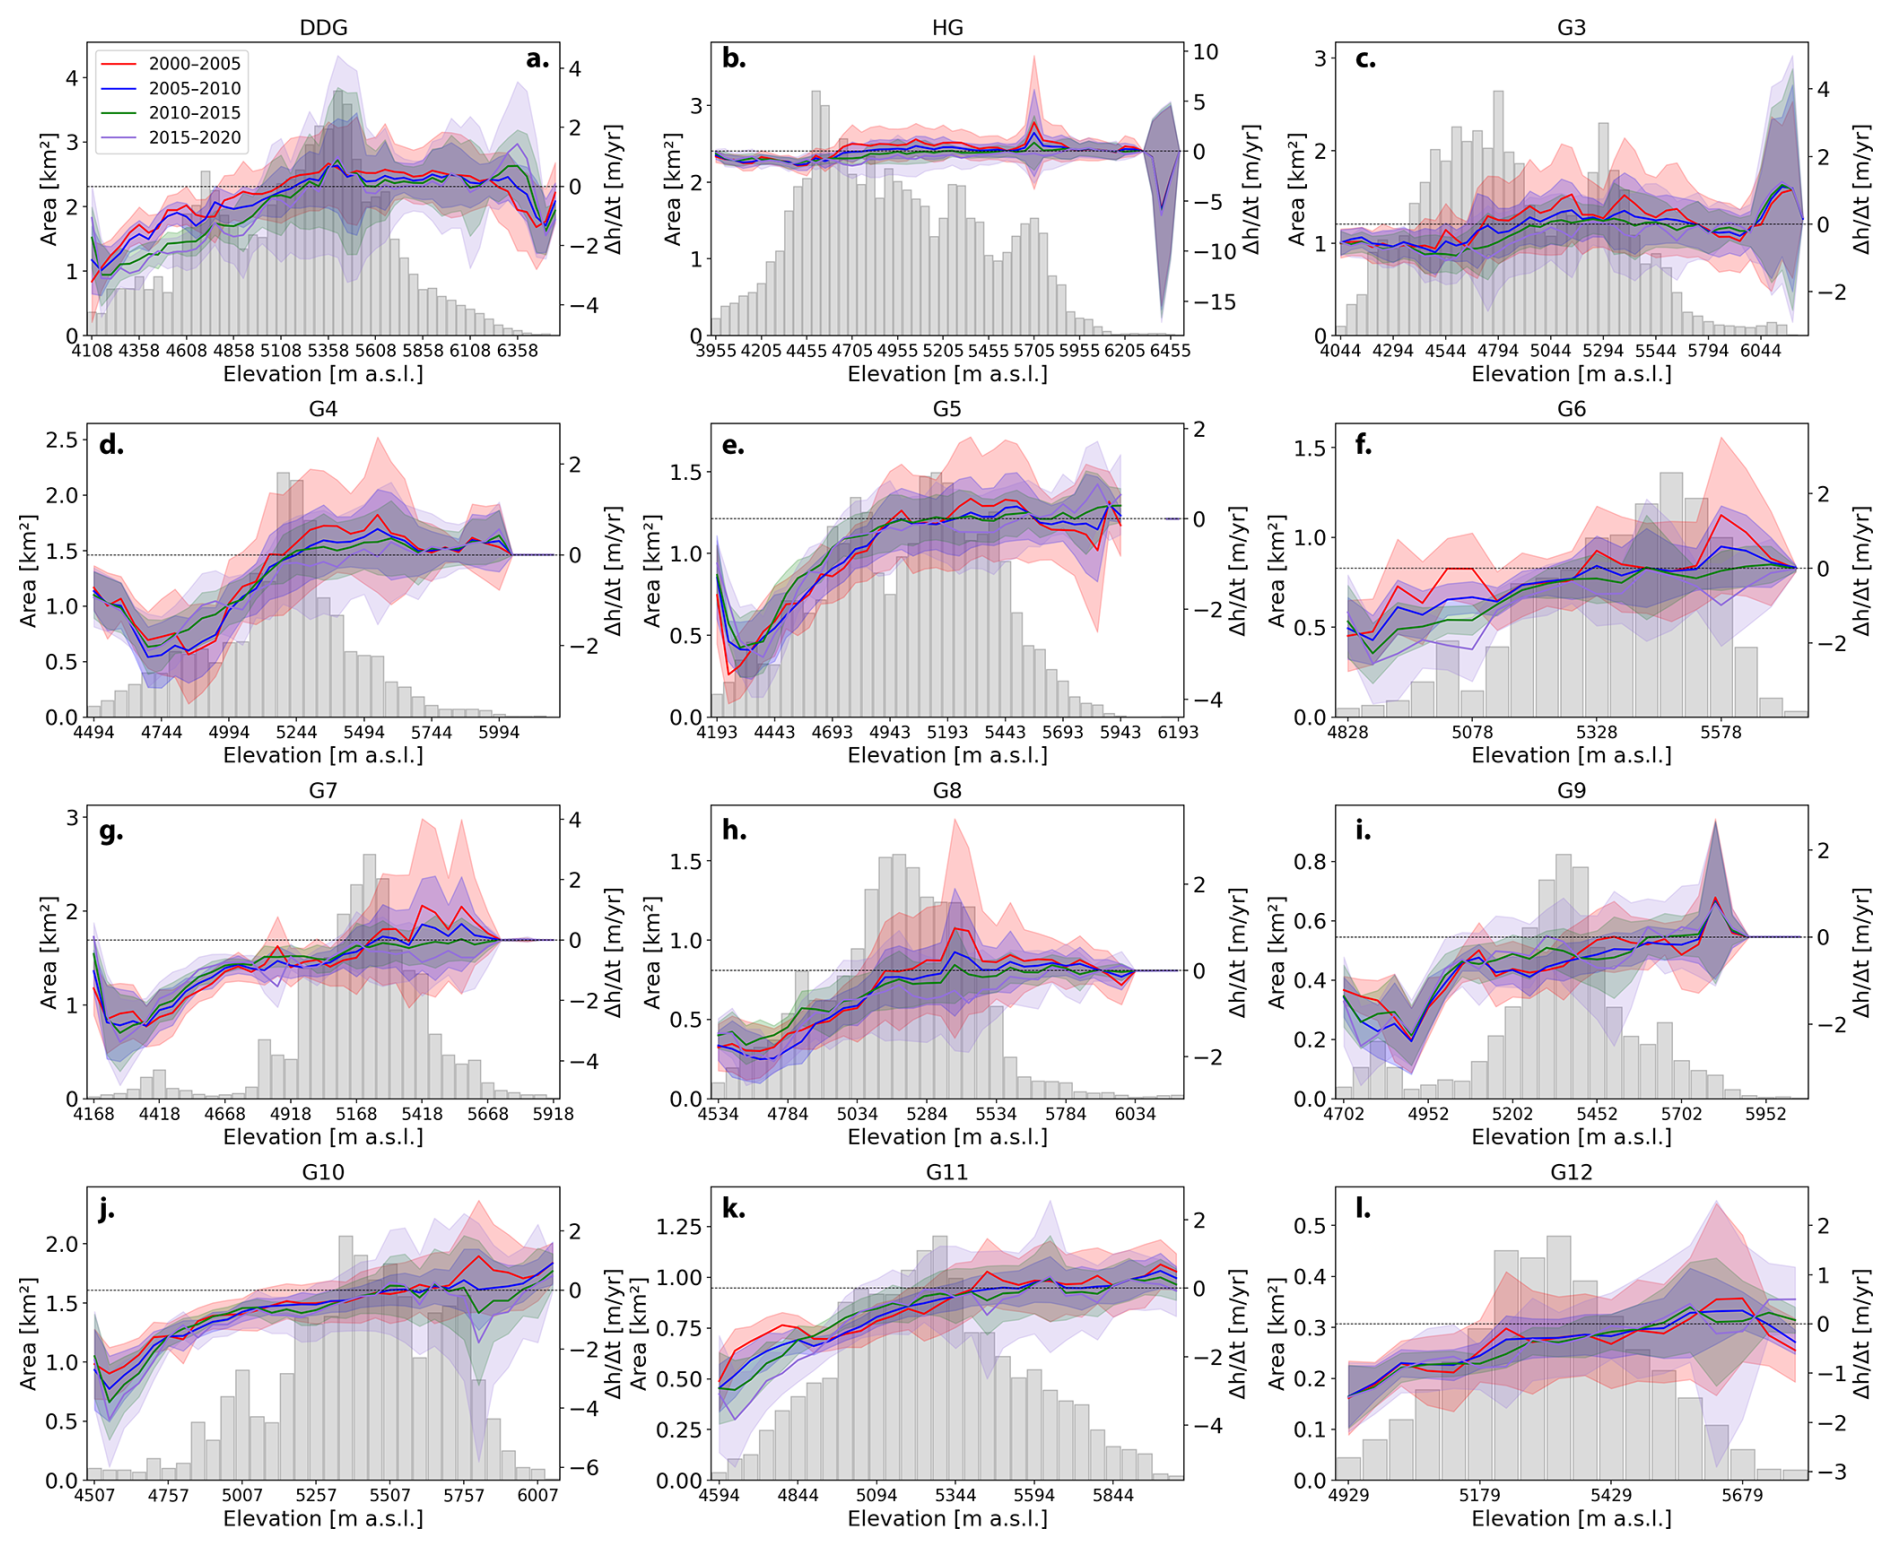
Figure 6(a–l) Glacier hypsometric curve of surface elevation change. The left y-axis shows glacier area (km2), represented as grey histograms and the right y-axis shows the glacier surface elevation change rate, dh dt (m yr−1) from Hugonnet et al. (2021a), data for four different periods, 2000–2005, 2005–2010, and 2015–2019 represented in red, blue, green and purple lines, respectively. The colored bands represent the 1σ (standard deviation).
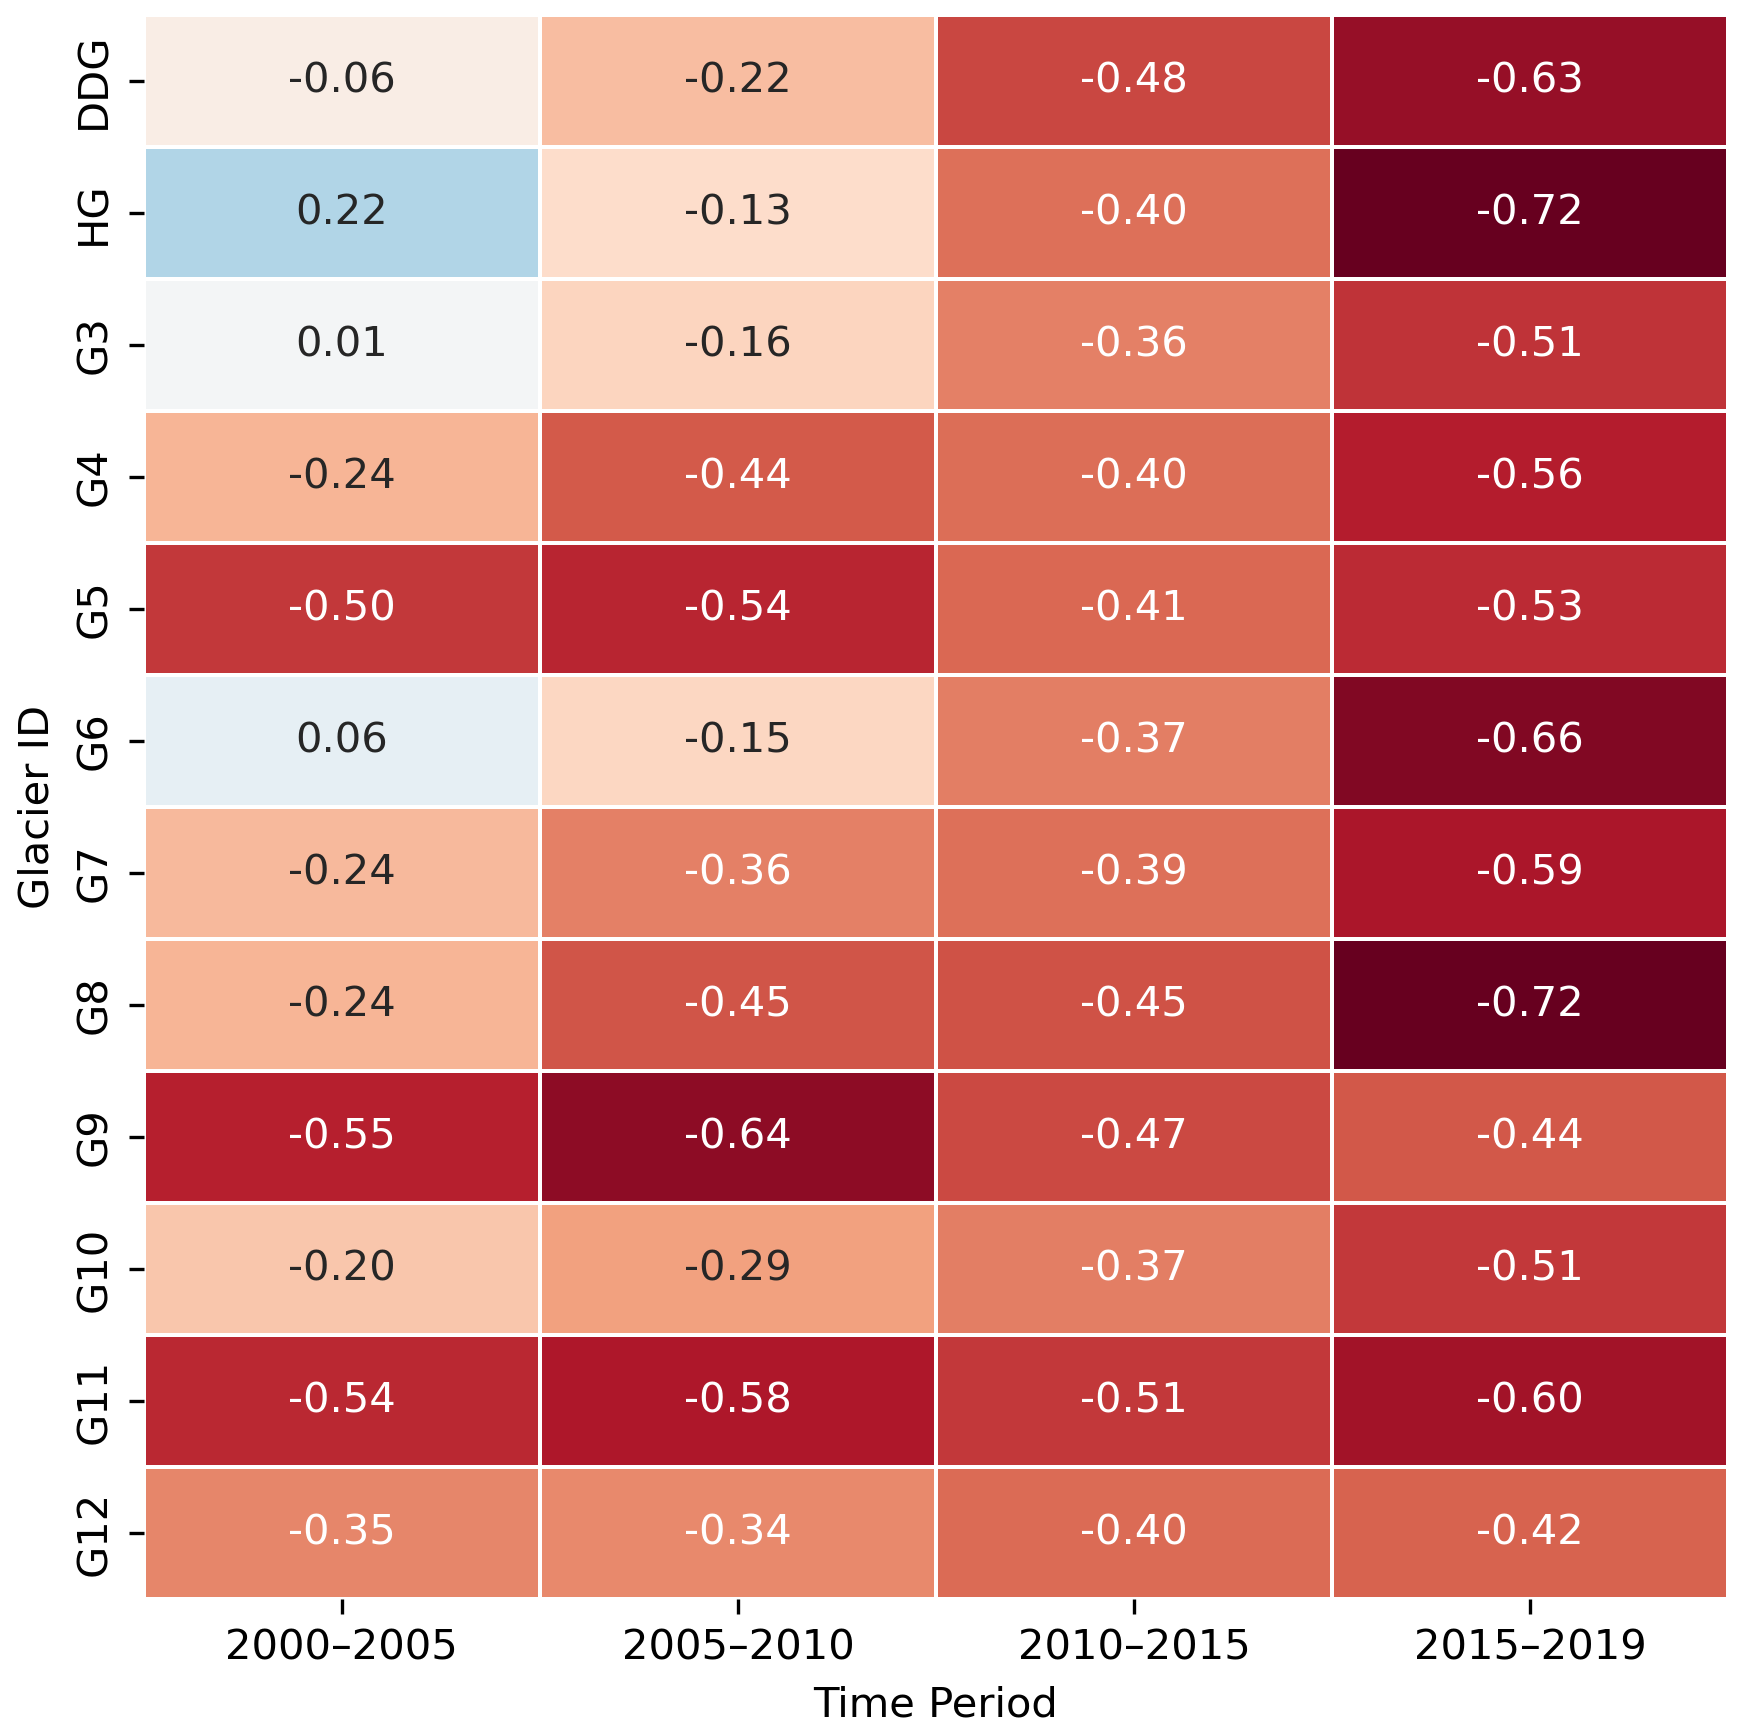
Figure 7Glacier-wide mean elevation change (dh dt) in m yr−1 for different periods. Blue denotes thickening and red denotes thinning.
The overall mean glacier surface elevation change rates for all the glaciers in the study region show a clear acceleration of thinning, from −0.22 m yr−1 (2000–2005) to −0.57 m yr−1 (2015–2020). This pattern aligns with glacier hypsometry, as bottom-heavy glaciers (e.g., HG, G3, G4, G8, G11) experienced greater thinning, with HG showing especially strong losses in the most recent period (−0.72 m yr−1; Fig. 7). The largest glacier – DDG, an equidimensional glacier (where glacier area is more evenly distributed across its elevation range), experienced a mean glacier-wide thinning rate of −0.06 m yr−1 during 2000 and 2005, to −0.63 m yr−1 during 2015 and 2020. Few glaciers (HG, G3 and G6) showed a mean positive rate during 2000 and 2005, which could be linked to the higher accumulation rate in higher elevations (Fig. 8).
4.3 Non-climatic factors
We used a correlation matrix to understand the interplay between glacier surface velocity and different non-climatic factors such as mean elevation, area, mean slope, mean aspect, and length (Fig. 9). The matrix indicates that glacier length and area have the strongest positive correlations with mean velocity, with a correlation coefficient of 0.75 and 0.67, respectively, which could be related to how large and thick the ice is. In contrast, slope () and aspect () shows a moderate negative correlation with velocity. While steeper slopes generally increase gravitational driving stress, the negative correlation observed here likely reflects the inverse relationship between slope and ice thickness; in this study area, steeper glaciers could be thinner, and the reduction in thickness exerts a stronger limiting influence on velocity than the slope gradient provides. The mean elevation shows almost no correlation (r=0.01) with surface velocity.
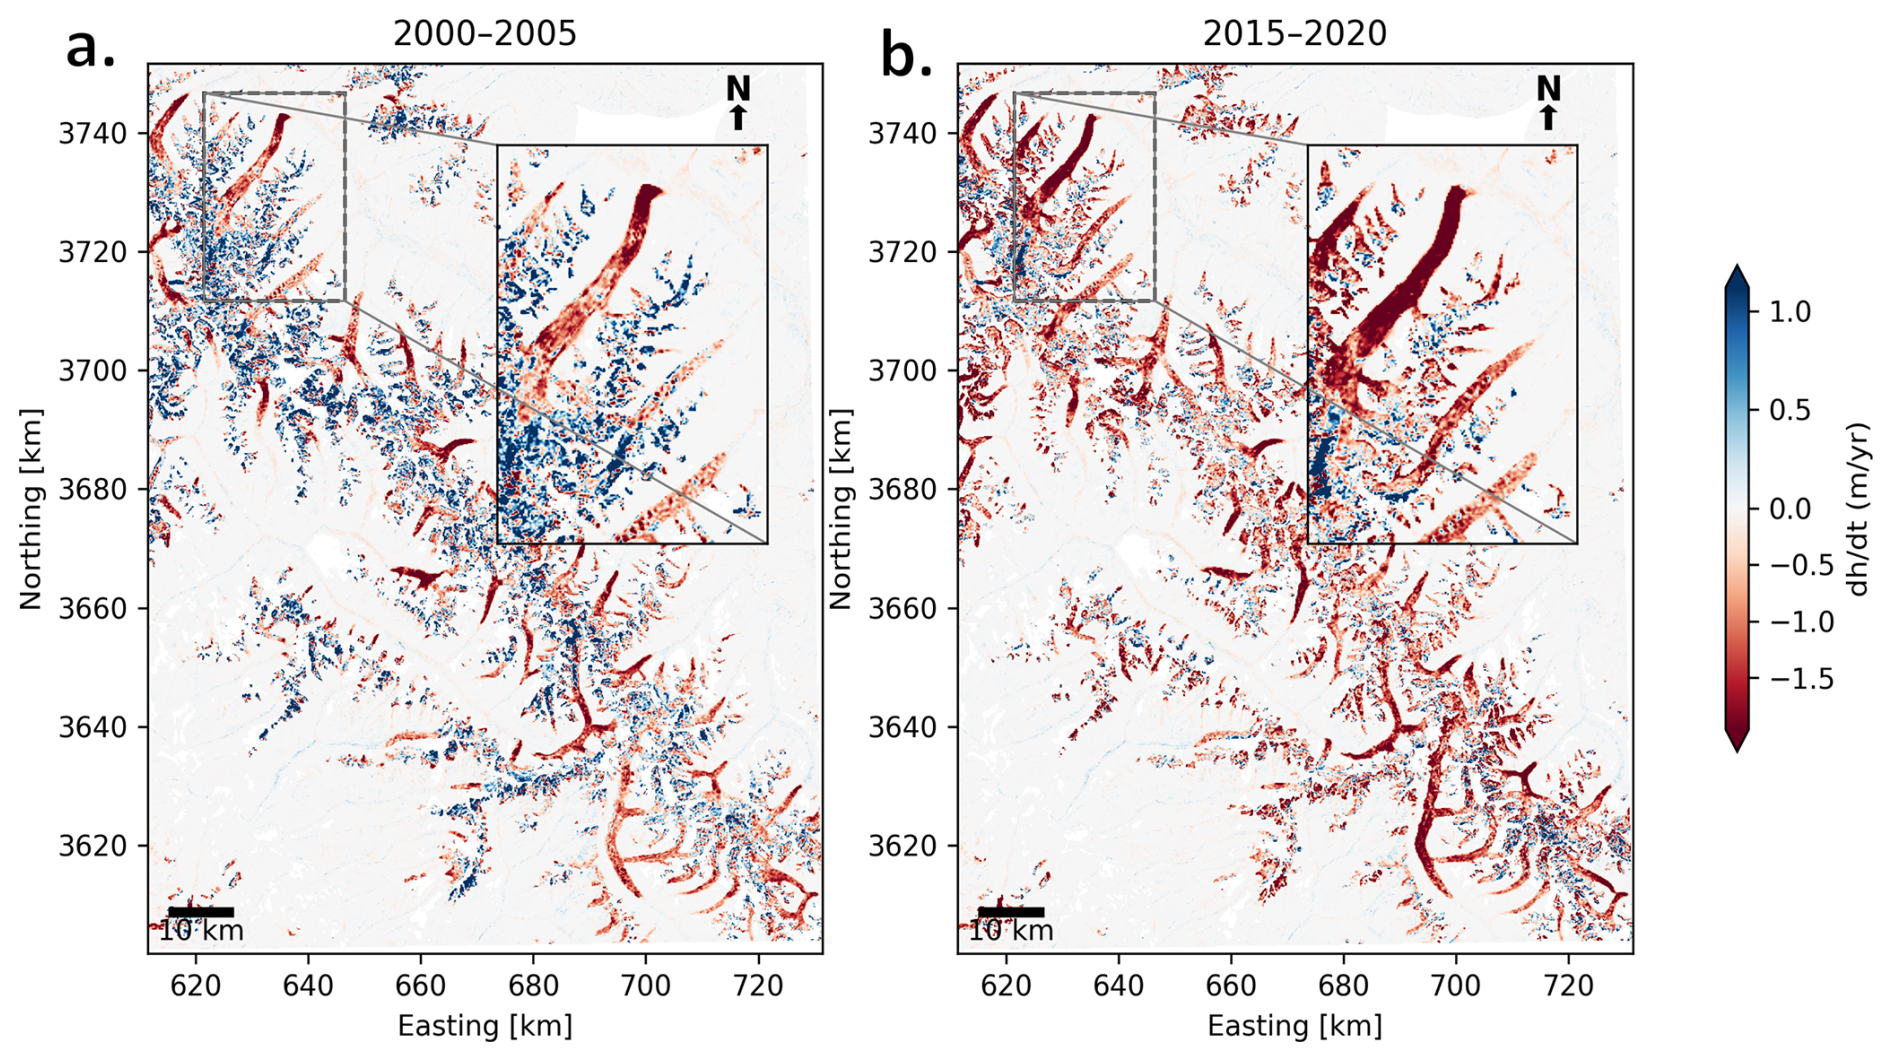
Figure 8Glacier surface elevation change (Hugonnet et al., 2021a). (a–b) show the elevation change map for different periods (2000–2005 and 2015–2020). The colour bar represents the 2nd–98th percentile of elevation change. The inset in panels (a) and (b) show the tongue of the Drang Drung glacier and its neighbouring glaciers.
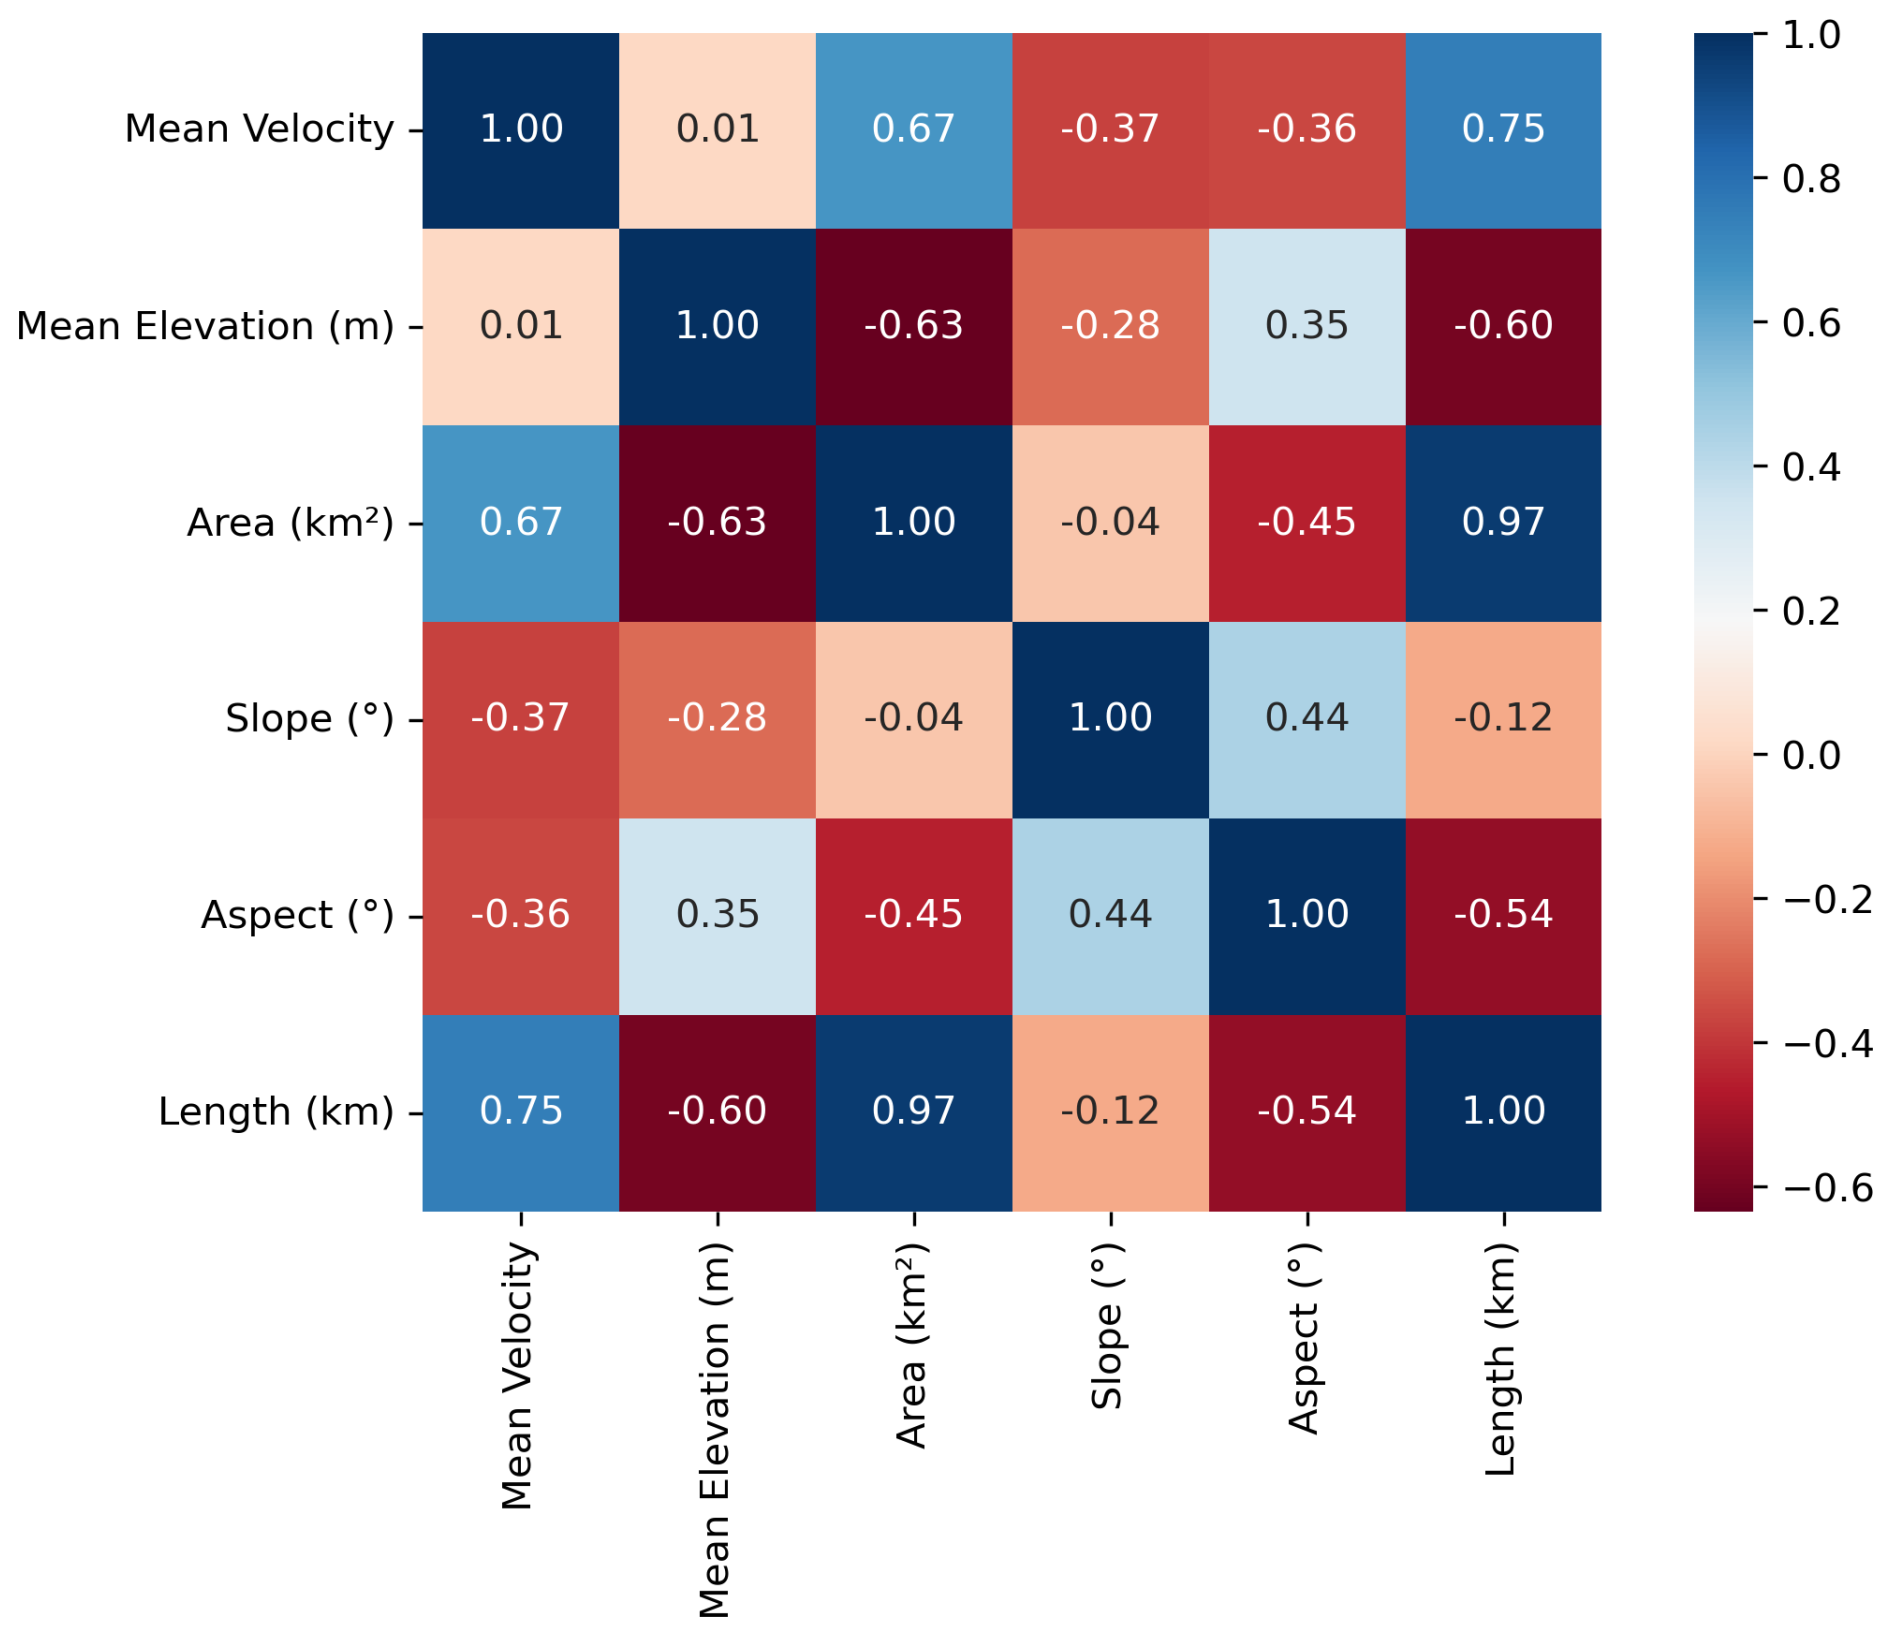
Figure 9Correlation matrix between mean surface velocity and non-climatic variables such as Mean elevation (m), Area (km2), Slope (in °), Aspect (in °) and length (km).
4.4 Climatic trends
We analyzed climate data over the region from the ERA5-Land dataset, calculating trends over the period 1990–2025. The overall mean annual temperature increased by 0.02±0.01 °C yr−1 over the period, with increases in both summer (May–September; 0.01±0.01 °C yr−1) and winter (October–April; 0.03±0.01 °C yr−1) temperatures (Fig. 10a). Summer precipitation (MJJAS) remains consistent with no significant change. In contrast, the winter precipitation shows a declining trend (Fig. 10b).
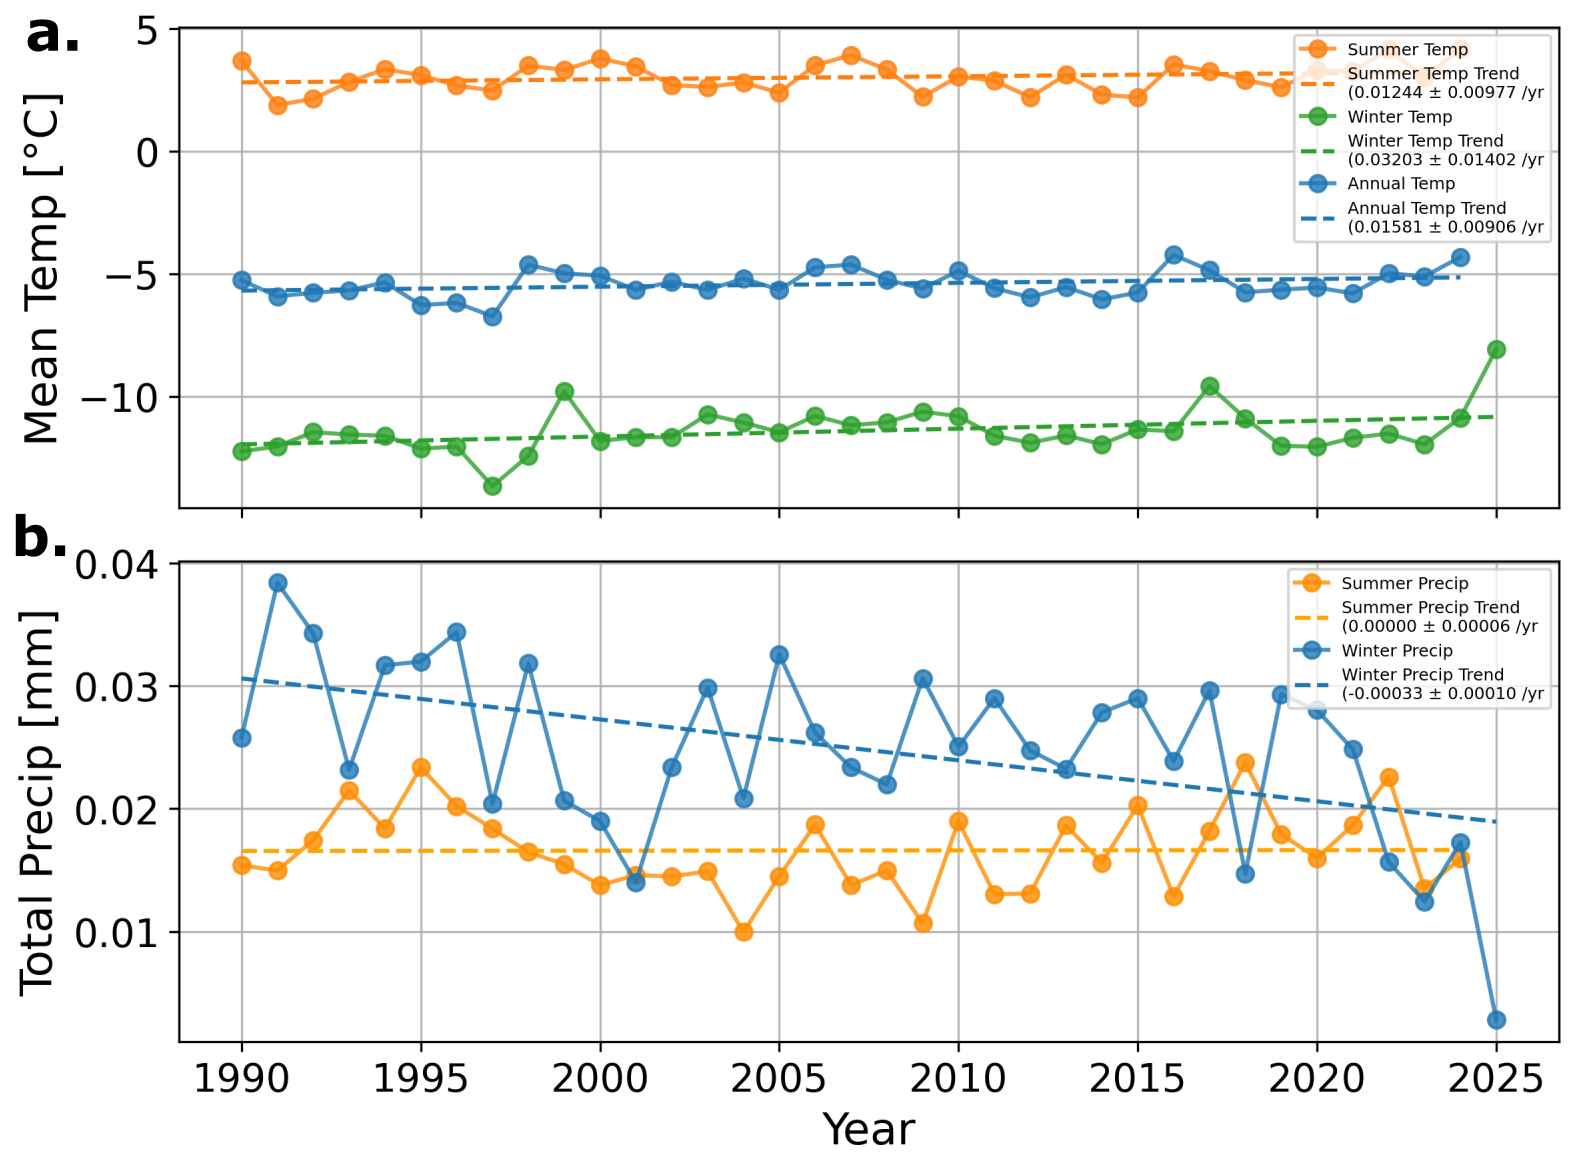
Figure 10(a) Trend of summer temperature (MJJAS), winter temperature (ONDJFMA), and annual mean temperature from ERA5 Land; (b) Summer precipitation and winter precipitation (1990–2025) from ERA5 Land. Each data point for temperature is the mean, whereas for precipitation, it is cumulative.
5.1 Trends in Surface Velocity and Elevation Change
Our analysis shows an overall consistent slowdown in glacier velocity over recent decades. This trend aligns well with other regional and glacier-specific observations of glacier deceleration, which are linked to ongoing thinning and mass loss. For instance, Dehecq et al. (2019) reported a significant decadal slowdown (2000–2017) in glacier flow across High Mountain Asia. Especially, the Lahaul-Spiti region, within our study area, exhibits an average velocity trend of −4.6 ± 0.6 m yr−1 per decade. Similar patterns have been reported for Parkachik Glacier in the Suru Basin, adjacent to our study area, where velocity decreased from 45.2 ± 1.8 m yr−1 in 1999 and 2000 to 32.28 ± 0.80 m yr−1 in 2020 and 2021, primarily linked to mass wastage, debris-cover increase, and reduced accumulation (Rana et al., 2023). Another study calculated the long-term change (1993–2018) of Parkachik Glacier, showing evidence of velocity slowdown by ∼ 35 % (10.5±5.7 m yr−1) due to increased debris cover near the terminus and mass loss (Garg et al., 2022). A recent study focusing on the Chenab Basin showed glaciers slowing down by 54 % and 20 % between 1993 and 2021 in the Bhut and Warwan subbasins, respectively, which was primarily linked to increased debris-cover over glaciers (Garg et al., 2025). Another recent study by Bhattacharjee et al. (2025) reported a velocity of 0.26 ± 0.02 m d which corresponds to 94.97 ± 7.31 m yr−1 for DDG close to the ELA (Equilibrium Line Altitude) and 0.04 ± 0.003 m d−1, equivalent to 14.6 ± 1.1 m yr−1 for G3 near the terminus, which aligns very well with our results. Although previous studies have reported a slowdown of glaciers in the Ladakh region, a contrasting increase in glacier velocity was found in the Drang Drung Glacier. For example, the results from the study by Singh Jasrotia et al. (2024) show velocity increased from 71±6.1 m yr−1 in 1999 and 2000 to 140±7.4 m yr−1 in 2019 and 2020 (by ∼ 50 %), which contrasts with our findings, and is likely an artefact of their consideration of two timeframes only. Overall, our declining glacier velocity trends align with patterns observed for nearby glaciers in other studies. However, our results contrast with the recorded flow acceleration of some Karakoram glaciers during 2000/2002 and 2009/2010, as reported by Heid and Kääb (2012), which was due to positive mass balance, and also glacier surging in this region.
The slowdown we observed could be primarily explained by sustained glacier thinning, resulting in reduced driving stress, especially at lower elevations in the ablation zones, often exceeding several meters per year in some cases. Detailed investigations of surface elevation change revealed strong glacier thinning across all the glaciers, with higher rates observed from 2010 to 2020. HG and G8 exhibited the highest negative elevation change (0.72 m yr−1) between 2015 and 2020, despite them being debris-covered glaciers. This pattern matches the results reported by Bhushan et al. (2018), where debris-covered glaciers exhibited similar elevation change compared to clean ice glaciers. This could be likely due to melt-enhancing features on debris-covered ice, such as ice cliffs and supraglacial ponds that conduct a significant amount of surrounding heat into the ice, resulting in ablation (Brun et al., 2016; Pellicciotti et al., 2015; Reznichenko et al., 2010). A geodetic mass balance estimated by Mandal et al. (2024) also reports an elevation change rate of m yr−1 (2000–2017) for Western Ladakh glaciers that covers Zanskar Basin as well, which aligns well with Hugonnet et al. (2021a) trends.
Several glaciers in our domain (DDG, HG, G4 and G5) showed higher velocities in lower elevations in recent years, accompanied by lower thinning rates near those elevations (Fig. 6). For G4 and G5 (top-heavy glaciers) and DDG (equidimensional hypsometry), sustained ice flux from upstream likely contributes to maintaining flow toward lower elevations. However, the dynamic behaviour of these lower ablation zones cannot be explained by geometry alone. Enhanced surface melt in recent years likely increases meltwater inputs to the glacier bed through moulins or crevasses, promoting periods of elevated basal water pressure and reducing effective pressure at the ice-bed interface, which can lead to higher basal sliding. HG, a heavily debris-covered glacier with a bottom-heavy hypsometry is likely more sensitive to such hydrological controls near the ablation zone. While debris can modulate surface melt spatially, meltwater routed through crevasses, ice cliffs, and supraglacial ponds can still reach the bed and locally enhance sliding. Bhushan et al. (2018) also reported a dynamically active trunk of DDG (> 20 m yr−1 in 2013–2014), consistent with our mean flowline velocities. This highlights the complex interplay between glacier geometry, debris, subglacial hydrology evolution, and dynamics.
Overall, our findings reinforce the broader picture of sustained glacier slowdown across the Zanskar region, which is closely tied to glacier mass loss due to thinning, and is consistent with the patterns observed in other studies and existing theory. The climate data analysis further supports this link, showing increasing summer temperatures and declining winter precipitation (snowfall) over recent decades (Fig. 10), which is likely to intensify in the future under continued warming.
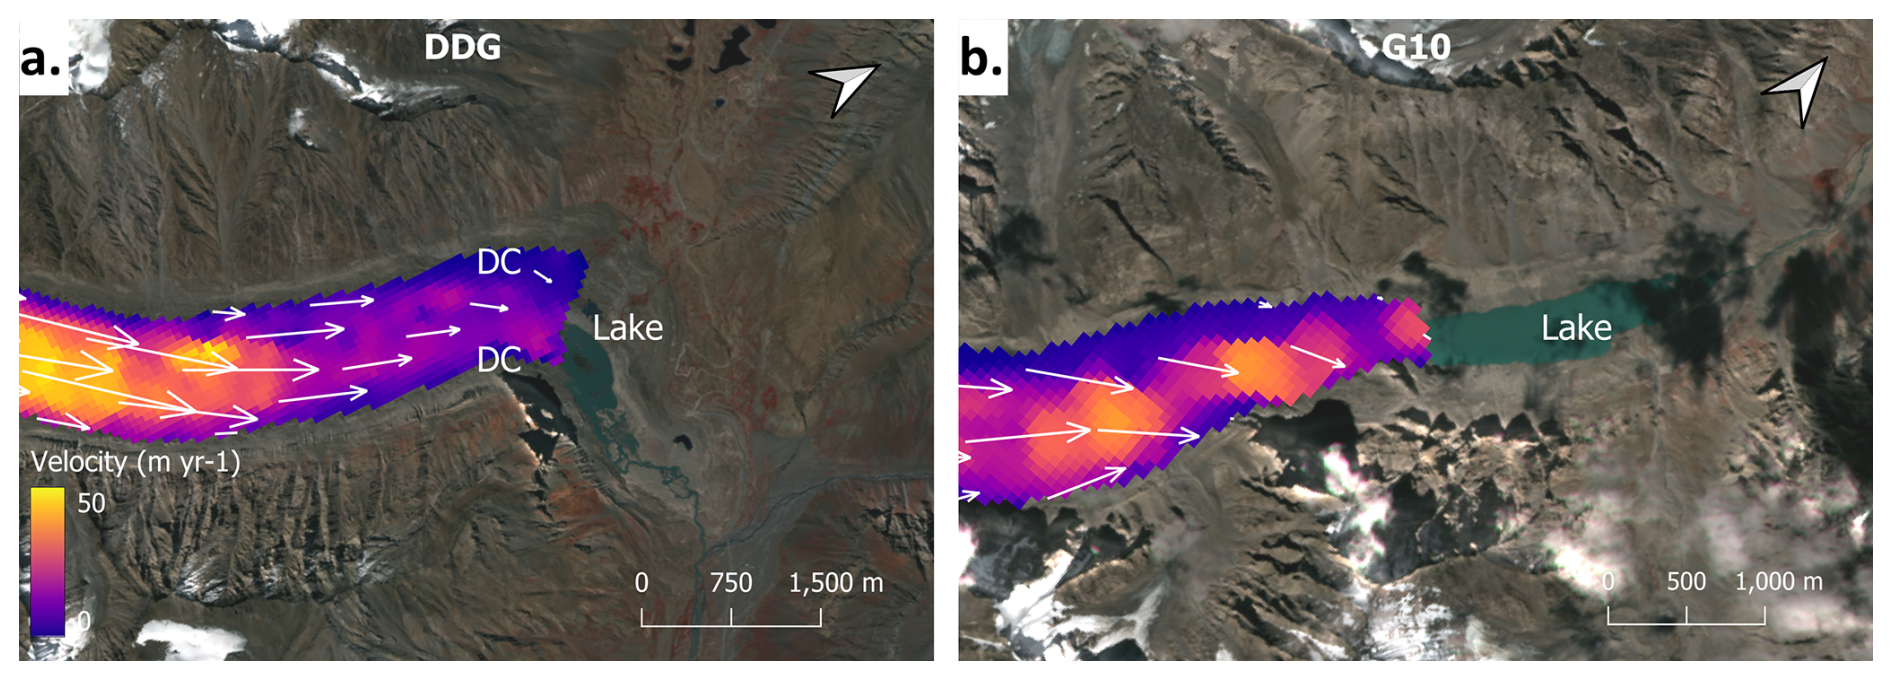
Figure 11Velocity near the terminus of the lake terminating glaciers. (a) DDG; and (b) G10 for the year 2020–2021. Highlighting the high velocity near the terminus for G10 and DDG. “DC” represents the Debris Cover area along the glacier tongue. The basemap is a Sentinel 2 satellite image from September 2021.
5.2 Velocity trend of lake-terminating glaciers
Glacier velocities across the study region show clear differences between lake-terminating and land-terminating glaciers, with the former generally maintaining higher surface flow speeds – often up to twice that of their land-terminating counterpart. For instance, mean velocity along the central flowline for DDG and G10 corresponds to 57.9 and 38.5 m yr−1, respectively, which is significantly higher than other glaciers (Fig. 11). While glacier size and thickness have controls on driving stress and could partly explain these higher velocities, the dynamic influence of proglacial lakes likely provides an additional control on them.
The presence of a pro-glacial lake has been previously linked with enhanced glacier mass loss (King et al., 2019; Minowa et al., 2023; Zhang et al., 2023). That is, a lake-terminating glacier loses mass at its terminus by surface melt and frontal ablation, which includes mechanical calving and subaqueous melt (Carrivick and Tweed, 2013), both of which drive dynamic thinning and retreat. This is evident from the elevation change analysis of both DDG and G10 (Fig. 6). For DDG, retreat rates of 21.1 m year−1, and a total retreat of 925 m have been observed between 1971 and 2017, with the pro-glacial lake developing around 2014 (Rashid and Majeed, 2018). This thinning and retreat could be related to calving, which was evidenced in 2023 (e.g. see Fig. S4). The pro-glacial lake near the G10 terminus was formed well before 1975 (Govindha Raj, 2010). In contrast to DDG, calving at G10 is not apparent from satellite observations, and it is less clear what mechanisms underlie the thinning of this glacier. Such lake expansion could alter the local force balance near the termini, promoting frontal acceleration (Pronk et al., 2021). A recent study on Bhutan lake-terminating glaciers found, despite high thinning rates, some glaciers showed acceleration near the terminus, which is potentially due to increased meltwater flux (Hyde et al., 2025). A similar conclusion was drawn by Wu et al. (2020) for a lake-terminating glacier in Kangri Karpo Mountains in South-Eastern Tibet.
Numerical modelling experiment on an alpine glacier has also explained that the presence of a pro-glacial lake enhances the glacier retreat by 4 times and induces ice acceleration by 8 times higher as compared to land-terminating glaciers forced with the same climatic parameters (Sutherland et al., 2020). The contrasting behaviour of lake-terminating glaciers may therefore be explained in two ways: (a) less buttressing and altered local force balance at the ice-lake margin, and (b) enhanced surface lowering near the terminus. The latter, in particular, influences the flow characteristics by regulating the glacier's dynamic thinning phenomenon, as also discussed and found in the majority of lake-terminating Himalayan glacier studies (King et al., 2019; Pronk et al., 2021). Glacier geometry is equally important in this regard, as longer and thicker glaciers inherently sustain greater driving stresses, enabling higher ice flow velocities irrespective of terminus conditions. However, disentangling the relative influence of these geometric controls from lake-driven dynamic processes remains beyond the scope of the present dataset, as the observations do not directly constrain either factor. This limitation warrants further investigation.
5.3 Limitations
While the study provides some critical insights into the evolution and control of interannual glacier velocity for selected glaciers in the Zanskar region of Ladakh, a few limitations need to be acknowledged. First, issues in velocity retrieval led to data gaps between 2002 and 2008, primarily due to the limited availability or poor quality of optical satellite imagery with persistent cloud cover and low surface contrast hindering reliable feature tracking. These data gaps in time series analysis may miss specific events during the acceleration or slowdown phase, especially during periods of high inter-annual variability, such as high-melting years, which can lead to biases in the trend estimates.
Second, the analysis focuses on interannual to interdecadal variability and does not resolve short-term or seasonal velocity fluctuations driven by meltwater input and subglacial hydrological processes. In addition, erroneous velocity due to the presence of cloud cover, shadows, or snow may occur. For example, spatially, velocity retrieval was found to be less reliable in accumulation zones and small tributaries for some years, where low surface texture and seasonal snow cover lead to noisy or non-physical velocity vectors. In contrast, the main glacier trunks show internally coherent and consistently downstream flow, supporting confidence in the primary velocity patterns while highlighting regions of reduced reliability (Troilo et al., 2024). The estimated uncertainties in our results are well within limits and less than the magnitudes of velocity observed in the terminus of DDG and G10.
Finally, due to the lack of reliable in situ meteorological observations, ERA5-Land data were not bias-corrected. While the use of raw ERA5-Land data may influence the magnitude of derived climatic trends (e.g. Satyapragyan et al., 2026), it does not affect the primary objective of this study, which focuses on the temporal evolution of glacier velocity.
We set out to understand the long-term evolution of glacier velocity and its potential drivers in the Zanskar Basin of the Ladakh Himalayas. By analyzing interannual glacier velocity changes from 1992 to 2023 alongside glacier surface elevation change trends over four distinct periods between 2000 and 2019, of 12 selected glaciers, we provide a detailed picture of how glacier dynamics have evolved over time.
The results highlight an overall trend of glacier slowdown across all the glaciers, accompanied by prolonged glacier thinning, highlighting the dynamic response of the glaciers to sustained mass loss. Surface thinning has been more pronounced at lower elevations (< 5000 m), while patterns of velocity change vary across glaciers and time periods.
While climate-driven thinning is the dominant control on glacier deceleration, glacier geometry, slope, debris cover, subglacial conditions, and terminus type significantly modulate the spatial and temporal patterns of ice flow. Though lake-terminating glaciers exhibited persistently higher velocities compared to land-terminating ones, consistent with previous findings across the Himalayas, the specific mechanisms driving this difference cannot be conclusively resolved here, given current data constraints. Further, climate records indicate rising summer temperatures and declining winter snowfall, trends that are expected to intensify, implying continued reductions in accumulation, enhanced ablation, and accelerated mass loss in the future. Our findings contribute to a broader understanding of long-term spatial and temporal variability in glacier dynamics in the region influenced by the complex interplay between glacier thinning and other non-climatic factors.
Open-access image correlation algorithm tool- COSI-Corr is available to download from https://www.tectonics.caltech.edu/slip_history/spot_coseis/download_software.html (last access: 28 October 2024). All datasets used for this study are publicly available on different portals and repositories. Landsat series of satellite images are freely available to download from the United States Geological Survey (USGS) Earth Explorer Portal (https://earthexplorer.usgs.gov/, last access: 19 July 2025). The glacier elevation change datasets are publicly available from Hugonnet et al. (2021b) accessed from: https://doi.org/10.6096/13. The debris cover dataset is available from Scherler et al. (2018a) at https://doi.org/10.5880/GFZ.3.3.2018.005 (Scherler et al., 2018b). Climate datasets-ECMWF ERA5-Land were accessed from Copernicus Climate Data Store (https://doi.org/10.24381/CDS.68D2BB30, Copernicus Climate Change Service, 2019). The dataset generated in this study are publicly available via Zenodo (https://doi.org/10.5281/zenodo.20175928, Ghosh et al., 2026).
The supplement related to this article is available online at https://doi.org/10.5194/tc-20-3415-2026-supplement.
TG – Conceptualisation, methodology, formal analysis, Writing – original draft, reviewing and editing, RR – Conceptualisation, Writing – reviewing and editing. FSM – Writing – reviewing and editing, AM – Writing – reviewing and editing. RR, FSM and AM jointly supervised the study.
At least one of the (co-)authors is a member of the editorial board of The Cryosphere. The peer-review process was guided by an independent editor, and the authors also have no other competing interests to declare.
Publisher's note: Copernicus Publications remains neutral with regard to jurisdictional claims made in the text, published maps, institutional affiliations, or any other geographical representation in this paper. The authors bear the ultimate responsibility for providing appropriate place names. Views expressed in the text are those of the authors and do not necessarily reflect the views of the publisher.
First author would like to thank Dr. Suresh Das, Postdoctoral Researcher, and member of the Hydro Remote Sensing Applications Group (H-RSA), IIT Bombay, for kindly providing a subset of the velocity data used in this study. The authors are grateful to the editor, Etienne Berthier, for handling the article and to the two reviewers, Maximillian Van Wyk de Vries and an anonymous reviewer, for their constructive comments on the article.
TG was supported by a PhD scholarship from IITB-Monash Research Academy under project IMURA0980. FSM was supported under an Australian Research Council (ARC) Discovery Early Career Research Award (grant no. DE210101433).
This paper was edited by Etienne Berthier and reviewed by Maximillian Van Wyk de Vries and one anonymous referee.
Agarwal, V., Van Wyk De Vries, M., Haritashya, U. K., Garg, S., Kargel, J. S., Chen, Y.-J., and Shugar, D. H.: Long-term analysis of glaciers and glacier lakes in the Central and Eastern Himalaya, Sci. Total Environ., 898, 165598, https://doi.org/10.1016/j.scitotenv.2023.165598, 2023.
Altena, B., Scambos, T., Fahnestock, M., and Kääb, A.: Extracting recent short-term glacier velocity evolution over southern Alaska and the Yukon from a large collection of Landsat data, The Cryosphere, 13, 795–814, https://doi.org/10.5194/tc-13-795-2019, 2019.
Archer, D. R. and Fowler, H. J.: Spatial and temporal variations in precipitation in the Upper Indus Basin, global teleconnections and hydrological implications, Hydrol. Earth Syst. Sci., 8, 47–61, https://doi.org/10.5194/hess-8-47-2004, 2004.
Azam, M. F., Wagnon, P., Ramanathan, A., Vincent, C., Sharma, P., Arnaud, Y., Linda, A., Pottakkal, J. G., Chevallier, P., Singh, V. B., and Berthier, E.: From balance to imbalance: a shift in the dynamic behaviour of Chhota Shigri glacier, western Himalaya, India, J. Glaciol., 58, 315–324, https://doi.org/10.3189/2012JoG11J123, 2012.
Azam, M. F., Wagnon, P., Vincent, C., Ramanathan, A., Linda, A., and Singh, V. B.: Reconstruction of the annual mass balance of Chhota Shigri glacier, Western Himalaya, India, since 1969, Ann. Glaciol., 55, 69–80, https://doi.org/10.3189/2014AoG66A104, 2014.
Azam, M. F., Kargel, J. S., Shea, J. M., Nepal, S., Haritashya, U. K., Srivastava, S., Maussion, F., Qazi, N., Chevallier, P., Dimri, A. P., Kulkarni, A. V., Cogley, J. G., and Bahuguna, I.: Glaciohydrology of the Himalaya-Karakoram, Science, 373, eabf3668, https://doi.org/10.1126/science.abf3668, 2021.
Azam, M. F., Hussain, Md. A., Kaushik, H., Srivastava, S., Munda, M. K., Mandal, A., Bahuguna, I., Singh, S. K., and Jawad, M.: Initial glaciological investigations on a large Himalayan glacier: Drang Drung (Zanskar, Ladakh, India), J. Glaciol., 1–22, https://doi.org/10.1017/jog.2024.102, 2025.
Barnett, T. P., Adam, J. C., and Lettenmaier, D. P.: Potential impacts of a warming climate on water availability in snow-dominated regions, Nature, 438, 303–309, https://doi.org/10.1038/nature04141, 2005.
Bhambri, R., Bolch, T., Chaujar, R. K., and Kulshreshtha, S. C.: Glacier changes in the Garhwal Himalaya, India, from 1968 to 2006 based on remote sensing, J. Glaciol., 57, 543–556, https://doi.org/10.3189/002214311796905604, 2011.
Bhambri, R., Schmidt, S., Chand, P., Nüsser, M., Haritashya, U., Sain, K., Tiwari, S. K., and Yadav, J. S.: Heterogeneity in glacier thinning and slowdown of ice movement in the Garhwal Himalaya, India, Sci. Total Environ., 875, 162625, https://doi.org/10.1016/j.scitotenv.2023.162625, 2023.
Bhattacharjee, S., Garg, R. D., and Pandey, A. C.: Monitoring glacier surface velocity in Zanskar Valley, India: Insights from DInSAR-based 2D velocity estimation, Results Earth Sci., 3, 100092, https://doi.org/10.1016/j.rines.2025.100092, 2025.
Bhattacharya, A., Bolch, T., Mukherjee, K., Pieczonka, T., Kropáček, J., and Buchroithner, M. F.: Overall recession and mass budget of Gangotri Glacier, Garhwal Himalayas, from 1965 to 2015 using remote sensing data, J. Glaciol., 62, 1115–1133, https://doi.org/10.1017/jog.2016.96, 2016.
Bhushan, S., Syed, T. H., Kulkarni, A. V., Gantayat, P., and Agarwal, V.: Quantifying Changes in the Gangotri Glacier of Central Himalaya: Evidence for Increasing Mass Loss and Decreasing Velocity, IEEE J. Sel. Top. Appl., 10, 5295–5306, https://doi.org/10.1109/JSTARS.2017.2771215, 2017.
Bhushan, S., Syed, T. H., Arendt, A. A., Kulkarni, A. V., and Sinha, D.: Assessing controls on mass budget and surface velocity variations of glaciers in Western Himalaya, Sci. Rep., 8, 8885, https://doi.org/10.1038/s41598-018-27014-y, 2018.
Bindschadler, R.: The Importance of Pressurized Subglacial Water in Separation and Sliding at the Glacier Bed, J. Glaciol., 29, 3–19, https://doi.org/10.3189/S0022143000005104, 1983.
Bolch, T.: Asian glaciers are a reliable water source, Nature, 545, 161–162, https://doi.org/10.1038/545161a, 2017.
Bolch, T., Kulkarni, A., Kääb, A., Huggel, C., Paul, F., Cogley, J. G., Frey, H., Kargel, J. S., Fujita, K., Scheel, M., Bajracharya, S., and Stoffel, M.: The State and Fate of Himalayan Glaciers, Science, 336, 310–314, https://doi.org/10.1126/science.1215828, 2012a.
Bolch, T., Kulkarni, A., Kääb, A., Huggel, C., Paul, F., Cogley, J. G., Frey, H., Kargel, J. S., Fujita, K., Scheel, M., Bajracharya, S., and Stoffel, M.: The State and Fate of Himalayan Glaciers, Science, 336, 310–314, https://doi.org/10.1126/science.1215828, 2012b.
Brun, F., Buri, P., Miles, E. S., Wagnon, P., Steiner, J., Berthier, E., Ragettli, S., Kraaijenbrink, P., Immerzeel, W. W., and Pellicciotti, F.: Quantifying volume loss from ice cliffs on debris-covered glaciers using high-resolution terrestrial and aerial photogrammetry, J. Glaciol., 62, 684–695, https://doi.org/10.1017/jog.2016.54, 2016.
Brun, F., Berthier, E., Wagnon, P., Kääb, A., and Treichler, D.: A spatially resolved estimate of High Mountain Asia glacier mass balances from 2000 to 2016, Nat. Geosci., 10, 668–673, https://doi.org/10.1038/ngeo2999, 2017.
Carrivick, J. L. and Tweed, F. S.: Proglacial lakes: character, behaviour and geological importance, Quaternary Sci. Rev., 78, 34–52, https://doi.org/10.1016/j.quascirev.2013.07.028, 2013.
Copernicus Climate Change Service: ERA5-Land monthly averaged data from 2001 to present, Copernicus Climate Change Service (C3S) Climate Data Store (CDS) [data set], https://doi.org/10.24381/CDS.68D2BB30, 2019.
Cuffey, K. M. and Paterson, W. S. B.: The physics of glaciers, 4. ed., Butterworth-Heineman, Amsterdam Heidelberg, 693 pp., ISBN 978-0-12-369461-4, 2010.
Das, S. and Sharma, M. C.: Glacier surface velocities in the Jankar Chhu Watershed, western Himalaya, India: Study using Landsat time series data (1992–2020), Remote Sens. Appl. Soc. Environ., 24, 100615, https://doi.org/10.1016/j.rsase.2021.100615, 2021.
Dehecq, A., Gourmelen, N., and Trouve, E.: Deriving large-scale glacier velocities from a complete satellite archive: Application to the Pamir–Karakoram–Himalaya, Remote Sens. Environ., 162, 55–66, https://doi.org/10.1016/j.rse.2015.01.031, 2015.
Dehecq, A., Gourmelen, N., Gardner, A. S., Brun, F., Goldberg, D., Nienow, P. W., Berthier, E., Vincent, C., Wagnon, P., and Trouvé, E.: Twenty-first century glacier slowdown driven by mass loss in High Mountain Asia, Nat. Geosci., 12, 22–27, https://doi.org/10.1038/s41561-018-0271-9, 2019.
Dematteis, N., Giordan, D., Troilo, F., Wrzesniak, A., and Godone, D.: Ten-Year Monitoring of the Grandes Jorasses Glaciers Kinematics. Limits, Potentialities, and Possible Applications of Different Monitoring Systems, Remote Sens., 13, 3005, https://doi.org/10.3390/rs13153005, 2021.
Fahnestock, M., Scambos, T., Moon, T., Gardner, A., Haran, T., and Klinger, M.: Rapid large-area mapping of ice flow using Landsat 8, Remote Sens. Environ., 185, 84–94, https://doi.org/10.1016/j.rse.2015.11.023, 2016.
Garg, S., Shukla, A., Garg, P. K., Yousuf, B., and Shukla, U. K.: Surface evolution and dynamics of the Kangriz glacier, western Himalaya in past 50 years, Cold Reg. Sci. Technol., 196, 103496, https://doi.org/10.1016/j.coldregions.2022.103496, 2022.
Garg, S., Agarwal, V., Haritashya, U. K., Kargel, J. S., and Shukla, A.: Evolving glacier patterns in the Chenab River Basin (1993–2021): Drivers and environmental implications, Sci. Total Environ., 962, 178430, https://doi.org/10.1016/j.scitotenv.2025.178430, 2025.
Ghosh, T., Ramsankaran, R., McCormack, F. S., and Mackintosh, A. N.: Dataset generated during the study, Zenodo [data set], https://doi.org/10.5281/zenodo.20175928, 2026.
Govindha Raj, K. B.: Remote sensing based hazard assessment of glacial lakes: a case study in Zanskar basin, Jammu and Kashmir, India, Geomat. Nat. Haz. Risk, 1, 339–347, https://doi.org/10.1080/19475705.2010.532973, 2010.
Greene, C. A. and Gardner, A. S.: Seasonal dynamics of Earth's glaciers and ice sheets, Science, 390, 945–950, https://doi.org/10.1126/science.adx6654, 2025.
Heid, T. and Kääb, A.: Repeat optical satellite images reveal widespread and long term decrease in land-terminating glacier speeds, The Cryosphere, 6, 467–478, https://doi.org/10.5194/tc-6-467-2012, 2012.
Hooke, R. LeB., Calla, P., Holmlund, P., Nilsson, M., and Stroeven, A.: A 3 Year Record of Seasonal Variations in Surface Velocity, StorglaciÄren, Sweden, J. Glaciol., 35, 235–247, https://doi.org/10.3189/S0022143000004561, 1989.
Hugonnet, R., McNabb, R., Berthier, E., Menounos, B., Nuth, C., Girod, L., Farinotti, D., Huss, M., Dussaillant, I., Brun, F., and Kääb, A.: Accelerated global glacier mass loss in the early twenty-first century, Nature, 592, 726–731, https://doi.org/10.1038/s41586-021-03436-z, 2021a.
Hugonnet, R., McNabb, R., Berthier, E., Menounos, B., Nuth, C., Girod, L., Farinotti, D., Huss, M., Dussaillant, I., Brun, F., and Kääb, A.: Accelerated global glacier mass loss in the early twenty-first century – Dataset, Theia [data set], https://doi.org/10.6096/13 (last access: 22 April 2025), 2021b.
Huss, M. and Hock, R.: Global-scale hydrological response to future glacier mass loss, Nat. Clim. Change, 8, 135–140, https://doi.org/10.1038/s41558-017-0049-x, 2018.
Hyde, A., Carr, R., Dunning, S. A., and Van Wyk De Vries, M.: Quantifying heterogeneous glacier dynamics in Lunana, Bhutan, using spatiotemporally high-resolution satellite imagery, J. Glaciol., 71, e126, https://doi.org/10.1017/jog.2025.10103, 2025.
Iken, A. and Bindschadler, R. A.: Combined measurements of Subglacial Water Pressure and Surface Velocity of Findelengletscher, Switzerland: Conclusions about Drainage System and Sliding Mechanism, J. Glaciol., 32, 101–119, https://doi.org/10.3189/S0022143000006936, 1986.
Immerzeel, W. W., Van Beek, L. P. H., and Bierkens, M. F. P.: Climate Change Will Affect the Asian Water Towers, Science, 328, 1382–1385, https://doi.org/10.1126/science.1183188, 2010.
Jiskoot, H., Curran, C. J., Tessler, D. L., and Shenton, L. R.: Changes in Clemenceau Icefield and Chaba Group glaciers, Canada, related to hypsometry, tributary detachment, length–slope and area–aspect relations, Ann. Glaciol., 50, 133–143, https://doi.org/10.3189/172756410790595796, 2009.
Kamp, U., Byrne, M., and Bolch, T.: Glacier fluctuations between 1975 and 2008 in the Greater Himalaya Range of Zanskar, southern Ladakh, J. Mt. Sci., 8, 374–389, https://doi.org/10.1007/s11629-011-2007-9, 2011.
Kim, T. K.: T test as a parametric statistic, Korean J. Anesthesiol., 68, 540, https://doi.org/10.4097/kjae.2015.68.6.540, 2015.
King, O., Bhattacharya, A., Bhambri, R., and Bolch, T.: Glacial lakes exacerbate Himalayan glacier mass loss, Sci. Rep., 9, 18145, https://doi.org/10.1038/s41598-019-53733-x, 2019.
Koblet, T., Gärtner-Roer, I., Zemp, M., Jansson, P., Thee, P., Haeberli, W., and Holmlund, P.: Reanalysis of multi-temporal aerial images of Storglaciären, Sweden (1959–99) – Part 1: Determination of length, area, and volume changes, The Cryosphere, 4, 333–343, https://doi.org/10.5194/tc-4-333-2010, 2010.
Kraaijenbrink, P., Meijer, S. W., Shea, J. M., Pellicciotti, F., De Jong, S. M., and Immerzeel, W. W.: Seasonal surface velocities of a Himalayan glacier derived by automated correlation of unmanned aerial vehicle imagery, Ann. Glaciol., 57, 103–113, https://doi.org/10.3189/2016AoG71A072, 2016.
Lee, S. Y., Seong, Y. B., Owen, L. A., Murari, M. K., Lim, H. S., Yoon, H. I., and Yoo, K.: Late Quaternary glaciation in the Nun-K un massif, northwestern India, Boreas, 43, 67–89, https://doi.org/10.1111/bor.12022, 2014.
Leprince, S., Barbot, S., Ayoub, F., and Avouac, J.-P.: Automatic and Precise Orthorectification, Coregistration, and Subpixel Correlation of Satellite Images, Application to Ground Deformation Measurements, IEEE T. Geosci. Remote, 45, 1529–1558, https://doi.org/10.1109/TGRS.2006.888937, 2007a.
Leprince, S., Ayoub, F., Klinger, Y., and Avouac, J.-P.: Co-Registration of Optically Sensed Images and Correlation (COSI-Corr): an operational methodology for ground deformation measurements, in: 2007 IEEE International Geoscience and Remote Sensing Symposium, 2007 IEEE International Geoscience and Remote Sensing Symposium, 1943–1946, https://doi.org/10.1109/IGARSS.2007.4423207, 2007b.
Li, Z., Sun, W., and Zeng, Q.: Measurements of Glacier Variation in the Tibetan Plateau Using Landsat Data, Remote Sens. Environ., 63, 258–264, https://doi.org/10.1016/S0034-4257(97)00140-5, 1998.
Mackintosh, A. N., Anderson, B. M., and Pierrehumbert, R. T.: Reconstructing Climate from Glaciers, Annu. Rev. Earth Pl. Sc., 45, 649–680, https://doi.org/10.1146/annurev-earth-063016-020643, 2017.
Mandal, A., Vishwakarma, B. D., Angchuk, T., Azam, M. F., Garg, P. K., and Soheb, M.: Glacier mass balance and its climatic and nonclimatic drivers in the Ladakh region during 2000–2021 from remote sensing data, J. Glaciol., 1–23, https://doi.org/10.1017/jog.2024.19, 2024.
Maurer, J. M., Schaefer, J. M., Rupper, S., and Corley, A.: Acceleration of ice loss across the Himalayas over the past 40 years, Sci. Adv., 5, eaav7266, https://doi.org/10.1126/sciadv.aav7266, 2019.
Mehta, M., Kumar, V., Garg, S., and Shukla, A.: Little Ice Age glacier extent and temporal changes in annual mass balance (2016–2019) of Pensilungpa Glacier, Zanskar Himalaya, Reg. Environ. Change, 21, https://doi.org/10.1007/s10113-021-01766-2, 2021.
Millan, R., Mouginot, J., Rabatel, A., and Morlighem, M.: Ice velocity and thickness of the world's glaciers, Nat. Geosci., 15, 124–129, https://doi.org/10.1038/s41561-021-00885-z, 2022.
Minchew, B. and Joughin, I.: Toward a universal glacier slip law, Science, 368, 29–30, https://doi.org/10.1126/science.abb3566, 2020.
Minowa, M., Schaefer, M., and Skvarca, P.: Effects of topography on dynamics and mass loss of lake-terminating glaciers in southern Patagonia, J. Glaciol., 69, 1580–1597, https://doi.org/10.1017/jog.2023.42, 2023.
Nanni, U., Scherler, D., Ayoub, F., Millan, R., Herman, F., and Avouac, J.-P.: Climatic control on seasonal variations in mountain glacier surface velocity, The Cryosphere, 17, 1567–1583, https://doi.org/10.5194/tc-17-1567-2023, 2023.
Nüsser, M., Schmidt, S., and Dame, J.: Irrigation and Development in the Upper Indus Basin: Characteristics and Recent Changes of a Socio-hydrological System in Central Ladakh, India, Mt. Res. Dev., 32, 51–61, https://doi.org/10.1659/MRD-JOURNAL-D-11-00091.1, 2012.
Oerlemans, J.: On the Response of Valley Glaciers to Climatic Change, in: Glacier Fluctuations and Climatic Change, vol. 6, edited by: Oerlemans, J., Springer Netherlands, Dordrecht, 353–371, https://doi.org/10.1007/978-94-015-7823-3_23, 1989.
Patel, L. K., Sharma, P., Singh, A. T., Pratap, B., Oulkar, S., and Thamban, M.: Spatial surface velocity pattern in the glaciers of Chandra Basin, Western Himalaya, Geocarto Int., 37, 5327–5344, https://doi.org/10.1080/10106049.2021.1920627, 2022.
Pellicciotti, F., Stephan, C., Miles, E., Herreid, S., Immerzeel, W. W., and Bolch, T.: Mass-balance changes of the debris-covered glaciers in the Langtang Himal, Nepal, from 1974 to 1999, J. Glaciol., 61, 373–386, https://doi.org/10.3189/2015jog13j237, 2015.
Pritchard, H. D.: Asia's shrinking glaciers protect large populations from drought stress, Nature, 569, 649–654, https://doi.org/10.1038/s41586-019-1240-1, 2019.
Pronk, J. B., Bolch, T., King, O., Wouters, B., and Benn, D. I.: Contrasting surface velocities between lake- and land-terminating glaciers in the Himalayan region, The Cryosphere, 15, 5577–5599, https://doi.org/10.5194/tc-15-5577-2021, 2021.
Rana, A. S., Kunmar, P., Mehta, M., and Kumar, V.: Glacier retreat, dynamics and bed overdeepenings of Parkachik Glacier, Ladakh Himalaya, India, Ann. Glaciol., 64, 254–267, https://doi.org/10.1017/aog.2023.50, 2023.
Rashid, I. and Majeed, U.: Recent recession and potential future lake formation on Drang Drung glacier, Zanskar Himalaya, as assessed with earth observation data and glacier modelling, Environ. Earth Sci., 77, 429, https://doi.org/10.1007/s12665-018-7601-5, 2018.
Reznichenko, N., Davies, T., Shulmeister, J., and McSaveney, M.: Effects of debris on ice-surface melting rates: an experimental study, J. Glaciol., 56, 384–394, https://doi.org/10.3189/002214310792447725, 2010.
RGI Consortium: Randolph Glacier Inventory – A Dataset of Global Glacier Outlines, Version 7, National Snow and Ice Data Center [data set], https://doi.org/10.5067/F6JMOVY5NAVZ, 2023.
Rounce, D. R., Hock, R., Maussion, F., Hugonnet, R., Kochtitzky, W., Huss, M., Berthier, E., Brinkerhoff, D., Compagno, L., Copland, L., Farinotti, D., Menounos, B., and McNabb, R. W.: Global glacier change in the 21st century: Every increase in temperature matters, Science, 379, 78–83, https://doi.org/10.1126/science.abo1324, 2023.
Sam, L., Bhardwaj, A., Kumar, R., Buchroithner, M. F., and Martín-Torres, F. J.: Heterogeneity in topographic control on velocities of Western Himalayan glaciers, Sci. Rep., 8, 12843, https://doi.org/10.1038/s41598-018-31310-y, 2018.
Satyabala, S. P.: Spatiotemporal variations in surface velocity of the Gangotri glacier, Garhwal Himalaya, India: Study using synthetic aperture radar data, Remote Sens. Environ., 181, 151–161, https://doi.org/10.1016/j.rse.2016.03.042, 2016.
Satyapragyan, S., Yadav, J. S., and Bhambri, R.: Bias corrections of ERA5 and ERA5-land temperature using automatic weather station data in the Higher Central Himalaya: implications for hydro-meteorological and glaciological research, J. Hydrol. Reg. Stud., 63, 103079, https://doi.org/10.1016/j.ejrh.2025.103079, 2026.
Scherler, D. and Strecker, M. R.: Large surface velocity fluctuations of Biafo Glacier, central Karakoram, at high spatial and temporal resolution from optical satellite images, J. Glaciol., 58, 569–580, https://doi.org/10.3189/2012JoG11J096, 2012.
Scherler, D., Leprince, S., and Strecker, M.: Glacier-surface velocities in alpine terrain from optical satellite imagery – Accuracy improvement and quality assessment, Remote Sens. Environ., 112, 3806–3819, https://doi.org/10.1016/j.rse.2008.05.018, 2008.
Scherler, D., Wulf, H., and Gorelick, N.: Global Assessment of Supraglacial Debris-Cover Extents, Geophys. Res. Lett., 45, https://doi.org/10.1029/2018GL080158, 2018a.
Scherler, D., Wulf, H., and Gorelick, N.: Supraglacial Debris Cover, V. 1.0., GFZ Data Services [data set], https://doi.org/10.5880/GFZ.3.3.2018.005, 2018b.
Schmidt, S. and Nüsser, M.: Changes of High Altitude Glaciers in the Trans-Himalaya of Ladakh over the Past Five Decades (1969–2016), Geosciences, 7, 27, https://doi.org/10.3390/geosciences7020027, 2017.
Shean, D. E., Bhushan, S., Montesano, P., Rounce, D. R., Arendt, A., and Osmanoglu, B.: A Systematic, Regional Assessment of High Mountain Asia Glacier Mass Balance, Front. Earth Sci., 7, 363, https://doi.org/10.3389/feart.2019.00363, 2020.
Shrivastava, D., Sangewar, C. V., Kaul, M. K., and Jamwal, K. S.: Mass balance of Rulung Glacier- a Trans-Himalayan glacier, Indus basin, Ladakh, in: Proc. Symp. Snow, Ice and Glacier, Symposium on Snow, Ice and Glacier, 41–46, 1999.
Shukla, A. and Garg, P. K.: Spatio-temporal trends in the surface ice velocities of the central Himalayan glaciers, India, Global Planet. Change, 190, 103187, https://doi.org/10.1016/j.gloplacha.2020.103187, 2020.
Singh Jasrotia, A., Ahmad, S., Ridwan, Q., Ahmad Wani, Z., Siddiqui, S., Siddiqua, A., and Ali Morfeine Aika, E.: Estimation of Surface Ice Velocity of Durung Drung Glacier, Western Himalaya using COSI-Corr from Landsat images, Egypt J. Remote Sens. Space Sci., 27, 369–381, https://doi.org/10.1016/j.ejrs.2024.04.006, 2024.
Soheb, M., Ramanathan, A., Angchuk, T., Mandal, A., Kumar, N., and Lotus, S.: Mass-balance observation, reconstruction and sensitivity of Stok glacier, Ladakh region, India, between 1978 and 2019, J. Glaciol., 66, 627–642, https://doi.org/10.1017/jog.2020.34, 2020.
Soheb, M., Ramanathan, A., Bhardwaj, A., Coleman, M., Rea, B. R., Spagnolo, M., Singh, S., and Sam, L.: Multitemporal glacier inventory revealing four decades of glacier changes in the Ladakh region, Earth Syst. Sci. Data, 14, 4171–4185, https://doi.org/10.5194/essd-14-4171-2022, 2022.
Stevens, N. T., Roland, C. J., Zoet, L. K., Alley, R. B., Hansen, D. D., and Schwans, E.: Multi-decadal basal slip enhancement at Saskatchewan Glacier, Canadian Rocky Mountains, J. Glaciol., 69, 71–86, https://doi.org/10.1017/jog.2022.45, 2023.
Sugiyama, S., Fukui, K., Fujita, K., Tone, K., and Yamaguchi, S.: Changes in ice thickness and flow velocity of Yala Glacier, Langtang Himal, Nepal, from 1982 to 2009, Ann. Glaciol., 54, 157–162, https://doi.org/10.3189/2013AoG64A111, 2013.
Sutherland, J. L., Carrivick, J. L., Gandy, N., Shulmeister, J., Quincey, D. J., and Cornford, S. L.: Proglacial Lakes Control Glacier Geometry and Behavior During Recession, Geophys. Res. Lett., 47, e2020GL088865, https://doi.org/10.1029/2020GL088865, 2020.
Thayyen, R. J. and Gergan, J. T.: Role of glaciers in watershed hydrology: a preliminary study of a “Himalayan catchment,” The Cryosphere, 4, 115–128, https://doi.org/10.5194/tc-4-115-2010, 2010.
The GlaMBIE Team, Zemp, M., Jakob, L., Dussaillant, I., Nussbaumer, S. U., Gourmelen, N., Dubber, S., A, G., Abdullahi, S., Andreassen, L. M., Berthier, E., Bhattacharya, A., Blazquez, A., Boehm Vock, L. F., Bolch, T., Box, J., Braun, M. H., Brun, F., Cicero, E., Colgan, W., Eckert, N., Farinotti, D., Florentine, C., Floricioiu, D., Gardner, A., Harig, C., Hassan, J., Hugonnet, R., Huss, M., Jóhannesson, T., Liang, C.-C. A., Ke, C.-Q., Khan, S. A., King, O., Kneib, M., Krieger, L., Maussion, F., Mattea, E., McNabb, R., Menounos, B., Miles, E., Moholdt, G., Nilsson, J., Pálsson, F., Pfeffer, J., Piermattei, L., Plummer, S., Richter, A., Sasgen, I., Schuster, L., Seehaus, T., Shen, X., Sommer, C., Sutterley, T., Treichler, D., Velicogna, I., Wouters, B., Zekollari, H., and Zheng, W.: Community estimate of global glacier mass changes from 2000 to 2023, Nature, 639, 382–388, https://doi.org/10.1038/s41586-024-08545-z, 2025.
Tripathi, N., Singh, S. K., Rathore, B. P., Oza, S. R., and Bahuguna, I. M.: Topographical and morphological variability explicates the regional heterogeneity in glacier surface ice velocity across Karakoram-Himalaya, Remote Sens. Appl. Soc. Environ., 29, 100892, https://doi.org/10.1016/j.rsase.2022.100892, 2023.
Troilo, F., Dematteis, N., Zucca, F., Funk, M., and Giordan, D.: Monthly velocity and seasonal variations of the Mont Blanc glaciers derived from Sentinel-2 between 2016 and 2024, The Cryosphere, 18, 3891–3909, https://doi.org/10.5194/tc-18-3891-2024, 2024.
Tucker, C. J., Grant, D. M., and Dykstra, J. D.: NASA's Global Orthorectified Landsat Data Set, Photogramm. Eng. Rem. S., 70, 313–322, https://doi.org/10.14358/PERS.70.3.313, 2004.
Vincent, C., Gilbert, A., Walpersdorf, A., Gimbert, F., Gagliardini, O., Jourdain, B., Roldan Blasco, J. P., Laarman, O., Piard, L., Six, D., Moreau, L., Cusicanqui, D., and Thibert, E.: Evidence of Seasonal Uplift in the Argentière Glacier (Mont Blanc Area, France), J. Geophys. Res.-Earth, 127, e2021JF006454, https://doi.org/10.1029/2021JF006454, 2022.
Viviroli, D., Archer, D. R., Buytaert, W., Fowler, H. J., Greenwood, G. B., Hamlet, A. F., Huang, Y., Koboltschnig, G., Litaor, M. I., López-Moreno, J. I., Lorentz, S., Schädler, B., Schreier, H., Schwaiger, K., Vuille, M., and Woods, R.: Climate change and mountain water resources: overview and recommendations for research, management and policy, Hydrol. Earth Syst. Sci., 15, 471–504, https://doi.org/10.5194/hess-15-471-2011, 2011.
Wagnon, P., Linda, A., Arnaud, Y., Kumar, R., Sharma, P., Vincent, C., Pottakkal, J. G., Berthier, E., Ramanathan, A., Hasnain, S. I., and Chevallier, P.: Four years of mass balance on Chhota Shigri Glacier, Himachal Pradesh, India, a new benchmark glacier in the western Himalaya, J. Glaciol., 53, 603–611, https://doi.org/10.3189/002214307784409306, 2007.
Weertman, J.: On the Sliding of Glaciers, J. Glaciol., 3, 33–38, https://doi.org/10.3189/S0022143000024709, 1957.
Wester, P., Mishra, A., Mukherji, A., and Shrestha, A. B. (Eds.): The Hindu Kush Himalaya Assessment: Mountains, Climate Change, Sustainability and People, Springer International Publishing, Cham, https://doi.org/10.1007/978-3-319-92288-1, 2019.
World Glacier Monitoring Service (WGMS): FLUCTUATIONS OF GLACIERS DATABASE, World Glacier Monitoring Service (WGMS), https://doi.org/10.5904/WGMS-FOG-2023-09, 2023.
Wu, K., Liu, S., Zhu, Y., Liu, Q., and Jiang, Z.: Dynamics of glacier surface velocity and ice thickness for maritime glaciers in the southeastern Tibetan Plateau, J. Hydrol., 590, 125527, https://doi.org/10.1016/j.jhydrol.2020.125527, 2020.
Zhang, G., Bolch, T., Yao, T., Rounce, D. R., Chen, W., Veh, G., King, O., Allen, S. K., Wang, M., and Wang, W.: Underestimated mass loss from lake-terminating glaciers in the greater Himalaya, Nat. Geosci., 16, 333–338, https://doi.org/10.1038/s41561-023-01150-1, 2023.
Zhang, J., Jia, L., Menenti, M., and Ren, S.: Interannual and Seasonal Variability of Glacier Surface Velocity in the Parlung Zangbo Basin, Tibetan Plateau, Remote Sens., 13, 80, https://doi.org/10.3390/rs13010080, 2020.
Zhou, Y., Chen, J., and Cheng, X.: Glacier Velocity Changes in the Himalayas in Relation to Ice Mass Balance, Remote Sens., 13, 3825, https://doi.org/10.3390/rs13193825, 2021.