the Creative Commons Attribution 4.0 License.
the Creative Commons Attribution 4.0 License.
 | 15 Jun 2026
A high-resolution snow dataset for Switzerland (2016–2025) combining physics-based simulations and in situ observations
Bertrand Cluzet
Jan Magnusson
Giulia Mazzotti
Rebecca Mott
Louis Quéno
Clare Webster
Tobias Zolles
Tobias Jonas
We present a high-resolution snow dataset that provides daily estimates of snow depth, snow water equivalent, snow cover fraction, and snowmelt runoff for Switzerland and hydrologically connected bordering regions, covering water years 2016–2025. The dataset is based on fully distributed simulations at 250 m resolution using the multi-layer, physics-based snow model FSM2OSHD, operated by the Swiss Operational Snow Hydrological Service. To capture the high spatial heterogeneity of snow cover dynamics in complex mountainous terrain, the modeling framework combines dedicated dynamical and statistical downscaling of numerical weather prediction data with the upscaling of hyper-resolution terrain, forest, and light-availability datasets, explicitly accounting for subgrid variability. The particle filter-based assimilation of in situ snow depth observations from 444 monitoring stations across the domain dynamically corrects spatiotemporal error patterns in the meteorological forcing data. This approach ensures consistent input data quality over the entire 10-year period and mitigates potential discontinuities caused by changes within the numerical weather prediction system. Example applications demonstrate the dataset's ability to capture regional and interannual variability of snow water resources, snow cover extent, and snow duration. With 10 years of physically consistent estimates at high spatial and temporal resolution, this dataset represents, to our knowledge, the most accurate and comprehensive record of snow cover dynamics for Switzerland to date. It expands the snow data record for the European Alps and bridges the gap between coarse global reanalyses and detailed local observations. The dataset is publicly and freely available providing a valuable resource for a wide range of scientific and applied studies in hydrology, ecology, climate, and cryospheric research.
- Article
(10275 KB) - Full-text XML
- BibTeX
- EndNote


Seasonal snow drives numerous hydrological and ecological processes (Han et al., 2024; Hale et al., 2023; Slatyer et al., 2022) and affects many socioeconomic aspects (Rasul and Molden, 2019). Snow-cover extent, as well as timing and intensity of snowmelt, have a direct impact on avalanche and flood hazards (Musselman et al., 2018; Li et al., 2019; Eckert et al., 2024), freshwater availability (Musselman et al., 2021; Siirila-Woodburn et al., 2021), hydropower production (Magnusson et al., 2020; Hou et al., 2025), and winter tourism (Moreno-Gené et al., 2018; Morin et al., 2021). However, estimating snow water resources in mountainous regions is particularly challenging due to the substantial spatial variability of the terrain and the snowpack (Grünewald et al., 2010; López-Moreno et al., 2013; Mott et al., 2018), the lack of accurate distributed measurements (Dozier et al., 2016; Gascoin et al., 2024), and the uncertainties inherent in snowpack estimated from numerical models (Menard et al., 2021).
The mountain snowpack remains severely undersampled despite continuous monitoring efforts (Largeron et al., 2020). Detailed, high-resolution hydrometeorological and snow datasets exist for small catchments, such as the Dischma catchment in Switzerland (Magnusson et al., 2025), the Izas catchment in the Spanish Pyrenees (Revuelto et al., 2017), or the Johnston Draw catchment in Idaho, USA (Godsey et al., 2018), but their spatial coverage is limited. Similarly, airborne lidar- or photogrammetry-based snow depth maps are available only for a few select catchments and at specific times during the season (Painter et al., 2016; Bührle et al., 2023). For larger scales and with roughly weekly temporal resolution, spaceborne optical sensors provide observations of snow cover extent and snow cover fraction (SCF) (Gascoin et al., 2019), but cannot provide direct information on snow depth or snow water equivalent (SWE). The NorSWE dataset (Mortimer and Vionnet, 2025) compiles SWE observations from more than 10 000 locations across the Northern Hemisphere over three decades, with the Alps represented by manual point measurements from 11 sites in Switzerland only. Spatially explicit snow depth observations from Sentinel-1 retrievals are possible under dry-snow conditions (Lievens et al., 2019, 2022), but truly reliable, high-resolution, spatiotemporally continuous SWE estimates remain elusive (Gascoin et al., 2024; Mortimer et al., 2020). While numerical models can provide such continuous estimates at any desirable spatial and temporal resolution, they are subject to inherent uncertainties in the parametrization and forcing data (Günther et al., 2019; Menard et al., 2021).
Reanalysis products provide estimates of past states by constraining numerical simulations through the assimilation of observational datasets. While global reanalyses within numerical weather prediction (NWP) systems, such as ECMWF's ERA5 (Hersbach et al., 2020), are widely used for climate monitoring, their snow-related variables offer only low resolution and accuracy in mountainous regions (Li et al., 2022; Monteiro and Morin, 2023; Kouki et al., 2023). Fiddes et al. (2019) presented an efficient method that couples sub-grid clustering of complex terrain, downscaling of global meteorological reanalysis data, and the assimilation of spaceborn SCF observations, to enable high-resolution ensemble-based snow reanalyses in mountain regions. Other recent efforts in the snow modeling community have produced detailed and dedicated long-term snowpack reanalysis datasets: the modeling and data assimilation system SNODAS provides daily snowpack and precipitation data at 1 km resolution over the contiguous US from 2003 onward (Barrett, 2003); daily estimates of SWE and SCF based on the assimilation Landsat SCF observations into a land surface model, coupled with a snow depletion curve, are available for the Sierra Nevada (Margulis et al., 2016) and the western US (Fang et al., 2022), at a resolution of 90 and 500 m, respectively; a similar dataset based on the joint assimilation of Landsat and MODIS SCF observations is available for High Mountain Asia (Liu et al., 2021); a daily 10 km gridded snow depth and SWE estimates over the Iberian Peninsula since 1980 are available based on the physics-based snow model FSM forced with downscaled ERA-interim data (Alonso-González et al., 2018, and references therein); daily 1 km gridded estimates of snow depth and snow cover duration between 1961–2020 are available for Austria, based on simulations of the SNOWGRID model in a climate configuration forced with gridded meteorological observations (Olefs et al., 2020); the IT-SNOW reanalysis provides daily estimates of snow states for Italy from water year 2010 onward by combining model simulations with in-situ and spaceborne osbervations (Avanzi et al., 2023); the S2M meteorological and snow cover reanalysis combines the meteorological analysis SAFRAN and the high complexity snow model Crocus within the SURFEX/ISBA land surface model, covering the semi-distributed massifs of the French Alps, Pyrenees, and Corsica from 1958 onwards (Vernay et al., 2022, and references therein).
Here, we present a continuous 10-year snow reanalysis dataset for Switzerland and hydrologically connected bordering regions, produced within the near-real-time modeling framework of the Swiss Operational Snow Hydrological Service (OSHD). The dataset provides daily estimates of snow depth, SWE, SCF, and snowmelt runoff by combining high-resolution simulations from the intermediate-complexity, physics-based snow model FSM2OSHD (Mott et al., 2023) with in situ snow depth observations from 444 stations (Oberrauch et al., 2024). To capture the high spatial variability of snow processes in complex Alpine terrain, the modeling chain employs dedicated dynamical and statistical downscaling of NWP forcing data to a spatial resolution of 250 m, solves the coupled mass- and energy-balance equation for multiple numerical snow layers, and explicitely accounts for differences in the atmospheric and snowpack procsesses of open, forested, and glaciated areas (Mazzotti et al., 2021). The simulations are based on upscaled versions of the most accurate hyper-resolution datasets currently available, including a 10 m digital elevation model and terrain surface model (swissALTIRegio, 2025; swissSurface3D, 2025), as well as a 1 m canopy height model and light availability maps that resolve terrain and vegetation shading down to individual trees for every hour of the year (Webster et al., 2025). Temporal consistency across the whole period is ensured through an assimilation scheme that homogenizes meteorological inputs despite changes in the source and processing level of the forcing data (Oberrauch et al., 2025; MeteoSwiss, 2024). The model has been tuned and validated continuously over the past decade against snow depth, SWE, SCF, and new snow observations from a dense station network (Mott et al., 2023; Cluzet et al., 2024; Haagmans et al., 2026).
To our knowledge, this dataset represents the most accurate and comprehensive snow reanalysis for Switzerland to date. By providing 10 years of physically consistent estimates of snow cover dynamics at a subkilometric resolution across a large part of the European Alps, it contributes to the snow database of a region characterized by highly complex terrain and diverse hydroclimatic regimes. The dataset helps bridge existing scale and knowledge gaps between coarse global products (e.g. Hersbach et al., 2020) and detailed local observations (e.g. Magnusson et al., 2025) and provides a robust foundation for hydrological, ecological, and cryospheric analyses (e.g. Jenicek et al., 2016; Xie et al., 2018; Floriancic et al., 2020; Publications Office of the European Union, 2023). The data is publicly and freely available under https://doi.org/10.5281/zenodo.17313889 (Oberrauch et al., 2026), offering substantial value to a wide range of scientific and applied users.
The basis for the presented dataset is the fully distributed, physics-based, multi-layer snow model FSM2OSHD (Mott et al., 2023), operated by the Swiss Operational Snow Hydrological Service (OSHD). Forcing data from the Federal Office of Meteorology and Climatology, MeteoSwiss, are debiased and downscaled to the 250 m model resolution and dynamically corrected through the assimilation of in situ snow depth observations (Oberrauch et al., 2024). The following section provides a brief overview of the study area, the datasets used, the modeling chain, and the particle filter (PF) based assimilation scheme.
2.1 Study area
The presented dataset spans Switzerland and hydrologically connected neighboring regions of Austria, France, Germany, Italy, and Liechtenstein (Fig. 1). The model domain has a latitudinal and longitudinal extent of 272 and 365 km, respectively. It comprises 928 155 grid cells at a spatial resolution of 250 m, for a total area of over 58 000 km2. Model elevations range from 180 to 4750 m, with 50 % of the grid points located above 966 m. Roughly 40 % of the domain is forested, with forest cover extending up to 2400 m, although less than half of the forest is situated above 1000 m (Szerencsits, 2012; Haagmans et al., 2026).
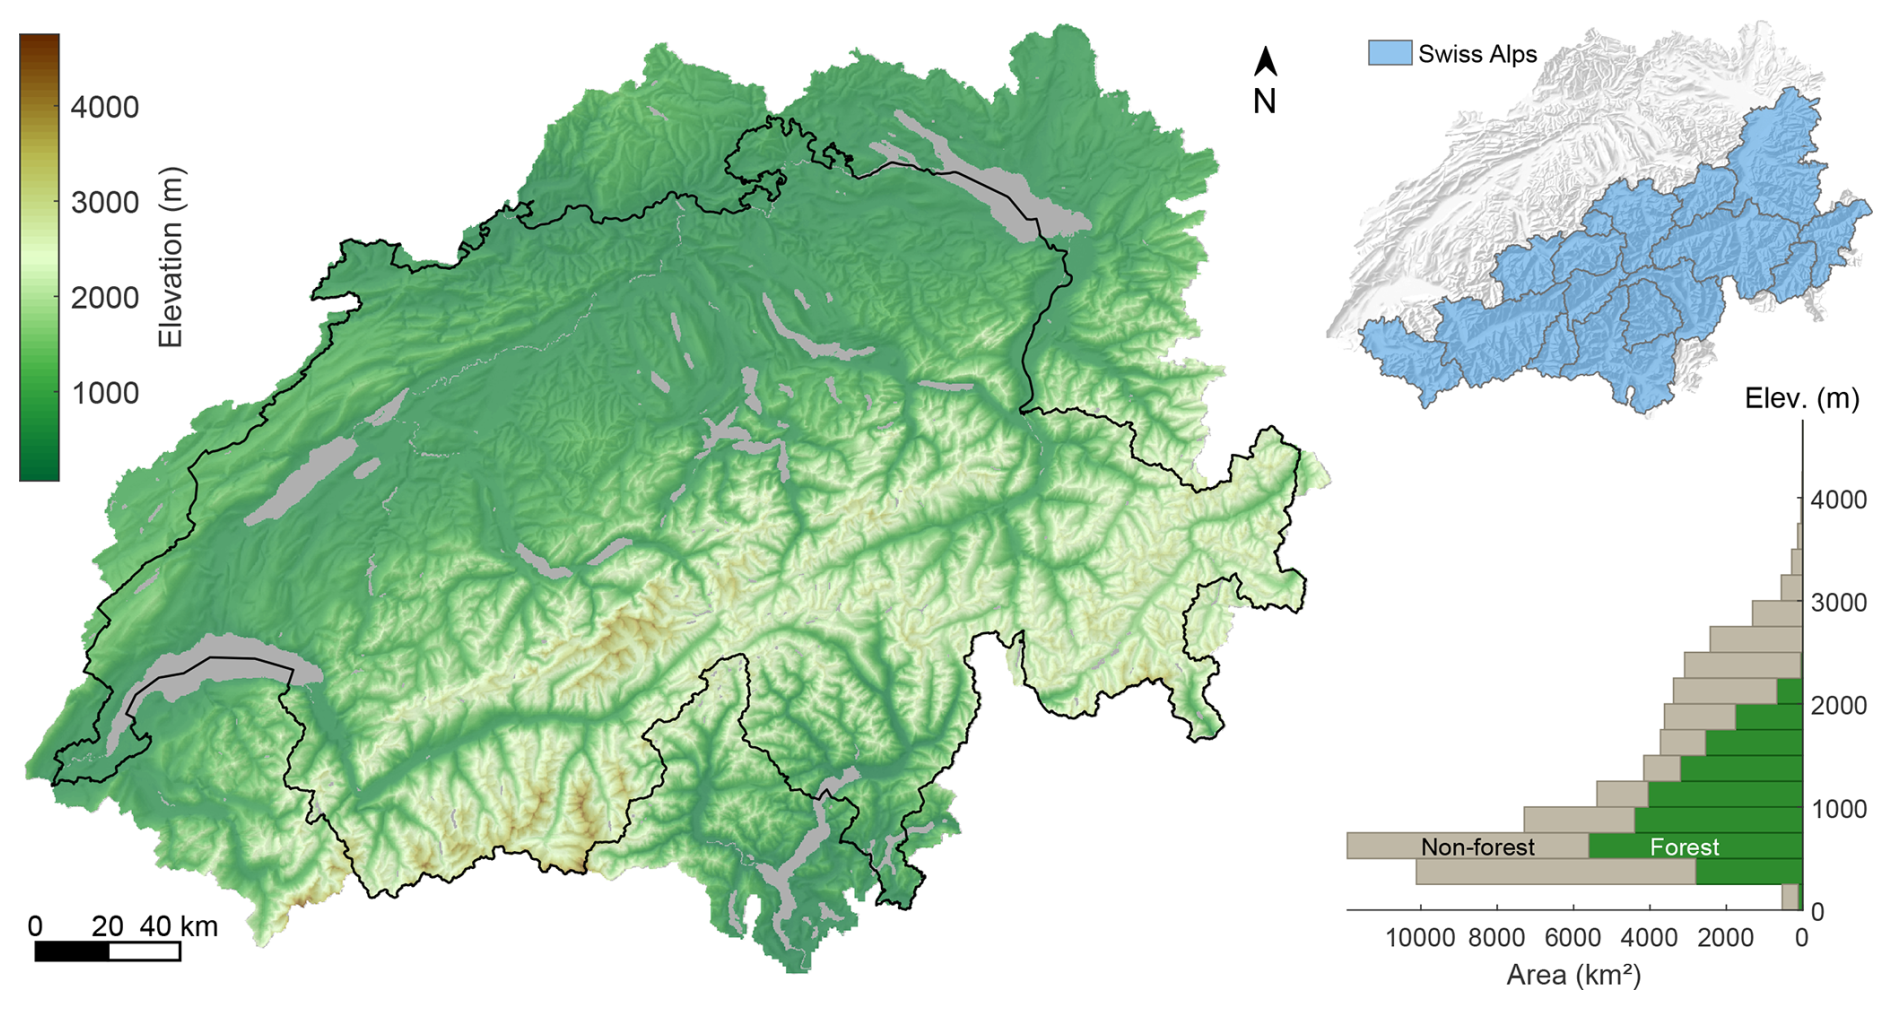
Figure 1Terrain representation of the model domain based on the 250 m resolution digital elevation model. Major water bodies are shown in grey, the Swiss national border is outlined in black, and a shaded relief is used as a background map. The bottom-right inset panel displays the areal distribution of the domain across 250 m elevation bands, with forest and non-forest fractions shown in green and beige, respectively. The top-right inset panel shows the 16 hydrological units, collectively referred to as the Swiss Alps, used for validation against spaceborne SCF observations.
Switzerland lies in Central Europe and spans both sides of the European Alps and the adjacent lowlands, each characterized by distinct hydroclimatic regimes. The Alpine Main Ridge forms a climatic divide between Mediterranean air masses to the south and Atlantic air masses to the north (Gubler et al., 2023). Precipitation is generally high in the Alps, the Alpine foothills, and the Jura mountains (in the northwest of the country), with annual totals of around 2000 mm. In contrast, certain inner-Alpine valleys are sheltered from moist air masses and are therefore comparatively dry, with annual totals of about 700 mm or less (MeteoSwiss, 2025). Figure 2 displays average monthly air temperature and solid precipitation aggregated into four elevation bands, based on the forcing data over the presented 10-year period (with the interannual variability indicated by shadings).
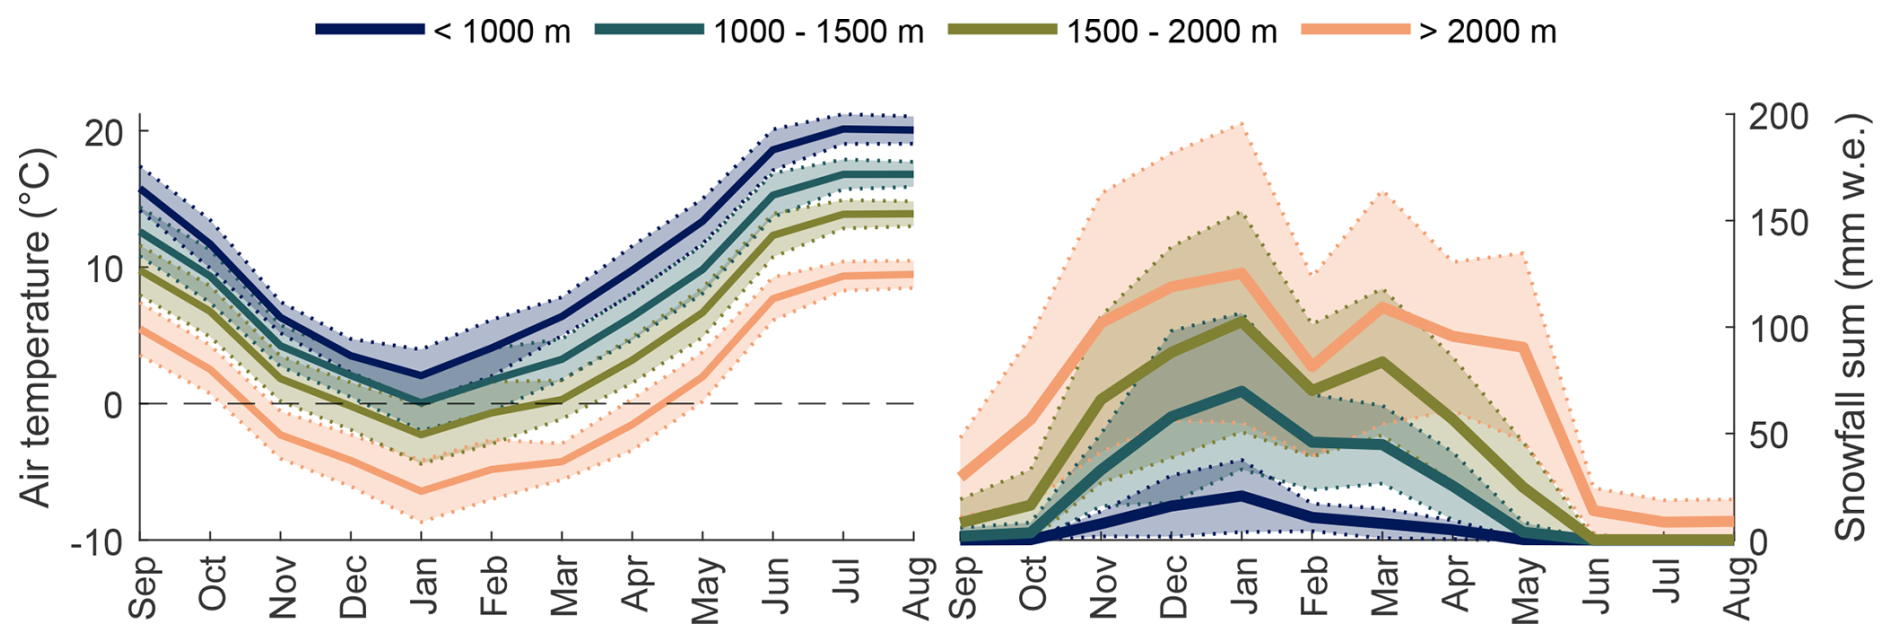
Figure 2Monthly climatology of near-surface air temperature (left) and snowfall sums (right) stratified by elevation bands over the period between September 2015–August 2025, based on the meteorological forcing data. Results are averaged over all model grid points within the respective elevation bands. Solid lines represent mean values, while the shading indicates the standard deviation across the 10 seasons.
2.2 Used datasets
MeteoSwiss officially replaced its operational forecasting model in June 2024 (MeteoSwiss, 2024), shifting from COSMO (Baldauf et al., 2011) to ICON (Zängl et al., 2015) as the dynamical core. Moreover, ICON data was reprocessed for a transitional period between 2020–2024. ICON is the higher-resolution successor to COSMO, and provides an improved representation of terrain-induced variability (Zängl et al., 2015; MeteoSwiss, 2023). Hence, for the water years 2016–2020, we used analysis data from COSMO, while from 2021 onward, ICON data were employed at different processing levels: (re-)forecast data for the water years 2021–2023 and analysis data from 2024 onward. Oberrauch et al. (2025) demonstrated that correcting spatiotemporal error patterns in the forcing data through the assimilation of point observations homogenizes snow model performance. Thereby, potential temporal discontinuities arising from changes in the forcing data sources are mitigated, as detailed below in Sect. 2.4.
The hourly NWP data are downscaled from 1 km to the 250 m model resolution using various statistical and dynamic downscaling schemes (outlined below in Sect. 2.3), all based on a detailed land-use and land-cover datasets. The basis is the swissALTIRegio digital elevation model (DEM) with a resolution of 10 m (swissALTIRegio, 2025), used to compute the 250 m model DEM, as well as the topographic position index, slope, aspect, and subgrid terrain variability for each grid cell. The CORINE land cover dataset (European Union's Copernicus Land Monitoring Service information, 2020) was used to distinguish between open, forested, and glaciated areas, which are handled differently by the FSM2OSHD model (outlined below in Sect. 2.3). Large water bodies where snow does not accumulate are excluded from the domain, indicated as grey areas in Fig. 1 and subsequent figures.
The SwissRad10 dataset provides domain-wide estimates of direct and diffuse radiation at 10 m resolution across Switzerland, accounting for vegetation and terrain shadowing as well as the sky view fraction (Webster et al., 2025). The dataset is derived from high-resolution airborne lidar data that resolves individual trees (swissSurface3D, 2025), using the Canopy Radiation Model (Webster et al., 2023). It provides a terrain-only scenario, as well as leaf-on and leaf-off canopy scenarios (of which only the latter is used in FSM2OSHD) at hourly resolution over a full annual solar cycle.
The assimilation scheme (see Sect. 2.4) uses snow depth observations from a network of 444 monitoring stations across Switzerland and neighboring regions in Germany, Austria, Liechtenstein, Italy, and France, spanning an elevation range from 230 to 2950 m (with 50 % above 1300 m). All stations are in flat, open areas, while locations known for unrepresentative snow conditions (e.g. due to strong snow drift) are excluded. The data are manually quality-controlled, including the removal of obvious outlier observations and the filling of small data gaps (informed by observations from neighboring stations). Snow depth observations are reported daily, with less than 2 % of station-days missing over the 444 stations and 10 years.
Spaceborne SCF maps derived from Sentinel-2 data, provided by the AlpSnow science activity within ESA's Alpine Regional Initiative (European Space Agency, 2025), are used for an independent evaluation of the dataset. The SCF retrievals are based on multi-spectral unmixing of Level-1C reflectance data for improved snow detection in shaded areas (Keuris et al., 2023), while clouds, glaciers, forests, and urban areas are masked out to mitigate inherent limitations of optical sensors, following the methods of Cluzet et al. (2024). As these data are available to us only for the water years 2018–2025, they have not been assimilated in order to avoid temporal discontinuities in the final dataset (as discussed in Sect. 4).
2.3 The OSHD modeling chain
FSM2OSHD is a multi-layer, physics-based model solving the coupled mass and energy balance for individual numerical snow layers at an hourly resolution, without directly accounting for snow microstructures and metamorphism (Mott et al., 2023). FSM2OSHD was originally based on the Flexible Snow Model (FSM2, Essery, 2015; Essery et al., 2025), incorporating additional process-based refinements adapted and tuned for the application within the OSHD.
The implemented snowpack process parameterizations (FSM2OSHD code available at https://doi.org/10.5281/zenodo.20410047, Mott et al., 2026) are briefly outlined below; please refer to Mott et al. (2023, and references therein) for more detailed information. Fresh snow density in the model is estimated from air temperature and wind speed during snowfall (Vionnet et al., 2012), tuned against snow board measurements, which capture the depth and weight of snow accumulated over a period of 24 h (Fierz et al., 2009; Haberkorn, 2019). Since such measurements inherently include initial settling, the tuning accounts for both fresh snow density and compaction over the first 24 h. The settling of the snowpack and the associated changes in snow density are computed via a viscosity-based overburden scheme adapted from Vionnet et al. (2012). Increasing snow weight compresses the underlying layers depending on the layer's viscosity, which, in turn, depends on layer density, temperature, and liquid water content. Thermal conductivity between snow layers is diagnosed from snow density (Douville et al., 1995; Essery, 2015), while the ground heat flux is estimated using a five-layer soil model (Cox et al., 1999; Essery, 2015). Turbulent fluxes at the snow–atmosphere boundary are parameterized following Essery (2015, Sect. 2.3.4), with transfer coefficients adjusted according to the Richardson number (Ri, Louis, 1979) and capped at Ri=0.2 to prevent an unrealistic stability-induced shutdown of the turbulent exchange. Liquid water retention in each layer follows a bucket-storage approach, with the storage capacity depending on the snow density (Anderson, 1976; Boone and Etchevers, 2001). Broadband snow albedo is computed with a snow-age-dependent decay function, following a linear rate for cold snow and an exponential rate for melting snow (Douville et al., 1995). Albedo values are reset to their maximum fresh-snow values after a minimum of 10 new snow accumulation over 24 h. Additional tuning accounts for bare ground piercing through thin snowpacks, as well as aspect- and slope-dependent differences in the albedo decay based on a comparison with spaceborne snow wetness and SCF observations (Cluzet et al., 2024). SCF in open, non-forested areas is estimated by tracking the seasonal evolution of snow depth and SWE depending on subgrid terrain variability (Helbig et al., 2021), while a simpler hyperbolic tangent model is applied within forests (Essery, 2015).
FSM2OSHD differentiates between open, forested, and glaciated terrain by simulating the snow cover separately for each land cover type and aggregating the results as a weighted average according to the respective land cover fractions within each grid cell. Glaciated terrain is simulated analogously to open terrain but with a modified ground heat flux and roughness length. For forest-covered grid cells, FSM2OSHD explicitly accounts for key snow–canopy and canopy–atmosphere interactions, including snowfall interception, snow unloading and sublimation from the canopy, shortwave radiation transmission, longwave radiation enhancement, and wind attenuation (Mazzotti et al., 2020a, 2021; Essery et al., 2025). Forest processes and vegetation shading extend beyond the forest edges, thereby influencing adjacent open terrain.
The hourly NWP data are bias corrected and downscaled to the 250 m model grid and station locations (see Sect. 4 and Table 1 in Mott et al., 2023) by statistically downscaling the wind fields (Winstral et al., 2017), dynamically downscaling the radiation input (Jonas et al., 2020; Webster et al., 2025), and linearly interpolating air temperature, relative humidity, and precipitation with corresponding lapse rate corrections. Slope-dependent precipitation adjustments account for not explicitly resolved redistribution processes in mountainous terrain (Griessinger et al., 2016). Precipitation is further partitioned into rain and snow based on air temperature Tair using a logistic function (Kavetski and Kuczera, 2007; Magnusson et al., 2014; Oberrauch et al., 2024). The fraction of solid precipitation fsolid is computed as
where Tthresh is the temperature threshold defining the transition from predominantly solid to liquid precipitation, and mp controls the width of the mixed-phase precipitation range. The fraction of liquid precipitation is then given by . For COSMO data, Tthresh=1.04 °C and mp=0.15 °C are fixed parameters. Since ICON already provides solid and liquid precipitation as separate quantities, instead we infer Tthresh for each 1 km ICON grid cell such that fsolid matches the rain-snow partitioning of the ICON model output. The infered temperature threshold can then be interpolated to the 250 m model grid and applied to compute fsolid at high resolution. Note that this partitioning scheme allows for adjustments of the precipitation phase through perturbations of air temperature during the assimilation step (Sect. 2.4).
Analogous to the operational products of the OSHD, the presented dataset represents seasonal snow for individual water years, defined as the period from 1 September to 31 August of the following year. Accordingly, at the beginning of each water year, all snow is removed, disregarding the buildup of any perennial snow and firn at high elevations and on glaciers. A one-year spin-up simulation is performed to initialize the soil layer temperatures for the water year 2016. Subsequently, the end-of-season soil temperatures are used to initialize the following season.
2.4 Particle-filter-based assimilation
The particle filter (PF, Chopin and Papaspiliopoulos, 2020) is a Bayesian data assimilation method that estimates the state of a system from a weighted set of ensemble members, referred to as particles. The ensemble simulation represents the initial uncertainty of the prior estimate. Particle weights are sequentially updated based on the likelihood of the given observation, under the assumption that the respective particle represents the true state of the system. The resulting posterior distribution combines prior information and observations, accounting for their respective uncertainties. Particles are propagated from one assimilation step to the next according to the model dynamics, with a potential resampling step to ensure adequate dispersion. Given spatially correlated priors, it is possible to update unobserved locations indirectly (e.g. Cluzet et al., 2022; Odry et al., 2022; Alonso-González et al., 2023).
We employ the PF-based assimilation scheme described by Oberrauch et al. (2024) to correct spatiotemporal error patterns in the meteorological forcing data by assimilating point snow depth observations from 444 stations across the domain. Local corrections are inferred independently for each station location and three-day assimilation window, and subsequently interpolated to unobserved locations across the domain. The assimilation procedure is performed on a separate “offline” set of point simulations, allowing for computationally efficient updates of the fully distributed simulations over such a large domain without the need for a gridded ensemble (see Fig. 3 for an overview of the modeling and assimilation workflow).
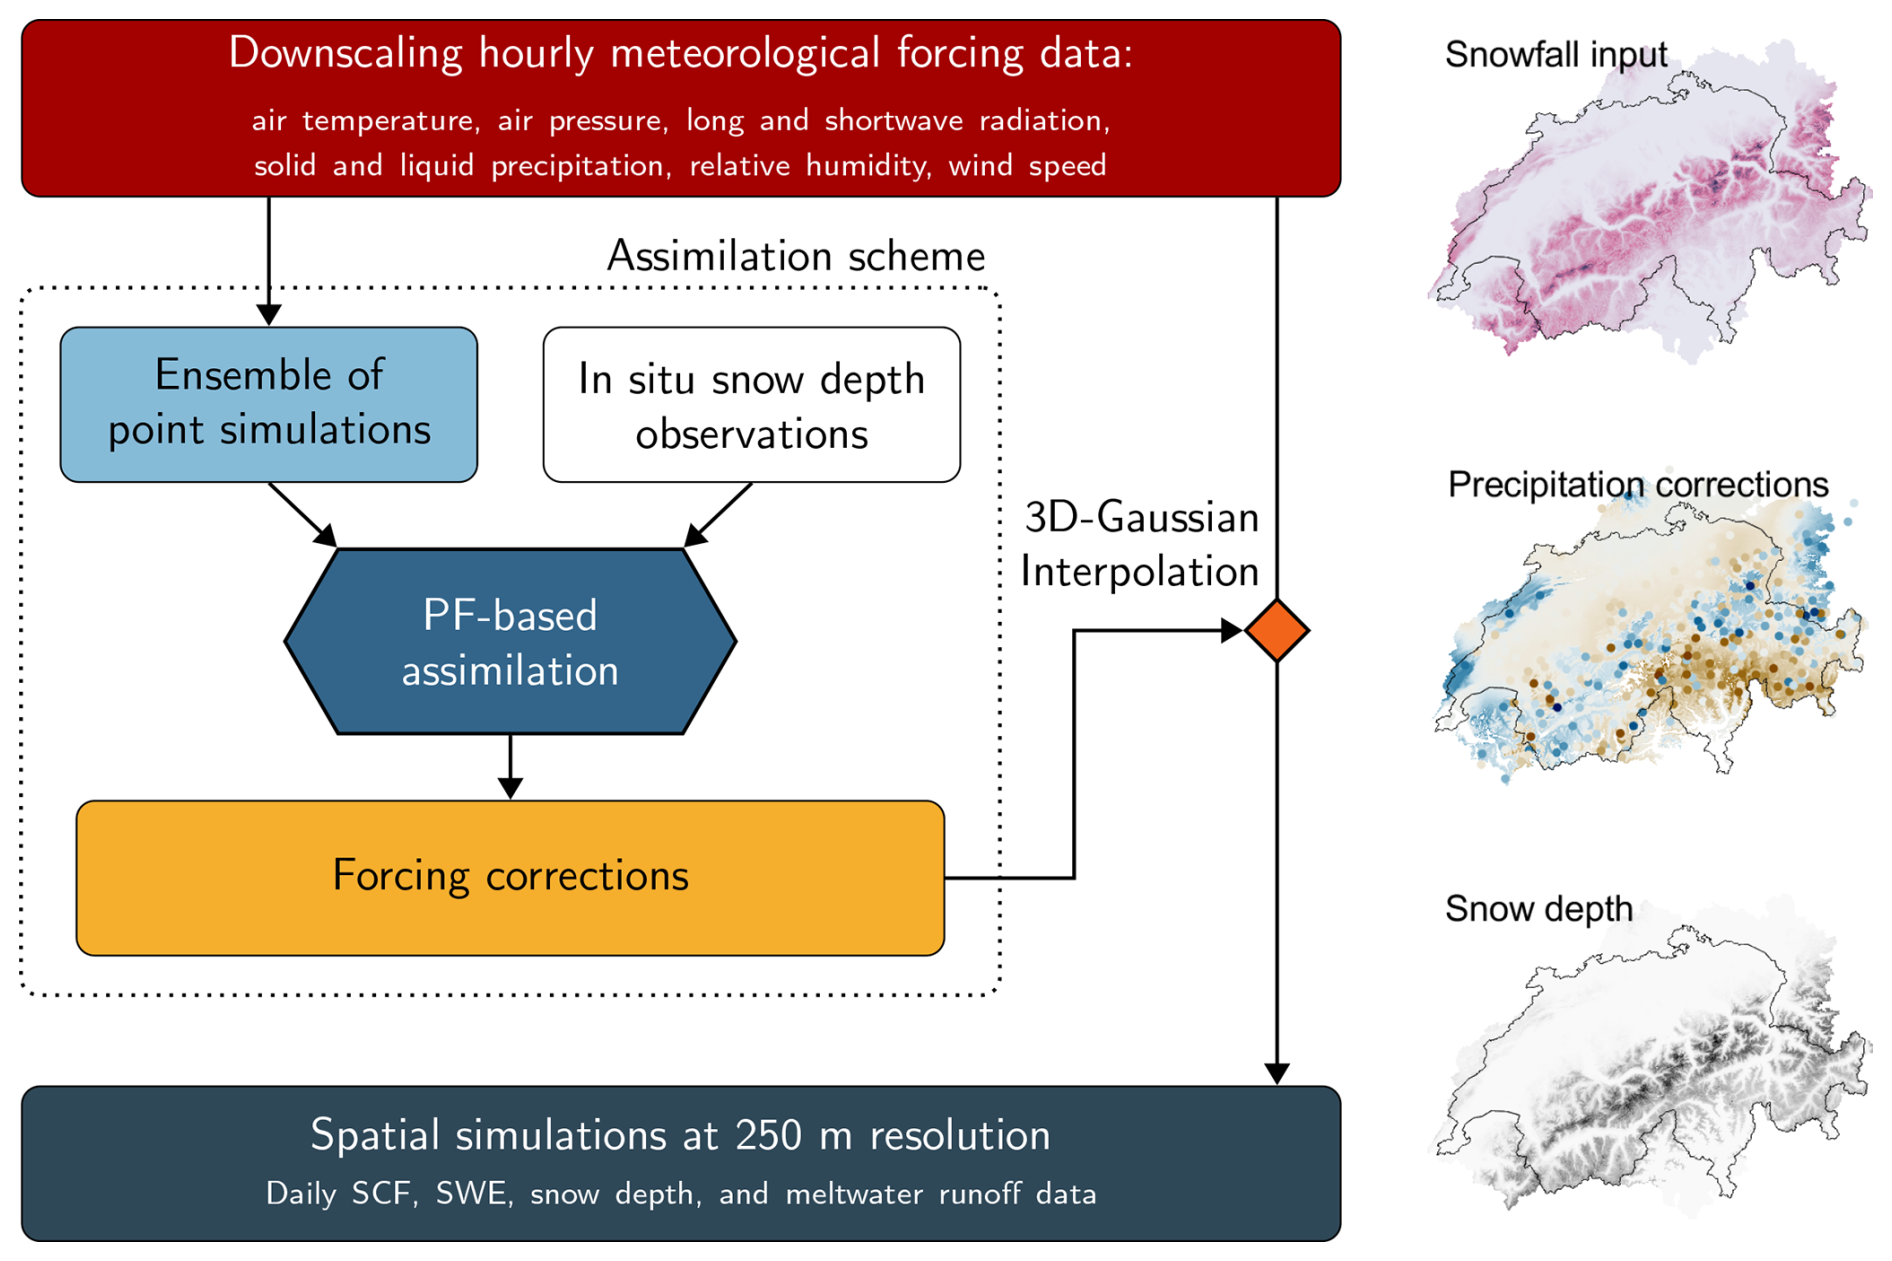
Figure 3Simplified flowchart of the modeling chain, including the PF-based assimilation scheme to correct meteorological forcing inputs.
The prior ensemble is generated by stochastically perturbing incoming longwave radiation and air temperature additively, and precipitation amount multiplicatively via a scaling factor. This perturbation strategy provides direct and largely independent handles on the radiative energy budget, as well as the amount and phase of precipitation (the latter via small perturbations of air temperature via Eq. 1), thereby minimizing equifinality issues (Oberrauch et al., 2024). Oberrauch et al. (2025) showed that the best results were achieved by allowing sufficient flexibility in correcting the given forcing variables, while additional perturbation of model parameters, namely the snow viscosity, did not notably improve the final estimate. Accordingly, to create this dataset, we applied the “METEO” perturbation strategy from Oberrauch et al. (2025), which uses less constrained perturbation priors. The additive perturbations of longwave radiation and air temperature are drawn from normal distributions with zero mean and standard deviations of and σTA=2.73 °C, respectively. The precipitation scaling factors are drawn from a log-normal distribution with parameters μPR=0 and σPR=1.174. In all cases, only the central 80 % of the respective distributions are sampled to exclude extreme perturbations (Oberrauch et al., 2025). Further details are given in Sect. 2.8 and Tables 2 and 3 of Oberrauch et al. (2025).
For each station and assimilation window, a set of optimal forcing corrections is defined based on the probability density distribution of the perturbation posterior. At the end of each three-day assimilation window, the posterior distribution is computed from the weight of each particle ωi based on the difference between simulated snow depth and observed value dobs:
The observation uncertainty σobs is set to 5 % of the observed snow depth, with upper and lower bounds of 5 and 20 cm, respectively. The most conservative local mode of the resulting multivariate distribution, i.e. the point with the highest probability density closest to the unperturbed state, is chosen as the optimal set of forcing corrections. For a more in-depth explanation, please refer to Oberrauch et al. (2024, Sect. 2.4.1). This deliberate collapse of the probabilistic information onto a deterministic estimate forms the basis for the subsequent propagation of the inferred information to unobserved locations.
The independently inferred local forcing corrections are interpolated spatially using a three-dimensional Gaussian interpolation scheme (Jörg-Hess et al., 2014; Oberrauch et al., 2024). The corrections at each grid point are a weighted average of all stations within a 35 km radius, weighted by the three-dimensional distance to the station locations, with vertical distances scaled by a factor γ=50 relative to the horizontal distance (following Oberrauch et al., 2024, Sect. 2.4.3). The gridded corrections obtained from the spatial interpolation are then applied to the downscaled gridded meteorological input data, forcing the distributed simulations.
The assimilation scheme notably improves snowpack simulations at unobserved locations across the domain at subregional scales, with its performance ultimately constrained by the information content of the assimilated observations (Oberrauch et al., 2025). As a result, input datasets of varying quality and processing levels from the COSMO and ICON forecasting systems can be effectively corrected, yielding snowpack simulations of comparable accuracy regardless of the input data. This homogenization of the meteorological forcing ensures consistent quality of the provided dataset throughout the entire 10-year period, preventing year-to-year discontinuities, which may arise when switching NWP models (between COSMO and ICON) or processing levels (between forecast and analysis). A detailed evaluation of the assimilation scheme, comparing multiple assimilation settings over two seasons and a range of model complexities and input data qualities, is provided in Oberrauch et al. (2025).
The OSHD model system has been successfully employed in an operational context for over a decade, delivering daily analyses and forecasts of snow cover dynamics across Switzerland, thereby providing critical information to the avalanche warning service, the Federal Office for the Environment, and other partners (Mott et al., 2023). In addition to its operational use, which relies on the system's robustness and the consistent quality of the data products delivered, continuous tuning, validation, and integration of advances from snow modeling research further contribute to the high quality of the data provided (Mazzotti et al., 2023; Quéno et al., 2024; Cluzet et al., 2024; Oberrauch et al., 2025; Haagmans et al., 2026).
To provide an estimate of the uncertainties in the presented dataset, we conducted a leave-one-station-out (LOO) validation, comparing snow depth estimates with point observations at the 444 station locations, analogous to Oberrauch et al. (2024, 2025). To ensure independence, the forcing corrections at each station location were interpolated from surrounding stations within the 35 km sphere of influence, disregarding the correction estimated at the station itself. Figure 4 shows simulated and observed snow depths across the full simulation period from September 2016 to August 2025, aggregated into four elevation bands by averaging over all stations within each band. Even in the highest elevation band, where average peak snow depths exceed 2 m, the RMSE remains as low as 6.25 cm, with a slightly negative bias of 3.34 cm.
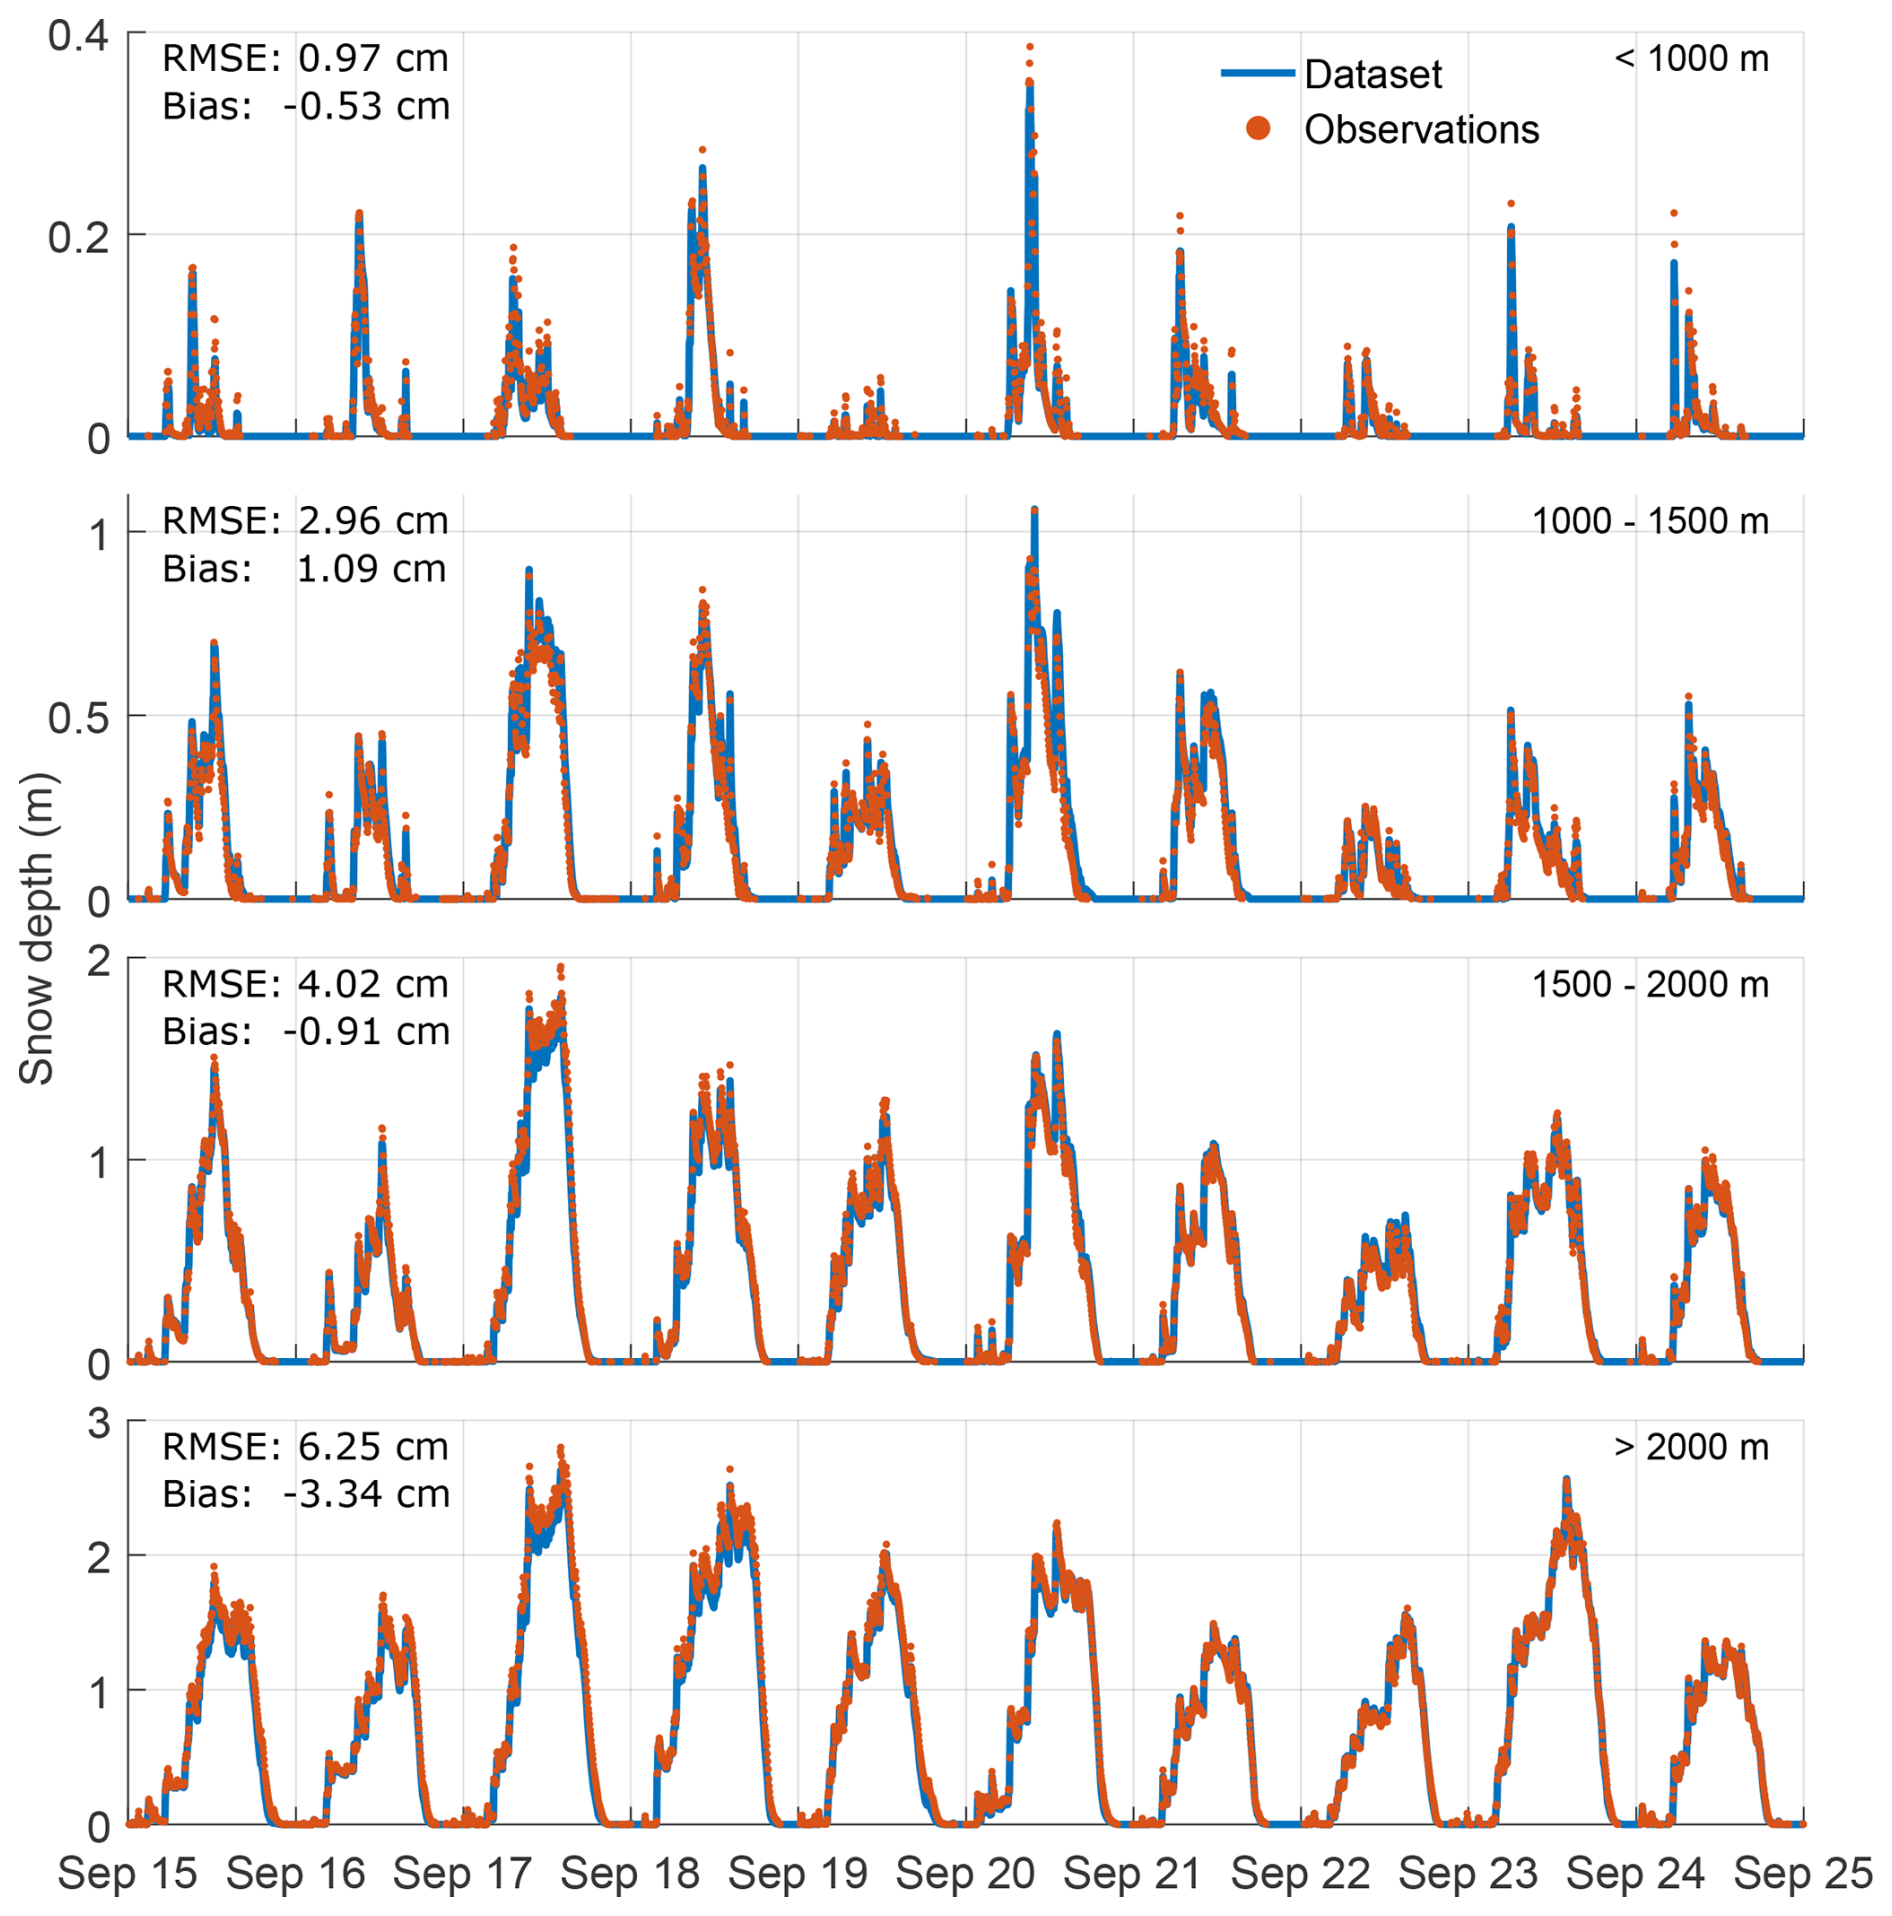
Figure 4Average snow depth per elevation band across all 444 station locations between September 2015–August 2025. Observed values are shown as orange dots, while model estimates from the leave-one-out validation simulation are shown as a blue line. RMSE and bias are calculated over the entire period for all snow-covered days within the respective elevation bands (i.e. excluding days when both simulated and observed values are zero).
Given the representativeness error inherent to point snow observation, a validation at individual locations is not sufficient to evaluate the dataset across the complex mountain topography. A recent validation study by Cluzet et al. (2024) compared FSM2OSHD against snow wetness observations from Sentinel-1 retrievals and identified a delayed melt onset, which was subsequently corrected through a refined albedo parameterization, now adopted in the present model configuration. Furthermore, a validation against SCF maps from Sentinel-2 retrievals presented in Oberrauch et al. (2025) showed that the PF-based assimilation scheme reliably accounts for forcing uncertainties at a subregional scale, but errors in small-scale accumulation and ablation patterns remain unresolved.
We present a spatially explicit validation of the dataset against SCF maps derived from Sentinel-2 observations over eight seasons with sufficient data availability (WY 2018 to WY 2025). For each day with a usable Sentinel-2 acquisition between March–July, we aggregate modeled and observed SCF information to produce a regional snow-line altitude (SLA) for eight aspect classes and flat locations. The SLA is defined as the elevation where the average SCF in a given region drops below 30 %. Figure 5 depicts the distribution of mean SLA bias (model-observations) over all 16 hydrological units of the Swiss Alps (as indicated in Fig. 1). Overall, the median SLA bias is within ±100 m for all water years and aspect classes, with individual subregions occasionally exceeding this range but more frequently falling well below it. Noticeable differences exist between water years, though there is no clear link to high or low snow years (cf. Fig. 6), suggesting that the bias is driven by factors other than overall snow availability. A slight aspect dependency is evident, with a tendency towards positive biases in the north-easterly sector, and negative biases in the south-westerly sector.
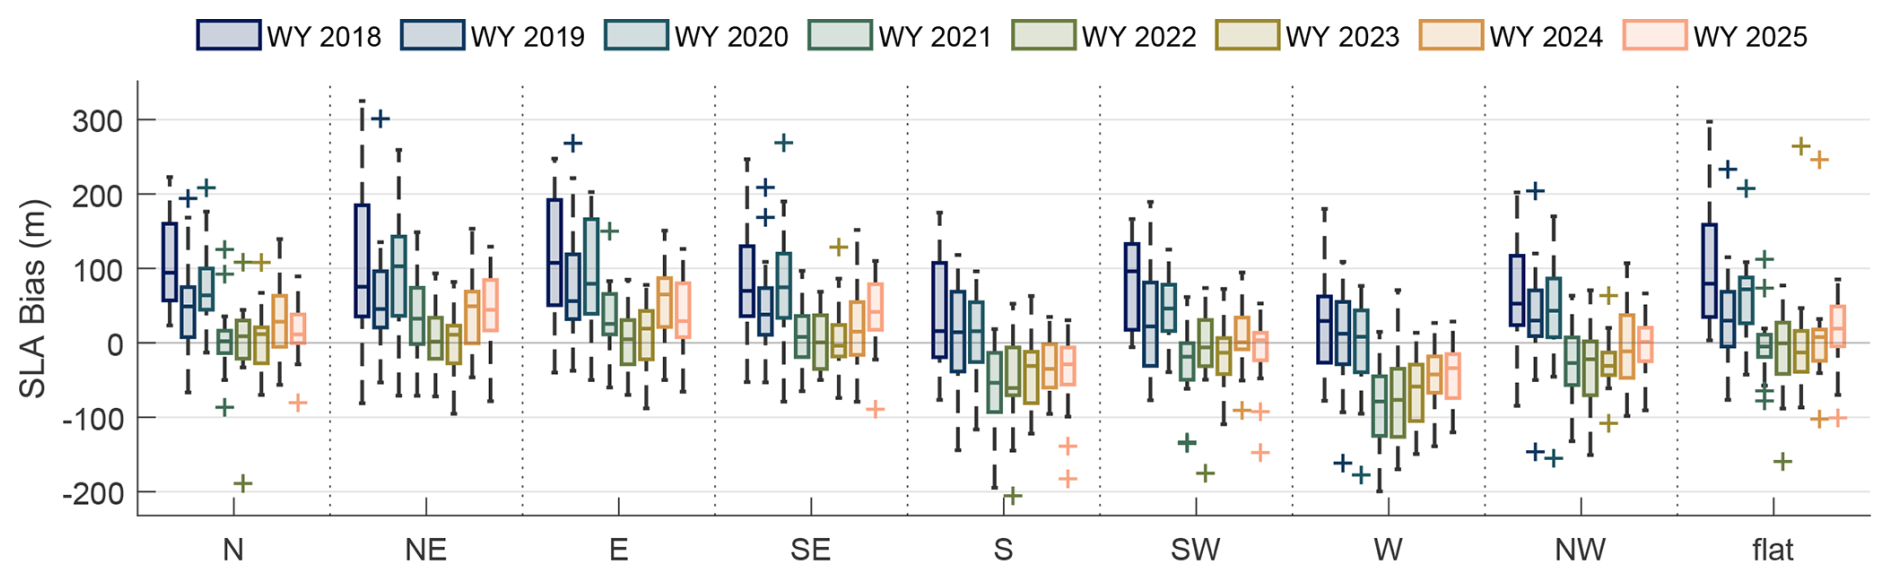
Figure 5Distribution of average snow-line altitude bias over all 15 hydrological units spanning the Swiss Alps, aggregated into eight aspect classes and flat terrain. The different colors indicate the different water years (WY). Each box represents the interquartile range (IQR), with the horizontal line indicating the median value. The whiskers represent the range, while outliers, defined as points beyond 1.5×IQR from the box boundaries, appear as crosses.
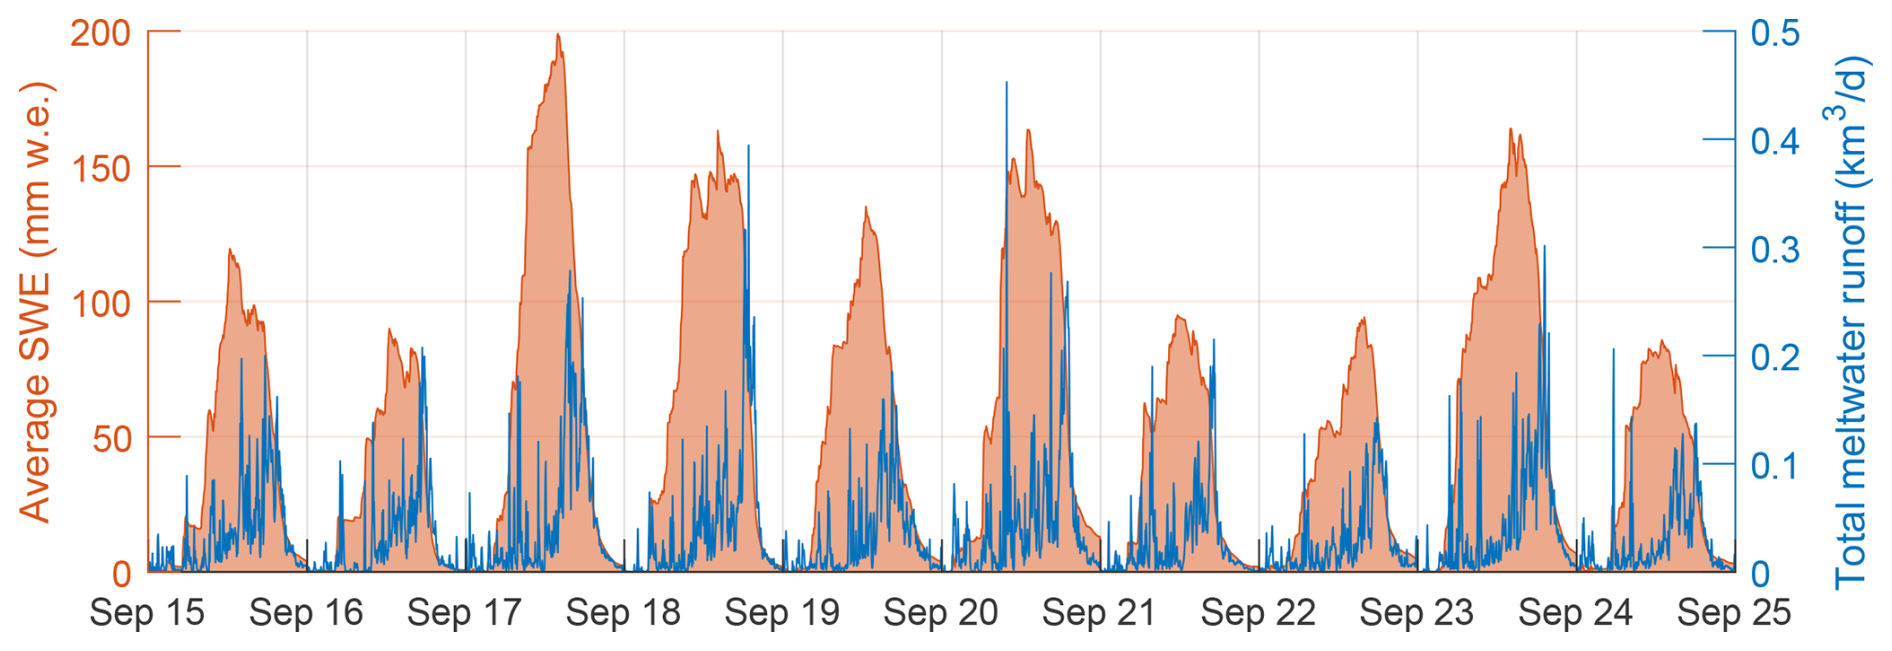
Figure 6Daily time series of average SWE (orange shading, left axis) and total meltwater runoff (blue line, right axis) over the whole domain from September 2015 to August 2025.
As outlined in Sect. 3 and further detailed in Oberrauch et al. (2024, 2025), the PF assimilation scheme reliably accounts for forcing uncertainties at subregional scales, while only minor errors in small-scale accumulation and ablation patterns persist. The leave-one-out evaluation at station locations shows that snow depth estimates remain within a few centimeters of observed values across the entire 10-year period and the full elevation range. Furthermore, the evaluation against independent SCF maps demonstrates that the dataset accurately captures the heterogeneous evolution of the snowpack across the complex mountainous domain, with an average SLA bias well below 100 m in most cases. Together, the use of state-of-the-art meteorological forcing, physics-based snow modeling, and data assimilation has allowed us to produce a dataset with, to our knowledge, unprecedented spatial resolution and accuracy for a domain and period of this size. Nevertheless, a few limitations remain, which are discussed below.
Oberrauch et al. (2025) showed that assimilation performance is limited by the information content of in situ observations rather than their absolute number or density, as point observations cannot fully resolve the heterogeneous evolution of the snowpack across different slopes and aspects, especially when collected predominantly at flat-field locations (e.g. Grünewald and Lehning, 2015; Cluzet et al., 2024). Hence, to further improve model estimates, additional spatially explicit data would be necessary. Assimilating SCF observations using ensemble smoother techniques (e.g. Girotto et al., 2014; Margulis et al., 2015) is common practice in reanalysis studies (e.g. Margulis et al., 2016; Aalstad et al., 2018; Fiddes et al., 2019; Liu et al., 2021) and allows for reconstructing the seasonal snowpack evolution from observed meltout patterns. In our case, however, the available SCF data did not cover the full 10-year period, and assimilating them would have likely introduced temporal discontinuities in dataset accuracy, as reported, e.g. for the French snow reanalysis dataset (Vernay et al., 2022). Since providing a temporally homogeneous dataset has been a main objective, we chose not to assimilate SCF observations.
Snowpack estimates might be less reliable at very high elevations above 3000 m, where uncertainties are difficult to quantify due to the lack of comprehensive observational data. At these elevations, a limited number of grid cells lie outside the sphere of influence of any snow monitoring station, as defined in Sect. 2.4. For those grid cells, forcing corrections had to be interpolated from the three nearest stations, regardless of distance or elevation difference, to avoid unrealistic discontinuities in the dataset. Given that only about 1.8 % of the domain lies above 3000 m and that no alternative observational data are available for assimilation or validation at these elevations, this represents the best available approach, and any resulting errors are expected to remain limited in their impact on the overall dataset quality.
In forested areas, snow models require additional process representations and input datasets, which unavoidably introduce additional sources of uncertainty. The snow–canopy and canopy–atmosphere interactions within FSM2OSHD have been extensively validated at the process level and for hyper-resolution simulations between 1–50 m (Mazzotti et al., 2020b, 2021, 2023). At the presented 250 m resolution, a comparison with PlanetScope RGB composites has confirmed that FSM2OSHD accurately reproduces observed differences in the seasonal, interannual, and regional evolution of the snowpack among open, dense, and sparsely forested areas (Haagmans et al., 2026). To our knowledge, the extent of model validation efforts in forest terrain and the level of detail of the canopy input datasets (Webster et al., 2025) are unprecedented in the European Alps. Nevertheless, the vegetation input datasets may contain inaccuracies. For example, the vegetation data have been acquired between 2020–2022, and changes in the canopy structure since are not accounted for (Webster et al., 2025). Additionally, snow estimates in forested areas lack direct observational constraints. However, given the model's accurate representation of forest-snow processes, improvements in the meteorological forcing data will also enhance snow estimates in the forest, even when the forcing corrections were derived from stations outside the forest.
The research model variant FSM2trans (Quéno et al., 2024) includes dedicated modules for snow redistribution by gravity- and wind-driven processes (Bernhardt and Schulz, 2010; Liston et al., 2007), as well as an updated density-dependent layering scheme to represent erodible snow. While accounting for horizontal redistribution of snow enables a more realistic representation of small-scale accumulation and erosion patterns, it requires simulations at hectometre or finer spatial resolutions, along with appropriate downscaling of wind fields (Quéno et al., 2024; Berg et al., 2024; Reynolds et al., 2024). At the resolution of 250 m of the presented dataset, FSM2OSHD does not explicitly account for snow redistribution, which may affect the accuracy of local-scale snow distribution patterns.
The presented dataset provides daily values of snow depth, SWE, SCF, and meltwater runoff over an area of 58 000 km2 and a period of 10 years, enabling analyses across different temporal and spatial scales. Snow depth is reported as the average value per grid cell. For example, if a grid cell has a snow depth of 25 cm and an SCF of 50 %, this can be interpreted as half the cell being covered with 50 cm of snow. SWE and runoff are given as the total water volume per grid cell. Runoff represents the liquid water leaving the snowpack; during rain-on-snow events, this can include liquid precipitation percolating through the snowpack. Note that soil infiltration is not considered in these calculations (Essery, 2015; Mott et al., 2023, for details). Below, we highlight several illustrative examples of the use of this dataset.
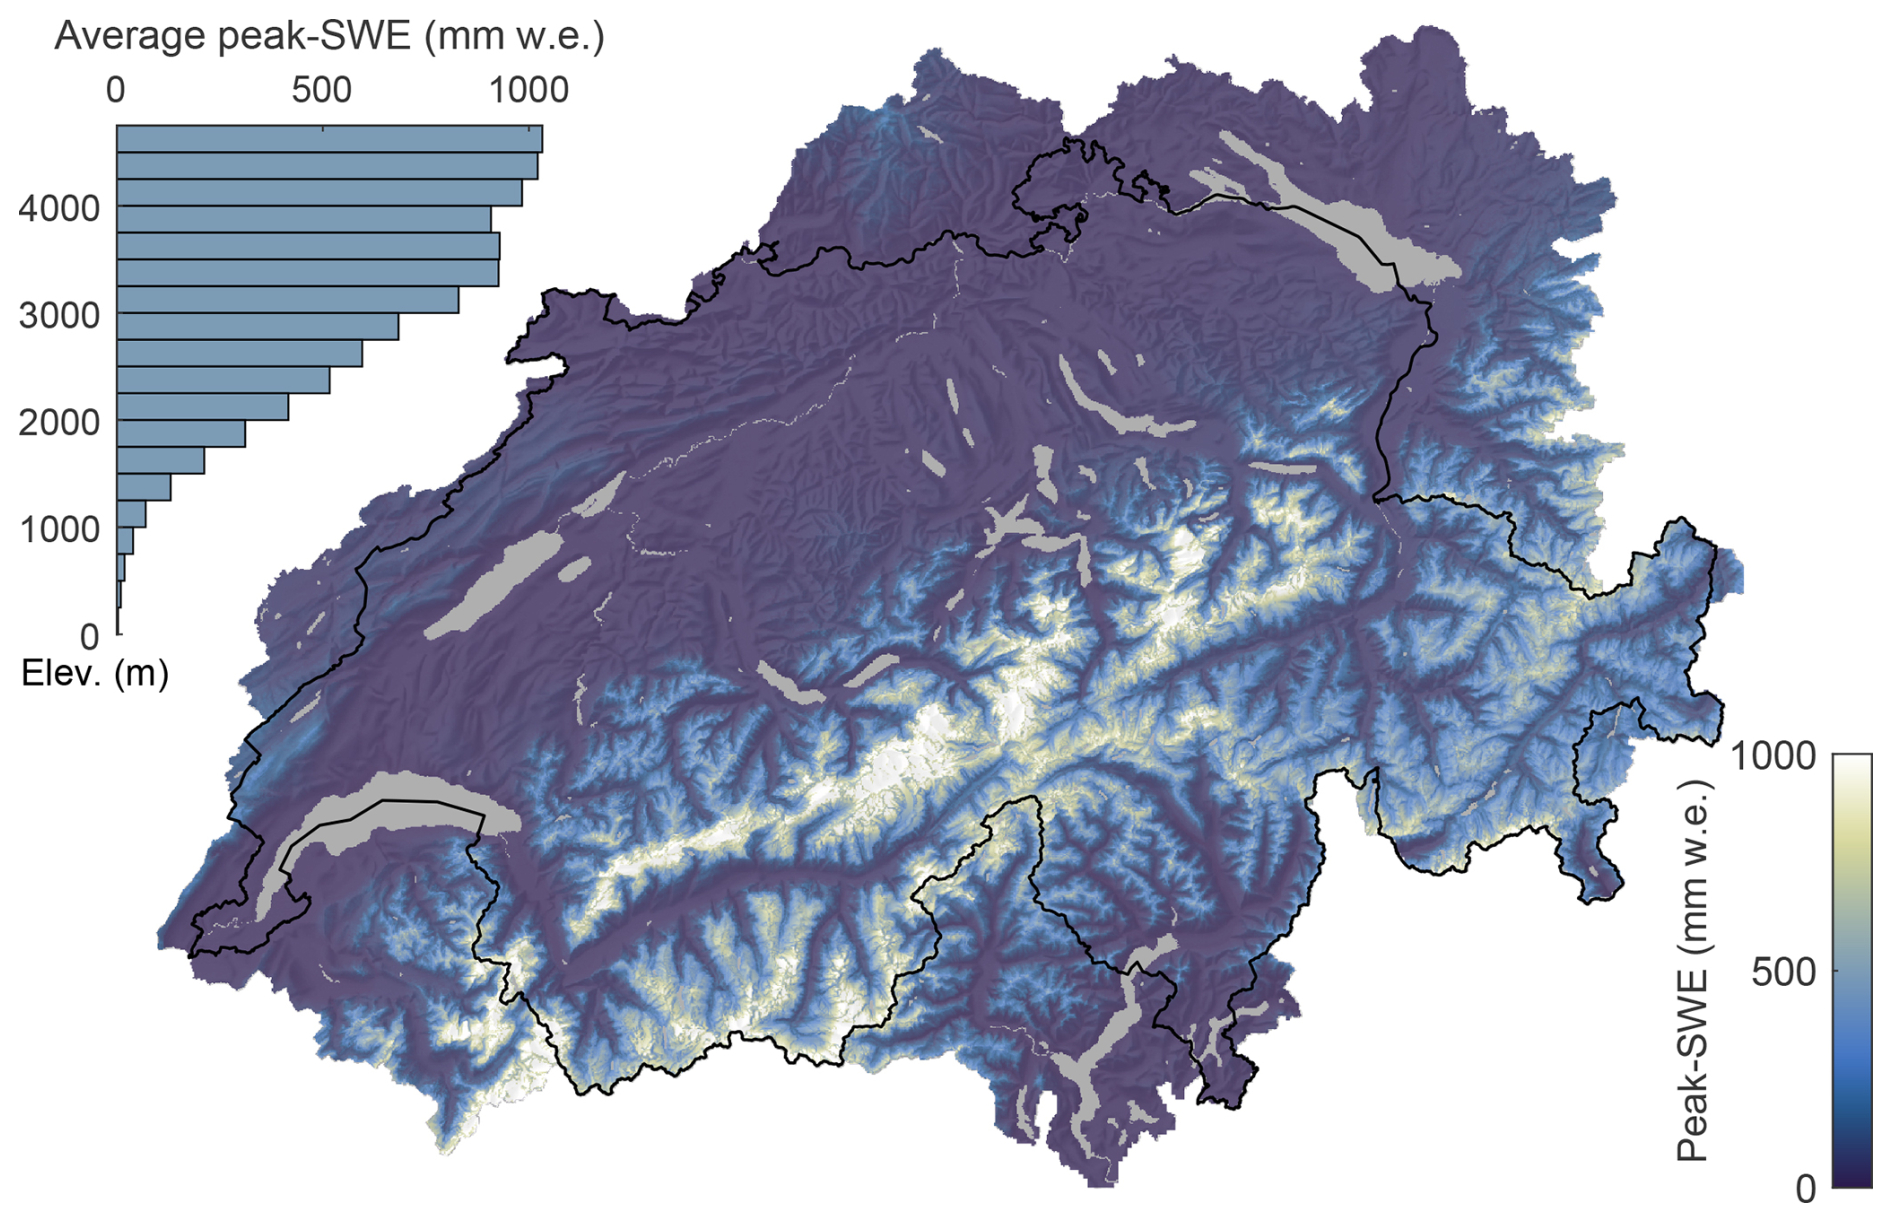
Figure 7Map of average pixel-wise peak SWE between September 2015–August 2025. The Swiss national border is outlined in black, and a shaded relief is used as a background map. The inset panel shows the elevation distribution of average peak SWE across 250 m elevation bands.
Figure 6 shows time series of the average SWE (orange shading, left axis) and total meltwater runoff over the entire domain (blue line, right axis). Over all 10 seasons, average peak-SWE amounts to 130 , with around 90 for low-snow years and above 160 for high-snow years. Interannual variations in peak-SWE values are even more pronounced, ranging from up to 197 in water year 2018 down to 85 in water year 2025. While the overall seasonality is consistent, the magnitude of seasonal accumulation and melt varies notably. On average, peak-SWE typically occurs on March 24±18 d, but can be as early as the end of February and as late as the beginning of May (corresponding to a range of 65 d). Meltwater runoff also follows a clear seasonal pattern, with low values in autumn and winter, peak values in spring, and a gradual reduction during summer. Day-to-day variability is, however, much higher, with pronounced spikes throughout the season and maximum values occurring as early as December (see water year 2021).
The average pixel-wise peak SWE over all 10 seasons, shown in Fig. 7, reveals a distinct elevation-dependent pattern. In the high mountains and glaciated areas along the Alpine Main Ridge, peak SWE values regularly exceed 1000 and even surpass 2000 . In the mid-elevation mountain ranges between 2000–3000 m, average peak SWE is approximately 550 . Over the Swiss Plateau, the snowpack remains shallow, with considerably higher peak-SWE values observable in the adjacent Jura Mountains.
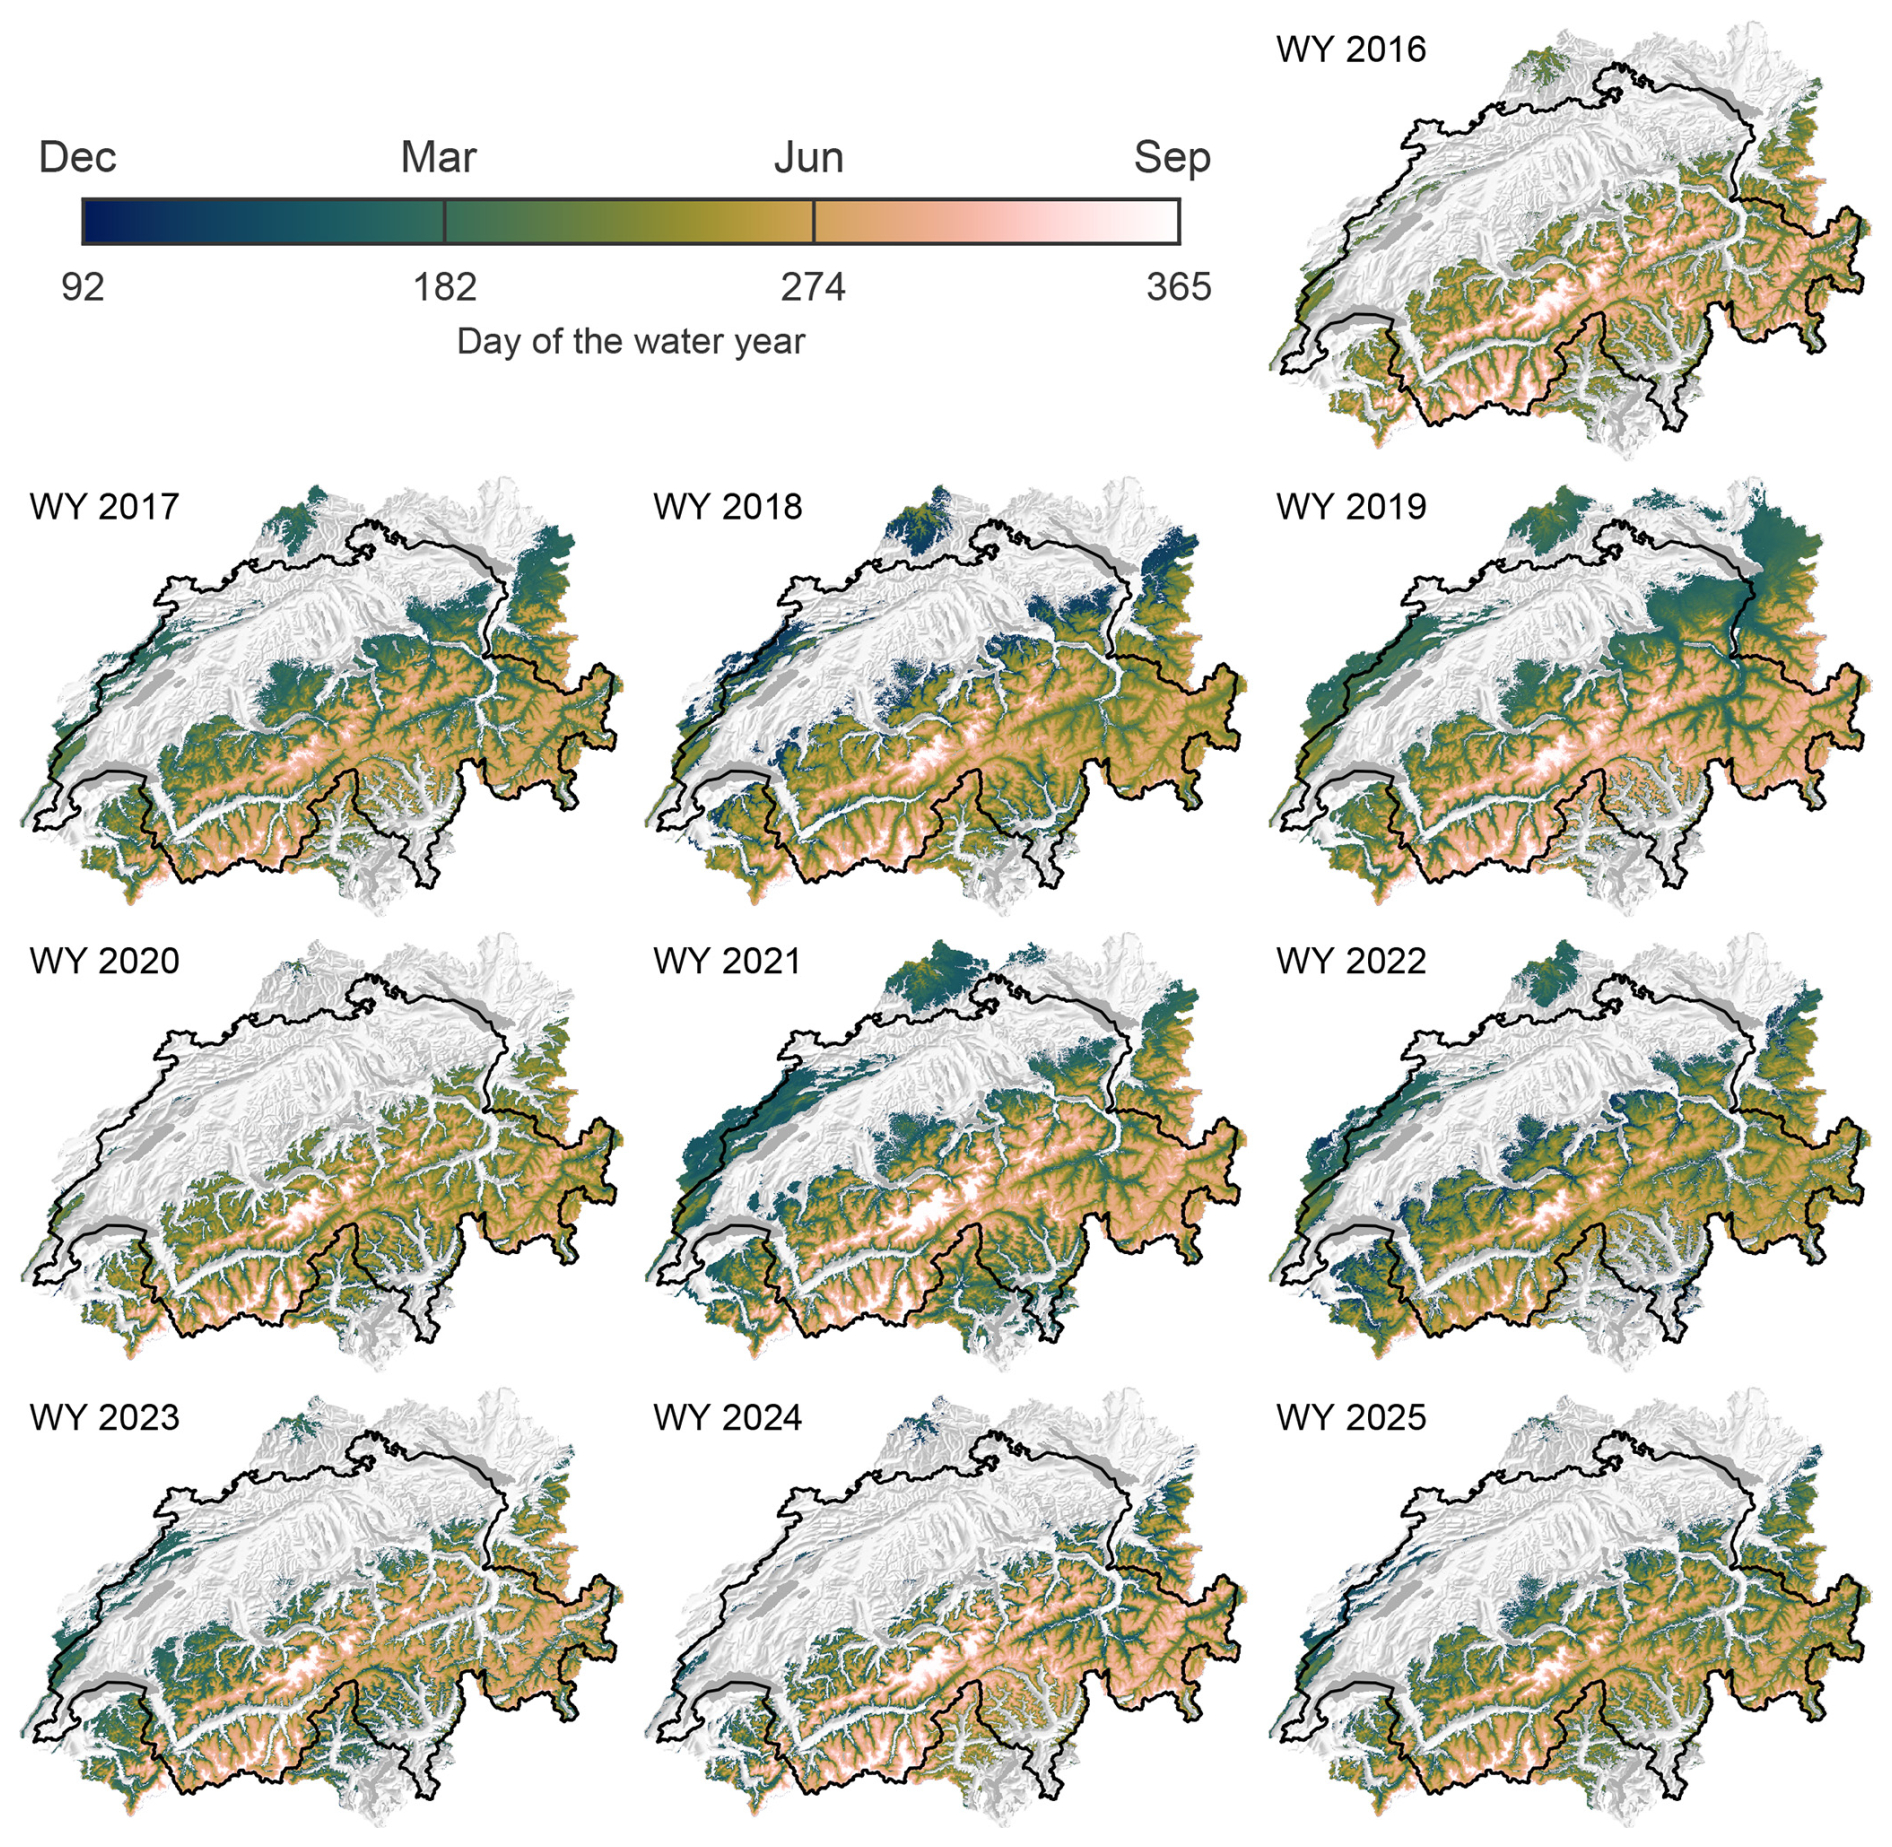
Figure 8Maps of snow melt-out date for the water years 2016–2025. The snow melt-out date is defined as the last day of the water year with at least 5 cm of snow depth, following a minimum of 30 consecutive days of continuous snow cover. The Swiss national border is outlined in black, and a shaded relief is used as a background map.
Figure 8 shows the snow melt-out date for each season, defined as the last day of the water year with at least 5 cm of snow depth, following a minimum of 30 consecutive days of snow cover. The Swiss Plateau rarely experiences a whole month of continuous snow cover, so a melt-out date cannot be computed for most of the region. In the Jura and Alpine foothills, the melt-out date typically falls between December–March, while snow cover can be observed up to June and later along the Alpine Main Ridge. Nevertheless, the interannual variability is considerable, and total domain-wide SWE (shown in Fig. 6) and melt-out dates are not necessarily correlated: in the low-snow year 2016, for instance, the average peak SWE was only 120 , yet melt-out dates above 2000 m ranged from June to September.
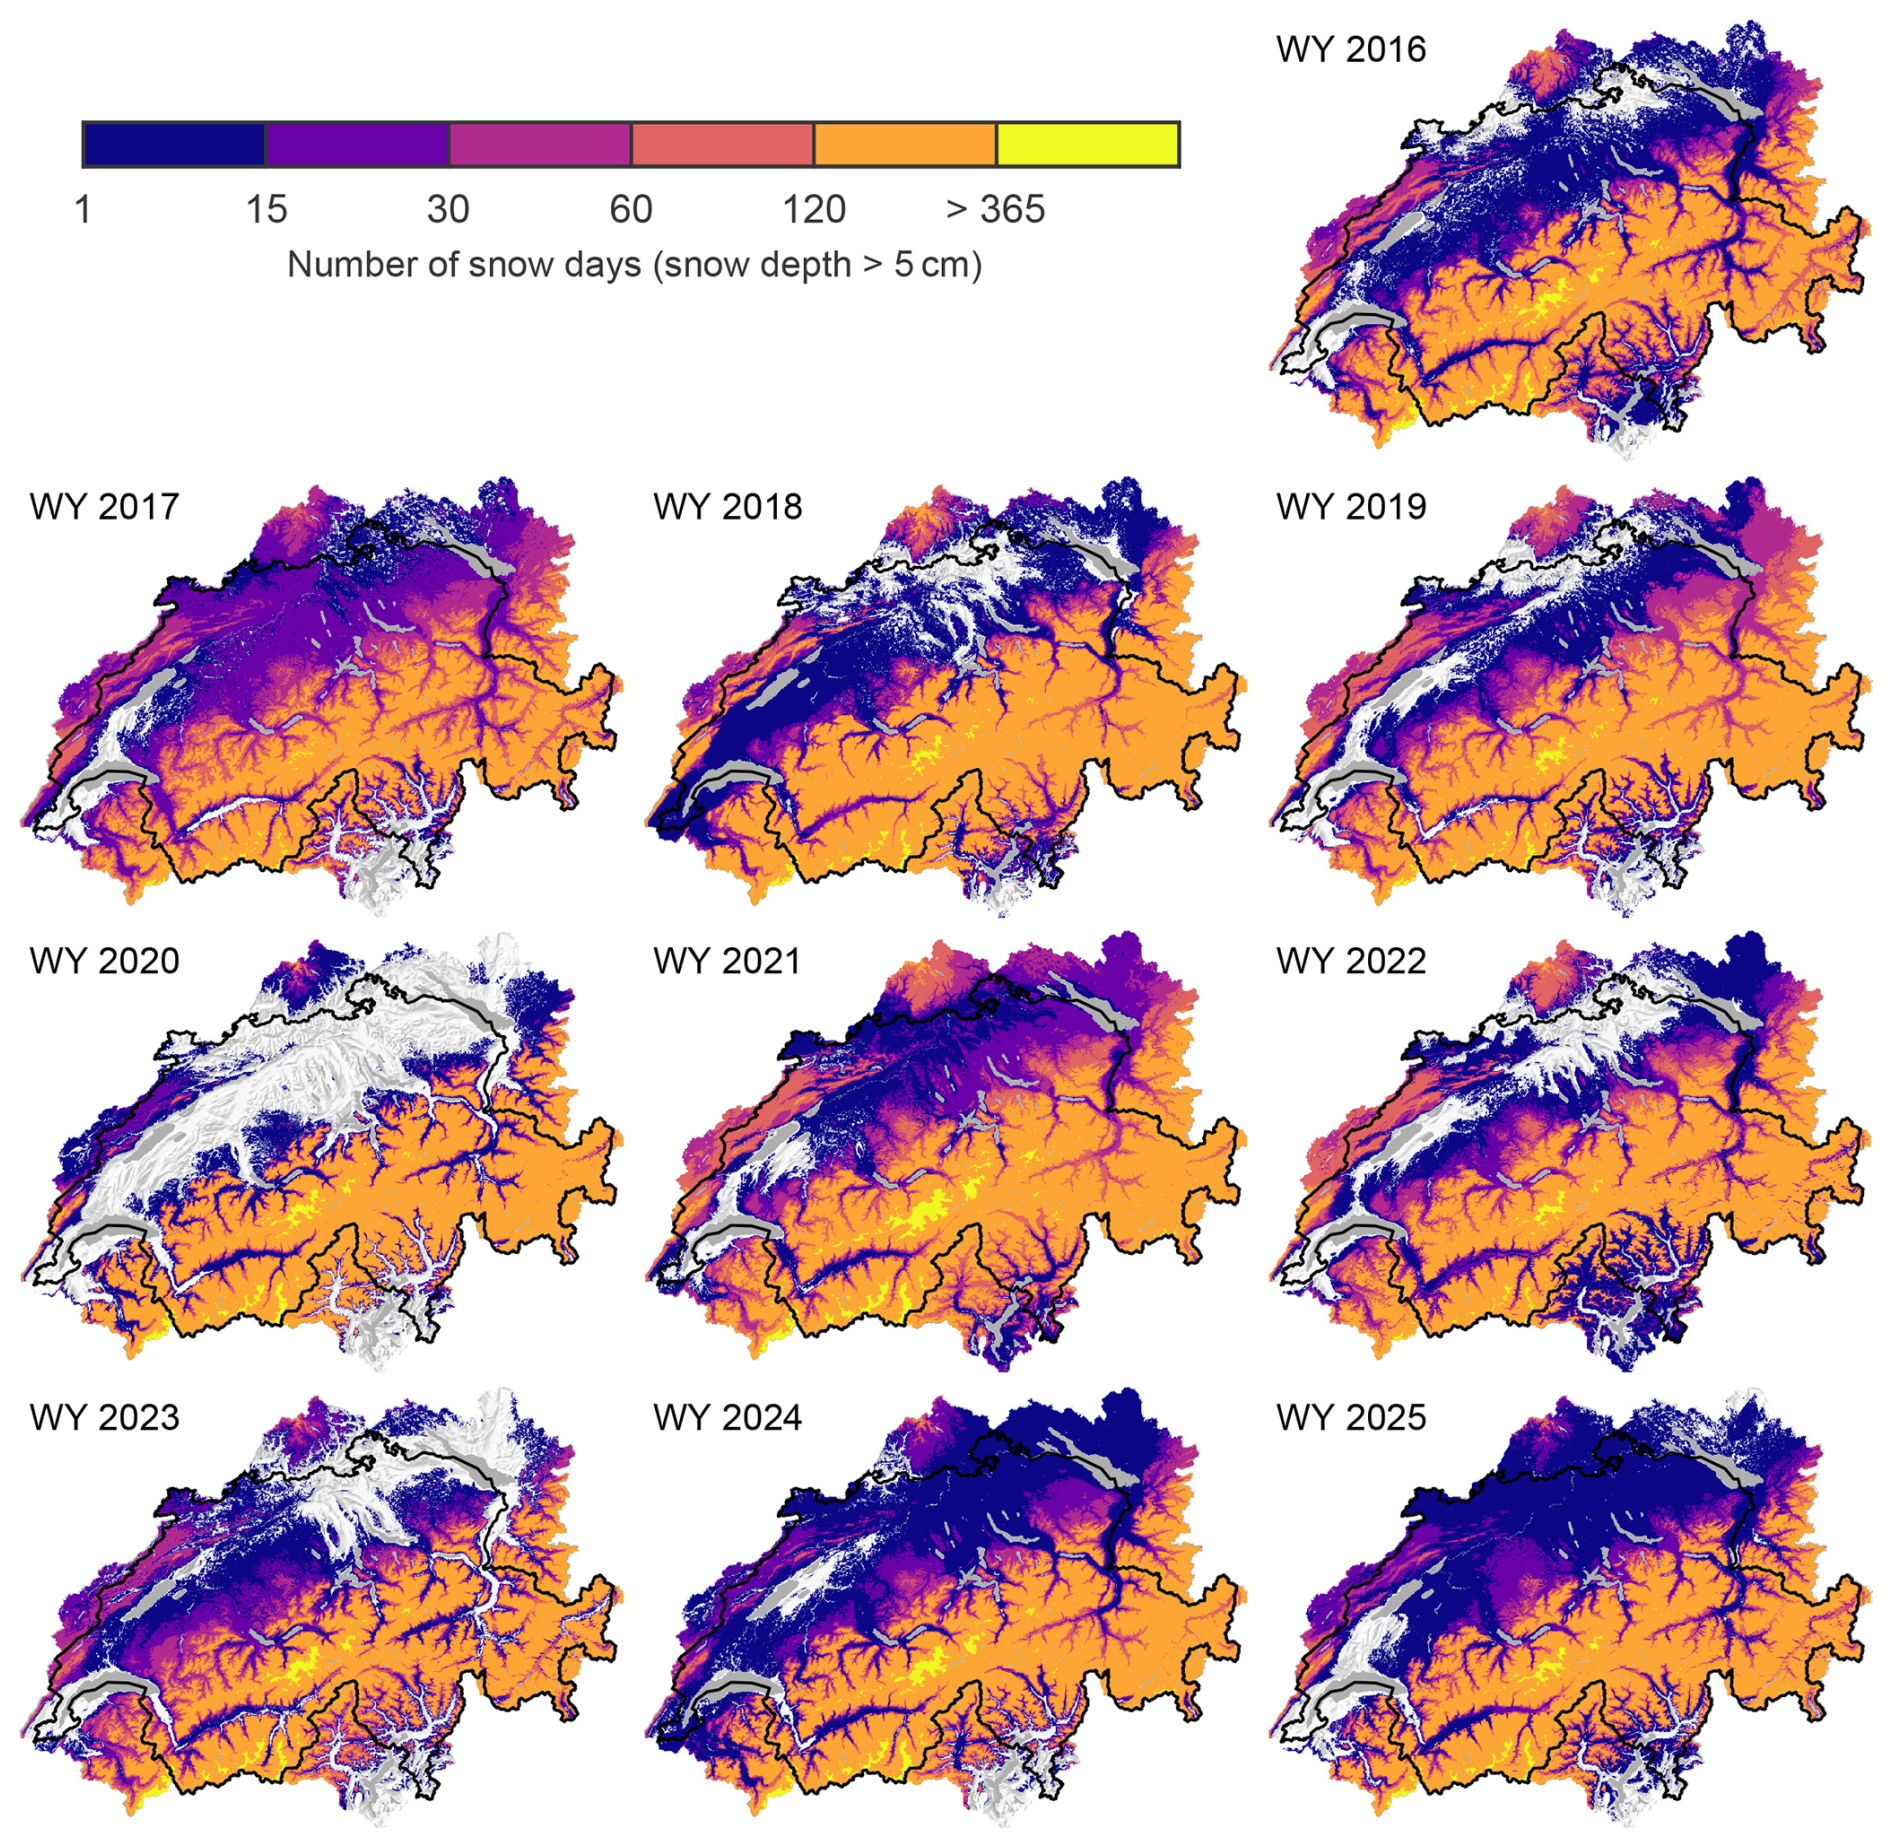
Figure 9Maps of the number of snow days per season (defined as days with a minimum snow depth of 5 cm) for water years 2016–2025. Regions with 120 or more snow days and a snow cover that persists until the end of the season are labeled as >365. The Swiss national border is outlined in black, and a shaded relief is used as a background map.
Figure 9 shows maps of the number of snow days per season (defined as days with a minimum snow depth of 5 cm) grouped into discrete classes between 1, 15, 30, 60, 120, and more than 365 d. Across all 10 years, much of the Swiss Alps exhibits a persistent seasonal snowpack with more than 120 snow days, while the Alpine foothills, Jura Mountains, and Swiss Plateau generally experience far fewer snow days. The water year 2020 shows a particularly distinct bimodal pattern, with areas experiencing either more than 120 snow days or fewer than 15, and only narrow transition zones in between. The interannual variability is pronounced, not only between low and high elevations but also between the northern and southern slopes of the Alps. In most years, at least one day of snow cover occurs across the majority of the domain, although some exceptionally warm and/or dry years (e.g. 2020, 2022, and 2023) show snow-free conditions in the lowlands. Regions with 120 or more snow days and a snow cover that persists until the end of the season (labeled as >365 in the figure) are confined to small areas in the highest and glaciated parts of the Alps and are virtually absent in certain years, such as 2017.
The dataset provides daily estimates of snow depth (m), snow water equivalent (), snow cover fraction (unitless), and snowmelt runoff () for each grid cell within the domain. The reference time for daily values is 06:00 Central European Time (1:00), with snow depth, SWE, and SCF representing states at that time, and runoff corresponding to the accumulated total over the preceding 24 h. Given that on 1 September at 06:00 CET of each season, all snow is removed, all variables for that day in the dataset are zero because the end-states from the previous season are not carried over.
The data are stored in self-explanatory monthly NetCDF files (e.g. OSHD_DATA_2020-01.nc for January 2020) within individual zip archives for each water year (e.g. OSHD_DATA_WY2020.zip for water year 2020), with a total data volume of about 800 MB per season. Variable names, attributes, and metadata adhere to the CF 1.12 and ACDD 1.3 conventions. The data variables are structured as three-dimensional arrays, with time, easting, and northing coordinates. The temporal coordinate denotes the number of days since the first day of the corresponding month. The horizontal coordinates refer to the center of the respective grid cell, given in the local Swiss CH1903+/LV95 reference system (EPSG:2056). The total spatial extent is also specified by the minimum and maximum longitude and latitude in WGS84 coordinates (EPSG:4326). Additional metadata includes the dataset title, keywords, summary, and version history; contact information; and a reference to the FSM model version used (as GitHub tag). The model DEM is provided as a GeoTiff (OSHD_MODEL_DEM.tif). Compatibility with the NASA Panoply NetCDF Viewer (NASA GISS, 2025) was verified using Panoply v5.7.1 under Windows 11.
We present a reanalysis dataset of spatially explicit seasonal snow cover dynamics for Switzerland and its bordering regions for water years 2016–2025, based on the high-resolution simulations with the physics-based, multi-layer snow model FSM2OSHD and the assimilation of snow depth observations from 444 stations across the domain. The combination of dedicated downscaling of NWP forcing data with the upscaling of state-of-the-art hyper-resolution DEM and light-availability datasets enables simulations that account for subgrid variability within the 250 m model resolution, which is crucial for capturing the spatial heterogeneity of the mountainous snowpack. The coupled energy- and mass-balance equation, solved for individual numerical snow layers, explicitly accounts for different atmospheric and snowpack processes of open, forested, and glaciated areas. Finally, the assimilation of in situ snow depth observations dynamically corrects spatiotemporal error patterns in the meteorological input data, ensuring consistent forcing quality over the presented 10-year period.
Spanning 10 years of physically consistent snow cover estimates across a large part of the European Alps, the dataset contributes to the snow data record for a region characterized by complex terrain and diverse hydroclimatic regimes. With its high spatial and temporal resolution, the dataset helps bridge the gap between coarse global products and detailed local observations. The data are publicly and freely available at https://doi.org/10.5281/zenodo.17313889 (Oberrauch et al., 2026), providing a robust foundation for hydrological, ecological, and cryospheric analyses.
The dataset is publicly available at https://doi.org/10.5281/zenodo.17313889 (Oberrauch et al., 2026) under a CC BY 4.0 license, permitting use, adaptation, and redistribution with appropriate attribution to the creators and the original dataset. Data are compressed into self-explanatory zip archives for each water year (e.g. OSHD_DATA_WY2020.zip for water year 2020), containing monthly NetCDF files (e.g. OSHD_DATA_2020-01.nc for January 2020) with all relevant metadata conforming to the CF 1.12 and ACDD 1.3 conventions. The model digital elevation model (DEM) is distributed as a GeoTIFF file named OSHD_MODEL_DEM.tif. Sources of all input datasets and model codes used in this study are detailed in the accompanying publication. FSM2OSHD model source code is publicly available at https://doi.org/10.5281/zenodo.20410047 Mott et al. (2026), and the code version used is noted in the dataset metadata. Meteorological forcing from MeteoSwiss can be obtained from https://www.meteoswiss.admin.ch/services-and-publications/service/open-data.html (last access: 10 June 2026). Snow depth measurements from the monitoring networks of WSL Institute for Snow and Avalanche Research (SLF) and MeteoSwiss are accessible under https://measurement-data.slf.ch/ (last access: 10 June 2026) and https://data.geo.admin.ch/browser/index.html#/collections/ch.meteoschweiz.ogd-nime (last access: 10 June 2026), respectively. Snow cover fraction observations derived from Sentinel-2 imagery are provided through the European Space Agency's AlpSnow EXPRO+ project (https://alpsnow.enveo.at/, last access: 10 June 2026).
MO performed the simulations, conducted the analysis, produced the figures, compiled the final dataset, and wrote the manuscript, all under the supervision of TJ. BC, JM, GM, RM, LQ, CW, and TJ contributed to the model development. GM, CW, and TJ processed forest and light availability data. BC, JM, RM, LQ, TZ, and TJ curated the input, land cover, and observational datasets. MO, BC, and JM implemented the assimilation scheme. All authors contributed to the analysis, supported the writing of the manuscript, and reviewed and approved the final version.
The contact author has declared that none of the authors has any competing interests.
Publisher's note: Copernicus Publications remains neutral with regard to jurisdictional claims made in the text, published maps, institutional affiliations, or any other geographical representation in this paper. The authors bear the ultimate responsibility for providing appropriate place names. Views expressed in the text are those of the authors and do not necessarily reflect the views of the publisher.
The authors thank the editor and the reviewers for their constructive comments, which helped improve the manuscript.
This research has been funded by the Swiss National Science Foundation (grant no. 192140).
This paper was edited by Franziska Koch and reviewed by Matthieu Lafaysse and one anonymous referee.
Aalstad, K., Westermann, S., Schuler, T. V., Boike, J., and Bertino, L.: Ensemble-based assimilation of fractional snow-covered area satellite retrievals to estimate the snow distribution at Arctic sites, The Cryosphere, 12, 247–270, https://doi.org/10.5194/tc-12-247-2018, 2018. a
Alonso-González, E., López-Moreno, J. I., Gascoin, S., García-Valdecasas Ojeda, M., Sanmiguel-Vallelado, A., Navarro-Serrano, F., Revuelto, J., Ceballos, A., Esteban-Parra, M. J., and Essery, R.: Daily gridded datasets of snow depth and snow water equivalent for the Iberian Peninsula from 1980 to 2014, Earth Syst. Sci. Data, 10, 303–315, https://doi.org/10.5194/essd-10-303-2018, 2018. a
Alonso-González, E., Aalstad, K., Pirk, N., Mazzolini, M., Treichler, D., Leclercq, P., Westermann, S., López-Moreno, J. I., and Gascoin, S.: Spatio-temporal information propagation using sparse observations in hyper-resolution ensemble-based snow data assimilation, Hydrol. Earth Syst. Sci., 27, 4637–4659, https://doi.org/10.5194/hess-27-4637-2023, 2023. a
Anderson, E. A.: A Point Energy and Mass Balance Model of a Snow Cover, Tech. rep., United States National Weather Service, https://repository.library.noaa.gov/view/noaa/6392/noaa_6392_DS1.pdf (last access: 10 June 2026), 1976. a
Avanzi, F., Gabellani, S., Delogu, F., Silvestro, F., Pignone, F., Bruno, G., Pulvirenti, L., Squicciarino, G., Fiori, E., Rossi, L., Puca, S., Toniazzo, A., Giordano, P., Falzacappa, M., Ratto, S., Stevenin, H., Cardillo, A., Fioletti, M., Cazzuli, O., Cremonese, E., Morra di Cella, U., and Ferraris, L.: IT-SNOW: a snow reanalysis for Italy blending modeling, in situ data, and satellite observations (2010–2021), Earth Syst. Sci. Data, 15, 639–660, https://doi.org/10.5194/essd-15-639-2023, 2023. a
Baldauf, M., Seifert, A., Förstner, J., Majewski, D., Raschendorfer, M., and Reinhardt, T.: Operational convective-scale numerical weather prediction with the COSMO model: description and sensitivities, Mon. Weather Rev., 139, 3887–3905, https://doi.org/10.1175/MWR-D-10-05013.1, 2011. a
Barrett, A. P.: National Operational Hydrologic Remote Sensing Center SNOw Data Assimilation System (SNODAS) Products at NSIDC – NSIDC Special Report 11, Tech. Rep. NSIDC Special Report 11, National Snow and Ice Data Center, Boulder, Colorado, USA, https://nsidc.org/sites/default/files/nsidc_special_report_11.pdf (last access: 10 June 2026), 2003. a
Berg, J., Reynolds, D., Quéno, L., Jonas, T., Lehning, M., and Mott, R.: A seasonal snowpack model forced with dynamically downscaled forcing data resolves hydrologically relevant accumulation patterns, Front. Earth Sci., 12, 1393260, https://doi.org/10.3389/feart.2024.1393260, 2024. a
Bernhardt, M. and Schulz, K.: SnowSlide: a simple routine for calculating gravitational snow transport, Geophys. Res. Lett., 37, 11502, https://doi.org/10.1029/2010GL043086, 2010. a
Boone, A. and Etchevers, P.: An intercomparison of three snow schemes of varying complexity coupled to the same land surface model: local-scale evaluation at an Alpine site, J. Hydrometeorol., 2, 374–394, https://doi.org/10.1175/1525-7541(2001)002<0374:AIOTSS>2.0.CO;2, 2001. a
Bührle, L. J., Marty, M., Eberhard, L. A., Stoffel, A., Hafner, E. D., and Bühler, Y.: Spatially continuous snow depth mapping by aeroplane photogrammetry for annual peak of winter from 2017 to 2021 in open areas, The Cryosphere, 17, 3383–3408, https://doi.org/10.5194/tc-17-3383-2023, 2023. a
Chopin, N. and Papaspiliopoulos, O.: An Introduction to Sequential Monte Carlo, Vol. 4 of Springer Series in Statistics, Springer International Publishing, Cham, https://doi.org/10.1007/978-3-030-47845-2, 2020. a
Cluzet, B., Lafaysse, M., Deschamps-Berger, C., Vernay, M., and Dumont, M.: Propagating information from snow observations with CrocO ensemble data assimilation system: a 10-years case study over a snow depth observation network, The Cryosphere, 16, 1281–1298, https://doi.org/10.5194/tc-16-1281-2022, 2022. a
Cluzet, B., Magnusson, J., Quéno, L., Mazzotti, G., Mott, R., and Jonas, T.: Exploring how Sentinel-1 wet-snow maps can inform fully distributed physically based snowpack models, The Cryosphere, 18, 5753–5767, https://doi.org/10.5194/tc-18-5753-2024, 2024. a, b, c, d, e, f
Cox, P. M., Betts, R. A., Bunton, C. B., Essery, R. L. H., Rowntree, P. R., and Smith, J.: The impact of new land surface physics on the GCM simulation of climate and climate sensitivity, Clim. Dynam., 15, 183–203, https://doi.org/10.1007/s003820050276, 1999. a
Douville, H., Royer, J. F., and Mahfouf, J. F.: A new snow parameterization for the Météo-France climate model: Part I: validation in stand-alone experiments, Clim. Dynam., 12, 21–35, https://doi.org/10.1007/BF00208760, 1995. a, b
Dozier, J., Bair, E. H., and Davis, R. E.: Estimating the spatial distribution of snow water equivalent in the world's mountains, WIREs Water, 3, 461–474, https://doi.org/10.1002/wat2.1140, 2016. a
Eckert, N., Corona, C., Giacona, F., Gaume, J., Mayer, S., van Herwijnen, A., Hagenmuller, P., and Stoffel, M.: Climate change impacts on snow avalanche activity and related risks, Nature Reviews Earth and Environment, 5, 369–389, https://doi.org/10.1038/s43017-024-00540-2, 2024. a
Essery, R.: A factorial snowpack model (FSM 1.0), Geosci. Model Dev., 8, 3867–3876, https://doi.org/10.5194/gmd-8-3867-2015, 2015. a, b, c, d, e, f
Essery, R., Mazzotti, G., Barr, S., Jonas, T., Quaife, T., and Rutter, N.: A Flexible Snow Model (FSM 2.1.1) including a forest canopy, Geosci. Model Dev., 18, 3583–3605, https://doi.org/10.5194/gmd-18-3583-2025, 2025. a, b
European Space Agency: ESA EXPRO+ AlpSnow, https://alpsnow.enveo.at/index.html (last access: 10 June 2026), 2025. a
European Union's Copernicus Land Monitoring Service information: CORINE Land Cover 2018 (vector/raster 100 m), Europe, 6-yearly, European Environment Agency [data set], https://doi.org/10.2909/960998c1-1870-4e82-8051-6485205ebbac, 2020. a
Fang, Y., Liu, Y., and Margulis, S. A.: A western United States snow reanalysis dataset over the Landsat era from water years 1985 to 2021, Scientific Data, 9, 1–17, https://doi.org/10.1038/S41597-022-01768-7, 2022. a
Fiddes, J., Aalstad, K., and Westermann, S.: Hyper-resolution ensemble-based snow reanalysis in mountain regions using clustering, Hydrol. Earth Syst. Sci., 23, 4717–4736, https://doi.org/10.5194/hess-23-4717-2019, 2019. a, b
Fierz, C., Armstrong, R., Durand, Y., Etchevers, P., Greene, E., Mcclung, D., Nishimura, K., Satyawali, P., and Sokratov, S.: The International Classification of Seasonal Snow on the Ground, https://cryosphericsciences.org/wp-content/uploads/2019/02/snowclass_2009-11-23-tagged-highres.pdf (last access: 10 June 2026), 2009. a
Floriancic, M. G., Berghuijs, W. R., Jonas, T., Kirchner, J. W., and Molnar, P.: Effects of climate anomalies on warm-season low flows in Switzerland, Hydrol. Earth Syst. Sci., 24, 5423–5438, https://doi.org/10.5194/hess-24-5423-2020, 2020. a
Gascoin, S., Grizonnet, M., Bouchet, M., Salgues, G., and Hagolle, O.: Theia Snow collection: high-resolution operational snow cover maps from Sentinel-2 and Landsat-8 data, Earth Syst. Sci. Data, 11, 493–514, https://doi.org/10.5194/essd-11-493-2019, 2019. a
Gascoin, S., Luojus, K., Nagler, T., Lievens, H., Masiokas, M., Jonas, T., Zheng, Z., and De Rosnay, P.: Remote sensing of mountain snow from space: status and recommendations, Front. Earth Sci., 12, 1381323, https://doi.org/10.3389/feart.2024.1381323, 2024. a, b
Girotto, M., Margulis, S. A., and Durand, M.: Probabilistic SWE reanalysis as a generalization of deterministic SWE reconstruction techniques, Hydrol. Process., 28, 3875–3895, https://doi.org/10.1002/hyp.9887, 2014. a
Godsey, S. E., Marks, D., Kormos, P. R., Seyfried, M. S., Enslin, C. L., Winstral, A. H., McNamara, J. P., and Link, T. E.: Eleven years of mountain weather, snow, soil moisture and streamflow data from the rain–snow transition zone – the Johnston Draw catchment, Reynolds Creek Experimental Watershed and Critical Zone Observatory, USA, Earth Syst. Sci. Data, 10, 1207–1216, https://doi.org/10.5194/essd-10-1207-2018, 2018. a
Griessinger, N., Seibert, J., Magnusson, J., and Jonas, T.: Assessing the benefit of snow data assimilation for runoff modeling in Alpine catchments, Hydrol. Earth Syst. Sci., 20, 3895–3905, https://doi.org/10.5194/hess-20-3895-2016, 2016. a
Grünewald, T. and Lehning, M.: Are flat-field snow depth measurements representative? A comparison of selected index sites with areal snow depth measurements at the small catchment scale, Hydrol. Process., 29, 1717–1728, https://doi.org/10.1002/HYP.10295, 2015. a
Grünewald, T., Schirmer, M., Mott, R., and Lehning, M.: Spatial and temporal variability of snow depth and ablation rates in a small mountain catchment, The Cryosphere, 4, 215–225, https://doi.org/10.5194/tc-4-215-2010, 2010. a
Gubler, S., Fukutome, S., and Scherrer, S. C.: On the statistical distribution of temperature and the classification of extreme events considering season and climate change – an application in Switzerland, Theor. Appl. Climatol., 153, 1273–1291, https://doi.org/10.1007/s00704-023-04530-0, 2023. a
Günther, D., Marke, T., Essery, R., and Strasser, U.: Uncertainties in snowpack simulations – assessing the impact of model structure, parameter choice, and forcing data error on point-scale energy balance snow model performance, Water Resour. Res., 55, 2779–2800, https://doi.org/10.1029/2018WR023403, 2019. a
Haagmans, V., Mazzotti, G., Webster, C., and Jonas, T.: How montane forests shape snow cover dynamics across the central European Alps, Hydrol. Earth Syst. Sci., 30, 1691–1717, https://doi.org/10.5194/hess-30-1691-2026, 2026. a, b, c, d
Haberkorn, A.: European Snow Booklet – an Inventory of Snow Measurements in Europe, EnviDat [data set], https://doi.org/10.16904/envidat.59, 2019. a
Hale, K. E., Musselman, K. N., Newman, A. J., Livneh, B., and Molotch, N. P.: Effects of snow water storage on hydrologic partitioning across the mountainous, western United States, Water Resour. Res., 59, e2023WR034690, https://doi.org/10.1029/2023WR034690, 2023. a
Han, J., Liu, Z., Woods, R., McVicar, T. R., Yang, D., Wang, T., Hou, Y., Guo, Y., Li, C., and Yang, Y.: Streamflow seasonality in a snow-dwindling world, Nature, 629, 1075–1081, https://doi.org/10.1038/s41586-024-07299-y, 2024. a
Helbig, N., Schirmer, M., Magnusson, J., Mäder, F., van Herwijnen, A., Quéno, L., Bühler, Y., Deems, J. S., and Gascoin, S.: A seasonal algorithm of the snow-covered area fraction for mountainous terrain, The Cryosphere, 15, 4607–4624, https://doi.org/10.5194/tc-15-4607-2021, 2021. a
Hersbach, H., Bell, B., Berrisford, P., Hirahara, S., Horányi, A., Muñoz-Sabater, J., Nicolas, J., Peubey, C., Radu, R., Schepers, D., Simmons, A., Soci, C., Abdalla, S., Abellan, X., Balsamo, G., Bechtold, P., Biavati, G., Bidlot, J., Bonavita, M., De Chiara, G., Dahlgren, P., Dee, D., Diamantakis, M., Dragani, R., Flemming, J., Forbes, R., Fuentes, M., Geer, A., Haimberger, L., Healy, S., Hogan, R. J., Hólm, E., Janisková, M., Keeley, S., Laloyaux, P., Lopez, P., Lupu, C., Radnoti, G., de Rosnay, P., Rozum, I., Vamborg, F., Villaume, S., and Thépaut, J. N.: The ERA5 global reanalysis, Q. J. Roy. Meteor. Soc., 146, 1999–2049, https://doi.org/10.1002/QJ.3803, 2020. a, b
Hou, Y., Yang, Y., Han, J., Woods, R., and Yan, Z.: Impacts of snow changes on hydropower potential under a changing climate, J. Hydrol., 661, 133747, https://doi.org/10.1016/J.JHYDROL.2025.133747, 2025. a
Jenicek, M., Seibert, J., Zappa, M., Staudinger, M., and Jonas, T.: Importance of maximum snow accumulation for summer low flows in humid catchments, Hydrol. Earth Syst. Sci., 20, 859–874, https://doi.org/10.5194/hess-20-859-2016, 2016. a
Jonas, T., Webster, C., Mazzotti, G., and Malle, J.: HPEval: a canopy shortwave radiation transmission model using high-resolution hemispherical images, Agr. Forest Meteorol., 284, 107903, https://doi.org/10.1016/J.AGRFORMET.2020.107903, 2020. a
Jörg-Hess, S., Fundel, F., Jonas, T., and Zappa, M.: Homogenisation of a gridded snow water equivalent climatology for Alpine terrain: methodology and applications, The Cryosphere, 8, 471–485, https://doi.org/10.5194/tc-8-471-2014, 2014. a
Kavetski, D. and Kuczera, G.: Model smoothing strategies to remove microscale discontinuities and spurious secondary optima in objective functions in hydrological calibration, Water Resour. Res., 43, 3411, https://doi.org/10.1029/2006WR005195, 2007. a
Keuris, L., Hetzenecker, M., Nagler, T., Mölg, N., and Schwaizer, G.: An adaptive method for the estimation of snow-covered fraction with error propagation for applications from local to global scales, Remote Sens.-Basel, 15, 1231, https://doi.org/10.3390/RS15051231, 2023. a
Kouki, K., Luojus, K., and Riihelä, A.: Evaluation of snow cover properties in ERA5 and ERA5-Land with several satellite-based datasets in the Northern Hemisphere in spring 1982–2018, The Cryosphere, 17, 5007–5026, https://doi.org/10.5194/tc-17-5007-2023, 2023. a
Largeron, C., Dumont, M., Morin, S., Boone, A., Lafaysse, M., Metref, S., Cosme, E., Jonas, T., Winstral, A., and Margulis, S. A.: Toward snow cover estimation in mountainous areas using modern data assimilation methods: a review, Front. Earth Sci., 8, https://doi.org/10.3389/feart.2020.00325, 2020. a
Li, D., Lettenmaier, D. P., Margulis, S. A., and Andreadis, K.: The role of rain-on-snow in flooding over the conterminous United States, Water Resour. Res., 55, 8492–8513, https://doi.org/10.1029/2019WR024950, 2019. a
Li, W., Chen, J., Li, L., Orsolini, Y. J., Xiang, Y., Senan, R., and de Rosnay, P.: Impacts of snow assimilation on seasonal snow and meteorological forecasts for the Tibetan Plateau, The Cryosphere, 16, 4985–5000, https://doi.org/10.5194/tc-16-4985-2022, 2022. a
Lievens, H., Demuzere, M., Marshall, H.-P., Reichle, R. H., Brucker, L., Brangers, I., de Rosnay, P., Dumont, M., Girotto, M., Immerzeel, W. W., Jonas, T., Kim, E. J., Koch, I., Marty, C., Saloranta, T., Schöber, J., and De Lannoy, G. J. M.: Snow depth variability in the Northern Hemisphere mountains observed from space, Nat. Commun., 10, 4629, https://doi.org/10.1038/s41467-019-12566-y, 2019. a
Lievens, H., Brangers, I., Marshall, H.-P., Jonas, T., Olefs, M., and De Lannoy, G.: Sentinel-1 snow depth retrieval at sub-kilometer resolution over the European Alps, The Cryosphere, 16, 159–177, https://doi.org/10.5194/tc-16-159-2022, 2022. a
Liston, G. E., Haehnel, R. B., Sturm, M., Hiemstra, C. A., Berezovskaya, S., and Tabler, R. D.: Simulating complex snow distributions in windy environments using SnowTran-3D, J. Glaciol., 53, 241–256, https://doi.org/10.3189/172756507782202865, 2007. a
Liu, Y., Fang, Y., and Margulis, S. A.: Spatiotemporal distribution of seasonal snow water equivalent in High Mountain Asia from an 18-year Landsat–MODIS era snow reanalysis dataset, The Cryosphere, 15, 5261–5280, https://doi.org/10.5194/tc-15-5261-2021, 2021. a, b
López-Moreno, J. I., Fassnacht, S. R., Heath, J. T., Musselman, K. N., Revuelto, J., Latron, J., Morán-Tejeda, E., and Jonas, T.: Small scale spatial variability of snow density and depth over complex alpine terrain: implications for estimating snow water equivalent, Adv. Water Resour., 55, 40–52, https://doi.org/10.1016/J.ADVWATRES.2012.08.010, 2013. a
Louis, J.-F.: A parametric model of vertical eddy fluxes in the atmosphere, Bound.-Lay. Meteorol., 17, 187–202, https://doi.org/10.1007/BF00117978, 1979. a
Magnusson, J., Gustafsson, D., Hüsler, F., and Jonas, T.: Assimilation of point SWE data into a distributed snow cover model comparing two contrasting methods, Water Resour. Res., 50, 7816–7835, https://doi.org/10.1002/2014WR015302, 2014. a
Magnusson, J., Nævdal, G., Matt, F., Burkhart, J. F., and Winstral, A.: Improving hydropower inflow forecasts by assimilating snow data, Hydrol. Res., 51, 226–237, https://doi.org/10.2166/NH.2020.025, 2020. a
Magnusson, J., Bühler, Y., Quéno, L., Cluzet, B., Mazzotti, G., Webster, C., Mott, R., and Jonas, T.: High-resolution hydrometeorological and snow data for the Dischma catchment in Switzerland, Earth Syst. Sci. Data, 17, 703–717, https://doi.org/10.5194/essd-17-703-2025, 2025. a, b
Margulis, S. A., Girotto, M., Cortés, G., and Durand, M.: A particle batch smoother approach to snow water equivalent estimation, J. Hydrometeorol., 16, 1752–1772, https://doi.org/10.1175/JHM-D-14-0177.1, 2015. a
Margulis, S. A., Cortés, G., Girotto, M., and Durand, M.: A Landsat-Era Sierra Nevada snow reanalysis (1985–2015), J. Hydrometeorol., 17, 1203–1221, https://doi.org/10.1175/JHM-D-15-0177.1, 2016. a, b
Mazzotti, G., Essery, R., Moeser, C. D., and Jonas, T.: Resolving small scale forest snow patterns using an energy balance snow model with a one layer canopy, Water Resour. Res., 56, https://doi.org/10.1029/2019WR026129, 2020a. a
Mazzotti, G., Essery, R., Webster, C., Malle, J., and Jonas, T.: Process level evaluation of a hyper resolution forest snow model using distributed multisensor observations, Water Resour. Res., 56, https://doi.org/10.1029/2020WR027572, 2020b. a
Mazzotti, G., Webster, C., Essery, R., and Jonas, T.: Increasing the physical representation of forest-snow processes in coarse-resolution models: lessons learned from upscaling hyper-resolution simulations, Water Resour. Res., 57, e2020WR029064, https://doi.org/10.1029/2020WR029064, 2021. a, b, c
Mazzotti, G., Webster, C., Quéno, L., Cluzet, B., and Jonas, T.: Canopy structure, topography, and weather are equally important drivers of small-scale snow cover dynamics in sub-alpine forests, Hydrol. Earth Syst. Sci., 27, 2099–2121, https://doi.org/10.5194/hess-27-2099-2023, 2023. a, b
Menard, C. B., Essery, R., Krinner, G., Arduini, G., Bartlett, P., Boone, A., Brutel-Vuilmet, C., Burke, E., Cuntz, M., Dai, Y., Decharme, B., Dutra, E., Fang, X., Fierz, C., Gusev, Y., Hagemann, S., Haverd, V., Kim, H., Lafaysse, M., Marke, T., Nasonova, O., Nitta, T., Niwano, M., Pomeroy, J., Schädler, G., Semenov, V. A., Smirnova, T., Strasser, U., Swenson, S., Turkov, D., Wever, N., and Yuan, H.: Scientific and human errors in a snow model intercomparison, B. Am. Meteorol. Soc., 102, E61–E79, https://doi.org/10.1175/BAMS-D-19-0329.1, 2021. a, b
MeteoSwiss: Project ICON-22 – MeteoSwiss, https://www.meteoswiss.admin.ch/about-us/research-and-cooperation/projects/2023/icon-22.html (last access: 10 June 2026), 2023. a
MeteoSwiss: The introduction of the new weather model ICON marks a milestone in Swiss weather forecasting – MeteoSwiss, https://www.meteoswiss.admin.ch/about-us/media/press-releases/2024/06/the-introduction-of-the-new-weather-model-icon-marks-a-milestone-in-swiss-weather-forecasting.html (last access: 10 June 2026), 2024. a, b
MeteoSwiss: The climate of Switzerland – MeteoSwiss, https://www.meteoswiss.admin.ch/climate/the-climate-of-switzerland.html (last access: 10 June 2026), 2025. a
Monteiro, D. and Morin, S.: Multi-decadal analysis of past winter temperature, precipitation and snow cover data in the European Alps from reanalyses, climate models and observational datasets, The Cryosphere, 17, 3617–3660, https://doi.org/10.5194/tc-17-3617-2023, 2023. a
Moreno-Gené, J., Sánchez-Pulido, L., Cristobal-Fransi, E., and Daries, N.: The economic sustainability of snow tourism: the case of ski resorts in Austria, France, and Italy, Sustainability, 10, 3012,, https://doi.org/10.3390/SU10093012, 2018. a
Morin, S., Samacoïts, R., François, H., Carmagnola, C. M., Abegg, B., Demiroglu, O. C., Pons, M., Soubeyroux, J. M., Lafaysse, M., Franklin, S., Griffiths, G., Kite, D., Hoppler, A. A., George, E., Buontempo, C., Almond, S., Dubois, G., and Cauchy, A.: Pan-European meteorological and snow indicators of climate change impact on ski tourism, Climate Services, 22, 100215, https://doi.org/10.1016/J.CLISER.2021.100215, 2021. a
Mortimer, C. and Vionnet, V.: Northern Hemisphere in situ snow water equivalent dataset (NorSWE, 1979–2021), Earth Syst. Sci. Data, 17, 3619–3640, https://doi.org/10.5194/essd-17-3619-2025, 2025. a
Mortimer, C., Mudryk, L., Derksen, C., Luojus, K., Brown, R., Kelly, R., and Tedesco, M.: Evaluation of long-term Northern Hemisphere snow water equivalent products, The Cryosphere, 14, 1579–1594, https://doi.org/10.5194/tc-14-1579-2020, 2020. a
Mott, R., Vionnet, V., and Grünewald, T.: The seasonal snow cover dynamics: review on wind-driven coupling processes, Front. Earth Sci., 6, 197, https://doi.org/10.3389/feart.2018.00197, 2018. a
Mott, R., Winstral, A., Cluzet, B., Helbig, N., Magnusson, J., Mazzotti, G., Quéno, L., Schirmer, M., Webster, C., and Jonas, T.: Operational snow-hydrological modeling for Switzerland, Front. Earth Sci., 11, https://doi.org/10.3389/feart.2023.1228158, 2023. a, b, c, d, e, f, g, h
Mott, R., Winstral, A., Cluzet, B., Helbig, N., Magnusson, J., Mazzotti, G., Queno, L., Schirmer, M., Webster, C., and Jonas, T.: FSM2oshd (v1.1.3), Zenodo [code], https://doi.org/10.5281/zenodo.20410047, 2026. a, b
Musselman, K. N., Lehner, F., Ikeda, K., Clark, M. P., Prein, A. F., Liu, C., Barlage, M., and Rasmussen, R.: Projected increases and shifts in rain-on-snow flood risk over western North America, Nat. Clim. Change, 8, 808–812, https://doi.org/10.1038/s41558-018-0236-4, 2018. a
Musselman, K. N., Addor, N., Vano, J. A., and Molotch, N. P.: Winter melt trends portend widespread declines in snow water resources, Nat. Clim. Change, 11, 418–424, https://doi.org/10.1038/S41558-021-01014-9, 2021. a
NASA GISS: Panoply 5 netCDF, HDF and GRIB Data Viewer, https://www.giss.nasa.gov/tools/panoply/ (last access: 10 June 2026), 2025. a
Oberrauch, M., Cluzet, B., Magnusson, J., and Jonas, T.: Improving fully distributed snowpack simulations by mapping perturbations of meteorological forcings inferred from particle filter assimilation of snow monitoring data, Water Resour. Res., 60, https://doi.org/10.1029/2023WR036994, 2024. a, b, c, d, e, f, g, h, i, j
Oberrauch, M., Cluzet, B., Magnusson, J., and Jonas, T.: The performance gains of assimilating limited information into a fully distributed snowpack model depend on model complexity and input data quality, Water Resour. Res., 61, https://doi.org/10.1029/2025WR040681, 2025. a, b, c, d, e, f, g, h, i, j, k, l, m
Oberrauch, M., Cluzet, B., Magnusson, J., Mazzotti, G., Mott, R., Quéno, L., Webster, C., Zolles, T., and Jonas, T.: A high-resolution snow dataset for Switzerland (2016–2025) combining physics-based simulations and in situ observations, Zenodo [code], https://doi.org/10.5281/zenodo.17313889, 2026. a, b, c
Odry, J., Boucher, M.-A., Lachance-Cloutier, S., Turcotte, R., and St-Louis, P.-Y.: Large-scale snow data assimilation using a spatialized particle filter: recovering the spatial structure of the particles, The Cryosphere, 16, 3489–3506, https://doi.org/10.5194/tc-16-3489-2022, 2022. a
Olefs, M., Koch, R., Schöner, W., and Marke, T.: Changes in Snow Depth, Snow Cover Duration, and Potential Snowmaking Conditions in Austria, 1961–2020 – a model based approach, Atmosphere-Basel, 11, 1330, https://doi.org/10.3390/ATMOS11121330, 2020. a
Painter, T. H., Berisford, D. F., Boardman, J. W., Bormann, K. J., Deems, J. S., Gehrke, F., Hedrick, A., Joyce, M., Laidlaw, R., Marks, D., Mattmann, C., McGurk, B., Ramirez, P., Richardson, M., Skiles, S. M. K., Seidel, F. C., and Winstral, A.: The Airborne Snow Observatory: fusion of scanning lidar, imaging spectrometer, and physically-based modeling for mapping snow water equivalent and snow albedo, Remote Sens. Environ., 184, 139–152, https://doi.org/10.1016/j.rse.2016.06.018, 2016. a
Publications Office of the European Union: Drought in Europe – March 2023 – GDO analytical report, Tech. rep., https://doi.org/10.2760/998985, 2023. a
Quéno, L., Mott, R., Morin, P., Cluzet, B., Mazzotti, G., and Jonas, T.: Snow redistribution in an intermediate-complexity snow hydrology modelling framework, The Cryosphere, 18, 3533–3557, https://doi.org/10.5194/tc-18-3533-2024, 2024. a, b, c
Rasul, G. and Molden, D.: The global social and economic consequences of mountain cryospheric change, Frontiers in Environmental Science, 7, 91, https://doi.org/10.3389/fenvs.2019.00091, 2019. a
Revuelto, J., Azorin-Molina, C., Alonso-González, E., Sanmiguel-Vallelado, A., Navarro-Serrano, F., Rico, I., and López-Moreno, J. I.: Meteorological and snow distribution data in the Izas Experimental Catchment (Spanish Pyrenees) from 2011 to 2017, Earth Syst. Sci. Data, 9, 993–1005, https://doi.org/10.5194/essd-9-993-2017, 2017. a
Reynolds, D., Quéno, L., Lehning, M., Jafari, M., Berg, J., Jonas, T., Haugeneder, M., and Mott, R.: Seasonal snow–atmosphere modeling: let's do it, The Cryosphere, 18, 4315–4333, https://doi.org/10.5194/tc-18-4315-2024, 2024. a
Siirila-Woodburn, E. R., Rhoades, A. M., Hatchett, B. J., Huning, L. S., Szinai, J., Tague, C., Nico, P. S., Feldman, D. R., Jones, A. D., Collins, W. D., and Kaatz, L.: A low-to-no snow future and its impacts on water resources in the western United States, Nature Reviews Earth and Environment, 2, 800–819, https://doi.org/10.1038/s43017-021-00219-y, 2021. a
Slatyer, R. A., Umbers, K. D., and Arnold, P. A.: Ecological responses to variation in seasonal snow cover, Conserv. Biol., 36, e13727, https://doi.org/10.1111/COBI.13727, 2022. a
swissALTIRegio: swissALTIRegio, https://www.swisstopo.admin.ch/en/height-model-swissaltiregio (last access: 10 June 2026), 2025. a, b
swissSurface3D: swissSURFACE3D, https://www.swisstopo.admin.ch/en/height-model-swisssurface3d (last access: 10 June 2026), 2025. a, b
Szerencsits, E.: Swiss tree lines – a GIS-based approximation, Landscape Online, 28, 28–28, https://doi.org/10.3097/LO.201228, 2012. a
Vernay, M., Lafaysse, M., Monteiro, D., Hagenmuller, P., Nheili, R., Samacoíts, R., Verfaillie, D., and Morin, S.: The S2M meteorological and snow cover reanalysis over the French mountainous areas: description and evaluation (1958–2021), Earth Syst. Sci. Data, 14, 1707–1733, https://doi.org/10.5194/essd-14-1707-2022, 2022. a, b
Vionnet, V., Brun, E., Morin, S., Boone, A., Faroux, S., Le Moigne, P., Martin, E., and Willemet, J.-M.: The detailed snowpack scheme Crocus and its implementation in SURFEX v7.2, Geosci. Model Dev., 5, 773–791, https://doi.org/10.5194/gmd-5-773-2012, 2012. a, b
Webster, C., Essery, R., Mazzotti, G., and Jonas, T.: Using just a canopy height model to obtain lidar-level accuracy in 3D forest canopy shortwave transmissivity estimates, Agr. Forest Meteorol., 338, 109429, https://doi.org/10.1016/J.AGRFORMET.2023.109429, 2023. a
Webster, C., Ginzler, C., Marty, M., Nussbaumer, A., Mazzotti, G., and Jonas, T.: Hourly potential light availability maps at 10 m resolution over Switzerland, Scientific Data, 12, 1882, https://doi.org/10.1038/s41597-025-06152-9, 2025. a, b, c, d, e
Winstral, A., Jonas, T., and Helbig, N.: Statistical downscaling of gridded wind speed data using local topography, J. Hydrometeorol., 18, 335–348, https://doi.org/10.1175/JHM-D-16-0054.1, 2017. a
Xie, J., Kneubühler, M., Garonna, I., de Jong, R., Notarnicola, C., De Gregorio, L., and Schaepman, M. E.: Relative influence of timing and accumulation of snow on Alpine land surface phenology, J. Geophys. Res.-Biogeo., 123, 561–576, https://doi.org/10.1002/2017JG004099, 2018. a
Zängl, G., Reinert, D., Rípodas, P., and Baldauf, M.: The ICON (ICOsahedral Non hydrostatic) modelling framework of DWD and MPI M : Description of the non hydrostatic dynamical core, Q. J. Roy. Meteor. Soc., 141, 563–579, https://doi.org/10.1002/qj.2378, 2015. a, b