the Creative Commons Attribution 4.0 License.
the Creative Commons Attribution 4.0 License.
 | 02 Jun 2026
Seasonal glacier motion variations and underlying hydro-mechanical processes at Glacier d'Argentière, French Alps
Adrien Gilbert
Florent Gimbert
Andrea Walpersdorf
Subglacial hydrology controls basal sliding of hard-bedded glaciers by modulating basal drag through changes in ice–bed separation. Yet, the underlying mechanisms that control ice–bed separation and its links with basal friction remain poorly understood. In this study, we contribute to a better understanding of this problem by evaluating spatial and temporal changes in bed separation in relation to changes in glacier horizontal velocity using three years of continuous and dense GPS records from Glacier d'Argentière (French Alps). We confirm a previous study showing that spatial and temporal variations in glacier vertical motion mainly reflect changes in ice–bed separation, as they cannot be explained by variations in internal strain rates. We find that the rate of uplift is in anti-phase with subglacial water discharge, being positive in winter in the absence of surface melt and negative during summer melt. We suggest that this behavior results from basal cavities being weakly connected in winter, allowing them to fill slowly under low water input from englacial storage release or basal melt, and then rapidly transitioning to a connected state in summer, enabling efficient drainage of surface meltwater and reduced cavity sizes. A key finding is that changes in horizontal velocity are well correlated, both in time and space, with changes in ice–bed separation. This results in an increase in horizontal velocity in winter that can be quantitatively compared with modeled values related to subsequent variations in basal cavity size. This contrasts strongly with previous observations in steeper parts of Glacier d'Argentière, where velocities were found to decrease consistently in winter and where it was argued that seasonal motion was primarily controlled by cavities being connected year-round. We discuss the potential mechanisms underlying these discrepancies and how they may also explain observations of seasonal glacier dynamics in Greenland.
- Article
(6985 KB) - Full-text XML
-
Supplement
(35166 KB) - BibTeX
- EndNote


Glacier basal sliding generally exhibits seasonal variations, with summer speeds reaching up to three times the average speed in winter (Nienow et al., 1998; Ryser et al., 2014; Vincent and Moreau, 2016). These variations are controlled by the seasonal influx of surface meltwater beneath the glacier through moulins and crevasses, which increases water pressure and thus basal lubrication (Lliboutry, 1968; Iken and Bindschadler, 1986). Water pressure is expected to be a function not only of the water supply rate but also of the conductivity of the subglacial drainage system. The subglacial drainage network is generally conceptualized as a combination of two distinct components: a distributed system, which is hydrologically inefficient, and a channelized system, which facilitates efficient meltwater evacuation (Davison et al., 2019).
At the onset of the melt season, the subglacial hydrology system is thought to be mainly composed of a widespread network of cavities (water pockets between bedrock bumps) with low drainage efficiency. Such system favors water pressure increase in response to meltwater input, resulting in a “spring acceleration” observed in many glaciers (Iken, 1981; Mair et al., 2001; Anderson et al., 2004; Bingham et al., 2008). Elevated basal water pressure increases cavity size (also known as bed separation) which reduces apparent bed roughness and enhances basal sliding (Lliboutry, 1958; Hodge, 1974; Iken and Bindschadler, 1986; Fowler, 1987; Gagliardini et al., 2007). As the melt season progresses, the distributed subglacial drainage system may evolve into a channelized network (Röthlisberger, 1972) capable of efficiently evacuating large volumes of meltwater through subglacial conduits at low water pressure, resulting in glacier slow down (Nye, 1976; Spring and Hutter, 1982; Tedstone et al., 2015).
This view is challenged by an expanding body of observations from both the Greenland Ice Sheet (GrIS) (Andrews et al., 2014; Mejia et al., 2021) and mountain glaciers (Lefeuvre et al., 2015; Rada and Schoof, 2018) suggesting that hydraulic isolation of significant parts of glacier beds is a common phenomenon, even during the summer melt season (Rada and Schoof, 2018). In the interior regions of the GrIS, observations attribute the summer slowdown to pressure decreases in cavities that remain largely hydraulically isolated from the lower pressure, efficient drainage system (Andrews et al., 2014; Mejia et al., 2021). Because isolated or weakly connected cavities are likely widespread and water pressures in these are high, they have a strong potential for modulating sliding speeds. These observations raise important questions regarding future sea-level rise projections, as existing large-scale subglacial drainage models typically assume that the glacier bed remains entirely hydraulically connected (Werder et al., 2013; Sommers et al., 2023).
Seasonal velocity patterns vary substantially between glaciers, further illustrating the complexity of subglacial drainage systems. Satellite observations along the margins of the GrIS reveal three distinct seasonal velocity behaviors (Moon et al., 2014; Vijay et al., 2019; Solgaard et al., 2022). Type 1 behavior is characterized by a speedup from late spring through early summer, with velocities remaining elevated until late winter. In this pattern, meltwater is interpreted to drive the initial acceleration, while the subsequent sustained high speeds are primarily linked to terminus retreat. Type 2 behavior displays a strong early-summer speedup that coincides with runoff, indicating a predominantly inefficient subglacial drainage system. In contrast, Type 3 behavior features a velocity increase through winter followed by a pronounced late-summer minimum during periods of high runoff, a cycle consistent with a seasonal transition from an inefficient to an efficient subglacial drainage system. This diverse behavior of seasonal velocity cycles is the basis of current understanding of hydrology-dynamic coupling and how increased melting will influence flow speeds and mass loss in the future (Davison et al., 2019).
While these patterns are well-documented at the ice-sheet scale, resolving the specific physical mechanisms driving them requires high-resolution observations that are often only possible on smaller, more accessible mountain glaciers. Glacier d'Argentière in the French Alps is one such key site, as it is one of the few glaciers where sliding velocity has been directly measured in a natural subglacial cavity at the terminus of the glacier (Vincent and Moreau, 2016). Using these long-term direct measurements, previous studies demonstrated that bed shear stress strongly influences effective pressure through a feedback between subglacial drainage and basal sliding (Gimbert et al., 2021a), and subsequently developed a fully coupled hydro-mechanical model to describe this interaction (Gilbert et al., 2022). However, a few hundred meters upstream, Vincent et al. (2022) observed winter uplift and acceleration, which they suggested may result from increasing bed separation due to the growth of basal cavities that remain isolated during winter. This discrepancy further attests that, beyond meltwater input, other factors such as ice thickness, surface slope, and bed topography may also modulate effective pressure.
Here we investigate subglacial hydrology and its influence on basal friction at the same site studied by Vincent et al. (2022), but using a dense GNSS network with significantly higher temporal resolution, continuously operating for 3 years (2019–2021) in the ablation zone of Glacier d'Argentière. We decompose the GNSS-derived motion into its horizontal and vertical components and use the vertical velocities to reconstruct the evolution of basal cavity growth and closure, and the horizontal velocities to assess changes in basal sliding. We then interpret these variations in terms of evolving subglacial hydrology and its control on basal friction by comparing these data to a coupled hydro-mechanical model developed for the nearby cavitometer site. These high-resolution observations contribute to a better understanding of the seasonal processes that control frictional changes as a function of the evolution of subglacial hydrology.
2.1 Study site
Glacier d'Argentière is located in the Mont-Blanc Massif in the French Alps (Fig. 1a) and is considered to be a hard-bedded glacier (Vivian and Bocquet, 1973; Gimbert et al., 2021a, b). It originates at about 3400 m a.s.l. and terminates at around 1600 m a.s.l., spanning a total length of ∼10 km. The equilibrium-line altitude laid at about 2900 m during 2019–2021 (Vincent et al., 2009). Our study site is located in the ablation zone at ∼2380 m, where the glacier is characterized by a sharply incised V-shaped valley (Hantz and Lliboutry, 1983; Vincent et al., 2009) and where previous studies have documented ice dynamics in relation to subglacial hydrology (Vincent et al., 2022; Togaibekov et al., 2024; Roldán-Blasco et al., 2025; Nanni et al., 2020, 2021). At this location, the glacier has a relatively shallow surface slope (10 %), a maximum thickness of 255 m (Fig. 1a), and an average surface melt rate from May to September of 0.05 m w.e. d−1 (Togaibekov et al., 2025).
2.2 Field set-up
Five Global Positioning System (GPS) stations were deployed in the ablation zone of Glacier d'Argentière in February 2019, with an additional seven stations installed in February 2020 (inset map in Fig. 1a). GPS antennas were mounted on aluminum poles anchored up to 6 m deep in the ice (Fig. 1b). The distance between neighboring survey stations ranges from 50 to 200 m. Regular field visits (monthly at most during a melting season) ensured the upright position of the antenna poles and continuous power supply. We employ multi-frequency Leica GR25 receivers and Leica AS10 antennas, which continuously record GPS signals at a 1 Hz sampling interval. The raw GPS data are decimated to 30 s intervals and converted into 24 h-long RINEX (Receiver INdependent EXchange) format files. Although we collected multi-GNSS (Global Navigation Satellite Systems) observables, only GPS data were used in this study.
In addition to GPS, we utilize a wide range of complementary observations. In situ measurements of basal sliding velocity are made thanks to direct access to a subglacial cavity and the installation of specialized equipment known as a “cavitometer” (green diamond in Fig. 1a) (Gimbert et al., 2021a; Gilbert et al., 2022; Vincent and Moreau, 2016; Vivian and Bocquet, 1973). This equipment consists of a bicycle wheel (Fig. 1c) recording basal velocity at 30 min intervals with a precision better than ±1 cm d−1 (Vincent and Moreau, 2016). The bed topography at these locations is distinct: the glacier is steep (20 %) and thin (55 m) at the cavitometer location, whereas it is flatter (10 %) and thicker (250 m) at the GPS network site (Gimbert et al., 2021a). At the cavitometer site, a sharp local break in bed slope allows the ice to detach without elevated water pressure. Given this unique setting, we suggest that sliding variations are instead driven by water pressure changes in surrounding cavities within the broader region (Gimbert et al., 2021a). To complement these velocity data, we also incorporate in our study a network of 27 ablation stakes from Vincent et al. (2022). The stakes were measured 5–8 times per year at Profile 4 (blue line in Fig. 1a) between 2018 and 2020 with an intrinsic accuracy of ±0.01 m.
Water discharge (blue square in Fig. 1a) is recorded in excavated tunnels beneath the glacier tongue, a few hundred meters downstream of the cavitometer, at 15 min intervals, with a maximum measurable discharge of approximately 10 m3 s−1 due to collector capacity limitations (Vincent and Moreau, 2016). This limitation was eliminated after an upgrade to a more advanced monitoring system in summer 2020. The new installation utilizes laser altimetry to measure water surface elevation within a stable, concrete-lined conduit, with a rating curve established using dye-tracing experiments. This system also enables the measurement of low discharge values below 1 m3 s−1, which is important for capturing minimum flow rates during the winter periods. The discharge measurements are performed at a well-identified notch in the bedrock valley, with only a minimal amount of water flowing out elsewhere, ensuring the measurements are representative of the total discharge. Water pressure is measured in a borehole (yellow star in Fig. 1a) next to the GPS site ARG1 using a piezometer positioned 95 m above the bed. To obtain the basal water pressure, we add a constant pressure equivalent to the water column height of 95 m. The borehole was operational from September 2019 to October 2020, although it is thought that it decoupled from the subglacial hydraulic system during the summer of 2020 (Roldán-Blasco et al., 2025). We also use air temperature data obtained at 30 min intervals from the SAFRAN meteorological reanalysis in the French Alps (Vernay et al., 2022).
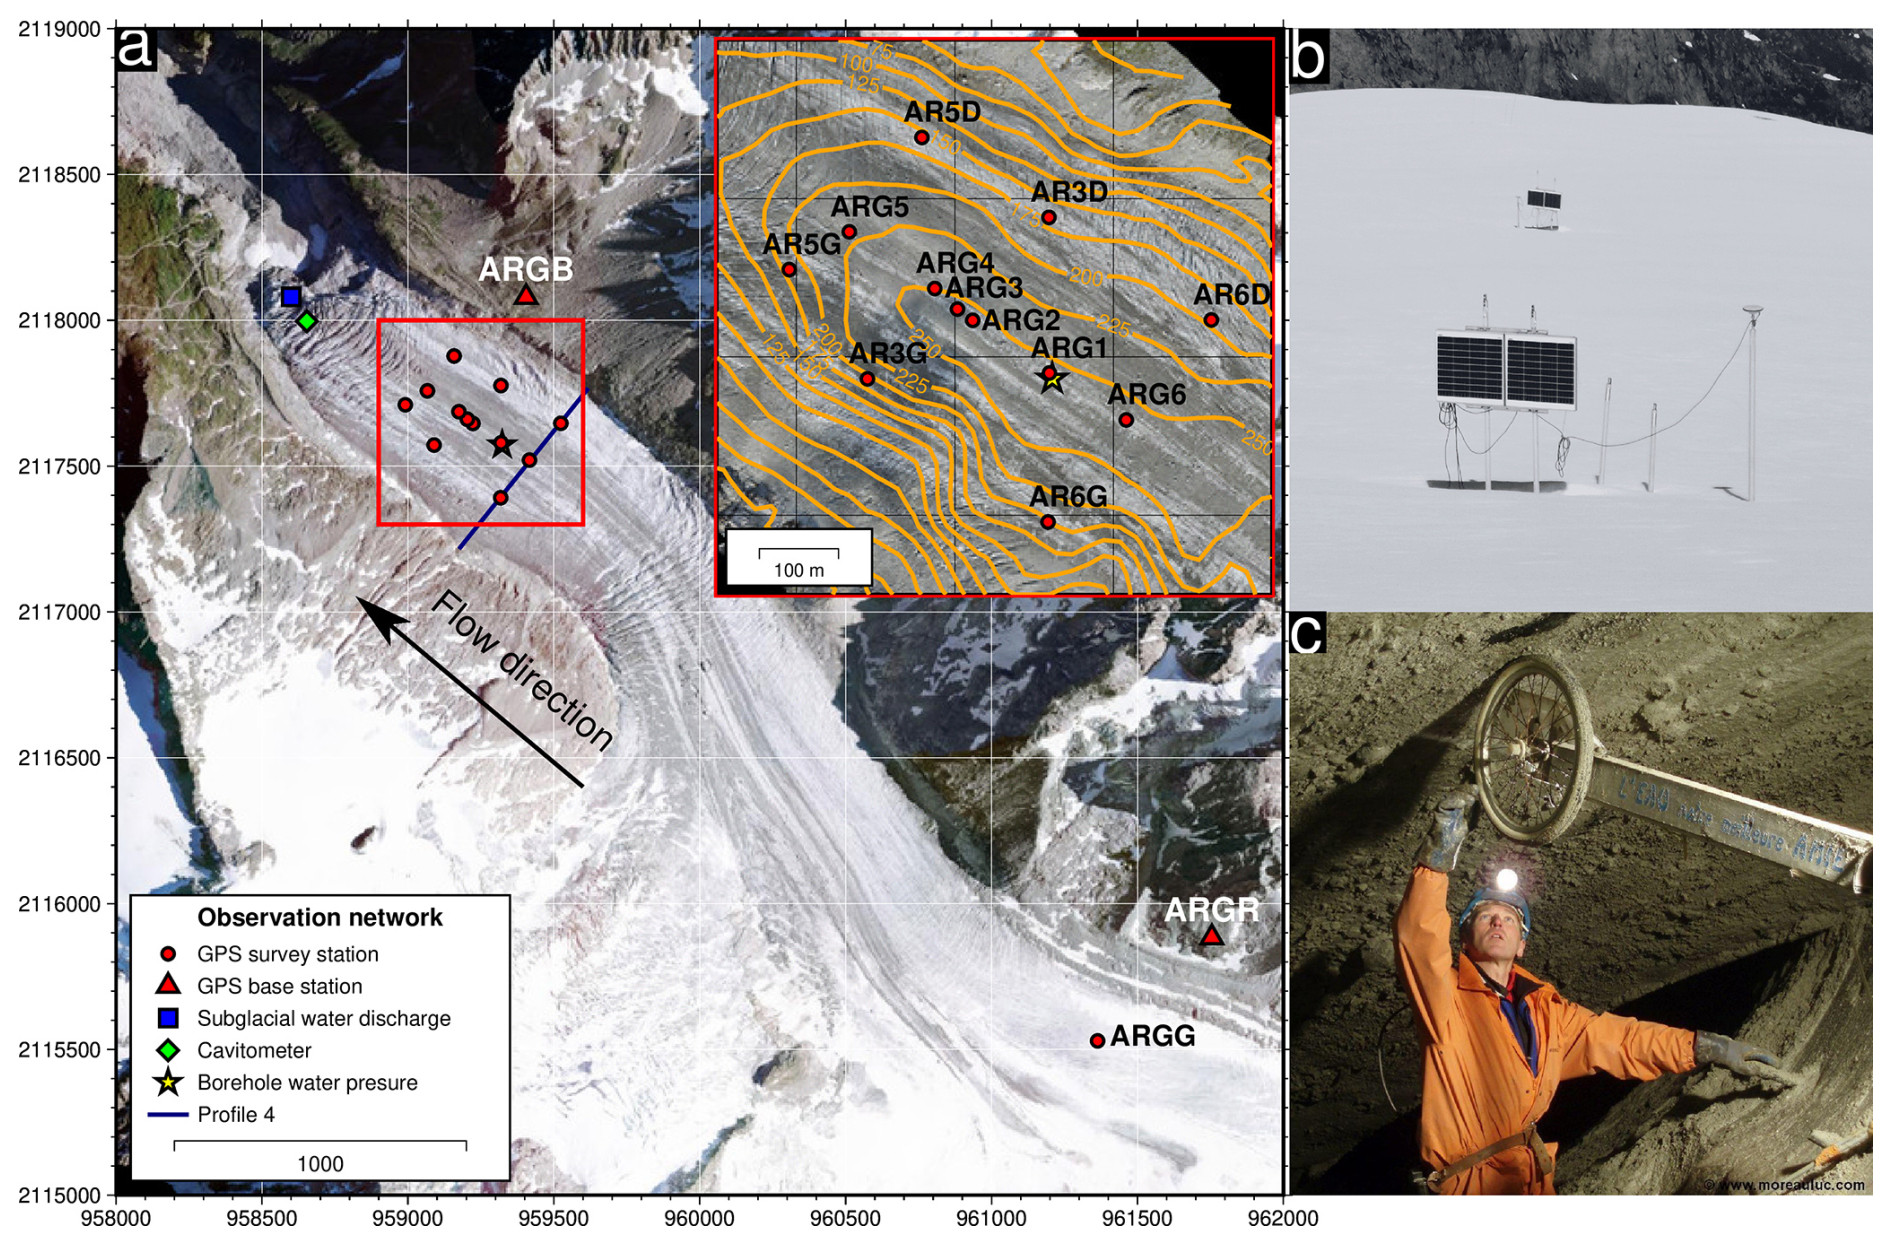
Figure 1(a) Map showing the observation network at Glacier d'Argentière. The red rectangle indicates the location of twelve along-flow GPS sites (red circles, also shown in the top-right inset map). The dark blue line represents Profile 4, which was used to set the model parameters. The isolines in the inset show the glacier thickness in meters. Coordinates are given in the cartesian NTF (Paris)/Lambert zone II coordinate system. (b, c) Pictures of (b) two GPS stations and (c) the cavitometer.
2.3 GPS data processing
GPS data were processed in static mode with double difference and the ionosphere-free linear combination (Bock et al., 1986) using the geodetic software GAMIT/GLOBK (Herring et al., 2018). Daily GPS phase measurements were processed relative to 13 well-constrained IGS (International GNSS Service) stations located at distances ranging from 110 to 1080 km from Glacier d'Argentière. Unlike the kinematic solutions (Togaibekov et al., 2024), we do not filter these daily static solutions, as the 24 h window naturally attenuates short-term diurnal signals (Fig. S1b in the Supplement) while reducing high-frequency noise to preserve long-term seasonal trends (Fig. S1a). However, the formal errors generated by the software for static position estimates are only strictly applicable to stationary sites. Because Glacier d'Argentière moves over 10 cm d−1, applying these formal errors would violate the least-squares requirement, resulting in overestimated and biased residuals (King, 2004). Therefore, we estimate the precision empirically by assessing the quality of position estimates using the bedrock site ARGB (red triangle in Fig. 1a), located close to the survey network, which is exposed to a multi-path scattering environment similar to the on-ice sites. The position time series of the stationary site ARGB yields an average root-mean-square (RMS) of ±2.1 and ±6.1 mm for horizontal and vertical position estimates, respectively (Fig. S2a–c). While we use the RMS of the static ARGB site to estimate velocity errors for the on-ice sites, we acknowledge this likely represents a lower bound, as antenna motion can introduce additional errors during phase ambiguity resolution.
The daily position estimates are converted into horizontal and vertical velocity time series by subtracting successive coordinates over a 24 h interval and dividing by this time interval. The velocity error at site ARGB is ±2.3 mm d−1 (Fig. S2d), which we adopt for the survey stations on the glacier. Assuming the cyclic behavior of bed separation at the study site (Vincent et al., 2022), we remove a bed geometry-controlled linear trend in the vertical displacement time series for each annual cycle independently, ensuring that bed uplift returns to the same value each year. This enables both the local emergence velocity and the average vertical velocity component due to sliding along the bed to be corrected for. The influence of seasonal variation in sliding velocity along the bed was however neglected in our analysis, as the combination of a low bed slope of 3 degrees and 10–15 m a−1 of horizontal velocity change would introduce variation in vertical velocity below 0.8 m a−1, which is small compared to the observed variation of about 4 m a−1 (Fig. 2c). This approach imposes a common reference at an arbitrary datum, where the minimum point is set to zero. The mean values of the GPS-derived observables (horizontal velocity, vertical displacement, and vertical velocity) averaged across all sites are presented in Fig. 2. Time series of horizontal velocity and vertical displacement for individual GPS sites are provided in the Supplement (Fig. S3).
2.4 Model Description
The multidecadal measurements of basal sliding velocity Ub and water discharge at the cavitometer site have allowed to establish a calibrated friction law that is observationally constrained and captures sliding velocity changes that occurred over the past three decades (Gilbert et al., 2022). In this law, basal friction τb and subglacial hydrology are coupled through the transient evolution of the cavitation ratio θ as:
where As is the Weertman friction coefficient (m a−1 MPa−m), m is an exponent, and Ub is the basal sliding velocity. The evolution of θ through time is computed as a function of effective pressure N and sliding velocity Ub through the evolution equation of the form:
where lr is a characteristic length scale (m) representative of the distance between bedrock bumps, C, q, and α are positive constants as defined in Gagliardini et al. (2007).
In this study, following Gilbert et al. (2022), we use the friction law (Eq. 1) as a basal boundary condition of a full-Stokes ice flow model coupled to a subglacial hydrology model that describes the evolution of effective pressure in response to water supply at the glacier base. We adopt a simplified slab geometry adapted to our study site, setting the basal slope to 3° and the surface topography such that τb equals 0.1 MPa as inferred from inversions of the basal condition (Gilbert et al., 2023). We use the same friction law parameter values as constrained in Togaibekov et al. (2024).
The subglacial hydrological model is based on Gilbert et al. (2022) who propose a modified version of the GlaDS model (Werder et al., 2013) where the evolution of the sheet thickness h is computed according to the evolution of θ (Eq. 2). The coupled hydro-mechanical model operates with constant geometry and a 48 min timestep, with surface meltwater and rainfall provided as source terms in the hydraulic potential evolution equation (see Eq. 24 in Werder et al., 2013). We assume that surface water percolates instantly to the glacier bed through the numerous moulins and crevasses observed across the study area. The surface melt rate is calculated at each simulation timestep as proportional to the temperature above 0 °C during the timestep. The proportionality factor, known as the degree-day factor, is adjusted so that the integrated water flow in the model matches the total discharge measured at the cavitometer (see Fig. 2a).
2.5 Linking bed separation and sliding velocity
Variations in basal uplift are equivalent to variations in sheet thickness in the model such that a theoretical relationship between sliding velocity and basal uplift can be derived and compared with our observations. Following Gilbert et al. (2022), the sheet thickness h is given by:
with hr the average height of bedrock bumps (in meters) and p1 a fitting parameter. By combining Eqs. (1) and (3), we can link the sheet thickness to sliding velocity Ub:
The parameters hr and p1 were previously calibrated by Gilbert et al. (2022) based on a model comparison with observations at the cavitometer. They showed that p1=0.6 is well constrained, but that there is a trade-off between bump height hr and intrinsic hydraulic conductivity, since both parameters play a similar role in the sheet discharge formulation (Eq. 11 in Gilbert et al., 2022). The choice of hr=1 m is thus somewhat arbitrary but is representative of what is observed in the deglaciated part of Glacier d'Argentière.
3.1 Temporal variations
3.1.1 Observed seasonal variations of glacier motion
We observe clear seasonal variations in both vertical and horizontal motion during the three-year monitoring period (Fig. 2). Surface horizontal velocity and vertical displacement begin to increase immediately after the melting season ends, typically in October–November (Fig. 2a–c), coinciding with an increase in water pressure, as observed in winter 2019–2020 (Fig. 2b), reaching its peak close to overburden pressure around the highest velocity and uplift in May, known as the “spring event” (Iken and Bindschadler, 1986; Mair et al., 2003). The spring event occurs when the glacier is still snow-covered, immediately after the air temperature exceeds 0 °C but shortly before the onset of the water discharge rise, and lasts for about 5 d (Fig. 2). Following this event, both horizontal velocity and vertical displacement start to decline early in the melting season, while water discharge remains elevated throughout the summer months, fluctuating between 5 and 15 m3 s−1. While vertical displacement declines progressively, horizontal velocity exhibits short-term variations as long as water discharge is high (Fig. 2b). The minimum values of GPS-derived horizontal velocity and vertical displacement coincide with a significant drop in water discharge, typically in October–November, sometimes referred to in the literature as the “fall event” (Fudge et al., 2008; Rada and Schoof, 2018). The vertical velocity, on the other hand, is in anti-phase with water discharge, being negative during the summer months and positive from September to May. Similar behavior with smaller amplitude is also observed at station ARGG (Fig. S3), located approximately 3 km upstream, closer to the equilibrium line, suggesting that similar processes are at play in a significant portion of the glacier.
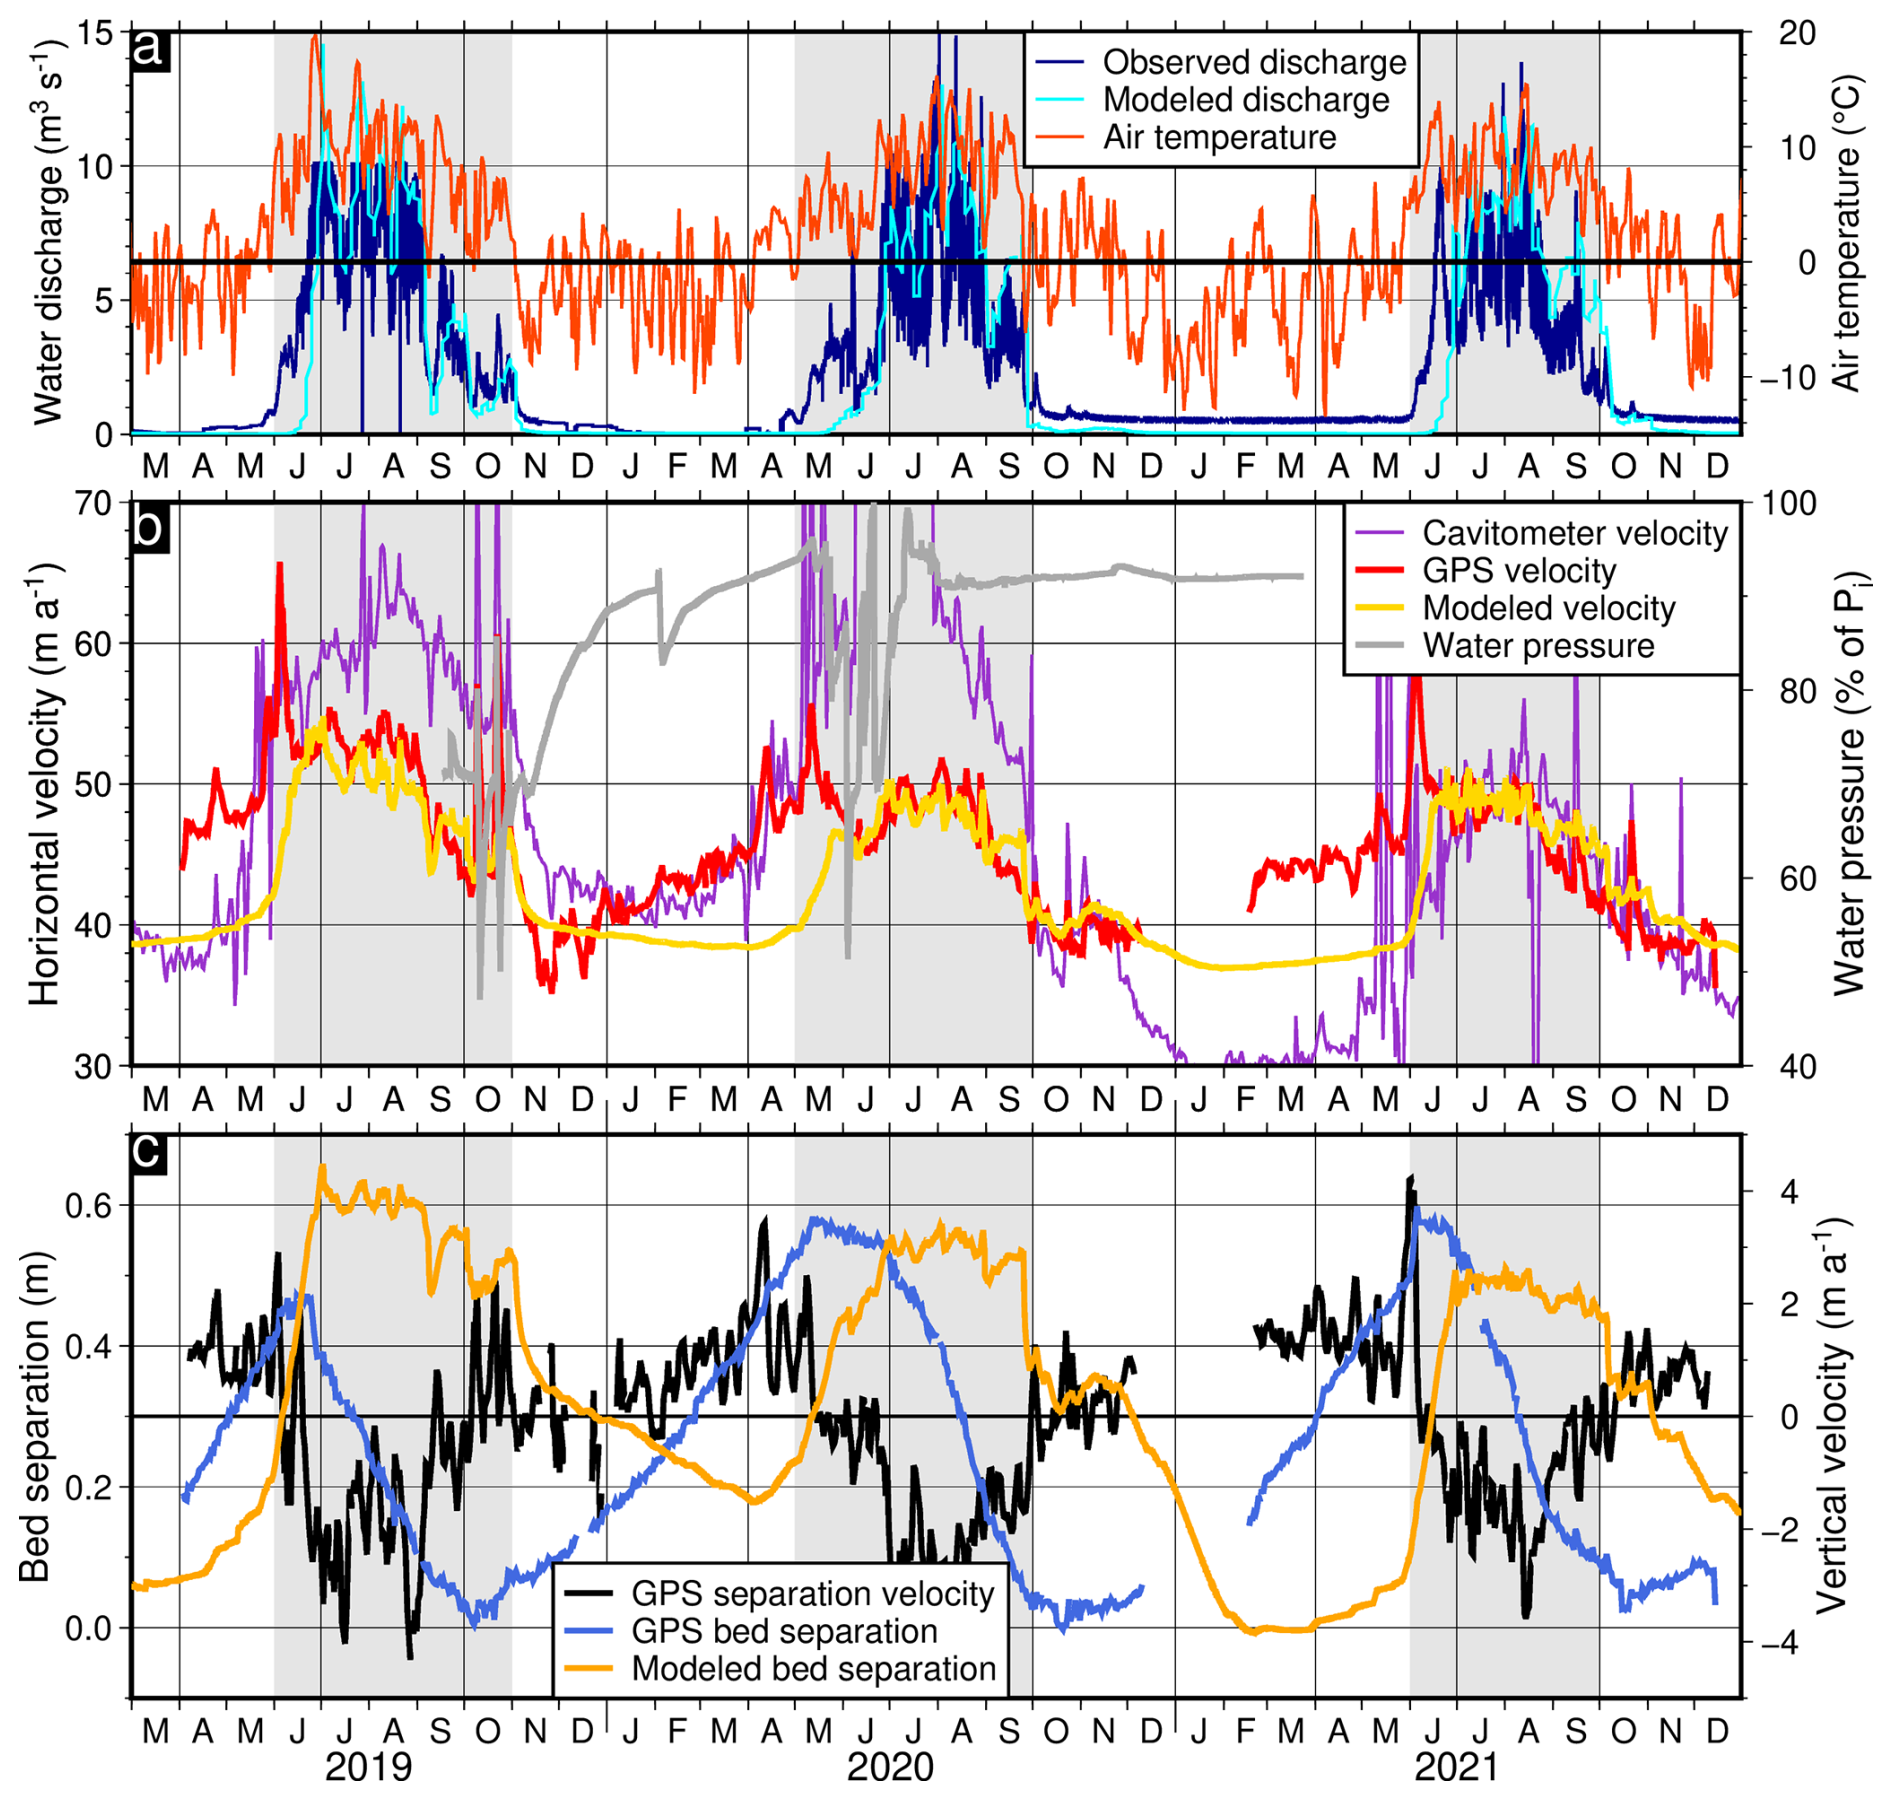
Figure 2Seasonal variations in (a) water discharge and air temperature, (b) horizontal velocity and water pressure, and (c) vertical displacement and vertical velocity time series over a 3-year observational period from 2019 to 2021. The GPS-derived horizontal velocity, bed separation, and separation velocity are given as an average across all available GPS sites. Water pressure is expressed as a percentage of the ice overburden pressure (Pi) for an ice thickness of 255 m. The shaded gray areas indicate the melt season.
3.1.2 Comparison with the cavitometer velocities
Both the sliding velocity measured by the cavitometer at the terminus of the glacier and the GPS-recorded surface velocity several hundred meters upglacier (Fig. 1) exhibit distinct seasonal variations. Both independent measurements capture a series of synchronous short-term speed-up events and a similar deceleration trend during the late melt season from July through November. Despite this shared patterns, they differ notably in overall magnitude and specific timing (Fig. 2b). At the cavitometer, the sliding velocity decreases toward a plateau over winter and increases significantly (by up to approximately 20–25 m a−1) as water discharge rises at the onset of melt in April. In contrast, the GPS-derived surface velocity increases progressively over winter, starting in November, by up to 15 m a−1. During the melt period, the cavitometer shows velocity variations similar to those in the GPS records but with a different amplitude due to higher basal shear stress at the cavitometer location (Gilbert et al., 2022). It is important to note the differences in the physical settings of these instruments: the cavitometer is located in an icefall area characterized by a significantly steeper basal slope angle and higher mean surface velocities compared to the flatter, slower-moving region monitored by the GPS network.
The winter of 2020–2021 is characterized by the lowest sliding velocities at the cavitometer, around 30 m a−1. Interestingly, this coincides with the smallest winter increase in GPS-derived surface velocity before the onset of the spring event, and it was preceded by the smallest velocity decrease in autumn (Fig. 2b). It is noteworthy that the water discharge level remains constant at about 1 m3 s−1 throughout the winter, indicating that basal water flows beneath the glacier year-round. As described in Sect. 2.2, the water discharge measurement system was upgraded in autumn 2020 because the previous system was not accurate enough to record low water discharge. This earlier technical limitation explains the zero values observed during the winters of 2018–2019 and 2019–2020.
3.1.3 Comparison with modeled velocities
The hydro-mechanical model, originally developed based on cavitometer measurements, only partially reproduces the seasonal patterns of velocity and uplift observed by GPS (Fig. 2b). The main discrepancy is that the model underestimates both the observed winter speed-up and uplift, which were previously found to result from enhanced bed separation due to increased storage of basal water in isolated cavities (Vincent et al., 2022). If this is the case, the model cannot, by design, simulate rising winter water pressures in isolated hydraulic systems. This is because hydraulic conductivity is set as a function that only increases with sheet thickness. Thus, growing cavities always reduce the water pressure in the model. This is a common limitation of current subglacial hydraulic models, which often fail to reproduce highly pressurized and disconnected subglacial environments (Downs et al., 2018; Flowers, 2015) that spontaneously form in the absence of surface melt (Hoffman et al., 2016).
Although, during the summer, the model accurately captures horizontal velocity variations, it produces changes in cavity size that are different from those inferred by GPS observations (Fig. 2c). Specifically, the GPS records show an earlier peak in bed separation coinciding with the spring event, followed by continuous subsidence throughout the melt season. In contrast, the model predicts a delayed peak and a more sustained level of uplift. These discrepancies between the measurements and the model raise the questions of whether the observed summer subsidence is truly representative of bed separation or whether the model lacks the appropriate physics.
3.1.4 Temporal relationship between bed separation and horizontal velocity
The seasonal relationship between winter uplift and velocity speed-up is strongly coupled and approximately linear (Fig. 3a, b). As the winter season progresses from November to May, a steady increase in bed separation from 0 m to approximately 0.5 m is accompanied by a proportional rise in horizontal velocity from roughly 35 to over 50 m a−1, yielding a slope of 27 m a−1 per meter of uplift (blue dashed line in Fig. 3b). Although this long-term seasonal trend is evident, short-term variations in horizontal velocity appear to be uncorrelated with the observed uplift, as they are mainly driven by rapid changes in water pressure at a constant cavitation state (Togaibekov et al., 2024). This relationship is also valid at the end of summer, when water discharge significantly decreases (below 5 m3 s−1), typically from late August to early November (Fig. 3a, c). Equation (4) provides a good order of magnitude for the relationship between winter speed-up and uplift (dark gray line in Fig. 3b), suggesting that bed uplift could serve as a good proxy for the overall cavitation state θ at the glacier base.
However, the horizontal velocity appears to be uncorrelated with bed separation during the subsidence phase immediately after the spring event in May. This is evident in Fig. 3c, where the summer months (July to August) exhibit a steep vertical drop in the scatter plot: bed separation decreases precipitously from approximately 0.6 to 0.2 m, yet horizontal velocity remains high between 45 and 55 m a−1. During these periods of high water discharge, which usually encompass most of the summer months in 2020 and 2021, cavities shrink when surface velocity was constant, possibly due to other processes affecting overall bed friction during this period. This deviation is less apparent in stake measurements, likely due to their lower temporal resolution (triangles and stars in Fig. 3c).
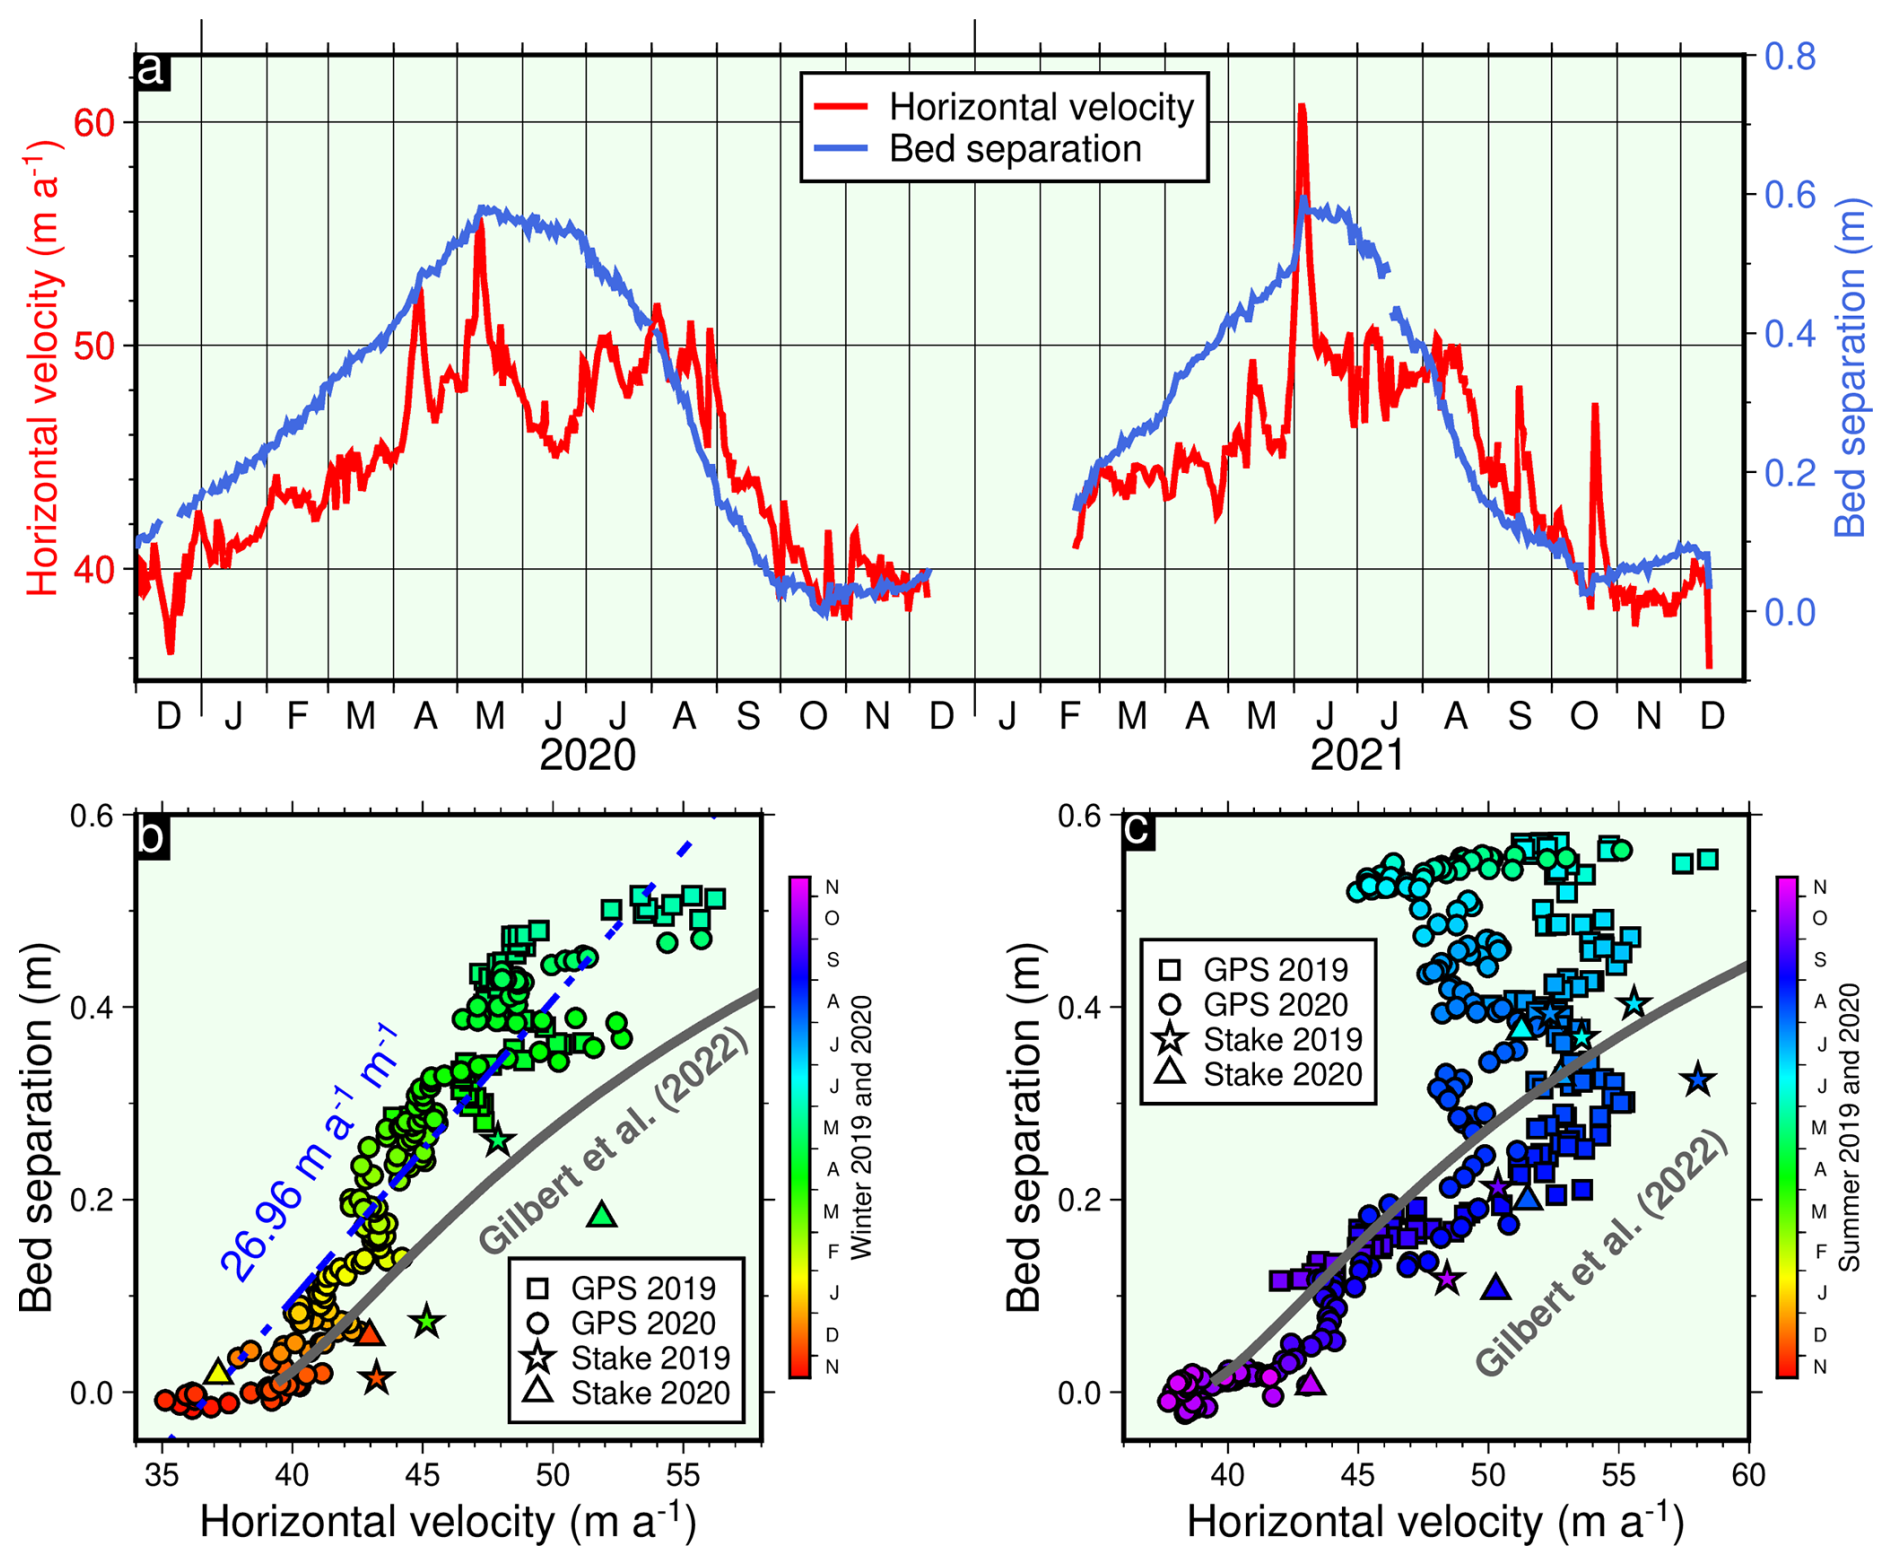
Figure 3Relationship between bed separation and horizontal velocity during the melting seasons. (a) Time series of horizontal velocity and hydrologically induced vertical displacement (2020–2021), averaged over 12 GPS sites. (b) Relationship between temporal changes (spatially averaged over 12 GPS sites) in horizontal velocity and bed separation in (b) winters and (c) summers 2018–2020, with ablation stake measurements in 2018–2020 (Vincent et al., 2022, Fig. 9c). Slope of a linear fit in (b) is given only over GPS measurements.
3.2 Spatial variations
3.2.1 Vertical displacement patterns
The spatial patterns of winter uplift (Fig. 4b, e) and summer subsidence (Fig. 5b, e) consistently occur at the same locations with comparable magnitude each year. For example, the GPS site AR3D on the right bank consistently records the largest uplift and subsidence. Uplift at site AR3D reaches almost 1 m during the longest observed period (winter 2020–2021) while the average uplift is about 0.5 m (Fig. 4e), and the lowest uplift of approximately 0.3 m occurs at site AR3G. We note that the period length is not consistent from year to year due to data gaps at certain stations, which limit the time window over which we have complete GPS network coverage. Overall, the spatial pattern of winter uplift observed in our study is consistent with that reported by Vincent et al. (2022) for the winter of 2019–2020 (Fig. S4).
3.2.2 Spatial relationship between bed separation and horizontal velocity
We compare the spatial patterns of winter uplift and summer subsidence with the average horizontal velocity and the horizontal velocity change (HVC). Here, HVC is defined as the magnitude of velocity change between the seasonal extrema: the spring peak (typically in May) and the autumn minimum (typically in October–November) (Figs. 4 and 5). During summer, the spatial correlation between surface subsidence and summer HVC is not apparent. In contrast, we find that the spatial pattern of winter HVC closely matches the winter uplift pattern each year. For example, during the longest recorded winter period of 2020–2021, the highest HVC of over 4 m a−1 occurred at site AR3D, where the maximum uplift was observed. We also observe a decreasing value toward the left bank in both uplift and HVC, where HVC dropped to approximately 2–3 m a−1 at site AR3G, which is almost half the value observed at AR3D (Fig. 4). The reason why the cavities are larger on the right bank remains unclear, but it may be related to the heavily crevassed terrain, which could favor local water storage that is then slowly released during the winter months.
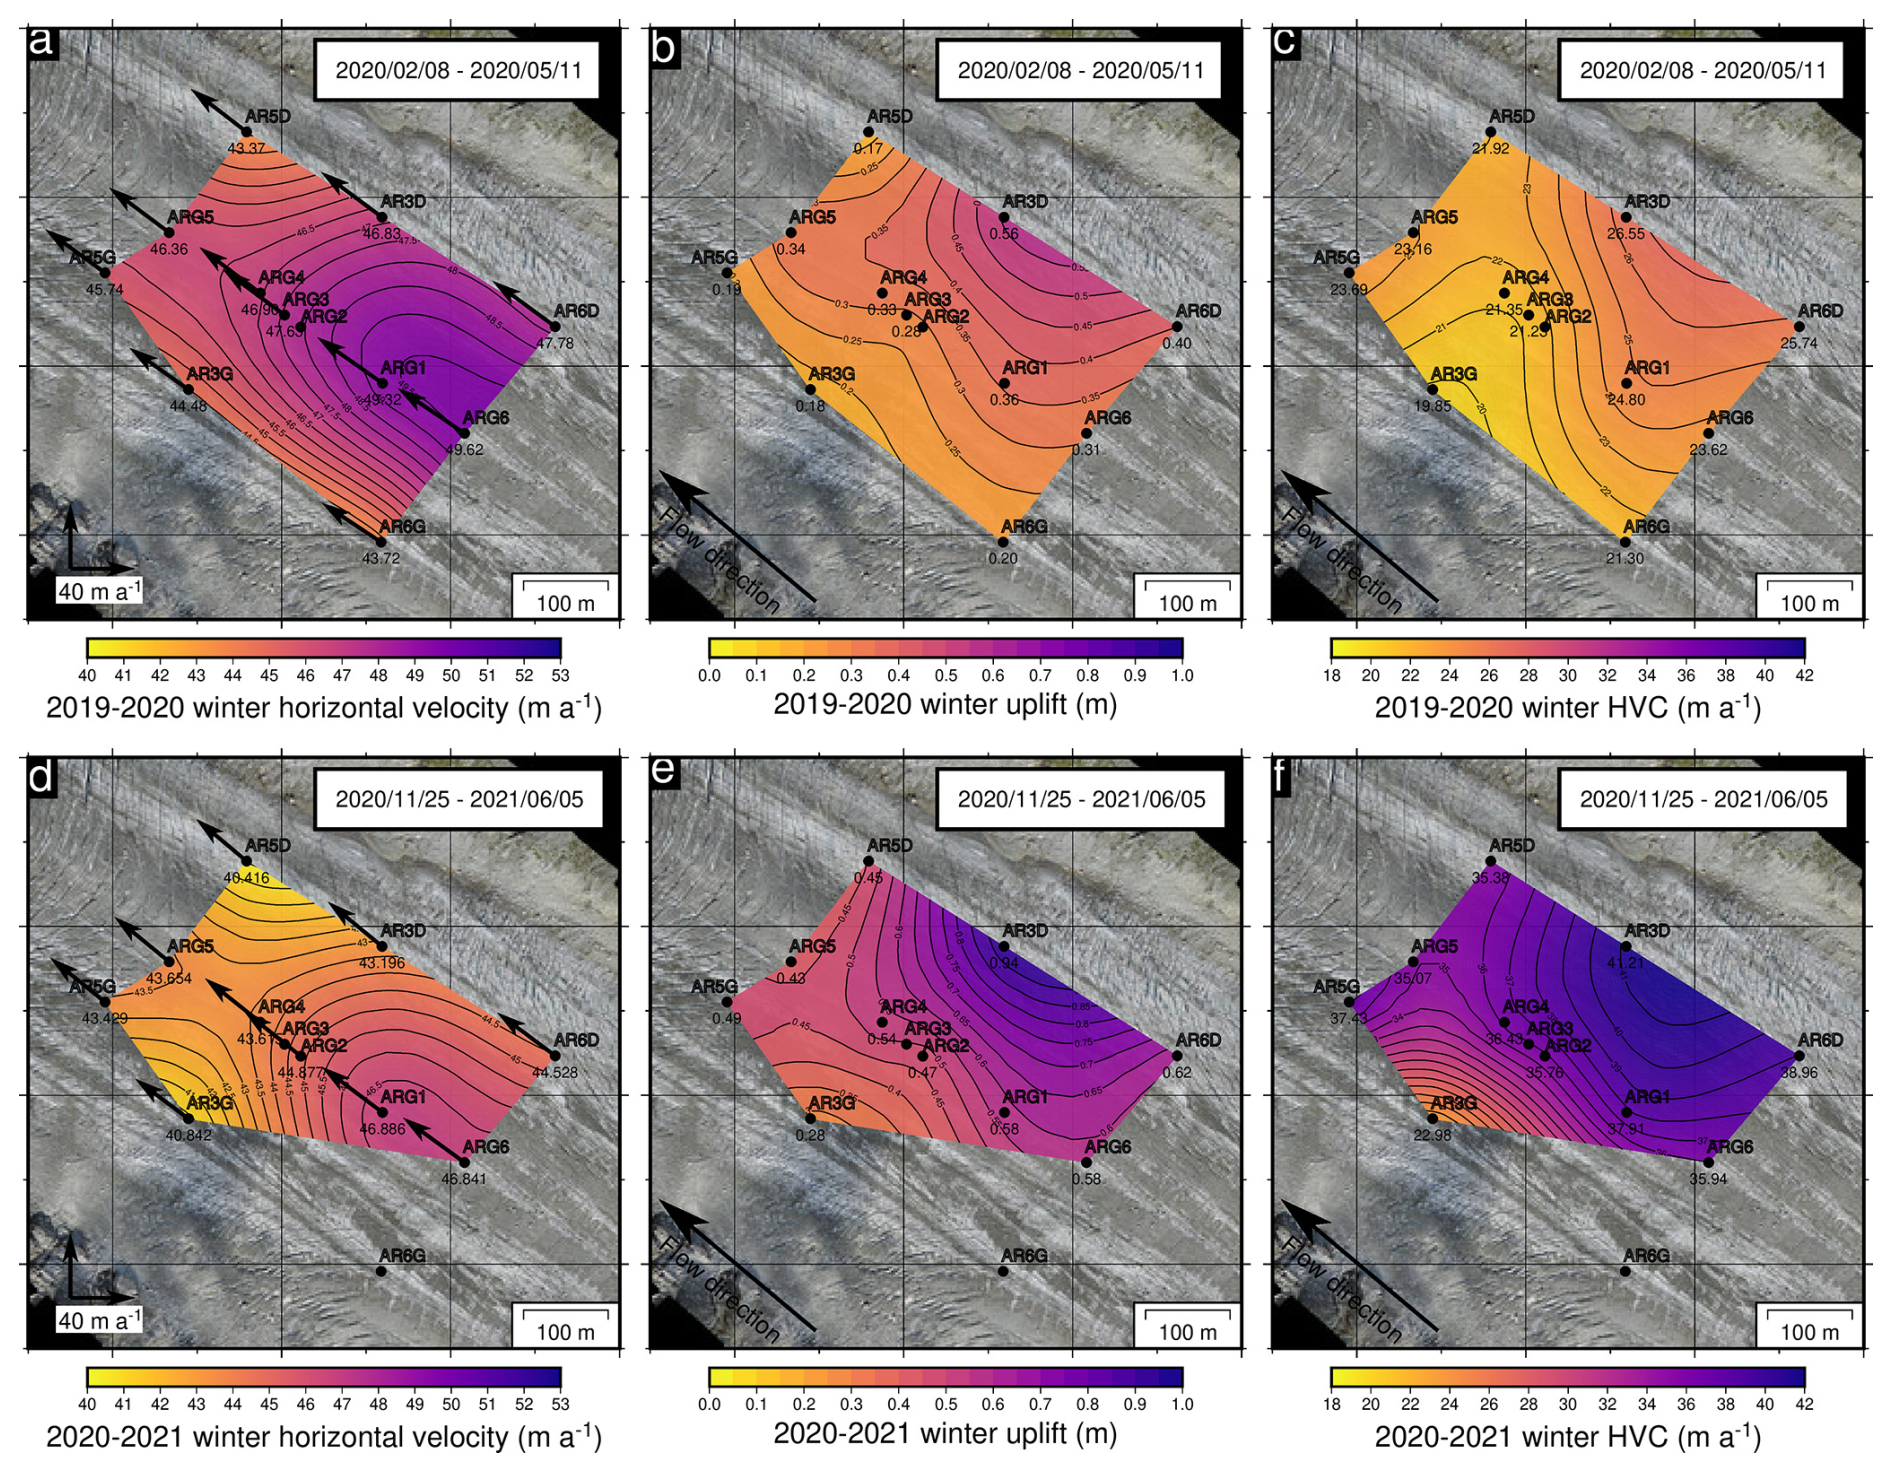
Figure 4Spatial pattern of (a, d) average horizontal velocity, (b, e) vertical displacement, and (c, f) horizontal velocity change in winter 2020 (top panels) and 2020/2021 (bottom panels). Contour maps were generated using the surface module of the Generic Mapping Tools (GMT), which uses a continuous curvature spline in tension to interpolate the data (Wessel et al., 2019). HVC denotes the horizontal velocity change, defined as the difference between the winter and summer extrema within the horizontal velocity time series.
Figure 5Spatial pattern of (a, d) horizontal velocity, (b, e) vertical displacement, and (c, f) horizontal velocity change in summer 2020 (top panels) and 2021 (bottom panels). Contour maps were generated using the surface module of the Generic Mapping Tools (GMT), which uses a continuous curvature spline in tension to interpolate the data (Wessel et al., 2019). HVC denotes the horizontal velocity change, defined as the difference between the winter and summer extrema within the horizontal velocity time series.
3.2.3 Spatial and temporal consistency between bed separation and horizontal velocity
Similar to the temporal analysis of the relationship between bed separation and horizontal velocity (Fig. 3b–c), we examine this relationship in space across 12 GPS stations during the winters (Fig. 6a) and summers (Fig. 6b) between 2020 and 2021. We find that the spatial relationship between winter uplift and HVC across these stations is approximately 34 m a−1 per meter of uplift, which is remarkably similar to the temporal relationship over the same period (∼ 27 m a−1 m−1). This is a strong evidence that changes in cavity dynamics during winter control both the spatial and temporal variations in surface velocities. This relationship, just like in temporal analysis, is less evident in summer (Fig. 6b), suggesting that additional factors influence glacier velocity during that season. We also observe that the spatial patterns of HVC vary from year to year (Fig. 5c, f), whereas the subsidence pattern remains more consistent (Fig. 5b, e).
Figure 6Spatial relationship between bed separation and horizontal velocity over 12 GPS sites averaged (a) winters and (b) summers 2020–2021.
4.1 Winter acceleration
To assess the total contribution of bed separation to the observed surface uplift, we first examine whether the vertical displacements measured during winter could be affected by spatial variations in strain rate (Sect. S1). To do this, we estimate the winter strain rate anomaly relative to the annual mean by computing the evolution of the surface velocity gradient (Fig. S5). We find that the spatial pattern of the strain rate anomaly does not match that of the observed vertical displacement, suggesting that changes in strain rate cannot explain the observed uplift. A similar conclusion was reached by Vincent et al. (2022) using a three-dimensional ice-flow model. We note that integrating the strain rate over the glacier depth, assuming it is homogeneous with depth, and over the considered time periods results in a vertical displacement magnitude greater than the observed uplift (Fig. S6). This more likely indicates that the assumption of depth-homogeneous strain rate is not valid (Sugiyama and Gudmundsson, 2004) rather than the estimated surface strain rate is inaccurate. Furthermore, the presence of crevassing may violate the continuity equation in this region; however, future measurements of internal vertical strain in boreholes are needed to observationally confirm this.
The variations in both horizontal velocity and vertical displacement observed at all GPS sites suggest that, in winter, the glacier decouples from its bed across a large area. The concurrent increase in water pressure indicates that the uplift is associated with the growth of basal cavities in response to rising water pressure. Given the limited amount of water available in winter, the increasing pressure must originate from the subglacial hydraulic network becoming inefficient as it transitions into a system of largely disconnected cavities. The winter water likely results from basal melt driven by frictional heating, geothermal flux, and/or the release of residual englacial water from the previous ablation season (Harper et al., 2005; Ryser et al., 2014; Sommers et al., 2023). The presence of liquid water beneath the glacier is further supported by the observed winter discharge of approximately 1 m3 s−1, detected after the measurement device was upgraded in autumn 2020 (Fig. 2a). Such low discharge in winter also suggests that the basal cavities are weakly connected rather than strictly isolated (Hoffman et al., 2016).
Summer subsidence concomitant with the onset of melt suggests that cavities connect in response to meltwater input, indicating that a minimum amount of extra subglacial discharge from surface melt is required to drive the transition to, and maintenance of, a connected cavity network. We speculate that, at this site, cavities cannot connect mechanically (i.e., through growth driven by increased water pressure and sliding speed), but instead require channel-like conduits that open through melting to establish connections. Interestingly, winter acceleration is not detected at the cavitometer, which is located a few hundred meters from the GPS sites. We suggest that these differences may result from different hydraulic potential gradients caused by drastically different surface slopes at the two locations (approximately 10 % at the GPS sites and 25 % at the cavitometer). The higher hydraulic potential gradient at the cavitometer may facilitate hydraulic connections at lower water pressures in winter, thereby preventing cavity growth and the associated acceleration of sliding. This explanation would be consistent with the channel-like control on effective pressure proposed by Gimbert et al. (2021a) to explain constant winter effective pressure over multi-decadal timescales in this steeper part of the glacier.
4.2 Surface velocity variations during the melt season
Water pressure starts declining after the spring acceleration (Fig. 2b), consistent with the subglacial drainage system transitioning from inefficient to efficient (Iken and Bindschadler, 1986). From this point onward, velocity variations are well captured by the hydro-mechanical model representing connected cavity dynamics (Fig. 2b), consistent with the glacier entering a regime where water pressure is regulated by coupled cavity dynamics and drainage that directly evolve in response to changes in water input (Gilbert et al., 2022). However, during the high melting period (June–July), the observed subsidence (cavity closure) no longer matches the observed velocities, which remain nearly constant despite surface subsidence (Fig. 3c). This lack of correlation between surface velocity change and surface subsidence also holds spatially as the summer spatial subsidence pattern does not match the summer spatial velocity change pattern (Figs. 5 and 6). This suggests that subglacial cavity size is not the only factor controlling sliding velocity at this time of year. Unsteady friction driven by short-term pulses in water pressure caused by large fluctuations in water discharge could explain this deviation (Rada and Schoof, 2018; Fudge et al., 2008; Sugiyama and Gudmundsson, 2004), since, in that case, local short-term increases in water pressure are expected to instantaneously increase the overall sliding speed (Togaibekov et al., 2024), despite average pressure progressively decreasing and thus cavities progressively closing. Later in the season (August–September), velocity changes become again correlated with surface subsidence (Fig. 3c), indicating that they primarily control the sliding velocities at this time. The spatial pattern of summer subsidence also matches fairly well that of winter uplift (Figs. 4 and 5), which is consistent with cavities closing in summer being the same as those opening in winter.
4.3 Analogy with GrIS seasonal dynamics
A monotonic increase in winter surface velocities, similar to that observed here, has previously been documented in many Greenland outlet glaciers (Sole et al., 2013; Andrews et al., 2014; Vijay et al., 2019; Solgaard et al., 2022), which are referred to as Type 3 glaciers (Moon et al., 2014). This increase was attributed to a steady wintertime rise in basal meltwater of up to 20 % (Harper et al., 2021), which increases water pressure in the weakly-connected cavity system (Andrews et al., 2014; Hoffman et al., 2016). Our observations are consistent with this interpretation, with the added observation that such pressure increase causes surface uplift from weakly-connected cavities increasing significantly in size.
The cavitometer velocity, on the other hand, mimics the Type 2 seasonal behavior where seasonal acceleration coincides with the onset of runoff and remains elevated throughout the melt season. Moon et al. (2014) proposed that development of efficient channelized subglacial drainage is absent or limited for these glaciers; here, this behavior is also explained solely by changes in meltwater discharge within the connected cavity system (Gilbert et al., 2022). These distinct spatial variations within the small ablation zone of Glacier d'Argentière suggest that subglacial hydrology is highly heterogeneous at small scales (Rada and Schoof, 2018). However, we further propose that the hydraulic pressure gradient acts as a key control parameter for the transition between Type 2 and Type 3 behaviors. In turn, the pressure gradient is likely controlled by the surface slope (Maier et al., 2022), a relationship that remains to be investigated more generally across different glacier bed geometries.
We monitored surface ice motions in the ablation zone of Glacier d'Argentière using a dense network of GPS stations over a three-year period. By combining these measurements with complementary observations of water pressure, water discharge, and sliding velocity, together with a coupled hydro-mechanical model, we characterize two distinct alternating seasonal phases, referred to here as the winter and summer periods. We show that the glacier progressively accelerates and uplifts throughout winter as observed in a few studies from Greenland (Sole et al., 2013; Moon et al., 2014) but rarely on mountain glaciers (Vincent et al., 2022). A key finding of this study is that the observed surface uplift provides strong evidence of variations in bed separation, which drives frictional change throughout winter. This is evident from the clear temporal and spatial relationships between bed separation and the increase in horizontal velocity (∼30 m a−1 per meter of uplift), which follow model prediction of Gilbert et al. (2022). This indicates that winter acceleration is driven by the growth of highly pressurized cavities as subglacial water pressure rises through winter and approaches the overburden pressure around the spring event. The sustained high water pressure in the absence of water input from the surface suggests that the cavities are weakly connected, as observed in Greenland (Andrews et al., 2014).
During the two first months of the melt period, the relationship between bed separation and horizontal velocity no longer holds and cavity shrinkage becomes uncorrelated with glacier deceleration, both temporally and spatially, suggesting that processes other than subglacial cavitation may also influence sliding speed. We attribute this lack of correlation to unsteady cavity dynamics driven by highly variable short-term water pressure in response to large fluctuations in water discharge, a phenomenon previously observed in many glaciers, including Glacier d'Argentière (Togaibekov et al., 2024). Later in the summer, however, the decrease in velocity again becomes related to surface subsidence associated with the closure of subglacial cavities. These observations show that connectivity within a drainage system plays a major role in controlling friction at the glacier bed.
These two phases result in a seasonal cycle characterized by peak velocity at spring event and a general decrease in velocity during the summer months. This contrasts with observations made at the nearby Argentière cavitometer, where the seasonal cycle is directly correlated with melt discharge (Gilbert et al., 2022). It shows that subglacier morphology can influence how the different hydrological components of the subglacial drainage system control the effective pressure throughout the year. In particular, the existence of weakly connected cavities that grow in winter appears to be limited to areas with shallow surface slopes. These observations can be directly linked to the different types of seasonal variability of Types 2 and 3 observed in the GrIS (Moon et al., 2014). Our study sheds light on the various seasonal velocity patterns by providing detailed insights into the factors driving the sliding velocity throughout the year.
The GPS data used in this study are archived on the Oreme repository at https://doi.org/10.15148/744BE716-3207-4A26-BF7B-60B5FD304FFD (Walpersdorf et al., 2023a), https://doi.org/10.15148/3FD58616-E0C4-4A7F-B2A9-7CF3DB4933BA (Walpersdorf et al., 2023b), https://doi.org/10.15148/FF97D3BB-0DB2-4D21-8ABE-999A7C2565CD (Walpersdorf et al., 2023c). Other data can be accessed through the Zenodo repository available at https://doi.org/10.5281/zenodo.10419097 (Togaibekov et al., 2023), https://doi.org/10.5281/zenodo.15023211 (Togaibekov, 2025), https://doi.org/10.5281/zenodo.5536953 (Vincent, 2021).
The supplement related to this article is available online at https://doi.org/10.5194/tc-20-3257-2026-supplement.
All authors contributed to the conceptualization of the work. AT and AW maintained the GPS network and processed the GPS data. FG and AW supervised the work and provided funding. AG designed and performed the numerical simulations. AT analyzed the data, and all authors interpreted the results. AT lead the writing of the manuscript, with inputs from all co-authors.
The contact author has declared that none of the authors has any competing interests.
Publisher's note: Copernicus Publications remains neutral with regard to jurisdictional claims made in the text, published maps, institutional affiliations, or any other geographical representation in this paper. The authors bear the ultimate responsibility for providing appropriate place names. Views expressed in the text are those of the authors and do not necessarily reflect the views of the publisher.
The GPS equipment was provided by the French national mobile parc GPSmob. We thank all the people who conducted fieldwork, particularly Laurent Ott, Agnès Helmstetter, Christian Sue, and Martin Champon. We thank Luc Moreau for providing cavitometer data, and Luc Piard for conducting the drilling operations.
This research has been supported by the French National Research Agency (grant no. ANR-18-CE01-0015-01).
This paper was edited by Adam Booth and reviewed by Samuel Doyle and two anonymous referees.
Anderson, R. S., Anderson, S. P., MacGregor, K. R., Waddington, E. D., O'Neel, S., Riihimaki, C. A., and Loso, M. G.: Strong feedbacks between hydrology and sliding of a small alpine glacier, J. Geophys. Res.-Earth Surf., 109, https://doi.org/10.1029/2004JF000120, 2004. a
Andrews, L. C., Catania, G. A., Hoffman, M. J., Gulley, J. D., Lüthi, M. P., Ryser, C., Hawley, R. L., and Neumann, T. A.: Direct observations of evolving subglacial drainage beneath the Greenland Ice Sheet, Nature, 514, 80–83, https://doi.org/10.1038/nature13796, 2014. a, b, c, d, e
Bingham, R. G., Hubbard, A. L., Nienow, P. W., and Sharp, M. J.: An investigation into the mechanisms controlling seasonal speedup events at a High Arctic glacier, J. Geophys. Res.-Earth Surf., 113, https://doi.org/10.1029/2007JF000832, 2008. a
Bock, Y., Gourevitch, S. A., Counselman III, C. C., King, R. W., and Abbot, R. I.: Interferometric analysis of GPS phase observations, Manuscr. Geodaet., 11, 282–288, 1986. a
Davison, B. J., Sole, A. J., Livingstone, S. J., Cowton, T. R., and Nienow, P. W.: The Influence of Hydrology on the Dynamics of Land-Terminating Sectors of the Greenland Ice Sheet, Front. Earth Sci., 7, https://doi.org/10.3389/feart.2019.00010, 2019. a, b
Downs, J. Z., Johnson, J. V., Harper, J. T., Meierbachtol, T., and Werder, M. A.: Dynamic hydraulic conductivity reconciles mismatch between modeled and observed winter subglacial water pressure, J. Geophys. Res.-Earth Surf., 123, 818–836, https://doi.org/10.1002/2017JF004522, 2018. a
Flowers, G. E.: Modelling water flow under glaciers and ice sheets, P. R. Soc. A, 471, 20140907, https://doi.org/10.1098/rspa.2014.0907, 2015. a
Fowler, A. C.: Sliding with Cavity Formation, J. Glaciol., 33, 255–267, https://doi.org/10.3189/S0022143000008820, 1987. a
Fudge, T. J., Humphrey, N. F., Harper, J. T., and Pfeffer, W. T.: Diurnal fluctuations in borehole water levels: configuration of the drainage system beneath Bench Glacier, Alaska, USA, J. Glaciol., 54, 297–306, https://doi.org/10.3189/002214308784886072, 2008. a, b
Gagliardini, O., Cohen, D., Råback, P., and Zwinger, T.: Finite-element modeling of subglacial cavities and related friction law, J. Geophys. Res.-Earth Surf., 112, https://doi.org/10.1029/2006JF000576, 2007. a, b
Gilbert, A., Gimbert, F., Thøgersen, K., Schuler, T. V., and Kääb, A.: A Consistent Framework for Coupling Basal Friction With Subglacial Hydrology on Hard-Bedded Glaciers, Geophys. Res. Lett., 49, e2021GL097507, https://doi.org/10.1029/2021GL097507, 2022. a, b, c, d, e, f, g, h, i, j, k, l, m
Gilbert, A., Gimbert, F., Gagliardini, O., and Vincent, C.: Inferring the Basal Friction Law From Long Term Changes of Glacier Length, Thickness and Velocity on an Alpine Glacier, Geophys. Res. Lett., 50, e2023GL104503, https://doi.org/10.1029/2023GL104503, 2023. a
Gimbert, F., Gilbert, A., Gagliardini, O., Vincent, C., and Moreau, L.: Do Existing Theories Explain Seasonal to Multi-Decadal Changes in Glacier Basal Sliding Speed?, Geophys. Res. Lett., 48, e2021GL092858, https://doi.org/10.1029/2021GL092858, 2021a. a, b, c, d, e, f
Gimbert, F., Nanni, U., Roux, P., Helmstetter, A., Garambois, S., Lecointre, A., Walpersdorf, A., Jourdain, B., Langlais, M., Laarman, O., Lindner, F., Sergeant, A., Vincent, C., and Walter, F.: A Multi‐Physics Experiment with a Temporary Dense Seismic Array on the Argentière Glacier, French Alps: The RESOLVE Project, Seismol. Res. Lett., 92, 1185–1201, https://doi.org/10.1785/0220200280, 2021b. a
Hantz, D. and Lliboutry, L.: Waterways, Ice Permeability at Depth, and Water Pressures at Glacier D’Argentière, French Alps, J. Glaciol., 29, 227–239, https://doi.org/10.3189/S0022143000008285, 1983. a
Harper, J., Meierbachtol, T., Humphrey, N., Saito, J., and Stansberry, A.: Generation and fate of basal meltwater during winter, western Greenland Ice Sheet, The Cryosphere, 15, 5409–5421, https://doi.org/10.5194/tc-15-5409-2021, 2021. a
Harper, J. T., Humphrey, N. F., Pfeffer, W. T., Fudge, T., and O’Neel, S.: Evolution of subglacial water pressure along a glacier’s length, Ann. Glaciol., 40, 31–36, https://doi.org/10.3189/172756405781813573, 2005. a
Herring, T. A., King, R. W., Floyd, M. A., and McClusky, S. C.: Introduction to GAMIT/GLOBK, Massachusetts Institute of Technology, Cambridge, MA, USA, http://geoweb.mit.edu/gg/docs/Intro_GG.pdf (last access: 1 June 2026), 2018. a
Hodge, S. M.: Variations in the Sliding of a Temperate Glacier, J. Glaciol., 13, 349–369, https://doi.org/10.3189/S0022143000023157, 1974. a
Hoffman, M. J., Andrews, L. C., Price, S. F., Catania, G. A., Neumann, T. A., Lüthi, M. P., Gulley, J., Ryser, C., Hawley, R. L., and Morriss, B.: Greenland subglacial drainage evolution regulated by weakly connected regions of the bed, Nat. Commun., 7, 13903, https://doi.org/10.1038/ncomms13903, 2016. a, b, c
Iken, A.: The Effect of the Subglacial Water Pressure on the Sliding Velocity of a Glacier in an Idealized Numerical Model, J. Glaciol., 27, 407–421, https://doi.org/10.3189/S0022143000011448, 1981. a
Iken, A. and Bindschadler, R. A.: Combined measurements of Subglacial Water Pressure and Surface Velocity of Findelengletscher, Switzerland: Conclusions about Drainage System and Sliding Mechanism, J. Glaciol., 32, 101–119, https://doi.org/10.3189/S0022143000006936, 1986. a, b, c, d
King, M.: Rigorous GPS data-processing strategies for glaciological applications, J. Glaciol., 50, 601–607, https://doi.org/10.3189/172756504781829747, 2004. a
Lefeuvre, P.-M., Jackson, M., Lappegard, G., and Hagen, J. O.: Interannual variability of glacier basal pressure from a 20 year record, Ann. Glaciol., 56, 33–44, 2015. a
Lliboutry, L.: Contribution a la theorie du frottement du glacier sur son lit, Comptes Rendus Hebdomadaires des Seances de l’Academie des Sciences, 247, 318–320, 1958. a
Lliboutry, L.: General Theory of Subglacial Cavitation and Sliding of Temperate Glaciers, J. Glaciol., 7, 21–58, https://doi.org/10.3189/S0022143000020396, 1968. a
Maier, N., Gimbert, F., and Gillet-Chaulet, F.: Threshold response to melt drives large-scale bed weakening in Greenland, Nature, 607, 714–720, https://doi.org/10.1038/s41586-022-04927-3, 2022. a
Mair, D., Nienow, P., Willis, I., and Sharp, M.: Spatial patterns of glacier motion during a high-velocity event: Haut Glacier d’Arolla, Switzerland, J. Glaciol., 47, 9–20, https://doi.org/10.3189/172756501781832412, 2001. a
Mair, D., Willis, I., Fischer, U. H., Hubbard, B., Nienow, P., and Hubbard, A.: Hydrological controls on patterns of surface, internal and basal motion during three “spring events”: Haut Glacier d’Arolla, Switzerland, J. Glaciol., 49, 555–567, https://doi.org/10.3189/172756503781830467, 2003. a
Mejia, J. Z., Gulley, J. D., Trunz, C., Covington, M. D., Bartholomaus, T. C., Xie, S., and Dixon, T. H.: Isolated Cavities Dominate Greenland Ice Sheet Dynamic Response to Lake Drainage, Geophys. Res. Lett., 48, e2021GL094762, https://doi.org/10.1029/2021GL094762, 2021. a, b
Moon, T., Joughin, I., Smith, B., van den Broeke, M. R., van de Berg, W. J., Noël, B., and Usher, M.: Distinct patterns of seasonal Greenland glacier velocity, Geophys. Res. Lett., 41, 7209–7216, https://doi.org/10.1002/2014GL061836, 2014. a, b, c, d, e
Nanni, U., Gimbert, F., Vincent, C., Gräff, D., Walter, F., Piard, L., and Moreau, L.: Quantification of seasonal and diurnal dynamics of subglacial channels using seismic observations on an Alpine glacier, The Cryosphere, 14, 1475–1496, https://doi.org/10.5194/tc-14-1475-2020, 2020. a
Nanni, U., Gimbert, F., Roux, P., and Lecointre, A.: Observing the subglacial hydrology network and its dynamics with a dense seismic array, P. Natl. Acad. Sci. USA, 118, e2023757118, https://doi.org/10.1073/pnas.2023757118, 2021. a
Nienow, P., Sharp, M., and Willis, I.: Seasonal changes in the morphology of the subglacial drainage system, Haut Glacier d'Arolla, Switzerland, Earth Surf. Process. Land., 23, 825–843, https://doi.org/10.1002/(SICI)1096-9837(199809)23:9<825::AID-ESP893>3.0.CO;2-2, 1998. a
Nye, J. F.: Water Flow in Glaciers: Jökulhlaups, Tunnels and Veins, J. Glaciol., 17, 181–207, https://doi.org/10.3189/S002214300001354X, 1976. a
Rada, C. and Schoof, C.: Channelized, distributed, and disconnected: subglacial drainage under a valley glacier in the Yukon, The Cryosphere, 12, 2609–2636, https://doi.org/10.5194/tc-12-2609-2018, 2018. a, b, c, d, e
Roldán-Blasco, J.-P., Gilbert, A., Piard, L., Gimbert, F., Vincent, C., Gagliardini, O., Togaibekov, A., Walpersdorf, A., and Maier, N.: Creep enhancement and sliding in a temperate, hard-bedded alpine glacier, The Cryosphere, 19, 267–282, https://doi.org/10.5194/tc-19-267-2025, 2025. a, b
Röthlisberger, H.: Water Pressure in Intra- and Subglacial Channels, J. Glaciol., 11, 177–203, https://doi.org/10.3189/S0022143000022188, 1972. a
Ryser, C., Lüthi, M. P., Andrews, L. C., Hoffman, M. J., Catania, G. A., Hawley, R. L., Neumann, T. A., and Kristensen, S. S.: Sustained high basal motion of the Greenland ice sheet revealed by borehole deformation, J. Glaciol., 60, 647–660, https://doi.org/10.3189/2014JoG13J196, 2014. a, b
Sole, A., Nienow, P., Bartholomew, I., Mair, D., Cowton, T., Tedstone, A., and King, M. A.: Winter motion mediates dynamic response of the Greenland Ice Sheet to warmer summers, Geophys. Res. Lett., 40, 3940–3944, https://doi.org/10.1002/grl.50764, 2013. a, b
Solgaard, A., Rapp, D., Noël, B., and Hvidberg, C.: Seasonal patterns of Greenland ice velocity from Sentinel-1 SAR data linked to runoff, Geophys. Res. Lett., 49, e2022GL100343, https://doi.org/10.1029/2022GL100343, 2022. a, b
Sommers, A., Meyer, C., Morlighem, M., Rajaram, H., Poinar, K., Chu, W., and Mejia, J.: Subglacial hydrology modeling predicts high winter water pressure and spatially variable transmissivity at Helheim Glacier, Greenland, J. Glaciol., 69, 1556–1568, https://doi.org/10.1017/jog.2023.39, 2023. a, b
Spring, U. and Hutter, K.: Conduit flow of a fluid through its solid phase and its application to intraglacial channel flow, Int. J. Eng. Sci., 20, 327–363, https://doi.org/10.1016/0020-7225(82)90029-5, 1982. a
Sugiyama, S. and Gudmundsson, G. H.: Short-term variations in glacier flow controlled by subglacial water pressure at Lauteraargletscher, Bernese Alps, Switzerland, J. Glaciol., 50, 353–362, https://doi.org/10.3189/172756504781829846, 2004. a, b
Tedstone, A. J., Nienow, P. W., Gourmelen, N., Dehecq, A., Goldberg, D., and Hanna, E.: Decadal slowdown of a land-terminating sector of the Greenland Ice Sheet despite warming, Nature, 526, 692–695, https://doi.org/10.1038/nature15722, 2015. a
Togaibekov, A.: SmartStake SMB, air temperature, snow depth measurements at Argentière Glacier between 2019 and 2021, Zenodo [data set], https://doi.org/10.5281/zenodo.15023211, 2025. a
Togaibekov, A., Gimbert, F., Gilbert, A., and Walpersdorf, A.: Sliding velocity, water discharge, water pressure, and rainfall time series at Argentière Glacier between 2019 and 2021, Zenodo [data set], https://doi.org/10.5281/zenodo.10419097, 2023. a
Togaibekov, A., Gimbert, F., Gilbert, A., and Walpersdorf, A.: Observing and Modeling Short-Term Changes in Basal Friction During Rain-Induced Speed-Ups on an Alpine Glacier, Geophys. Res. Lett., 51, e2023GL107999, https://doi.org/10.1029/2023GL107999, 2024. a, b, c, d, e, f
Togaibekov, A., Gimbert, F., Rabatel, A., and Walpersdorf, A.: Surface mass balance monitoring of an alpine glacier using GNSS Interferometric Reflectometry, J. Glaciol., 71, e111, https://doi.org/10.1017/jog.2025.10086, 2025. a
Vernay, M., Lafaysse, M., Monteiro, D., Hagenmuller, P., Nheili, R., Samacoïts, R., Verfaillie, D., and Morin, S.: The S2M meteorological and snow cover reanalysis over the French mountainous areas: description and evaluation (1958–2021), Earth Syst. Sci. Data, 14, 1707–1733, https://doi.org/10.5194/essd-14-1707-2022, 2022. a
Vijay, S., Khan, S. A., Kusk, A., Solgaard, A. M., Moon, T., and Bjørk, A. A.: Resolving seasonal ice velocity of 45 Greenlandic glaciers with very high temporal details, Geophys. Res. Lett., 46, 1485–1495, https://doi.org/10.1029/2018GL081503, 2019. a, b
Vincent, C.: Ice flow velocities and uplift, Zenodo [data set], https://doi.org/10.5281/zenodo.5536953, 2021. a
Vincent, C. and Moreau, L.: Sliding velocity fluctuations and subglacial hydrology over the last two decades on Argentière glacier, Mont Blanc area, J. Glaciol., 62, 805–815, https://doi.org/10.1017/jog.2016.35, 2016. a, b, c, d, e
Vincent, C., Soruco, A., Six, D., and Meur, E. L.: Glacier thickening and decay analysis from 50 years of glaciological observations performed on Glacier d’Argentière, Mont Blanc area, France, Ann. Glaciol., 50, 73–79, https://doi.org/10.3189/172756409787769500, 2009. a, b
Vincent, C., Gilbert, A., Walpersdorf, A., Gimbert, F., Gagliardini, O., Jourdain, B., Roldan Blasco, J. P., Laarman, O., Piard, L., Six, D., Moreau, L., Cusicanqui, D., and Thibert, E.: Evidence of Seasonal Uplift in the Argentière Glacier (Mont Blanc Area, France), J. Geophys. Res.-Earth Surf., 127, e2021JF006454, https://doi.org/10.1029/2021JF006454, 2022. a, b, c, d, e, f, g, h, i, j
Vivian, R. and Bocquet, G.: Subglacial Cavitation Phenomena Under the Glacier D’Argentière, Mont Blanc, France, J. Glaciol., 12, 439–451, https://doi.org/10.3189/S0022143000031853, 1973. a, b
Walpersdorf, A., Ott, L., Helmstetter, A., Sue, C., Bouvier, J.-N., Champon, M., Moreau, L., Togaibekov, A., Gimbert, F., Six, D., Vincent, C., Garambois, S., Mercier, S., Laarman, O., Piard, L., Nanni, U., Mathey, M., Urruty, B., Romeyer, O., and Radiguet, M.: Epos-France – GPSMob data – Mission no. 19-050 – Argentiere (2019) – 2019-04-02 / 2020-01-01 – 7 points, OSU OREME [data set], https://doi.org/10.15148/744BE716-3207-4A26-BF7B-60B5FD304FFD, 2023a. a
Walpersdorf, A., Ott, L., Helmstetter, A., Sue, C., Bouvier, J.-N., Champon, M., Moreau, L., Togaibekov, A., Gimbert, F., Six, D., Vincent, C., Garambois, S., Mercier, S., Laarman, O., Piard, L., Nanni, U., Mathey, M., Urruty, B., Romeyer, O., and Radiguet, M.: Epos-France – GPSMob data – Mission no. 20-021 – Argentiere (2020) – 2020-01-02 / 2021-01-01 – 13 points, OSU OREME [data set], https://doi.org/10.15148/3FD58616-E0C4-4A7F-B2A9-7CF3DB4933BA, 2023b. a
Walpersdorf, A., Ott, L., Helmstetter, A., Sue, C., Bouvier, J.-N., Champon, M., Moreau, L., Togaibekov, A., Gimbert, F., Six, D., Vincent, C., Garambois, S., Mercier, S., Laarman, O., Piard, L., Nanni, U., Mathey, M., Urruty, B., Romeyer, O., and Radiguet, M.: Epos-France – GPSMob data – Mission no. 21-028 – Argentiere (2021) – 2021-01-02 / 2021-12-31 – 13 points, OSU OREME [data set], https://doi.org/10.15148/FF97D3BB-0DB2-4D21-8ABE-999A7C2565CD, 2023c. a
Werder, M. A., Hewitt, I. J., Schoof, C. G., and Flowers, G. E.: Modeling channelized and distributed subglacial drainage in two dimensions, J. Geophys. Res.-Earth Surf., 118, 2140–2158, https://doi.org/10.1002/jgrf.20146, 2013. a, b, c
Wessel, P., Luis, J. F., Uieda, L., Scharroo, R., Wobbe, F., Smith, W. H. F., and Tian, D.: The Generic Mapping Tools Version 6, Geochem. Geophys. Geosyst., 20, 5556–5564, https://doi.org/10.1029/2019GC008515, 2019. a, b