the Creative Commons Attribution 4.0 License.
the Creative Commons Attribution 4.0 License.
 | 15 Apr 2026
Brief communication: Uncertainties in Southern Ocean sea surface conditions and their impact on Antarctic climate over 1958–1978
Quentin Dalaiden
Ingo Bethke
Atmospheric reanalyses extending before 1979, including ERA5, show a substantial cold bias over Antarctica during 1958–1978. Because Southern Ocean sea surface conditions (SSCs) are poorly constrained in this period, we assess their role using two ensembles of a global atmospheric model forced by different SSC datasets. The first uses the widely employed HadISST product, while the second is based on a recent reconstruction that assimilates continental observations. Our results show that SSC differences strongly alter the Antarctic surface climate, but explain only about 30 % of the ERA5 cold bias ERA5 in our model experiments, indicating that additional factors contribute to this bias.
- Article
(6242 KB) - Full-text XML
-
Supplement
(1306 KB) - BibTeX
- EndNote


Being the largest freshwater reservoir on Earth, any change in the total ice mass of the Antarctic Ice Sheet (AIS) has profound global implications (Fyke et al., 2018), including contributions to sea-level rise affecting coastal regions and impacts on the overturning circulation of the global ocean through the deep-water formation. The total mass balance of an ice sheet is defined as the difference between the surface mass gain, referred to as the surface mass balance (SMB) and dominated by snowfall (e.g., Lenaerts et al., 2020), and the mass losses due to ice-shelf melting and iceberg calving (Fyke et al., 2018). Over 1992–2020, the AIS experienced a net negative mass balance, with ice losses – primarily from ice-shelf melting – exceeding the surface mass gain (Otosaka et al., 2023). However, more recently, during 2020–2023, the AIS showed a slight mass gain (Wang et al., 2025), largely attributed to increased snow accumulation in East Antarctica, while West Antarctica – particularly glaciers located in the Amundsen Sea – has continued to lose mass at a pace comparable to the 1990s. Climate model simulations have long suggested that snowfall over Antarctica should increase in response to atmospheric warming (e.g., Frieler et al., 2015), yet observations until 2020 had not confirmed this model signal. The recent mass gain therefore suggests that snowfall variability may at times be large enough to offset, at least partially, the losses from ice-shelf melting.
The Antarctic SMB is largely controlled by the transport of moisture from the low- and mid-latitude regions of the Southern Hemisphere (e.g., Lenaerts et al., 2020). Sea surface conditions (SSCs) – sea surface temperature and sea-ice concentration – in the Southern Ocean play a substantial role in regulating this moisture transport and, consequently, the variability of Antarctic SMB through air-sea interactions (e.g., Kittel et al., 2018). An ice-free ocean surface enhances air–sea exchanges, increasing the moisture content of the overlying atmosphere, which can subsequently be converted into snowfall over Antarctica during adiabatic cooling associated with orographic uplift. Similarly, warmer seas act to increase moisture transport to the continent. Since 1979, the year-to-year variability of SSCs has been well constrained thanks to increasingly abundant and improved satellite observations, but prior to 1979 large uncertainties remain (e.g., Titchner and Rayner, 2014; Dalaiden et al., 2025). The latest atmospheric reanalysis from the European Centre for Medium-Range Weather Forecasts, ERA5 (Hersbach et al., 2020) – considered as the best state-of-the-art atmospheric reanalysis in Antarctica (e.g., Gossart et al., 2019) – which extends back to 1940, are therefore sensitive to these uncertainties. Bromwich et al. (2024) identified a pronounced cold bias in ERA5 over Antarctica before the continuous, and comprehensive satellite coverage from 1979, specifically during 1958–1978, when numerous weather stations became available due to the International Geophysical Year. This bias corresponds to an overestimated warming trend since 1958. Furthermore, polar-oriented regional climate models driven by ERA5 suggest a large SMB increase over this period (van Dalum et al., 2025), raising questions about the reliability of such results given the uncertainties in Southern Ocean SSCs.
In this study, we investigate how uncertainties in Southern Ocean SSCs influenced the Antarctic surface climate and large-scale atmospheric circulation during the period before the onset of continuous satellite coverage (1958–1978). To this end, we use a recently published climate reconstruction constrained by weather station observations from both Antarctica and mid-latitude regions of the Southern Hemisphere (Dalaiden et al., 2025). To assess the role of SSC uncertainty, we conduct ensembles of global atmospheric circulation model simulations using this reconstruction and, for comparison, the HadISST2 dataset (Titchner and Rayner, 2014), which is used in ERA5. In addition, we evaluate Antarctic climate in ERA5 during 1958–1978, with a particular focus on the extent to which SSCs contribute to the cold bias reported by Bromwich et al. (2024).
2.1 Historical Southern Ocean Sea Surface Conditions
To test the sensitivity of the Antarctic surface climate to uncertainties in Southern Ocean SSCs during the 1958–1979 period, we use two different SSC datasets. The first dataset is taken directly from ERA5, which uses the HadISST2 dataset (Titchner and Rayner, 2014) before 1979 and the Operational Sea Surface Temperature and Sea Ice Analysis (OSTIA) product (Good et al., 2020) thereafter. We use ERA5 SSCs because ERA5 has consistently been shown to provide the most reliable performance among atmospheric reanalyses over Antarctica (e.g., Gossart et al., 2019). However, it is important to note that HadISST2 is known to display a large sea-ice extent before 1979 (e.g., Titchner and Rayner, 2014). For simplicity, we refer to this blended dataset as “ERA5 SSCs” throughout the text.
The second dataset is the recently published reconstruction of Dalaiden et al. (2025) (hereafter we use the acronym ANT-REC throughout the text), which covers the entire 1958–2023 period for the Southern Ocean. This product combines annual weather station observations – specifically near-surface air temperature and atmospheric surface pressure – from Antarctica and mid-latitudes with ten different Earth System Model ensemble simulations, using a data assimilation framework, resulting in a fully physically consistent atmospheric reanalysis. This atmospheric reanalysis was then used to force an ocean–sea-ice model, thereby reconstructing oceanic variability including sea ice. A key advantage of this dataset is that, unlike ERA5, it is directly constrained by Antarctic and mid-latitude observations and is not dependent on HadISST2, making it potentially better suited to capture variability before the onset of continuous satellite coverage (i.e., 1979).
2.2 Weather stations observations
To evaluate the impacts of SSCs on the Antarctic surface climate, we use long-term instrumental observations from Antarctic weather stations operating since the International Geophysical Year (1958). These records are compiled in the SCAR READER dataset (Turner et al., 2004). In total, 15 stations provide near-surface air temperature measurements with continuous coverage beginning around 1958. It is important to note that these long-term observations were also used in the reconstruction of Dalaiden et al. (2025). We restrict our analysis to only time-continuous stations in order to avoid artifacts associated with temporal changes in station availability.
2.3 The Community Atmospheric Model (CAM)
To quantify the impact of Southern Ocean SSCs on the Antarctic surface climate during 1958–1978, we use a global atmospheric model with prescribed SSCs (monthly mean sea surface temperature and sea-ice concentration fields). Specifically, we employ the atmospheric component of the Norwegian Earth System Model Version 1 at medium resolution (NorESM1-ME) (Bentsen et al., 2013), namely the Community Atmospheric Model version 4 (CAM4) (Neale et al., 2010), which is based on the Community Earth System Model Version 1 (CESM1) (Hurrell et al., 2013). In this configuration, CAM4 includes a prognostic formulation of the aerosol life cycle, replacing the original prescribed formulation. The model is run on the standard horizontal f19 grid (nominal 2° resolution; 1.9° × 2.5° latitude–longitude) and uses 26 hybrid-sigma vertical levels. Although CAM4 is an older-generation model, Dalaiden et al. (2025) demonstrated that it performs satisfactorily over the Southern Ocean. In addition, external forcings are updated to those used in CMIP5. A further advantage of using CAM4 over newer versions is the computational efficiency, which makes it well suited for ensemble-based experiments at modest computational cost.
2.4 Experiments
The experiments conducted with CAM4 follow the framework of Atmospheric Model Intercomparison Project (AMIP)-style simulations (Gates et al., 1999), in which SSCs are prescribed to isolate their effects on atmospheric variables, including atmospheric circulation. We perform two ensembles of experiments. In the first ensemble, SSCs are taken from ERA5, while in the second they are taken from ANT-REC. The difference between the two ensembles therefore isolates the influence of SSC uncertainties on the Antarctic climate system. Each ensemble consists of ten simulations, all using the same SSCs and external forcings but initialized with small atmospheric perturbations following Kay et al. (2015) (micro-perturbation). The ensembles span the 1959–2000 period. We analyze the ensemble mean in order to amplify the signal from prescribed SSCs and reduce the contribution of internal atmospheric variability.
3.1 Historical changes in Southern Ocean sea surface conditions since 1958
Since 1958, substantial changes in both annual mean sea-ice cover and sea surface temperature (SST) have been observed in the Southern Ocean. Focusing first on sea ice, the total sea-ice extent (defined as the integrated ocean area covered by at least 15 % ice concentration) exhibits pronounced multi-decadal variability that can be broadly divided into three periods (Fig. 1). From 1958 to 1980, an overall decline in sea-ice extent is noticed in both ERA5 and ANT-REC, including a sharp drop toward the end of this period. This is followed by a relatively steady increase that lasts until 2015, after which another marked decline is noticed. From 1979 onward, when satellite observations are available, both ERA5 and ANT-REC datasets show good agreement, although, as noted by Dalaiden et al. (2025), ANT-REC underestimates the 2014 maximum. In contrast, during the earlier 1958–1978 period, substantial discrepancies emerge: ERA5 exhibits a much larger decrease in sea-ice extent compared to ANT-REC. Specifically, the change in sea-ice extent between 1981–2000 and 1959–1968 reaches −1.92 × 10⁶ km2 (−15.3 %) in ERA5, compared to only −0.49 × 10⁶ km2 (−3.9 %) in ANT-REC – more than three times smaller.
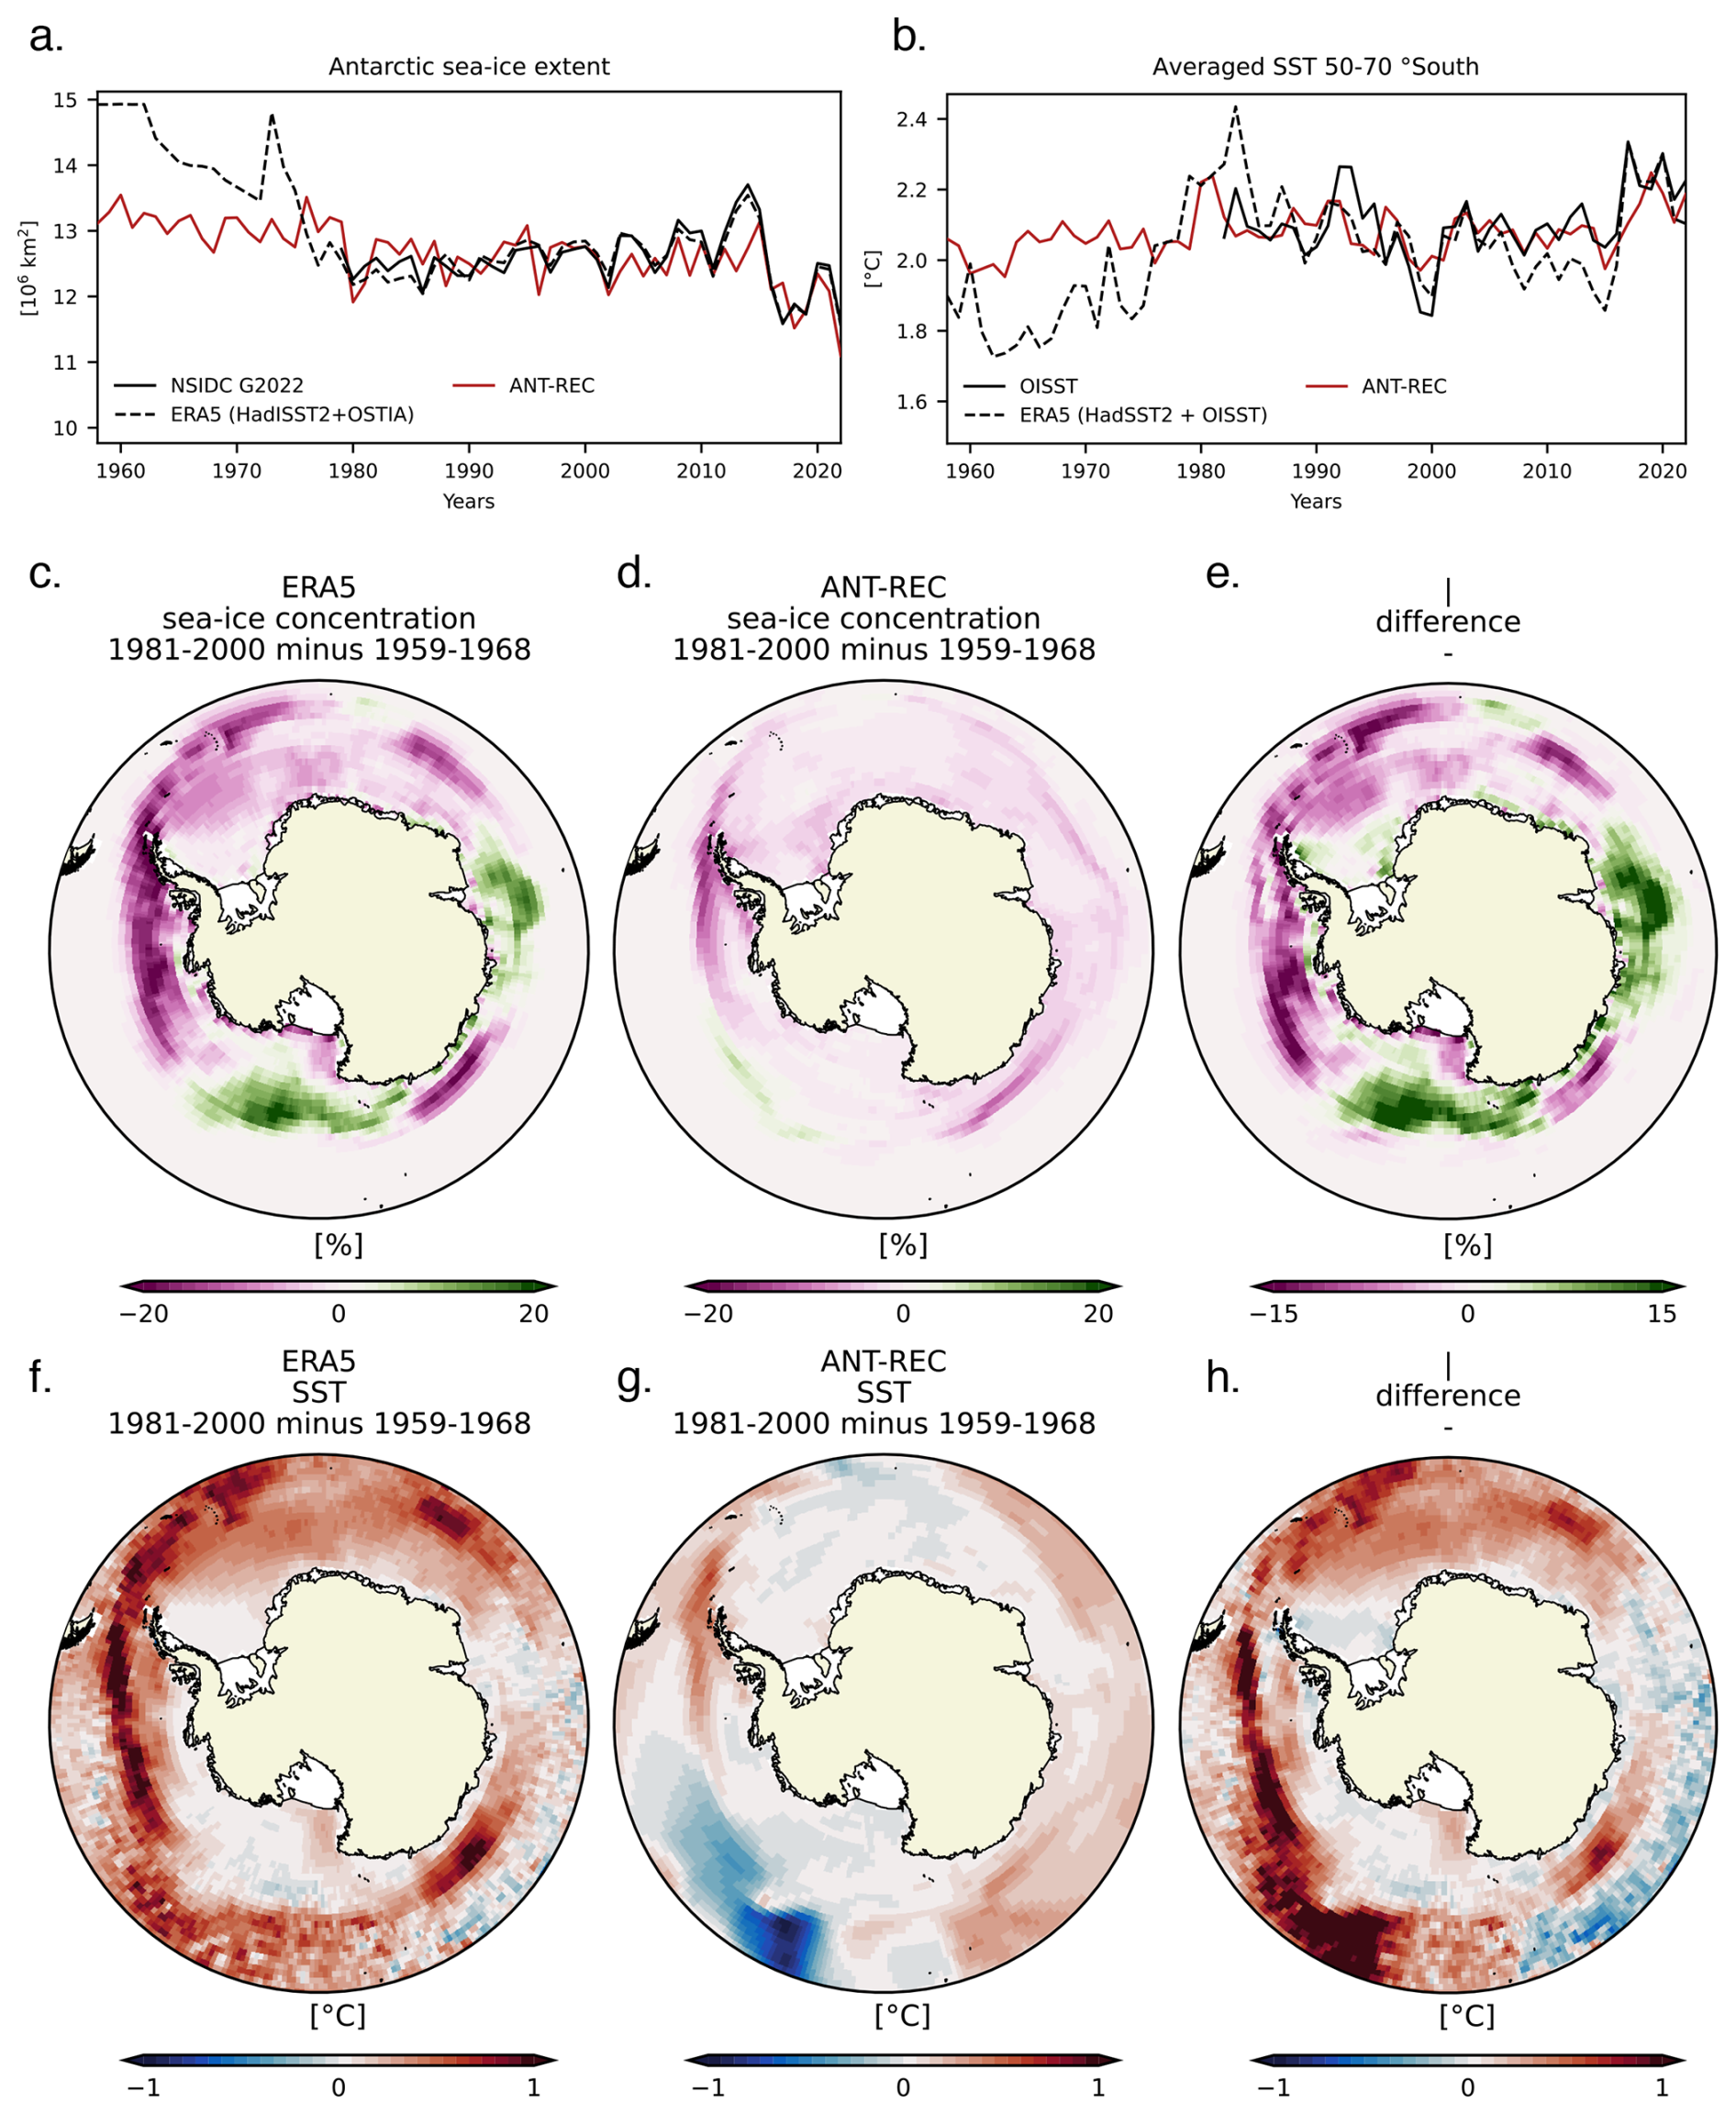
Figure 1(a) Evolution of total annual Antarctic sea-ice extent from 1958 to 2022 in satellite-based observations (NSIDC), ERA5 SSCs, and ANT-REC. (b) Southern Ocean mean SST (50–70° S) from OISST, ERA5 SSCs, and ANT-REC. (c–e) Sea-ice concentration changes between 1981–2000 and 1959–1968 in ERA5 SSCs (c), ANT-REC (d), and their difference (e). (f–h) SST changes between 1981–2000 and 1959–1968 in ERA5 SSCs (f), ANT-REC (g), and their difference (h).
Another reconstruction of Antarctic sea-ice extent covering the 20th century and beyond has been proposed by Fogt et al. (2022), based on statistical relationships between mid-latitude atmospheric variability and Antarctic sea-ice extent derived from atmospheric pressure and temperature observations. Compared with ANT-REC, this reconstruction suggests an even weaker decrease in Antarctic sea-ice extent prior to 1979 (0.18×10⁶ km2 between 1959–1968 and 1981–2000, compared with 0.49×10⁶ km2 in ANT-REC), highlighting the substantial uncertainties in historical sea-ice variability. These differences likely arise from differences in methodology. More specifically, the reconstruction of Fogt et al. (2022) relies primarily on statistical relationships in the atmosphere, whereas the ANT-REC dataset used in this study is based on the assimilation of Antarctic and sub-Antarctic atmospheric pressure and temperature observations into Earth System Model simulations, followed by ocean–sea-ice modeling to represent ocean dynamics, thereby explicitly representing oceanic processes.
Beyond differences between reconstructions, uncertainties are also present within the ANT-REC framework itself. Although only one atmospheric reanalysis (based on CESM1) was used to force the ocean–sea-ice model, ten atmospheric reanalyses are available and provide an indication of the reanalysis uncertainty, as they also provide sea-ice concentration fields. Among these reanalyses, the CESM1-based atmospheric reanalysis shows a sea-ice decline between 1959–1968 and 1981–2000 of 0.40×10⁶ km2, which lies close to the ensemble mean of the ten realizations (0.41 ± 0.18×10⁶ km2). Finally, the magnitude of the sea-ice decrease in ANT-REC is broadly consistent with independent paleo-based estimates (Thomas et al., 2019; Dalaiden, Rezsöhazy et al., 2023), but the discrepancies between reconstructions emphasize the remaining uncertainty in Southern Ocean sea surface conditions prior to 1979, when continuous satellite coverage is available.
Spatially, ANT-REC suggests relatively uniform changes in sea-ice concentration over 1981–2000 relative to 1959–1968, with the largest negative anomalies in the Bellingshausen Sea and a slight increase offshore of the Ross Sea. In contrast, ERA5 (using boundary conditions from HadISST2) reveals both a stronger magnitude of change and larger spatial variability. The most significant declines occur in the Amundsen and Bellingshausen Seas and in the Atlantic sector, while increases are evident in the Ross Sea and near the Amery Ice Shelf. As a result, the difference between the two datasets highlights a stronger sea-ice decline in ERA5 in the Amundsen and Bellingshausen Seas and the Atlantic sector, whereas in the Indian sector and Ross Sea, ANT-REC indicates a more substantial decrease.
The changes in SSTs are broadly consistent with those in sea-ice extent. The temporal evolution of SSTs averaged over the Southern Ocean (50–70° S) shows colder conditions during 1958–1967 compared to 1981–2010, with a mean difference of −0.28 °C in ERA5 and −0.06 °C in ANT-REC. Consistent with its underestimation of the 2014 sea-ice maximum, ANT-REC also exhibits a warm SST bias in that year. In terms of spatial patterns, ERA5 indicates relatively homogeneous surface warming across the Southern Ocean, with the strongest anomalies in regions of largest sea-ice loss, as well as farther north – particularly in the Atlantic and Pacific sectors. In contrast, ANT-REC shows greater spatial heterogeneity and a weaker overall warming signal. The strongest SST increases in ANT-REC occur near the Antarctic Peninsula, with moderate warming in the Indian sector, while little to no change is noticed in the Weddell, Ross, and Amundsen Seas. Consequently, ERA5 depicts significantly cooler conditions across the Southern Ocean during 1958–1967 compared to ANT-REC, especially in the Atlantic and Pacific sectors. These discrepancies highlight the 1958–1978 period as a key window of uncertainty in SSC reconstructions, underscoring the importance of quantifying how such differences impact the Antarctic climate over that period.
3.2 Station-based evaluation of near-surface air temperature biases under different SSCs
Figure 2 shows the bias in annual near-surface air temperature during 1959–1968 for ERA5, ERA5-forced CAM and ANT-REC-forced CAM, relative to weather station observations. Before computing the bias (defined as the difference between each dataset and station observations), all datasets were first expressed as anomalies with respect to the 1981–2000 mean. In addition, for both the ERA5-forced and ANT-REC-forced CAM ensembles, 1000 bootstrap resamples were generated from the 10-member ensemble to quantify the contribution of internal atmospheric variability to the total signal. More specifically, for each station, 1000 resamples were generated by randomly selecting eight out of the ten ensemble members (without replacement), on which we further compute the mean difference. ERA5 exhibits a cold bias at most stations (−0.68 °C on average). In ERA5-forced CAM, the cold bias persists but is weaker (−0.38 °C). This indicates that although the continental cold bias in ERA5 is partly related to the prescribed SSCs, SSCs alone cannot fully account for it. In ANT-REC-forced CAM, the mean temperature bias is slightly negative (0.04 °C). The small spread among ensemble members indicates that the differences between the ERA5-forced and ANT-REC-forced simulations primarily reflect the imposed SSC boundary conditions rather than differences in atmospheric initialization. The negative temperature bias in ERA5 contrasts with ERA5-forced CAM and is consistent with the smaller sea-ice extent and warmer SSTs in ANT-REC compared to ERA5 SSCs.
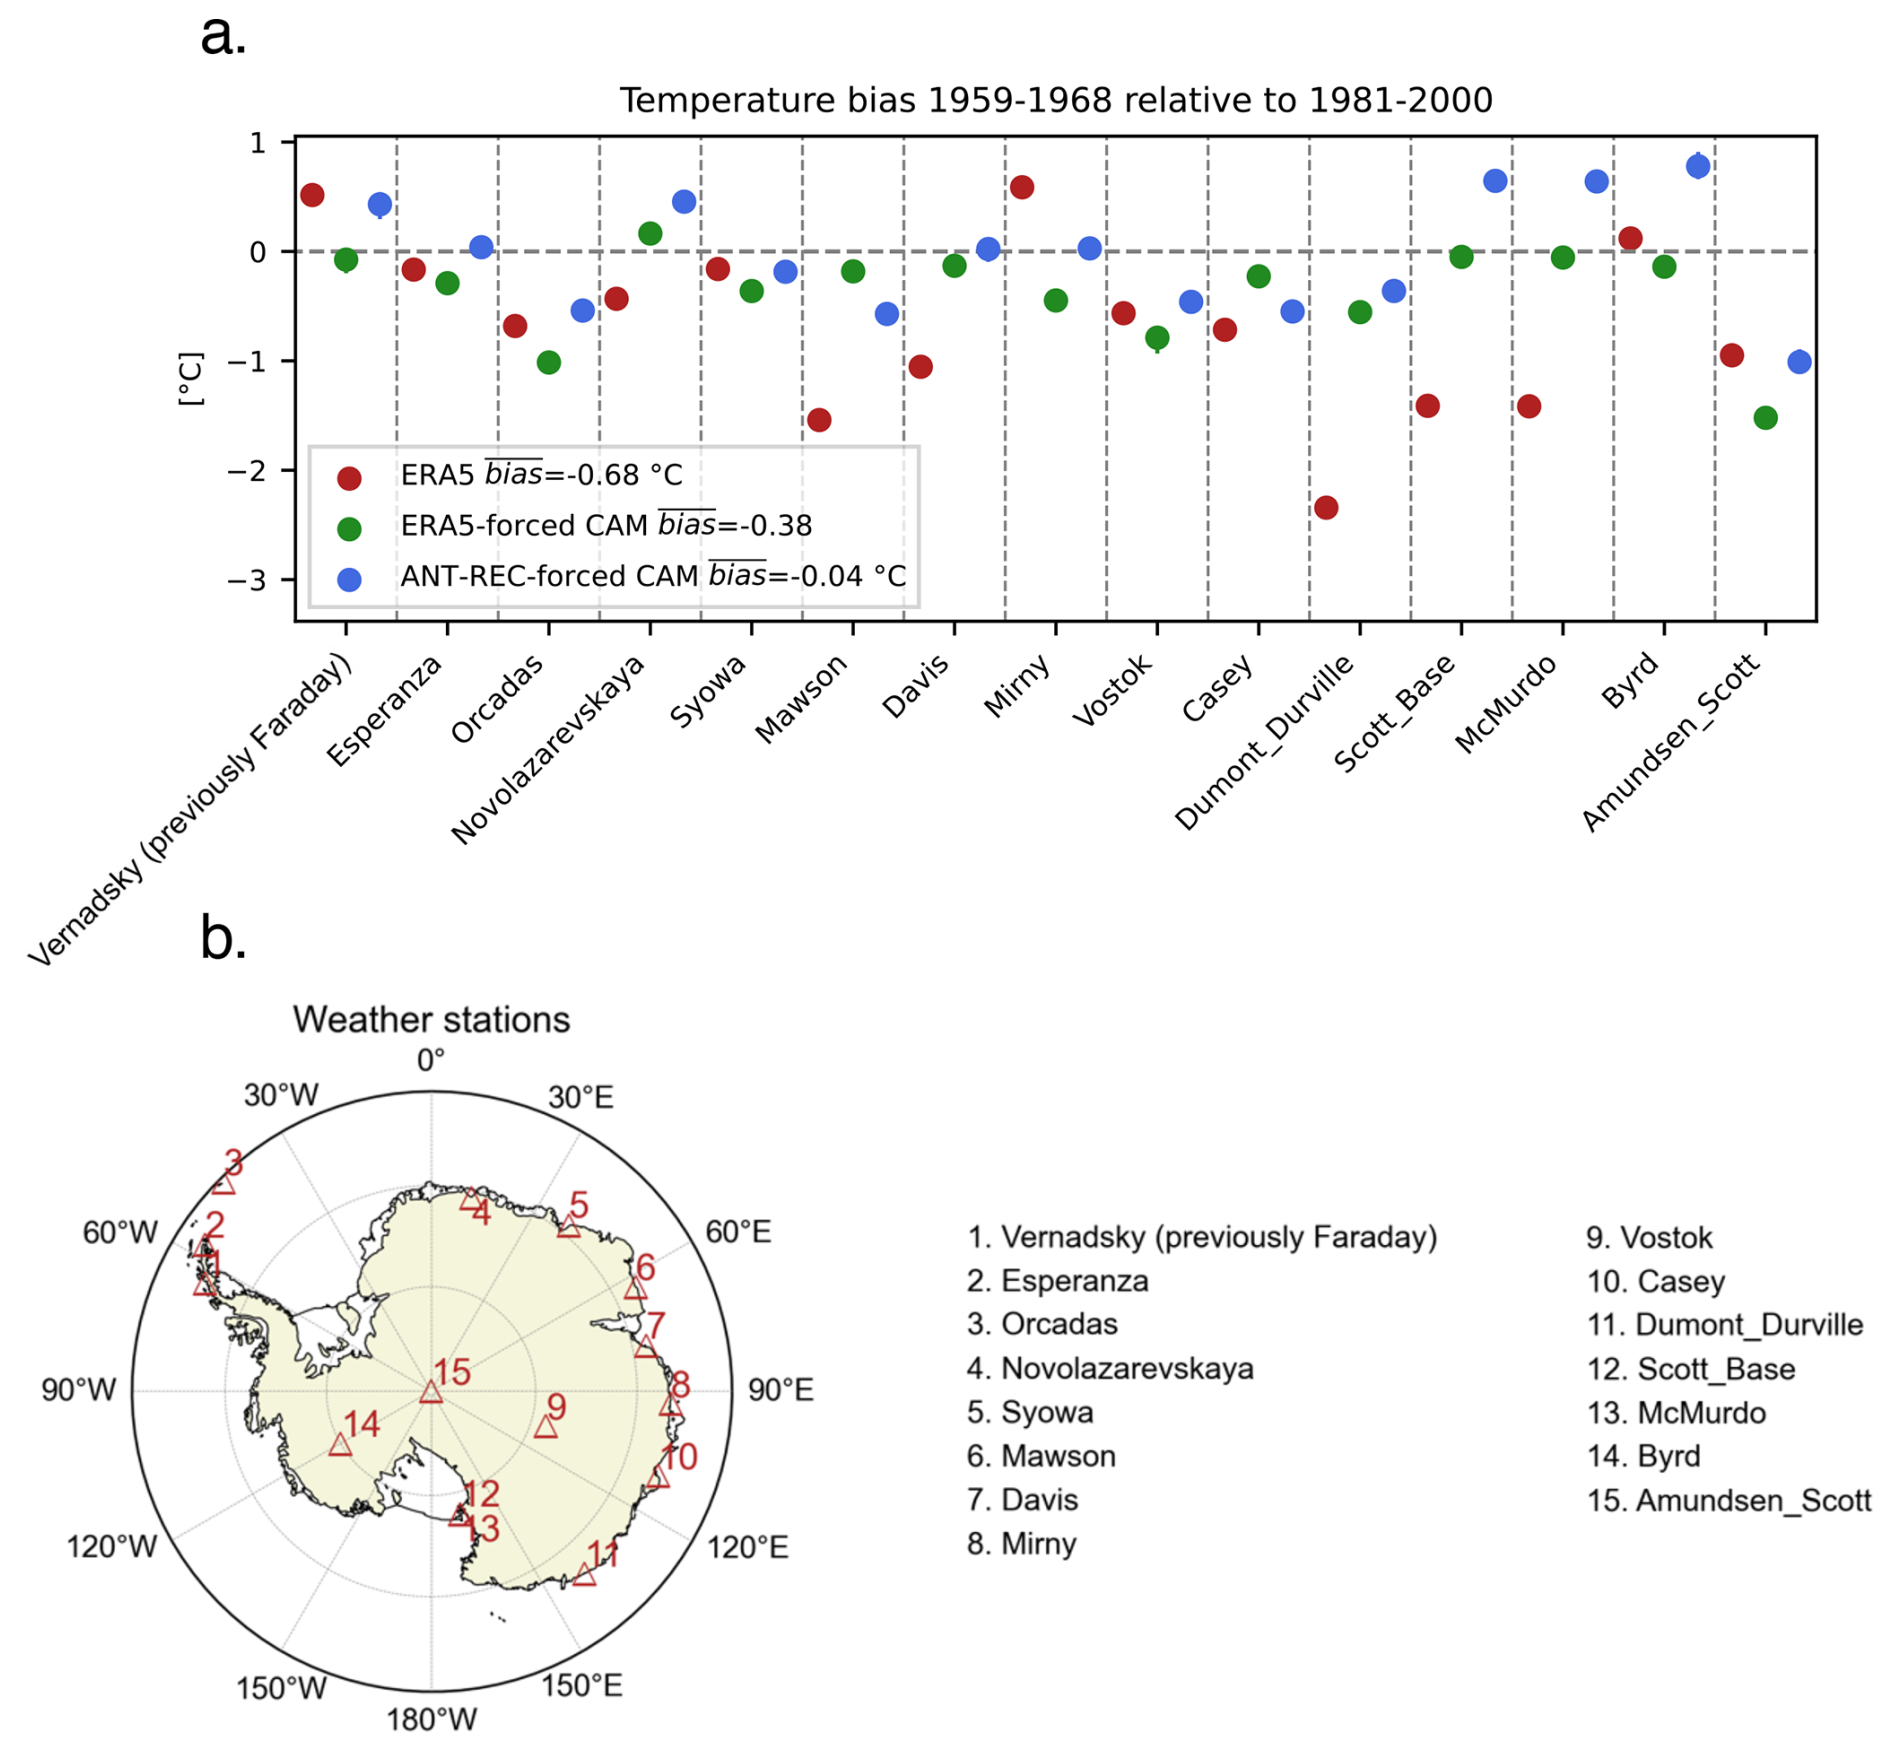
Figure 2(a) Bias in annual near-surface air temperature relative to weather station observations over 1959–1968 for ERA5, ERA5-forced CAM and ANT-REC-forced CAM. The bias is defined as model or reanalysis minus observations (e.g., negative values indicate a cold bias). All time series are expressed as anomalies relative to the 1981–2000 mean before bias calculation. For the two CAM ensembles, the dots indicate the median of the 1000 bootstrap resamples derived from the 10-member ensemble, while the bars represent the 95 % confidence interval. (b) Locations of the weather stations.
3.3 Changes in precipitation and near-surface air temperature over the Antarctic Ice Sheet associated with sea surface condition changes
Figure 3 shows the changes in precipitation and near-surface temperature between 1959–1968 and 1981–2000 from the CAM ensemble mean using ANT-REC SSCs and ERA5 SSCs, along with their differences. Both ensembles show a net increase in precipitation over the AIS: 269 Gt for the ERA5-forced CAM ensemble mean and 118 Gt for the ANT-REC-forced CAM ensemble mean (more than twice smaller). As expected, the largest increases are found along coastal regions, where adiabatic cooling during orographic uplift of moist air masses originating from the ocean converts atmospheric humidity into snowfall. A substantial precipitation increase also occurs in non-coastal areas in West Antarctica.
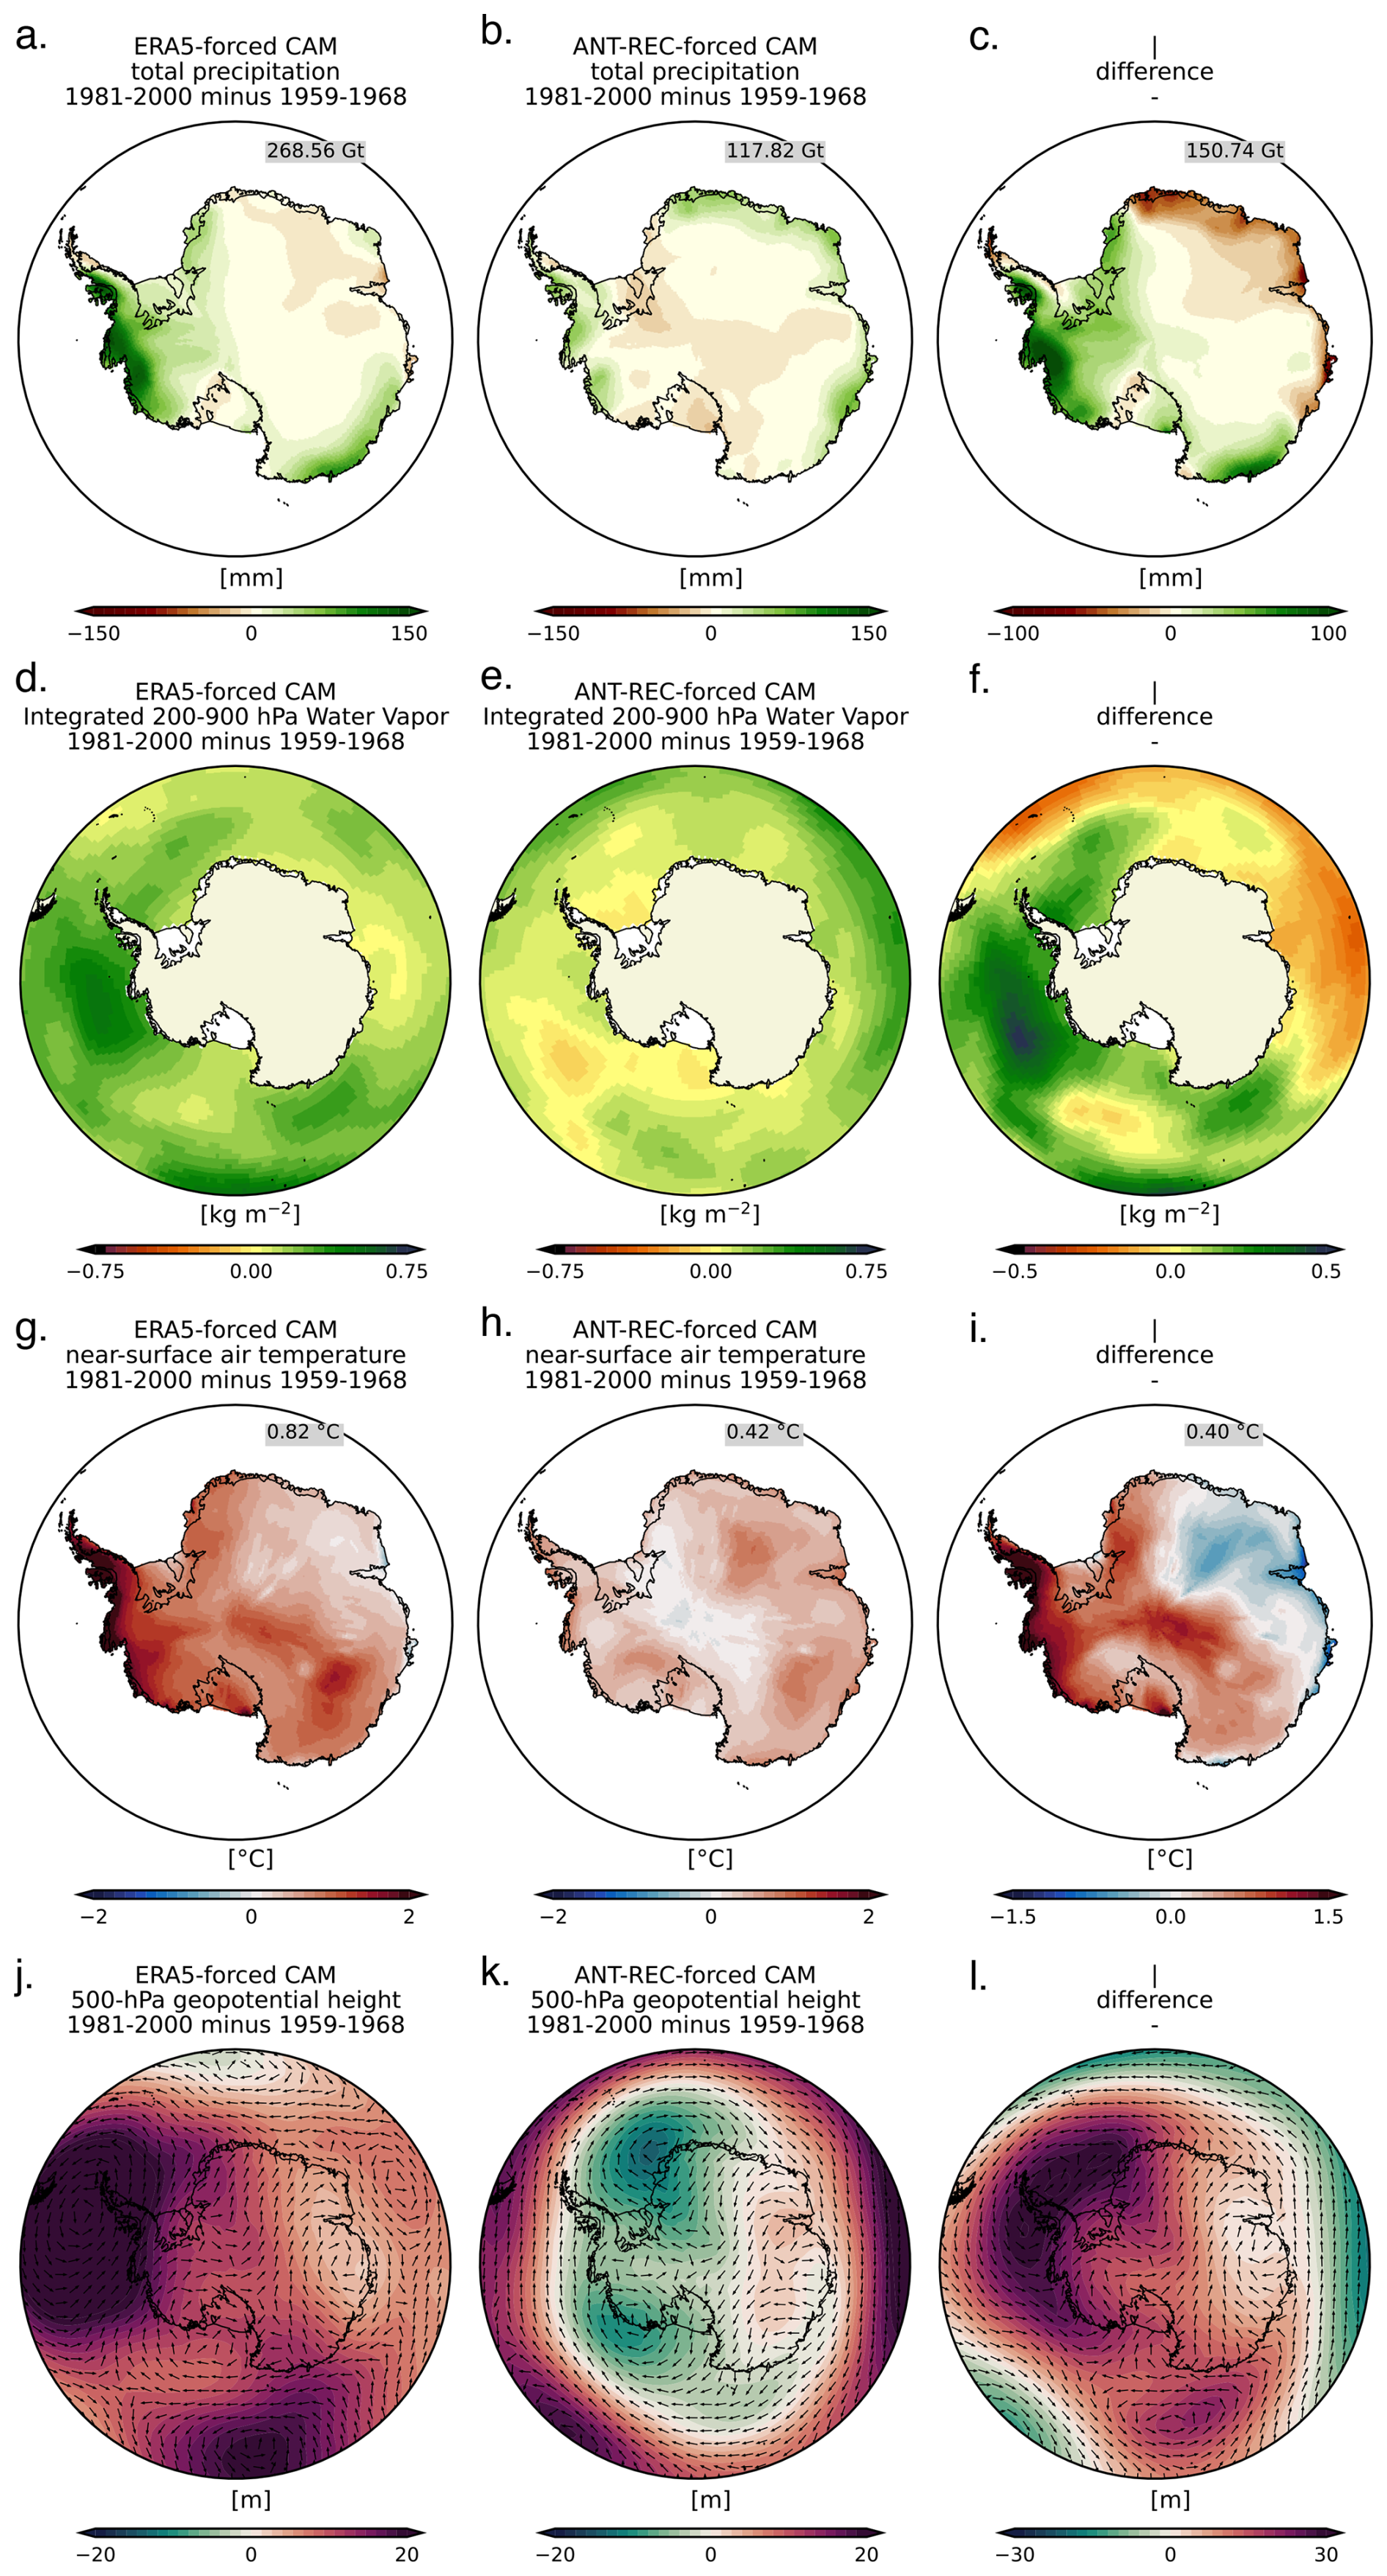
Figure 3(a–c) Total precipitation changes between 1981–2000 and 1959–1968 in ERA5-forced CAM (a), ANT-REC-forced CAM (b), and their difference (c, i.e., b–a). (d–f) Same as (a)–(c), but for integrated water vapor between 200–900 hPa. (g–i) Same, but for near-surface air temperature. (j–l) Same, but for 500 hPa geopotential height together with 500 hPa winds (vectors scaled by their norms). For total precipitation and near-surface air temperature, the corresponding continental mean change is also indicated (e.g., precipitation change is computed as the integrated total precipitation for 1981–2000 minus the integrated total precipitation for 1959–1968).
The net increase in precipitation in both ensembles is driven by changes in external forcings (aerosols, greenhouse gases, ozone depletion) and by SSC changes. Since external forcings are identical in both CAM ensembles, their differences isolate the impact of SSCs. The ERA5-forced CAM ensemble mean shows a precipitation gain of 151 Gt in 1981–2000 with respect to 1959–1968 relative to the ANT-REC-forced CAM ensemble mean, with the largest positive anomalies in West Antarctica. This enhanced precipitation can be explained by pronounced differences in sea-ice concentration and SSTs in the Bellingshausen and Amundsen Seas (Fig. 1): compared with ANT-REC, ERA5 SSCs show stronger sea-ice retreat and more intense surface ocean warming in this area. These conditions favor enhanced air–sea fluxes, especially upward moisture transfer from the ocean to the atmosphere. Combined with the climatological low-pressure system located off the West Antarctic coasts, known as the Amundsen Sea Low, these changes increase moisture transport toward the West Antarctic Ice Sheet, where it precipitates. In contrast, ANT-REC-forced CAM indicates a strong precipitation increase over Dronning Maud Land, associated with higher offshore atmospheric vapor content and the strengthening of a low-pressure system off the East Antarctic coast in the Altantic/Indian sector, which transports additional moisture inland (Fig. 3). Conversely, ERA5-forced CAM shows anomalous positive changes in 500 hPa geopotential height in this sector, which favors enhanced northward outflow from the cold and dry continent and thus drier conditions compared with ANT-REC-forced CAM.
For near-surface air temperature, both ensembles simulate overall warming in 1981–2000 relative to 1959–1968: 0.45 °C in the ANT-REC-forced CAM ensemble mean and 0.87 °C in the ERA5-forced CAM ensemble mean (almost twice as large). Unlike precipitation, warming is not confined to coastal regions but extends across the Antarctic Plateau. Consistent with the precipitation patterns, ERA5-forced CAM shows strong warming over the Antarctic Peninsula and West Antarctica. ANT-REC-forced CAM shows weaker warming in West Antarctica but similarly strong warming over the Antarctic Peninsula (though with lower amplitude) and the Antarctic Plateau. The differences between the two ensembles are thus consistent with those found for precipitation, particularly in West Antarctica and the Antarctic Peninsula. This pattern aligns with the well-documented positive temperature–precipitation relationship over Antarctica (Frieler et al., 2015). However, in East Antarctica, warming is not systematically associated with higher precipitation. For example, in Dronning Maud Land, strong warming in ERA5-forced CAM is not always coincided with notable precipitation changes.
According to ERA5, the AIS gained about 440 Gt of surface mass (precipitation) in 1981–2000 relative to 1959–1968 corresponding to 160 % and 370 % of the increases simulated in the ERA5-forced CAM and ANT-REC-forced CAM ensembles, respectively (Fig. S1). Our model simulations therefore indicate that SSCs in ERA5 cannot, solely, explain the entire precipitation changes in ERA5. For near-surface air temperature, the mean change in ERA5 (0.82 °C) is consistent with ERA5-forced CAM, but the spatial patterns differ: ERA5 shows weaker warming in West Antarctica and stronger warming over the Ross and Filchner–Ronne Ice Shelves. Consequently, precipitation sensitivity to temperature substantially differs between the datasets: 19.8 % per °C in ERA5, compared with 12 % in ERA5-forced CAM and 10.4 % in ANT-REC-forced CAM. The stronger scaling in ERA5 likely reflects circulation-driven increases in moisture transport rather than a purely thermodynamic Clausius–Clapeyron response.
The largest discrepancies between ERA5 and ERA5-forced CAM are found in the 500 hPa geopotential height field. ERA5 shows a strengthening and poleward shift of the westerlies, including intensification of the Amundsen Sea Low, and a pronounced deepening of a low-pressure system near the East Antarctic coast, close to the Amery Ice Shelf. Although this negative trend in the westerly winds is consistent with observations (Fogt et al., 2019), the magnitude is too strong. This exaggerated change is consistent with the positive bias in surface pressure recorded at several East Antarctic stations (Dalaiden et al., 2025), where ERA5 overestimates the negative pressure trend. Associated with this surface atmospheric pressure bias is a cool bias during the pre-continuous satellite period (Fig. 2), also reported by Bromwich et al. (2024). In their study, the cold bias in ERA5 is estimated to be about 1 °C over Antarctica as a whole, whereas our estimate (0.68 °C) is derived from the locations of available weather stations and over slightly different period (1940–1978 relative to the post-1979 period), which likely contributes to the difference in magnitude. Our modeling experiments suggest that SSCs account for about 30 % of this cold bias within the framework of our experiments, but other factors must also contribute. Among these potential factors, the limited observational constraints before the late 1970s might have contributed to systematic errors in ERA5 for the Southern Hemisphere (Bromwich et al., 2024; Soci et al., 2024).
It should also be noted that the sensitivity experiments performed in this study are based on simulations with CAM, whereas the ERA5 reanalysis is produced using the Integrated Forecasting System (IFS). These models differ in their dynamical cores and physical parameterizations, which influence the atmospheric response to prescribed SSCs. In addition, ERA5 is constrained by atmospheric observations through data assimilation – albeit limited in the Southern Ocean before 1979 (Soci et al., 2024) –, while the simulations conducted here are only constrained by prescribed SSCs. Therefore, the results presented here should be interpreted as the response of CAM to different SSC products, and not as a direct quantification of the ERA5 bias.
The aim of this study was to better understand the reported mid-20th century surface mass gain of the AIS, and more generally Antarctic surface climate change, by focusing on the impacts of SSC uncertainties over 1958–1978 (i.e., before the onset of continuous satellite coverage). We show that SSC uncertainties strongly affect the Antarctic hydroclimate, influencing both precipitation and near-surface temperature. In contrast to previous studies, which primarily tested sensitivity using idealized perturbations (e.g., Kittel et al., 2018), we quantify Antarctic climate sensitivity using two observation-based SSC datasets, thereby providing an explicit quantification of the SSC uncertainty. In particular, simulations using a recent Antarctic reconstruction – assimilating mid- and high-latitude station observations into an Earth System Model (i.e., Dalaiden et al., 2025) – show better agreement with Antarctic observations than simulations using ERA5 SSCs. This suggests that ERA5 SSCs may contain systematic biases in the Southern Ocean. In particular, ERA5 relies on HadISST2 for the period before the satellite period. Yet HadISST2 is characterized by a large sea-ice cover over that period (Titchner and Rayner, 2014). Nonetheless, the better performance of ANT-REC should be interpreted cautiously. By using near-surface air temperature and atmospheric surface pressure from the Antarctic and sub-Antarctic weather stations, this reconstruction relies on the physical relationship between continental and oceanic changes to reconstruct the surface conditions, further used as atmospheric forcing in a ocean–sea-ice model. This later step improves the representation of the variability of the sea surface temperature and sea-ice concentration through the integration of the atmospheric forcing by the ocean (Dalaiden et al., 2025).
Given the critical role of Antarctica in the global climate system, particularly through sea-level rise, longer and more homogeneous SSC products are essential for robust assessments of long-term climate change. This is especially important given the large internal variability of the Antarctic climate (e.g., Jones et al., 2016). Developing a temporally consistent SSC dataset for the high-latitude Southern Hemisphere is therefore a priority. However, uncertainties in SSC reconstructions prior to 1979 will inevitably remain larger than after the onset of continuous satellite data coverage. Progress is foreseen through the combination of diverse observational sources, including satellite products, weather stations, historical ship logbooks, as well as indirect climate records (i.e., paleoclimate records), into unified datasets. In parallel, quantifying the impact of the number, quality, and time-varying constraints of available observations in SSC reconstructions is equally important. In this context, future ensemble reanalyses should aim to explicitly sample uncertainties in SSCs, allowing a more robust quantification of their impact on the simulated atmospheric state.
All datasets used in this study are publicly available from open repositories. Weather station observations were obtained from the READER dataset (https://legacy.bas.ac.uk/met/READER/, last access: 15 January 2025), along with the Byrd Station temperature record (https://polarmet.osu.edu/datasets/Byrd_recon/, last access: 15 January 2025). The ERA5 reanalysis was retrieved from the Copernicus Climate Change Service (C3S) Climate Data Store. Sea-ice concentration data from NSIDC are available at https://nsidc.org/data/NSIDC-0051/versions/1, last access: 16 January 2024. The HadISST2 product can be accessed from https://www.metoffice.gov.uk/hadobs/hadisst2/data/download.html, last access: 26 February 2024, and the OISST dataset is available from https://www.ncei.noaa.gov/products/optimum-interpolation-sst, last access: 2 May 2025. The ANT-REC reconstruction is available on Zenodo (https://zenodo.org/records/15472051, last access: 20 May 2025, Dalaiden, 2025b). Finally, the 10-member ensembles of ERA5-forced CAM and ANT-REC-forced CAM simulations are available on Zenodo (https://zenodo.org/records/17521381, Dalaiden, 2025a).
The supplement related to this article is available online at https://doi.org/10.5194/tc-20-2089-2026-supplement.
QD designed the study, performed the simulations with assistance from IB, analyzed the results, and wrote the first draft of the manuscript. IG provided feedback and comments on the initial version of the manuscript.
The contact author has declared that neither of the authors has any competing interests.
Publisher's note: Copernicus Publications remains neutral with regard to jurisdictional claims made in the text, published maps, institutional affiliations, or any other geographical representation in this paper. The authors bear the ultimate responsibility for providing appropriate place names. Views expressed in the text are those of the authors and do not necessarily reflect the views of the publisher.
The simulations were performed on the Norwegian supercomputer Betzy (Sigma2; projects ns11071K and nn9039k). QD received support from the European Union's Horizon 2020 research and innovation programme under the Marie Skłodowska-Curie grant agreement No. 101149188. We would like to thank David Bromwich and John King for their valuable and constructive comments that have improved the quality and robustness of our study.
This research has been supported by the European Commission Horizon 2020 Framework Programme (grant no. 101149188).
This paper was edited by Masashi Niwano and reviewed by David Bromwich and John King.
Bentsen, M., Bethke, I., Debernard, J. B., Iversen, T., Kirkevåg, A., Seland, Ø., Drange, H., Roelandt, C., Seierstad, I. A., Hoose, C., and Kristjánsson, J. E.: The Norwegian Earth System Model, NorESM1-M – Part 1: Description and basic evaluation of the physical climate, Geosci. Model Dev., 6, 687–720, https://doi.org/10.5194/gmd-6-687-2013, 2013. a
Bromwich, D. H., Ensign, A., Wang, S. H., and Zou, X.: Major Artifacts in ERA5 2-m Air Temperature Trends Over Antarctica Prior to and During the Modern Satellite Era, Geophys. Res. Lett., 51, https://doi.org/10.1029/2024GL111907, 2024. a, b, c, d
Dalaiden, Q.: Atmospheric simulations from “Uncertainties in Southern Ocean sea surface conditions and their impact on Antarctic climate over 1958–1978”, Zenodo [data set], https://doi.org/10.5281/zenodo.17521381, 2025a. a
Dalaiden, Q.: Dynamical reconstruction of Southern Ocean and Antarctic climate variability since 1700, Zenodo [data set], https://doi.org/10.5281/zenodo.15472051, 2025b. a
Dalaiden, Q., Rezsöhazy, J., Goosse, H., Thomas, E. R., Vladimirova, D. O., and Tetzner, D.: An Unprecedented Sea Ice Retreat in the Weddell Sea Driving an Overall Decrease of the Antarctic Sea-Ice Extent Over the 20th Century, Geophys. Res. Lett., 50, e2023GL104666, https://doi.org/10.1029/2023GL104666, 2023. a
Dalaiden, Q., Goosse, H., Holland, P. R., and Barthelemy, A.: Dynamical reconstruction of Southern Ocean and Antarctic climate variability since 1700, Sci. Data, 12, 1574, https://doi.org/10.1038/s41597-025-05808-w, 2025. a, b, c, d, e, f, g, h, i
Fogt, R. L., Schneider, D. P., Goergens, C. A., Jones, J. M., Clark, L. N., and Garberoglio, M. J.: Seasonal Antarctic pressure variability during the twentieth century from spatially complete reconstructions and CAM5 simulations, Clim. Dynam., 53, 1435–1452, https://doi.org/10.1007/s00382-019-04674-8, 2019. a
Fogt, R. L., Sleinkofer, A. M., Raphael, M. N., and Handcock, M. S.: A regime shift in seasonal total Antarctic sea ice extent in the twentieth century, Nat. Clim. Change, 12, 54–62, https://doi.org/10.1038/s41558-021-01254-9, 2022. a, b
Frieler, K., Clark, P. U., He, F., Buizert, C., Reese, R., Ligtenberg, S. R., Van Den Broeke, M. R., Winkelmann, R., and Levermann, A.: Consistent evidence of increasing Antarctic accumulation with warming, Nat. Clim. Change, 5, 348–352, https://doi.org/10.1038/nclimate2574, 2015. a, b
Fyke, J., Sergienko, O., Löfverström, M., Price, S., and Lenaerts, J. T.: An Overview of Interactions and Feedbacks Between Ice Sheets and the Earth System, Rev. Geophys., 56, 361–408, https://doi.org/10.1029/2018RG000600, 2018. a, b
Gates, W. L., Boyle, J. S., Covey, C., Dease, C. G., Doutriaux, C. M., Drach, R. S., Fiorino, M., Gleckler, P. J., Hnilo, J. J., Marlais, S. M., Phillips, T. J., Potter, G. L., Santer, B. D., Sperber, K. R., Taylor, K. E., and Williams, D. N.: An Overview of the Results of the Atmospheric Model Intercomparison Project (AMIP I), Bull. Am. Meteorol. Soc., 80, 29–55, https://doi.org/10.1175/1520-0477(1999)080<0029:AOOTRO>2.0.CO;2, 1999. a
Good, S., Fiedler, E., Mao, C., Martin, M. J., Maycock, A., Reid, R., Roberts-Jones, J., Searle, T., Waters, J., While, J., and Worsfold, M.: The Current Configuration of the OSTIA System for Operational Production of Foundation Sea Surface Temperature and Ice Concentration Analyses, Remote Sens., 12, https://doi.org/10.3390/rs12040720, 2020. a
Gossart, A., Helsen, S., Lenaerts, J. T. M., Broucke, S. V., van Lipzig, N. P. M., and Souverijns, N.: An Evaluation of Surface Climatology in State-of-the-Art Reanalyses over the Antarctic Ice Sheet, J. Clim., 32, 6899–6915, https://doi.org/10.1175/JCLI-D-19-0030.1, 2019. a, b
Hersbach, H., Bell, B., Berrisford, P., Hirahara, S., Horányi, A., Muñoz-Sabater, J., Nicolas, J., Peubey, C., Radu, R., Schepers, D., Simmons, A., Soci, C., Abdalla, S., Abellan, X., Balsamo, G., Bechtold, P., Biavati, G., Bidlot, J., Bonavita, M., De Chiara, G., Dahlgren, P., Dee, D., Diamantakis, M., Dragani, R., Flemming, J., Forbes, R., Fuentes, M., Geer, A., Haimberger, L., Healy, S., Hogan, R. J., Hólm, E., Janisková, M., Keeley, S., Laloyaux, P., Lopez, P., Lupu, C., Radnoti, G., de Rosnay, P., Rozum, I., Vamborg, F., Villaume, S., and Thépaut, J. N.: The ERA5 global reanalysis, Q. J. Roy. Meteorol. Soc., 146, 1999–2049, https://doi.org/10.1002/qj.3803, 2020. a
Hurrell, J. W., Holland, M. M., Gent, P. R., Ghan, S., Kay, J. E., Kushner, P. J., Lamarque, J. F., Large, W. G., Lawrence, D., Lindsay, K., Lipscomb, W. H., Long, M. C., Mahowald, N., Marsh, D. R., Neale, R. B., Rasch, P., Vavrus, S., Vertenstein, M., Bader, D., Collins, W. D., Hack, J. J., Kiehl, J., and Marshall, S.: The community earth system model: A framework for collaborative research, Bull. Am. Meteorol. Soc., 94, 1339–1360, https://doi.org/10.1175/BAMS-D-12-00121.1, 2013. a
Jones, J. M., Gille, S. T., Goosse, H., Abram, N. J., Canziani, P. O., Charman, D. J., Clem, K. R., Crosta, X., De Lavergne, C., Eisenman, I., England, M. H., Fogt, R. L., Frankcombe, L. M., Marshall, G. J., Masson-Delmotte, V., Morrison, A. K., Orsi, A. J., Raphael, M. N., Renwick, J. A., Schneider, D. P., Simpkins, G. R., Steig, E. J., Stenni, B., Swingedouw, D., and Vance, T. R.: Assessing recent trends in high-latitude Southern Hemisphere surface climate, Nat. Clim. Change, 6, 917–926, https://doi.org/10.1038/nclimate3103, 2016. a
Kay, J. E., Deser, C., Phillips, A., Mai, A., Hannay, C., Strand, G., Arblaster, J. M., Bates, S. C., Danabasoglu, G., Edwards, J., Holland, M., Kushner, P., Lamarque, J. F., Lawrence, D., Lindsay, K., Middleton, A., Munoz, E., Neale, R., Oleson, K., Polvani, L., and Vertenstein, M.: The community earth system model (CESM) large ensemble project : A community resource for studying climate change in the presence of internal climate variability, Bull. Am. Meteorol. Soc., 96, 1333–1349, https://doi.org/10.1175/BAMS-D-13-00255.1, 2015. a
Kittel, C., Amory, C., Agosta, C., Delhasse, A., Doutreloup, S., Huot, P. V., Wyard, C., Fichefet, T., and Fettweis, X.: Sensitivity of the current Antarctic surface mass balance to sea surface conditions using MAR, The Cryosphere, 12, 3827–3839, https://doi.org/10.5194/tc-12-3827-2018, 2018. a, b
Lenaerts, J. T., Gettelman, A., van Tricht, K., van Kampenhout, L., and Miller, N. B.: Impact of Cloud Physics on the Greenland Ice Sheet Near-Surface Climate : A Study With the Community Atmosphere Model, J. Geophys. Res.-Atmos., 1–16, https://doi.org/10.1029/2019JD031470, 2020. a, b
Neale, R., Richter, J., Conley, A., Park, S., Lauritzen, P., Gettelman, A., Williamson, D., Rasch, P., Vavrus, S., Taylor, M., Collins, W., Zhang, M., and Lin, S.-J.: Description of the Community Atmosphere Model (CAM 4.0), NCAR Technical Note, TN-485+STR, https://doi.org/10.5065/GSEB-6470, 2010. a
Otosaka, I. N., Shepherd, A., Ivins, E. R., Schlegel, N.-J., Amory, C., van den Broeke, M. R., Horwath, M., Joughin, I., King, M. D., Krinner, G., Nowicki, S., Payne, A. J., Rignot, E., Scambos, T., Simon, K. M., Smith, B. E., Sørensen, L. S., Velicogna, I., Whitehouse, P. L., A, G., Agosta, C., Ahlstrøm, A. P., Blazquez, A., Colgan, W., Engdahl, M. E., Fettweis, X., Forsberg, R., Gallée, H., Gardner, A., Gilbert, L., Gourmelen, N., Groh, A., Gunter, B. C., Harig, C., Helm, V., Khan, S. A., Kittel, C., Konrad, H., Langen, P. L., Lecavalier, B. S., Liang, C.-C., Loomis, B. D., McMillan, M., Melini, D., Mernild, S. H., Mottram, R., Mouginot, J., Nilsson, J., Noël, B., Pattle, M. E., Peltier, W. R., Pie, N., Roca, M., Sasgen, I., Save, H. V., Seo, K.-W., Scheuchl, B., Schrama, E. J. O., Schröder, L., Simonsen, S. B., Slater, T., Spada, G., Sutterley, T. C., Vishwakarma, B. D., van Wessem, J. M., Wiese, D., van der Wal, W., and Wouters, B.: Mass balance of the Greenland and Antarctic ice sheets from 1992 to 2020, Earth Syst. Sci. Data, 15, 1597–1616, https://doi.org/10.5194/essd-15-1597-2023, 2023. a
Soci, C., Hersbach, H., Simmons, A., Poli, P., Bell, B., Berrisford, P., Horányi, A., Muñoz-Sabater, J., Nicolas, J., Radu, R., Schepers, D., Villaume, S., Haimberger, L., Woollen, J., Buontempo, C., and Thépaut, J.-N.: The ERA5 global reanalysis from 1940 to 2022, Q. J. Roy. Meteorol. Soc., 150, 4014–4048, https://doi.org/10.1002/qj.4803, 2024. a, b
Thomas, E. R., Allen, C. S., Etourneau, J., King, A. C. F., Severi, M., Winton, V. H. L., Mueller, J., Crosta, X., and Peck, V. L.: Antarctic Sea Ice Proxies from Marine and Ice Core Archives Suitable for Reconstructing Sea Ice over the past 2000 Years, Geosciences, 1–33, https://doi.org/10.3390/geosciences9120506, 2019. a
Titchner, H. A. and Rayner, N. A.: The Met Office Hadley Centre sea ice and sea surface temperature data set, version 2: 1. Sea ice concentrations, J. Geophys. Res.-Atmos., 119, 2864–2889, https://doi.org/10.1002/2013JD020316, 2014. a, b, c, d, e
Turner, J., Colwell, S. R., Marshall, G. J., Lachlan-Cope, T. A., Carleton, A. M., Jones, P. D., Lagun, V., Reid, P. A., and Iagovkina, S.: The SCAR READER Project: Toward a High-Quality Database of Mean Antarctic Meteorological Observations, J. Clim., 17, 2890–2898, https://doi.org/10.1175/1520-0442(2004)017<2890:TSRPTA>2.0.CO;2, 2004. a
van Dalum, C. T., van de Berg, W. J., van den Broeke, M. R., and van Tiggelen, M.: The surface mass balance and near-surface climate of the Antarctic ice sheet in RACMO2.4p1, The Cryosphere, 19, 4061–4090, https://doi.org/10.5194/tc-19-4061-2025, 2025. a
Wang, W., Shen, Y., Chen, Q., Wang, F., and Yu, Y.: Spatiotemporal mass change rate analysis from 2002 to 2023 over the Antarctic Ice Sheet and four glacier basins in Wilkes-Queen Mary Land, Sci. China Earth Sci., 68, 1086–1099, https://doi.org/10.1007/s11430-024-1517-1, 2025. a