the Creative Commons Attribution 4.0 License.
the Creative Commons Attribution 4.0 License.
 | 22 Oct 2025
Quantifying retrogressive thaw slump mass wasting and carbon mobilisation on the Qinghai-Tibet Plateau using multi-modal remote sensing
Zhuoxuan Xia
Mark J. Lara
Jurjen van der Sluijs
Philipp Bernhard
Irena Hajnsek
Retrogressive Thaw Slumps (RTS) are slope failures triggered by permafrost thaw that occur in ground-ice-rich regions of the Arctic and the Qinghai-Tibet Plateau (QTP). A strong warming trend has amplified RTS activity on the QTP in recent years. Although the region currently acts as a carbon sink, its permafrost-covered area (40 %) contains substantial soil organic carbon (SOC) stocks. Intensifying thaw-driven mass wasting may transform the QTP into a net carbon source by mobilising previously frozen SOC and enhancing decomposition. Yet, regional remote sensing studies have not yet quantified RTS mass wasting, including material erosion volumes and associated SOC mobilisation. Analysing time-series data from digital elevation models (DEMs) enables direct observation of RTS activity by measuring changes in active area, eroded material volume, and the overall magnitude of surface change. However, most available DEM sources lack the spatial resolution and temporal frequency required for comprehensive RTS monitoring. In contrast, optical data provide higher spatial resolution and more frequent observations, but lack elevation information. Here, we evaluated RTS mass wasting across the QTP from 2011 to 2020 by combining DEMs derived from bistatic Interferometric Synthetic Aperture Radar (InSAR) observations of the TanDEM-X mission with annual RTS inventories generated from high-resolution optical satellite imagery and geophysical soil property data to estimate erosion volume, ground ice loss, and SOC mobilisation. We estimated that RTS activity on the QTP during 2011–2020 relocated 5.02 m3 previously frozen material, resulting in a loss of 3.58 m3 of ground ice, and mobilised 2.78 kg C of organic carbon. We found a reliable power-law scaling relationship between RTS area in the optical RTS inventory and calculated volume change, with α values ranging from 1.20±0.01 to 1.30±0.01 (R2=0.87, p<0.001) depending on the regression model used, which may readily transform planimetric RTS area into volume estimates at scale on the QTP. Despite the relatively recent initiation and smaller size of RTSs on the QTP, material erosion and SOC mobilisation over the past decade exceeded levels in some Siberian Arctic regions, but remained up to 10 times lower than hotspots in the Canadian High Arctic. While current RTS impacts on the QTP are relatively modest, affecting < 0.01 % of the total permafrost area and contributing approximately 0.1 % to the regional carbon budget, the accelerating rates of RTS activity indicate that this phenomenon could become increasingly significant in the future. Our findings highlight the importance of regional studies in advancing our understanding of permafrost thaw-driven changes to the carbon dynamics of rapidly changing permafrost ecosystems.
- Article
(4043 KB) - Full-text XML
-
Supplement
(5779 KB) - BibTeX
- EndNote


Permafrost regions are rapidly warming, causing widespread thaw and degradation (Biskaborn et al., 2019; Farquharson et al., 2019; O'Neill et al., 2023). The permafrost thaw is triggered by a long-term increase in air temperatures (Smith et al., 2022) and is further amplified by various short-term disturbances, such as periods of extreme summer temperatures, high-intensity rainfall, hydrological changes, wildfires, and anthropogenic impacts (Grosse et al., 2011; Hjort et al., 2022; Holloway et al., 2020; Bernhard et al., 2022b; Kokelj et al., 2015). Although approximately half of the global soil organic carbon (SOC) stock is stored in permafrost soils in the Northern Hemisphere (Mishra et al., 2021; Schuur et al., 2022), ongoing permafrost decline is expected to accelerate SOC decomposition and greenhouse gas emissions, potentially triggering significant climate feedbacks (Schuur et al., 2022; Yi et al., 2025). Due to the lack of large-scale observations and the complexity of permafrost thaw processes, climate models do not account for the potential of such processes when simulating permafrost carbon feedbacks (Yi et al., 2025; Schuur et al., 2015, 2022). Existing Earth system models exhibit significant limitations in the accounting of soil organic carbon (SOC) and in the prediction of future changes for global permafrost regions (Turetsky et al., 2020; Virkkala et al., 2021; Nitzbon et al., 2020).
The largest high-altitude permafrost zone is the Qinghai-Tibet Plateau (QTP) with a total extent of 1.06×10⁶ km2 at mean elevations greater than 4000 m (Wang and French, 1994; Liu and Chen, 2000; Zou et al., 2017). Similarly to high-latitude permafrost regions, the QTP is one of the most climate-sensitive regions on Earth (Liu and Chen, 2000) and has experienced a pronounced warming trend in recent decades, with an average increase in air temperatures of 0.035 °C a−1 (Yao et al., 2019). The warming trend affects the thermal state of the permafrost: the active layer thickness (ALT) and ground temperatures have increased, while the regional permafrost extent declined (Cheng and Wu, 2007; Wu and Zhang, 2008; Zhao et al., 2021; Ran et al., 2022). Hence, the QTP is susceptible to permafrost thaw processes that have a substantial impact on the environment and communities, including threats to local transport and energy infrastructure, ecosystems and hydrology, as well as regional carbon budgets and water storage capacities (Luo et al., 2019; Li et al., 2022; Mu et al., 2017; Zhao et al., 2020; Yi et al., 2025; Chen et al., 2024b). Permafrost thaw together with the large SOC stocks make the QTP a potentially considerable carbon source and an important region to monitor permafrost thaw processes (Ran et al., 2022; Chen et al., 2024a; Yi et al., 2025).
Retrogressive Thaw Slumps (RTS) are permafrost landforms that occur in ice-rich permafrost terrain when ground ice is exposed, allowing for rapid thaw and downslope movement of the resulting debris (Burn and Lewkowicz, 1990; Kokelj and Jorgenson, 2013; Nesterova et al., 2024; Harris, 1988; CPA et al., 2024). The landform can expand successively upslope with time due to continuous exposure and thawing of massive and segregated ground ice, thus eroding steep headwalls and mobilising thawed material downslope and potentially into nearby streams and rivers (Nesterova et al., 2024; Kokelj et al., 2021). A gradual decline in headwall height with upslope growth and material accumulation can also result in stabilisation and recovery (Burn and Lewkowicz, 1990; van der Sluijs et al., 2023). RTS can reactivate in complex polycyclic ways (Krautblatter et al., 2024). Climate warming and human disturbance have intensified RTS activity not only in the Arctic (Lantz and Kokelj, 2008; Bernhard et al., 2022a; van der Sluijs et al., 2023), but also on the QTP. In recent years, the plateau experienced strong expansion and initiation rates of RTS mainly on gentle north-facing slopes with fine-grained soils and high ground ice content. More than 30 % of all RTS activity is observed in the Beiluhe River Basin located in the central QTP, where most activity started after 2010 (Luo et al., 2019, 2022; Huang et al., 2020; Xia et al., 2022, 2024). RTS retreat rates are relatively high, with mean rates up to 25 m a−1 (2017–2019) (Huang et al., 2021), although these are similar to other highly active RTS sites in Alaska, northwest Canada, the Canadian High Arctic, and Siberia (Ward Jones et al., 2019; Lacelle et al., 2015, 2010; Lantuit and Pollard, 2008; Lantz and Kokelj, 2008; Leibman et al., 2021).
Due to their complex spatiotemporal dynamics, monitoring RTS activity and assessing their impact on regional carbon cycling remains challenging and is still associated with considerable uncertainties. Most studies have focused on thermokarst hotspots in the central and northeast regions of the QTP, conducting local to subregional analyses using high-resolution satellite imagery and (semi)automatic detection algorithms (Luo et al., 2022; Huang et al., 2021; Xia et al., 2022). A recent study provided an annual inventory of more than 3000 RTS features across the QTP from 2016 to 2022, using high-resolution optical PlanetScope imagery and a semiautomatic detection approach. This effort represents the first high-quality regional-scale dataset that describes RTS initiation and planimetric expansion (Xia et al., 2024). Nevertheless, to quantify RTS-induced mass wasting and evaluate the potential implications on permafrost carbon mobilisation, additional datasets are required - particularly those capturing lateral and vertical change and soil properties. By deriving elevation change from pairs of high-resolution digital elevation models (DEMs) with a temporal baseline within the affected planimetric RTS boundary, volume changes of the eroded material can be obtained by air- or spaceborne LiDAR, stereo optical photogrammetry, or bistatic Interferometric Synthetic Aperture Radar (InSAR) measurements (Lantuit and Pollard, 2005; Van Der Sluijs et al., 2018; Ramage et al., 2018; Dai et al., 2024; Bernhard et al., 2020). Data from the German TanDEM-X mission's X-band bistatic SAR enables the creation of global multitemporal DEMs with approximately 10 m spatial resolution and 2–3 m vertical accuracy (Krieger et al., 2007) and has been shown to be suitable for pan-Arctic monitoring of RTS mass wasting (Bernhard et al., 2022b; Maier et al., 2025). Using in-situ measurements or modelled estimates of SOC stocks and ground ice content, we can combine this information with volumetric change estimates to estimate the amount of formerly frozen organic carbon that has been mobilised. Such approaches have been applied to assess carbon mobilisation due to coastal erosion and slumping in Canada (Ramage et al., 2018), a severe heat wave in Siberia (Bernhard et al., 2022b), and more recently at large thaw-driven mass wasting sites across the pan-Arctic (Dai et al., 2025). However, to date, there have been no regional-scale empirical estimates of either material erosion volume or SOC mobilisation for the QTP.
The volume of eroded material of an RTS scales with its area following power-law relations that characterise its growth dynamics. Several studies adapted the so-called area-volume or allometric scaling from temperate landslide research (Jaboyedoff et al., 2020). Commonly, area-volume scaling is performed using an ordinary least squares (OLS) approach to fit a linear model to the log-transformed RTS area and volume (change) to obtain scaling coefficients. However, distinct differences in the estimated scaling laws can be present between geographic regions and based on the methodological approach used. Bernhard et al. (2022a) used an orthogonal distance regression (ODR) (Boggs and Rogers, 1989) instead of OLS to fit the straight line to the log-transformed RTS area and volume change based on TanDEM-X DEM pairs (2010–2016) assuming that both volume change δV and area change δA are affected by measurement error. The authors report a scaling coefficient of 1.15 for several Arctic sites. Dai et al. (2025) reported a pan-Arctic scaling coefficient of 1.30 based on OLS and ArcticDEM pairs (2012–2022) while Kokelj et al. (2021) and van der Sluijs et al. (2023) report coefficients of 1.36 and 1.41, respectively, in the Canadian Arctic based on OLS and pre-disturbance terrain reconstruction (until 2018). A recent study estimated a scaling coefficient of 1.20 for almost 1500 RTS on the QTP (Ma et al., 2025) based on DEM mosaics and commercial stereo-optical DEMs with varying dates (until 2021–2025). Robust empirical scaling relationships can be helpful to potentially constrain regional-scale estimates on material erosion and carbon mobilisation when only optically derived RTS area estimates are available. However, differences in the scaling model and temporal and spatial resolution of the elevation data impair the (inter-)regional transferability of the estimated coefficients.
In this study, we present the first regional empirical analysis on RTS mass wasting due to RTS activity on the QTP during the last decade. The elevation change from TanDEM-X-derived DEMs between 2011 and 2020, in combination with the high-quality RTS delineations of Xia et al. (2024) and soil property datasets for the QTP, allowed us to estimate the volume of eroded material and the related allometric scaling coefficients, associated ground ice loss, and mobilisation of SOC. We aim to show that the combination of multimodal and multitemporal datasets allows for a more detailed analysis of RTS mass wasting dynamics and further increases our understanding of the regional carbon budget impacts.
2.1 Study site
Our study region, the QTP, is located between 26 and 38° N in the south-west of China at average elevations higher than 4000 m above sea level (Fig. 1a). Permafrost covers 40 % of the plateau (Wang and French, 1994; Liu and Chen, 2000; Zou et al., 2017). The permafrost ground ice content averages around 30 %, decreasing spatially from north to south and west to east (Zou et al., 2024) (Fig. 1b). Compared to the Arctic, the ALT is high ( m) (Ran et al., 2022), while permafrost thickness is relatively low (<60–350 m) (Zhao et al., 2020). A dry and cold climate in the northwest transitions to a warmer and wetter climate in the southeast of the plateau (Chen et al., 2015). The QTP permafrost also stores large amounts of SOC with a median estimate of 1.41×10¹³ kg C (or 14.1 Pg C) for the top 3 m and 4.92×10¹³ kg C (or 49.2 Pg C) for the upper 25 m of soils (Wang et al., 2020; Chen et al., 2024a). The SOC stocks increase from west to east and from north to south (Wang et al., 2021; Chen et al., 2024a) (Fig. 1c).
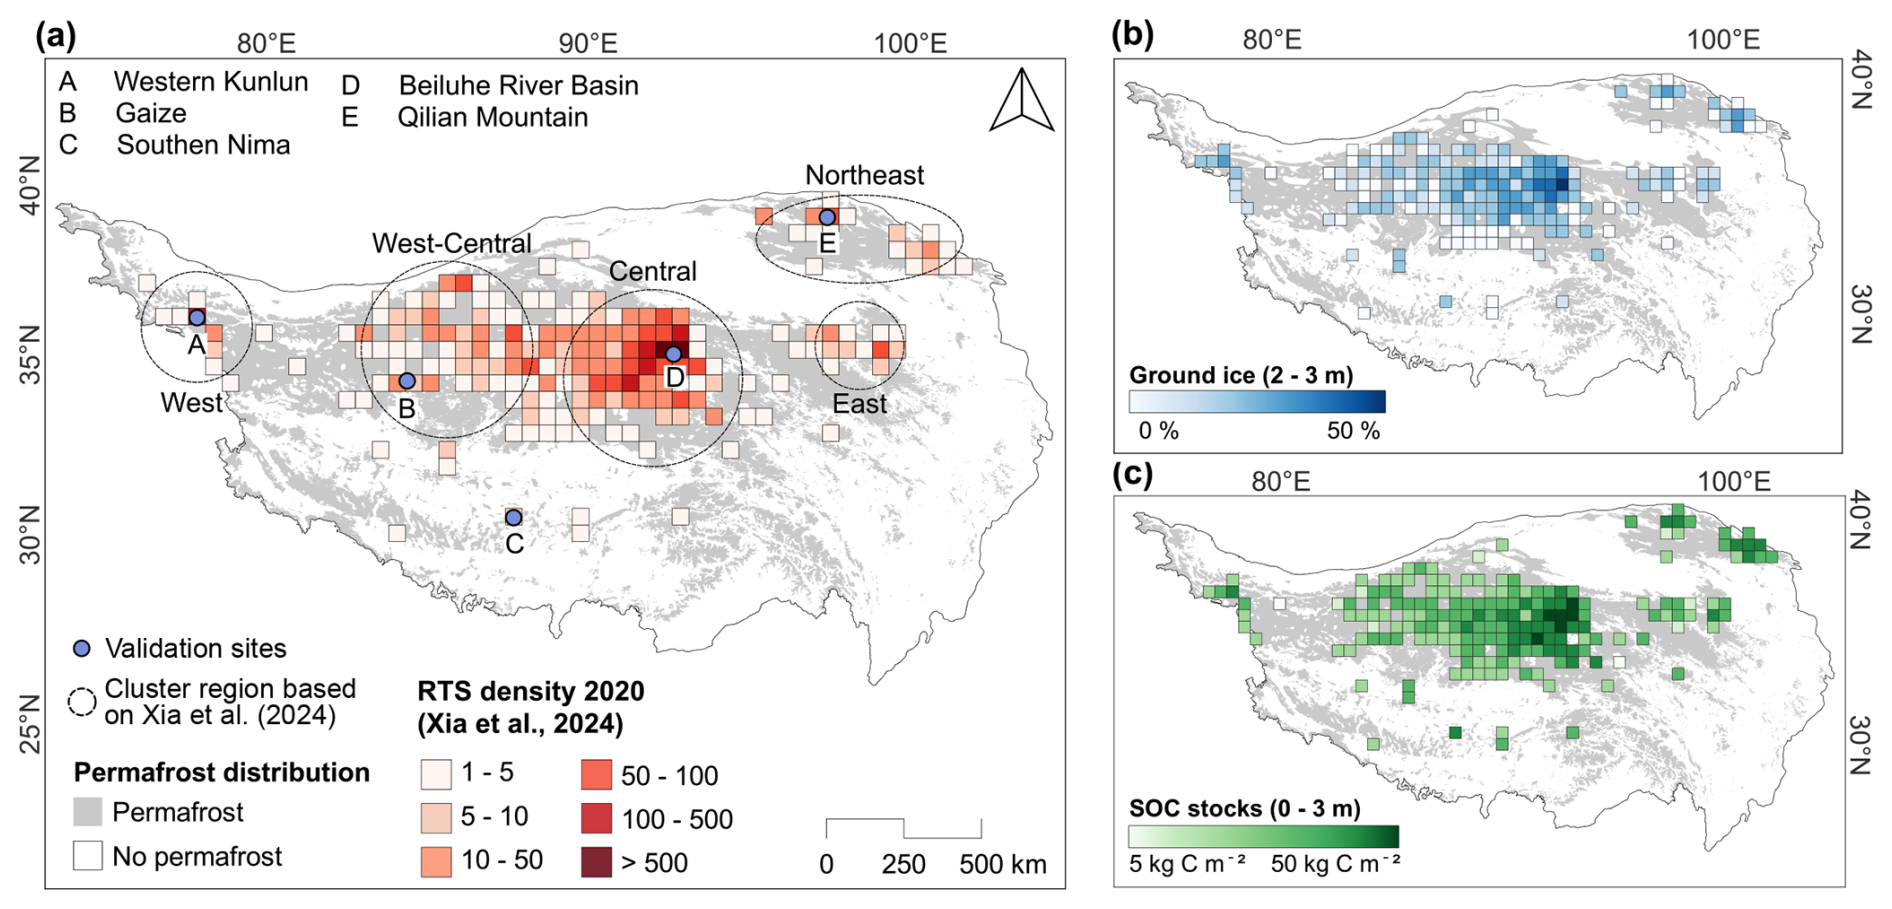
Figure 1Overview of the study region, the Qinghai-Tibet Plateau (QTP). All data is gridded into 50×50 km2 units for visualisation purposes. (a) Distribution and spatial density of RTS (Xia et al., 2024). We divided the QTP into five subregions (West, West-Central, Central, East, Northeast) and distributed validation sites (400 km2) across the QTP. The background depicts the spatial distribution of permafrost terrain on the QTP (Zou et al., 2017). (b) The ground ice content on the QTP for an exemplary depth layer (2–3 m) is highest in the central part of the plateau (Zou et al., 2024). (c) Soil organic carbon (SOC) stocks aggregated for the first 3 m depth show an increasing trend from the northwest to the southeast QTP (Wang et al., 2021).
Based on the spatial clustering of RTS identified by Xia et al. (2024), we divided the study area into five subregions, including: West, West-Central, Central, East, and Northeast (Fig. 1a). These subregions are used to analyse the spatial patterns of material erosion and mobilisation of SOC induced by RTS activity, and area-volume-scaling across the QTP. To validate the estimated volumes of RTS material erosion derived from integrated optical and elevation remote sensing data, we established the following validation sites covering 400 km2 each (Fig. 1a): Western Kunlun, Gaize, Southern Nima, Beiluhe River Basin, and Qilian Mountain. We selected sites based on (1) the presence of RTS activity located within diverse geographic and terrain conditions identified by Xia et al. (2024), (2) the availability of field observations, and (3) the sufficient coverage of TanDEM-X observations to ensure consistent data quality for validation purposes.
2.2 Workflow and data processing
We used bistatic TanDEM-X SAR observations to generate multi-temporal DEMs that cover all RTS locations in the RTS inventory of Xia et al. (2024). By differencing DEMs from 2011 and 2020 and combining the resulting elevation change with the annual high-resolution RTS inventory, we estimated the volume change of the eroded material induced by RTS activity on the QTP (Fig. 2a, b). Based on recent datasets on the permafrost state and soil conditions including ALT, ground ice content (GI) content, and SOC stocks, we modelled the material erosion volumes into annual SOC mobilisation rates for all RTS present on the QTP until 2020 (Fig. 2c). We evaluated the uncertainty in the estimated erosion volume and the derived properties, examining how spatial resolution affects errors in material erosion estimates (Fig. 2d). Similar to temperate landslides, scaling laws between the planimetric area and the erosion volume have been used to improve our understanding of the variability in geomorphology, process dynamics, and the drivers and controls of RTS.
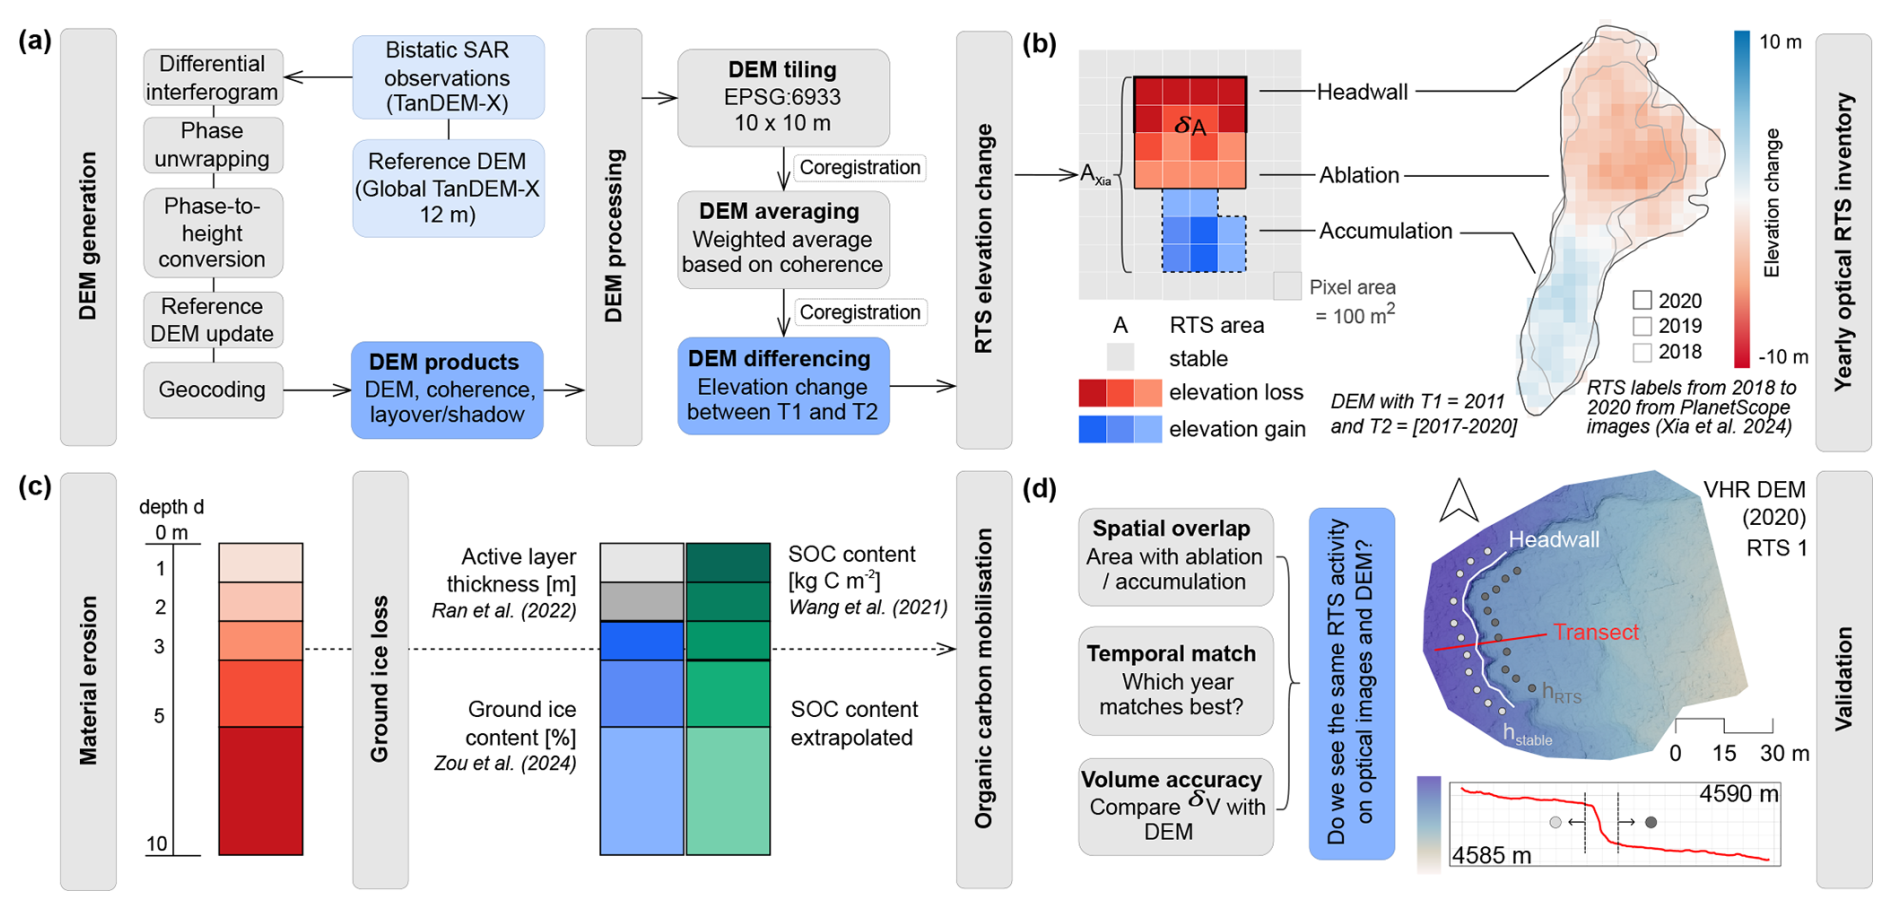
Figure 2Data processing and validation: (a) DEM generation from TanDEM-X SAR observations based on bistatic interferometric SAR (InSAR) processing and post-processing with data tiling, averaging, and differencing including coregistration routines resulting in elevation change maps between time T1 and T2. (b) We extract the elevation change (T2–T1) within the boundaries of the temporally matching optical RTS labels of Xia et al. (2024) divided into negative elevation change (ablation) and positive elevation change (deposition of thawed material) within the RTS delineation. (c) Estimation of the properties of RTS mass wasting including material erosion calculated from negative elevation change within the RTS boundary, ground ice (GI) loss, and SOC mobilisation. (d) Validation at selected sites by (1) evaluating how accurately we can estimate the active erosion area δA and the material erosion volume δV based on the optical RTS delineations and (2) by comparing approximate headwall heights obtained from very-high-resolution (VHR) DEMs of six RTS in the Beiluhe River Basin from photogrammetric drone surveys to our results.
2.2.1 Digital Elevation Model generation and processing
We used satellite observations from the German Synthetic Aperture Radar (SAR) mission TanDEM-X to generate temporally resolved DEMs based on bistatic SAR interferometry (InSAR) (Krieger et al., 2007; Bojarski et al., 2021). We excluded observations with height-of-ambiguity (HoA) values below 15 and above 80 m to guarantee a vertical accuracy between 2 and 3 m in flat areas (Martone et al., 2012; Bernhard et al., 2020). We used TanDEM-X observations throughout the year to achieve full spatial coverage on the QTP, although previous studies in the Arctic have used only winter data to avoid errors caused by dense and wet tundra vegetation during the growing season or melting snow packs (Bernhard et al., 2020, 2022a; Maier et al., 2025). The potential errors introduced by vegetation characteristics and snow cover are likely to be negligible in this study due to the commonly low canopy heights of the local vegetation (alpine meadows, arid desert, bare ground) (Wang et al., 2016; Xia et al., 2024), and shallow average snow depths well below the height sensitivity of the TanDEM-X DEMs (Che et al., 2008; Yang et al., 2020).
Using the global 12 m spatial resolution TanDEM-X DEM as a reference, pairs of bistatic SAR observations were processed with the GAMMA Remote Sensing software (Werner et al., 2000) to generate a series of DEM products following a standard InSAR processing workflow (Fig. 2a). Key steps include the generation of a differential interferogram, phase unwrapping, phase-to-height conversion, update of the reference DEM with the computed height difference, and the orthorectification or geocoding of the resulting DEM to map coordinates. Further information about the DEM generation pipeline can be found in Bernhard et al. (2020) and Maier et al. (2025). SAR shadow and layover areas, as well as the regions in the SAR images that experienced low coherence (<0.3), were not considered in subsequent processing (Bernhard et al., 2020; Maier et al., 2025). We estimated the associated random elevation error σh of each pixel for all generated DEMs using the interferometric coherence, HoA, and the multilook window of 4×4 pixels (Krieger et al., 2007; Rosen et al., 2000; Rodriguez and Martin, 1992). We reprojected all DEM products to a common horizontal coordinate system, WGS 84 / NSIDC EASE-Grid 2.0 Global (EPSG:6933) with an ellipsoidal vertical reference, resampled to 10 m spatial resolution, and split all data into 100 km2-tiles with a small spatial overlap to avoid any edge effects. We corrected the DEMs for vertical offsets and tilts and co-registered the DEM pairs using the Python package xDEM (Hugonnet et al., 2021). Due to the non-uniform temporal coverage of TanDEM-X observations on the QTP, we decided to calculate the elevation change δh between two time periods. We averaged all available DEMs for the time period T1 that spans one summer period (January 2011–April 2012) and for T2 that spans two summer seasons (September 2017–January 2020). In case of the existence of several DEMs in the same location during the same time period, we calculated a weighted average per pixel based on interferometric coherence before computing the elevation difference T2–T1 for each tile with RTS activity. For stable terrain, the resulting elevation change products were normally distributed around zero with a standard deviation representing the achievable vertical accuracy of the DEM pair. δh∼0 m indicates stable terrain, while negative and positive values reflect material ablation and deposition of thawed materials, respectively.
2.2.2 Multimodal RTS mass wasting quantification
Xia et al. (2024) created a high-quality regional inventory of annual RTS delineations between 2016 and 2022 based on a semi-automated deep learning approach with optical high-resolution PlanetScope imagery (Xia et al., 2022) (Fig. 2b). Spectral information in optical images distinguishes undisturbed from disturbed terrain, using differences in bare-ground and vegetation cover. RTS delineations derived from optical imagery often incorporate a broader area than the active ablation zone, including zones of recent activity and depositional sections of the slump floor (i.e., features not directly involved in ongoing material loss), while excluding stable zones of past disturbance masked by lush vegetation growth. Therefore, we calculated the volume of eroded material δV for each RTS by summing only the negative elevation changes δh<0 m multiplied by the area of the DEM pixel (Fig. 2c).
The DEMs of T2 may consist of up to two summer seasons of RTS activity, depending on the availability and spatial distribution of the observations. If the data from T2 consisted of observations from only one year, the optical RTS delineation from the matching year was selected as the RTS delineation for the mass wasting calculation. If observations from several years contributed to the DEM of T2, we assigned the optical RTS delineation that matched the most recent DEM to ensure we captured the full planimetric extent of the RTS. Nevertheless, if multiple observations contributed to the T2 DEM, the multi-year averaged erosion volume may underestimate the actual erosion volume.
Since previous studies on allometric scaling use different methods to fit a straight line to the log-transformed RTS area and volume change, we apply two common models: We use (1) an orthogonal distance regression (ODR) model (Boggs and Rogers, 1989) used by Bernhard et al. (2022a) for several North American and Siberian RTS sites, and (2) an ordinary least squares (OLS) approach applied by, for example, Kokelj et al. (2021), van der Sluijs et al. (2023), and Dai et al. (2025), to predict the eroded volume δV based on the planimetric area δA with an exponential scaling coefficient α and a scaling factor c (Jaboyedoff et al., 2020) for the time interval T1–T2:
In particular, δA stands for the RTS area that undergoes a negative elevation change or ablation within the monitoring period of T1–T2. To test the influence of different definitions of the RTS area between delineations on optical images and the elevation change maps, we also performed area-volume scaling with the entire RTS delineation area AXia, which does not only include zones of ablation δA but often also bare soils disturbed by mud flows and the deposition of thawed material in the slump floor (Fig. 2b).
To estimate how much SOC is stored in the previously frozen permafrost soils mobilised by RTS activity during the study period, ground conditions must be known or modelled (Fig. 2c). Therefore, we integrated existing datasets for the QTP that define (1) ALT (Ran et al., 2022), (2) GI content between 2 and 10 m (Zou et al., 2024), and (3) SOC stocks between 0 and 3 m depth (Wang et al., 2021). All datasets are sampled in 1 km2-cells. Ran et al. (2022) estimated permafrost thermal state variables, including ALT for the pan-Arctic permafrost region and the QTP with 452 field measurements with statistical learning models that achieve a root mean square error (RMSE) <1 m (1). Zou et al. (2024) estimated the GI content up to 10 m depth with a random forest algorithm based on climate, terrain and soil variables and 664 borehole records with R2>0.8 for all depth layers (Fig. 1b, (2)). Wang et al. (2021) applied a set of machine learning algorithms together with environmental variables and soil profile data from 572 field measurements to predict the spatial distribution of SOC in the upper 3 m, including an uncertainty layer on the QTP. The model achieved R2 values between 0.66 for the upper 30 cm and 0.54 for the first metre (Fig. 1c, (3)). Since the SOC stocks dataset is limited to the upper 3 m, we applied an exponential decay model to extrapolate the values to lower depths where we propagated the uncertainty estimates of 2–3 m (Bernhard et al., 2022b). Based on the assumptions that (1) ground ice starts at the depth where the active layer ends and (2) SOC is not present in any form in the massive ground ice, we sampled the negative elevation change within each RTS label to calculate the SOC mobilisation per RTS
with the number of pixels n, the RTS ablation area δA [m], the depth of the active layer ALT (>0 m), ground ice content GI [%] and soil depth d ( m). If the depth d is greater than the ALT, then only the part of the eroded material that is not massive ground ice is added to the total SOC mobilisation. Similarly, we estimate the volume of RTS-induced ground ice loss across the depth layers by scaling the eroded material by . To illustrate, if we sample at an exemplary RTS location an ALT = 1.8 m and GI % we round the ALT to 2 m. For 0–2 m depth, we compute the SOC mobilisation without scaling for ground ice since we assume no presence of massive ice in the active layer. For the depth layer 2–3 m we reduce the SOC mobilisation by 31 %.
We report the total estimates of the volume of eroded material, the mobilisation of SOC, and the loss of ground ice as the sum over all RTS in the study region and throughout the study period. By dividing SOC mobilisation by the number of years between T1 and T2, we estimate a yearly SOC mobilisation rate. However, the values might be partially biased since we cannot distinguish between RTS that have been active for the entire study period and those that may have only been active for a shorter period of time (Bernhard et al., 2022b). We normalise our results by the size of the study area and the number of RTS to ensure comparability to the results of previous studies.
2.2.3 RTS material erosion error assessment and validation
Since we aim to integrate two datasets with different spatial resolutions (DEM raster: 10 m, optical RTS inventory vectors: 3 m), we have to account for the ambiguity produced. Negative elevation change pixels might only partially intersect the RTS delineation instead of being entirely contained. We chose to rasterise the optical RTS delineations into two parts: an upper-bound RTS area δA+ that includes all intersected pixels, and a lower-bound area δA− with only fully contained pixels. Together with the estimated elevation error σh of the DEM we compute the upper and lower volume change bounds
and
that indicate the uncertainty induced by differences in spatial resolution, boundary mismatch, and vertical DEM error. Together with the uncertainty estimates of the SOC stocks, we propagate the error bounds to all reported quantities. We assume the RTS area AXia is error-free, despite biases and subjective influences in both automated and manual RTS segmentation, which are difficult to measure (Nitze et al., 2024; Maier et al., 2025).
In addition to reporting data uncertainties, we performed a two-fold validation at five validation sites (Fig. 1a): (1) We manually delineated the RTS ablation area in the elevation change maps, where a distinct pattern of negative elevation change is visible to the human eye. At all validation sites, the elevation change maps consisted of TanDEM-X DEMs from 2011 and 2019. We statistically compared the delineations of the RTS inventory (Xia et al., 2024) from the same year (2019), the year before (2018) and the year after (2020) to the manually delineated ablation zones to investigate the agreement between the datasets in terms of RTS quantities, (ablation) area, and material erosion volume (Fig. 2d). (2) At the Beiluhe River Basin site, we compared the TanDEM-X-derived elevation change with very high-resolution (VHR) photogrammetric DEMs from an in-situ drone campaign covering in total six RTSs in August 2020. A DJI P4 Multispectral was used to obtain the multispectral drone images. The resulting DEMs have a spatial resolution of <1 m and a georeferencing accuracy of 0.2 m RMSE. Since no VHR DEM was available for T1, we could not perform DEM differencing and directly validate our volume change estimates. Based on the hillshade VHR DEMs, we manually delineated the approximate location of the headwall with the help of transect profiles (Fig. 2d). We defined small buffer zones (∼5 m) and randomly distributed points (n=100 per RTS) on both sides of the headwalls that represent the elevation of stable ground hstable and the RTS slump floor hRTS, respectively. We computed the average headwall height hVHR per RTS as the median difference between hstable and hRTS. The monitored RTS were relatively small (<104 m2) and shallow (hVHR<4 m). Defining a headwall position and applying the same methodology with TanDEM-X DEMs is not feasible due to the coarser resolution. Therefore, we chose to compare the estimated headwall heights based on the VHR DEMs with the maximum negative elevation change δhmax that we estimated based on TanDEM-X elevation change maps, assuming that the largest height loss aligns with the largest material ablation and is located close to the headwall.
3.1 RTS mass wasting on the QTP between 2011 and 2020
Out of 3613 RTS delineations of Xia et al. (2024) that we matched with the generated elevation change maps, we excluded 2 % (71 RTS) from further analysis due to low SAR coherence or SAR layover/shadow regions. For these discarded RTS, reliable erosion volume estimates were not possible to achieve due to the low confidence in DEM quality.
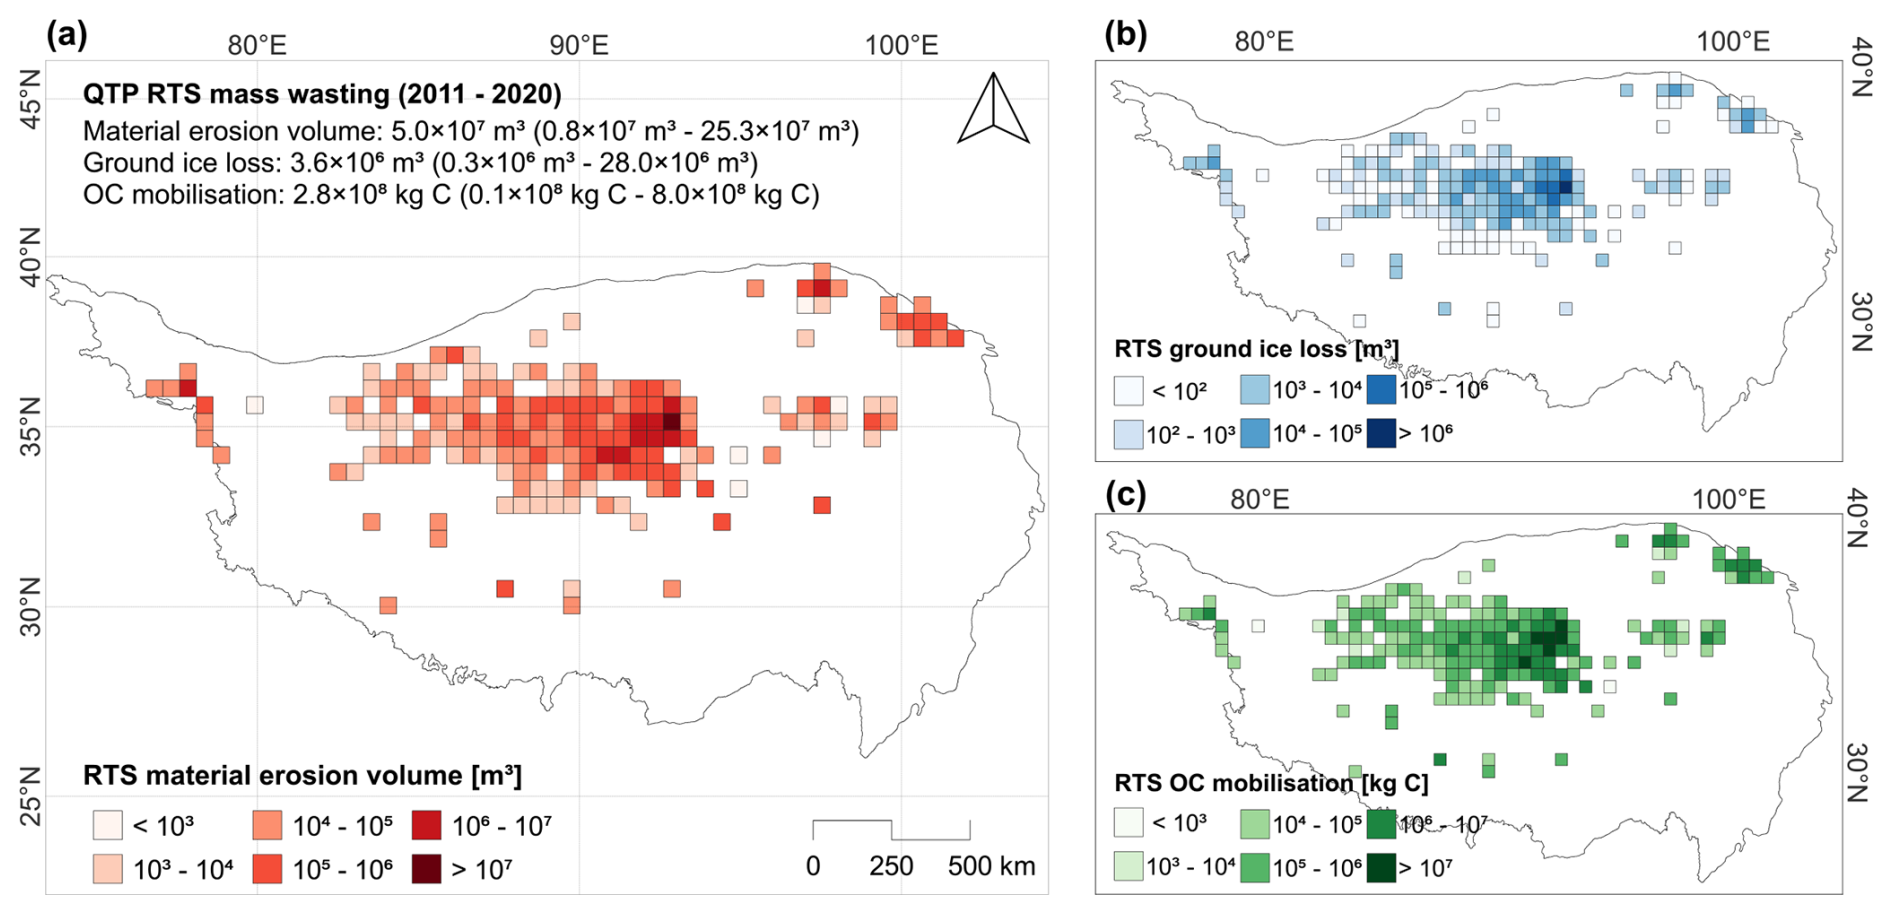
Figure 3Total RTS mass wasting on the QTP between 2011–2020. All data are aggregated in 50×50 km-tiles for visualisation purposes. For all mass wasting quantities including (a) material erosion volume, (b) total GI loss, and (c) total SOC mobilisation, the central QTP shows the highest values.
We estimated a total volume change of eroded material δV of 5.02 m3 induced by RTS activity on the QTP between 2011 and 2020 (Fig. 3a). Approximately half of the volume change originates from 0–1 m, 28 % from 1–2 m, and 13 % from 2–3 m depth. On average, 65 % of the entire delineated areas AXia of the RTS inventory were actively eroding between 2011 and 2020. The median ablation area δA per RTS was 5200 m2 compared to the full delineation AXia (including the accumulation and inactive parts of an RTS) of 8000 m2. We estimated a median volume loss of 6534±2284 m3. When fitting a linear model to the log-transformed area δA and material erosion volume δV based on (1) OLS and (2) ODR, we found power-law relationships for the area-volume scaling of RTS on the QTP (Fig. S1a) of
and
For ODR, we obtain the same scaling coefficient (αODR=1.30, c=0.05, Fig. S3a) when we use the entire area of the RTS delineations AXia instead of solely the ablation area δA yet a lower scaling coefficient for computations based on OLS (αOLS=1.11, c=0.29, Fig. S3a). However, the fit is slightly noisier (R2=0.75 for ODR and R2=0.77 for OLS). An α value between 1.11 and 1.30 indicates that RTS on the QTP followed a relationship between a growing scar zone with constant depth (α=1.0) and growth with a constant width-depth ratio (α=1.5) during the last decade and fall in the range of soil landslides (1.1–1.4) based on the investigated scaling relations of landslides in temperate climate regions (Jaboyedoff et al., 2020; van der Sluijs et al., 2023).
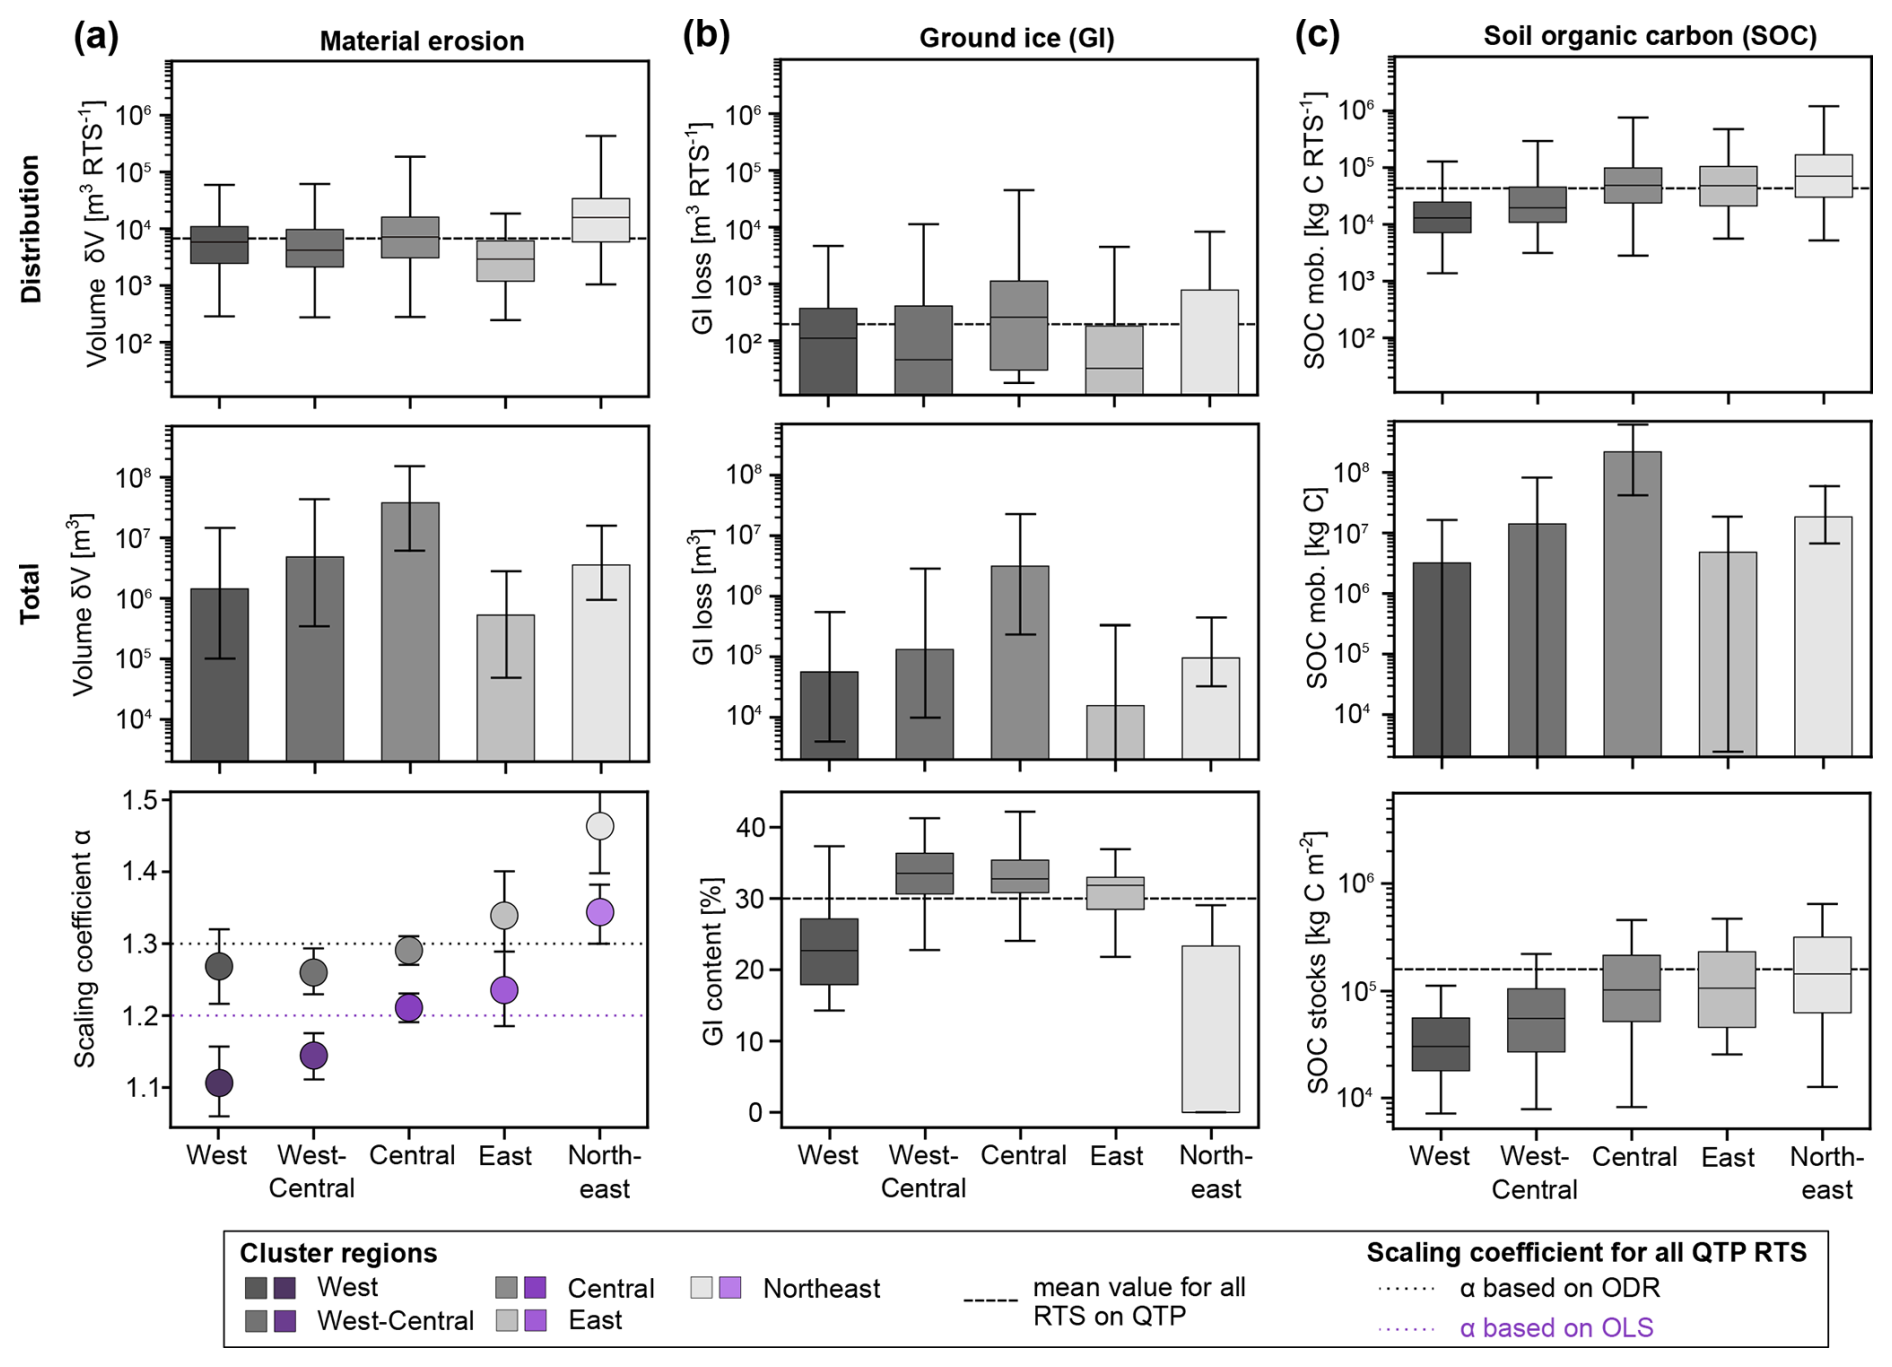
Figure 4RTS mass wasting quantities in the QTP subregions between 2011 and 2020: The first row displays box plots for values associated with individual RTS, the second row bar charts for the total quantities across the subregions, and the third row additional data that vary between the columns. For all plots, the computed uncertainty is reported with error bars. (a) RTS material erosion and area-volume scaling coefficients for the subregions with R2 values between 0.77/0.79 (p<0.001, West) and 0.89/0.90 (p<0.001, Central) computed based on ODR (black dots)/OLS (purple dots). (b) RTS GI loss and the distribution of GI content (Zou et al., 2024). (c) RTS-induced SOC mobilisation and the distribution of SOC stocks 0–3 m (Wang et al., 2021). Number of RTS per subregion: West = 170, West-Central = 523, Central = 2688, East = 76, Northeast = 140.
We estimated that m3 of massive ground ice has been lost on the entire QTP during the last decade (Fig. 3b). Approximately 64 % of the thawed ground ice was located in the first metre under the active layer (2–3 m), 32 % between 3 and 5 m and the remaining 4 % below 5 m depth. Based on the SOC stocks dataset (Wang et al., 2021), we calculated a total SOC mobilisation of kg C (Fig. 3c) and annual SOC mobilisation rates of 0.35×10⁸ kg C a−1. The first metre of soil contributed approximately 76 %, the second 14 %, and the third 8 % to the total SOC mobilisation.
Xia et al. (2024) found 75 % of RTS activity in the central QTP, including the highest area expansion rates. Figure 4 shows a similar pattern of 78 % of material erosion volume, 89 % of ground ice loss and 81 % of SOC mobilisation attributed to the central QTP. We found that even though the central Plateau exhibited the highest absolute amounts due to the highest density of RTS, individual RTS in the northeastern QTP eroded on average more material (Fig. 4a). The scaling coefficients range from αODR=1.27–1.34 (R2=0.77–0.89, p<0.001) and αOLS=1.11–1.23 (R2=0.79–0.90, p<0.001) in the West to East subregions to (R2=0.87, p<0.001) and (R2=0.87, p<0.001) in the northeast QTP. Based on Zou et al. (2024), the GI content is highest in the central subregions (median of 32.8 % in central and 32.6 % in the west-central QTP), where we also found the highest total and average ground ice loss (Fig. 4b). The lowest GI content was present in the northeast (median of 0 %, mean of 10.7 %). The total amount of SOC mobilised from RTS activity for the QTP subregions showed a pattern similar to material erosion and ground ice loss: the central QTP dominated all RTS mass wasting quantities through the largest number of RTS present. The average SOC mobilisation per RTS increased from the west to the northeast QTP (Fig. 4c). Details can be found in the Supplement (Table S1a, b and Fig. S2).
3.2 Assessment of InSAR DEM- and optical-based monitoring of RTS mass wasting on the QTP
For the validation sites, we compared the delineations (2018–2020) of the RTS inventory (Xia et al., 2024) to the ablation zones we manually identified on the elevation change maps based on TanDEM-X DEMs (2011–2019). Out of a total of 445 RTS in the RTS inventory, we identified 290 in the lower-resolution elevation change maps, which accounts for an F1 score of 0.63. 17 RTS were missed in the RTS inventory, while 155 RTS present in the RTS inventory were not distinguishable from background noise in the elevation change maps. Most of the validation sites showed a good agreement between the two datasets. However, in Western Kunlun (A in Fig. 1a) only 55 % of the RTS in the RTS inventory were detectable in the elevation change maps. More details on individual results at the test sites can be found in Table S2a and b.
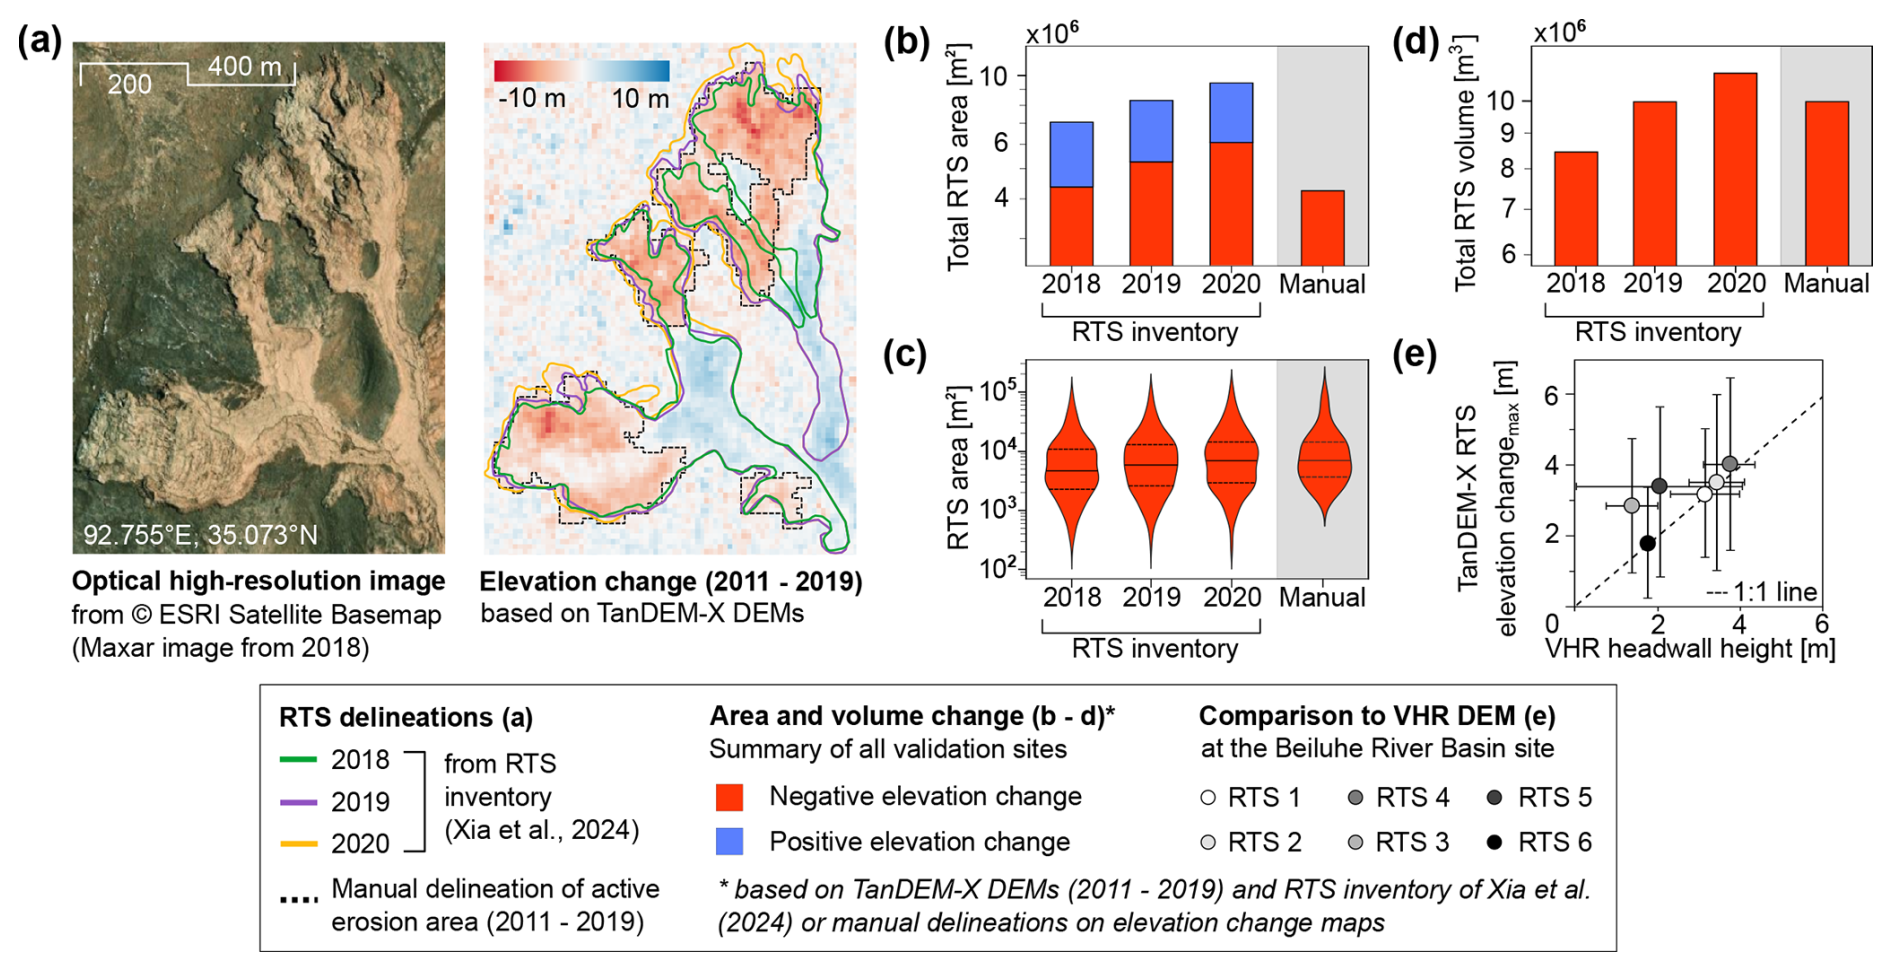
Figure 5Compatibility and accuracy assessment aggregated for all validation sites: (a) RTS at the Beiluhe River Basin site in an high-resolution optical image from 2018 (ESRI Satellite Basemap) and on a TanDEM-X elevation change map (2011–2019) with delineations (2018–2020) from the RTS inventory (Xia et al., 2024) (solid lines). The manually delineated ablation area (= negative elevation change) is visualised by a dashed line. The RTS has grown over the course of the three years and its headwall extended upslope. The delineations from the RTS inventory based on optical images and disturbances of the vegetation cover include not only ablation zones but also material accumulation further downslope (= positive elevation change). (b) Sum of ablation and accumulation area based on the elevation loss/gain pixels for the delineations of the RTS inventory. Delineations of the RTS inventory tend to cover a larger area than actual ablation area distinguishable on the DEM. (c) Distribution of the RTS ablation area. Due to the higher resolution of the optical images compared to the TanDEM-X DEMs, smaller RTS can be distinguished from the image background. Only small differences can be observed between the years. (d) Sum of material erosion volume based on the delineations of the RTS inventory and the negative elevation change. The volume computed from the 2019 delineation was closest to the actual erosion volume while 2018 under- and 2020 overestimates the actual erosion volume. (e) For six RTS at the Beiluhe River Basin site (D in Fig. 1a), we compared the maximum elevation loss δhmax of the TanDEM-X elevation change within the 2020 delineation of the RTS inventory to the average headwall height derived from drone-based single-time-step VHR DEMs (summer 2020). We assume that the maximum elevation loss can be used as an approximation of the headwall height of an RTS.
Visually, the delineations from the RTS inventory fit well with the spatial patterns of the TanDEM-X elevation change map, with most of the ablation zone being covered. Due to the lower spatial resolution of the DEM, the differences between the delineations from the RTS inventory of 2018, 2019, and 2020 are rather small in this example (Fig. 5b). The total RTS area AXia consists of the material erosion zone (= negative elevation change) which was growing between 2018 and 2020, and the material accumulation zone (= positive elevation change) which stayed relatively constant across time. For all analysed years, the total RTS area was distinctly larger than the sum of the manually delineated erosion areas. When only considering the ablation zone within the RTS delineation, the difference was smaller (Fig. 5b). The actual average RTS ablation area based on the manual delineation was 1.29×10⁴ m2, which is relatively close to the RTS inventory: 0.98×10⁴ m2 in 2018, 1.13×10⁴ m2 in 2019, and 1.35×10⁴ m2 in 2020, accounting for 62 % to 64 % of the total RTS area AXia. However, in the high-resolution PlanetScope images used as the basis for the RTS inventory, considerably smaller RTS could be identified compared to the TanDEM-X DEMs. We found that RTS monitoring using TanDEM-X can only identify RTS with sizes larger than 103 m2 (Fig. 5d). However, in our analysis of the entire QTP, only 6 % of 3613 RTS had ablation areas below this value. The total volume of material erosion computed with the RTS inventory differed only minimally from the volume calculated based on the manual delineations (Fig. 5e). We estimated a total volume δV of 8.47×10⁶ m3, 9.98×10⁶ m3, and 10.97×10⁶ m3 for the RTS inventory delineations of 2018, 2019, and 2020, respectively, compared to an erosion volume of 9.94×10⁶ m3 defined by the manual delineations. The uncertainty of the estimated material erosion volume is larger for the results based on the delineations of the RTS inventory compared to the results based on manually delineated ablation areas (Table S2b).
We used VHR DEMs to further validate our results. Figure 5f shows an adequate fit between the maximum elevation changes δhmax computed with TanDEM-X DEMs and the delineations of the RTS inventory and the average headwall height calculated from the VHR DEMs at six RTS locations. Details can be found in Table S3. However, the small sample size does not allow meaningful statistical analysis and, therefore, only allows for a qualitative comparison.
4.1 RTS activity, material erosion, and area-volume scaling across permafrost regions
Previous research has investigated material erosion volumes (Lantuit and Pollard, 2005; Kokelj et al., 2015; Günther et al., 2015) and allometric scaling relationships for thaw-driven mass wasting primarily in regions <104 km2 in the Arctic (Kokelj et al., 2021; van der Sluijs et al., 2023) and recently on the QTP (Ma et al., 2025). At a larger spatial scale, comparable to our study, Bernhard et al. (2022a) estimated annual material erosion rates for ten sites across Canada, Alaska, and Siberia, covering a total area of 220 000 km2, using DEMs derived from TanDEM-X observations. Similarly, Dai et al. (2025) used ArcticDEM time series to assess volumetrics and area-volume scaling across other Arctic sites. On the QTP, we found RTS material erosion rates of 6.36 m3 a−1, whereas Bernhard et al. (2022a) estimated rates ranging from m3 a−1 in Alaska (Fig. 6, location 5) and the Siberian Arctic (6–8) to 7.16×10⁶ m3 a−1 in the Canadian Arctic (1–4) between 2010 and 2017. With 5.2 RTS per 100 km2 between 2010 and 2020, the QTP has an RTS density approximately half of that observed between 2010 and 2017 on Banks Island (2) (Bernhard et al., 2022a), yet more than double that of all other Arctic sites investigated. Over the past decade, RTS on the QTP displaced 101.8 material, which is roughly 4, 6, and 10 times less than the Canadian hillslope RTS hotspots, the Peel Plateau (4), Ellesmere Island (1), and Banks Island (2), respectively (Lewkowicz and Way, 2019). The remaining sites investigated by Bernhard et al. (2022a) in the Canadian (3) and Siberian (6–8) Arctic are characterised by smaller and shallower RTS located on lake shores in relatively flat terrain and exhibited less than half the volume change rates observed on the QTP (Fig 6b).
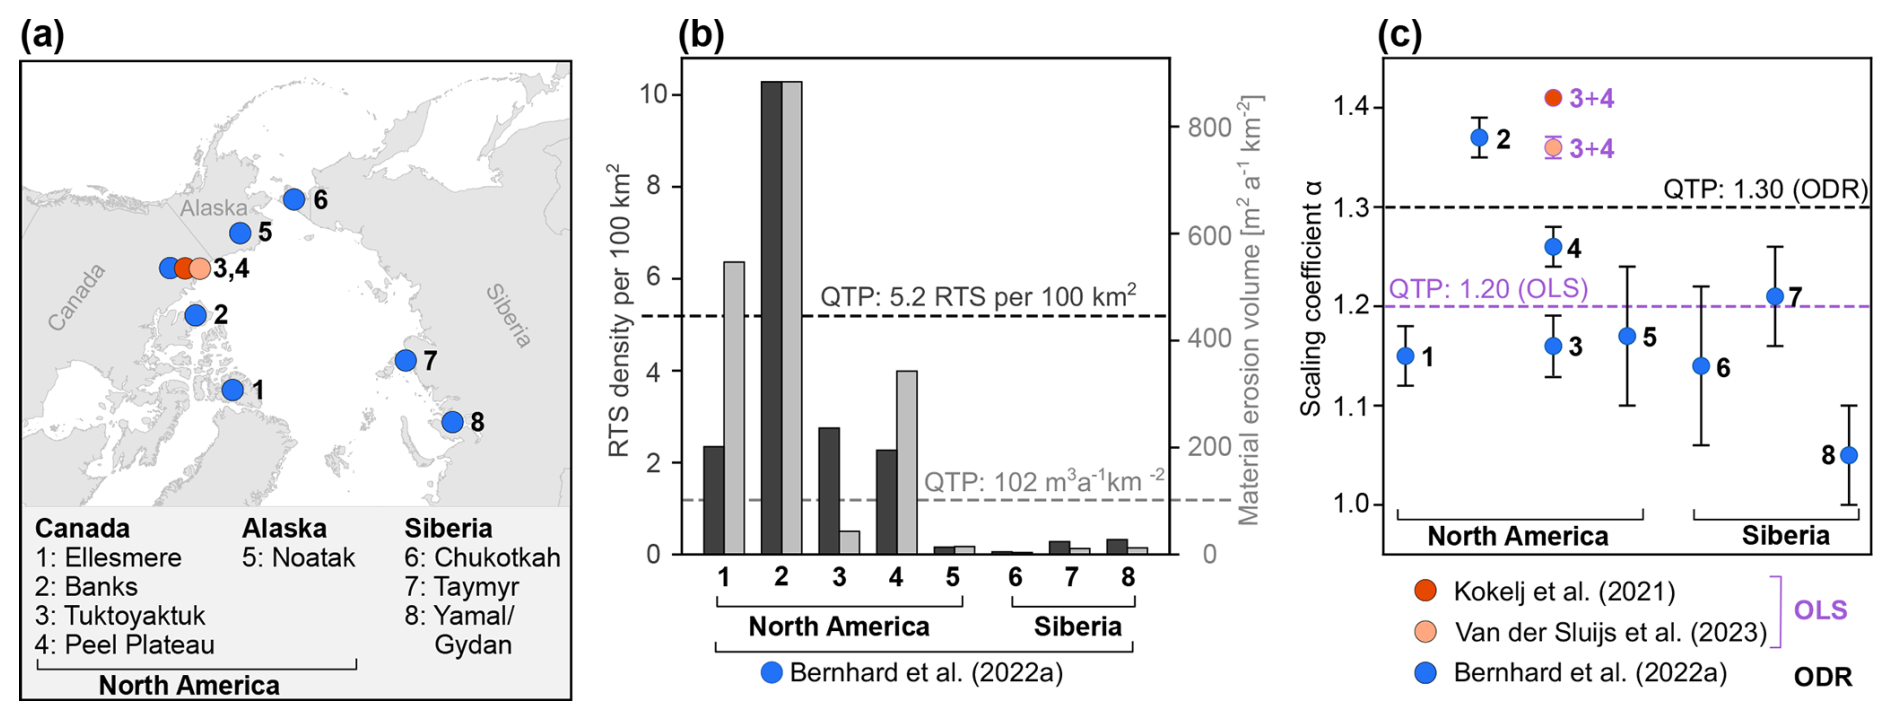
Figure 6Comparison between RTS on the QTP and in Arctic permafrost regions with respect to material erosion and area-volume scaling. (a) Map of the Arctic sites investigated by previous studies: Kokelj et al. (2021) and van der Sluijs et al. (2023) estimated erosion volume and area-volume scaling (OLS) based on high-resolution airborne DEMs and pre-disturbance reconstruction in northwestern Canada. Bernhard et al. (2022a) studied RTS area-volume relations based on TanDEM-X DEMs (ODR) at eight sites in North America and Siberia between 2010 and 2016. (b) RTS density and material erosion volume per unit area for all sites reported in Bernhard et al. (2022a). RTS density and erosion volume are consistently higher on the QTP compared to Siberia and in a similar magnitude as the North American sites. (c) The area-volume scaling coefficients (ODR) reported by Bernhard et al. (2022a) are on a similar magnitude as αODR of the QTP. The Siberian sites have generally lower α-values while Banks Island (2) and Peel Plateau (4) are closest to the QTP's αODR. Both Canadian sites (2, 4) are dominated by hillslope RTS compared to a prevalence of lakeshore RTS in Siberia (6–8). The coefficients based on OLS reported by Kokelj et al. (2021) and van der Sluijs et al. (2023) are distinctly higher than αOLS on the QTP.
Area-volume or allometric scaling relationships describe volumetric enlargement characteristics of RTS and their potential drivers such as that higher α coefficients indicate larger headwalls and concavity depth per unit area growth (van der Sluijs et al., 2023). Several studies investigated the power-law relationship between RTS area and volume using different methodologies and datasets, complicating direct transferability between results. Similar to our approach, Bernhard et al. (2022a) and Dai et al. (2025) calculated elevation change over a time period T1–T2, whereas Kokelj et al. (2021) and van der Sluijs et al. (2023) derived erosion volumes by subtracting a simulated pre-disturbance DEM (T1) from the high-resolution DEM of the disturbed state (T2) using masking and re-interpolation techniques. Ma et al. (2025) followed a similar approach yet used 30 m-resolution mosaic DEMs as the pre-disturbance state (T1). The studies also used different model fitting approaches: OLS (Kokelj et al., 2021; van der Sluijs et al., 2023; Dai et al., 2025) and ODR (Bernhard et al., 2022a). Ma et al. (2025) did not explicitly report the model choice. We therefore assume that the authors used the more common OLS. Bernhard et al. (2022a) estimated an overall Arctic (nRTS=1854) while Dai et al. (2025) found with (nRTS=2747) a noticeably higher coefficient. Kokelj et al. (2021) and van der Sluijs et al. (2023) estimated αOLS-values of 1.41 (nRTS=71) and 1.36±0.01 (nRTS=1522) in the low Canadian Arctic, respectively (Fig. 6c, 3 + 4). Bernhard et al. (2022a) calculated the power-law scaling separately and found (nRTS=438) for the Peel Plateau (3) and (nRTS=212) for the Tuktoyaktuk Coastlands (4). This range of scaling coefficients for similar regions as well as our results for QTP (Fig. 4a and Fig. S1) highlights the challenge in comparing scaling studies based on different methodologies and datasets. Moreover, minor differences in the scaling coefficient have strong impacts on the scaling: A difference of, for example, 0.1 in α leads to a doubling of the volume estimation (van der Sluijs et al., 2023).
On the QTP, more than half of the RTS in the inventory of Xia et al. (2024) initiated in 2016 (Fig. S2a) while Luo et al. (2022) found that >80 % of the RTS in the central QTP formed during extremely warm summers in 2010 and 2016. This indicates that our scaling results are based on planimetric areas and volumes representing rather the entire RTS landform and its lifecycle, similar to the methodology used by Kokelj et al. (2021), van der Sluijs et al. (2023) and Ma et al. (2025). Compared to Arctic permafrost regions, our results (, , nRTS=3043) are higher than the scaling coefficients reported by Bernhard et al. (2022a) yet lower than the estimates of Dai et al. (2025), van der Sluijs et al. (2023), and Kokelj et al. (2021). When comparing material erosion and area-volume scaling in the QTP subregions, we see almost as pronounced differences as between the QTP and the Arctic (Fig. 4a). The central QTP dominates the number of RTS and the associated total material erosion (Xia et al., 2024). However, the northeast QTP has a substantially higher scaling coefficient, indicating larger headwalls and hence, potentially more efficient material mobilisation at an individual RTS level. The mountainous northeastern plateau potentially favours the development of relatively larger and deeper RTS (see van der Sluijs et al., 2023, for coefficient interpretation, Figs. S1f and S3f). However, the driving factors underlying the observed differences across permafrost (sub-)regions are likely multifaceted, including variations in RTS longevity and lifecycle stage, GI content, vegetation and soil properties, and proximity to water bodies. Detailed investigations into these factors remain the subject of prospective research. RTS on the QTP are reported to be generally smaller and more shallow than at Arctic hotspots (Liu et al., 2024). It is therefore possible that the coarse resolution of the TanDEM-X DEM might not correctly capture the area and volume change for these small areas, skewing the scaling models. However, using high-resolution stereo-optical DEMs, Ma et al. (2025) found a scaling coefficient similar to our αOLS of 1.20±0.01 (nRTS=1429). Area-volume scaling also depends on how the actively eroding RTS scar zone is delineated. While there are commonly accepted definitions of RTS geomorphology (CPA et al., 2024; Harris, 1988), different data sources show different aspects of RTS activity, and even experts working on similar data can differ strongly in their delineations based on their own ontological understandings of what constitutes RTS (Nesterova et al., 2024; Nitze et al., 2024; Maier et al., 2025). More research is needed in this regard, and our novel dataset offers a critical resource for future investigations into the mechanisms driving RTS material erosion on the QTP. Our results are consistent with other studies showing a notable increase in RTS (mass wasting) activity across the QTP, particularly over the past decade (Ma et al., 2025; Xia et al., 2022; Luo et al., 2022) with RTS sizes being generally smaller and headwall retreat rates lower than those found in other Arctic regions (Yi et al., 2025; Luo et al., 2022; Lewkowicz and Way, 2019; Runge et al., 2022; Nesterova et al., 2024; Huang et al., 2021). The magnitude of newly formed RTS potentially offsets the relatively low concavity depths, so that the total mass-wasting activity and material erosion volume during the last decade show a magnitude comparable to the thermokarst landscapes in the high Arctic.
4.2 Magnitude of RTS SOC mobilisation and ground ice loss
Jiao et al. (2022) investigated one large RTS in the Beiluhe River Basin between 2021 and 2022 and found 1.9 m a−1 vertical deformation at the headwall and a total volume change of 1.41×10³ m3 a−1. The active layer at the RTS location was 1.95 m with a ground ice layer between 2.2 and 3.5 m depth and an ice content of 68 % to 88 % at depths of 2.2 to 4 m obtained at a borehole near the RTS. Compared to our results in the central QTP (Fig. 4, Table S1a), the investigated RTS has a typical headwall height and material erosion volume ( m, δhmax=2.35 m, m3 a−1). The measured GI content near the RTS is substantially higher than the average GI content we used in our estimations ( %). The GI content is strongly related to the landscape's geomorphology. The majority of GI on the QTP is found on gentle shaded slopes at elevations between 4400 and 5100 m (Fan et al., 2023) typical for central subregions and most RTS locations (Table S1, Fig. S2b–d). However, some studies also found GI content higher than 80 % in the northeast QTP (Wang et al., 2018; Fan et al., 2023) and a mean GI content of ∼ 16 % in the Beiluhe River Basin (Lin et al., 2020). RTS only form in locations where massive ground ice is present in depths that can be exposed by, for example, active layer detachments (Nesterova et al., 2024). We might underestimate local ground ice conditions since large-scale datasets that estimate soil properties in permafrost regions are based on limited observations and coarse spatial resolution that typically do not well represent fine-scale soil conditions (Hugelius et al., 2014; Mishra et al., 2021; Wang et al., 2021; Zou et al., 2024). With increased soil depth, estimates of soil properties become even more scarce (Chen et al., 2024b; Ding et al., 2019). Since we observed negative elevation changes of more than 3 m in RTS on the QTP, we used a simple exponential model to extrapolate SOC stocks to deeper soil layers. Probably, this model is too simple and does not capture the spatial variability of soil conditions in the complex permafrost landscape (Bernhard et al., 2022b). However, only 2 % of the total estimated mobilised SOC came from soils below 3 m depth.
The processes and fate of the mobilised SOC remain highly uncertain as multiple complex ecosystem interactions and hydrothermal processes are involved (Yi et al., 2025). Parts of mobilised SOC remain potentially on the slump floor and are available for microbial decomposition and release as greenhouse gases (Wang et al., 2024). Other parts, together with the thawed material, are deposited and stabilised at the slump floor (Thomas et al., 2023; Liu et al., 2021, 2018; Mu et al., 2017) or laterally transported downslope into adjacent river and lake systems undergoing complex water chemistry processes such as dissolution or sedimentation (Lewkowicz and Way, 2019). We only quantified the magnitude of SOC mobilised by RTS activity and its spatial pattern which closely follows the spatial trend of existing SOC stocks on the QTP (Wang et al., 2021). Exploring the complex pathways of mobilised SOC is beyond the scope of this study. However, based on the results of our study, we recommend further research into the fate of the mobilised SOC. Figure 5b clearly shows areas of material ablation, but also regions of material deposition on the slump floor are visible. In future investigations, insights could potentially be generated into how much relocated material and SOC are deposited within an RTS and how much is transported laterally into hydrological networks. In addition, the balance between areas of negative and positive elevation change might be another avenue to improve spatially explicit GI information for the QTP.
To our knowledge, no study has quantified the SOC mobilisation based on empirical RTS erosion material volumetrics for the entire QTP. Ma et al. (2025) modelled a total annual SOC loss of 4.12×10⁷ kg C a−1 (95 % CI: 3.06×10⁷ kg C a−1–5.12×10⁷ kg C a−1) from RTS mass wasting between 1989 and 2022 based on optical RTS inventories and allometric scaling relations, which is of a similar magnitude as our results ( kg C a−1). Bernhard et al. (2022b), similar to this study, processed multi-temporal stacks of TanDEM-X-derived DEMs for the time periods 2010–2016 (nRTS=76) and 2017–2020 (nRTS=1404) to investigate the impact of a summer heat wave on RTS mass wasting and SOC mobilisation on the Taymyr Peninsula in Siberia. Individual RTS on the Taymyr Peninsula mobilised on average a similar amount of material, yet 14 times more SOC compared to the RTS on the QTP prior to the heatwave. The heatwave triggered a surge in RTS activity, including a 17-fold increase in new initiations, a 2.3-fold increase in the average volume change rate, and a 28-fold increase in SOC mobilisation, resulting in quantities far exceeding those observed on the QTP.
Due to the increase in greening and wetting of the QTP, recent studies estimate that the QTP is a large carbon sink of 344×108 kg C a−1 (or 34.4 Tg C a−1) (Chen et al., 2024a; Wang et al., 2023). However, several studies that conducted soil sampling within disturbed permafrost areas for several consecutive years found that up to one-third of the surface SOC content (< 40 cm) has the potential to be lost due to rapid permafrost thaw (Mu et al., 2017; Liu et al., 2018; Wu et al., 2018). Furthermore, vegetation restoration appears to be slow on the QTP, and exposed areas disturbed by thermokarst can remain bare for decades (Liu et al., 2018; Mu et al., 2017; Li et al., 2025). Even though our results indicate that RTS-induced SOC mobilisation only accounted for ∼0.1 % of the total QTP carbon budget during the last decade and is proportionately insignificant to many Arctic regions, the sharply rising number of RTS on the QTP and the majority of SOC mobilisation in the uppermost, carbon-rich layers of soil could become more relevant for regional carbon budgets in a warming future climate.
4.3 Limitations and Potential of a Multimodal Data Approach for RTS Mass Wasting Monitoring
Compared to the Arctic where the ArcticDEM strip data (Porter et al., 2018) offers an open source and high-resolution multitemporal DEM source based on stereo-optical satellite images (∼ 3 m) that is suitable for RTS monitoring (Dai et al., 2024, 2025; Nitze et al., 2021; Yang et al., 2023), on the QTP no similar high-resolution temporally resolved DEM exists - except for the data from the TanDEM-X mission. Bistatic TanDEM-X observations uniquely enable DEM generation on a global scale. Even in regions with adverse geographic or climatic conditions for satellite remote sensing, for example, a high percentage of cloud cover or long periods of snow cover, bistatic radar observations can be used to produce high-quality DEMs with acceptable spatial resolution for RTS monitoring (Krieger et al., 2007; Bojarski et al., 2021; Bernhard et al., 2022a; Maier et al., 2025). However, the temporal resolution of the TanDEM-X observations is not equal for all regions of the world. We can assume that RTS activity only occurs in the warm summer months and a phase of stability occurs between October and April due to low temperatures (Chen et al., 2015; Che et al., 2008; Ma et al., 2023). Due to limited data availability on the QTP, we had to aggregate observations from several years and seasons to ensure sufficient coverage. For T1, we used observations between mid-winter 2011 and end of winter 2012 accounting for exactly one summer of RTS activity, while for T2 we had to accept a larger time span (end of summer 2017 to mid-winter 2020) accumulating the RTS activity of two summer seasons, which potentially increased imprecision in the mass wasting estimates. Xia et al. (2024) found that the highest RTS activity occurred before 2020. Between 2020 and 2022, only 59 new RTS were detected in the PlanetScope images. This could indicate that we captured most of the RTS activity that has occurred on the QTP during the last decade. For volume estimation based on delineations of the RTS inventory, stable areas containing no elevation change but background noise are likely included, since most delineations based on optical images are broader than the actual active erosion area. Although this minimally affects the total volume change due to the low magnitude in negative elevation change, it adds additional random errors, thus contributing to the overall uncertainty budget.
To monitor the dynamic lifecycles of these complex thermokarst features and understand their drivers and future development, yearly records of RTS-induced material erosion volumes are highly desirable (Nesterova et al., 2024; Kokelj et al., 2021). The general scarcity of suitable DEMs, as well as the temporal limitations, makes monitoring of RTS material erosion and impact on carbon cycles solely based on DEM data challenging. Allometric or area-volume scaling relations, as presented and discussed in this study, are typically used to investigate landscape evolution or RTS activity change over time, but can also be used to enable the investigation of not only planimetric area expansion from optical RTS inventories but also transform the area change into volume change of eroded material and expand the analysis to yearly or even seasonal temporal scales. We derived a statistically robust area-volume scaling relation for the entire QTP region, similar to regions elsewhere (Bernhard et al., 2022a; van der Sluijs et al., 2023; Dai et al., 2025). However, a small difference in the scaling coefficient α has a large impact on the resulting volume change δV. We see substantial differences in the scaling relations between the different QTP subregions (Figs. S1 and S3). When comparing our scaling results with the small number of existing studies on allometric scaling of RTS in the Arctic, we saw distinct differences between our results and studies investigating similar regions in the Arctic (Bernhard et al., 2022a; van der Sluijs et al., 2023; Kokelj et al., 2021) yet clear similarities to the only existing study on the QTP (Ma et al., 2025). Applying area-volume scaling especially to multimodal RTS datasets should be done carefully to obtain regional estimates on material erosion volume and mass wasting derivatives such as ground ice loss or SOC mobilisation. For subregional scale or even feature level, this approach has its clear limitations due to the heterogeneity of RTS across at both local and broad scales. However, large-scale and even pan-Arctic RTS inventories based on optical satellite images become more available and may allow for a similar approach of finding scaling relations for Arctic thermokarst regions if delineations coincide well ontologically, spatially and temporally with measured elevation change (Yang et al., 2025; Nitze et al., 2025). Here, we present a scaling relationship for the QTP based on commonly applied OLS regression
that may readily transform planimetric RTS area derived from vegetation disturbance on optical remote sensing images into volume estimates at scale. We showed that RTS monitoring on elevation change maps based on DEMs with 10 m resolution omits approximately 35 % of the present features compared to monitoring RTS with 3 m multispectral images. However, the difference in estimated material erosion volume from the two datasets is <1 % since most of the missed RTS are small and shallow (Fig. 5c). Open-source and multi-temporal images, such as from ESA's Sentinel-2 satellites, with a similar spatial resolution as TanDEM-X DEMs could have great potential to continuously monitor RTS activity to answer questions about volumetrics, permafrost thaw impacts on hydrological systems, and carbon cycles based on reliable area-volume scaling laws.
RTS landforms are typically complex and highly dynamic, often remaining active for several years before stabilising and, in some cases, reinitiating. To adequately capture their temporal evolution and interactions with changing climate, high-temporal-resolution remote sensing data are essential. By combining modelled soil property datasets with multimodal remote sensing data, we estimated that RTS activity relocated 5.02 m3 formerly frozen material, contributed to a loss of 3.58 m3 ground ice and mobilised 2.78 kg C SOC on the QTP between 2011 and 2020. Interregional comparisons of RTS dynamics are challenging due to varying spatial, temporal, and methodological factors. However, RTS on the QTP exhibit mass-wasting dynamics comparable to Arctic RTS hotspots. Despite their comparably recent initiation and smaller size, erosion and SOC mobilisation on the QTP in the past decade surpassed some regions in the Siberian Arctic but remained up to 10 times lower than well-known thermokarst regions in the high Canadian Arctic. Although RTS-induced carbon mobilisation only accounts for approximately 0.1 % of the QTP's carbon budget, the acceleration of RTS activity since the beginning of the last decade can contribute to the anticipated region's shift from a carbon sink to a source. By integrating remote sensing data with varying spatial and temporal resolutions and different information layers, we demonstrated that erosion volumes can be accurately estimated, even when the delineations of the RTS erosion-affected area vary. We found a reliable power-law scaling based on commonly applied OLS regression between the computed material erosion volume change and the (ablation) area in the optical RTS inventory (, Fig. S1a, and , Fig. S3a) that enables future research to transform the planimetric area of RTS delineations into regional estimates of erosion volume and constrain RTS-induced SOC mobilisation on the QTP. Improved estimates and allometric relationships will help close the knowledge gap in understanding the impact of permafrost thaw on the permafrost carbon cycle for the QTP and globally.
The dataset containing all RTS boundaries of Xia et al. (2024) including the computed active erosion areas, material erosion volumes, ground ice loss, and SOC mobilisation can be found under https://doi.org/10.3929/ethz-b-000735734 (Maier, 2025a). The code and example data for the RTS mass-wasting calculations based on the optical RTS inventory can be found under https://doi.org/10.5281/zenodo.17375814 (Maier, 2025b). TanDEM-X CoSSC data can be requested from the German Aerospace Centre (DLR).
The supplement related to this article is available online at https://doi.org/10.5194/tc-19-4855-2025-supplement.
KM, LL, and ZX designed the study. ZX provided the optical RTS labels and produced the photogrammetric validation DEM. KM, PB, and IH developed the methodology. KM prepared the datasets and performed the analysis. IH secured the funding for the study. All co-authors contributed with their specific expertise to data interpretation as well as manuscript writing.
The contact author has declared that none of the authors has any competing interests.
Publisher's note: Copernicus Publications remains neutral with regard to jurisdictional claims made in the text, published maps, institutional affiliations, or any other geographical representation in this paper. While Copernicus Publications makes every effort to include appropriate place names, the final responsibility lies with the authors. Views expressed in the text are those of the authors and do not necessarily reflect the views of the publisher.
The authors thank Thomas Busche, Markus Bachmann, and the Order Desk Team at the German Aerospace Centre (DLR) for their help in downloading the large number of TanDEM-X observations in an efficient and timely manner, Xiaofan Zhu for reviewing an early version of this work, and Chengyan Fan (Lanzhou University) for his support in collecting the VHR drone imagery. The authors also thank the editor, Christian Hauck, and the two anonymous reviewers for their constructive feedback and their contribution to the improved quality of this work.
This research has been supported by the Chinese University of Hong Kong (grant nos. 4053644 and 4053707), the Research Grants Council, University Grants Committee (grant nos. N_CUHK434/21 and CUHK14303119), and the National Aeronautics and Space Administration (grant no. 80NSSC22K1254). Geospatial support for this work was provided by the Polar Geospatial Center (NSF-OPP awards 1043681, 1559691, and 2129685).
This paper was edited by Christian Hauck and reviewed by two anonymous referees.
Bernhard, P., Zwieback, S., Leinss, S., and Hajnsek, I.: Mapping Retrogressive Thaw Slumps Using Single-Pass TanDEM-X Observations, IEEE J. Sel. Top. Appl. Earth Observations Remote Sensing, 13, 3263–3280, https://doi.org/10.1109/JSTARS.2020.3000648, 2020. a, b, c, d, e
Bernhard, P., Zwieback, S., Bergner, N., and Hajnsek, I.: Assessing volumetric change distributions and scaling relations of retrogressive thaw slumps across the Arctic, The Cryosphere, 16, 1–15, https://doi.org/10.5194/tc-16-1-2022, 2022a. a, b, c, d, e, f, g, h, i, j, k, l, m, n, o, p, q, r, s
Bernhard, P., Zwieback, S., and Hajnsek, I.: Accelerated mobilization of organic carbon from retrogressive thaw slumps on the northern Taymyr Peninsula, The Cryosphere, 16, 2819–2835, https://doi.org/10.5194/tc-16-2819-2022, 2022b. a, b, c, d, e, f, g
Biskaborn, B. K., Smith, S. L., Noetzli, J., Matthes, H., Vieira, G., Streletskiy, D. A., Schoeneich, P., Romanovsky, V. E., Lewkowicz, A. G., Abramov, A., Allard, M., Boike, J., Cable, W. L., Christiansen, H. H., Delaloye, R., Diekmann, B., Drozdov, D., Etzelmüller, B., Grosse, G., Guglielmin, M., Ingeman-Nielsen, T., Isaksen, K., Ishikawa, M., Johansson, M., Johannsson, H., Joo, A., Kaverin, D., Kholodov, A., Konstantinov, P., Kröger, T., Lambiel, C., Lanckman, J.-P., Luo, D., Malkova, G., Meiklejohn, I., Moskalenko, N., Oliva, M., Phillips, M., Ramos, M., Sannel, A. B. K., Sergeev, D., Seybold, C., Skryabin, P., Vasiliev, A., Wu, Q., Yoshikawa, K., Zheleznyak, M., and Lantuit, H.: Permafrost is warming at a global scale, Nat. Commun., 10, 264, https://doi.org/10.1038/s41467-018-08240-4, 2019. a
Boggs, P. T. and Rogers, J. E.: Orthogonal Distance Regression, Applied and Computational Mathematics Division. U.S. Department of Commerce. National Institute of Standards and Technology, NISTIR 89–4197, 1989. a, b
Bojarski, A., Bachmann, M., Boer, J., Kraus, T., Wecklich, C., Steinbrecher, U., Tous-Ramon, N., Schmidt, K., Klenk, P., Grigorov, C., Schwerdt, M., and Zink, M.: TanDEM-X Long-Term System Performance After 10 Years of Operation, IEEE J. Sel. Top. Appl. Earth Observations Remote Sensing, 14, 2522–2534, https://doi.org/10.1109/JSTARS.2021.3055546, 2021. a, b
Burn, C. and Lewkowicz, A.: CANADIAN LANDFORM EXAMPLES – 17 RETROGRESSIVE THAW SLUMPS, Canadian Geographer, 34, 273–276, https://doi.org/10.1111/j.1541-0064.1990.tb01092.x, 1990. a, b
Che, T., Li, X., Jin, R., Armstrong, R., and Zhang, T.: Snow depth derived from passive microwave remote-sensing data in China, Annals of Glaciology, 49, 145–154, https://doi.org/10.3189/172756408787814690, 2008. a, b
Chen, L., Yang, G., Bai, Y., Chang, J., Qin, S., Liu, F., He, M., Song, Y., Zhang, F., Peñuelas, J., Zhu, B., Zhou, G., and Yang, Y.: Permafrost carbon cycle and its dynamics on the Tibetan Plateau, Science China Life Sciences, 67, 1833–1848, https://doi.org/10.1007/s11427-023-2601-1, 2024a. a, b, c, d
Chen, T., Wang, J., Che, T., Hao, X., and Li, H.: High spatial resolution elevation change dataset derived from ICESat-2 crossover points on the Tibetan Plateau, Scientific Data, 11, 394, https://doi.org/10.1038/s41597-024-03214-2, 2024b. a, b
Chen, X., An, S., Inouye, D. W., and Schwartz, M. D.: Temperature and snowfall trigger alpine vegetation green‐up on the world's roof, Global Change Biology, 21, 3635–3646, https://doi.org/10.1111/gcb.12954, 2015. a, b
Cheng, G. and Wu, T.: Responses of permafrost to climate change and their environmental significance, Qinghai‐Tibet Plateau, Journal of Geophysical Research: Earth Surface, 112, 2006JF000631, https://doi.org/10.1029/2006JF000631, 2007. a
CPA, Lewkowicz, A., Wolfe, S., Geological Survey of Canada, Roujanski, V., Tetra Tech Canada, Hoeve, E., HoeveEng Consulting Ltd, O'Neill, B., Geological Survey of Canada, Gruber, S., Carleton University, Roy-Léveillée, P., Université Laval, Brown, N., Carleton University, Koenig, C., BGC Engineering, Brooks, H., BGC Engineering, Rudy, A., Northwest Territories Geological Survey, Bonnaventure, P., University of Lethbridge, Paquette, M., and Stantec: An Illustrated Permafrost Dictionary, Tech. rep., https://doi.org/10.52381/CPA.permafrostdictionary.1, 2024. a, b
Dai, C., Howat, I. M., Van Der Sluijs, J., Liljedahl, A. K., Higman, B., Freymueller, J. T., Ward Jones, M. K., Kokelj, S. V., Boike, J., Walker, B., and Marsh, P.: Applications of ArcticDEM for measuring volcanic dynamics, landslides, retrogressive thaw slumps, snowdrifts, and vegetation heights, Science of Remote Sensing, 9, 100130, https://doi.org/10.1016/j.srs.2024.100130, 2024. a, b
Dai, C., Ward Jones, M. K., Van Der Sluijs, J., Nesterova, N., Howat, I. M., Liljedahl, A. K., Higman, B., Freymueller, J. T., Kokelj, S. V., and Sriram, S.: Volumetric quantifications and dynamics of areas undergoing retrogressive thaw slumping in the Northern Hemisphere, Nature Communications, 16, 6795, https://doi.org/10.1038/s41467-025-62017-0, 2025. a, b, c, d, e, f, g, h, i, j
Ding, J., Wang, T., Piao, S., Smith, P., Zhang, G., Yan, Z., Ren, S., Liu, D., Wang, S., Chen, S., Dai, F., He, J., Li, Y., Liu, Y., Mao, J., Arain, A., Tian, H., Shi, X., Yang, Y., Zeng, N., and Zhao, L.: The paleoclimatic footprint in the soil carbon stock of the Tibetan permafrost region, Nature Communications, 10, 4195, https://doi.org/10.1038/s41467-019-12214-5, 2019. a
Fan, X., Wang, Y., Niu, F., Li, W., Wu, X., Ding, Z., Pang, W., and Lin, Z.: Environmental Characteristics of High Ice-Content Permafrost on the Qinghai–Tibetan Plateau, Remote Sensing, 15, 4496, https://doi.org/10.3390/rs15184496, 2023. a, b
Farquharson, L. M., Romanovsky, V. E., Cable, W. L., Walker, D. A., Kokelj, S. V., and Nicolsky, D.: Climate Change Drives Widespread and Rapid Thermokarst Development in Very Cold Permafrost in the Canadian High Arctic, Geophysical Research Letters, 46, 6681–6689, https://doi.org/10.1029/2019GL082187, 2019. a
Grosse, G., Harden, J., Turetsky, M., McGuire, A. D., Camill, P., Tarnocai, C., Frolking, S., Schuur, E. A. G., Jorgenson, T., Marchenko, S., Romanovsky, V., Wickland, K. P., French, N., Waldrop, M., Bourgeau-Chavez, L., and Striegl, R. G.: Vulnerability of high-latitude soil organic carbon in North America to disturbance, J. Geophys. Res., 116, https://doi.org/10.1029/2010JG001507, 2011. a
Günther, F., Overduin, P. P., Yakshina, I. A., Opel, T., Baranskaya, A. V., and Grigoriev, M. N.: Observing Muostakh disappear: permafrost thaw subsidence and erosion of a ground-ice-rich island in response to arctic summer warming and sea ice reduction, The Cryosphere, 9, 151–178, https://doi.org/10.5194/tc-9-151-2015, 2015. a
Harris, S. A. (Ed.): Glossary of permafrost and related ground-ice terms, no. 142 in Technical Memorandum, National Research Council, Canada, Ottawa, Ontario, Canada, ISBN 978-0-660-12540-4, 1988. a, b
Hjort, J., Streletskiy, D., Doré, G., Wu, Q., Bjella, K., and Luoto, M.: Impacts of permafrost degradation on infrastructure, Nature Reviews Earth & Environment, 3, 24–38, https://doi.org/10.1038/s43017-021-00247-8, 2022. a
Holloway, J. E., Lewkowicz, A. G., Douglas, T. A., Li, X., Turetsky, M. R., Baltzer, J. L., and Jin, H.: Impact of wildfire on permafrost landscapes: A review of recent advances and future prospects, Permafrost and Periglacial Processes, 31, 371–382, https://doi.org/10.1002/ppp.2048, 2020. a
Huang, L., Luo, J., Lin, Z., Niu, F., and Liu, L.: Using deep learning to map retrogressive thaw slumps in the Beiluhe region (Tibetan Plateau) from CubeSat images, Remote Sensing of Environment, 237, 111534, https://doi.org/10.1016/j.rse.2019.111534, 2020. a
Huang, L., Liu, L., Luo, J., Lin, Z., and Niu, F.: Automatically quantifying evolution of retrogressive thaw slumps in Beiluhe (Tibetan Plateau) from multi-temporal CubeSat images, International Journal of Applied Earth Observation and Geoinformation, 102, 102399, https://doi.org/10.1016/j.jag.2021.102399, 2021. a, b, c
Hugelius, G., Strauss, J., Zubrzycki, S., Harden, J. W., Schuur, E. A. G., Ping, C.-L., Schirrmeister, L., Grosse, G., Michaelson, G. J., Koven, C. D., O'Donnell, J. A., Elberling, B., Mishra, U., Camill, P., Yu, Z., Palmtag, J., and Kuhry, P.: Estimated stocks of circumpolar permafrost carbon with quantified uncertainty ranges and identified data gaps, Biogeosciences, 11, 6573–6593, https://doi.org/10.5194/bg-11-6573-2014, 2014. a
Hugonnet, R., Mannerfelt, E., Dehecq, A., Knuth, F., and Tedstone, A.: xDEM (v0.0.2), Zenodo [software], https://doi.org/10.5281/zenodo.4809698, 2021. a
Jaboyedoff, M., Carrea, D., Derron, M.-H., Oppikofer, T., Penna, I. M., and Rudaz, B.: A review of methods used to estimate initial landslide failure surface depths and volumes, Engineering Geology, 267, 105478, https://doi.org/10.1016/j.enggeo.2020.105478, 2020. a, b, c
Jiao, C., Niu, F., He, P., Ren, L., Luo, J., and Shan, Y.: Deformation and Volumetric Change in a Typical Retrogressive Thaw Slump in Permafrost Regions of the Central Tibetan Plateau, China, Remote Sensing, 14, 5592, https://doi.org/10.3390/rs14215592, 2022. a
Kokelj, S., Tunnicliffe, J., Lacelle, D., Lantz, T., Chin, K., and Fraser, R.: Increased precipitation drives mega slump development and destabilization of ice-rich permafrost terrain, northwestern Canada, Global and Planetary Change, 129, 56–68, https://doi.org/10.1016/j.gloplacha.2015.02.008, 2015. a, b
Kokelj, S. V. and Jorgenson, M. T.: Advances in Thermokarst Research, Permafr. Periglac. Process., 24, 108–119, https://doi.org/10.1002/ppp.1779, 2013. a
Kokelj, S. V., Kokoszka, J., van der Sluijs, J., Rudy, A. C. A., Tunnicliffe, J., Shakil, S., Tank, S. E., and Zolkos, S.: Thaw-driven mass wasting couples slopes with downstream systems, and effects propagate through Arctic drainage networks, The Cryosphere, 15, 3059–3081, https://doi.org/10.5194/tc-15-3059-2021, 2021. a, b, c, d, e, f, g, h, i, j, k, l, m
Krautblatter, M., Angelopoulos, M., Pollard, W. H., Lantuit, H., Lenz, J., Fritz, M., Couture, N., and Eppinger, S.: Life Cycles and Polycyclicity of Mega Retrogressive Thaw Slumps in Arctic Permafrost Revealed by 2D/3D Geophysics and Long‐Term Retreat Monitoring, Journal of Geophysical Research: Earth Surface, 129, e2023JF007556, https://doi.org/10.1029/2023JF007556, 2024. a
Krieger, G., Moreira, A., Fiedler, H., Hajnsek, I., Werner, M., Younis, M., and Zink, M.: TanDEM-X: A Satellite Formation for High-Resolution SAR Interferometry, IEEE Trans. Geosci. Remote Sens., 45, 3317–3341, https://doi.org/10.1109/TGRS.2007.900693, 2007. a, b, c, d
Lacelle, D., Bjornson, J., and Lauriol, B.: Climatic and geomorphic factors affecting contemporary (1950–2004) activity of retrogressive thaw slumps on the Aklavik Plateau, Richardson Mountains, NWT, Canada: Climatic and Geomorphic Factors affecting Thaw Slump Activity, Permafrost and Periglacial Processes, 21, 1–15, https://doi.org/10.1002/ppp.666, 2010. a
Lacelle, D., Brooker, A., Fraser, R. H., and Kokelj, S. V.: Distribution and growth of thaw slumps in the Richardson Mountains–Peel Plateau region, northwestern Canada, Geomorphology, 235, 40–51, https://doi.org/10.1016/j.geomorph.2015.01.024, 2015. a
Lantuit, H. and Pollard, W. H.: Temporal stereophotogrammetric analysis of retrogressive thaw slumps on Herschel Island, Yukon Territory, Nat. Hazards Earth Syst. Sci., 5, 413–423, https://doi.org/10.5194/nhess-5-413-2005, 2005. a, b
Lantuit, H. and Pollard, W.: Fifty years of coastal erosion and retrogressive thaw slump activity on Herschel Island, southern Beaufort Sea, Yukon Territory, Canada, Geomorphology, 95, 84–102, https://doi.org/10.1016/j.geomorph.2006.07.040, 2008. a
Lantz, T. C. and Kokelj, S. V.: Increasing rates of retrogressive thaw slump activity in the Mackenzie Delta region, N.W.T., Canada, Geophys. Res. Lett., 35, L06502, https://doi.org/10.1029/2007GL032433, 2008. a, b
Leibman, M., Kizyakov, A., Zhdanova, Y., Sonyushkin, A., and Zimin, M.: Coastal Retreat Due to Thermodenudation on the Yugorsky Peninsula, Russia during the Last Decade, Update since 2001–2010, Remote Sensing, 13, 4042, https://doi.org/10.3390/rs13204042, 2021. a
Lewkowicz, A. G. and Way, R. G.: Extremes of summer climate trigger thousands of thermokarst landslides in a High Arctic environment, Nat. Commun., 10, 1329, https://doi.org/10.1038/s41467-019-09314-7, 2019. a, b, c
Li, D., Lu, X., Walling, D. E., Zhang, T., Steiner, J. F., Wasson, R. J., Harrison, S., Nepal, S., Nie, Y., Immerzeel, W. W., Shugar, D. H., Koppes, M., Lane, S., Zeng, Z., Sun, X., Yegorov, A., and Bolch, T.: High Mountain Asia hydropower systems threatened by climate-driven landscape instability, Nature Geoscience, 15, 520–530, https://doi.org/10.1038/s41561-022-00953-y, 2022. a
Li, W., Yan, D., Lou, Y., Weng, B., Zhu, L., Lai, Y., and Wang, Y.: Characteristic, relationship and impact of thermokarst lakes and retrogressive thaw slumps over the Qinghai-Tibetan plateau, Geoderma, 457, 117293, https://doi.org/10.1016/j.geoderma.2025.117293, 2025. a
Lin, Z., Gao, Z., Fan, X., Niu, F., Luo, J., Yin, G., and Liu, M.: Factors controlling near surface ground-ice characteristics in a region of warm permafrost, Beiluhe Basin, Qinghai-Tibet Plateau, Geoderma, 376, 114540, https://doi.org/10.1016/j.geoderma.2020.114540, 2020. a
Liu, F., Chen, L., Abbott, B. W., Xu, Y., Yang, G., Kou, D., Qin, S., Strauss, J., Wang, Y., Zhang, B., and Yang, Y.: Reduced quantity and quality of SOM along a thaw sequence on the Tibetan Plateau, Environmental Research Letters, 13, 104017, https://doi.org/10.1088/1748-9326/aae43b, 2018. a, b, c
Liu, F., Kou, D., Chen, Y., Xue, K., Ernakovich, J. G., Chen, L., Yang, G., and Yang, Y.: Altered microbial structure and function after thermokarst formation, Global Change Biology, 27, 823–835, https://doi.org/10.1111/gcb.15438, 2021. a
Liu, X. and Chen, B.: Climatic warming in the Tibetan Plateau during recent decades, International Journal of Climatology, 20, 1729–1742, https://doi.org/10.1002/1097-0088(20001130)20:14<1729::AID-JOC556>3.0.CO;2-Y, 2000. a, b, c
Liu, Y., Qiu, H., Kamp, U., Wang, N., Wang, J., Huang, C., and Tang, B.: Higher temperature sensitivity of retrogressive thaw slump activity in the Arctic compared to the Third Pole, Science of The Total Environment, 914, 170 007, https://doi.org/10.1016/j.scitotenv.2024.170007, 2024. a
Luo, J., Niu, F., Lin, Z., Liu, M., and Yin, G.: Recent acceleration of thaw slumping in permafrost terrain of Qinghai-Tibet Plateau: An example from the Beiluhe Region, Geomorphology, 341, 79–85, https://doi.org/10.1016/j.geomorph.2019.05.020, 2019. a, b
Luo, J., Niu, F., Lin, Z., Liu, M., Yin, G., and Gao, Z.: Inventory and Frequency of Retrogressive Thaw Slumps in Permafrost Region of the Qinghai–Tibet Plateau, Geophysical Research Letters, 49, https://doi.org/10.1029/2022GL099829, 2022. a, b, c, d, e
Ma, J., Wang, G., Song, C., Gao, D., Li, J., Huang, P., Guo, L., Li, K., Lin, S., and Sun, S.: Establishing a robust area-to-volume scaling for Qinghai-Tibetan Plateau Retrogressive Thaw Slumps: A key tool for quantifying mass wasting and carbon release induced by permafrost degradation, Global and Planetary Change, 254, 105012, https://doi.org/10.1016/j.gloplacha.2025.105012, 2025. a, b, c, d, e, f, g, h, i
Ma, Y., Huang, X.-D., Yang, X.-L., Li, Y.-X., Wang, Y.-L., and Liang, T.-G.: Mapping snow depth distribution from 1980 to 2020 on the tibetan plateau using multi-source remote sensing data and downscaling techniques, ISPRS Journal of Photogrammetry and Remote Sensing, 205, 246–262, https://doi.org/10.1016/j.isprsjprs.2023.10.012, 2023. a
Maier, K.: Dataset for Quantifying Retrogressive Thaw Slump Mass Wasting and Carbon Mobilisation on the Qinghai-Tibet Plateau Using Multi-Modal Remote Sensing, ETH Zurich [data set], https://doi.org/10.3929/ethz-b-000735734, 2025a. a
Maier, K.: kathrinmaier/qtp-rts-mass-wasting: Code for publication in The Cryosphere (v.0.0.1), Zenodo [code], https://doi.org/10.5281/zenodo.17375814, 2025b. a
Maier, K., Bernhard, P., Ly, S., Volpi, M., Nitze, I., Li, S., and Hajnsek, I.: Detecting mass wasting of Retrogressive Thaw Slumps in spaceborne elevation models using deep learning, International Journal of Applied Earth Observation and Geoinformation, 137, 104419, https://doi.org/10.1016/j.jag.2025.104419, 2025. a, b, c, d, e, f, g
Martone, M., Bräutigam, B., Rizzoli, P., Gonzalez, C., Bachmann, M., and Krieger, G.: Coherence evaluation of TanDEM-X interferometric data, ISPRS J. Photogramm. Remote Sens., 73, 21–29, https://doi.org/10.1016/j.isprsjprs.2012.06.006, 2012. a
Mishra, U., Hugelius, G., Shelef, E., Yang, Y., Strauss, J., Lupachev, A., Harden, J. W., Jastrow, J. D., Ping, C.-L., Riley, W. J., Schuur, E. A. G., Matamala, R., Siewert, M., Nave, L. E., Koven, C. D., Fuchs, M., Palmtag, J., Kuhry, P., Treat, C. C., Zubrzycki, S., Hoffman, F. M., Elberling, B., Camill, P., Veremeeva, A., and Orr, A.: Spatial heterogeneity and environmental predictors of permafrost region soil organic carbon stocks, Science Advances, 7, eaaz5236, https://doi.org/10.1126/sciadv.aaz5236, 2021. a, b
Mu, C. C., Abbott, B. W., Zhao, Q., Su, H., Wang, S. F., Wu, Q. B., Zhang, T. J., and Wu, X. D.: Permafrost collapse shifts alpine tundra to a carbon source but reduces N2O and CH4 release on the northern Qinghai‐Tibetan Plateau, Geophysical Research Letters, 44, 8945–8952, https://doi.org/10.1002/2017GL074338, 2017. a, b, c, d
Nesterova, N., Leibman, M., Kizyakov, A., Lantuit, H., Tarasevich, I., Nitze, I., Veremeeva, A., and Grosse, G.: Review article: Retrogressive thaw slump characteristics and terminology, The Cryosphere, 18, 4787–4810, https://doi.org/10.5194/tc-18-4787-2024, 2024. a, b, c, d, e, f
Nitzbon, J., Westermann, S., Langer, M., Martin, L. C. P., Strauss, J., Laboor, S., and Boike, J.: Fast response of cold ice-rich permafrost in northeast Siberia to a warming climate, Nature Communications, 11, 2201, https://doi.org/10.1038/s41467-020-15725-8, 2020. a
Nitze, I., Heidler, K., Barth, S., and Grosse, G.: Developing and Testing a Deep Learning Approach for Mapping Retrogressive Thaw Slumps, Remote Sensing, 13, 4294, https://doi.org/10.3390/rs13214294, 2021. a
Nitze, I., Van der Sluijs, J., Barth, S., Bernhard, P., Huang, L., Kizyakov, A., Lara, M., Nesterova, N., Runge, A., Veremeeva, A., Ward Jones, M., Witharana, C., Xia, Z., and Liljedahl, A.: A Labeling Intercomparison of Retrogressive Thaw Slumps by a Diverse Group of Domain Experts, Permafr. Periglac. Process., 36, 83–92, https://doi.org/10.1002/ppp.2249, 2024. a, b
Nitze, I., Heidler, K., Nesterova, N., Küpper, J., Schütt, E., Hölzer, T., Barth, S., Lara, M. J., Liljedahl, A. K., and Grosse, G.: DARTS: Multi-year database of AI-detected retrogressive thaw slumps in the circum-arctic permafrost region, Scientific Data, 12, 1512, https://doi.org/10.1038/s41597-025-05810-2, 2025. a
O'Neill, H. B., Smith, S. L., Burn, C. R., Duchesne, C., and Zhang, Y.: Widespread Permafrost Degradation and Thaw Subsidence in Northwest Canada, Journal of Geophysical Research: Earth Surface, 128, e2023JF007262, https://doi.org/10.1029/2023JF007262, 2023. a
Porter, C., Morin, P., Howat, I., Noh, M.-J., Bates, B., Peterman, K., Keesey, S., Schlenk, M., Gardiner, J., Tomko, K., Willis, M., Kelleher, C., Cloutier, M., Husby, E., Foga, S., Nakamura, H., Platson, M., Wethington, M., Williamson, C., Bauer, G., Enos, J., Arnold, G., Kramer, W., Becker, P., Doshi, A., D'Souza, C., Cummens, P., Laurier, F., and Bojesen, M.: ArcticDEM, Version 3, Harvard Dataverse, V1 [data set], https://doi.org/10.7910/DVN/OHHUKH, 2018. a
Ramage, J. L., Irrgang, A. M., Morgenstern, A., and Lantuit, H.: Increasing coastal slump activity impacts the release of sediment and organic carbon into the Arctic Ocean, Biogeosciences, 15, 1483–1495, https://doi.org/10.5194/bg-15-1483-2018, 2018. a, b
Ran, Y., Li, X., Cheng, G., Che, J., Aalto, J., Karjalainen, O., Hjort, J., Luoto, M., Jin, H., Obu, J., Hori, M., Yu, Q., and Chang, X.: New high-resolution estimates of the permafrost thermal state and hydrothermal conditions over the Northern Hemisphere, Earth Syst. Sci. Data, 14, 865–884, https://doi.org/10.5194/essd-14-865-2022, 2022. a, b, c, d, e
Rodriguez, E. and Martin, J.: Theory and design of interferometric synthetic aperture radars, IEE Proceedings F Radar and Signal Processing, 139, 147, https://doi.org/10.1049/ip-f-2.1992.0018, 1992. a
Rosen, P., Hensley, S., Joughin, I., Li, F., Madsen, S., Rodriguez, E., and Goldstein, R.: Synthetic aperture radar interferometry, Proceedings of the IEEE, 88, 333–382, https://doi.org/10.1109/5.838084, 2000. a
Runge, A., Nitze, I., and Grosse, G.: Remote sensing annual dynamics of rapid permafrost thaw disturbances with LandTrendr, Remote Sens. Environ., 268, 112752, https://doi.org/10.1016/j.rse.2021.112752, 2022. a
Schuur, E. A., Abbott, B. W., Commane, R., Ernakovich, J., Euskirchen, E., Hugelius, G., Grosse, G., Jones, M., Koven, C., Leshyk, V., Lawrence, D., Loranty, M. M., Mauritz, M., Olefeldt, D., Natali, S., Rodenhizer, H., Salmon, V., Schädel, C., Strauss, J., Treat, C., and Turetsky, M.: Permafrost and Climate Change: Carbon Cycle Feedbacks From the Warming Arctic, Annual Review of Environment and Resources, 47, 343–371, https://doi.org/10.1146/annurev-environ-012220-011847, 2022. a, b, c
Schuur, E. A. G., McGuire, A. D., Schädel, C., Grosse, G., Harden, J. W., Hayes, D. J., Hugelius, G., Koven, C. D., Kuhry, P., Lawrence, D. M., Natali, S. M., Olefeldt, D., Romanovsky, V. E., Schaefer, K., Turetsky, M. R., Treat, C. C., and Vonk, J. E.: Climate change and the permafrost carbon feedback, Nature, 520, 171–179, https://doi.org/10.1038/nature14338, 2015. a
Smith, S. L., O'Neill, H. B., Isaksen, K., Noetzli, J., and Romanovsky, V. E.: The changing thermal state of permafrost, Nature Reviews Earth & Environment, 3, 10–23, https://doi.org/10.1038/s43017-021-00240-1, 2022. a
Thomas, M., Monhonval, A., Hirst, C., Bröder, L., Zolkos, S., Vonk, J. E., Tank, S. E., Keskitalo, K. H., Shakil, S., Kokelj, S. V., Van Der Sluijs, J., and Opfergelt, S.: Evidence for preservation of organic carbon interacting with iron in material displaced from retrogressive thaw slumps: Case study in Peel Plateau, western Canadian Arctic, Geoderma, 433, 116443, https://doi.org/10.1016/j.geoderma.2023.116443, 2023. a
Turetsky, M. R., Abbott, B. W., Jones, M. C., Anthony, K. W., Olefeldt, D., Schuur, E. A. G., Grosse, G., Kuhry, P., Hugelius, G., Koven, C., Lawrence, D. M., Gibson, C., Sannel, A. B. K., and McGuire, A. D.: Carbon release through abrupt permafrost thaw, Nat. Geosci., 13, 138–143, https://doi.org/10.1038/s41561-019-0526-0, 2020. a
Van Der Sluijs, J., Kokelj, S. V., Fraser, R. H., Tunnicliffe, J., and Lacelle, D.: Permafrost Terrain Dynamics and Infrastructure Impacts Revealed by UAV Photogrammetry and Thermal Imaging, Remote Sensing, 10, 1734, https://doi.org/10.3390/rs10111734, 2018. a
van der Sluijs, J., Kokelj, S. V., and Tunnicliffe, J. F.: Allometric scaling of retrogressive thaw slumps, The Cryosphere, 17, 4511–4533, https://doi.org/10.5194/tc-17-4511-2023, 2023. a, b, c, d, e, f, g, h, i, j, k, l, m, n, o, p, q, r
Virkkala, A., Aalto, J., Rogers, B. M., Tagesson, T., Treat, C. C., Natali, S. M., Watts, J. D., Potter, S., Lehtonen, A., Mauritz, M., Schuur, E. A. G., Kochendorfer, J., Zona, D., Oechel, W., Kobayashi, H., Humphreys, E., Goeckede, M., Iwata, H., Lafleur, P. M., Euskirchen, E. S., Bokhorst, S., Marushchak, M., Martikainen, P. J., Elberling, B., Voigt, C., Biasi, C., Sonnentag, O., Parmentier, F. W., Ueyama, M., Celis, G., St.Louis, V. L., Emmerton, C. A., Peichl, M., Chi, J., Järveoja, J., Nilsson, M. B., Oberbauer, S. F., Torn, M. S., Park, S., Dolman, H., Mammarella, I., Chae, N., Poyatos, R., López‐Blanco, E., Christensen, T. R., Kwon, M. J., Sachs, T., Holl, D., and Luoto, M.: Statistical upscaling of ecosystem CO 2 fluxes across the terrestrial tundra and boreal domain: Regional patterns and uncertainties, Global Change Biology, 27, 4040–4059, https://doi.org/10.1111/gcb.15659, 2021. a
Wang, B. and French, H. M.: Climate controls and high‐altitude permafrost, qinghai‐xizang (tibet) Plateau, China, Permafrost and Periglacial Processes, 5, 87–100, https://doi.org/10.1002/ppp.3430050203, 1994. a, b
Wang, D., Wu, T., Zhao, L., Mu, C., Li, R., Wei, X., Hu, G., Zou, D., Zhu, X., Chen, J., Hao, J., Ni, J., Li, X., Ma, W., Wen, A., Shang, C., La, Y., Ma, X., and Wu, X.: A 1 km resolution soil organic carbon dataset for frozen ground in the Third Pole, Earth Syst. Sci. Data, 13, 3453–3465, https://doi.org/10.5194/essd-13-3453-2021, 2021. a, b, c, d, e, f, g, h
Wang, G., Peng, Y., Chen, L., Abbott, B. W., Ciais, P., Kang, L., Liu, Y., Li, Q., Peñuelas, J., Qin, S., Smith, P., Song, Y., Strauss, J., Wang, J., Wei, B., Yu, J., Zhang, D., and Yang, Y.: Enhanced response of soil respiration to experimental warming upon thermokarst formation, Nature Geoscience, 17, 532–538, https://doi.org/10.1038/s41561-024-01440-2, 2024. a
Wang, S., Sheng, Y., Li, J., Wu, J., Cao, W., and Ma, S.: An Estimation of Ground Ice Volumes in Permafrost Layers in Northeastern Qinghai-Tibet Plateau, China, Chinese Geographical Science, 28, 61–73, https://doi.org/10.1007/s11769-018-0932-z, 2018. a
Wang, T., Yang, D., Yang, Y., Piao, S., Li, X., Cheng, G., and Fu, B.: Permafrost thawing puts the frozen carbon at risk over the Tibetan Plateau, Science Advances, 6, eaaz3513, https://doi.org/10.1126/sciadv.aaz3513, 2020. a
Wang, Y., Xiao, J., Ma, Y., Ding, J., Chen, X., Ding, Z., and Luo, Y.: Persistent and enhanced carbon sequestration capacity of alpine grasslands on Earth’s Third Pole, Science Advances, 9, eade6875, https://doi.org/10.1126/sciadv.ade6875, 2023. a
Wang, Z.-W., Wang, Q., Zhao, L., Wu, X.-D., Yue, G.-Y., Zou, D.-F., Nan, Z.-T., Liu, G.-Y., Pang, Q.-Q., Fang, H.-B., Wu, T.-H., Shi, J.-Z., Jiao, K.-Q., Zhao, Y.-H., and Zhang, L.-L.: Mapping the vegetation distribution of the permafrost zone on the Qinghai-Tibet Plateau, Journal of Mountain Science, 13, 1035–1046, https://doi.org/10.1007/s11629-015-3485-y, 2016. a
Ward Jones, M. K., Pollard, W. H., and Jones, B. M.: Rapid initialization of retrogressive thaw slumps in the Canadian high Arctic and their response to climate and terrain factors, Environ. Res. Lett., 14, 055006, https://doi.org/10.1088/1748-9326/ab12fd, 2019. a
Werner, C., Wegmüller, U., Strozzi, T., and Wiesmann, A.: GAMMA SAR and interferometric processing, in: European Space Agency (Special Publication) ESA SP, 461, 211–219, 2000. a
Wu, Q. and Zhang, T.: Recent permafrost warming on the Qinghai‐Tibetan Plateau, Journal of Geophysical Research: Atmospheres, 113, 2007JD009539, https://doi.org/10.1029/2007JD009539, 2008. a
Wu, X., Xu, H., Liu, G., Zhao, L., and Mu, C.: Effects of permafrost collapse on soil bacterial communities in a wet meadow on the northern Qinghai-Tibetan Plateau, BMC Ecology, 18, 27, https://doi.org/10.1186/s12898-018-0183-y, 2018. a
Xia, Z., Huang, L., Fan, C., Jia, S., Lin, Z., Liu, L., Luo, J., Niu, F., and Zhang, T.: Retrogressive thaw slumps along the Qinghai–Tibet Engineering Corridor: a comprehensive inventory and their distribution characteristics, Earth Syst. Sci. Data, 14, 3875–3887, https://doi.org/10.5194/essd-14-3875-2022, 2022. a, b, c, d
Xia, Z., Liu, L., Mu, C., Peng, X., Zhao, Z., Huang, L., Luo, J., and Fan, C.: Widespread and Rapid Activities of Retrogressive Thaw Slumps on the Qinghai‐Tibet Plateau From 2016 to 2022, Geophysical Research Letters, 51, e2024GL109616, https://doi.org/10.1029/2024GL109616, 2024. a, b, c, d, e, f, g, h, i, j, k, l, m, n, o, p, q, r, s
Yang, J., Jiang, L., Luojus, K., Pan, J., Lemmetyinen, J., Takala, M., and Wu, S.: Snow depth estimation and historical data reconstruction over China based on a random forest machine learning approach, The Cryosphere, 14, 1763–1778, https://doi.org/10.5194/tc-14-1763-2020, 2020. a
Yang, Y., Rogers, B. M., Fiske, G., Watts, J., Potter, S., Windholz, T., Mullen, A., Nitze, I., and Natali, S. M.: Mapping retrogressive thaw slumps using deep neural networks, Remote Sens. Environ., 288, 113495, https://doi.org/10.1016/j.rse.2023.113495, 2023. a
Yang, Y., Rodenhizer, H., Rogers, B. M., Dean, J., Singh, R., Windholz, T., Poston, A., Potter, S., Zolkos, S., Fiske, G., Watts, J., Huang, L., Witharana, C., Nitze, I., Nesterova, N., Barth, S., Grosse, G., Lantz, T., Runge, A., Lombardo, L., Nicu, I. C., Rubensdotter, L., Makopoulou, E., and Natali, S.: A Collaborative and Scalable Geospatial Data Set for Arctic Retrogressive Thaw Slumps with Data Standards, Scientific Data, 12, 18, https://doi.org/10.1038/s41597-025-04372-7, 2025. a
Yao, T., Xue, Y., Chen, D., Chen, F., Thompson, L., Cui, P., Koike, T., Lau, W. K.-M., Lettenmaier, D., Mosbrugger, V., Zhang, R., Xu, B., Dozier, J., Gillespie, T., Gu, Y., Kang, S., Piao, S., Sugimoto, S., Ueno, K., Wang, L., Wang, W., Zhang, F., Sheng, Y., Guo, W., Ailikun, Yang, X., Ma, Y., Shen, S. S. P., Su, Z., Chen, F., Liang, S., Liu, Y., Singh, V. P., Yang, K., Yang, D., Zhao, X., Qian, Y., Zhang, Y., and Li, Q.: Recent Third Pole’s Rapid Warming Accompanies Cryospheric Melt and Water Cycle Intensification and Interactions between Monsoon and Environment: Multidisciplinary Approach with Observations, Modeling, and Analysis, Bulletin of the American Meteorological Society, 100, 423–444, https://doi.org/10.1175/BAMS-D-17-0057.1, 2019. a
Yi, Y., Wu, T., Wu, M., Jiang, H., Yang, Y., and Rogers, B. M.: Abrupt thaw and its effects on permafrost carbon emissions in the Tibetan Plateau: A remote sensing and modeling perspective, Earth-Science Reviews, 261, 105020, https://doi.org/10.1016/j.earscirev.2024.105020, 2025. a, b, c, d, e, f
Zhao, L., Zou, D., Hu, G., Du, E., Pang, Q., Xiao, Y., Li, R., Sheng, Y., Wu, X., Sun, Z., Wang, L., Wang, C., Ma, L., Zhou, H., and Liu, S.: Changing climate and the permafrost environment on the Qinghai–Tibet (Xizang) plateau, Permafrost and Periglacial Processes, 31, 396–405, https://doi.org/10.1002/ppp.2056, 2020. a, b
Zhao, L., Zou, D., Hu, G., Wu, T., Du, E., Liu, G., Xiao, Y., Li, R., Pang, Q., Qiao, Y., Wu, X., Sun, Z., Xing, Z., Sheng, Y., Zhao, Y., Shi, J., Xie, C., Wang, L., Wang, C., and Cheng, G.: A synthesis dataset of permafrost thermal state for the Qinghai–Tibet (Xizang) Plateau, China, Earth Syst. Sci. Data, 13, 4207–4218, https://doi.org/10.5194/essd-13-4207-2021, 2021. a
Zou, D., Zhao, L., Sheng, Y., Chen, J., Hu, G., Wu, T., Wu, J., Xie, C., Wu, X., Pang, Q., Wang, W., Du, E., Li, W., Liu, G., Li, J., Qin, Y., Qiao, Y., Wang, Z., Shi, J., and Cheng, G.: A new map of permafrost distribution on the Tibetan Plateau, The Cryosphere, 11, 2527–2542, https://doi.org/10.5194/tc-11-2527-2017, 2017. a, b, c
Zou, D., Pang, Q., Zhao, L., Wang, L., Hu, G., Du, E., Liu, G., Liu, S., and Liu, Y.: Estimation of Permafrost Ground Ice to 10 m Depth on the Qinghai‐Tibet Plateau, Permafrost and Periglacial Processes, 35, 423–434, https://doi.org/10.1002/ppp.2226, 2024. a, b, c, d, e, f, g