the Creative Commons Attribution 4.0 License.
the Creative Commons Attribution 4.0 License.
 | 16 Jul 2024
Brief communication: On the potential of seismic polarity reversal to identify a thin low-velocity layer above a high-velocity layer in ice-rich rock glaciers
Mirko Pavoni
Alexander Bast
Samuel Weber
Seismic refraction tomography is a commonly used technique to characterise rock glaciers, as the boundary between unfrozen and ice-bearing layers represents a strong impedance contrast. In several rock glaciers, we observed a reversed polarity of the waves refracted by an extended ice-bearing layer compared to direct-wave arrivals. This phase change may be related to the presence of a thin low-velocity layer (LVL), such as fine- to coarse-grained sediments, above a thicker ice-rich layer. Our results are confirmed by the modelling and analysis of synthetic seismograms to demonstrate that the presence of a low-velocity layer can produce a polarity reversal on the seismic gather.
- Article
(3360 KB) - Full-text XML
-
Supplement
(609 KB) - BibTeX
- EndNote


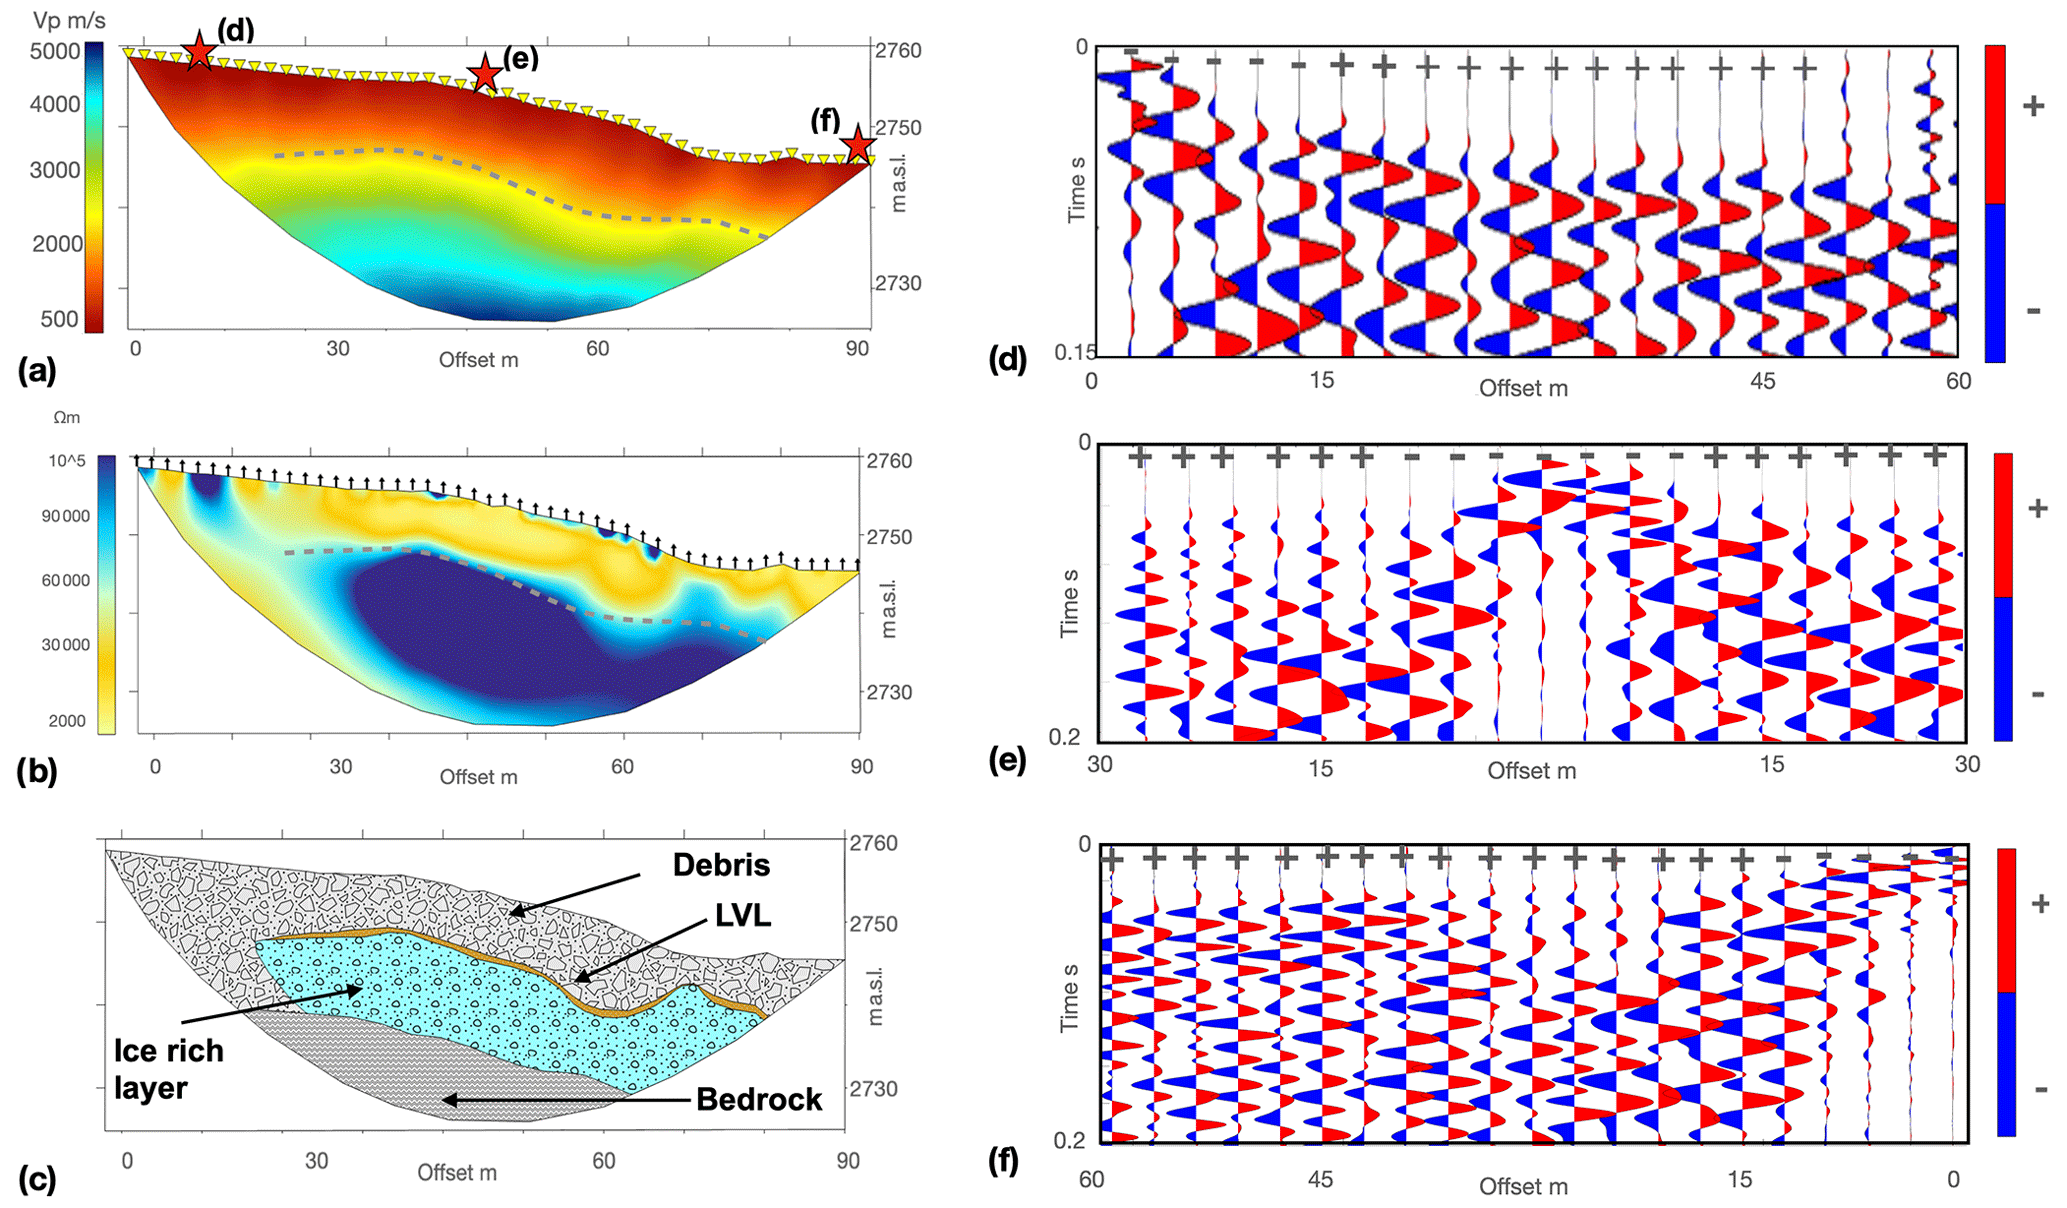
Figure 1(a) Schafberg SRT inverted section, where red stars are the shot positions presented here. (b) Schafberg ERT inverted section. The dashed line represents the ice-bearing layer boundary evaluated with the steepest gradient method applied to the resistivity section. (c) Schafberg interpreted model based on ERT and SRT profiles and borehole stratigraphies (Phillips et al., 2023). Panels (d), (e), and (f) show the wiggle-mode (zoom) seismograms above the ice-bearing layer for the lateral and central shots. The seismograms highlight the reversal polarity of the refracted waves: direct-wave first arrivals have blue negative polarity (−), while refracted-wave first arrivals switch to red positive polarity (+).
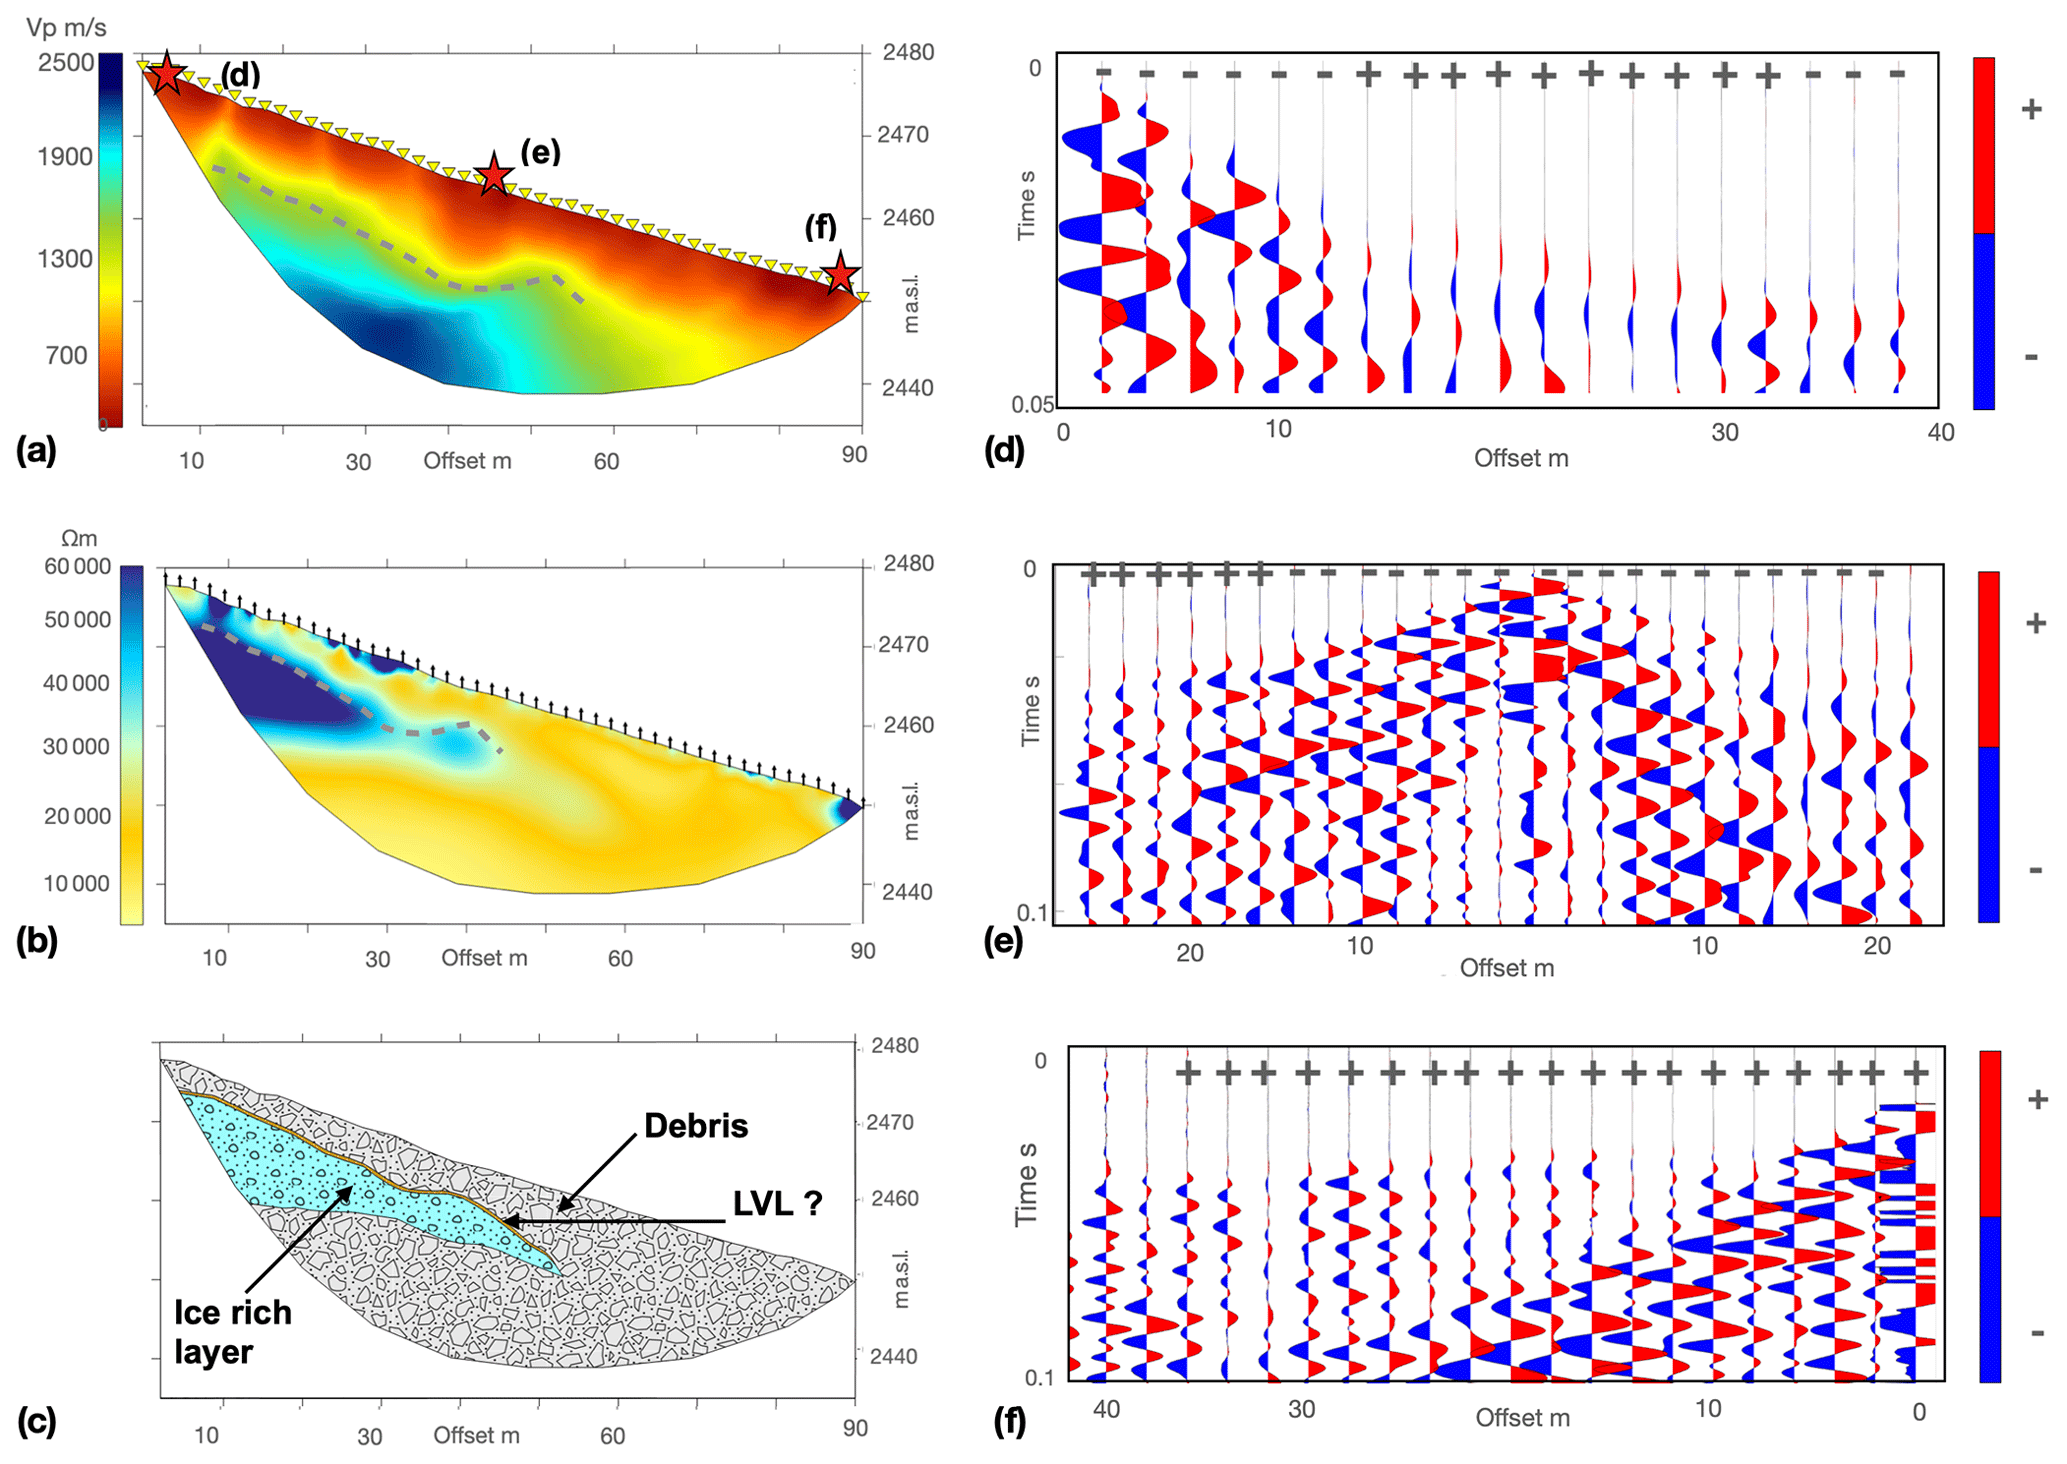
Figure 2(a) Flüela Pass SRT inverted section, where red stars are the shot positions presented here. (b) ERT inverted section. The dashed line represents the ice-bearing layer boundary evaluated with the steepest gradient method applied to the resistivity section. (c) Flüela Pass interpreted model based on ERT and SRT results. Panels (d), (e), and (f) are the wiggle-mode (zoom) seismograms above the ice-bearing layer for lateral and central shots. The seismograms show the reversal polarity of the refracted waves but only in the upper section where an ice-rich layer is present (d, e). The lateral shot (f) does not exhibit polarity reversal.
Rock glaciers are prominent landforms in permafrost environments that pose a potential mass movement hazard, endangering communities and infrastructure in high mountain regions. As their kinematics are strongly dependent on the presence of ice and water, various geophysical methods have been used in recent decades to map, characterise, and monitor the internal structure of these permafrost-related landforms. Seismic methods are one of the most frequently and earliest applied methods to investigate the near-subsurface of rock glaciers besides electrical methods such as electrical resistivity tomography (ERT; e.g. Hilbich, 2010), induced polarisation (e.g. Duvillard et al., 2018), or electro-magnetic methods (e.g. Boaga et al., 2020; Pavoni et al., 2023a). Recently, seismic refraction tomography (SRT; e.g. Musil et al., 2002) has regained popularity, as joint-inversion algorithms provide a more detailed insight into the ice, water, rock and air composition within a rock glacier (e.g. Hauck et al., 2011; Pavoni et al., 2023c). SRT is a very suitable method because the refracted seismic wave travels along the ice-bearing layer at higher seismic velocities than the upper sediments. Typically, higher velocities at depth imply higher impedance of acoustic contrast (Z), which is the product of density (σ) and seismic velocity (v). The reflection coefficient R influences the energy reflected at the boundary:
where Z1 is the acoustic impedance of the overlying media and Z2 is the acoustic impedance of the bottom one. The boundary generates critically refracted waves if the reflection coefficient (R) is positive (Harvey, 2011). The seismic velocity structure of the ground can be retrieved from the first-arrival times of the direct and refracted waves (Leopold et al., 2011). Since critically refracted waves are generated in the case of a positive reflection coefficient (R), a possible low-velocity layer (LVL) between two faster ones is not visible using the seismic refraction technique, which is the method's main drawback. However, different wave attributes can be analysed in the seismic shot gather. A polarity reversal, or so-called phase change, is an example of a local-amplitude seismic attribute anomaly in reflected waves that can indicate the presence of an LVL between two faster media. For example, phase polarity inversion is regarded as a direct hydrocarbon indicator in seismic hydrocarbon exploration. Polarity inversion has been observed in several glaciological seismic reflection studies (e.g. Anandakrishnan, 2003). The phase shift can also be observed in the vertical component of critically refracted head waves, in this case due to the complex interaction of the wave with a boundary or a change in the medium, as a phase lag generated by the presence of slow layers. We observed such a reversal of the polarity of the refracted waves, with respect to the direct-wave phase, in SRT datasets of several rock glaciers. Here, we present two case studies from Switzerland, where two rock glaciers were characterised using ERT and SRT and in one case with additional borehole information. In both cases, the refracted wave recorded with vertical geophones shows a reversal polarity in correspondence with the buried ice-rich layer. We speculate that this phase change may be due to the presence of an LVL, such as fine- to coarse-grained sediments with ice, overlying a high-velocity layer of massive ice, or with ice-filled veins between coarse blocks (see Figs. 1c and 2c). Such an LVL in rock glaciers (RGs) is typically a leach product of upper blocks, consisting of fine sediment of variable thickness (often <1 m), with moderate resistivity (<2 KΩ m) and poor mechanical properties (Vp<500 m s−1). It is hard to detect this LVL by ERT if the thickness is less than the electrode spacing and is apparently undetectable by SRT. We computed synthetic seismograms for two subsurface models, with and without the LVL. The synthetic modelling confirms that, in our case study, the presence of even a thin layer of fine sediment with low seismic velocity can induce a reversal in the polarity of the refracted waves.
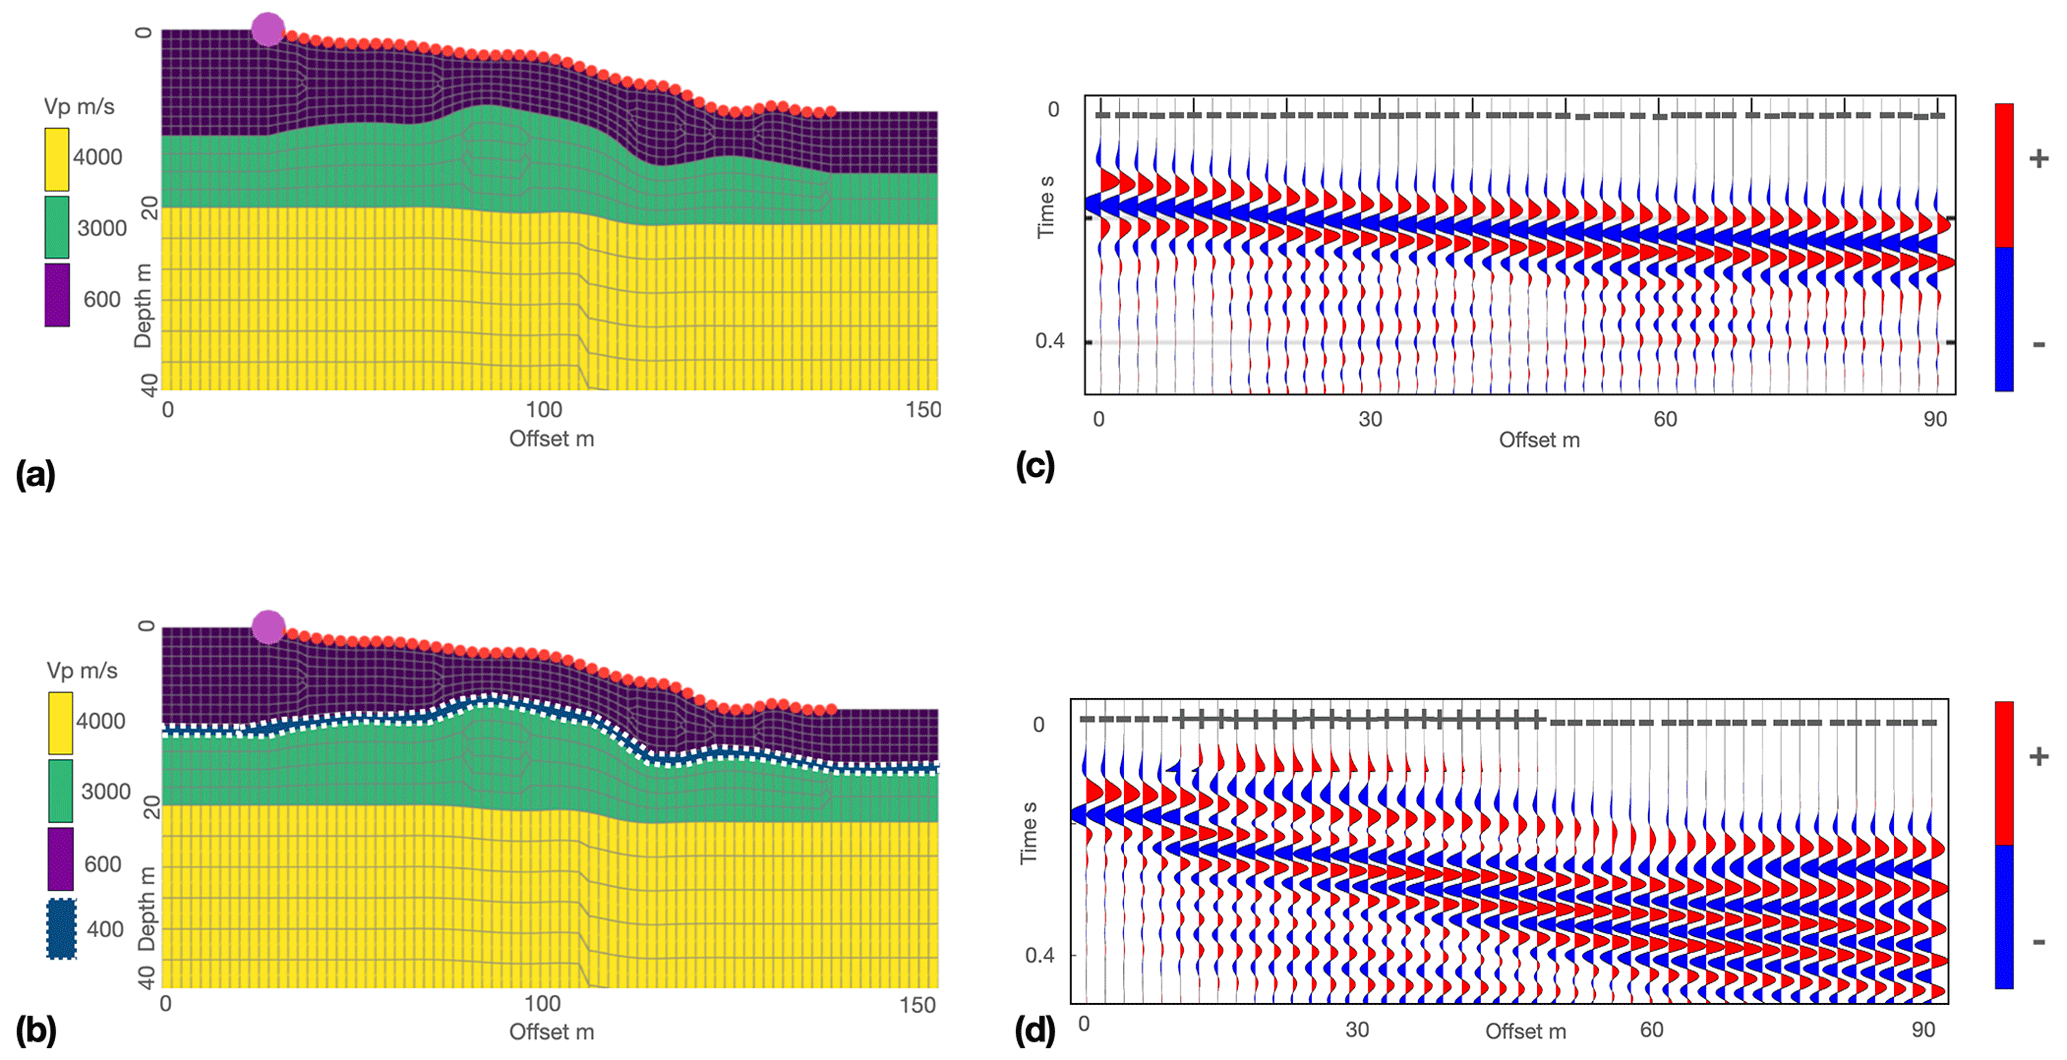
Figure 3Synthetic models of the Schafberg rock glacier (a) without and (b) with the fine-sediment 1 m thick LVL (blue zone between dashed white lines). The purple dot is the source position, and the red dots are the receivers. (c) Synthetic seismograms computed without the LVL presence and (d) synthetic seismograms computed with the same model but with the presence of a 1 m thick LVL.
In this study, we investigate the Schafberg and Flüela Pass rock glaciers (RGs) in Grisons in the eastern Swiss Alps. At both sites, ERT and SRT data were collected in August 2022. The ice-rich Schafberg rock glacier is located above Pontresina at 2750 m a.s.l. (∼46.49° N, ∼9.93° E). We performed the measurements near four boreholes. One borehole was drilled in 1990 and equipped with thermistors (Vonder Mühll and Holub, 1992). In 2020, a further three boreholes were drilled and equipped with piezometers, temperature sensors, and a cross-borehole ERT setup (Phillips et al., 2023; Bast et al., 2024). The stratigraphies recorded during drilling indicate a 3–4 m thick layer of boulders above a layer of fines with ice (∼1 m), over coarse sediments with ice, and a layer of ice and/or mud with ice (Phillips et al., 2023) and found bedrock at around 16 m depth. The internal structure was confirmed by ERT, SRT, and electromagnetic soundings (Boaga et al., 2020; Pavoni et al., 2023c). ERT and SRT acquisition was performed with 48 electrodes and 3 m spacing between geophones. The Flüela Pass rock glacier is an active rock glacier complex located at the pass between the Flüela and Susasca valleys in the eastern Swiss Alps (∼46.75° N, ∼9.95° E). This RG is a creeping ice-rich landform that ranges from 2380 to 2800 m a.s.l., surrounded by steep rock walls consisting mainly of amphibolite and paragneiss. The rock glacier surface is made up of debris and boulders of various sizes. Here, we conducted ERT and SRT soundings with 48 electrodes and with 2 m spacing between geophones. The inverted tomograms suggested the presence of an ice-bearing layer beneath a 3–5 m thick layer of unfrozen debris in the upper part of the section. Data were collected and processed in the same way at both sites. For data acquisition, we used a Syscal Pro Switch 48 georesistivimeter (IRIS Instruments; http://www.iris-instruments.com, last access: April 2024) with a multi-skip acquisition scheme and direct and reciprocal measurements to define a reliable expected data error (10 % at Flüela Pass and 20 % at Schafberg). Multi-skip dipole acquisition ensured good depth sensitivity and lateral resolution (Pavoni et al., 2023c); however, the spacing between the electrodes still determines the thickness of the observable layer, making any thin LVL invisible. Seismic data were recorded with Geode seismographs (Geometrics, San Jose, USA; http://www.geometrics.com, last access: April 2024) using vertical geophones (100 Hz) for both sites. Shot locations were at every second geophone, and signals were triggered with a sledgehammer (20 kg). Sampling was 0.25 ms, and the signal-to-noise ratio was improved by stacking the traces recorded twice at each location. In this way, we facilitated the manual picking procedure of the compressional wave's first-time arrivals and assessed uncertainty (picking error of 2 ms) by performing repeated picking (Pavoni et al., 2023c). Inversion modelling was performed by adopting unstructured triangular meshes to accurately consider the irregular topography of the rock glacier environments (we measured at each electrode and geophone with a Stonex S800 GNSS receiver; https://www.stonex.it/, last access: April 2024). ERT inversions were performed using the open-source Python-based software ResIPy (Blanchy et al., 2020) by applying a weighted least-squares objective function with normal isotropic regularisation inversion and linear filtering. Both models reached the convergence criteria (final RMS misfit <1) in two iterations. For SRT inversion modelling we adopted the open-source C++/Python-based library pyGIMLi (Rücker et al., 2017). In this case, the optimal regularisation factor was defined with an L-curve analysis, and both Vp models reached the convergence in four iterations. In the raw seismograms of both sites, we observed a reversal polarity of the refracted waves' first arrivals with respect to the direct waves' first arrivals, corresponding to the presence of an ice-bearing layer (Figs. 1 and 2). Panels (a) and (b) in each figure show the results of the inversion processes of the SRT and ERT datasets. The inverted models reveal the internal structure of the rock glaciers and the estimated ice-bearing layer boundary (dashed lines), estimated by applying the steepest gradient method to the ERT results (Pavoni et al., 2023b). Panel (c) shows the interpreted models as confirmed by borehole information in the Schafberg case. Panels (d), (e), and (f) show the raw seismograms for the left, central, and right shots, respectively. Wiggle-mode seismograms are shown with red (+) and blue (−) phase colours of the shot gather to highlight the polarity reversal.
At both sites, the shot gathers show an evident phase change from negative to positive between the direct waves' first arrivals (blue, negative polarity) and the critically refracted waves' first arrivals (red, positive polarity) in the presence of the ice-bearing layer boundary. As can be seen in Fig. 2c, in the Flüela Pass case, the ice-rich layer and the possible LVL are limited to the upper part of the RG; accordingly, the central and right shots (Fig. 3e and f) do not exhibit phase reversal in the lower part. We hypothesise that the observed reversal polarity can be attributed to the interference generated by the presence of a thin LVL of fine- to coarse-grained sediments with ice and unfrozen water above a high-velocity ice-rich layer, as documented by the stratigraphy of the Schafberg rock glacier (Phillips et al., 2023).
We computed synthetic seismograms based on SRT and ERT data from the Schafberg boreholes. The forward problem was implemented using the advanced full-waveform spectral element solver Salvus (by the Mondaic ETH spin-off; see Afanasiev et al., 2019). We used a ricker wavelet source centred at 50 Hz to correctly simulate our sledgehammer shot (having power frequency in the range 10–90 Hz), adopting an adaptive mesh of 10 elements per wavelength and absorbing external boundaries with 100 receivers spaced 1 m apart (see Salvus documentation in Afanasiev et al., 2019). Figure 3 shows the results of the schematic layered model for the Schafberg structure, in one case without LVL within the structure (Fig. 3a and c) and in the other case adding a 1 m thick LVL with Vp=400 m s−1, Vs=220 m s−1, and δ=1.6 g cm−3 (Fig. 3b and d). For both models, the other parameters are Vp=600 m s−1, Vs=400 m s−1, and δ=1.9 g cm−3 in the upper debris; Vp=3000 m s−1, Vs=1600 m s−1, and δ=2.0 g cm−3 in the ice-rich layer; and Vp=4000 m s−1, Vs=2200 m s−1, and δ=2.3 g cm−3 in the bottom layer.
The presence of a thin LVL consisting of fine sediments significantly increases the complexity of the shot gather (see Fig. 3c and d). The synthetic seismograms confirmed the field results: the seismogram with an LVL shows a phase change that is not present in the seismogram without an LVL. In the synthetic model with the LVL, the polarity of the first arrivals of the refracted waves is in fact reversed compared to the phases of the direct waves (from the negative phase in blue to the positive phase in red). On the contrary, in the absence of an LVL, the direct and refracted waves retain the same polarity without phase change (see Fig. 3c). Furthermore, the synthetic shot gather in Fig. 3d is very similar to the actual shot gather collected at Schafberg (Fig. 1d), where borehole stratigraphy confirmed the presence of a thin, fine-sediment layer above a high-velocity, ice-rich layer (Phillips et al., 2023). This observation suggests that the observed polarity reversal at Schafberg and Flüela Pass (also observed at other sites not presented here for brevity) may be due to the presence of an LVL of finer sediments accumulating on top of the ice-rich layers. This thin LVL is difficult to detect by geophysical imaging because conventional ERT does not have the necessary resolution and SRT is incompatible with velocity inversion at depth. This thin LVL may play a relevant role in the hydrological behaviour of supra-permafrost water fluxes in rock glaciers (Jones et al., 2019), most likely composed of low-permeability fine sediments. This LVL may, for example, help the ice-rich layer to act as an aquiclude (Pavoni et al., 2023b) or favour local water accumulation (Haeberli et al., 2001). Therefore, the simple observation of phase reversal in the shot-gather of the seismic refraction dataset can be interpreted as a proxy for complex subsurface structure, and this cannot exclude the presence of fine sediments overlying the massive ice-rich zone. Once the possible presence of an LVL has been suggested, future perspectives may include its characterisation, both in terms of thickness and continuity, by specifically designed surveys as very high-resolution ERT (i.e. with very little electrodes spacing) or detailed surface wave analyses (Barone et al., 2021).
All the raw data are available at https://doi.org/10.5281/zenodo.11505034 (Boaga, 2024).
The supplement related to this article is available online at: https://doi.org/10.5194/tc-18-3231-2024-supplement.
JB developed the concept of the study. AB, JB, SW, and MP were involved in data acquisition. MP and JB performed the data processing. All authors contributed to the writing and editing of the paper.
The contact author has declared that none of the authors has any competing interests.
Publisher's note: Copernicus Publications remains neutral with regard to jurisdictional claims made in the text, published maps, institutional affiliations, or any other geographical representation in this paper. While Copernicus Publications makes every effort to include appropriate place names, the final responsibility lies with the authors.
This article is part of the special issue “Emerging geophysical methods for permafrost investigations: recent advances in permafrost detecting, characterizing, and monitoring”. It is not associated with a conference.
This work has been funded by the “Progetto di Eccellenza Dipartimento di Geoscienze Università di Padova” from the Italian Ministry of University and Research.
This paper was edited by Sebastian Uhlemann and reviewed by Hansruedi Maurer and one anonymous referee.
Afanasiev, M., Boehm, C., van Driel, M., Krischer, L., Rietmann, M., May, D. A., Knepley M. G., and Fichtner, A.: Modular and flexible spectral-element waveform modelling in two and three dimensions, Geophys. J. Int., 216, 1675–1692, 2019.
Anandakrishnan, S.: Dilatant till layer near the onset of streaming flow of Ice Stream C, West Antarctica, determined by AVO (amplitude vs offset) analysis, Ann. Glaciol., 36, 283–286, 2003.
Barone, I., Boaga, J., Carrera, A., Orozco, A., and Cassiani, G.: Tackling Lateral Variability Using Surface Waves: A Tomography-Like Approach, Surv. Geophys., 42, 317–338, 2021.
Bast, A., Kenner, R., and Phillips, M.: Short-term cooling, drying and deceleration of an ice-rich rock glacier, EGUsphere [preprint], https://doi.org/10.5194/egusphere-2024-269, 2024.
Blanchy, G., Saneiyan, S., Boyd, J., McLachlan, P., and Binley, A. ResIPy, an intuitive open source software for complex geoelectrical inversion/modeling, Comput. Geosci., 137, 104423, https://doi.org/10.1016/j.cageo.2020.104423, 2020.
Boaga, J.: Data fluela schafberg, Zenodo [data set], https://doi.org/10.5281/zenodo.11505034, 2024.
Boaga, J., Phillips, M., Noetzli, J., Haberkorn, A., Kenner, R., and Bast, A.: A Comparison of Frequency Domain Electro-Magnetometry, Electrical Resistivity Tomography and Borehole Temperatures to Assess the Presence of Ice in a Rock Glacier, Front. Earth Sci., 8, 54–62, https://doi.org/10.3389/feart.2020.586430, 2020.
Duvillard, P. A., Revil, A., Qi, Y., Soueid Ahmed, A., Coperey, A., and Ravanel, L.: Three-Dimensional Electrical Conductivity and Induced Polarization Tomography of a Rock Glacier, J. Geophys. Res., 123, 9528–9554, 2018.
Haeberli, W., Kääb, A., Vonder Mühll, D., and Teysseire, P.: Prevention of outburst floods from periglacial lakes at Grubengletscher, Valais, Swiss Alps, J. Glaciol., 47, 111–122, 2001.
Harvey, N.: Seismic Refraction, in: Encyclopedia of Modern Coral Reefs. Encyclopedia of Earth Sciences Series, edited by: Hopley, D., Springer, Dordrecht, ISBN 978-90-481-2639-2, 2011.
Hauck, C., Böttcher, M., and Maurer, H.: A new model for estimating subsurface ice content based on combined electrical and seismic data sets, The Cryosphere, 5, 453–468, https://doi.org/10.5194/tc-5-453-2011, 2011.
Hilbich, C.: Time-lapse refraction seismic tomography for the detection of ground ice degradation, The Cryosphere, 4, 243–259, https://doi.org/10.5194/tc-4-243-2010, 2010.
Jones, D. B., Harrison, S., Anderson, K., and Whalley, W. B.: Rock glaciers and mountain hydrology: A review, Earth-Sci. Rev., 193, 66–90, https://doi.org/10.1016/j.earscirev.2019.04.001, 2019.
Leopold, M., Williams, M.W., Caine, N., Völkel, J., and Dethier, D. Internal structure of the Green lake 5 rock glacier, Colorado Front Range, USA, Permafr. Periglac. Process., 22, 107–119, 2011.
Musil, M., Maurer, H., Green, A.G., Horstmeyer, H., Nitsche, F. O., Mühill, D. V., and Springman, S.: Shallow seismic surveying of an Alpine rock glacier, Geophysics, 67, 1701–1710, 2002.
Pavoni, M., Boaga, J., Carrera, A., Urbini, S., de Blasi, F., and Gabrieli, J.: Combining Ground Penetrating Radar and Frequency Domain Electromagnetic Surveys to Characterize the Structure of the Calderone Glacieret (Gran Sasso d'Italia, Italy), Remote Sens., 15, 2615, https://doi.org/10.3390/rs15102615, 2023a.
Pavoni, M., Boaga, J., Carrera, A., Zuecco, G., Carturan, L., and Zumiani, M.: Brief communication: Mountain permafrost acts as an aquitard during an infiltration experiment monitored with electrical resistivity tomography time-lapse measurements, The Cryosphere, 17, 1601–1607, https://doi.org/10.5194/tc-17-1601-2023, 2023b.
Pavoni, M., Boaga, J., Wagner, F. M., Bast, A., and Phillips, M.: Characterization of rock glaciers environments combining structurally-coupled and petrophysically-coupled joint inversions of electrical resistivity and seismic refraction datasets, J. Appl. Geophys., 215, 105097, https://doi.org/10.1016/j.jappgeo.2023.105097, 2023c.
Phillips, M., Buchli, C., Weber, S., Boaga, J., Pavoni, M., and Bast, A.: Brief communication: Combining borehole temperature, borehole piezometer and cross-borehole electrical resistivity tomography measurements to investigate seasonal changes in ice-rich mountain permafrost, The Cryosphere, 17, 753–760, https://doi.org/10.5194/tc-17-753-2023, 2023.
Rücker, C., Günther, T., and Wagner, F. M.: pyGIMLi: An open-source library for modelling and inversion in geophysics, Comput. Geosci., 109, 106–123, https://doi.org/10.1016/j.cageo.2017.07.011, 2017.
Vonder Mühll, D. and Holub, P.: Borehole logging in Alpine permafrost, Upper Engadin, Swiss Alps, Permafrost Periglac. Process., 3, 125–132, 1992.