the Creative Commons Attribution 4.0 License.
the Creative Commons Attribution 4.0 License.
 | 20 Nov 2023
Observations of preferential summer melt of Arctic sea-ice ridge keels from repeated multibeam sonar surveys
Evgenii Salganik
Benjamin A. Lange
Christian Katlein
Ilkka Matero
Philipp Anhaus
Morven Muilwijk
Knut V. Høyland
Mats A. Granskog
Sea-ice ridges constitute a large fraction of the total Arctic sea-ice area (up to 40 %–50 %); nevertheless, they are the least studied part of the ice pack. Here we investigate sea-ice melt rates using rare, repeated underwater multibeam sonar surveys that cover a period of 1 month during the advanced stage of sea-ice melt. Bottom melt increases with ice draft for first- and second-year level ice and a first-year ice ridge, with an average of 0.46, 0.55, and 0.95 m of total snow and ice melt in the observation period, respectively. On average, the studied ridge had a 4.6 m keel bottom draft, was 42 m wide, and had 4 % macroporosity. While bottom melt rates of ridge keel were 3.8 times higher than first-year level ice, surface melt rates were almost identical but responsible for 40 % of ridge draft decrease. Average cross-sectional keel melt ranged from 0.2 to 2.6 m, with a maximum point ice loss of 6 m, showcasing its large spatial variability. We attribute 57 % of the ridge total (surface and bottom) melt variability to keel draft (36 %), slope (32 %), and width (27 %), with higher melt for ridges with a larger draft, a steeper slope, and a smaller width. The melt rate of the ridge keel flanks was proportional to the draft, with increased keel melt within 10 m of its bottom corners and the melt rates between these corners comparable to the melt rates of level ice.
- Article
(5341 KB) - Full-text XML
- BibTeX
- EndNote


According to the definition by the World Meteorological Organization, an ice ridge is a line or wall of broken ice that is forced up by pressure (WMO, 2014). Ridges consist of a sail above and a keel below the water level. The keel initially consists of randomly packed ice blocks separated by water-filled voids, described by the ridge macroporosity (fraction of water-filled voids in the keel). The initial macroporosity of first-year ice ridges is in the range of 20 %–45 % (Bowen and Topham, 1996), with an average porosity of 30 % (Timco and Burden, 1997). The upper part of ridge keels usually refreezes, forming a consolidated layer defined by zero macroporosity. Some ridges become fully consolidated (with near-zero keel macroporosity) during the melt season (Marchenko, 2022). The measurements collected in the Arctic Ocean during the Multidisciplinary drifting Observatory for the Study of the Arctic Climate (MOSAiC) expedition (Nicolaus et al., 2022) showed that complete consolidation of ridges may occur during the spring season before the melt onset through the transfer of snow into ridge keels via open leads (Salganik et al., 2023a) or ice deformation, which was supported by 6 %–11 % estimates of snow mass fraction within several ridges (Lange et al., 2023). Ice ridges are key features in climate studies since they constitute around 30 % of the total Arctic sea-ice volume based on ice–ocean coupled modelling (Rothrock, 2005). Mårtensson et al. (2012) used a multicategory sea-ice model to estimate the Arctic sea-ice ridge volume of 45 %–60 % and ridge area of 25 %–45 %. Melling and Riedel (1996) observed an increase in ridge areal fraction from 15 % in autumn to 40 %–50 % in spring based on subsea sonar ice draft measurements in the Beaufort Sea in 1991–1992. However, the proportion of ridges varies depending on the region and how they are defined. Fram Strait serves as the main outlet of the Arctic sea-ice export (Krumpen et al., 2016), and for that region, Hansen et al. (2014) estimated the fraction of deformed ice to be 37 ± 8 %, using an evolving threshold relative to the modal thickness derived from draft measurements by moored upward-looking sonars during 1990–2011. In those observations, the ridge fraction increased in 1990–2008 and decreased thereafter, which was confirmed by Sumata et al. (2023) using extended data from the same upward-looking sonars in Fram Strait for 1990–2020. Furthermore, ridges have also been identified as potential biological hotspots (Gradinger et al., 2010; Fernández-Méndez et al., 2018) and as influencing the light conditions beneath the ice (Katlein et al., 2021).
Sea-ice ridges can be formed from new, young, first-year, second-year, or multiyear level ice, or from a combination of ice types. Typically, ridges are made from relatively thin ice (Tucker et al., 1984), which breaks as the weakest points during deformation events. Ridges themselves can also be first year, second year, or multiyear, depending on how many seasons they have survived. The maximum keel draft is limited by the ice strength and is correlated with the adjacent level ice draft (Amundrud et al., 2004). Once the keel has reached its maximum possible draft, it thereafter only grows in width (Hopkins, 1998).
Previous research has suggested that ridges impact the melt rates of the ice. For instance, Rigby and Hanson (1976) showed enhanced bottom melt of a ridge keel in comparison with thinner ice, although mechanical erosion could not be ruled out for this large ridge with a maximum total thickness of 10–12 m. During the SHEBA expedition in the Beaufort and Chukchi seas, Perovich et al. (2003) used data from single-point measurements from hot-wire thickness gauges and measured 60 % higher bottom melt for second-year and multiyear ice ridges (42 gauges) than for multiyear level ice (89 gauges) during the entire melt season from early June to early October 1998. Meanwhile, Skyllingstad et al. (2003) measured enhanced vertical mixing and a five-fold increase in ocean heat flux (OHF) for a 10 m-deep ridge during the winter season at SHEBA expedition using high-frequency measurements of seawater temperature, salinity, and velocity. The same effect is also likely in summer, but this does not take into account the shallow meltwater stratification that develops in summer and affects ice melt rates (Salganik et al., 2023d). Amundrud et al. (2006) estimated that ridge keels melt four to five times faster than level ice based on the observations from ice-profiling sonars mounted on subsea moorings in the Beaufort Sea (however, their data do not repeatedly measure the same ice due to sideway ice drift). Furthermore, Shestov et al. (2018) observed ridge melt in summer during the N-ICE2015 expedition (Granskog et al., 2018) in the pack ice north of Svalbard (Norway) using single-point measurements from a temperature buoy. Here, the average OHF under level ice was 63 W m−2 (Peterson et al., 2017), while the ridge keel melted by 1.5 m over 2 weeks, which translates into an equivalent OHF of 300 W m−2 (with macroporosity of 27 % taken into account) and is 4.8 times higher than for level ice (Shestov et al., 2018). Based on the thermodynamic model developed by Amundrud et al. (2006), several parameters, such as keel width and shape, may impact keel melt, with ridge macroporosity and block thickness being key factors. In summary, the observed ratio of ridge and level ice accumulated melt in previous studies ranged from 60 % to 400 % even for similar geographical locations, suggesting the need for a more detailed investigation of the spatial and temporal variability of melting of different ice types.
The first direct measurements of under-ice topography were linear profiles from narrow-beam upward-looking sonar (Lyon, 1961). Wadhams et al. (2006) and Wadhams and Doble (2008) were the first to use an autonomous underwater vehicle instrumented with a multibeam sonar to study the three-dimensional bottom topography of Arctic sea ice. Using multibeam mapping by a submarine, Wadhams and Toberg (2012) found a mean slope of first-year and multiyear ridge keels of 28∘ and 25∘, respectively, assuming a triangular shape. Ekeberg et al. (2015) analysed the shape of ridge keels using data from upward-looking sonar in Fram Strait and suggested that ridge keels typically have a trapezoidal shape, with the keel bottom width accounting for an average of 17 % of the keel total width.
Although ridges play an important role in the evolution of the Arctic ice pack, they are understudied compared with the level ice that is usually sampled. The aforementioned studies are also typically limited to a one-time snapshot and a few point measurements. In this study, we use novel repeated multibeam ice draft measurements that follow the temporal and spatial evolution of a first-year sea-ice ridge and adjacent level ice during summer melt collected in the Arctic Ocean during the MOSAiC expedition in 2020. Over a period of 1 month, we observed ice draft changes and melt rates for first- and second-year level ice and a first-year ice ridge. Additionally, we identified key characteristics of the ice bottom topography that affected the melt rates.
In the first two sections of this study, we provide estimates of the total melt for level ice and ridge. In the third section, we analyse the effect of ridge cross-sectional characteristics on its melt. In the fourth section, we provide estimates of surface and bottom melt for level ice and ridge. In the fifth and sixth sections, we discuss how meltwater drainage and sea-ice density temporal evolution affect the sea-ice draft. In the seventh and eighth sections, we compare our estimates of the ridge enhanced melt with previous observations and discuss the limitations of this study. The use of underwater multibeam sonar allows collection of over 105 measurements of sea-ice draft and over 104 ridge draft measurements every week. In comparison with point measurements from temperature buoys (Shestov et al., 2018), ice coring, and thickness gauges (Perovich et al., 2003), remotely operated vehicle (ROV) sonar measurements increase the number of draft data points by three orders of magnitude, revealing the small-scale spatial variability of sea-ice melt in unprecedented detail. In comparison with moored subsea sonar ice draft measurements (Amundrud et al., 2006), repeated ROV surveys allowed us to study the same sea ice repeatedly for a longer period with high spatial resolution and reduced uncertainty in measured melt rates.
2.1 Expedition
The MOSAiC expedition took place in 2019–2020 to better understand the coupled Arctic ice, ocean, and atmosphere system, as well as the sea-ice mass and energy budget over a full season, and included a range of snow and sea-ice measurements (Nicolaus et al., 2022). The MOSAiC Central Observatory, an approximately 3 by 4 km large ice floe, drifted for 10 months across the central Arctic starting from 4 October 2019, following the Transpolar Drift, until it reached the ice edge in Fram Strait and broke apart on 31 July 2020 (Fig. 1b). The OHF estimate from ice mass balance buoys (IMBs) increased from 11 to 40 W m−2 during July 2020 (Salganik et al., 2023d), with an average value of 24 W m−2, comparable to the summer OHF estimates of 20–30 W m−2 for Beaufort Gyre and Transpolar Drift in 1979–2002 (Krishfield, 2005). The OHF increase took place in mid-July, the period with the highest annual solar insolation and with a reduction in sea-ice concentration from 100 % to 85 % within a 3 km radius of the Central Observatory (Krumpen et al., 2021). Combined, this led to a higher solar heat input and, hence, warming of the mixed layer (Fig. 1d). Despite the floe also drifting further south towards Fram Strait and getting closer to shallower and warmer Atlantic Water at the same time, the mixed layer and upper ocean conditions still retained their Arctic characteristics. This is evident through the observation of remarkably low heat fluxes over the halocline (−0.01 ± 0.30 W m−2) and thermocline (+2.1 ± 1.2 W m−2) in Fram Strait during melt season (Schulz et al., 2023a). This shows that the conditions are representative of the seasonally driven OHF typical for the central Arctic and are not driven by excessive OHF in the marginal ice zone or from Atlantic Water, as observed by, for example, Shestov et al. (2018).
Due to logistical reasons, the ridge investigations during MOSAiC were performed at several sites. During January–February and June–July 2020, Alli's ridge was studied using ice coring and IMBs, while in June–July 2020, Jaridge was studied using underwater sonar surveys, ice coring, and IMB. The measurements of Alli's ridge draft included only four ice coring sites visited before and during melt season (Salganik et al., 2023a) and will be used only as a reference for the Jaridge investigations presented here.

Figure 1Panel (a) shows ice bottom temperature for first-year ice (FYI), second-year ice (SYI), and ridge from coring. Panel (b) shows an overview map of the study area with drift of the MOSAiC ice floe for ROV multibeam sonar observations from 24 June to 28 July 2020. Panel (c) shows surface photography with the investigated ice ridge internal sail structure on 4 July 2020. Panel (d) shows water temperature and water freezing temperature from microstructure profiles (MSS) at 5 m depth. Panel (e) shows the structure of a sea-ice ridge. Displayed bathymetric data in (b) are from ETOPO2 (National Geophysical Data Center, 2006), and displayed ice edges in (b) are derived from the AMSR-2 sea-ice concentration (SIC) product for thresholds of 15 % and 80 % on 28 July 2020 (Spreen et al., 2008).
2.2 Ridge drilling
In this study, we focus primarily on the evolution of a ridge called “Jaridge”. Jaridge was formed between 4 and 12 February 2020, based on the visual inspection of sea-ice surface elevation models from an airborne laser scanner (Jutila et al., 2023). The ice blocks forming the ridge were 0.2–0.4 m thick (Fig. 1c), the average sail height was 0.5 m, and the average draft was 3.8 m. It was formed between level first-year ice and level second-year ice. We investigated ridge morphology using a 2-inch-diameter ice auger (Kovacs Enterprise, Oregon, USA) and thickness tape to measure the snow or ice interface position. Ice drilling was organized along seven drilling transects perpendicular to the ridge crest orientation (Fig. 2a). Each transect contained three to seven drilling locations with measurements of ice draft, freeboard, depth of ridge voids, and snow thickness at a horizontal spacing of 2.5 or 5 m (Fig. 2b). The ridge was measured seven times, between 25 June and 29 July, with a total of 47 drill holes during the summer melt season when located over the Yermak Plateau and Fram Strait (79.4–82.1∘ N, 2.8∘ W–10.2∘ E; Fig. 1b). Jaridge covered 12 % of the area of sonar surveys, which included four classified ice types (Fig. 2c). Another shallower ridge, “Porridge”, was also located within the survey area but only mapped with the multibeam sonar. The area at the top right quarter of sonar surveys was heavily covered with false bottoms during 7–29 July (Salganik et al., 2023d) and was therefore excluded from our analysis.
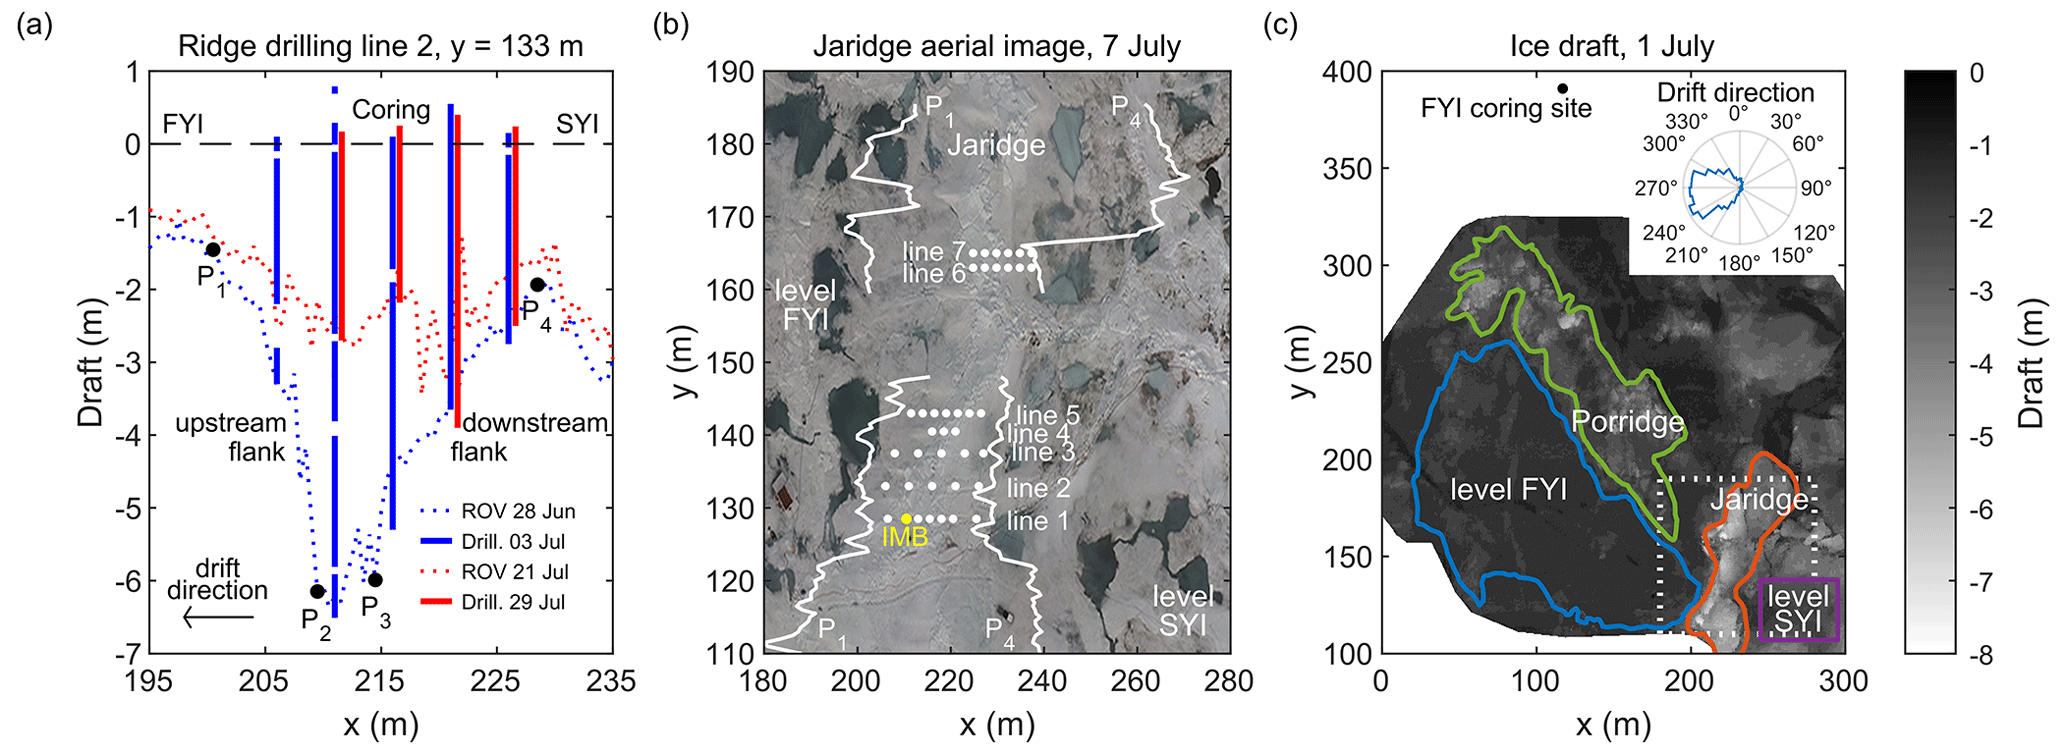
Figure 2Panel (a) shows a cross-section of ice draft in late June and late July 2020 along drilling line 2. The blue and red vertical lines are drill holes: the solid lines are ice, the line breaks are voids, and the dotted lines are ROV sonar draft measurements. Corners P1−4 represent trapezoidal ridge shape. Panel (b) shows the locations of ridge drillings, ice mass balance buoy (IMB), and keel width boundaries P1 and P4 of Jaridge on an optical helicopter-borne aerial image from 7 July from Neckel et al. (2023). Panel (c) shows the ice bottom topography on 1 July 2020, measured by remotely operated vehicle (ROV) multibeam sonar, showing the locations of first-year ice (FYI), second-year ice (SYI), Jaridge and Porridge, and the location of (b) inside the white dotted-line box. The polar histogram in (c) shows the frequency of ice drift direction in relation to the displayed ice floe orientation, with prevailing drift in the western direction.
To study the temporal evolution of the ridge interfaces, we used temperature measurements from IMB 2020M26 (Bruncin d.o.o., Zagreb, Croatia). The IMB consisted of a 5 m-long thermistor chain with a sensor spacing of 2 cm and provided temperature readings every 6 h with an accuracy of 0.1 ∘C and daily heating-induced temperature difference measurements after a cycle of internal heating, allowing us to identify the location of snow–ice and ice–water interfaces with high precision (Jackson et al., 2013). The IMB was installed on 26 June 2020 at the ridge drilling line 1 (Fig. 2b). At the IMB site upon deployment, the consolidated layer thickness was 1.9 m, the keel draft was 4.0 m, and the snow depth was 0.6 m. Temperature, salinity, and isotope compositions from Jaridge coring are presented in Lange et al. (2023), with a ridge bulk salinity of 1.8–2.8 and a snow mass fraction of 6 %–11 %.
2.3 Underwater multibeam sonar
We use a multibeam sonar (DT101, Imagenex, BC, Canada) mounted on a remotely operated vehicle (ROV; M500, Ocean Modules, Åtvidaberg, Sweden; after Katlein et al., 2017) to measure ice draft in an area of approximately 350 by 200 m, with 0.05 m vertical accuracy and 0.5 m horizontal resolution. The surveys were done in a grid pattern with a distance between lines of 20–25 m. The sonar had 480 beams with an across track swath width of 120∘ (64 m width for level ice), an along track swath width of 3∘, an effective beam width of 0.75∘, and an angular resolution of 0.25∘. Seven surveys at a depth of 20 m were performed during the melt season (24 June to 28 July), close to the floe edge of the MOSAiC Central Observatory (Nicolaus et al., 2022), covering an area with undeformed ice and several ice ridges, including the Jaridge (Fig. 1b). In our analysis, we mostly use the first six sonar surveys, as ice deformations decreased the co-location accuracy of sea-ice ridges for the previous survey.
2.4 Ridge morphology analysis
To quantify how ridge characteristics affect melt rates, we divided our ridge draft multibeam observations into 131 individual cross-sections that were nearly parallel to the direction of ice drift during June–July. The distance between neighbouring cross-sections was 0.5 m. We determined the following characteristics for each cross-section: keel bottom width, draft, slope, and distance from the keel front. To quantify these parameters with a single value, we simplified each cross-section to a trapezoidal shape, following Ekeberg et al. (2015). Four points of these trapezoids (P1–P4 in Fig. 2a) coincide with the largest transition of the smoothed inclination of ridge cross-sections, separating each cross-section into an upstream flank, keel bottom, and downstream flank (locations of P1 and P4 are shown in Fig. 2b). The upstream flank was facing the ice drift direction, while the downstream flank was on the leeside of the prevailing ocean current relative to the ice (Fig. 2c). The keel bottom width is equal to the horizontal projection of the keel bottom (P2–P3), while the keel draft is equal to the average draft of the keel bottom. The keel slope is defined as the angle between the upstream flank and the waterline. A tangent straight line “touching” the initial position of all P2 points of cross-sections (upstream bottom corners) on 24 June is the keel front (Fig. 4c). The distance from P2 of each cross-section to the keel front was identified as one of the factors for studying ridge melt rates.
2.5 Relationship between sea-ice draft and thickness
This study focuses on the measurements of sea-ice draft, while the draft evolution may provide only an estimate of sea-ice melt as it involves several complex processes affecting the parameters required for such conversion. Under the assumption of hydrostatic equilibrium, the sea-ice draft decrease equals the thickness of surface and bottom melt multiplied by snow and sea-ice density, respectively, and divided by water density (Fons et al., 2023). For various remote sensing measurements, including satellite altimetry (Landy et al., 2022) and upward-looking sonars (Sumata et al., 2023), the sea-ice density is assumed to be constant, although considering sea-ice density seasonal evolution may improve the accuracy of satellite ice thickness retrievals (Fons et al., 2023). In Sects. 3.1–3.4, we compare raw measurements of draft change and estimates of sea-ice melt under the assumption of a constant draft-to-thickness ratio of 0.9.
We used the ridge drilling described in Sect. 2.1 to study the relationship between ridge draft, freeboard, snow thickness, and macroporosity. Additionally, we performed sea-ice density measurements from cores extracted from Jaridge as well as from the other ridge within the MOSAiC floe. To study the evolution of level ice draft, thickness, and interface evolution, we used data from the first-year ice (FYI) coring site located 70 m away from the ridge surveys (Fig. 2c), further detailed in Salganik et al. (2023d). These observations included a combination of IMB temperature measurements and sea-ice coring conducted on a weekly basis, with measurements of FYI temperature, salinity, and density, as well as snow and ice thickness and draft from 20–30 sea-ice cores per week. In Sects. 3.5–3.6, we present our measurements of sea-ice density and draft-to-thickness ratio evolution and show how these measurements can refine the estimates of sea-ice melt for different ice types. In our sea-ice density estimates, the gas fraction was calculated from laboratory hydrostatic measurements of sea-ice density with an error below 2 % (Pustogvar and Kulyakhtin, 2016), while brine volume was calculated from in situ temperature and salinity measurements (Cox and Weeks, 1983).
3.1 Level ice melt
In this study, we focus on the observed difference in sea-ice draft between the sonar surveys from 24 June to 21 July due to the large spatial variability in melt rates. During this period, an area of undeformed FYI (Fig. 2c) with an initial draft of 1.4 ± 0.2 m experienced a 0.42 ± 0.26 m decrease in draft, while an area of undeformed SYI with an initial draft of 2.6 ± 0.7 m decreased by 0.50 ± 0.31 m (20 % more than FYI). A shallow ridge (“Porridge”) with an initial draft of 2.3 ± 0.8 m (similar to SYI) experienced a 0.54 ± 0.61 m decrease in draft. FYI draft decrease had a positive correlation with its initial draft, with a regression slope of 0.47. Such a relationship may be related to the strong vertical stratification of the ocean mixed layer observed in July (Fer et al., 2022). Skyllingstad et al. (2003) suggested that fresh water insulates sea ice if turbulent mixing is weak, while thicker ice and ridges are efficient at forcing turbulence in the fresh layer. This agrees with our measurements of FYI, SYI, and ridge bottom temperatures (Fig. 1a), where thinner ice was more strongly affected by meltwater for a longer time, which led to a lower OHF.
3.2 Ridge morphology and keel melt
Repeated ridge drilling showed that Jaridge keel melt was very variable (Fig. A1). The average melt along ridge drilling lines 1–3 (Fig. 2b) was 1.7 m, while ridge flanks melted up to 4.5 m. For the ROV sonar surveys, the average draft change of the ridge area was 0.9 ± 1.0 m with an average initial draft of 3.9 ± 1.1 m (Fig. 3a). The maximum ridge draft decreased from 8.2 to 7.0 m, while the largest observed ridge draft reduction was 5.6 m (not including areas with mechanical erosion). The average keel slope was 14–15∘ for both flanks, half of that reported by Wadhams and Toberg (2012), possibly because of the larger 5 m minimum ridge draft threshold used in their study. The average initial fraction of keel bottom width (P2–P3 in Fig. 2a) to keel width (P1–P4) was 38 %, twice as large as the 17 % estimated by Ekeberg et al. (2015), possibly related to the larger maximum cross-sectional keel bottom draft (7.2 m in comparison with our 5.3 m) and 5 m keel draft threshold. The co-location of ridge draft measurements from drilling and sonar showed good agreement between the two draft measurement techniques (R2=0.8; Fig. A1). According to the individual observations of ice draft evolution from multibeam sonar, the melt of ridge flanks stronger (1.7 times larger regression slope) depended on the ice draft in comparison with the melt of the keel bottom (Fig. 3b). The average melt at the same depth was higher for flanks than for keel bottom. For example, for an ice draft larger than 4 m, the average draft change for the upstream flank, keel bottom, and downstream flank was 1.3, 1.0, and 1.4 m, respectively. Figure 3b can be used to predict the ridge melt relative to level ice melt, depending only on the ridge draft and a fraction of the keel bottom width. On average, ridge flanks and keel bottom were melting 1.7 and 2.0 times faster than FYI at the coring site. A higher average melt rate for the keel bottom was related to a higher average initial draft for the keel bottom (4.4 m) than for the flanks (3.1 m).
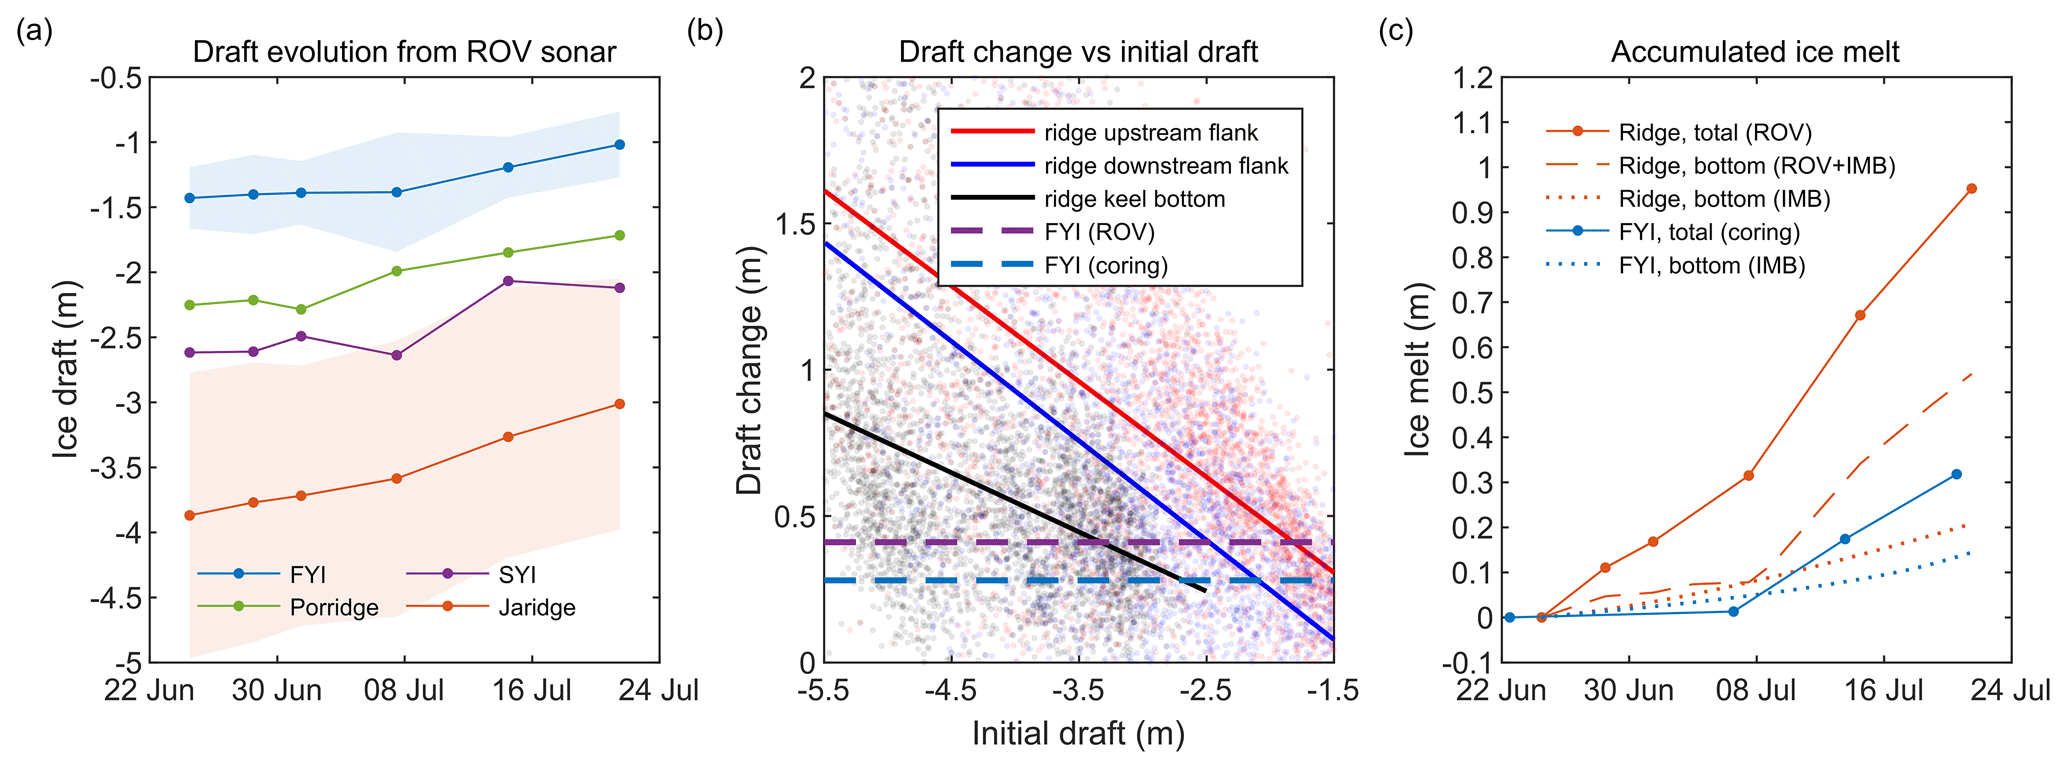
Figure 3Panel (a) shows the evolution of the average sea-ice draft measured by an ROV multibeam sonar for first-year ice (FYI), second-year ice (SYI), as well as Porridge and Jaridge during June–July 2020. Panel (b) shows the draft change for single-point sonar measurements of ridge upstream and downstream flanks and keel bottom, corresponding linear regression with solid lines, and average draft change for FYI coring site. Panel (c) shows accumulated ice melt for ridge and FYI estimated from ROV multibeam sonar, ice mass balance buoy (IMB), and ice coring measurements. Shaded areas in (a) represent standard deviations of draft measurements.
3.3 Ridge cross-sectional melt
Based on the results of multiple linear regression analysis, keel draft, slope, bottom width, and distance to the keel front (Fig. 4c) are responsible for 57 % (coefficient of determination R2) of ridge melt variability, with 37 % positive correlation with keel draft, 32 % positive correlation with keel slope, 27 % negative correlation with keel bottom width, and 11 % negative correlation with distance from the keel front. The roughness of the ridge keel, characterized by its draft standard deviation, did not have a significant effect on the ridge melt. The large correlation of ridge melt with its draft may be explained by a combination of both higher ice melt and lower keel width for larger drafts. Based on ridge drilling observations from this study and from another examined ridge during MOSAiC (Salganik et al., 2023a), the flanks of ridge keels are usually less consolidated, which may be coupled with higher ocean turbulence at the ridge flanks in comparison with the keel bottom.
The keel bottom width ranged from 1 to 35 m with an average of 13 ± 9 m, and the highest melt was observed around the ridge left and right bottom corners (P2 and P3) within a diameter of 10 m (Fig. 4a). For wide profiles, it was possible to distinguish keel melt around two bottom corners and in the keel bottom between them. While areas within 10 m around the upstream bottom corner (P2) melted on average by 1.2 m, the keel bottom outside 10 m surroundings around both corners (P2 and P3) melted by 0.5 m (similar to level ice melt rates despite a much larger ice draft). We also found that all ridge cross-sections that had both narrow keel bottom width and low keel melt were located within two areas (Fig. 4c) and were characterized by a large distance from the keel front. (Their upstream flanks were shifted towards the ridge interior.) Exclusion of profiles from these two areas would increase the correlation (R2) between keel melt and keel bottom width from 27 % to 57 % alone (Fig. 4b). We suggest that these areas were protected by the keel front from the turbulent fluxes, which appear to occur in the vicinity of the ridge bottom corners (P2 and P3 in Fig. 2a). The ridge at y=148–160 m was not trapezoidal and consisted of separate blocks with patchy draft evolution. This area with mechanical erosion was not included in the correlation analysis but was included in the further comparison of level ice and ridge melt. The mean draft decrease for this area was 1.0 ± 2.1 m, 10 % higher than for the rest of the ridge. The draft decrease of other ridge parts was gradual, and they were fully consolidated, suggesting little mechanical erosion. The strong negative correlation between keel melt and keel bottom width may be explained by the stronger ridge consolidation at its interior parts (Salganik et al., 2023a; Shestov et al., 2018), as well as by the smaller fraction of the keel affected by the enhanced turbulence around the keel bottom corners P2 and P3.
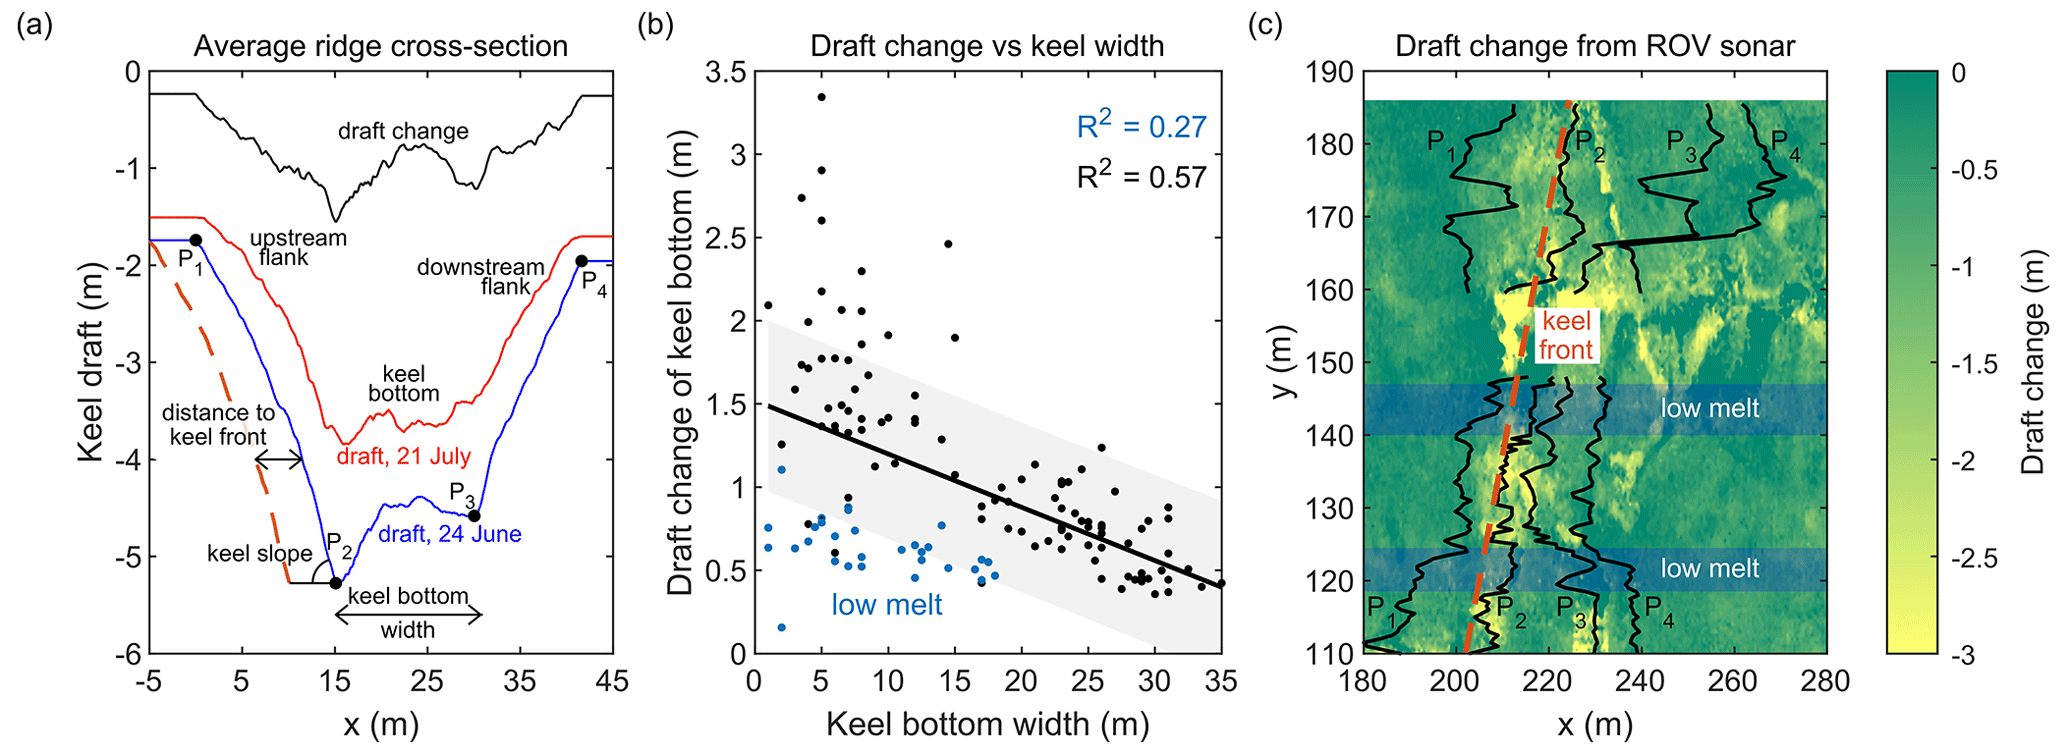
Figure 4Panel (a) shows the average ridge cross-section of ice draft in late June and late July 2020. Panel (b) shows the draft change of keel bottom vs keel bottom width for each ridge cross-section. Panel (c) shows the contour plot of ridge draft change from 24 June to 21 July with locations of ridge corners P1−4 (black lines), keel front (dashed red line), and cross-sections with low total melt and narrow keel width (shaded blue areas).
3.4 Total, surface, and bottom ice melt
In the previous sections, we analysed the draft evolution of several sea-ice types. In addition, it is important to separate surface and bottom melt to study the thermodynamic coupling of sea ice, ocean, and atmosphere. In this section, we assume a constant ratio of sea-ice draft and thickness of 0.9, characteristic of unchanging sea-ice density. From 22 June to 20 July, unponded level ice at the FYI coring site experienced 0.08 m snow melt, 0.18 m surface melt, and 0.14 m bottom melt, with nearly identical draft change (0.34 m) and total melt (0.32 m). At the same time, sonar measurements gave a larger FYI draft change (0.41 m) and hence provided a substantially larger estimate of FYI bottom melt (0.25 m) under the assumption of the same snow and ice surface melt as for the FYI coring site. The reason for such a difference is discussed in Sect. 3.6.
During the same period, the average snow depth (for each drilling survey) above Jaridge decreased from 0.50 to 0.12 m. Temperature and heating-induced temperature difference measurements from IMB indicate a surface ridge melt of 0.24 m. Macfarlane et al. (2023) present an average snow density of 420 kg m−3 in June and July. Assuming 0.24 m of surface melt and 0.38 m of snowmelt for the whole ridge, using sonar measurements, we can estimate the average ridge bottom melt as 0.55 m, or 60 % of the mean ridge total melt of 0.93 m. This may explain why only 57 % of the ridge total melt was related to characteristics of the keel topography. The surface melt of level FYI and the ridge was similar, whereas the ridge bottom melt estimates were 2.2–3.9 times larger than for level FYI.
The average ridge macroporosity measured by drilling in June–July was 4 % ± 7 % for all 47 drilling sites (Fig. A1). Bottom ridge brine volume (5 %–7 %) was lower than for FYI due to lower ridge temperatures (Fig. 1a). This shows that the ridge macroporosity and brine volume fraction have a minor effect on the estimate of the total volume of melted ice based on its draft measurements relative to the difference in melt between various ice types. A study focused on the seasonal evolution of ridge consolidation based on observations from IMBs and ice drilling during MOSAiC showed that the most consolidation occurred during the spring season, while upon melt onset, ridges were already fully consolidated (Salganik et al., 2023a). Following Lei et al. (2022), we used 10 MOSAiC IMBs to estimate an average bottom melt of 0.17 ± 0.07 m for first- and second-year level ice with an average initial thickness of 1.8 ± 0.2 m from 22 June to 20 July, with no significant correlation between the initial ice thickness and bottom melt.
3.5 Effect of meltwater drainage on ice draft
From 7 to 14 July, we observed an unexpected 0.08 m increase in FYI freeboard at the coring site, despite a 0.16 m total melt (Fig. 5a). We suggest that this short-term imbalance is related to surface melt pond drainage observed from 9 to 13 July (Webster et al., 2022), which was accompanied by the formation of an under-ice meltwater layer with 21 % areal coverage and 0.46 m thickness (Salganik et al., 2023d). This suggests that the large decrease in draft (0.30 m) for FYI measured by sonar during 7–14 July was not purely due to ice melt but also included an approximately 0.10 m freeboard increase (Fig. 5d). During that period, independent measurements from FYI coring also showed a substantially larger draft decrease (0.24 m in comparison with a 0.08 m draft change during 14–21 July). Moreover, the total FYI melt from coring during these 2 weeks was 0.16 and 0.14 m, respectively. Our observations also indicate that the increase in FYI freeboard caused by meltwater drainage was reversible (Fig. 5a). It is supported by the rapid recovery of surface melt pond fraction and depth to the values prior to drainage during 13–17 July (Webster et al., 2022).
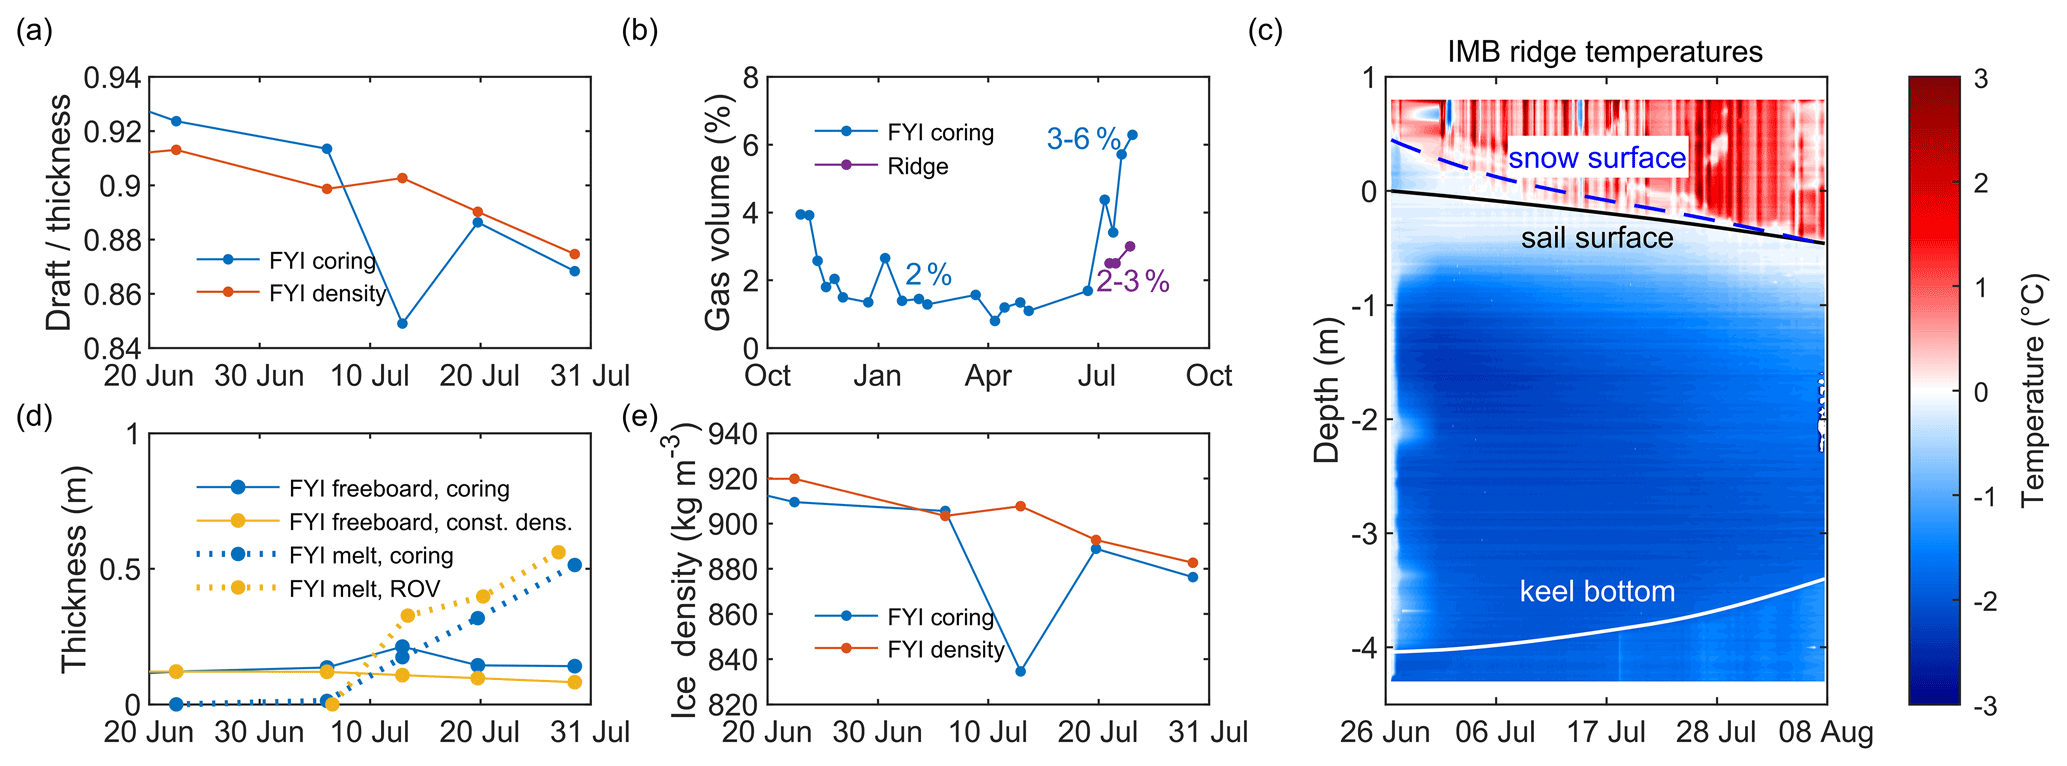
Figure 5Panel (a) shows the evolution of the first-year ice (FYI) draft-to-thickness ratio. Panel (b) shows FYI and ridge gas volume. Panel (c) shows a contour plot of the ridge temperature measurements from IMB buoy 2020M26 with sail surface and keel bottom interfaces from IMB and average snow thickness from the ridge drilling surveys. Panel (d) shows FYI freeboard and total melt. Panel (e) shows FYI density estimated from coring measurements of snow and ice thickness and draft, and from density measurements.
3.6 Effect of sea-ice density on ice draft
Previously, we used a constant ratio of sea-ice draft and thickness to estimate its melt from the draft measurements. Meanwhile, at the coring site, the ratio of FYI draft to thickness gradually decreased from 0.92 on 22 June to 0.87 on 29 July (Fig. 5a). The corresponding estimate of sea-ice bulk density (assuming hydrostatic equilibrium) decreased from 910 to 876 kg m−3, which agrees with a sea-ice density decrease from 914 to 875 kg m−3 from the direct density measurements performed at the FYI coring site (Fig. 5e). During these measurements, the snow at the FYI coring site melted entirely by 20 July from an initial depth of 0.08 m and had a minor effect on the FYI freeboard. The observed sea-ice density decrease was mainly caused by an increase in the gas fraction from 2 % to 6 % (Fig. 5b). We suggest that the decrease in FYI density led to a large difference in FYI total melt estimates from coring thickness measurements (0.34 m) and sonar draft measurements (0.46 m), indicating that the FYI melt from sonar may be overestimated when assuming a constant sea-ice density (Fig. 5d) or draft-to-thickness ratio.
Unlike for the level ice, the ratio of draft to thickness for Jaridge drilling lines was 0.89 ± 0.06 and did not decrease (Fig. A1), while the ridge bulk density estimated from coring measurements on 10 July was 892 kg m−3. The ridge gas volume fraction was 2.5 %–3.0 % (Fig. 5b), while in contrast to the level ice, the ridge was also colder than seawater (Lange et al., 2023). A strong decrease in sea-ice density was not observed at the SYI coring site, with a nearly constant gas fraction during melt season (Salganik et al., 2023d). These measurements suggest that considering the draft-to-thickness ratio dependence on the sea-ice density evolution of different ice types may improve estimates of ice melt from sonar surveys. Therefore, we suggest 3.8 times higher bottom and 3.0 times higher total melt rates for the sea-ice ridge than for FYI. For a typical areal fraction of sea-ice ridges (40 %–50 %), we estimate that they produce 1.7–2.5 times more meltwater than level ice.
The absence of ridge lift during melt season is supported by sonar measurements with a smaller draft change of FYI and SYI (0.24–0.25 m) right next to the ridge in comparison with the average FYI and SYI draft change of 0.41–0.50 m away from the ridge. Measurements from an airborne laser scanner (0.025 m accuracy; Ricker et al., 2023) give a 0.02 m increase in FYI freeboard during 4–17 July, which agrees with the 0.01 m freeboard increase from FYI coring during 6–20 July, supporting our density measurements and upscaling them for the whole FYI area, surveyed by multibeam sonar. Our FYI coring measurements also agree with previous estimates of sea-ice density seasonal evolution (Fons et al., 2023). A gradual increase in FYI freeboard by 0.02 m, from 22 June to 29 July, despite a total FYI melt of 0.52 m, observed at the FYI coring site and mainly caused by the decrease in FYI density, may affect aerial and satellite altimetry retrievals in the Arctic summer.
Measurements of sea-ice bottom melt allow us to estimate the OHF for different ice types, following Shestov et al. (2018). From 24 June to 21 July, calculations based on temperature measurements from the FYI IMB resulted in an average OHF of 17 W m−2, increasing from 11 to 36 W m−2 (Salganik et al., 2023d). A combination of sonar and IMB measurements at the ridge result in an average OHF of 65 W m−2 with averages of 20 W m−2 during 24 June–7 July and 107 W m−2 during 8–21 July, respectively, suggesting larger ridge melt enhancement for lower sea-ice concentrations of 85 % (Krumpen et al., 2021) due to increased solar heat input.
3.7 Comparison with previous observations of enhanced ridge melt
The areas representative for the Arctic sea ice cover are characterized by high ice concentration and comparable surface and bottom level ice melt, while the largest amount of bottom level ice melt occurs in regions with low ice concentration (Perovich et al., 2011). The average accumulated surface/bottom melt of level ice was 0.56/0.50 m for yearlong SHEBA measurements and 0.24/0.31 m for MOSAiC, with measurements until 29 July, covering approximately half of the SHEBA melt season. The average OHF was 18 W m−2 from 3 June to 4 October for SHEBA and 18 W m−2 from 3 June to 29 July for the MOSAiC FYI coring site, similar to the average summer estimates for Beaufort Gyre and Transpolar Drift (Krishfield, 2005). This suggests that level ice melt during MOSAiC was comparable to that of SHEBA, with a surface and bottom melt ratio typical for areas with high ice concentration. Despite a deeper ridge keel with a 6 m total ice thickness on SHEBA, the enhanced ridge bottom melt relative to level ice was only 60 % (Perovich et al., 2003) in comparison with 280 % for MOSAiC with an average keel draft of 3.9 m and a sail height of 0.5 m. This difference could be related to the older (second-year and multiyear) SHEBA ridges or to the substantially smaller areal coverage of SHEBA ridge measurements. Second- and multiyear ice ridges surveyed by Perovich et al. (2003) are typically smooth, fully consolidated, and have low sea-ice salinity, as observed previously by Kovacs et al. (1973); and this may affect turbulence around old ridges. With only 14 stakes at the second-year ridge during SHEBA, in comparison with over 104 ridge draft measurements for MOSAiC, the latter captures the whole range of different melt rates.
The oceanographic conditions during N-ICE2015 were substantially different from those of both SHEBA and MOSAiC due to the proximity to Atlantic Water, with the average OHF under level ice of 63 W m−2 during 10–19 June 2015 (Peterson et al., 2017), six times higher than for MOSAiC during the same period. The enhanced OHF for ice ridges during N-ICE2015, observed by Shestov et al. (2018), is based on one single-point measurement of bottom ridge melt from a temperature buoy and an OHF estimate from turbulence instrument clusters for level ice. The keel macroporosity of the ridge studied by Shestov et al. (2018) was 8 % (higher than the 4 % for MOSAiC, possibly due to the lower N-ICE2015 keel width of 16 m), the maximum keel draft was 7.3 m, and the estimated increase in the ridge bottom melt in comparison with level ice was 4.8 compared with 3.8 for MOSAiC. The enhanced first-year ridge melt estimated from draft measurements from upward-looking sonar in the Beaufort Sea from Amundrud et al. (2006) may have substantial uncertainties as they are based on an assumption of similar ice draft distribution along the direction of ice drift (and not necessarily repeated measurements of the same ridges), while ridge macroporosity, block thickness, sea-ice density, and fraction of surface and bottom ice melt were unknown. Amundrud et al. (2006) estimated the total level ice melt rate in July as 0.02–0.03 m d−1, similar to 0.018 m d−1 for the MOSAiC FYI coring site (1–29 July), while the total melt rate for ridges with 4–8 m draft was 0.10 m d−1 in the Beaufort Sea and 0.04 m d−1 during MOSAiC (1–21 July). The corresponding ridge total melt enhancement of 4.0 was higher than the ratio of ridge and level ice total melt of 3.0 for MOSAiC. Another ridge (Alli's ridge) with similar block thickness, keel draft, width, and macroporosity, but oriented along the drift direction (perpendicular to Jaridge), was studied during MOSAiC. Despite the different orientation, by 26 July Alli's ridge experienced a draft decrease of 0.9 m, similar to that of Jaridge; however, those observations are limited to four-point measurements across a single ridge cross-section.
The results of our sonar investigations provided evidence of high spatial variability in sea-ice melt, especially for ridges. For the ridge with a total cross-sectional melt of 0.9 ± 0.4 m, we identified cross-sections with an average total melt ranging from 0.2 to 2.6 m. This means that measurements from a single location or even a single ridge cross-section may not be representative, as the variability of draft change is comparable to the difference between the average melt of different sea-ice types. This suggests that the 20–30 % difference between our observations of first-year ridge enhanced melt and observations from Amundrud et al. (2006) and Shestov et al. (2018) may be related to the high spatial variability of ridge melt or different oceanographic conditions, while the much larger 120 % difference from Perovich et al. (2003) may be attributed to different ridge age.
3.8 Study application and limitations
Our study provides melt estimates for different ice types over a substantial range of sea-ice draft. It also describes the effects of ridge morphological parameters, including ridge draft, slope, and width, on melt rates. This allows us to extrapolate our estimates to a range of ridge cross-sections with various shapes and drafts. Nevertheless, we acknowledge limitations related to some other ridge characteristics that may affect melt, such as macroporosity, block thickness, and ridge age. Most of the characteristics of the investigated ridge are close to the average characteristics of first-year ice ridges with 8 m maximum keel draft, 36 m keel width, and 0.2–0.4 m block thickness (Strub-Klein and Sudom, 2012), except for its low macroporosity. The number of ridges sampled during the melt season is limited, but melting ridges often have low macroporosity (Marchenko, 2022; Shestov et al., 2018). Similarly, our results do not cover ridges with keel drafts above 8 m and strongly non-trapezoidal shapes, often observed in Arctic regions with thicker sea ice, including the Chukchi and Beaufort seas (Metzger et al., 2021). Previous studies on ridge melt showed a wide range of ridge and level ice melt fractions from only 1.6 (Perovich et al., 2003) to 4–5 (Amundrud et al., 2006; Shestov et al., 2018), yet due to the limited coverage of these observations, it is challenging to indicate which parameters were the main reason for such differences in ridge melt. Additional limitations are related to the estimates of sea-ice density seasonal evolution for different ice types due to the small number of such observations, especially for ridges, and known challenges and uncertainties related to brine losses during ice coring (Pustogvar and Kulyakhtin, 2016).
We collected an unprecedented dataset using a multibeam sonar mounted on an ROV that captured the four-dimensional change of sea-ice draft over a period of 1 month during advanced summer melt in the Arctic Ocean. This revealed that a first-year ridge melted faster than adjacent level ice types. The total ridge melt was on average 0.95 m, compared with 0.55 m for level second-year ice and 0.46 m for level first-year ice. These observations can largely be explained by the difference in initial average ice draft of 1.4 m for first-year ice, 2.6 m for second-year ice, and 3.9 m for the ridge. Ridge bottom melt was three to four times higher than the bottom melt of first-year level ice, while surface melt was almost identical. The high-resolution sonar observations also revealed large spatial heterogeneity in keel melt, and therefore the results from point observations need to be interpreted with care since it is difficult to tell how representative they are. Key factors that affect the melt rates of ridge keels include the keel draft and slope (with a negative correlation), keel width, and distance from the keel front (with a positive correlation). These factors can explain 57 % of the total melt variability for this particular ridge, with 36 % of the melt variability explained by keel draft, 32 % by keel slope, 27 % by keel width, and 11 % by a distance from the keel front. We observed a relationship between the melt of ridge flanks with their draft, and the amplification of keel melt within 10 m of its bottom corners, while the melt rates of the (more level) middle part of the ridge keel bottom were comparable to those of level ice melt. However, ice draft changes (as measured by sonars) are not due to ice melt alone, because the hydrostatic balance of the ice needs to be considered since, for example, melt pond drainage and sea-ice density evolution change ice draft. This needs to be considered when such measurements are used over longer periods of time. Considering the seasonal change in sea-ice density allowed us to refine the ratio of total ridge to first-year level ice melt to 3.0 and the ratio of bottom ice melt to 3.8. Such ice draft changes also affect the ice freeboard and can potentially affect satellite altimetry retrievals in the Arctic summer.
Since a large percentage (up to 40 %–50 %) of the Arctic ice pack is deformed (ridged) ice, it is imperative that we better understand its role in the Arctic sea-ice system. While ridge keels contribute a significant amount of ice melt in summer (Perovich et al., 2021), they also provide a sink for meltwater through refreezing in keel voids (Lange et al., 2023). Ridge keels also shape the lateral distribution of under-ice meltwater layers (which in turn affect level ice melt rates) (Salganik et al., 2023d) and affect turbulent exchanges (Skyllingstad et al., 2003), with implications for ice–ocean exchange. This work highlights areas that warrant future observation-model development for improved representation of ridge-related sea-ice processes in models.
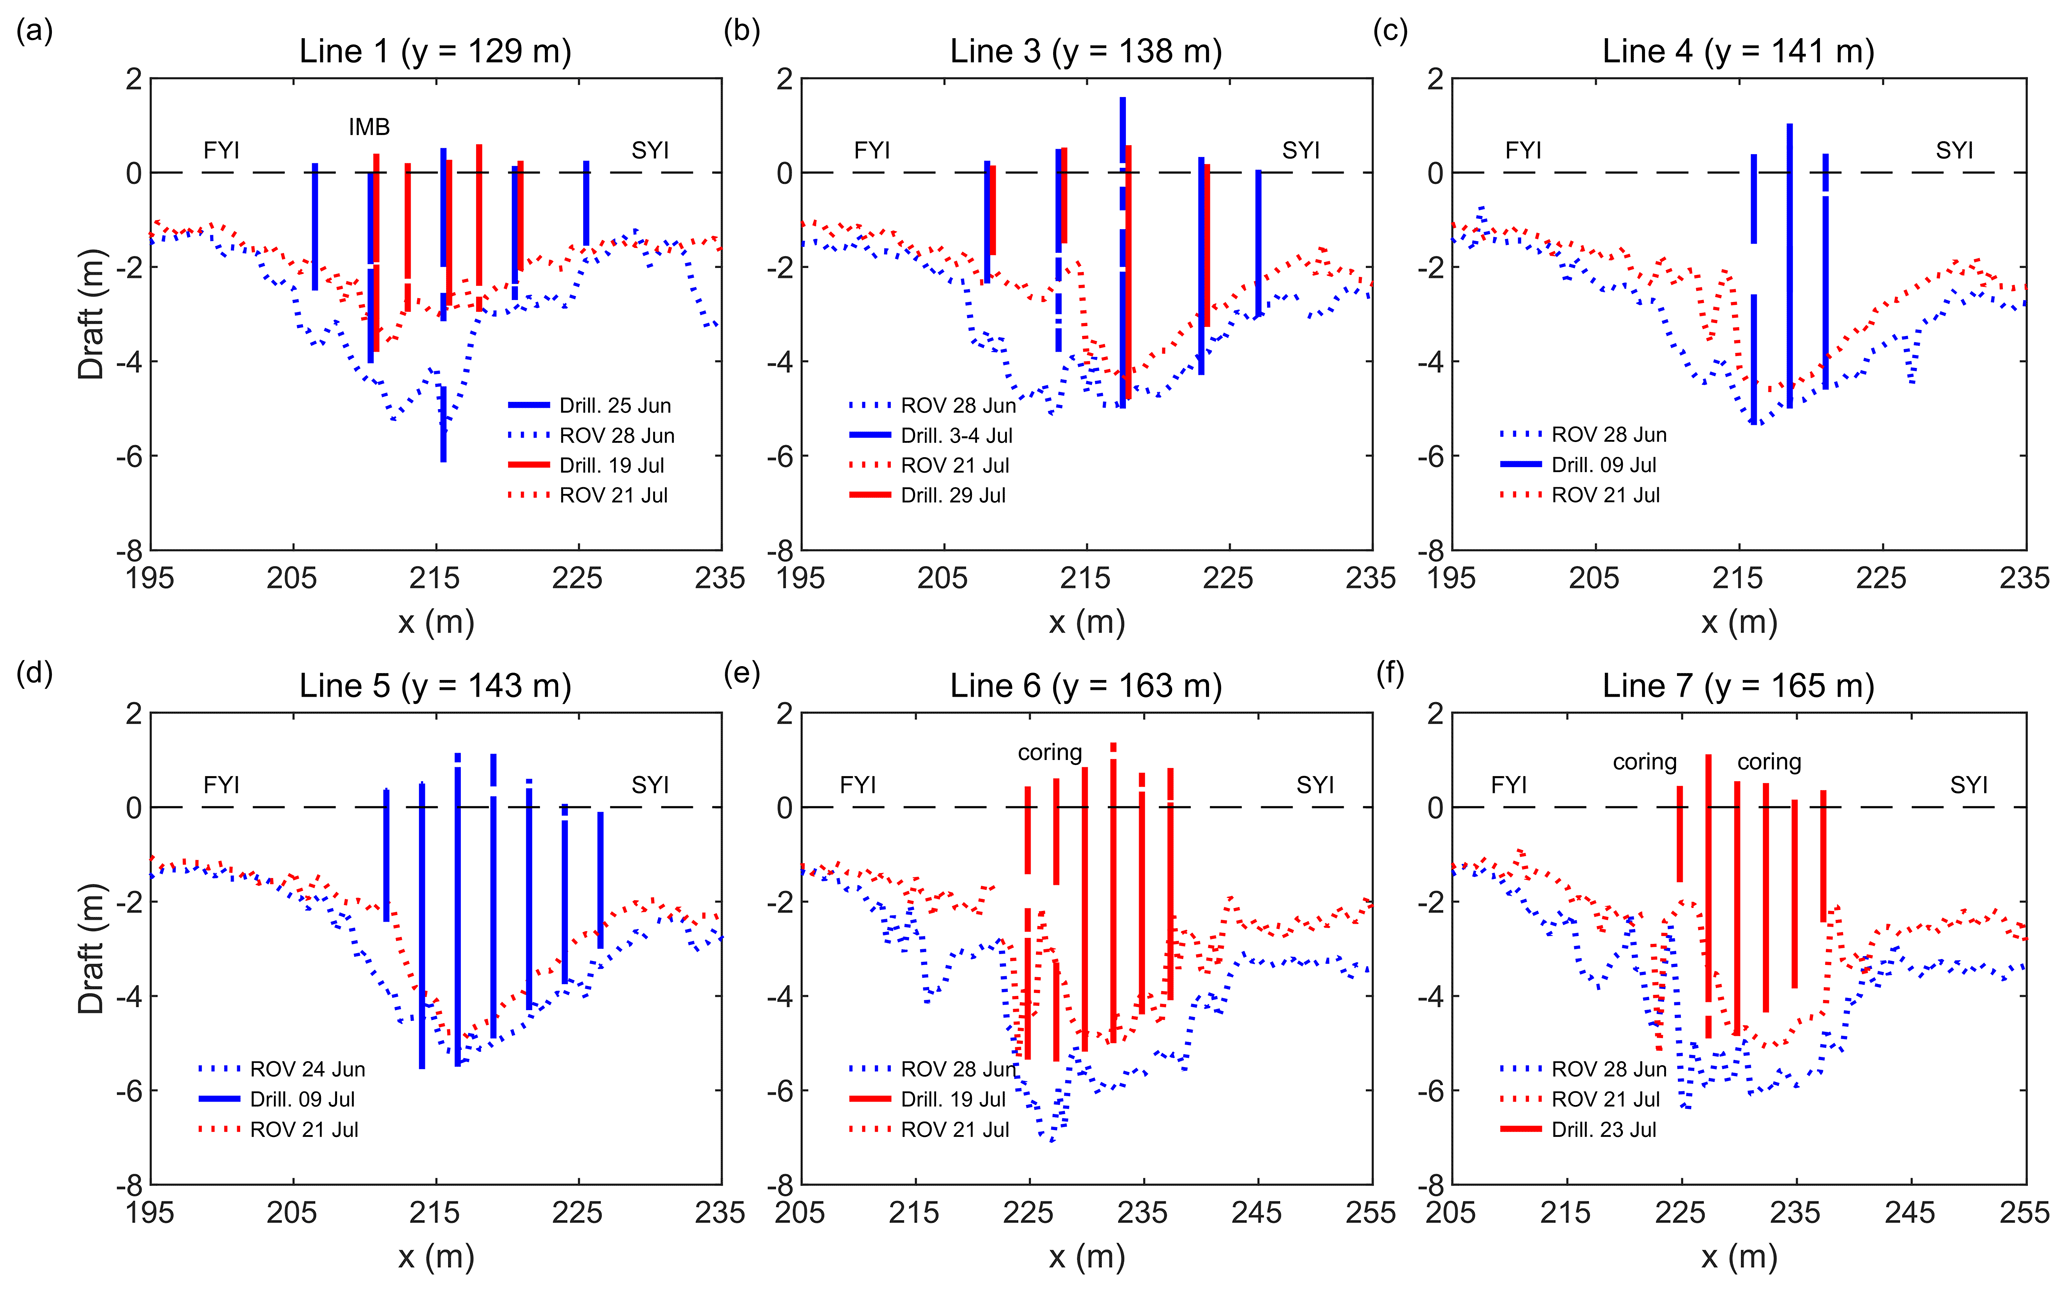
Figure A1Ridge draft measurements from ROV multibeam sonar and ice drilling lines. The vertical lines are drill holes: the solid lines are ice, the line breaks are voids, and the dotted lines are ROV sonar draft measurements.
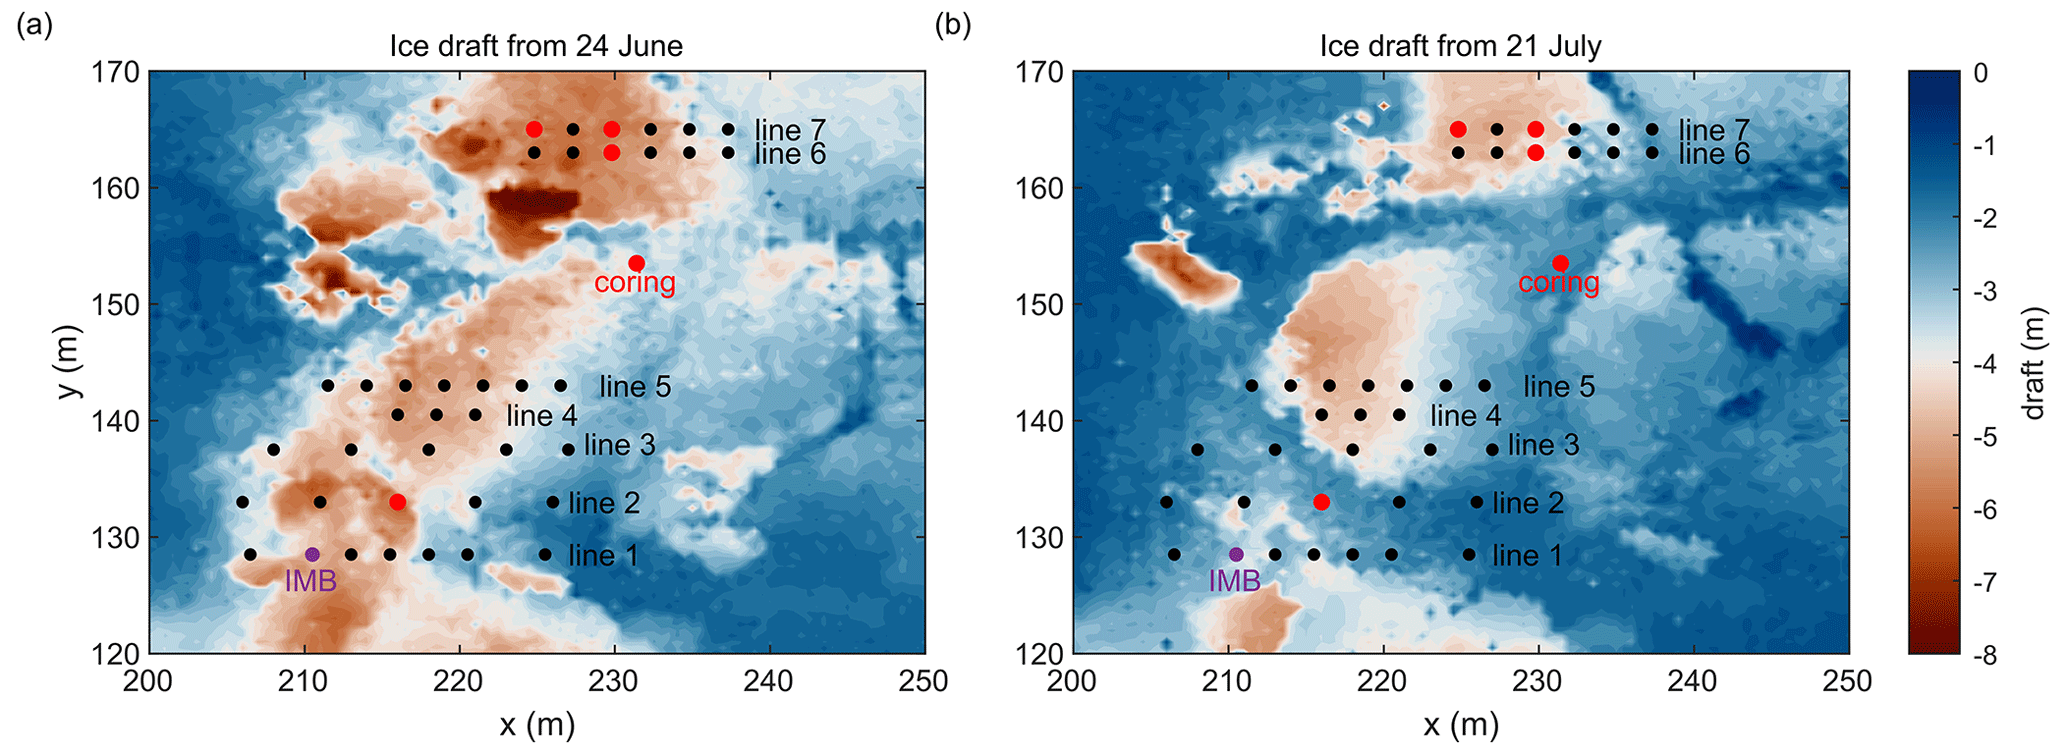
Figure A2Contour plot with ice draft for 24 June (a) and 21 July (b). Black points show ridge drilling locations, the purple point shows the location of ice mass balance buoy (IMB), and red points show the location of ridge coring. Contour plot colours follow recommendations of scientifically derived colour maps (Crameri et al., 2020).
All scientific data used in this study is publicly available. The multibeam sonar data can be found in Katlein et al. (2022; https://doi.org/10.1594/PANGAEA.945846), the ridge drilling data can be found in Salganik et al. (2023b; https://doi.org/10.1594/PANGAEA.953880), the IMB data can be found in Granskog et al. (2021; https://doi.org/10.1594/PANGAEA.938354), the ALS data can be found in Jutila et al. (2023; https://doi.org/10.1594/PANGAEA.950509), the FYI coring data can be found in Oggier et al. (2023; https://doi.org/10.1594/PANGAEA.956732), the ridge salinity and density data can be found in Lange et al. (2022; https://doi.org/10.1594/PANGAEA.943746) and Salganik et al. (2023c; https://doi.org/10.1594/PANGAEA.953865), the snow density data can be found in Macfarlane et al. (2021; https://doi.org/10.1594/PANGAEA.935934), the helicopter-borne RGB orthomosaics can be found in Neckel et al. (2023; https://doi.org/10.1594/PANGAEA.949433), the meteorological data from RV Polarstern can be found in Schmithüsen (2021; https://doi.org/10.1594/PANGAEA.935224), the ocean microstructure profile data can be found in Schulz et al. (2022; https://doi.org/10.1594/PANGAEA.939816), and the core hydrographic data can be found in Schulz et al. (2023b; https://doi.org/10.18739/A21J9790B).
ES, BAL, CK, IM, KVH and MAG contributed to the design of the study. ES, BAL, CK, IM, and MM collected and processed the field data. ES undertook the statistical analyses and interpreted the results. ES and MAG prepared the manuscript with contributions from all co-authors.
The contact author has declared that none of the authors has any competing interests.
Publisher's note: Copernicus Publications remains neutral with regard to jurisdictional claims made in the text, published maps, institutional affiliations, or any other geographical representation in this paper. While Copernicus Publications makes every effort to include appropriate place names, the final responsibility lies with the authors.
The work carried out and the data used in this paper are part of the international Multidisciplinary drifting Observatory for the Study of the Arctic Climate (MOSAiC) with the tag MOSAiC20192020. We thank all persons involved in the expedition of the Research Vessel Polarstern (Alfred-Wegener-Institut Helmholtz-Zentrum für Polar- und Meeresforschung, 2017) during MOSAiC in 2019–2020 (Project_ID: AWI_PS122_00) as listed in Nixdorf et al. (2021). We especially acknowledge Marcel Nicolaus and Donald Perovich for their efforts in coordinating the sea-ice physics work during MOSAiC. We are also grateful to Marcel Nicolaus for his efforts in coordinating the ROV work during MOSAiC. We thank Julia Regnery for the assistance with ROV multibeam sonar measurements and ROV co-piloting. We are grateful for the assistance of Niklas Neckel in processing MOSAiC helicopter-borne RGB orthomosaics.
Evgenii Salganik, Benjamin Allen Lange, Knut Vilhelm Høyland, and Mats Anders Granskog were supported by the Research Council of Norway through project HAVOC (grant no. 280292). Evgenii Salganik was also supported by Research Council of Norway project INTERAAC (grant no. 328957), Benjamin Allen Lange and Mats Anders Granskog by Research Council of Norway project CAATEX (grant no. 280531), and Mats Anders Granskog and Morven Muilwijk by the Norwegian Polar Institute. Mats Anders Granskog and Morven Muilwijk received funding from the European Union's Horizon 2020 research and innovation programme (grant no. 101003826) via project CRiceS (Climate Relevant interactions and feedbacks: the key role of sea ice and Snow in the polar and global climate system). ROV operations, Ilkka Matero, and Christian Katlein were jointly supported by UKRI Natural Environment Research Council (NERC) and the German Federal Ministry of Education and Research (BMBF) through the Diatom ARCTIC project (BMBF grant no. 03F0810A). ROV operations were further supported by the Helmholtz Infrastructure Initiative Frontiers in Arctic Marine Monitoring (FRAM). PA was supported through the Alfred-Wegener-Institut internal project AWI_ROV and BMBF through the Diatom ARCTIC project (BMBF grant no. 03F0810A) and the IceScan project (BMBF grant no. 03F0916A).
The authors thank Stefan Kern and an anonymous reviewer for their constructive suggestions which helped to improve the paper.
This research has been supported by the Norges Forskningsråd (grant nos. 280292, 328957, and 280531), the Horizon 2020 (grant no. 101003826), and the Bundesministerium für Bildung und Forschung (grant nos. 03F0810A and 03F0916A).
This paper was edited by Vishnu Nandan and reviewed by Stefan Kern and one anonymous referee.
Amundrud, T. L., Melling, H., and Ingram, G.: Geometrical constraints on the evolution of ridged sea ice, J. Geophys. Res.-Oceans, 109, 1–12, https://doi.org/10.1029/2003JC002251, 2004.
Amundrud, T. L., Melling, H., Ingram, R. G., and Allen, S. E.: The effect of structural porosity on the ablation of sea ice ridges, J. Geophys. Res., 111, C06004, https://doi.org/10.1029/2005JC002895, 2006.
Bowen, R. G. and Topham, D. R.: A study of the morphology of a discontinuous section of a first year arctic pressure ridge, Cold Reg. Sci. Technol., 24, 83–100, https://doi.org/10.1016/0165-232X(95)00002-S, 1996.
Cox, G. F. N. and Weeks, W. F.: Equations for determining the gas and brine volumes in sea-ice samples, J. Glaciol., 29, 306–316, https://doi.org/10.3189/S0022143000008364, 1983.
Crameri, F., Shephard, G. E., and Heron, P. J.: The misuse of colour in science communication, Nat. Commun., 11, 5444, https://doi.org/10.1038/s41467-020-19160-7, 2020.
Ekeberg, O., Høyland, K., and Hansen, E.: Ice ridge keel geometry and shape derived from one year of upward looking sonar data in the Fram Strait, Cold Reg. Sci. Technol., 109, 78–86, https://doi.org/10.1016/j.coldregions.2014.10.003, 2015.
Fer, I., Baumann, T. M., Koenig, Z., Muilwijk, M., and Tippenhauer, S.: Upper-Ocean Turbulence Structure and Ocean-Ice Drag Coefficient Estimates Using an Ascending Microstructure Profiler During the MOSAiC Drift, J. Geophys. Res.-Oceans, 127, 1–23, https://doi.org/10.1029/2022JC018751, 2022.
Fernández-Méndez, M., Olsen, L. M., Kauko, H. M., Meyer, A., Rösel, A., Merkouriadi, I., Mundy, C. J., Ehn, J. K., Johansson, A. M., Wagner, P. M., Ervik, Å., Sorrell, B. K., Duarte, P., Wold, A., Hop, H., and Assmy, P.: Algal hot spots in a changing Arctic Ocean: sea-ice ridges and the snow-ice interface, Front. Mar. Sci., 5, https://doi.org/10.3389/fmars.2018.00075, 2018.
Fons, S., Kurtz, N., and Bagnardi, M.: A decade-plus of Antarctic sea ice thickness and volume estimates from CryoSat-2 using a physical model and waveform fitting, The Cryosphere, 17, 2487–2508, https://doi.org/10.5194/tc-17-2487-2023, 2023.
Gradinger, R., Bluhm, B., and Iken, K.: Arctic sea-ice ridges – Safe heavens for sea-ice fauna during periods of extreme ice melt?, Deep-Sea Res. Pt. II, 57, 86–95, https://doi.org/10.1016/j.dsr2.2009.08.008, 2010.
Granskog, M. A., Fer, I., Rinke, A., and Steen, H.: Atmosphere-ice-ocean-ecosystem processes in a thinner Arctic sea ice regime: the Norwegian Young Sea ICE (N-ICE2015) Expedition, J. Geophys. Res.-Oceans, 123, 1586–1594, https://doi.org/10.1002/2017JC013328, 2018.
Granskog, M. A., Lange, B. A., Salganik, E., De La Torre, P. R., and Riemann-Campe, K.: Temperature and heating induced temperature difference measurements from the modular buoy 2020M26, deployed during MOSAiC 2019/20, PANGAEA [data set], https://doi.org/10.1594/PANGAEA.938354, 2021.
Hansen, E., Ekeberg, O.-C., Gerland, S., Pavlova, O., Spreen, G., and Tschudi, M.: Variability in categories of Arctic sea ice in Fram Strait, J. Geophys. Res.-Oceans, 119, 7175–7189, https://doi.org/10.1002/2014JC010048, 2014.
Hopkins, M. A.: Four stages of pressure ridging, J. Geophys. Res.-Oceans, 103, 21883–21891, https://doi.org/10.1029/98JC01257, 1998.
Jackson, K., Wilkinson, J., Maksym, T., Meldrum, D., Beckers, J., Haas, C., and Mackenzie, D.: A novel and low-cost sea ice mass balance buoy, J. Atmos. Ocean. Technol., 30, 2676–2688, https://doi.org/10.1175/JTECH-D-13-00058.1, 2013.
Jutila, A., Hendricks, S., Birnbaum, G., von Albedyll, L., Ricker, R., Helm, V., Hutter, N., and Haas, C.: Geolocated sea-ice or snow surface elevation point cloud segments from helicopter-borne laser scanner during the MOSAiC expedition, version 1, PANGAEA [data set], https://doi.org/10.1594/PANGAEA.950509, 2023.
Katlein, C., Schiller, M., Belter, H. J., Coppolaro, V., Wenslandt, D., and Nicolaus, M.: A New Remotely Operated Sensor Platform for Interdisciplinary Observations under Sea Ice, Front. Mar. Sci., 4, 1–12, https://doi.org/10.3389/fmars.2017.00281, 2017.
Katlein, C., Langelier, J., Ouellet, A., Lévesque-Desrosiers, F., Hisette, Q., Lange, B. A., Lambert-Girard, S., Babin, M., and Thibault, S.: The Three-Dimensional Light Field Within Sea Ice Ridges, Geophys. Res. Lett., 48, e2021GL093207, https://doi.org/10.1029/2021GL093207, 2021.
Katlein, C., Anhaus, P., Arndt, S., Krampe, D., Lange, B. A., Matero, I., Regnery, J., Rohde, J., Schiller, M., and Nicolaus, M.: Sea-ice draft during the MOSAiC expedition 2019/20, PANGAEA [data set], https://doi.org/10.1594/PANGAEA.945846, 2022.
Kovacs, A., Weeks, W. F., Ackley, S., and Hibler, W. D.: Structure of a Multi-Year Pressure Ridge, ARCTIC, 26, 22–31, https://doi.org/10.14430/arctic2893, 1973.
Krishfield, R. A.: Spatial and temporal variability of oceanic heat flux to the Arctic ice pack, J. Geophys. Res., 110, C07021, https://doi.org/10.1029/2004JC002293, 2005.
Krumpen, T., Gerdes, R., Haas, C., Hendricks, S., Herber, A., Selyuzhenok, V., Smedsrud, L., and Spreen, G.: Recent summer sea ice thickness surveys in Fram Strait and associated ice volume fluxes, The Cryosphere, 10, 523–534, https://doi.org/10.5194/tc-10-523-2016, 2016.
Krumpen, T., von Albedyll, L., Goessling, H. F., Hendricks, S., Juhls, B., Spreen, G., Willmes, S., Belter, H. J., Dethloff, K., Haas, C., Kaleschke, L., Katlein, C., Tian-Kunze, X., Ricker, R., Rostosky, P., Rückert, J., Singha, S., and Sokolova, J.: MOSAiC drift expedition from October 2019 to July 2020: sea ice conditions from space and comparison with previous years, The Cryosphere, 15, 3897–3920, https://doi.org/10.5194/tc-15-3897-2021, 2021.
Landy, J. C., Dawson, G. J., Tsamados, M., Bushuk, M., Stroeve, J. C., Howell, S. E. L., Krumpen, T., Babb, D. G., Komarov, A. S., Heorton, H. D. B. S., Belter, H. J., and Aksenov, Y.: A year-round satellite sea-ice thickness record from CryoSat-2, Nature, 609, 517–522, https://doi.org/10.1038/s41586-022-05058-5, 2022.
Lange, B. A., Salganik, E., Macfarlane, A. R., Schneebeli, M., Høyland, K. V., Gardner, J., Müller, O., and Granskog, M. A.: Ridge ice oxygen and hydrogen isotope data MOSAiC Leg 4 (PS122/4), PANGAEA [data set], https://doi.org/10.1594/PANGAEA.943746, 2022.
Lange, B. A., Salganik, E., Macfarlane, A., Schneebeli, M., Høyland, K., Gardner, J., Müller, O., Divine, D. V., Kohlbach, D., Katlein, C., and Granskog, M. A.: Snowmelt contribution to Arctic first-year ice ridge mass balance and rapid consolidation during summer melt, Elem. Sci. Anthr., 11, 00037, https://doi.org/10.1525/elementa.2022.00037, 2023.
Lei, R., Cheng, B., Hoppmann, M., Zhang, F., Zuo, G., Hutchings, J. K., Lin, L., Lan, M., Wang, H., Regnery, J., Krumpen, T., Haapala, J., Rabe, B., Perovich, D. K., and Nicolaus, M.: Seasonality and timing of sea ice mass balance and heat fluxes in the Arctic transpolar drift during 2019–2020, Elem. Sci. Anthr., 10, 000089, https://doi.org/10.1525/elementa.2021.000089, 2022.
Lyon, W.: Ocean and sea-ice research in the Arctic Ocean via submarine, Trans. N. Y. Acad. Sci., 23, 662–674, https://doi.org/10.1111/j.2164-0947.1961.tb01400.x, 1961.
Macfarlane, A. R., Schneebeli, M., Dadic, R., Wagner, D. N., Arndt, S., Clemens-Sewall, D., Hämmerle, S., Hannula, H.-R., Jaggi, M., Kolabutin, N., Krampe, D., Lehning, M., Matero, I., Nicolaus, M., Oggier, M., Pirazzini, R., Polashenski, C., Raphael, I., Regnery, J., Shimanchuck, E., Smith, M. M., and Tavri, A.: Snowpit raw data collected during the MOSAiC expedition, PANGAEA [data set], https://doi.org/10.1594/PANGAEA.935934, 2021.
Macfarlane, A. R., Schneebeli, M., Dadic, R., Tavri, A., Immerz, A., Polashenski, C., Krampe, D., Clemens-Sewall, D., Wagner, D. N., Perovich, D. K., Henna-Reetta, H., Raphael, I., Matero, I., Regnery, J., Smith, M. M., Nicolaus, M., Jaggi, M., Oggier, M., Webster, M. A., Lehning, M., Kolabutin, N., Itkin, P., Naderpour, R., Pirazzini, R., Hämmerle, S., Arndt, S., and Fons, S.: A Database of Snow on Sea Ice in the Central Arctic Collected during the MOSAiC expedition, Sci. Data, 10, 398, https://doi.org/10.1038/s41597-023-02273-1, 2023.
Marchenko, A.: Thermo-Hydrodynamics of Sea Ice Rubble, Springer International Publishing, 203–223, https://doi.org/10.1007/978-3-030-80439-8_10, 2022.
Mårtensson, S., Meier, H. E. M., Pemberton, P., and Haapala, J.: Ridged sea ice characteristics in the Arctic from a coupled multicategory sea ice model, J. Geophys. Res.-Oceans, 117, C00D15, https://doi.org/10.1029/2010JC006936, 2012.
Melling, H. and Riedel, D. A.: Development of seasonal pack ice in the Beaufort Sea during the winter of 1991–1992: A view from below, J. Geophys. Res.-Oceans, 101, 11975–11991, https://doi.org/10.1029/96JC00284, 1996.
Metzger, A. T., Mahoney, A. R., and Roberts, A. F.: The Average Shape of Sea Ice Ridge Keels, Geophys. Res. Lett., 48, e2021GL095100, https://doi.org/10.1029/2021GL095100, 2021.
National Geophysical Data Center: ETOPO2v2 2-minute Global Relief Model, NOAA National Centers for Environmental Information [data set], https://doi.org/10.7289/V5J1012Q, 2006.
Neckel, N., Fuchs, N., Birnbaum, G., Hutter, N., Jutila, A., Buth, L., von Albedyll, L., Ricker, R., and Haas, C.: Helicopter-borne RGB orthomosaics and photogrammetric Digital Elevation Models from the MOSAiC Expedition, PANGAEA [data set], https://doi.org/10.1594/PANGAEA.949433, 2023.
Nicolaus, M., Perovich, D. K., Spreen, G., Granskog, M. A., von Albedyll, L., Angelopoulos, M., Anhaus, P., Arndt, S., Belter, H. J., Bessonov, V., Birnbaum, G., Brauchle, J., Calmer, R., Cardellach, E., Cheng, B., Clemens-Sewall, D., Dadic, R., Damm, E., de Boer, G., Demir, O., Dethloff, K., Divine, D. V., Fong, A. A., Fons, S., Frey, M. M., Fuchs, N., Gabarró, C., Gerland, S., Goessling, H. F., Gradinger, R., Haapala, J., Haas, C., Hamilton, J., Hannula, H.-R., Hendricks, S., Herber, A., Heuzé, C., Hoppmann, M., Høyland, K. V., Huntemann, M., Hutchings, J. K., Hwang, B., Itkin, P., Jacobi, H.-W., Jaggi, M., Jutila, A., Kaleschke, L., Katlein, C., Kolabutin, N., Krampe, D., Kristensen, S. S., Krumpen, T., Kurtz, N., Lampert, A., Lange, B. A., Lei, R., Light, B., Linhardt, F., Liston, G. E., Loose, B., Macfarlane, A. R., Mahmud, M., Matero, I. O., Maus, S., Morgenstern, A., Naderpour, R., Nandan, V., Niubom, A., Oggier, M., Oppelt, N., Pätzold, F., Perron, C., Petrovsky, T., Pirazzini, R., Polashenski, C., Rabe, B., Raphael, I. A., Regnery, J., Rex, M., Ricker, R., Riemann-Campe, K., Rinke, A., Rohde, J., Salganik, E., Scharien, R. K., Schiller, M., Schneebeli, M., Semmling, M., Shimanchuk, E., Shupe, M. D., Smith, M. M., Smolyanitsky, V., Sokolov, V., Stanton, T., Stroeve, J., Thielke, L., Timofeeva, A., Tonboe, R. T., Tavri, A., et al.: Overview of the MOSAiC expedition, Elem. Sci. Anthr., 10, 000046, https://doi.org/10.1525/elementa.2021.000046, 2022.
Nixdorf, U., Dethloff, K., Rex, M., Shupe, M., Sommerfeld, A., Perovich, D., Nicolaus, M., Heuzé, C., Rabe, B., Loose, B., Damm, E., Gradinger, R., Fong, A., Maslowski, W., Rinke, A., Kwok, R., Hirsekorn, M., Spreen, G., Mohaupt, V., Wendisch, M., Frickenhaus, S., Mengedoht, D., Herber, A., Immerz, A., Regnery, J., Weiss-tuider, K., Gerchow, P., Haas, C., König, B., Ransby, D., Kanzow, T., Krumpen, T., Rack, F. R., Morgenstern, A., Saitzev, V., Sokolov, V., Makarov, A., Schwarze, S., and Wunderlich, T.: MOSAiC Extended Acknowledgement, Zenodo [data set], https://doi.org/10.5281/zenodo.5179739, 2021.
Oggier, M., Salganik, E., Whitmore, L., Fong, A. A., Hoppe, C. J. M., Rember, R., Høyland, K. V., Divine, D. V, Gradinger, R., Fons, S. W., Abrahamsson, K., Aguilar-Islas, A. M., Angelopoulos, M., Arndt, S., Balmonte, J. P., Bozzato, D., Bowman, J. S., Castellani, G., Chamberlain, E., Creamean, J., D'Angelo, A., Damm, E., Dumitrascu, A., Eggers, S. L., Gardner, J., Grosfeld, L., Haapala, J., Immerz, A., Kolabutin, N., Lange, B. A., Lei, R., Marsay, C. M., Maus, S., Müller, O., Olsen, L. M., Nuibom, A., Ren, J., Rinke, A., Sheikin, I., Shimanchuk, E., Snoeijs-Leijonmalm, P., Spahic, S., Stefels, J., Torres-Valdés, S., Torstensson, A., Ulfsbo, A., Verdugo, J., Vortkamp, M., Wang, L., Webster, M., Wischnewski, L., and Granskog, M. A.: First-year sea-ice salinity, temperature, density, oxygen and hydrogen isotope composition from the main coring site (MCS-FYI) during MOSAiC legs 1 to 4 in 2019/2020, PANGAEA [data set], https://doi.org/10.1594/PANGAEA.956732, 2023.
Perovich, D., Smith, M., Light, B., and Webster, M.: Meltwater sources and sinks for multiyear Arctic sea ice in summer, The Cryosphere, 15, 4517–4525, https://doi.org/10.5194/tc-15-4517-2021, 2021.
Perovich, D. K., Grenfell, T. C., Richter-Menge, J. A., Light, B., Tucker, W. B., and Eicken, H.: Thin and thinner: Sea ice mass balance measurements during SHEBA, J. Geophys. Res.-Oceans, 108, 1–21, https://doi.org/10.1029/2001jc001079, 2003.
Perovich, D. K., Richter-Menge, J. A., Jones, K. F., Light, B., Elder, B. C., Polashenski, C., Laroche, D., Markus, T., and Lindsay, R.: Arctic sea-ice melt in 2008 and the role of solar heating, Ann. Glaciol., 52, 355–359, https://doi.org/10.3189/172756411795931714, 2011.
Peterson, A. K., Fer, I., McPhee, M. G., and Randelhoff, A.: Turbulent heat and momentum fluxes in the upper ocean under Arctic sea ice, J. Geophys. Res.-Oceans, 122, 1439–1456, https://doi.org/10.1002/2016JC012283, 2017.
Pustogvar, A. and Kulyakhtin, A.: Sea ice density measurements. Methods and uncertainties, Cold Reg. Sci. Technol., 131, 46–52, https://doi.org/10.1016/j.coldregions.2016.09.001, 2016.
Ricker, R., Fons, S., Jutila, A., Hutter, N., Duncan, K., Farrell, S. L., Kurtz, N. T., and Fredensborg Hansen, R. M.: Linking scales of sea ice surface topography: evaluation of ICESat-2 measurements with coincident helicopter laser scanning during MOSAiC, The Cryosphere, 17, 1411–1429, https://doi.org/10.5194/tc-17-1411-2023, 2023.
Rigby, F. A. and Hanson, A.: Evolution of a large Arctic pressure ridge, AIDJEX Bull., 34, 43–71, 1976.
Rothrock, D. A.: Arctic Ocean sea ice volume: What explains its recent depletion?, J. Geophys. Res., 110, C01002, https://doi.org/10.1029/2004JC002282, 2005.
Salganik, E., Lange, B. A., Itkin, P., Divine, D., Katlein, C., Nicolaus, M., Hoppmann, M., Neckel, N., Ricker, R., Høyland, K. V., and Granskog, M. A.: Different mechanisms of Arctic first-year sea-ice ridge consolidation observed during the MOSAiC expedition, Elem. Sci. Anthr., 11, 00008, https://doi.org/10.1525/elementa.2023.00008, 2023a.
Salganik, E., Lange, B. A., Sheikin, I., Høyland, K. V., and Granskog, M. A.: Drill-hole ridge ice and snow thickness and draft measurements of “Jaridge” during MOSAiC 2019/20, PANGAEA [data set], https://doi.org/10.1594/PANGAEA.953880, 2023b.
Salganik, E., Lange, B. A., Høyland, K. V., Gardner, J., Müller, O., Tavri, A., Mahmud, M., and Granskog, M. A.: Ridge ice density data MOSAiC Leg 4 (PS122/4), PANGAEA [data set], https://doi.org/10.1594/PANGAEA.953865, 2023c.
Salganik, E., Katlein, C., Lange, B. A., Matero, I., Lei, R., Fong, A. A., Fons, S. W., Divine, D., Oggier, M., Castellani, G., Bozzato, D., Chamberlain, E. J., Hoppe, C. J. M., Müller, O., Gardner, J., Rinke, A., Pereira, P. S., Ulfsbo, A., Marsay, C., Webster, M. A., Maus, S., Høyland, K. V., and Granskog, M. A.: Temporal evolution of under-ice meltwater layers and false bottoms and their impact on summer Arctic sea ice mass balance, Elem. Sci. Anthr., 11, 00035, https://doi.org/10.1525/elementa.2022.00035, 2023d.
Schmithüsen, H.: Continuous meteorological surface measurement during POLARSTERN cruise PS122/4, Alfred Wegener Institute, Helmholtz Cent. Polar Mar. Res. Bremerhaven, PANGAEA [data set], https://doi.org/10.1594/PANGAEA.935224, 2021.
Schulz, K., Mohrholz, V., Fer, I., Janout, M. A., Hoppmann, M., Schaffer, J., Koenig, Z., Rabe, B., Heuzé, C., Regnery, J., Allerholt, J., Fang, Y.-C., He, H., Kanzow, T., Karam, S., Kuznetsov, I., Kong, B., Liu, H., Muilwijk, M., Schuffenhauer, I., Sukhikh, N., Sundfjord, A., and Tippenhauer, S.: Turbulent microstructure profile (MSS) measurements from the MOSAiC drift, Arctic Ocean, PANGAEA [data set], https://doi.org/10.1594/PANGAEA.939816, 2022.
Schulz, K., Koenig, Z., Muilwijk, M., Bauch, D., Hoppe, C. J. M., Droste, E., Hoppmann, M., Chamberlain, E. J., Laukert, G., Stanton, T., Zurita, A. Q., Fer, I., Heuzé, C., Karam, S., Mieruch-Schnuelle, S., Baumann, T., Vredenborg, M., Tippenhauer, S., and Granskog, M. A.: The Eurasian Arctic Ocean along the MOSAiC drift (2019–2020): An interdisciplinary perspective on properties and processes, EarthArXiv [preprint], https://doi.org/10.31223/X5TT2W, 2023a.
Schulz, K., Koenig, Z., and Muilwijk, M.: The Eurasian Arctic Ocean along the MOSAiC drift (2019–2020): Core hydrographic parameters, Arctic Data Center [data set], https://doi.org/10.18739/A21J9790B, 2023b.
Shestov, A., Høyland, K., and Ervik, Å.: Decay phase thermodynamics of ice ridges in the Arctic Ocean, Cold Reg. Sci. Technol., 152, 23–34, https://doi.org/10.1016/j.coldregions.2018.04.005, 2018.
Skyllingstad, E. D., Paulson, C. A., and Pegau, W. S.: Effects of keels on ice bottom turbulence exchange, J. Geophys. Res., 108, 3372, https://doi.org/10.1029/2002JC001488, 2003.
Spreen, G., Kaleschke, L., and Heygster, G.: Sea ice remote sensing using AMSR-E 89-GHz channels, J. Geophys. Res., 113, C02S03, https://doi.org/10.1029/2005JC003384, 2008.
Strub-Klein, L. and Sudom, D.: A comprehensive analysis of the morphology of first-year sea ice ridges, Cold Reg. Sci. Technol., 82, 94–109, https://doi.org/10.1016/j.coldregions.2012.05.014, 2012.
Sumata, H., de Steur, L., Divine, D. V., Granskog, M. A., and Gerland, S.: Regime shift in Arctic Ocean sea ice thickness, Nature, 615, 443–449, https://doi.org/10.1038/s41586-022-05686-x, 2023.
Timco, G. W. and Burden, R. P.: An analysis of the shapes of sea ice ridges, Cold Reg. Sci. Technol., 25, 65–77, https://doi.org/10.1016/S0165-232X(96)00017-1, 1997.
Tucker, W. B., Sodhi, D. S., and Govoni, J. W.: Structure of first-year pressure ridge sails in the Prudhoe region, in: The Alaskan Beaufort Sea, Elsevier, 115–135, https://doi.org/10.1016/B978-0-12-079030-2.50012-5, 1984.
Wadhams, P. and Doble, M. J.: Digital terrain mapping of the underside of sea ice from a small AUV, Geophys. Res. Lett., 35, L01501, https://doi.org/10.1029/2007GL031921, 2008.
Wadhams, P. and Toberg, N.: Changing characteristics of arctic pressure ridges, Polar Sci., 6, 71–77, https://doi.org/10.1016/j.polar.2012.03.002, 2012.
Wadhams, P., Wilkinson, J. P., and McPhail, S. D.: A new view of the underside of Arctic sea ice, Geophys. Res. Lett., 33, L04501, https://doi.org/10.1029/2005GL025131, 2006.
Webster, M. A., Holland, M., Wright, N. C., Hendricks, S., Hutter, N., Itkin, P., Light, B., Linhardt, F., Perovich, D. K., Raphael, I. A., Smith, M. M., von Albedyll, L., and Zhang, J.: Spatiotemporal evolution of melt ponds on Arctic sea ice, Elem. Sci. Anthr., 10, 000072, https://doi.org/10.1525/elementa.2021.000072, 2022.
WMO: World Meteorological Organization (WMO) Sea Ice Nomenclature: WMO-No. 259 922, Supplement to Vol. I, II and II, 5th session of JCOMM Expert Team on Sea ice. Tech. rep., https://doi.org/10.25607/OBP-1530, 2014.