the Creative Commons Attribution 4.0 License.
the Creative Commons Attribution 4.0 License.
 | 10 Mar 2022
Multi-decadal retreat of marine-terminating outlet glaciers in northwest and central-west Greenland
Ian Joughin
The retreat and acceleration of marine-terminating outlet glaciers in Greenland over the past 2 decades have been widely attributed to climate change. Here we present a comprehensive annual record of glacier terminus positions in northwest and central-west Greenland and compare it against local and regional climatology to assess the regional sensitivity of glacier termini to different climatic factors. This record is derived from optical and radar satellite imagery and spans 87 marine-terminating outlet glaciers from 1972 through 2021. We find that in this region, most glaciers have retreated over the observation period and widespread regional retreat accelerated from around 1996. The acceleration of glacier retreat coincides with the timing of sharp shifts in ocean surface temperatures, the duration of the sea-ice season, ice-sheet surface mass balance, and meltwater and runoff production. Regression analysis indicates that terminus retreat is most sensitive to increases in runoff and ocean temperatures, while the effect of offshore sea ice is weak. Because runoff and ocean temperatures can influence terminus positions through several mechanisms, our findings suggest that a variety of processes – such as ocean-interface melting, mélange presence and rigidity, and hydrofracture-induced calving – may contribute to, but do not conclusively dominate, the observed regional retreat.
- Article
(5724 KB) - Full-text XML
-
Supplement
(1816 KB) - BibTeX
- EndNote


The Greenland Ice Sheet has lost significant mass over the last few decades (Enderlin et al., 2014; Shepherd et al., 2020) as many of its glaciers have retreated (Hill et al., 2017; Howat and Eddy, 2011; King et al., 2020; Moon and Joughin, 2008; Murray et al., 2015), and ice flow has accelerated (Joughin et al., 2010; Moon et al., 2012; Rignot and Kanagaratnam, 2006). Recent Greenland ice loss has contributed to rates at times approaching 1 mm a−1 of global sea-level rise (Shepherd et al., 2020), with the contribution from northwest and central-west Greenland combined representing nearly half of the cumulative contribution from Greenland to sea-level rise since 1972 (Mouginot et al., 2019). Although surface mass balance has dominated Greenland's mass loss in the past 2 decades, over half of the mass loss in northwest and central-west Greenland is currently due to ice discharge (Mouginot et al., 2019), which has accelerated since 2000 in this region (King et al., 2020).
Changes in ice discharge are often related to changes to glacier terminus positions, with terminus retreat into deeper water driving acceleration and upstream thinning (Howat et al., 2008; Joughin et al., 2008b). Because of the relationship between the terminus position and calving rate, initial perturbations that increase calving can trigger further glacier retreat. While glacier retreat and acceleration are generally linked to changes at the terminus, it remains unclear which processes are most responsible for controlling perturbations to calving rates and subsequent terminus retreat (Straneo et al., 2013).
The recent acceleration and retreat of Greenland outlet glaciers have been attributed to warmer ocean temperatures (Fahrner et al., 2021; Holland et al., 2008; Howat et al., 2008; Morlighem et al., 2016; Rignot et al., 2012; Slater et al., 2019; Wood et al., 2021), to changes in the characteristics of sea ice and mélange – icebergs bound by a sea-ice matrix (Amundson et al., 2010; Carr et al., 2013; Cassotto et al., 2015; Foga et al., 2014; Joughin et al., 2008a; Moon et al., 2015), and to increased melting and crevassing associated with warming air temperatures (Benn et al., 2007; Nick et al., 2013; van der Veen, 1998). In turn, responses to these forcings are modulated by geometric factors associated with individual glaciers such as bed topography and fjord width (Carr et al., 2015; Catania et al., 2018; Felikson et al., 2021; Schild and Hamilton, 2013); for many glaciers, these modulating factors necessitate detailed records of terminus position changes in order to identify the importance of different forcing mechanisms on decadal-scale outlet glacier changes across a large area.
Most previous studies of Greenland outlet glacier terminus positions have been temporally or spatially limited. Some studies cover the entire ice sheet for over a decade but map termini only decadally or in non-consecutive years (Howat and Eddy, 2011; Moon and Joughin, 2008). Other studies map termini more frequently but only for a small sector of the ice sheet (Bjørk et al., 2012; McFadden et al., 2011; Moon et al., 2015) or for a few specific glaciers (Holland et al., 2016; Joughin et al., 2008b; Larsen et al., 2016; Motyka et al., 2017; Schild and Hamilton, 2013). Murray et al. (2015) mapped terminus positions at high spatial and temporal resolutions but only for a single decade. More recent studies have attempted to fill these observational gaps with ice-sheet-wide analyses of annual terminus positions spanning multiple decades (Fahrner et al., 2021; King et al., 2020; Wood et al., 2021), although they come to differing conclusions about the drivers of observed terminus retreat.
In this paper, we analyze glacier change at a high spatiotemporal resolution by constructing a multi-decadal (49 years) record of annual terminus positions for 87 marine-terminating outlet glaciers in northwest and central-west Greenland. This record allows us to identify the behavior of individual glaciers as well as regional trends in the magnitude and timing of glacier retreat. We compare this regional behavior with climate data – sea-surface and subsurface temperatures; sea-ice concentration; and ice-sheet surface mass balance, precipitation, melt, and runoff – to assess the relative influence of different forcing mechanisms on multi-decadal and annual terminus retreat in this sector of Greenland. It is important to note that we do not account for the effect of geometric factors such as bed topography on modulating the retreat of individual glaciers, as we instead focus on terminus retreat in connection with regional climate trends.
We used 455 synthetic aperture radar (SAR) mosaics and optical satellite images to trace annual terminus positions for 87 marine-terminating outlet glaciers in northwest and central-west Greenland (68.9 to 78.2∘ N) (Fig. 1) from 1972 through 2021.
2.1 Satellite images
We digitized terminus positions from SAR images acquired by the European Copernicus Programme's Sentinel-1A and Sentinel-1B and the Canadian Space Agency's Radarsat-1 satellites for 13 of the 49 years in our record. These radar satellites are able to image the surface regardless of clouds or darkness. For the most recent 7 years (2014/15 through 2020/21), we traced terminus positions in mosaics of Copernicus Sentinel-1A and Sentinel-1B images (Joughin et al., 2016a). These mosaics are typically created from images acquired in the early February of their respective years and have a 25 or 50 m product-dependent resolution. Radarsat-1 mosaics were used to trace terminus positions for six winters (2000/01, 2005/06–2008/09, 2012/13) (Joughin et al., 2015; Moon and Joughin, 2008). These mosaics are formed from images collected from October through March and have nominal resolutions of 20 m.
For the remaining 36 years in our record, we used imagery from all Landsat missions to map terminus positions. We also used Landsat imagery to map individual glacier termini where they were missing from or indiscernible in the SAR imagery. We prescreened images in the USGS Global Visualization Viewer (GloVis) to confirm that glaciers of interest were not obscured by clouds and that the images were georeferenced well. We continued to use Landsat 7 images after the instrument's scan-line corrector failure in 2003 as Landsat 5 images were typically unavailable over our study area during this period, although we kept only images which retained a sufficient number of data to map the terminus. In those images, we digitized across the scan-line corrector gaps when they crossed a glacier terminus (Supplement Fig. S1); comparison of temporally close images with different data gaps indicates that this method only marginally increases errors. In all, the scan-line corrector gaps affected 348 terminus traces (9.7 % of the dataset). Due to winter darkness, we could not select images from the same time of year as the SAR mosaics; instead, we chose images as close to winter as possible, with a preference for spring over autumn to capture a more winter-like state to reduce the effects of seasonal variation (Fig. 2). As a result, the majority of the Landsat images we used were collected in spring (March–May). Because of the difficulty in finding sunlit, cloud-free imagery, however, we had to use data from other periods, so all months except January and December are represented. For some glaciers there are several years with missing data. The image resolution ranges from 15 m (Landsat 8 panchromatic band) to 60 m (Landsat 1–5 Multispectral Scanner). We digitized termini using the panchromatic band for Landsat 7 and Landsat 8 and using a single band that provided high image contrast (typically band 2) for Landsat 1–Landsat 5.
2.2 Terminus positions
Using ArcGIS, we manually traced annual terminus positions from the radar and Landsat imagery. This dataset builds on a preexisting dataset covering six winters between 2000 and 2013 (Joughin et al., 2015; Moon and Joughin, 2008). The study area ranges from Saqqarliup Sermia (68.9∘ N, 50.3∘ W; ∼ 35 km southwest of Jakobshavn Isbræ) to Bamse Gletsjer (78.2∘ N, 72.7∘ W) (Fig. 1). Individual glacier names and coordinates are detailed in Supplement Table S1. To focus our analysis on glaciers that produce substantial ice discharge, we limited our analysis to marine-terminating outlet glaciers that are at least ∼ 1.5 km wide at the terminus and are flowing at a rate of at least ∼ 1000 m a−1. We traced each glacier's terminus position once per hydrological year (1 September through 31 August; Ettema et al., 2009) in every year for which suitable imagery was available. We used winter or near-winter imagery whenever possible as indicated by Fig. 2.
Errors in terminus position may arise from both the imagery used and the digitization process. The primary sources of errors introduced by the image data are the uncertainties in position after orthorectification and georeferencing. To reduce such errors, candidate images were compared with control images and discarded if they were noticeably offset or distorted. Manual digitization also introduces errors, which are exacerbated by poor image resolution and image artifacts (such as shadows or an indistinct transition from glacier to mélange) (Joughin et al., 2015). If a terminus position was ambiguous in one image, it was flagged during tracing and compared with close-in-time images from the same satellite platform or other satellite platforms when possible. Digitization errors are typically comparable to the image resolution; for example, a 25 m error for a Landsat 7 image with a 30 m resolution (Moon et al., 2015)
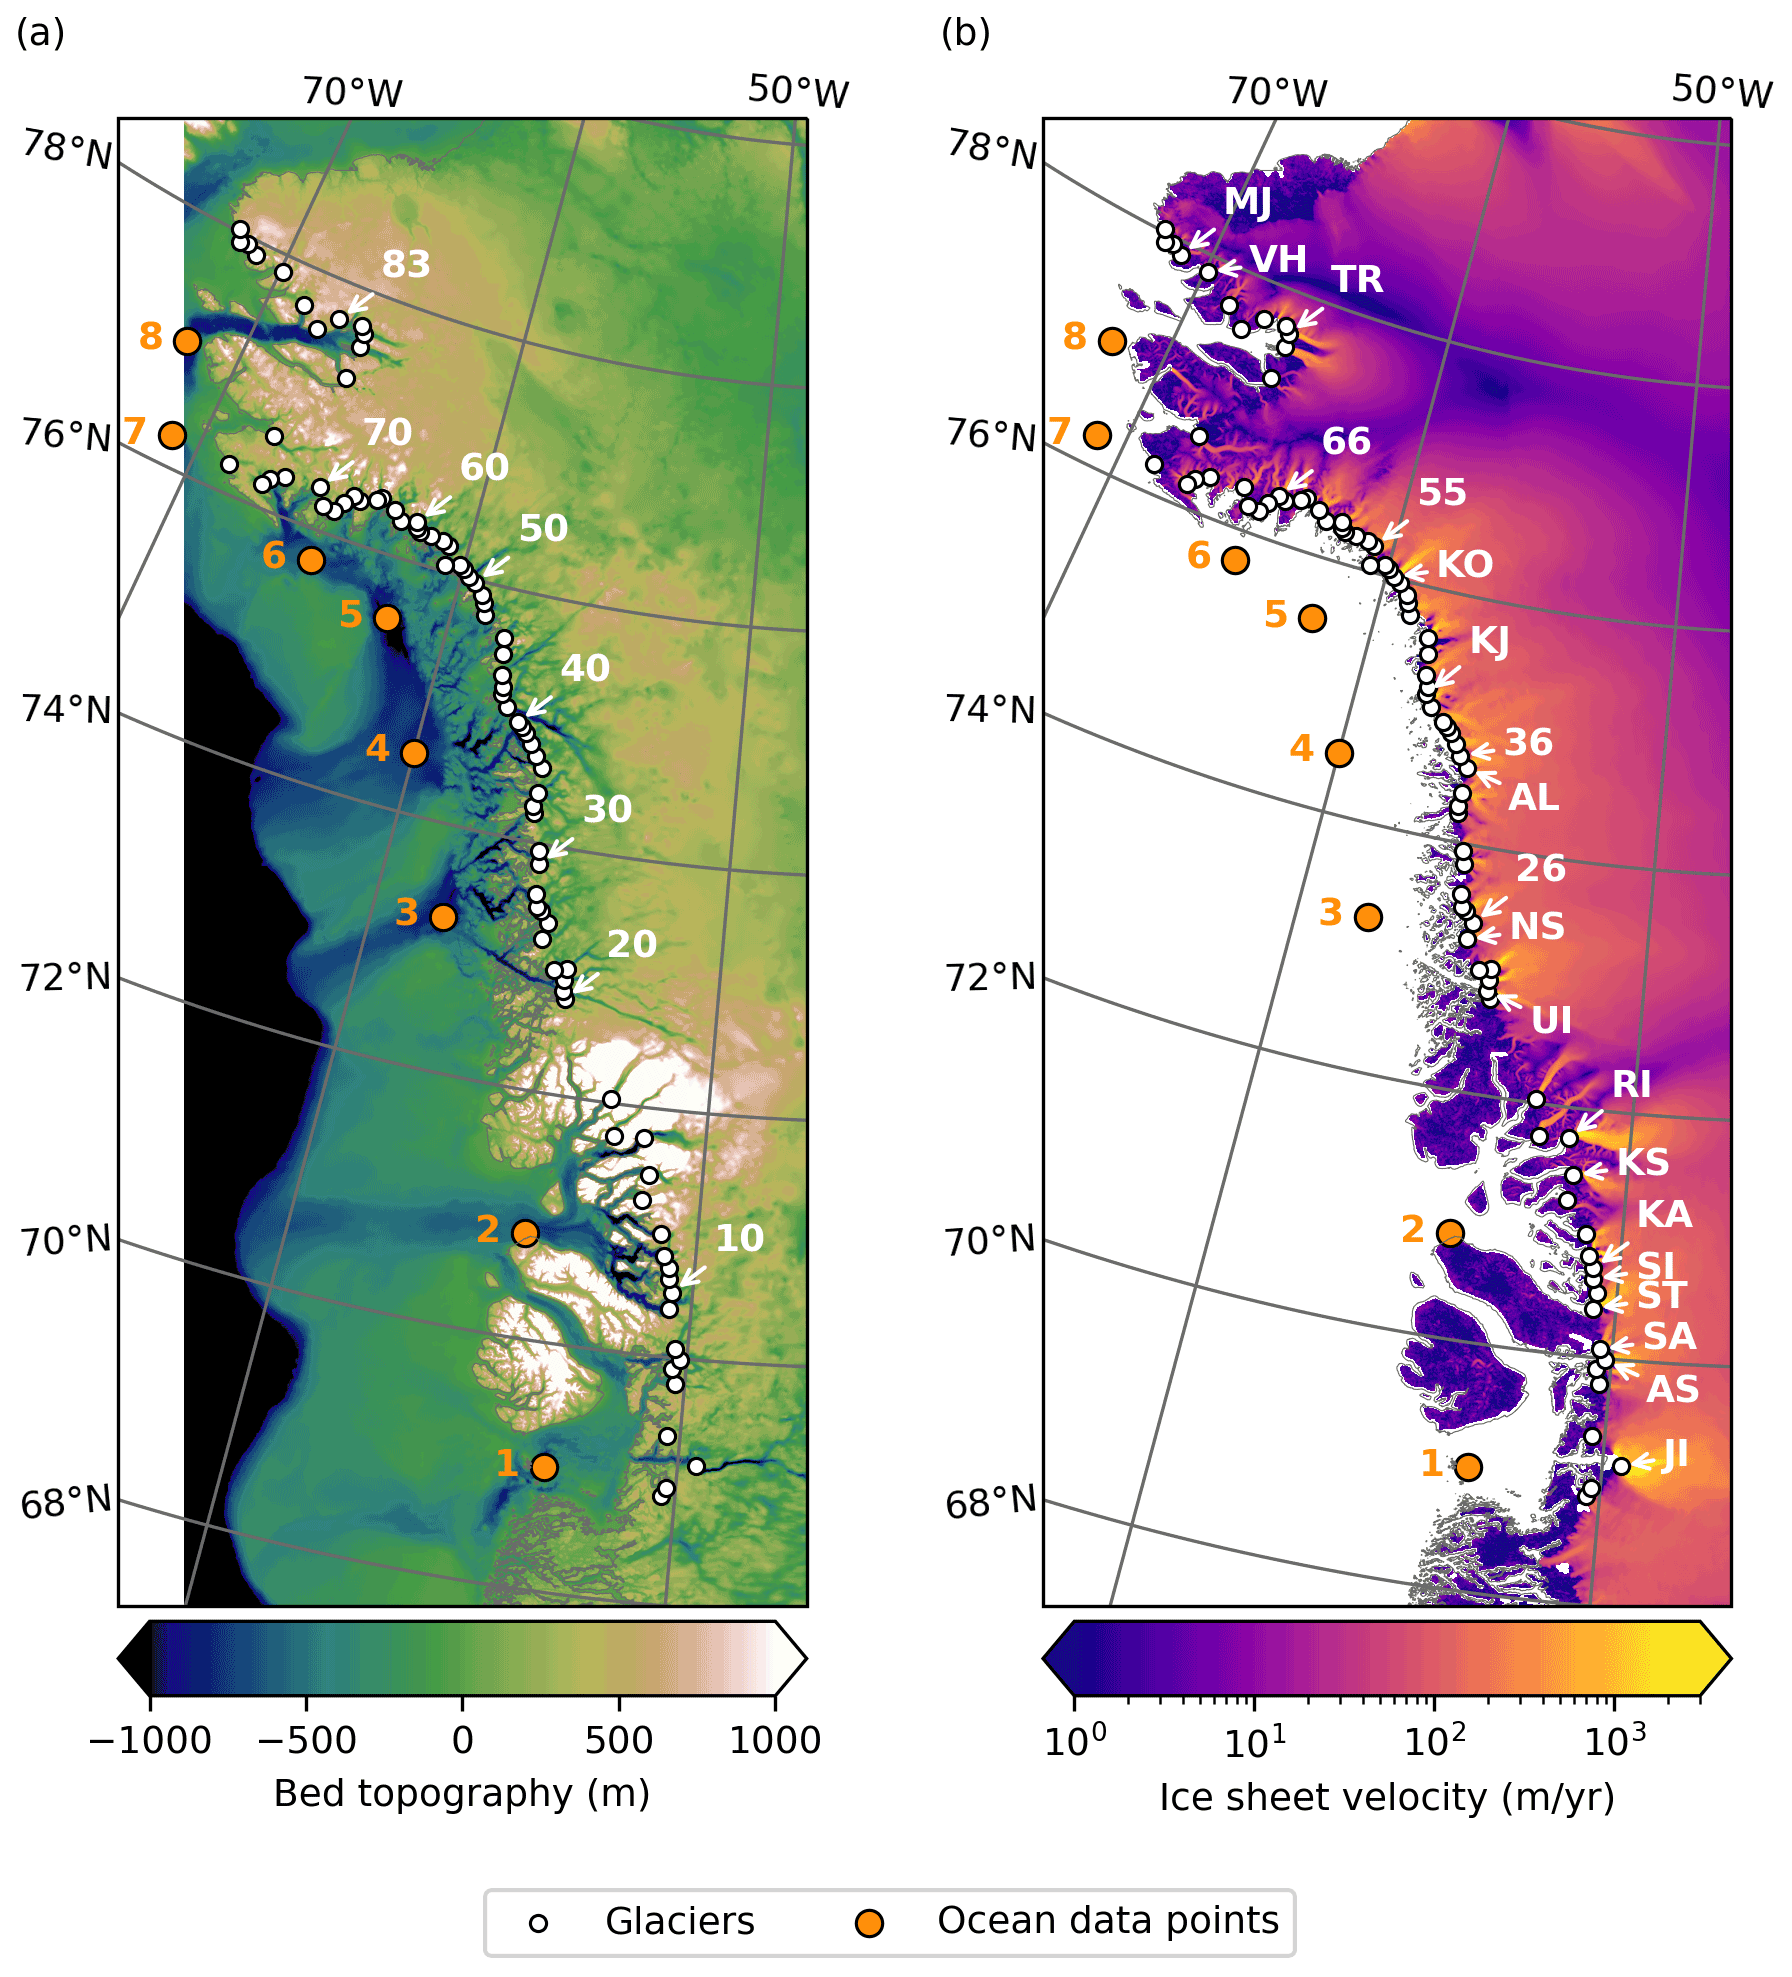
Figure 1Map of study area, showing individual glacier locations (white) and points where ocean data were acquired (orange, numbered). Glacier labels are (a) every 10th glacier, numbered, and (b) specific glaciers named in the paper, abbreviated as follows: Jakobshavn Isbræ (JI), Alianaatsup Sermia (AS), Sermeq Avannarleq (SA), Store Gletsjer (ST), Sermilik Isbræ (SI), Kangilleq (KA), Kangerlussuup Sermia (KS), Rink Isbræ (RI), Upernavik Isstrøm (UI), Naajarsuit Sermiat (NS), unnamed glacier no. 26 (26), Alison Glacier (AL), unnamed glacier no. 36 (36), Kjer Gletsjer (KJ), Kong Oscar Gletsjer (KO), unnamed glacier no. 55 (55), unnamed glacier no. 66 (66), Tracy Gletsjer (TR), Verhoeff Gletsjer (VH), and Morris Jesup Gletsjer (MJ). Basemaps are (a) bed topography from BedMachine Greenland V3 (Morlighem et al., 2017b, a) and (b) ice-sheet velocity from MEaSUREs GIMP (Joughin et al., 2016b, 2018a).
In addition to the errors associated with digitization of the images, there is additional uncertainty introduced by sampling seasonal variability at different times of year. For the terminus positions mapped from Landsat imagery, it was not possible to obtain sunlit and cloud-free images over each glacier at the same time every year (Fig. 2). This timing variation complicates the year-to-year comparison at a glacier, which might include seasonal variability in the terminus position. Such seasonal variability could produce some short-term deviations in our data; for example, Moon et al. (2015) found a mean annual terminus range of 610 m for a subset of our study glaciers. However, the data collection season is largely consistent across each of our glaciers (Fig. 2), and because these seasonal errors are not independent, they tend to cancel out over longer periods. Since we mostly focus on decadal-scale trends, issues of seasonal sampling should not greatly affect our results.
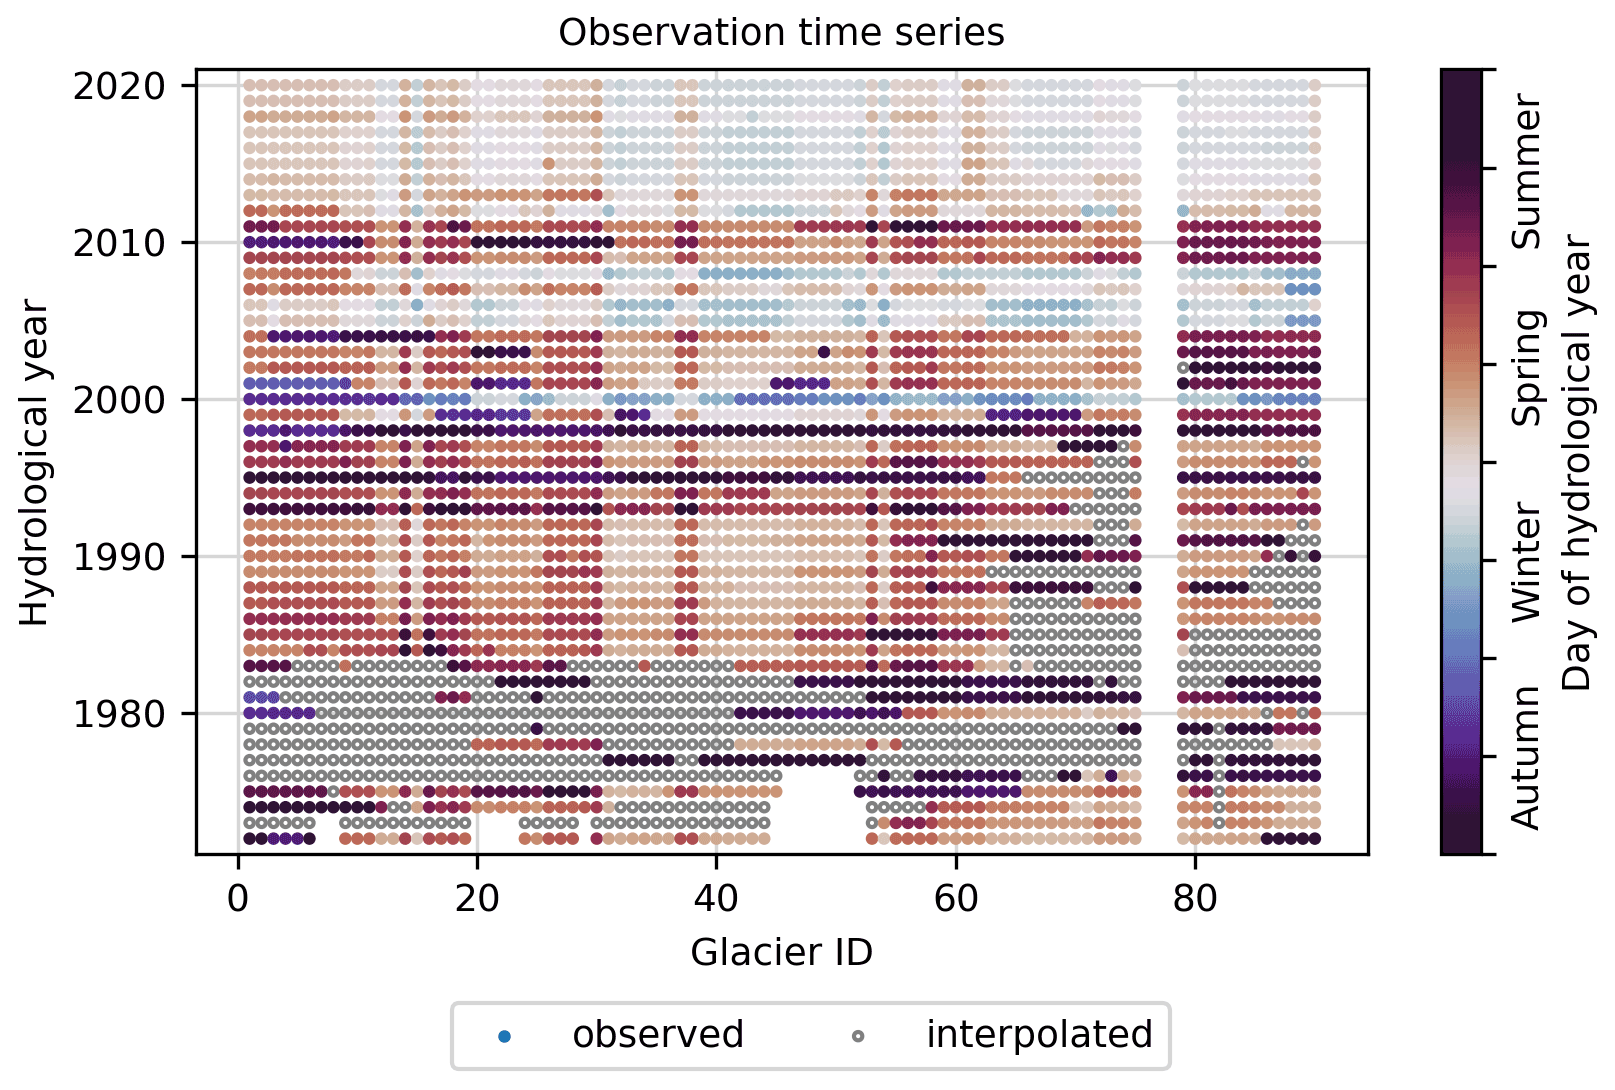
Figure 2Years in which a terminus position was observed (filled circles) for each glacier, colored by the season of the observation. If a terminus position was not observed, an estimated position was interpolated (open circles) from prior and subsequent observations to use in annual analyses. Glacier nos. 76–78 are not shown because they are not ice-sheet outlet glaciers and therefore are not included in this study.
2.3 Glacier change measurements
We calculated glacier area change over time using the box method (Moon and Joughin, 2008). Each glacier has a static, open-ended reference box (polygon) that approximately delineates the main region of ice flow. The box sides are roughly parallel to ice flow, and the “back” of the box is perpendicular to ice flow at an arbitrary location up-glacier of the extent of maximum observed terminus retreat (see example in Fig. 3). Where a terminus trace intersects the open end of the box, the polygon is closed, and the area of that polygon represents the glacier's reference area at that point in time. Repeating this process for each terminus trace for a glacier forms a time series of reference areas, from which we determine the annual area change. While the areas are arbitrarily determined by the box size, the area differences between successive terminus traces represent the annual gain or loss of area. By focusing on the area change between measurements rather than the absolute area of each measurement, we can ignore the arbitrariness of how the boxes are drawn, as well as any small regions of stagnant ice that may be included within the box boundaries. There is a small error associated with these area-change measurements because the boxes do not completely conform to the glacier sides.
As length change can provide a more intuitive measure of retreat than area change, we determine the nominal length change by scaling the area change by the average width of the box to obtain an approximate length change. This measurement should be interpreted as a proxy for length change rather than an exact measurement. Compared to the centerline method of measuring length change, this method is less sensitive to uncertainties in the centerline position at the terminus.
In years when no observations were made, we linearly interpolated between the prior and subsequent observations to estimate glacier length and area during the missing years (Fig. 2). For glaciers with missing observations at the beginning of the record, we did not interpolate prior to the first observation in the record. The largest temporal gap interpolated is 9 years (1975/76 through 1983/84), at Sermeq Avannarleq (no. 8). Most temporal gaps are in the 1970s and early 1980s, with additional gaps into the 1990s for some high-latitude glaciers, and there are no temporal gaps after 2002.
Because it is difficult to compare changes in area between glaciers of different sizes, we also determined the percent area change over time for each glacier. For each individual glacier area time series, we normalized the minimum observed glacier area to 0 and the maximum observed glacier area to 1 and linearly scaled the other measured areas between those set points. This method normalizes every glacier's area change to the same 0–1 scale, allowing straightforward comparison of size changes between different glaciers. Because the equivalent length is simply a scaled area, the results are identical for area and length.
To pinpoint the timing of changes in glacier area and length, we performed a break-point analysis on the time series for each glacier. We fit each time series with a piecewise linear function with two segments (Jekel and Venter, 2019); the break point between the two segments corresponds to a year in the time series that is the best fit for approximating the time series as a two-segment piecewise linear function. We performed an F test to determine whether the piecewise linear function was statistically a better fit than a single linear regression and discarded any break points that were not statistically significant (p<0.05).
2.4 Climate data
Earlier work has shown that climate-related processes including terminus ablation and undercutting (driven by ocean warming) (Holland et al., 2008; Motyka et al., 2011; Slater et al., 2019; Rignot et al., 2012; Wood et al., 2021), mélange rigidity (driven by changes in ocean temperature, sea-ice concentration, and/or runoff) (Carr et al., 2017; Joughin et al., 2020; Moon et al., 2015; Sohn et al., 1998; Todd and Christoffersen, 2014), and enhanced hydrofracture (driven by changes in runoff and surface mass balance) (Benn et al., 2007; Nick et al., 2010) may affect terminus position. Hence, we acquired several ice-sheet and oceanographic datasets in order to compare our glacier terminus position changes with climatic factors. For each variable and dataset, we considered the annual and decadal mean values. For the ice-sheet variables, we considered the annual mean at a fixed location near the front of each glacier, as well as the population annual and decadal means. For the oceanographic data, due to lack of reliable long-term data in narrow fjords, we used offshore observations as a proxy for fjord conditions. We used eight points offshore (Fig. 1), selected to be representative of clusters of glaciers: Disko Bay, Uummannaq Fjord, Upernavik Icefjord, south Melville Bay–Wilcox Head, central Melville Bay, north Melville Bay–Cape York, Wolstenholme Bay–Thule, and Inglefield Fjord (coordinates for each point are detailed in Supplement Table S2).
Ice-sheet surface mass balance, snowfall, rainfall, meltwater production, and runoff were extracted from the Modèle Atmosphérique Régional (MAR), Version 3.11, on a 6 km × 6 km grid over the period 1979–2020 (Fettweis et al., 2017).
Sea-surface temperatures came from the NASA JPL Estimating the Circulation and Climate of the Ocean (ECCO) consortium ocean circulation model, Version 5 (Forget et al., 2015; Zhang et al., 2018), on a ∘ × ∘ grid over the period 1992–2017, and the merged Hadley-OI sea-surface temperature and sea-ice concentration dataset (Hurrell et al., 2008; Shea et al., 2020), on a 1∘ × 1∘ grid over the period 1972–2020.
We also obtained subsurface temperatures from ECCO for most of our study area. In the Disko Bay area we used field observations from the ICES Dataset on Ocean Hydrography (ICES, 2014), collected over the period 1977–2016 by the Greenland Institute of Natural Resources. For both datasets, subsurface temperatures were averaged over the lower 60 % of the water column in order to capture warm water at depth while excluding the near-surface mixed layer. For the ECCO data, we applied a temperature correction to bring the data in line with Wood et al. (2021) (see Supplement).
Sea-ice concentration came from the merged Hadley-OI dataset, as well as the NOAA/NSIDC Climate Data Record of Passive Microwave Sea Ice Concentration, Version 3 (Meier et al., 2017; Peng et al., 2013), on a 25 km × 25 km grid over the period 1978–2019. For the sea-ice concentration, we calculated the annual duration of the period when sea-ice concentration exceeds 15 %, as well as the seasonal mean sea-ice concentration.
We produced a comprehensive multi-decadal dataset of terminus positions for glaciers in our study area and collected climate data both near the termini of these glaciers and in the ocean offshore of clusters of these glaciers.
3.1 Terminus positions
We created a dataset of 3606 annual terminus positions for our 87 selected glaciers from 1972/73 through 2020/21 (see example in Fig. 3). The median number of annual observations per glacier is 41, and nearly all glaciers were observed in 38 to 46 of the 49 years examined. Only three glaciers have fewer (33–34) observations; these glaciers are located just south of Thule Air Base and have limited imagery available in the 1980s and early 1990s. After interpolating area changes between glacier observations, the first year with either an observation or an interpolation available for each glacier is 1977/78. Therefore, our glacier analyses start in this year except where noted.
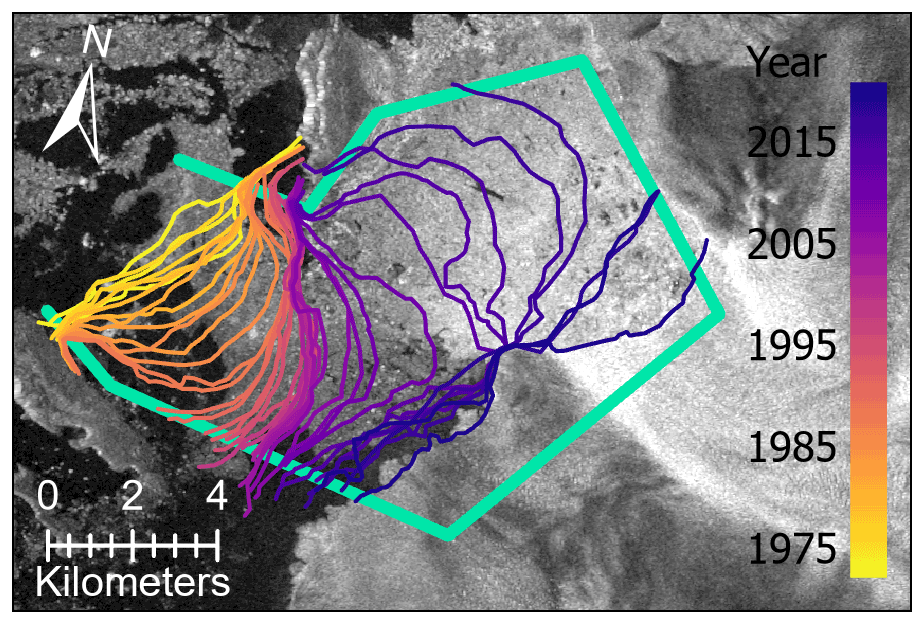
Figure 3Illustration of terminus traces and box method for Kjer Gletsjer (no. 42). Each trace intersects the glacier's box (green) to form a closed polygon. The areas of sequential polygons are differenced to create a time series of glacier area change. The basemap is a Sentinel-1 SAR mosaic from 4–9 February 2020.
3.1.1 Terminus behavior
The majority of the glaciers in our study area retreated between 1977 and 2021. The cumulative area loss of all of these glaciers is 1067 km2, equivalent to a cumulative retreat of 287 km. The individual area and length changes are plotted in Fig. 4 with glaciers with the greatest change broken out separately. We identify these dominant glaciers as those with a net change falling more than 2 standard deviations beyond the population mean, which yields four glaciers that dominate the area change: Jakobshavn Isbræ (no. 3; −130.9 km2), Alison Glacier (no. 35; −59.4 km2), Kjer Gletsjer (no. 42; −81.5 km2), and Tracy Gletsjer (no. 81; −58.7 km2). These glaciers together are responsible for 31.0 % of the total area loss. Five glaciers dominate the length change: Jakobshavn Isbræ (−16.9 km), Alison Glacier (−14.7 km), Kjer Gletsjer (−14.7 km), Tracy Gletsjer (−14.0 km), and one unnamed glacier (no. 36; −11.1 km). These glaciers are cumulatively responsible for 24.9 % of the total retreat. For the remaining glaciers, the mean area change is −8.9 km2 and the mean length change is −2.6 km. Net area and length changes for individual glaciers are detailed in Supplement Table S3.
A total of 15 glaciers were stable in that the net changes in area were within 2 standard deviations of their respective observed interannual variability, and no glaciers advanced significantly over the observation period. The 15 stable glaciers are as follows: Alianaatsup Sermia (no. 7); Sermeq Avannarleq (no. 8); Store Gletsjer (no. 9); Sermilik (no. 11); Kangilleq (no. 12); Kangerlussuup Sermia (no. 16); Rink Isbræ (no. 17); Upernavik Isstrøm (no. 21); Naajarsuit Sermiat (no. 25); Kong Oscar Gletsjer (no. 51); Verhoeff Gletsjer (no. 86); Morris Jesup Gletsjer (no. 87); and unnamed glacier nos. 26, 55, and 66.
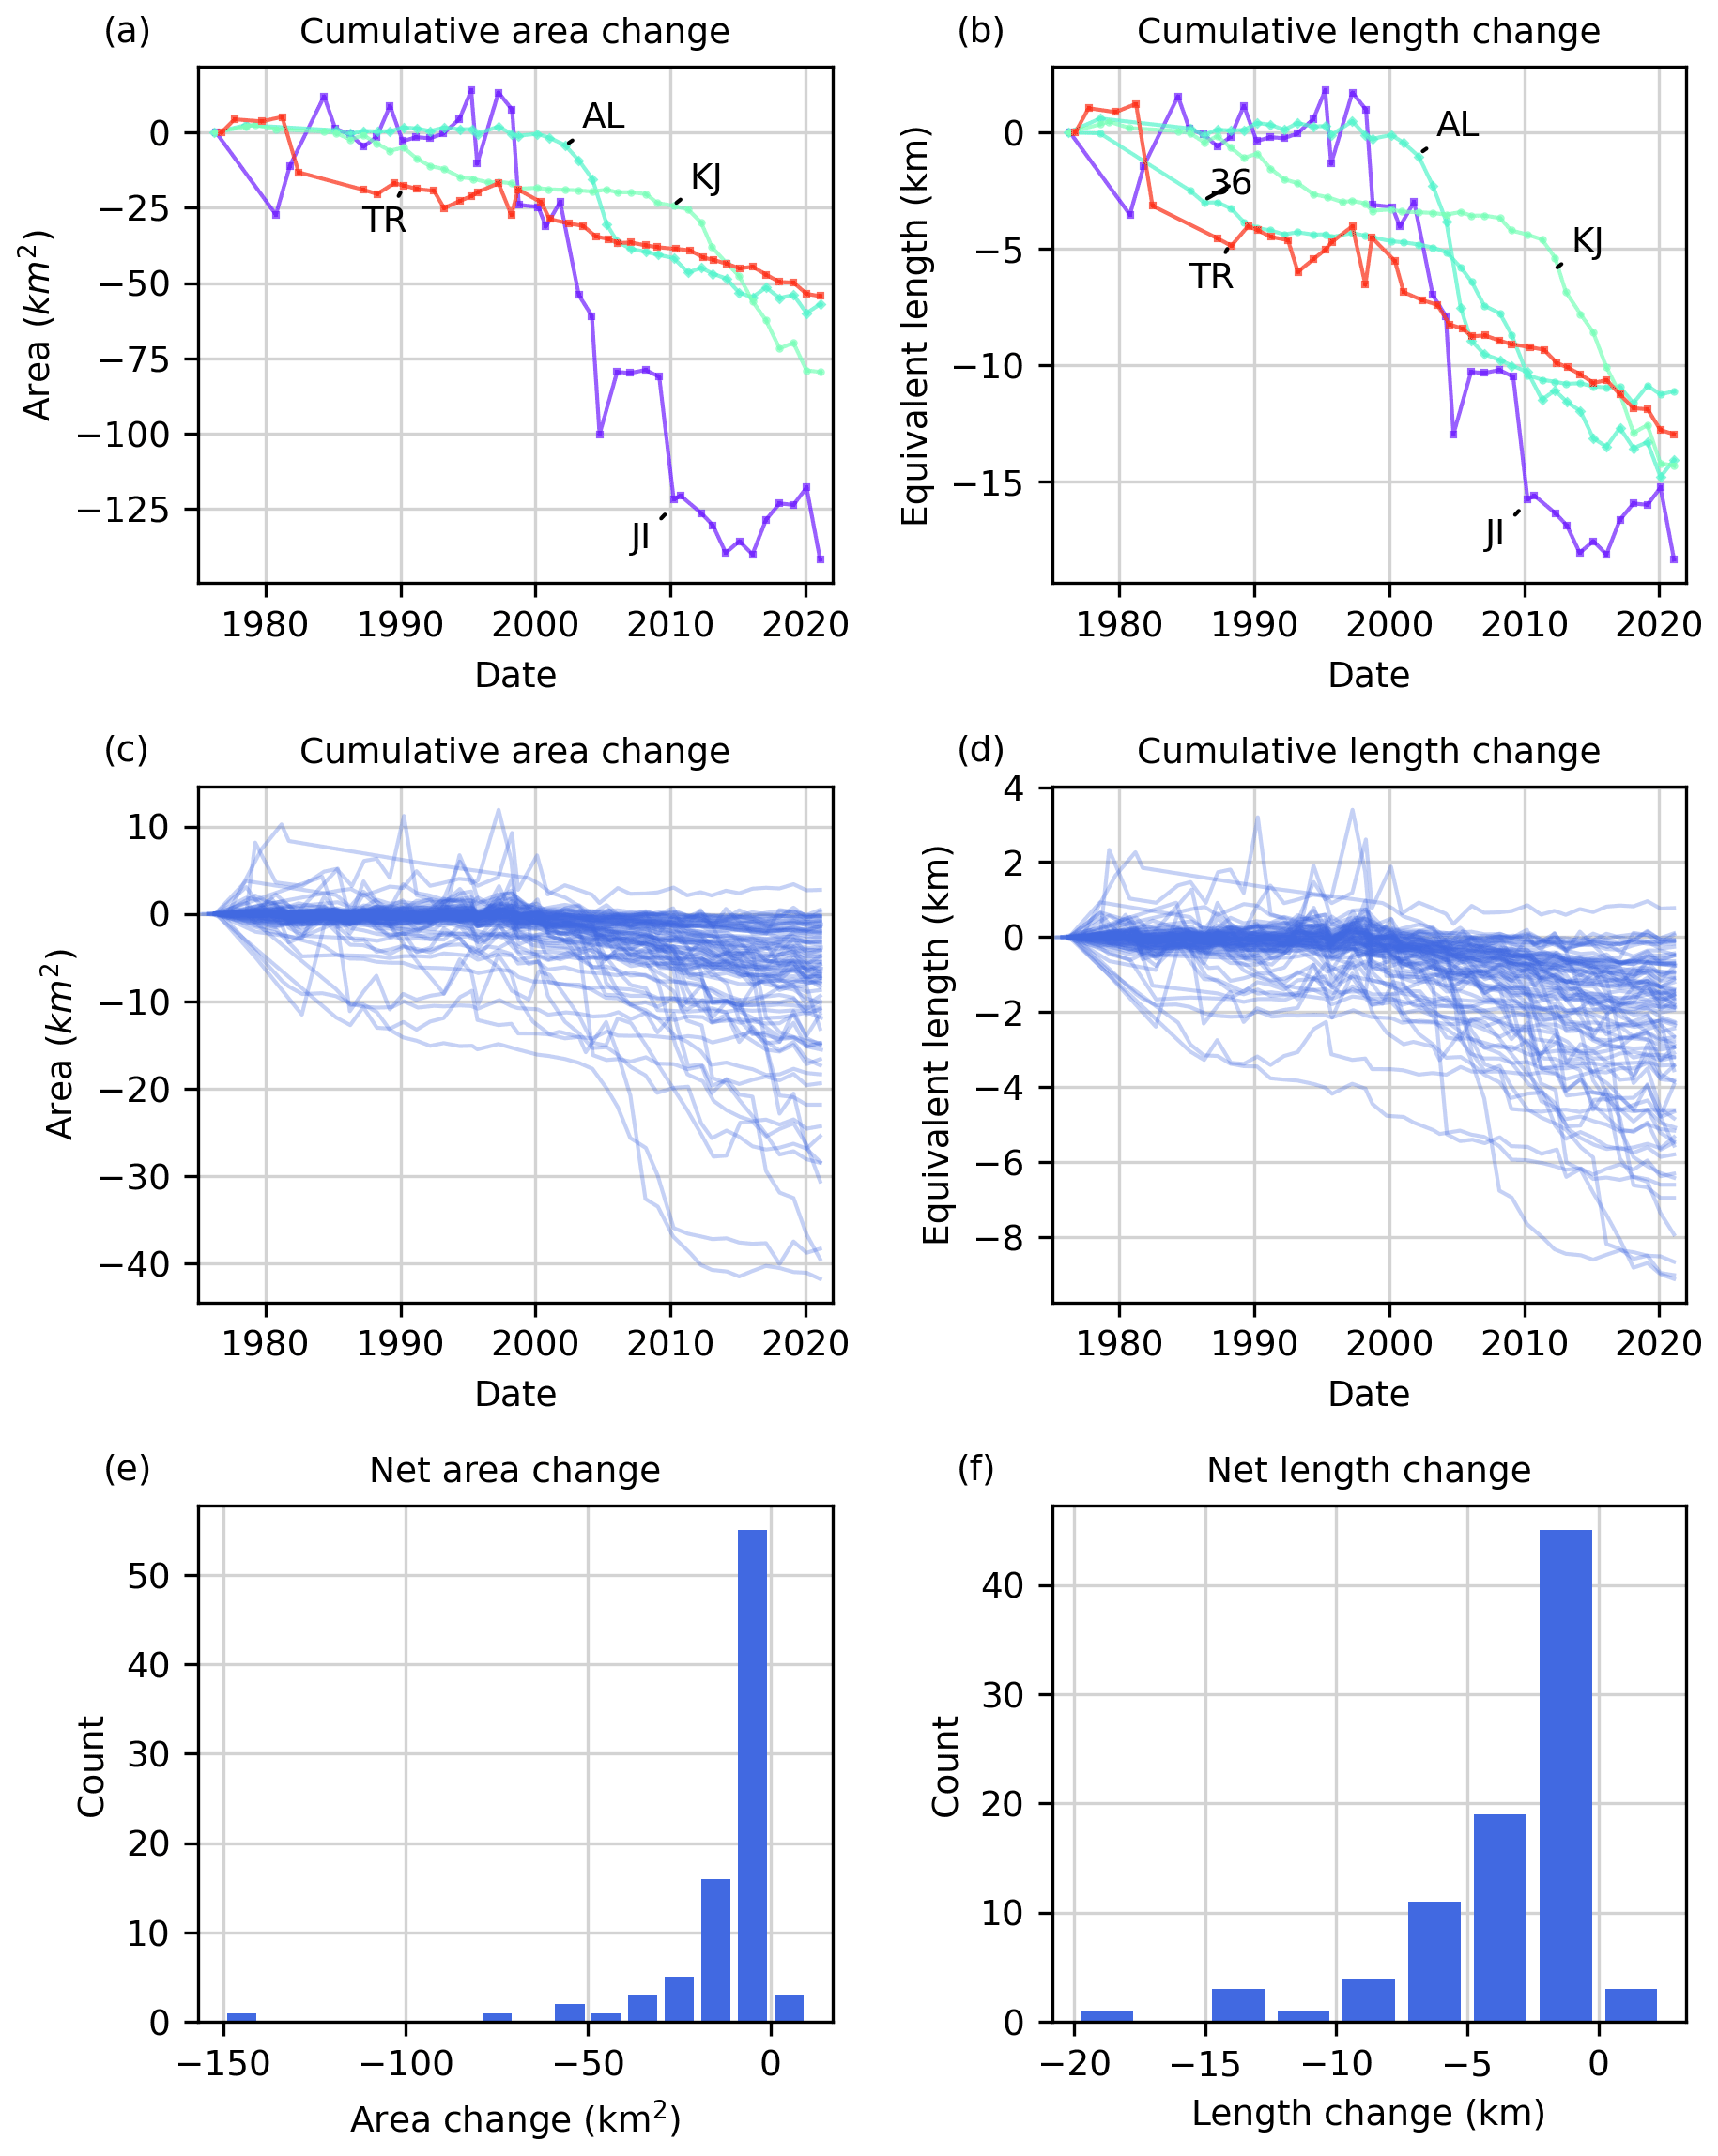
Figure 4Cumulative (a) area change and (b) length change for large glaciers that dominate the total observed change. Glacier changes in each plot are labeled using the abbreviation scheme in Fig. 1. The color map follows the order of the glaciers (from south to north), so glaciers with similar colors are spatially closer together. For all other glaciers, cumulative (c) area change and (d) length change are provided but not distinguished by glacier. The final net (e) area change and (f) length change are reported as histograms.
3.1.2 Timing of change
Because a small number of glaciers tend to dominate the overall trends in glacier changes, we scaled each glacier's length and area to a 0–1 scale as described above in order to consistently compare the relative timing of each glacier's behavior (Fig. 5a). The resulting data are noisy, so to better identify overall trends, we computed the mean and standard deviation of the scaled glacier changes (blue overlay in Fig. 5a). Of the observed mean size change (area or equivalent length), ∼ 4 % occurs each decade before 1996 and ∼ 31 % occurs each decade after 1996. The population of glaciers notably readvanced in 2017 and 2018 but began to retreat again in 2019.
We performed a break-point analysis (see Sect. 2.3) for each glacier's area time series (Fig. 5b). The step change in retreat rates in around 1996 for the normalized time series is consistent with the time series break points for individual glaciers. The most common break-point years were 1996/97 and 1997/98, with additional smaller peaks in break points in the mid-1990s and mid-2000s. The break-point years for each glacier are detailed in Supplement Table S3.
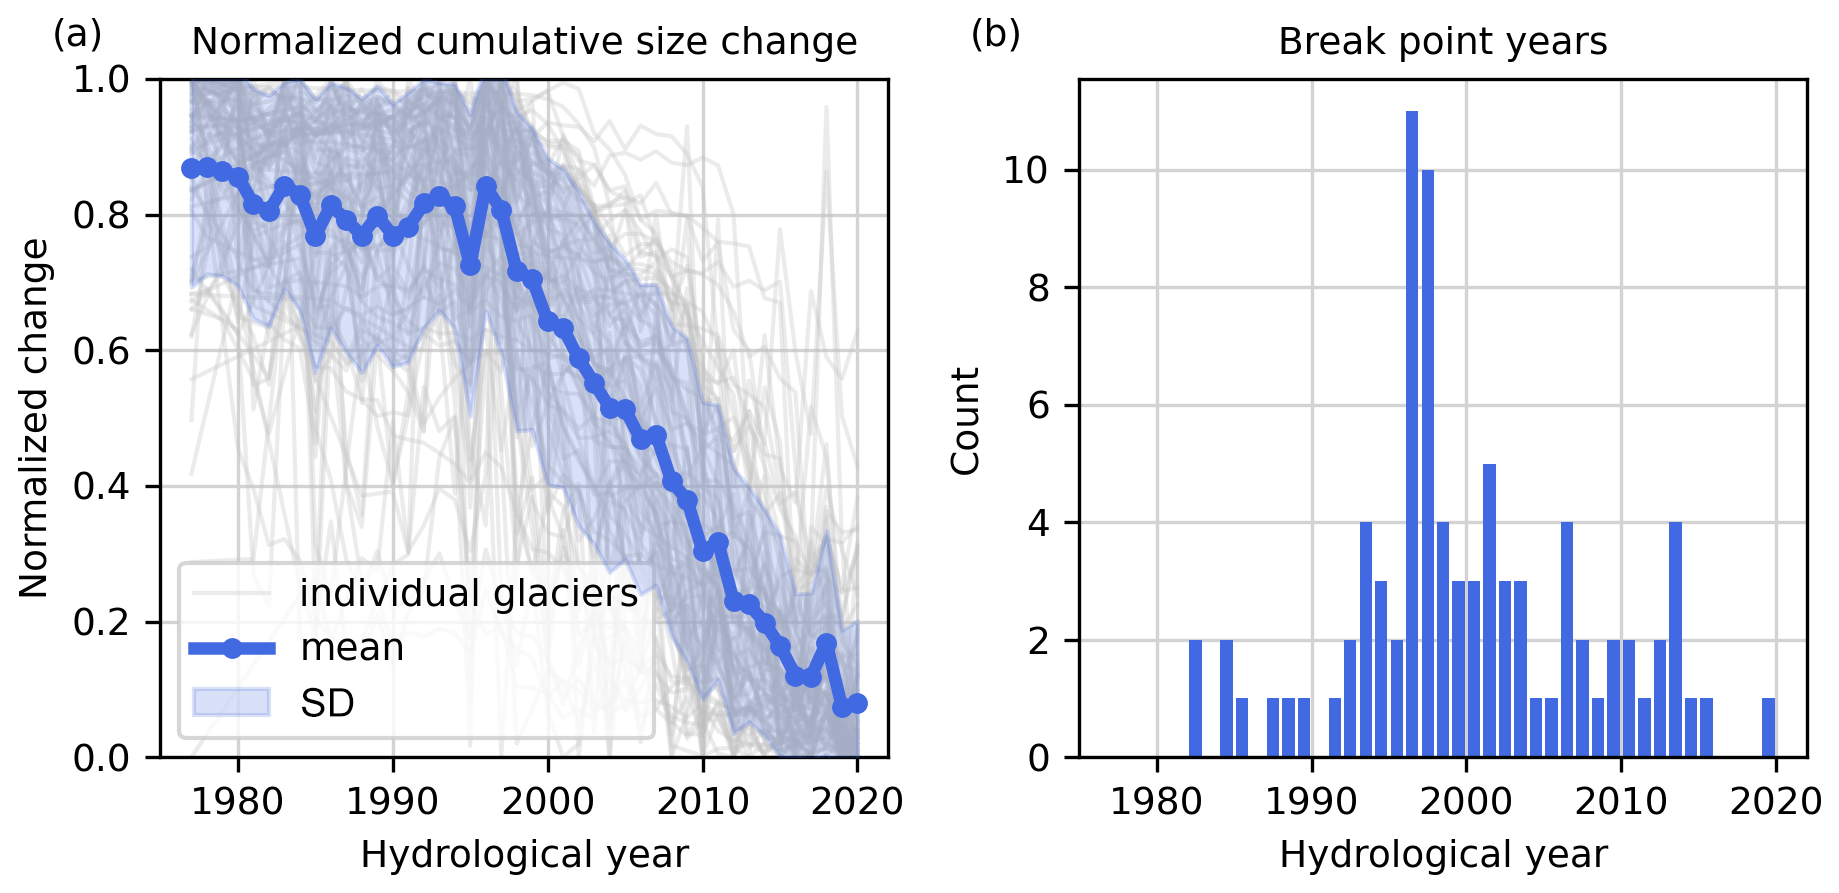
Figure 5Break-point analysis to identify the onset of increased terminus retreat rates. (a) Glacier cumulative area change is normalized such that for each glacier the greatest observed extent is 1 and the smallest observed extent is 0 so that glaciers of all sizes are placed on a common scale. Each glacier's cumulative change is then approximated as a two-segment piecewise linear function, and for cases where the piecewise linear function is statistically better than a linear regression, we compute (b) a histogram of the break-point year between the two segments.
3.2 Climate data
All of the climate variables that we surveyed showed long-term trends consistent with regional climate warming. Most of these variables, in most of the locations that we sampled, also showed a sharp change in their long-term trends between the 1990s and 2000s.
Figure 6 summarizes the data from the MAR climate model. While there is considerable interannual variability, the data indicate a net decrease in surface mass balance (Fig. 6a) and a net increase in both meltwater production (Fig. 6b) and runoff (Fig. 6c), with corresponding increases in the annual number of meltwater production days (Fig. 6d) and runoff days (Fig. 6e), that have occurred since the late 1970s. The mean surface mass balance was steady in the 1980s and 1990s but dropped by 0.48 m a−1 between the 1990s and the 2000s, primarily due to substantial increases in meltwater production (+0.42 m a−1) and runoff (+0.48 m a−1). By contrast, there were only small changes to the mean snowfall (−0.01 m a−1; Fig. 6f) and the mean rainfall (+0.02 m a−1; Fig. 6g) from the 1980s to the 2010s. For the 2010s, while the annual surface mass balance anomaly was positive in 2013, 2017, and 2018, it reached its lowest values for the full record in 2019 and 2020. These extremes are reflected in coincident meltwater production and runoff anomalies. For this decade as a whole, the decadal mean surface mass balance anomaly is slightly more negative than that of the 2000s and the decadal mean meltwater production and runoff continued to increase.
Like the mean meltwater production and runoff, the mean number of melt days (Fig. 6d) and runoff days (Fig. 6e) increased between the 1990s and the 2000s by 7 and 12 d, respectively. However, instead of continuing to increase in the 2010s, the number of melt and runoff days decreased, suggesting that the net increase in meltwater production and runoff was due to more intense melt events rather than a greater number of melt events.
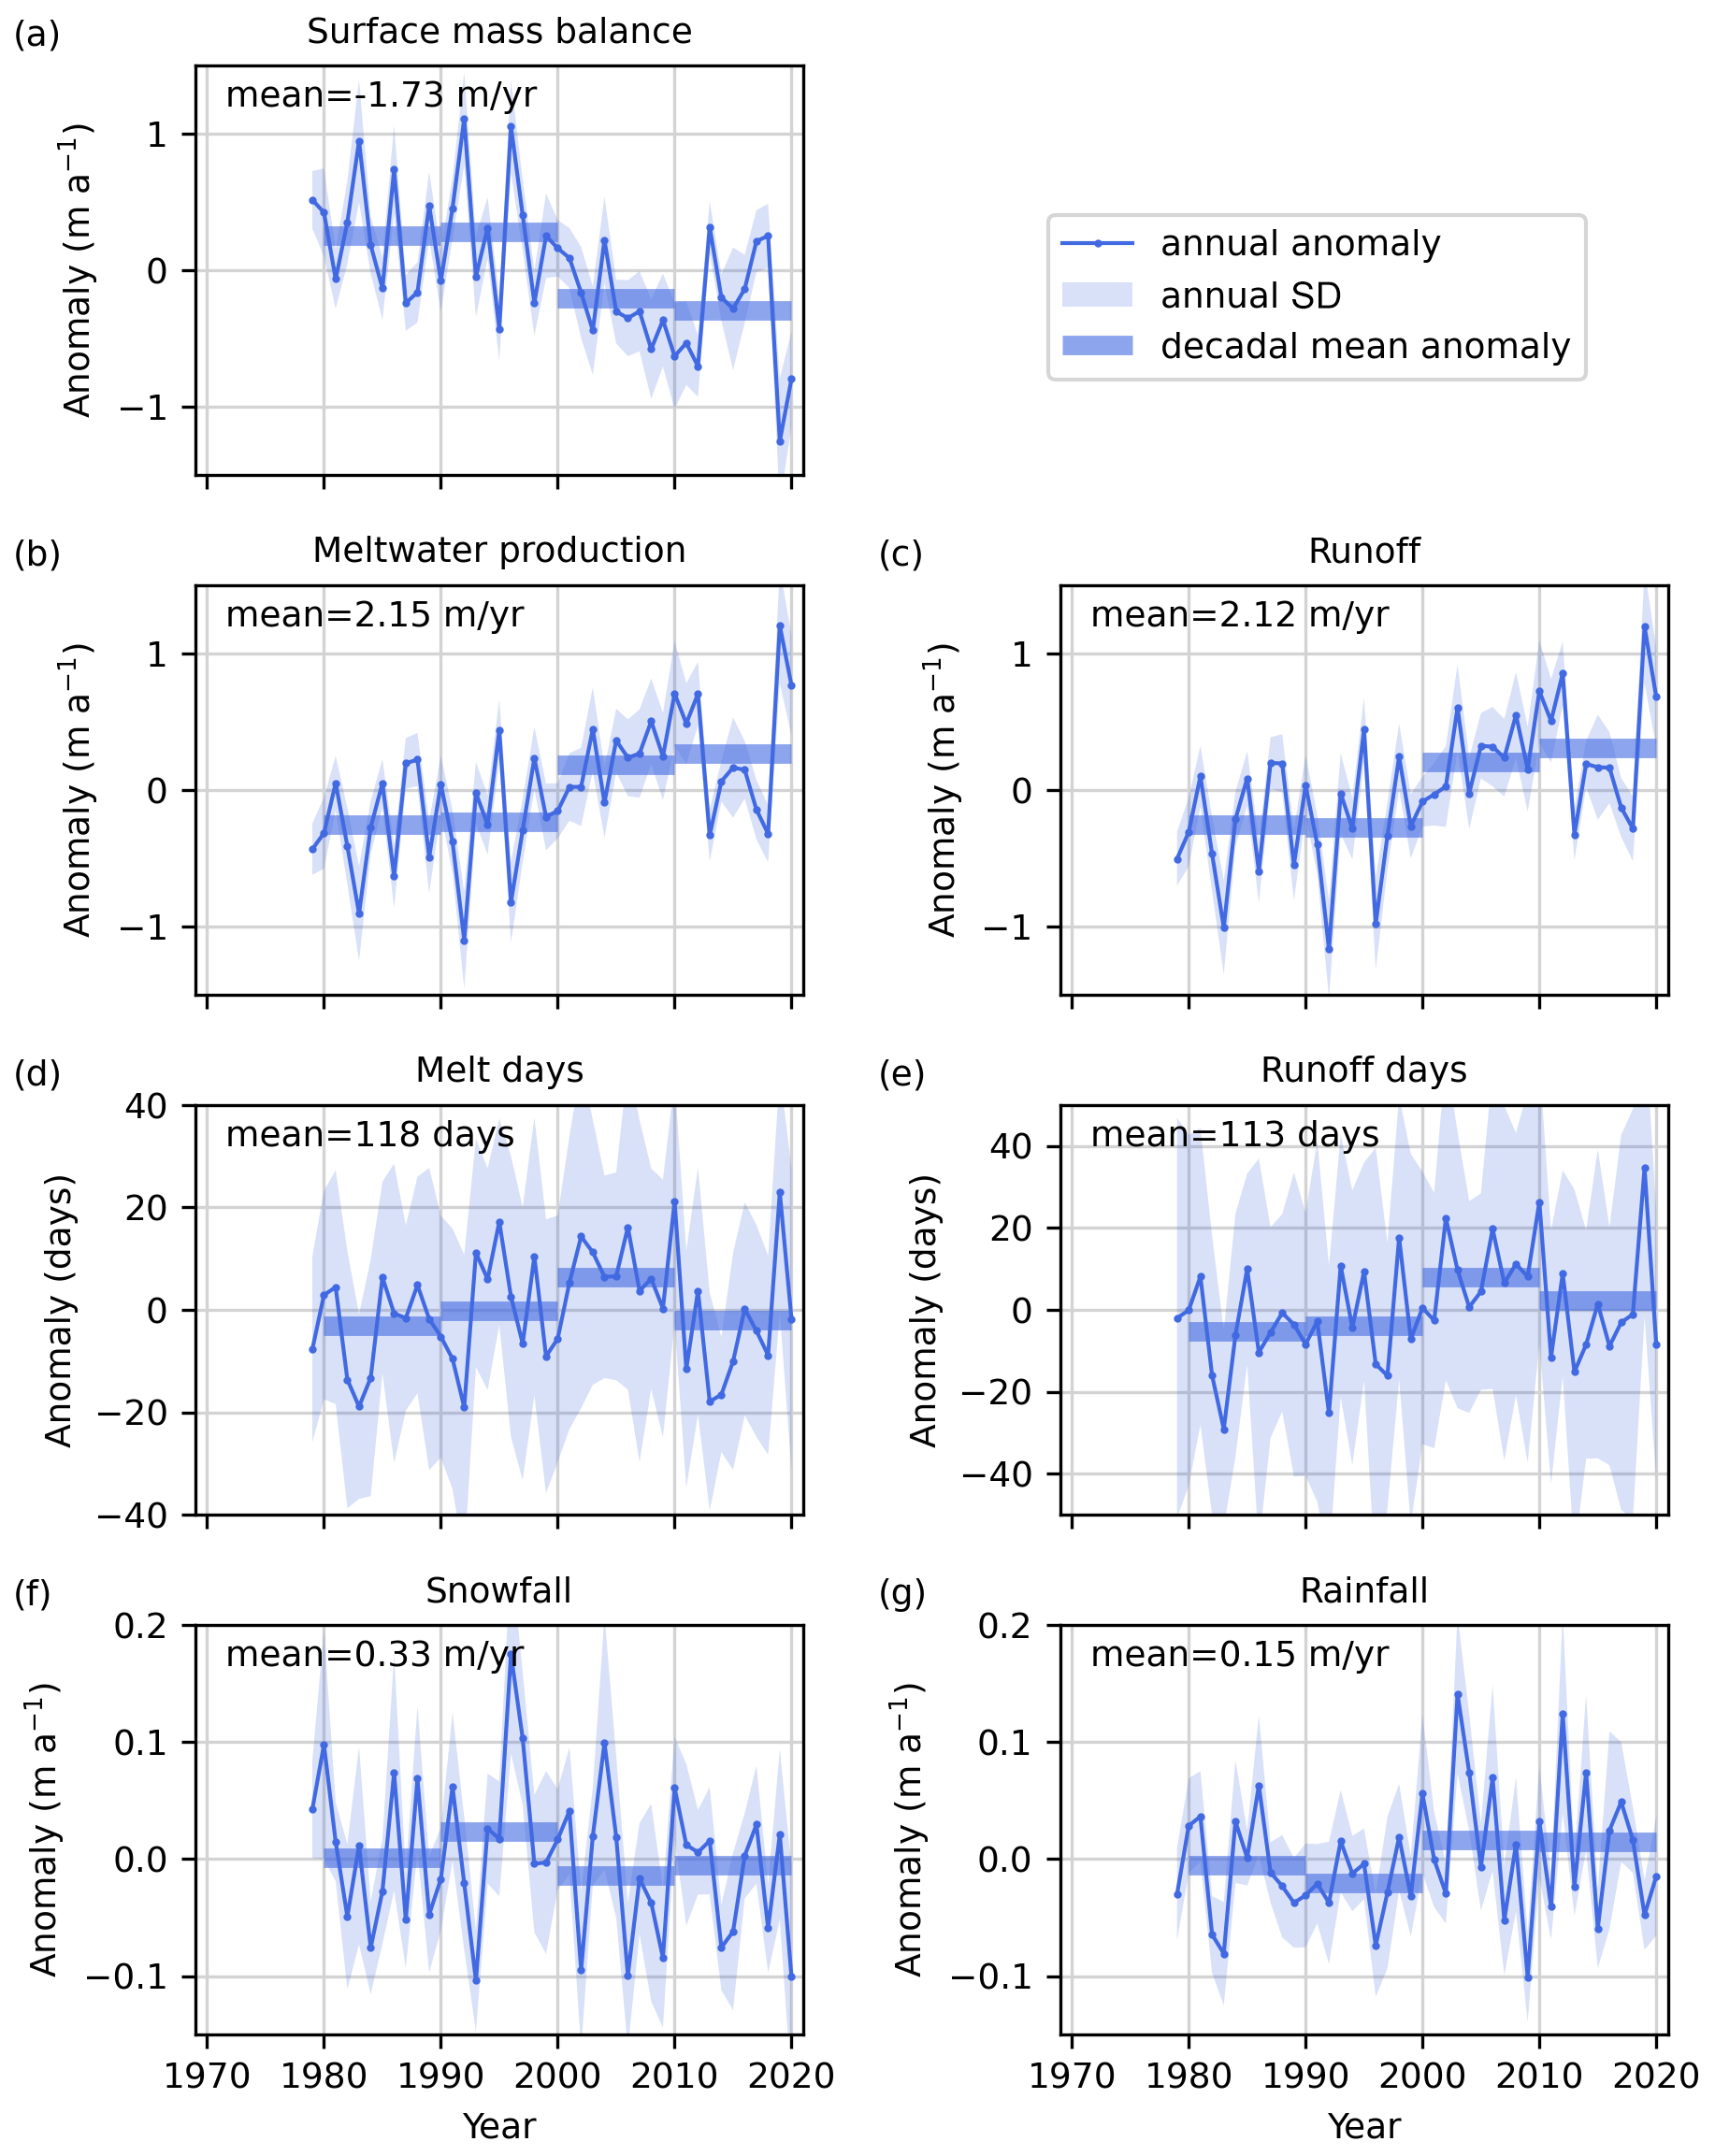
Figure 6Annual and decadal mean anomaly of (a) surface mass balance, (b) meltwater production, (c) number of melt days, (d) runoff, (e) number of runoff days, (f) snowfall, and (g) rainfall, from the MAR climate model, averaged over all glacier fronts in the study area. The mean for each anomaly is reported in each panel.
Figure 7a shows that Disko Bay warmed by between 0.21 ∘C (ICES) and 0.69 ∘C (ECCO) between the 1990s and 2000s and cooled in 2016–2017 (the final years of the two subsurface temperature datasets). North of Disko Bay (Fig. 7b–h), the decadal subsurface ocean temperatures followed a continuously increasing trend at every location we sampled. The temperature warmed substantially (0.79–1.07 ∘C) between the 1990s and 2000s at each of these locations, with a lesser magnitude of warming (0.01–0.45 ∘C) between the 2000s and the 2010s. The temperature trends, especially between the 1990s and the 2000s, are largely imposed by the corrections from Wood et al. (2021) (see Supplement).
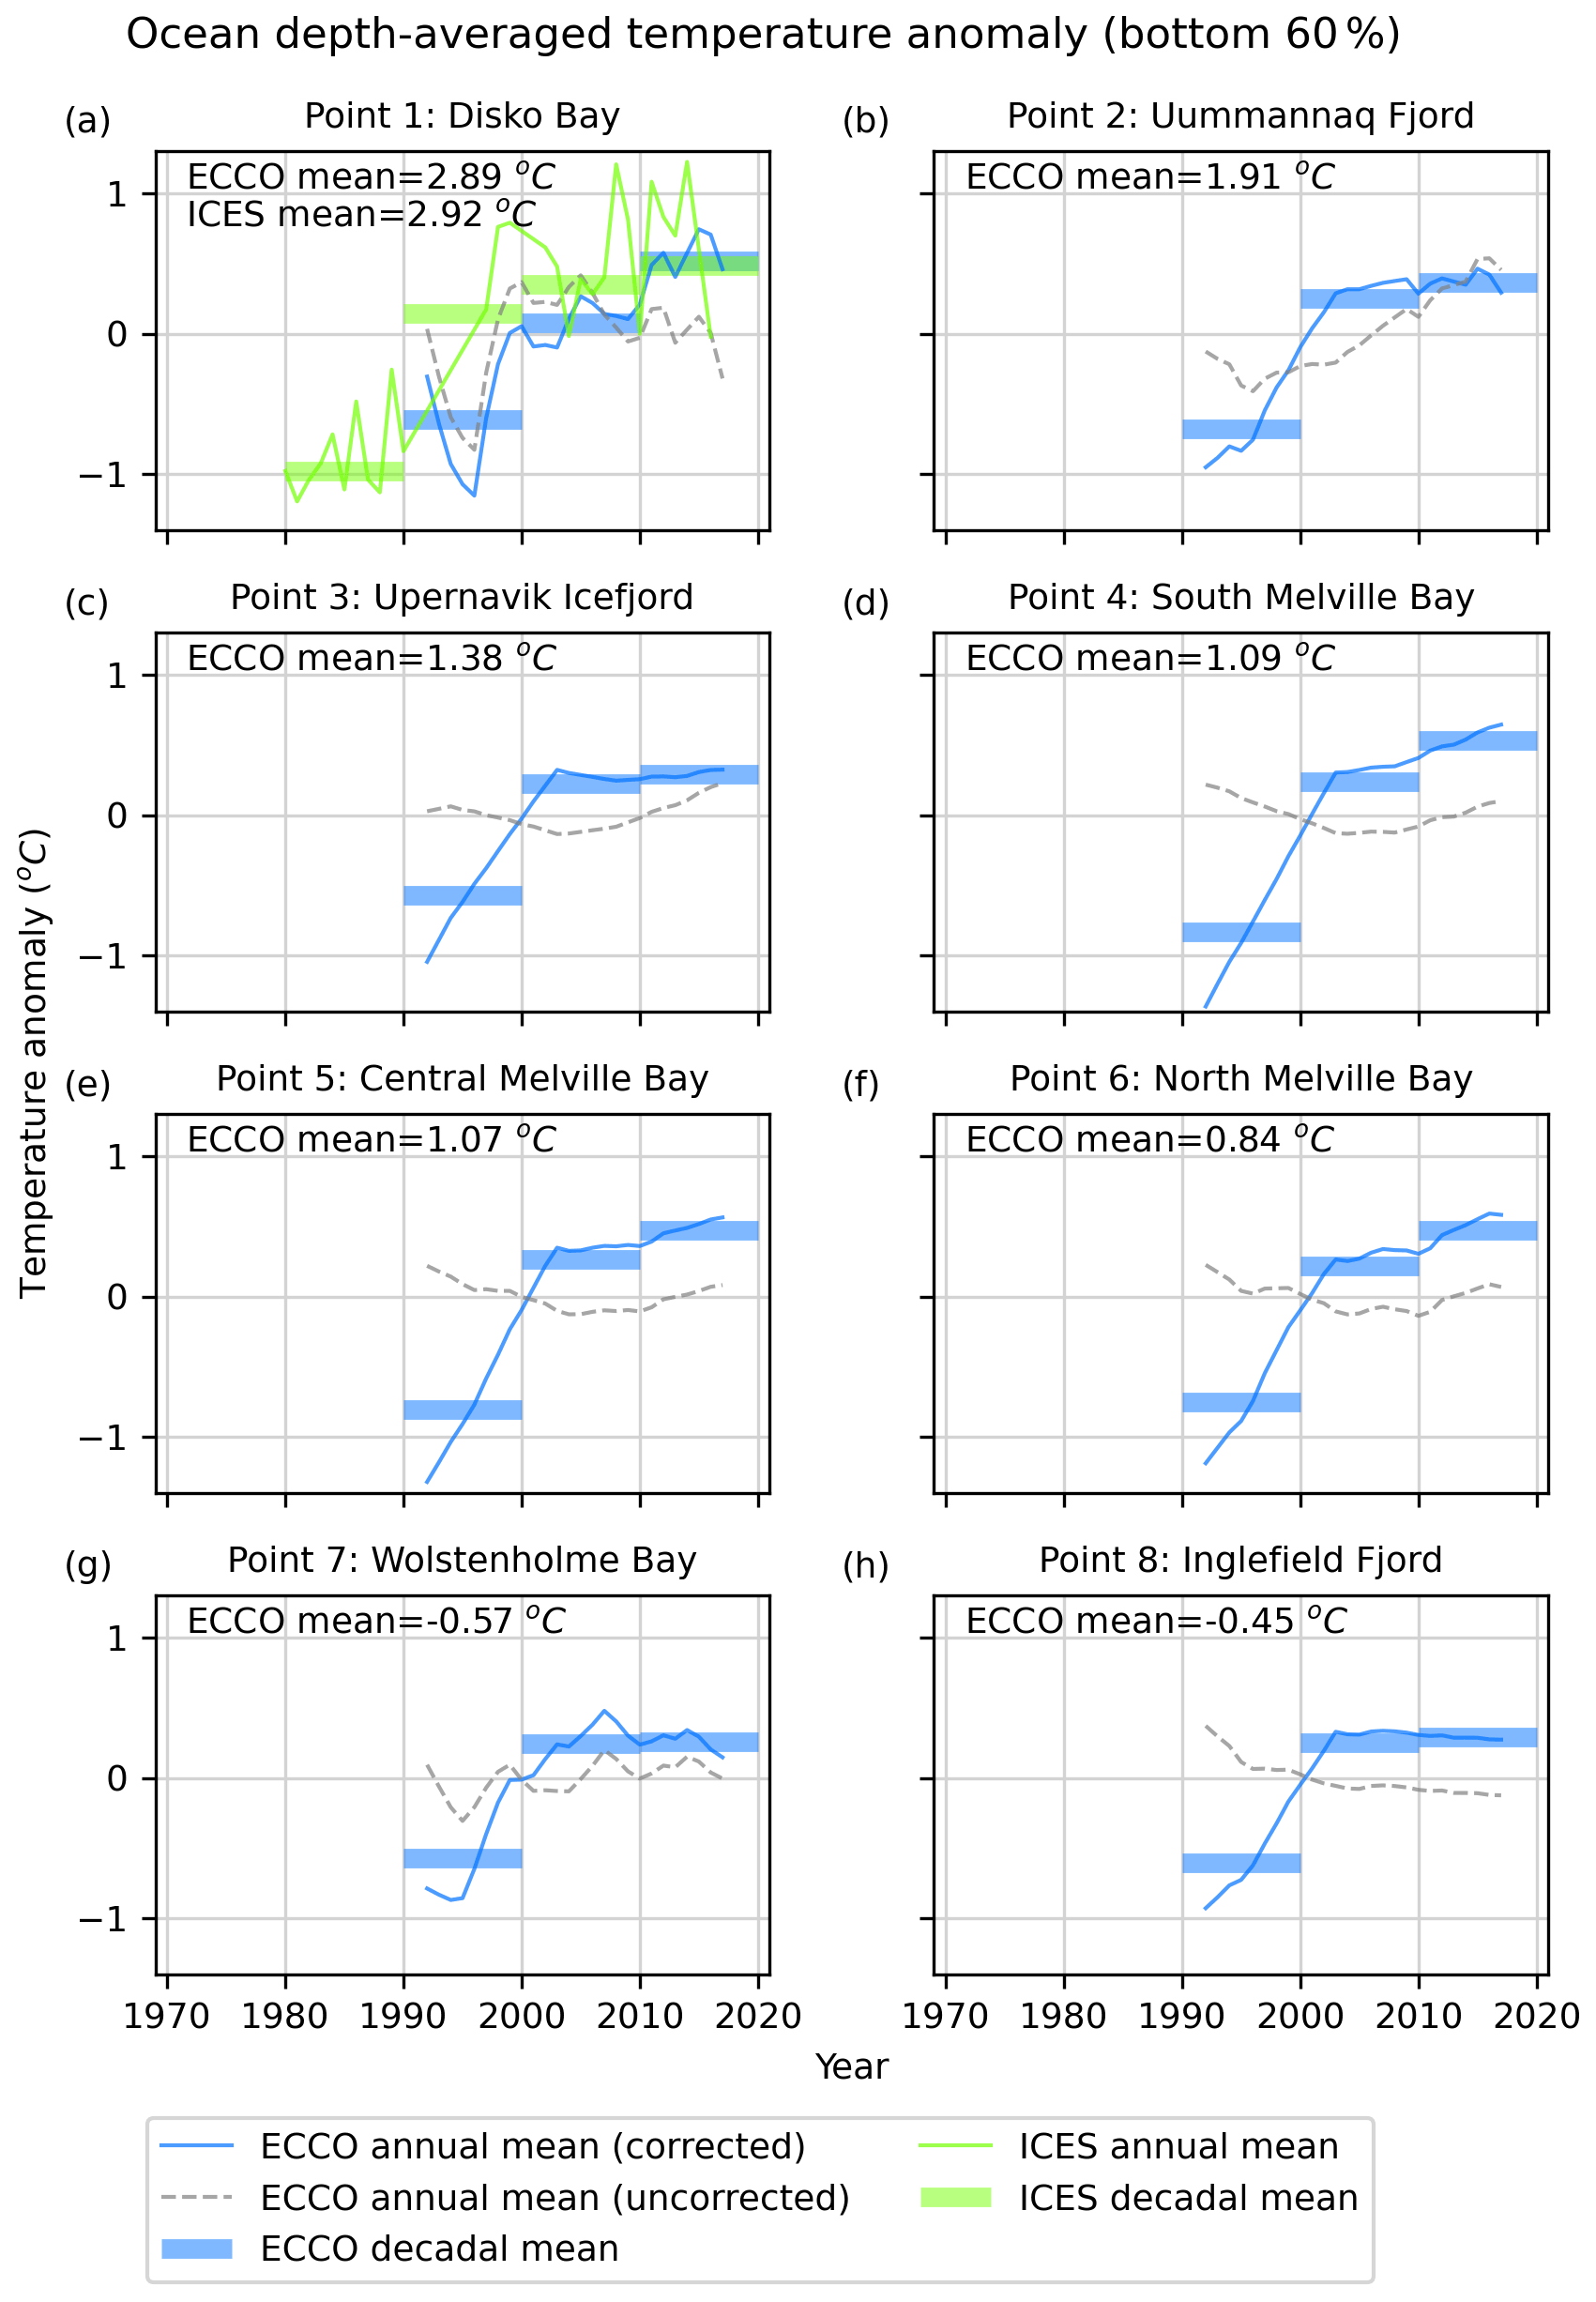
Figure 7Annual and decadal mean deepwater (bottom 60 %) ocean temperature anomaly from ECCO (blue) and ICES (green). Each panel corresponds with an ocean point in Fig. 1. The mean for each anomaly is reported in each panel. The “decadal” means are not taken over the entire decade in the 1990s (for ECCO) and 2010s due to lack of data.
Figure 8 shows that sea-surface temperatures (SST) were relatively steady in the 1970s and 1980s. At some locations the SSTs dipped slightly in the 1990s, followed by a sharp rise (0.57–0.78 ∘C from ECCO, 0.33–0.81 ∘C from Hadley-OI) in SSTs in the 2000s at all sites. SSTs in the 2010s were slightly warmer or cooler than in the 2000s, depending on the location and data source, but remained consistently above the pre-2000s temperatures.
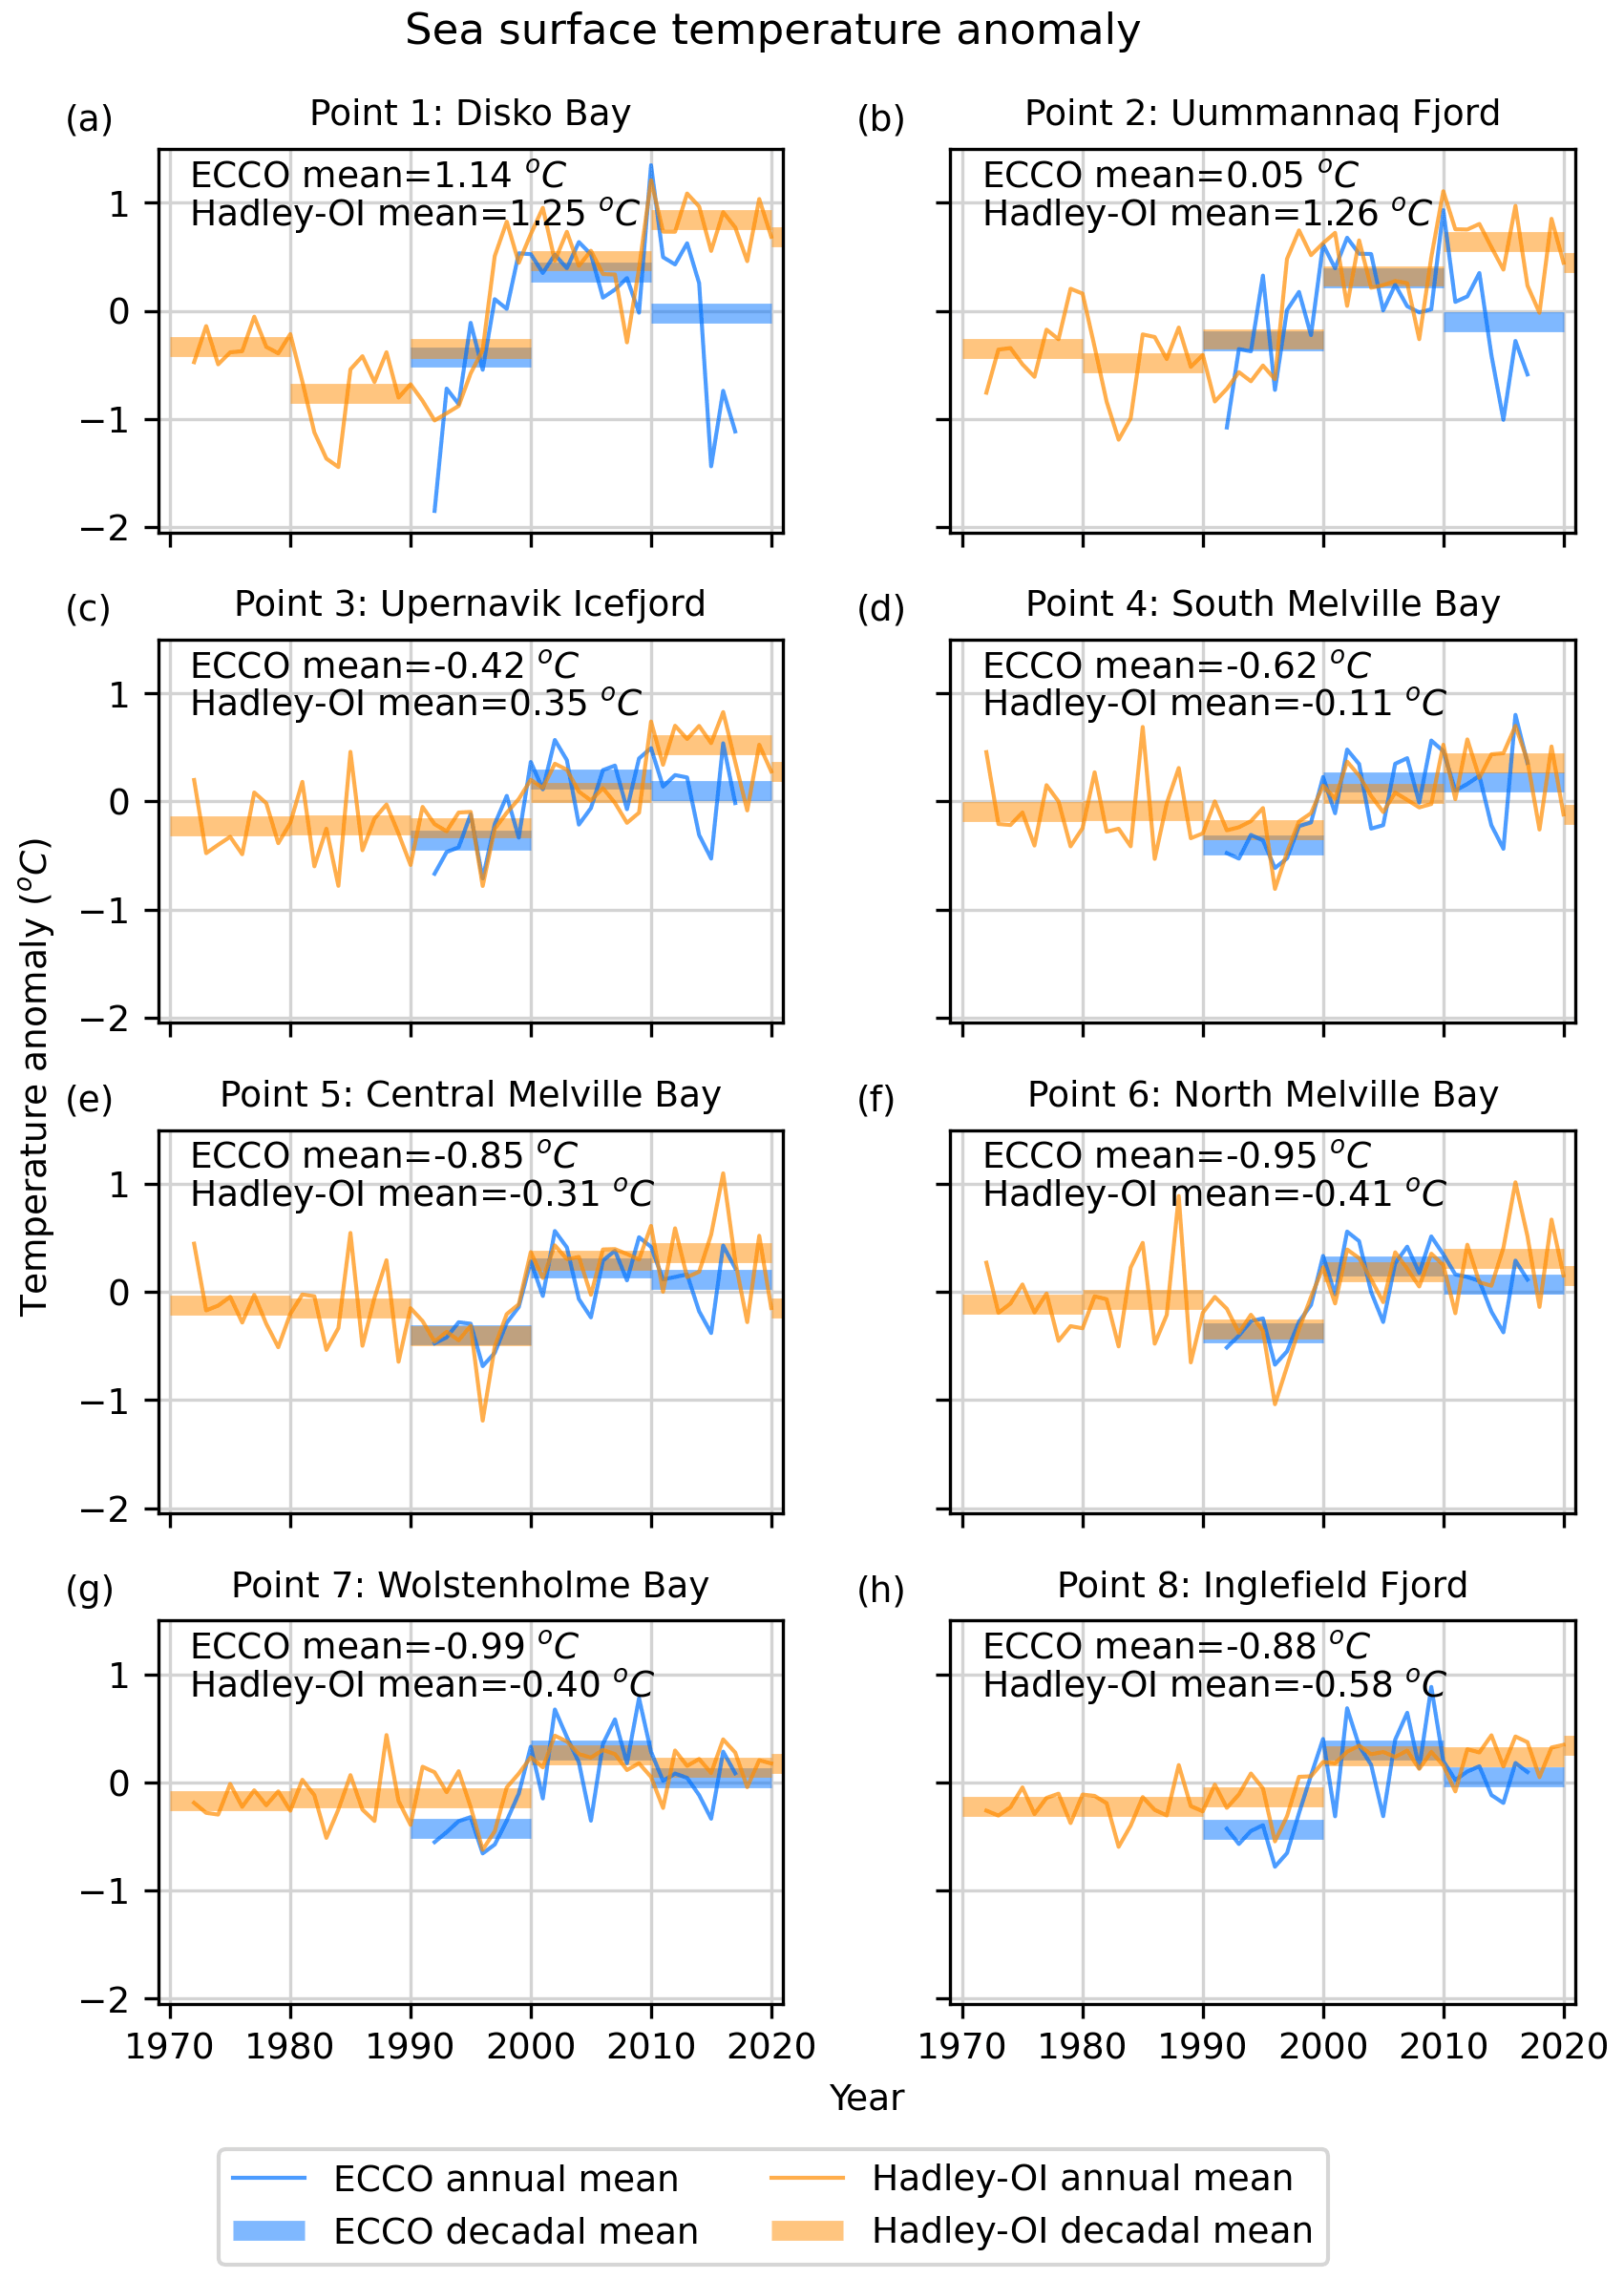
Figure 8Annual and decadal mean sea-surface temperature anomaly from ECCO (blue) and Hadley-OI (orange). Each panel corresponds with an ocean point in Fig. 1. The mean for each anomaly is reported in each panel.
Figure 9 shows that the annual duration of the sea-ice season (defined as when sea-ice concentration exceeds 15 %) has shortened since the 1970s. In particular, from Upernavik Icefjord north to Wolstenholme Bay (Fig. 9c–g), while the decadal mean sea-ice season length was relatively steady from the 1970s through the 1990s, it decreased by 1 to 2 months between the 1990s and the 2000s and remained relatively steady at the new shorter duration in the 2000s and 2010s. This pattern is borne out in the seasonal sea-ice concentration as well at many locations (Supplement Figs. S2–S5).
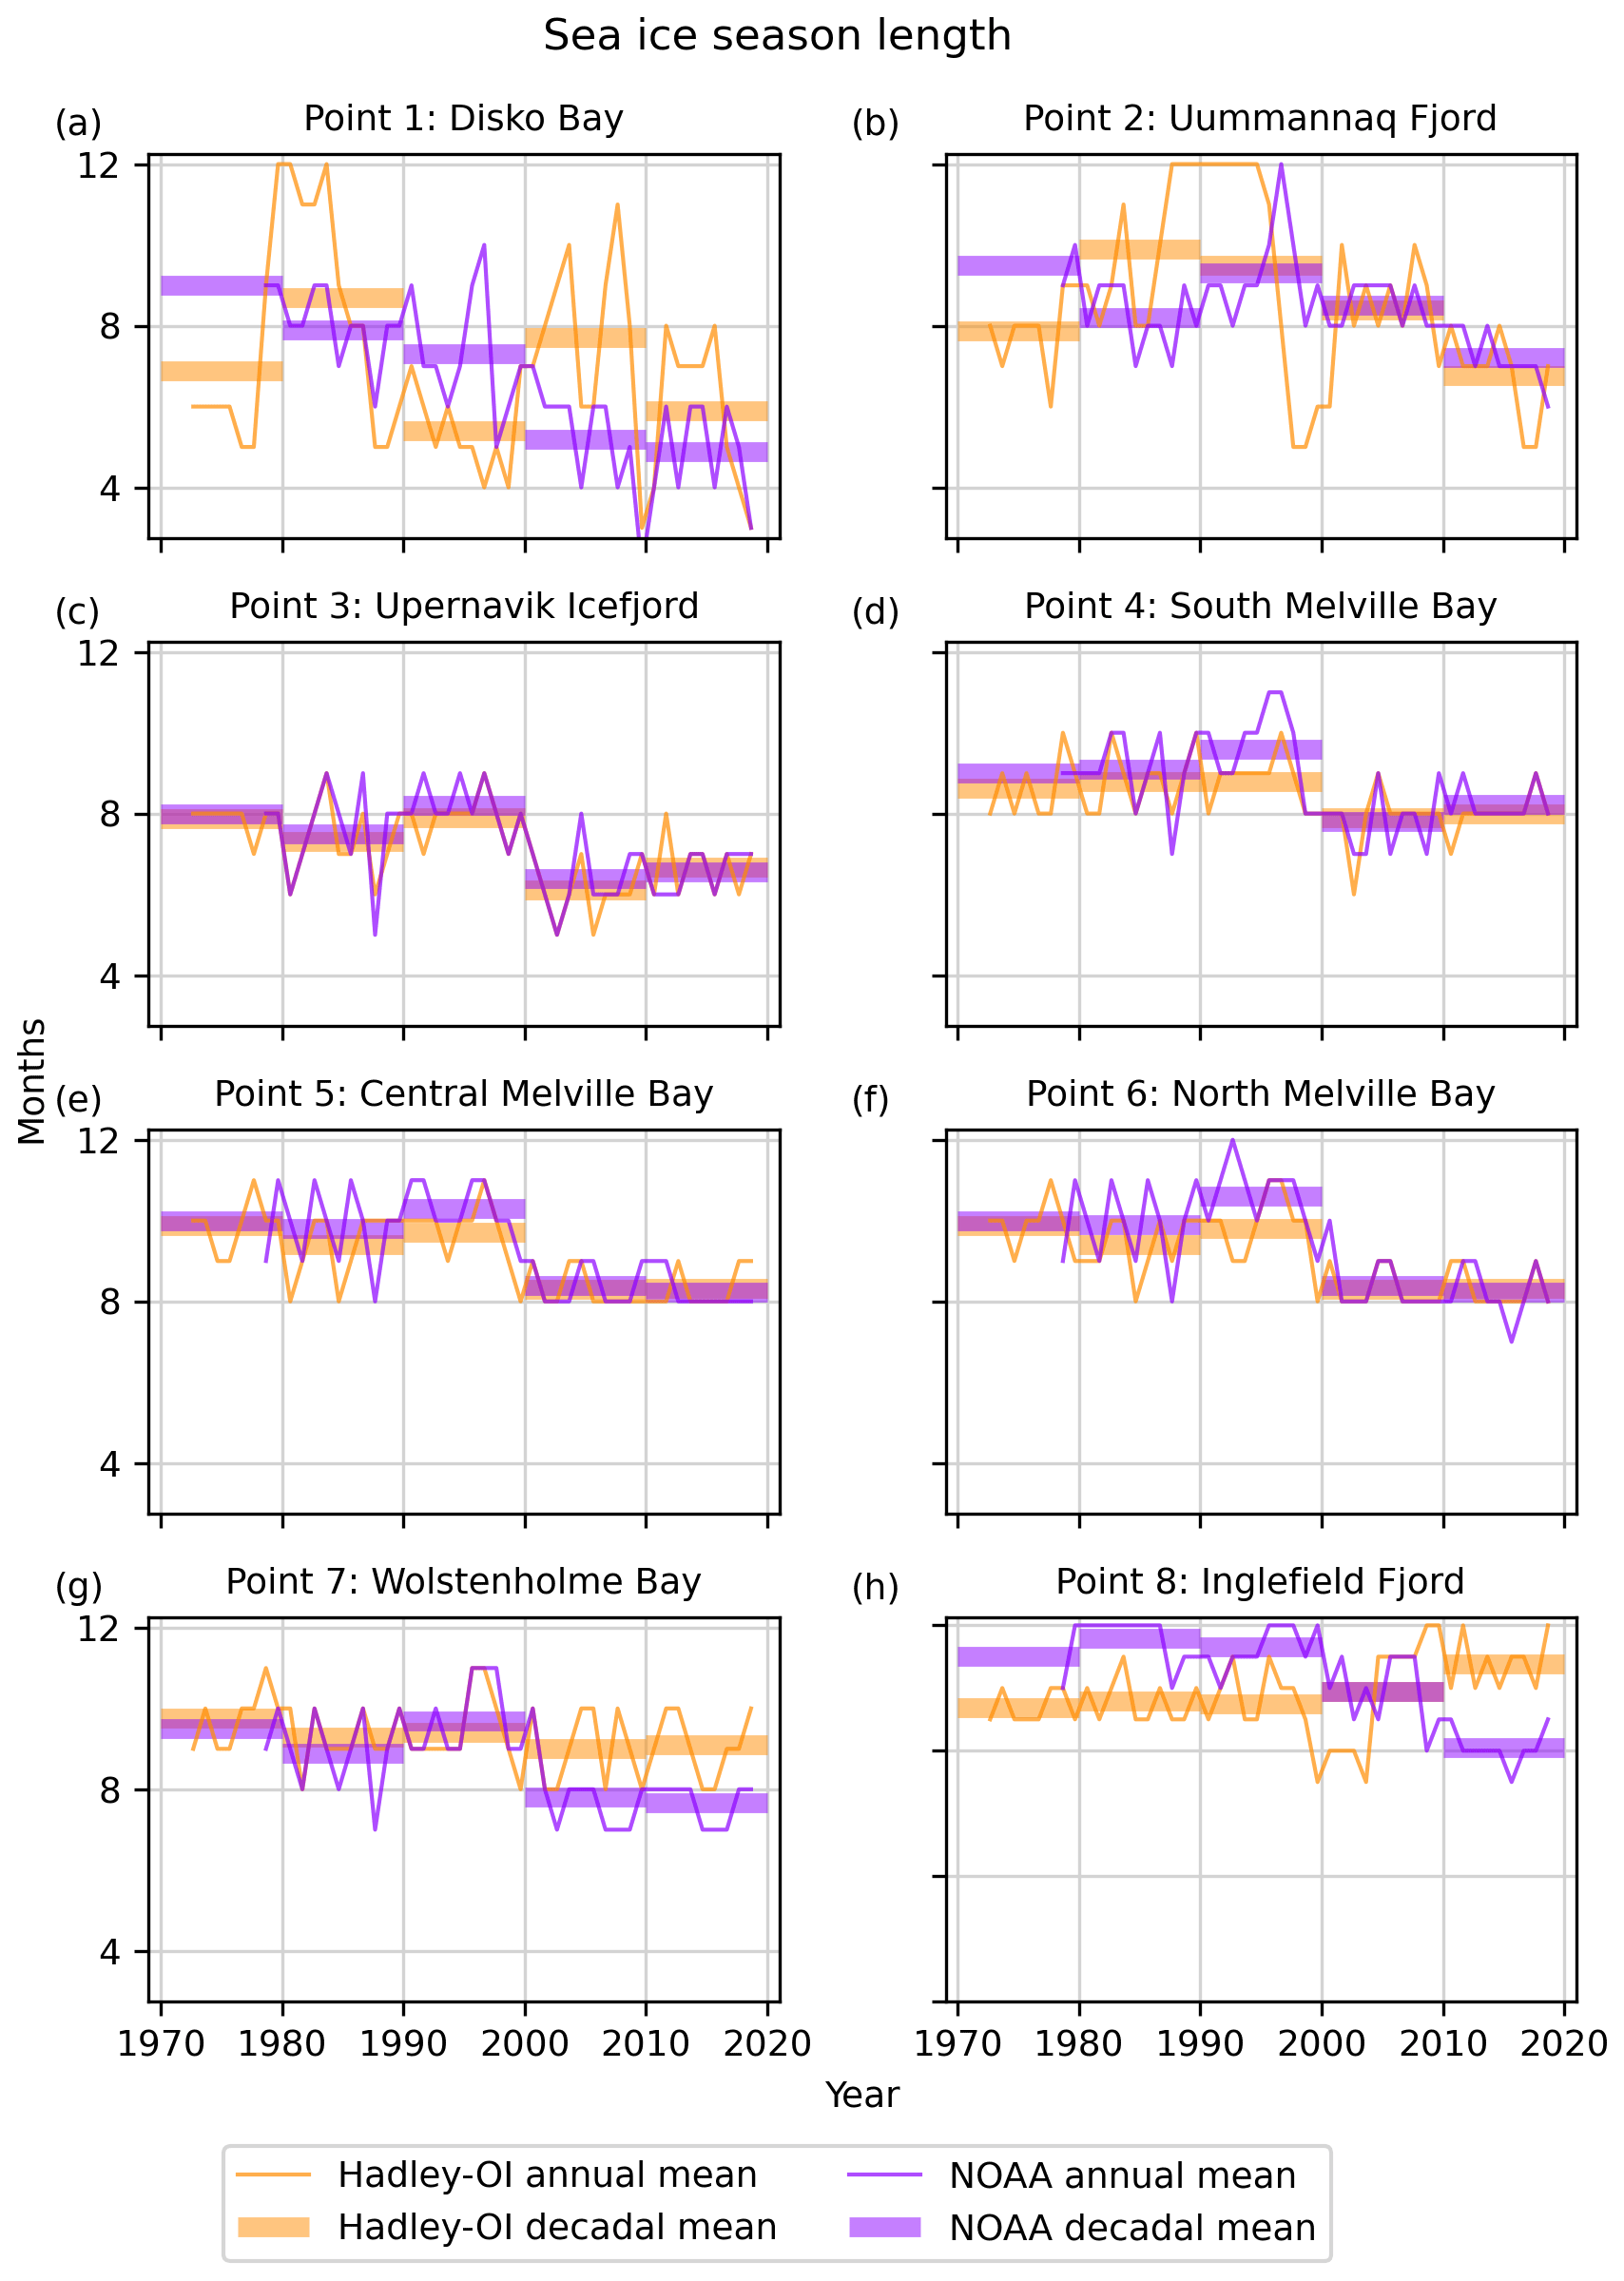
Figure 9Annual duration of sea-ice season (when sea-ice concentration is greater than 15 %) from Hadley-OI (orange) and NOAA (purple). Each panel corresponds with an ocean point in Fig. 1.
3.3 Regression analysis
We conducted a suite of multiple linear regressions of key climate variables against terminus retreat (Table 1), using data from 1992–2017, where we have data available for all variables. We ran two cases with all variables included: one with the corrected ECCO deepwater temperatures and one with the original uncorrected ECCO deepwater temperatures. The remaining cases systematically drop one of the variables at a time and then include only one type of variable (ocean temperatures, sea ice, runoff). For each case, we report the sensitivity of terminus retreat to each climate variable with 1σ errors, as well as the R2 value of the regression.
While it is difficult to interpret the results because of multiple correlations between the different parameters, it is clear that runoff has the dominant effect. Overall, terminus retreat appears to be most sensitive to runoff, moderately sensitive to ocean temperatures, and least sensitive to sea ice. For each case, the R2 value is small, likely due to large interannual variability in the climate variables. When we drop runoff from the regression, the R2 value drops by 0.098, suggesting that runoff accounts for ∼ 10 % of the variance in terminus sensitivity. Aside from runoff, dropping any individual variable seems to have little effect. Although dropping ocean temperatures (surface and deepwater) from the regressions has a small effect, keeping only ocean temperatures accounts for about half as much variance (0.094) as keeping only runoff (0.186). The sea-ice parameter sensitivities are not significantly different from zero, and the effect of dropping them is weak.
Table 1Sensitivities of terminus retreat to different climate variables for a suite of multiple linear regressions, with 1σ error.

Our measurements (Fig. 5) show a multi-decadal trend of regional glacier retreat with a step change in the terminus retreat rate from around 1996. Several mechanisms have been proposed as drivers of outlet glacier retreat, including ocean-warming-induced terminus ablation and undercutting, mélange rigidity, and enhanced hydrofracture, all of which can affect calving (Straneo et al., 2013). All of these mechanisms are tied to climatic warming in some sense, whether due to rising air or ocean temperatures, and associated changes in meltwater production, runoff, and sea-ice concentration. Our observed step change in terminus retreat rate was approximately coincident with sharp increases in meltwater production (22 %; Fig. 6b), runoff (26 %; Fig. 6c), deepwater temperature (0.21–1.07 ∘C; Fig. 7), and sea-surface temperature (0.33–0.81 ∘C; Fig. 8) and a sharp decrease in the duration of the sea-ice season (1–2 months; Fig. 9). Thus, any or all processes related to these anomalies could have contributed to the terminus retreat rates. Multiple linear regressions suggest that runoff is the dominant contributor to terminus retreat, with ocean temperatures accounting for much of the remaining variance. Offshore sea ice has a small and likely negligible effect.
4.1 Observations of regional retreat
The timing of our observed step change in the terminus retreat rate is consistent with previous studies of northwest and/or central-west Greenland that identified accelerated glacier retreat (Carr et al., 2017; Catania et al., 2018; Fahrner et al., 2021; Howat and Eddy, 2011; Wood et al., 2021) and ice speedup and discharge (Joughin et al., 2018b; King et al., 2020) beginning in the middle to late 1990s. Nearly all glaciers in our study region retreated between the onset of this step change and the end of our observations in 2021, in line with other observations of sustained retreat in the 21st century (Bunce et al., 2018; Fahrner et al., 2021; Howat and Eddy, 2011; Murray et al., 2015). Howat and Eddy (2011) found that between 2000 and 2010, nearly 100 % of glaciers in northwest Greenland retreated; although we considered a larger set of glaciers, we found that 85 % of our glaciers retreated and 15 % were stable over the same time period. Between 2010 and 2020, 74 % of glaciers retreated and 22 % were stable. In both decades, 69 % of glaciers retreated and 9 % were stable. Overall, between 2000 and 2020, 86 % of glaciers retreated and 14 % maintained stable terminus positions.
We observed a brief period of regional advance in 2017 and 2018, which was negated by regional retreat in 2019 (Fig. 5a, b). This broad pattern of readvance coincides with the readvance of Jakobshavn Isbræ in 2017 and 2018 (Khazendar et al., 2019); however, while Jakobshavn Isbræ remained in a relatively advanced position in 2019 and 2020 and retreated in 2021 (Fig. 4a, b), the region as a whole began to retreat again in 2019. The regional behavior is coincident with a sustained negative runoff and meltwater production anomaly (and positive surface mass balance anomaly) in 2017 and 2018 with values near the 20th-century mean anomaly. This negative anomaly was followed by the strong positive anomalies in the record in 2019 and 2020 (Fig. 5a). Although we lack sufficient ocean temperature or sea-ice data during this period to assess a relationship between those factors and regional glacier behavior, our regression analysis indicates that runoff anomalies have the strongest effect on terminus position.
4.2 Terminus melting
Ocean subsurface warming and surface warming in Baffin Bay and adjacent fjords have been cited as contributors to regional glacier retreat (Rignot et al., 2012; Slater et al., 2019; Wood et al., 2021) as well as to retreat for individual glaciers (Holland et al., 2008; Khazendar et al., 2019; Motyka et al., 2011; Rignot et al., 2010). Warmer ocean water increases melt at the calving face, and, in conjunction with subglacial discharge plumes, subsurface warming undercuts the terminus (Motyka et al., 2013; Slater et al., 2015, 2017), which could enhance calving (How et al., 2019; Luckman et al., 2015; Morlighem et al., 2019; Rignot et al., 2015).
Wood et al. (2021) found that ocean thermal forcing switched from a stable period to one of rapid warming between 1997 and 1998, consistent with the timing of the sharp step change in glacier retreat rate we observed. Based on the same ocean dataset, we found that ocean subsurface temperatures increased an average of 0.90 ∘C coincident with our observed step change in glacier retreat rate (Fig. 7) and together with sea-surface temperatures were moderately associated with terminus retreat. Wood et al. (2021) identified deep glaciers sitting in warmer water as those that are retreating the most. Terminus response, however, tends to scale non-linearly with depth, and deeper termini should be more responsive to any change that induces retreat (Schoof, 2007). As evidence of this effect, we note the strong response to seasonal perturbations on three of Greenland's deepest outlet glaciers (Jakobshavn, Kangerlussuaq, and Helheim), which is large compared to the degree of melting at the terminus (Joughin et al., 2020; Kehrl et al., 2017). Thus, irrespective of the forcing that caused the initial perturbation, a greater response would be expected for the deeper glaciers (> 100 m depth), whether the forcing is due to ocean melting or some other process.
Similarly to ocean subsurface temperatures, sea-surface temperatures averaged over all of our subregions also increased (0.58 ∘C) in concert with accelerated glacier retreat (Fig. 8). Fahrner et al. (2021) found a significant relationship between sea-surface temperatures and terminus change in northwest Greenland, whereas Murray et al. (2015) found no relationship between retreat and sea-surface temperature in this region. Elsewhere in Greenland, warming sea-surface temperatures have been linked with rapid terminus retreat (Howat et al., 2008).
4.3 Mélange rigidity
Models indicate that the absence of a rigid mélange may be more important than ocean-driven melting of the terminus in enhancing glacier retreat (Todd and Christoffersen, 2014). Observations show a correlation between terminus change and sea-ice and mélange conditions (Carr et al., 2017; Moon et al., 2015; Sohn et al., 1998) and that reduced sea-ice and mélange formation could have triggered retreat at several Greenland glaciers (Amundson et al., 2010; Howat et al., 2010; Joughin et al., 2008a; Sohn et al., 1998). The presence of a rigid mélange can exert sufficient force to inhibit calving, facilitating seasonal glacier advance (Amundson et al., 2010; Cassotto et al., 2015; Cook et al., 2021; Reeh et al., 2001; Robel, 2017). We observed a sharp reduction in both the duration of the sea-ice season (Fig. 9) and sea-ice concentrations (Supplement Figs. S2–S5), coincident with a step change in the regional glacier retreat rate in 1996; however, our regression analysis indicated that offshore sea-ice conditions have only a weak connection with terminus retreat. This suggests that the effect of offshore sea ice on terminus retreat is weak, although we note that the data we sampled are an imperfect proxy for near-terminus sea-ice conditions.
Runoff increases and ocean warming are both coincident with terminus retreat. While these factors also contribute to terminus melt, the majority of the ocean heat in the fjords goes into melting icebergs (thus weakening mélange) rather than the terminus face (Moon et al., 2018; Mortensen et al., 2020). Moreover, the runoff-enhanced iceberg melting lags discharge, causing iceberg melt to peak in late summer and early autumn (Moon et al., 2018). At least for Jakobshavn Isbræ, reductions in mélange rigidity appear to correspond to periods of warmer temperatures at depth in the fjord (Joughin et al., 2020). Warmer sea-surface temperatures, although unlikely to contribute to submarine undercutting of the terminus, may also inhibit sea-ice formation and reduce mélange rigidity. Additionally, the observed increase of 26 % in runoff and 11 % in the number of runoff days (Fig. 6c, e), coincident with the observed step change in terminus retreat rates, may have seasonally contributed to more mobile mélange near the terminus. Thus, the combination of increased runoff, sea-surface temperature, and subsurface temperature together suggests a reduction in mélange presence and rigidity that might have increased calving and retreat.
4.4 Enhanced hydrofracture
In addition to reducing mélange rigidity, increased meltwater production and runoff could also increase hydrofracture-induced calving. Crevasses filled with surface melt penetrate deeper than dry crevasses (van der Veen, 1998; Weertman, 1973), and if a crevasse near the terminus penetrates the full thickness of the ice, it can cause calving (Nick et al., 2010; Sohn et al., 1998). We observed a sustained 26 % increase in runoff (Fig. 6c) coincident with accelerated glacier retreat in 1996, which could contribute to increased filling of surface crevasses and subsequent hydrofracture, which would facilitate greater calving and retreat. Although runoff remained high in the 2010s, the duration of the runoff season decreased by 6 d (Fig. 6e) while sustained glacier retreat continued. These results suggest that to the extent that hydrofracture may have contributed to retreat, it is through increased runoff volume rather than seasonal duration.
We have built a comprehensive record of annual terminus positions for 87 marine-terminating outlet glaciers in northwest and central-west Greenland from 1972 through 2021. The majority of these glaciers retreated and lost area over the observation period, with retreat accelerating after 1996. We observed a brief regional readvance in 2017 and 2018, which was offset by losses in 2019. Ice-sheet climate data indicate that surface mass balance, meltwater production, and runoff increased substantially between the 1990s and 2000s, coincident with accelerated glacier retreat. Similarly, in most regions sea-surface and deepwater temperatures increased and sea-ice season duration decreased between the 1990s and 2000s. Our results indicate that increased runoff and ocean temperatures correspond with periods of increased terminus retreat. Runoff and ocean warming are expected to increase terminus retreat through a combination of terminus undercutting and reducing mélange rigidity; runoff could also increase calving rates through enhanced hydrofracture. Thus, some combination of these processes is likely responsible for the widespread observed retreat across northwest and central-west Greenland. In order to more conclusively reveal the primary drivers of retreat, future studies would benefit from additional information such as more spatiotemporally dense oceanographic measurements and estimates in fjords (e.g., Wood et al., 2021) and more widespread analysis of fjord mélange conditions (e.g., Joughin et al., 2020). Further research is needed to improve our understanding of the dominant processes contributing to terminus retreat and the resulting increases in ice discharge.
Data analysis and visualization code are available on GitHub (https://github.com/tarynblack/northwest_decadal_2021, last access: 8 February 2022) and Zenodo (https://doi.org/10.5281/zenodo.6015419, Black, 2022).
Some of the terminus positions are available on NSIDC as part of the MEaSUREs Annual Greenland Outlet Glacier Terminus Positions from SAR Mosaics dataset (https://nsidc.org/data/NSIDC-0642, Joughin et al., 2015), and the remainder are being prepared for delivery as part of the same dataset. Bed topography is from BedMachine Greenland V3 (https://nsidc.org/data/idbmg4, Morlighem et al., 2017b). Ice-sheet velocity is from MEaSUREs Multi-year Greenland Ice Sheet Velocity Mosaic, Version 1 (https://nsidc.org/data/NSIDC-0670/versions/1, Joughin et al., 2016b). Landsat images were identified with GloVis (http://glovis.usgs.gov, U.S. Geological Survey, 2017) and downloaded from Google Cloud Platform (https://console.cloud.google.com/storage/browser/gcp-public-data-landsat, Google, 2022). Sentinel-1 images are from MEaSUREs Greenland Image Mosaics from Sentinel-1A and -1B, Version 3 (https://doi.org/10.5067/WXQ366CP8YDE, Joughin, 2021). Ocean temperatures are from ECCO Version 5 (https://ecco-group.org, Forget et al., 2015; Zhang et al., 2018), the ICES Dataset on Ocean Hydrography (https://ocean.ices.dk/hydchem/hydchem.aspx, ICES, 2021), and the merged Hadley-OI sea-surface temperature and sea-ice concentration dataset (https://doi.org/10.5065/r33v-sv91, Hurrell et al., 2008; Shea et al., 2020). Sea-ice concentrations are from the merged Hadley-OI dataset and the NOAA/NSIDC Climate Data Record of Passive Microwave Sea Ice Concentration, Version 3 (https://nsidc.org/data/g02202, Meier et al., 2017; Peng et al., 2013). Ice-sheet climate data are from MAR v3.11 output over Greenland (ftp://ftp.climato.be/fettweis/MARv3.11/Greenland/ERA_1979-2020-6km/, Fettweis et al., 2017).
The supplement related to this article is available online at: https://doi.org/10.5194/tc-16-807-2022-supplement.
TEB and IJ conceptualized the project. TEB carried out the terminus data collection, analysis, and visualization. IJ prepared the SAR data products. TEB prepared the manuscript, with contributions from IJ.
The contact author has declared that neither they nor their co-author has any competing interests.
Publisher's note: Copernicus Publications remains neutral with regard to jurisdictional claims in published maps and institutional affiliations.
Taryn E. Black and Ian Joughin were supported by the NASA MEaSUREs program (80NSSC18M0078). Taryn E. Black was also supported by an NSF Graduate Research Fellowship early in the project. Twila Moon digitized the original 6-year dataset of terminus positions. The authors thank the Greenland Institute of Natural Resources, Nuuk, Greenland, for collection of hydrographic data in Disko Bay as part of its Standard Hydrographic Coastal Monitoring Program. Comments by Michael Wood and the anonymous reviewer also improved the manuscript.
This research has been supported by the National Aeronautics and Space Administration (grant no. 80NSSC18M0078).
This paper was edited by Stef Lhermitte and reviewed by Michael Wood and one anonymous referee.
Amundson, J. M., Fahnestock, M., Truffer, M., Brown, J., Lüthi, M. P., and Motyka, R. J.: Ice mélange dynamics and implications for terminus stability, Jakobshavn Isbræ, Greenland, J. Geophys. Res.-Earth, 115, F01005, https://doi.org/10.1029/2009JF001405, 2010.
Benn, D. I., Warren, C. R., and Mottram, R. H.: Calving processes and the dynamics of calving glaciers, Earth-Sci. Rev., 82, 143–179, https://doi.org/10.1016/j.earscirev.2007.02.002, 2007.
Bjørk, A. A., Kjær, K. H., Korsgaard, N. J., Khan, S. A., Kjeldsen, K. K., Andresen, C. S., Box, J. E., Larsen, N. K., and Funder, S.: An aerial view of 80 years of climate-related glacier fluctuations in southeast Greenland, Nat. Geosci., 5, 427–432, https://doi.org/10.1038/ngeo1481, 2012.
Black, T.: northwest_decadal_2021, Zenodo [code], https://doi.org/10.5281/zenodo.6015419, 2022.
Bunce, C., Carr, J. R., Nienow, P. W., Ross, N., and Killick, R.: Ice front change of marine-terminating outlet glaciers in northwest and southeast Greenland during the 21st century, J. Glaciol., 64, 1–13, https://doi.org/10.1017/jog.2018.44, 2018.
Carr, J. R., Vieli, A., and Stokes, C.: Influence of sea ice decline, atmospheric warming, and glacier width on marine-terminating outlet glacier behavior in northwest Greenland at seasonal to interannual timescales, J. Geophys. Res.-Earth, 118, 1210–1226, https://doi.org/10.1002/jgrf.20088, 2013.
Carr, J. R., Vieli, A., Stokes, C. R., Jamieson, S. S. R., Palmer, S. J., Christoffersen, P., Dowdeswell, J. A., Nick, F. M., Blankenship, D. D., and Young, D. A.: Basal topographic controls on rapid retreat of Humboldt Glacier, northern Greenland, J. Glaciol., 61, 137–150, https://doi.org/10.3189/2015JoG14J128, 2015.
Carr, J. R., Stokes, C. R., and Vieli, A.: Threefold increase in marine-terminating outlet glacier retreat rates across the Atlantic Arctic: 1992–2010, Ann. Glaciol., 58, 72–91, https://doi.org/10.1017/aog.2017.3, 2017.
Cassotto, R., Fahnestock, M., Amundson, J. M., Truffer, M., and Joughin, I.: Seasonal and interannual variations in ice melange and its impact on terminus stability, Jakobshavn Isbræ, Greenland, J. Glaciol., 61, 76–88, https://doi.org/10.3189/2015JoG13J235, 2015.
Catania, G. A., Stearns, L. A., Sutherland, D. A., Fried, M. J., Bartholomaus, T. C., Morlighem, M., Shroyer, E., and Nash, J.: Geometric Controls on Tidewater Glacier Retreat in Central Western Greenland, J. Geophys. Res.-Earth, 123, 2024–2038, https://doi.org/10.1029/2017JF004499, 2018.
Cook, S. J., Christoffersen, P., Truffer, M., Chudley, T. R., and Abellán, A.: Calving of a Large Greenlandic Tidewater Glacier has Complex Links to Meltwater Plumes and Mélange, J. Geophys. Res.-Earth, 126, e2020JF006051, https://doi.org/10.1029/2020JF006051, 2021.
Enderlin, E. M., Howat, I. M., Jeong, S., Noh, M.-J., van Angelen, J. H., and van den Broeke, M. R.: An improved mass budget for the Greenland ice sheet, Geophys. Res. Lett., 41, 866–872, https://doi.org/10.1002/2013GL059010, 2014.
Ettema, J., van den Broeke, M. R., van Meijgaard, E., van de Berg, W. J., Bamber, J. L., Box, J. E., and Bales, R. C.: Higher surface mass balance of the Greenland ice sheet revealed by high-resolution climate modeling, Geophys. Res. Lett., 36, L12501, https://doi.org/10.1029/2009GL038110, 2009.
Fahrner, D., Lea, J. M., Brough, S., Mair, D. W. F., and Abermann, J.: Linear response of the Greenland ice sheet's tidewater glacier terminus positions to climate, J. Glaciol., 67, 1–11, https://doi.org/10.1017/jog.2021.13, 2021.
Felikson, D., Catania, G. A., Bartholomaus, T. C., Morlighem, M., and Noël, B. P. Y.: Steep Glacier Bed Knickpoints Mitigate Inland Thinning in Greenland, Geophys. Res. Lett., 48, e2020GL090112, https://doi.org/10.1029/2020GL090112, 2021.
Fettweis, X., Box, J. E., Agosta, C., Amory, C., Kittel, C., Lang, C., van As, D., Machguth, H., and Gallée, H.: Reconstructions of the 1900–2015 Greenland ice sheet surface mass balance using the regional climate MAR model, The Cryosphere, 11, 1015–1033, https://doi.org/10.5194/tc-11-1015-2017, 2017.
Foga, S., Stearns, L. A., and van der Veen, C. J.: Application of Satellite Remote Sensing Techniques to Quantify Terminus and Ice Mélange Behavior at Helheim Glacier, East Greenland, Mar. Technol. Soc. J., 48, 81–91, https://doi.org/10.4031/MTSJ.48.5.3, 2014.
Forget, G., Campin, J.-M., Heimbach, P., Hill, C. N., Ponte, R. M., and Wunsch, C.: ECCO version 4: an integrated framework for non-linear inverse modeling and global ocean state estimation, Geosci. Model Dev., 8, 3071–3104, https://doi.org/10.5194/gmd-8-3071-2015, 2015.
Google: Google Cloud Platform Public Data Landsat, https://console.cloud.google.com/storage/browser/gcp-public-data-landsat, last access: 5 March 2022.
Hill, E. A., Carr, J. R., and Stokes, C. R.: A Review of Recent Changes in Major Marine-Terminating Outlet Glaciers in Northern Greenland, Front. Earth Sci., 4, 1–23, https://doi.org/10.3389/feart.2016.00111, 2017.
Holland, D. M., Thomas, R. H., de Young, B., Ribergaard, M. H., and Lyberth, B.: Acceleration of Jakobshavn Isbræ triggered by warm subsurface ocean waters, Nat. Geosci., 1, 659–664, https://doi.org/10.1038/ngeo316, 2008.
Holland, D. M., Voytenko, D., Christianson, K., Dixon, T. H., Mel, M. J., Parizek, B. R., Vaňková, I., Walker, R. T., Walter, J. I., Nicholls, K., and Holland, D.: An Intensive Observation of Calving at Helheim Glacier, East Greenland, Oceanography, 29, 46–61, https://doi.org/10.5670/oceanog.2016.98, 2016.
How, P., Schild, K. M., Benn, D. I., Noormets, R., Kirchner, N., Luckman, A., Vallot, D., Hulton, N. R. J., and Borstad, C.: Calving controlled by melt-under-cutting: detailed calving styles revealed through time-lapse observations, Ann. Glaciol., 60, 1–12, https://doi.org/10.1017/aog.2018.28, 2019.
Howat, I. M. and Eddy, A.: Multi-decadal retreat of Greenland's marine-terminating glaciers, J. Glaciol., 57, 389–396, https://doi.org/10.3189/002214311796905631, 2011.
Howat, I. M., Joughin, I., Fahnestock, M., Smith, B. E., and Scambos, T. A.: Synchronous retreat and acceleration of southeast Greenland outlet glaciers 2000-06: Ice dynamics and coupling to climate, J. Glaciol., 54, 646–660, https://doi.org/10.3189/002214308786570908, 2008.
Howat, I. M., Box, J. E., Ahn, Y., Herrington, A., and McFadden, E. M.: Seasonal variability in the dynamics of marine-terminating outlet glaciers in Greenland, J. Glaciol., 56, 601–613, https://doi.org/10.3189/002214310793146232, 2010.
Hurrell, J. W., Hack, J. J., Shea, D., Caron, J. M., and Rosinski, J.: A New Sea Surface Temperature and Sea Ice Boundary Dataset for the Community Atmosphere Model, J. Climate, 21, 5145–5153, https://doi.org/10.1175/2008JCLI2292.1, 2008.
ICES: ICES Dataset on Ocean Hydrography, ICES [data set], https://ocean.ices.dk/hydchem/hydchem.aspx, last access: 12 May 2021.
Jekel, C. and Venter, G.: pwlf: A Python Library for Fitting 1D Continuous Piecewise Linear Functions, Python, 2019.
Joughin, I.: MEaSUREs Greenland Image Mosaics from Sentinel-1A and 1B, Version 4, NASA National Snow and Ice Data Center Distributed Active Archive Cente [data set], https://doi.org/10.5067/WXQ366CP8YDE, 2021.
Joughin, I., Howat, I. M., Fahnestock, M., Smith, B., Krabill, W., Alley, R. B., Stern, H., and Truffer, M.: Continued evolution of Jakobshavn Isbrae following its rapid speedup, J. Geophys. Res.-Earth Surf., 113, F04006, https://doi.org/10.1029/2008JF001023, 2008a.
Joughin, I., Howat, I., Alley, R. B., Ekstrom, G., Fahnestock, M., Moon, T., Nettles, M., Truffer, M., and Tsai, V. C.: Ice-front variation and tidewater behavior on Helheim and Kangerdlugssuaq Glaciers, Greenland, J. Geophys. Res.-Earth, 113, F01004, https://doi.org/10.1029/2007JF000837, 2008b.
Joughin, I., Smith, B. E., Howat, I. M., Scambos, T. A., and Moon, T.: Greenland flow variability from ice-sheet-wide velocity mapping, J. Glaciol., 56, 415–430, https://doi.org/10.3189/002214310792447734, 2010.
Joughin, I., Moon, T., Joughin, J., and Black, T.: MEaSUREs Annual Greenland Outlet Glacier Terminus Positions from SAR Mosaics, Version 1, NSIDC (National Snow and Ice Data Center) [data set], https://nsidc.org/data/nsidc-0642/versions/1 (last access: 19 May 2021), https://doi.org/10.5067/DC0MLBOCL3EL, 2015.
Joughin, I., Smith, B. E., Howat, I. M., Moon, T., and Scambos, T. A.: A SAR record of early 21st century change in Greenland, J. Glaciol., 62, 62–71, https://doi.org/10.1017/jog.2016.10, 2016a.
Joughin, I., Smith, B., Howat, I., and Scambos, T.: MEaSUREs Multi-year Greenland Ice Sheet Velocity Mosaic, Version 1, NSIDC (National Snow and Ice Data Center) [data set], https://doi.org/10.5067/QUA5Q9SVMSJG, 2016b.
Joughin, I., Smith, B. E., and Howat, I. M.: A complete map of Greenland ice velocity derived from satellite data collected over 20 years, J. Glaciol., 64, 1–11, https://doi.org/10.1017/jog.2017.73, 2018a.
Joughin, I., Smith, B. E., and Howat, I.: Greenland Ice Mapping Project: ice flow velocity variation at sub-monthly to decadal timescales, The Cryosphere, 12, 2211–2227, https://doi.org/10.5194/tc-12-2211-2018, 2018b.
Joughin, I., Shean, D. E., Smith, B. E., and Floricioiu, D.: A decade of variability on Jakobshavn Isbræ: ocean temperatures pace speed through influence on mélange rigidity, The Cryosphere, 14, 211–227, https://doi.org/10.5194/tc-14-211-2020, 2020.
Kehrl, L. M., Joughin, I., Shean, D. E., Floricioiu, D., and Krieger, L.: Seasonal and interannual variabilities in terminus position, glacier velocity, and surface elevation at Helheim and Kangerlussuaq Glaciers from 2008 to 2016, J. Geophys. Res.-Earth, 122, 1635–1652, https://doi.org/10.1002/2016JF004133, 2017.
Khazendar, A., Fenty, I. G., Carroll, D., Gardner, A., Lee, C. M., Fukumori, I., Wang, O., Zhang, H., Seroussi, H., Moller, D., Noël, B. P. Y., Broeke, M. R. van den, Dinardo, S., and Willis, J.: Interruption of two decades of Jakobshavn Isbrae acceleration and thinning as regional ocean cools, Nat. Geosci., 12, 277–283, https://doi.org/10.1038/s41561-019-0329-3, 2019.
King, M. D., Howat, I. M., Candela, S. G., Noh, M. J., Jeong, S., Noël, B. P. Y., van den Broeke, M. R., Wouters, B., and Negrete, A.: Dynamic ice loss from the Greenland Ice Sheet driven by sustained glacier retreat, Commun. Earth Environ., 1, 1–7, https://doi.org/10.1038/s43247-020-0001-2, 2020.
Larsen, S. H., Khan, S. A., Ahlstrøm, A. P., Hvidberg, C. S., Willis, M. J., and Andersen, S. B.: Increased mass loss and asynchronous behavior of marine-terminating outlet glaciers at Upernavik Isstrøm, NW Greenland, J. Geophys. Res.-Earth, 121, 241–256, https://doi.org/10.1002/2015JF003507, 2016.
Luckman, A., Benn, D. I., Cottier, F., Bevan, S., Nilsen, F., and Inall, M.: Calving rates at tidewater glaciers vary strongly with ocean temperature, Nat. Commun., 6, 8566, https://doi.org/10.1038/ncomms9566, 2015.
McFadden, E. M., Howat, I. M., Joughin, I., Smith, B. E., and Ahn, Y.: Changes in the dynamics of marine terminating outlet glaciers in west Greenland (2000–2009), J. Geophys. Res.-Earth, 116, F02022, https://doi.org/10.1029/2010JF001757, 2011.
Meier, W. N., Fetterer, F., Savoie, M., Mallory, S., Duerr, R., and Stroeve, J.: NOAA/NSIDC Climate Data Record of Passive Microwave Sea Ice Concentration, Version 3, NSIDC (National Snow and Ice Data Center) [data set], https://doi.org/10.7265/N59P2ZTG, 2017.
Moon, T. and Joughin, I.: Changes in ice front position on Greenland's outlet glaciers from 1992 to 2007, J. Geophys. Res.-Earth, 113, F02022, https://doi.org/10.1029/2007JF000927, 2008.
Moon, T., Joughin, I., Smith, B., and Howat, I.: 21st-Century Evolution of Greenland Outlet Glacier Velocities, Science, 336, 576–578, https://doi.org/10.1126/science.1219985, 2012.
Moon, T., Joughin, I., and Smith, B.: Seasonal to multiyear variability of glacier surface velocity, terminus position, and sea ice/ice mélange in northwest Greenland, J. Geophys. Res.-Earth, 120, 818–833, https://doi.org/10.1002/2015JF003494, 2015.
Moon, T., Sutherland, D. A., Carroll, D., Felikson, D., Kehrl, L., and Straneo, F.: Subsurface iceberg melt key to Greenland fjord freshwater budget, Nat. Geosci., 11, 49–54, https://doi.org/10.1038/s41561-017-0018-z, 2018.
Morlighem, M., Bondzio, J., Seroussi, H., Rignot, E., Larour, E., Humbert, A., and Rebuffi, S.: Modeling of Store Gletscher's calving dynamics, West Greenland, in response to ocean thermal forcing, Geophys. Res. Lett., 43, 2659–2666, https://doi.org/10.1002/2016GL067695, 2016.
Morlighem, M., Williams, C. N., Rignot, E., An, L., Arndt, J. E., Bamber, J. L., Catania, G., Chauché, N., Dowdeswell, J. A., Dorschel, B., Fenty, I., Hogan, K., Howat, I., Hubbard, A., Jakobsson, M., Jordan, T. M., Kjeldsen, K. K., Millan, R., Mayer, L., Mouginot, J., Noël, B. P. Y., O'Cofaigh, C., Palmer, S., Rysgaard, S., Seroussi, H., Siegert, M. J., Slabon, P., Straneo, F., van den Broeke, M. R., Weinrebe, W., Wood, M., and Zinglersen, K. B.: BedMachine v3: Complete Bed Topography and Ocean Bathymetry Mapping of Greenland From Multibeam Echo Sounding Combined With Mass Conservation, Geophys. Res. Lett., 44, 11051–11061, https://doi.org/10.1002/2017GL074954, 2017a.
Morlighem, M., Williams, C., Rignot, E., An, L., Arndt, J. E., Bamber, J., Catania, G., Chauché, N., Dowdeswell, J. A., Dorschel, B., Fenty, I., Hogan, K., Howat, I., Hubbard, A., Jakobsson, M., Jordan, T. M., Kjeldsen, K. K., Millan, R., Mayer, L., Mouginot, J., Noël, B., O'Cofaigh, C., Palmer, S. J., Rysgaard, S., Seroussi, H., Siegert, M. J., Slabon, P., Straneo, F., van den Broeke, M. R., Weinrebe, W., Wood, M., and Zinglersen, K.: IceBridge BedMachine Greenland, Version 3, NSIDC (National Snow and Ice Data Center) [data set], https://doi.org/10.5067/2CIX82HUV88Y, 2017b.
Morlighem, M., Wood, M., Seroussi, H., Choi, Y., and Rignot, E.: Modeling the response of northwest Greenland to enhanced ocean thermal forcing and subglacial discharge, The Cryosphere, 13, 723–734, https://doi.org/10.5194/tc-13-723-2019, 2019.
Mortensen, J., Rysgaard, S., Bendtsen, J., Lennert, K., Kanzow, T., Lund, H., and Meire, L.: Subglacial Discharge and Its Down-Fjord Transformation in West Greenland Fjords With an Ice Mélange, J. Geophys. Res.-Oceans, 125, e2020JC016301, https://doi.org/10.1029/2020JC016301, 2020.
Motyka, R. J., Truffer, M., Fahnestock, M., Mortensen, J., Rysgaard, S., and Howat, I.: Submarine melting of the 1985 Jakobshavn Isbræ floating tongue and the triggering of the current retreat, J. Geophys. Res.-Earth, 116, F01007, https://doi.org/10.1029/2009JF001632, 2011.
Motyka, R. J., Dryer, W. P., Amundson, J., Truffer, M., and Fahnestock, M.: Rapid submarine melting driven by subglacial discharge, LeConte Glacier, Alaska, Geophys. Res. Lett., 40, 5153–5158, https://doi.org/10.1002/grl.51011, 2013.
Motyka, R. J., Cassotto, R., Truffer, M., Kjeldsen, K. K., van As, D., Korsgaard, N. J., Fahnestock, M., Howat, I., Langen, P. L., Mortensen, J., Lennert, K., and Rysgaard, S.: Asynchronous behavior of outlet glaciers feeding Godthåbsfjord (Nuup Kangerlua) and the triggering of Narsap Sermia's retreat in SW Greenland, J. Glaciol., 63, 288–308, https://doi.org/10.1017/jog.2016.138, 2017.
Mouginot, J., Rignot, E., Bjørk, A. A., van den Broeke, M., Millan, R., Morlighem, M., Noël, B., Scheuchl, B., and Wood, M.: Forty-six years of Greenland Ice Sheet mass balance from 1972 to 2018, P. Natl. Acad. Sci. USA, 116, 9239–9244, https://doi.org/10.1073/pnas.1904242116, 2019.
Murray, T., Scharrer, K., Selmes, N., Booth, A. D., James, T. D., Bevan, S. L., Bradley, J., Cook, S., Cordero Llana, L., Drocourt, Y., Dyke, L., Goldsack, A., Hughes, A. L., Luckman, A. J., and McGovern, J.: Extensive retreat of Greenland tidewater glaciers, 2000–2010, Arct. Antarct. Alp. Res., 47, 427–447, https://doi.org/10.1657/AAAR0014-049, 2015.
Nick, F. M., van der Veen, C. J., Vieli, A., and Benn, D. I.: A physically based calving model applied to marine outlet glaciers and implications for the glacier dynamics, J. Glaciol., 56, 781–794, https://doi.org/10.3189/002214310794457344, 2010.
Nick, F. M., Vieli, A., Andersen, M. L., Joughin, I., Payne, A., Edwards, T. L., Pattyn, F., and van de Wal, R. S. W.: Future sea-level rise from Greenland's main outlet glaciers in a warming climate, Nature, 497, 235–238, https://doi.org/10.1038/nature12068, 2013.
Peng, G., Meier, W. N., Scott, D. J., and Savoie, M. H.: A long-term and reproducible passive microwave sea ice concentration data record for climate studies and monitoring, Earth Syst. Sci. Data, 5, 311–318, https://doi.org/10.5194/essd-5-311-2013, 2013.
Reeh, N., Thomsen, H. H., Higgins, A. K., and Weidick, A.: Sea ice and the stability of north and northeast Greenland floating glaciers, Ann. Glaciol., 33, 474–480, https://doi.org/10.3189/172756401781818554, 2001.
Rignot, E. and Kanagaratnam, P.: Changes in the Velocity Structure of the Greenland Ice Sheet, Science, 311, 986–990, https://doi.org/10.1126/science.1121381, 2006.
Rignot, E., Koppes, M., and Velicogna, I.: Rapid submarine melting of the calving faces of West Greenland glaciers, Nat. Geosci., 3, 187–191, https://doi.org/10.1038/ngeo765, 2010.
Rignot, E., Fenty, I., Menemenlis, D., and Xu, Y.: Spreading of warm ocean waters around Greenland as a possible cause for glacier acceleration, Ann. Glaciol., 53, 257–266, https://doi.org/10.3189/2012AoG60A136, 2012.
Rignot, E., Fenty, I., Xu, Y., Cai, C., and Kemp, C.: Undercutting of marine-terminating glaciers in West Greenland, Geophys. Res. Lett., 42, 5909–5917, https://doi.org/10.1002/2015GL064236, 2015.
Robel, A. A.: Thinning sea ice weakens buttressing force of iceberg mélange and promotes calving, Nat. Commun., 8, 14596, https://doi.org/10.1038/ncomms14596, 2017.
Schild, K. M. and Hamilton, G. S.: Seasonal variations of outlet glacier terminus position in Greenland, J. Glaciol., 59, 759–770, https://doi.org/10.3189/2013JoG12J238, 2013.
Schoof, C.: Ice sheet grounding line dynamics: Steady states, stability, and hysteresis, J. Geophys. Res.-Earth, 112, F03S28, https://doi.org/10.1029/2006JF000664, 2007.
Shea, D., Hurrell, J., and Phillips, A.: Merged Hadley-OI sea surface temperature and sea ice concentration data set, UCAR/NCAR - GDEX [data set], https://doi.org/10.5065/R33V-SV91, 2020.
Shepherd, A., Ivins, E., Rignot, E., Smith, B., van den Broeke, M., Velicogna, I., Whitehouse, P., Briggs, K., Joughin, I., Krinner, G., Nowicki, S., Payne, T., Scambos, T., Schlegel, N., A, G., Agosta, C., Ahlstrøm, A., Babonis, G., Barletta, V. R., Bjørk, A. A., Blazquez, A., Bonin, J., Colgan, W., Csatho, B., Cullather, R., Engdahl, M. E., Felikson, D., Fettweis, X., Forsberg, R., Hogg, A. E., Gallee, H., Gardner, A., Gilbert, L., Gourmelen, N., Groh, A., Gunter, B., Hanna, E., Harig, C., Helm, V., Horvath, A., Horwath, M., Khan, S., Kjeldsen, K. K., Konrad, H., Langen, P. L., Lecavalier, B., Loomis, B., Luthcke, S., McMillan, M., Melini, D., Mernild, S., Mohajerani, Y., Moore, P., Mottram, R., Mouginot, J., Moyano, G., Muir, A., Nagler, T., Nield, G., Nilsson, J., Noël, B., Otosaka, I., Pattle, M. E., Peltier, W. R., Pie, N., Rietbroek, R., Rott, H., Sandberg Sørensen, L., Sasgen, I., Save, H., Scheuchl, B., Schrama, E., Schröder, L., Seo, K.-W., Simonsen, S. B., Slater, T., Spada, G., Sutterley, T., Talpe, M., Tarasov, L., van de Berg, W. J., van der Wal, W., van Wessem, M., Vishwakarma, B. D., Wiese, D., Wilton, D., Wagner, T., Wouters, B., and Wuite, J.: Mass balance of the Greenland Ice Sheet from 1992 to 2018, Nature, 579, 233–239, https://doi.org/10.1038/s41586-019-1855-2, 2020.
Slater, D. A., Nienow, P. W., Cowton, T. R., Goldberg, D. N., and Sole, A. J.: Effect of near-terminus subglacial hydrology on tidewater glacier submarine melt rates, Geophys. Res. Lett., 42, 2861–2868, https://doi.org/10.1002/2014GL062494, 2015.
Slater, D. A., Nienow, P. W., Goldberg, D. N., Cowton, T. R., and Sole, A. J.: A model for tidewater glacier undercutting by submarine melting, Geophys. Res. Lett., 44, 2360–2368, https://doi.org/10.1002/2016GL072374, 2017.
Slater, D. A., Straneo, F., Felikson, D., Little, C. M., Goelzer, H., Fettweis, X., and Holte, J.: Estimating Greenland tidewater glacier retreat driven by submarine melting, The Cryosphere, 13, 2489–2509, https://doi.org/10.5194/tc-13-2489-2019, 2019.
Sohn, H.-G., Jezek, K. C., and van der Veen, C. J.: Jakobshavn Glacier, west Greenland: 30 years of spaceborne observations, Geophys. Res. Lett., 25, 2699–2702, https://doi.org/10.1029/98GL01973, 1998.
Straneo, F., Heimbach, P., Sergienko, O., Hamilton, G., Catania, G., Griffies, S., Hallberg, R., Jenkins, A., Joughin, I., Motyka, R., Pfeffer, W. T., Price, S. F., Rignot, E., Scambos, T., Truffer, M., and Vieli, A.: Challenges to Understanding the Dynamic Response of Greenland's Marine Terminating Glaciers to Oceanic and Atmospheric Forcing, B. Am. Meteorol. Soc., 94, 1131–1144, https://doi.org/10.1175/BAMS-D-12-00100.1, 2013.
Todd, J. and Christoffersen, P.: Are seasonal calving dynamics forced by buttressing from ice mélange or undercutting by melting? Outcomes from full-Stokes simulations of Store Glacier, West Greenland, The Cryosphere, 8, 2353–2365, https://doi.org/10.5194/tc-8-2353-2014, 2014.
U.S. Geological Survey: Global Visualization Viewer (GloVis), https://glovis.usgs.gov/ (last access: 5 March 2022), 2017.
van der Veen, C. J.: Fracture mechanics approach to penetration of surface crevasses on glaciers, Cold Reg. Sci. Technol., 27, 31–47, https://doi.org/10.1016/S0165-232X(97)00022-0, 1998.
Weertman, J.: Can a water-filled crevasse reach the bottom surface of a glacier?, Int. Assoc. Sci. Hydrol., 139–145, 1973.
Wood, M., Rignot, E., Fenty, I., An, L., Bjørk, A., van den Broeke, M., Cai, C., Kane, E., Menemenlis, D., Millan, R., Morlighem, M., Mouginot, J., Noël, B., Scheuchl, B., Velicogna, I., Willis, J. K., and Zhang, H.: Ocean forcing drives glacier retreat in Greenland, Sci. Adv., 7, eaba7282, https://doi.org/10.1126/sciadv.aba7282, 2021.
Zhang, H., Menemenlis, D., and Fenty, I.: ECCO LLC270 Ocean-Ice State Estimate, https://dspace.mit.edu/handle/1721.1/119821, last access: 21 December 2018.