the Creative Commons Attribution 4.0 License.
the Creative Commons Attribution 4.0 License.
 | 03 Nov 2022
Sea ice breakup and freeze-up indicators for users of the Arctic coastal environment
John E. Walsh
Hajo Eicken
Kyle Redilla
Mark Johnson
The timing of sea ice retreat and advance in Arctic coastal waters varies substantially from year to year. Various activities, ranging from marine transport to the use of sea ice as a platform for industrial activity or winter travel, are affected by variations in the timing of breakup and freeze-up, resulting in a need for indicators to document the regional and temporal variations in coastal areas. The primary objective of this study is to use locally based metrics to construct indicators of breakup and freeze-up in the Arctic and subarctic coastal environment. The indicators developed here are based on daily sea ice concentrations derived from satellite passive-microwave measurements. The “day of year” indicators are designed to optimize value for users while building on past studies characterizing breakup and freeze-up dates in the open pack ice. Relative to indicators for broader adjacent seas, the coastal indicators generally show later breakup at sites known to have landfast ice. The coastal indicators also show earlier freeze-up at some sites in comparison with freeze-up for broader offshore regions, likely tied to earlier freezing of shallow-water regions and areas affected by freshwater input from nearby streams and rivers. A factor analysis performed to synthesize the local indicator variations shows that the local breakup and freeze-up indicators have greater spatial variability than corresponding metrics based on regional ice coverage. However, the trends towards earlier breakup and later freeze-up are unmistakable over the post-1979 period in the synthesized metrics of coastal breakup and freeze-up and the corresponding regional ice coverage. The findings imply that locally defined indicators can serve as key links between pan-Arctic or global indicators such as sea ice extent or volume and local uses of sea ice, with the potential to inform community-scale adaptation and response.
- Article
(9595 KB) - Full-text XML
-
Supplement
(650 KB) - BibTeX
- EndNote


Coastal sea ice impacts residents and other users of the nearshore marine environment in various ways. Perhaps most obvious is the fact that non-ice-strengthened vessels require ice-free waters for marine transport, which can serve purposes such as resupply of coastal communities, the transport of extracted resources (oil, liquefied natural gas, mined metals), migration of marine mammals (e.g., bowhead whales), and wintertime travel over the ice by coastal residents. Key metrics for such uses of the nearshore marine environment are the timing of breakup (or ice retreat) in the spring and the timing of freeze-up (or ice advance) in the autumn or early winter.
Sea ice concentration thresholds have been used in various studies to determine the dates of sea ice opening, retreat, advance, and closing (Markus et al., 2009; Johnson and Eicken, 2016; Bliss and Anderson; 2018; Peng et al., 2018; Bliss et al., 2019; Smith and Jahn, 2019). An emerging tendency in these and similar studies is the definition of breakup date as the date on which ice concentration drops below a prescribed threshold and remains below that threshold for a prescribed minimum duration (chosen to eliminate repeated crossings of the concentration threshold as a result of temperature- or wind-driven changes in ice coverage in response to transient weather events). A corresponding criterion is used for the freeze-up date.
Coastal regions present special challenges in the application of such criteria. First, landfast or shorefast ice (stationary sea ice held in place along the shoreline as a result of grounding and/or confinement by the coast) is common in waters immediately offshore of the coast, particularly in areas with shallow water. Landfast ice provides especially important sea ice services because it offers a stable platform for nearshore travel, serves as a critical habitat for marine mammals such as seals and polar bears (Dammann et al., 2018), and provides a buffer against coastal storms (Hosekova et al., 2021). Landfast ice extends offshore by hundreds of meters to many tens of kilometers. Figure 1 shows the geographical distribution of landfast ice in terms of the maximum extent during June for the period 1972–2007. Landfast ice is most extensive over shallow waters of the Siberian seas and the Canadian Archipelago. Given its widespread presence at coastal sites in the Arctic, landfast ice will be a key feature in our assessment of any differences in the sea ice indicators, particularly for ice breakup, when comparing coastal to offshore regions.
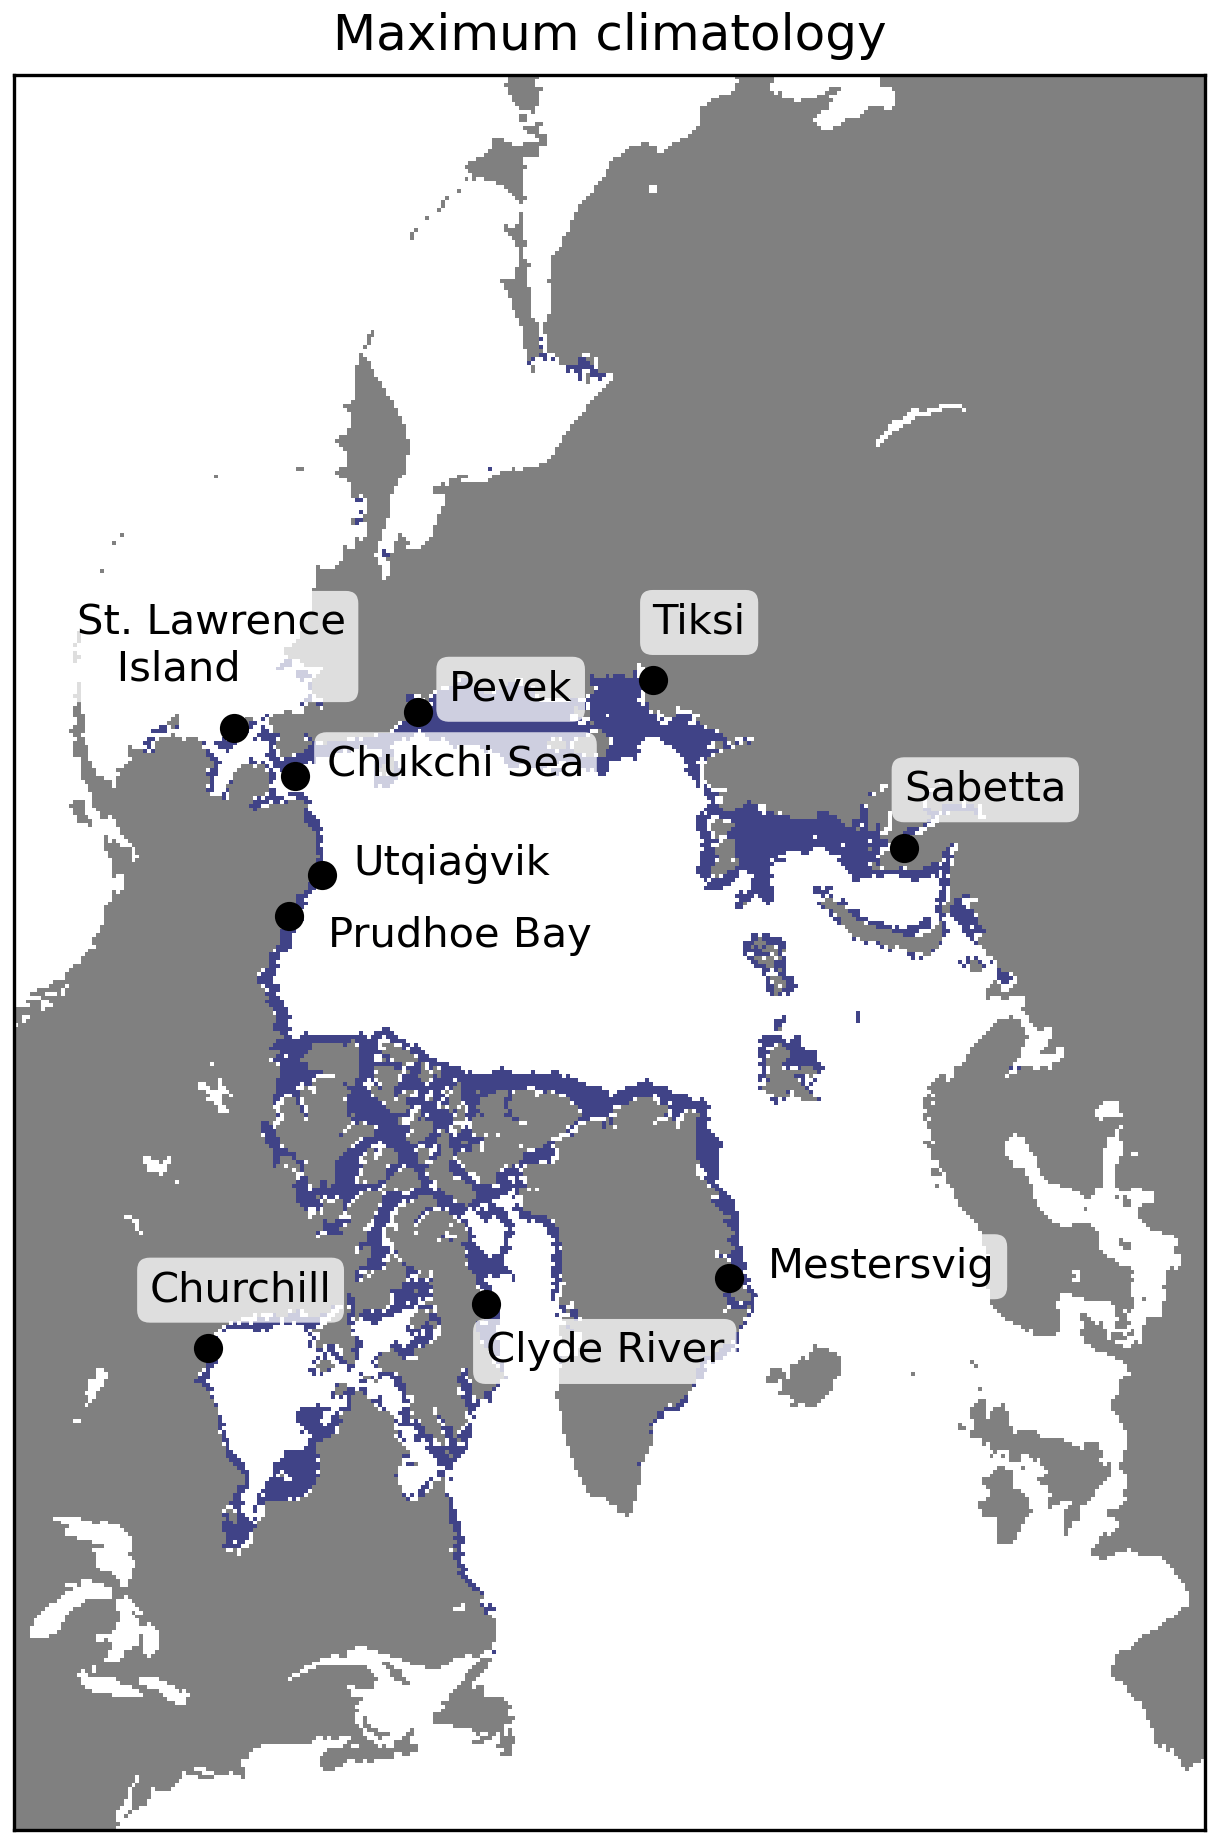
Figure 1Landfast ice distribution shown as the maximum extent of landfast ice over the 1972–2007 period. Data source: National Ice Center via National Snow and Ice Data Center, NSIDC dataset G02172 – https://nsidc.org/data/G02172 (last access: 4 September 2022).
A second challenge associated with coastal regions is that sea ice concentrations derived from passive-microwave measurements are prone to contamination by microwave emissions from land in coastal grid cells. Additionally, many parts of the Arctic coastline have inlets, river deltas, and barrier islands that are not captured by the 25 km resolution of the passive-microwave product. While higher-resolution datasets permitting finer resolution of coastal sea ice are available from sensors such as AMSR (Advanced Microwave Scanning Radiometer), the record lengths are sufficiently shorter (about 20 years for AMSR) that trend analyses are limited by a reliance on such products. Trend analysis is one of the main components of the present study.
A pervasive finding from recent studies of trends in Arctic sea ice is a shortening of the sea ice season. This finding is often presented in terms of the corresponding lengthening of the open-water season (e.g., Stroeve et al., 2014; Stroeve and Notz, 2018; Onarheim et al., 2018; Bliss and Anderson, 2018; Peng et al., 2018; Smith and Jahn, 2019). Because the reduction in ice extent has been greater in summer than in winter, the percentage of the Arctic sea ice cover experiencing breakup and freeze-up (i.e., the percentage of the maximum ice cover that is seasonal) has increased from about 50 % in 1980 to more than 70 % in recent years (Druckenmiller et al., 2021; Thomson et al., 2022). Since 1980, the length of the open-water period has increased by between 1 and 2 months (over 10 d per decade) (Stammerjohn et al., 2012; Peng et al., 2019; Thomson et al., 2022), with contributions of comparable magnitude from earlier breakup and later freeze-up. Regional variations in these trends, both in the vicinity of the coasts and in regions farther offshore, are the focus of this paper as well as of Bliss et al. (2019), to which we will compare our results.
Trends in freeze-up have been shown previously to be sensitive to the criterion for freeze-up (Peng et al., 2018; Bliss et al., 2019). For example, Peng et al. (2018) found that the trends in the autumn crossing of the 80 % concentration were greater than trends in the crossing of the 15 % threshold (Thomson et al., 2022), implying a slowing of the autumn/winter ice advance. Such findings, as well as those of Johnson and Eicken (2016), motivate our use of separate indicators for the start and end of breakup and freeze-up.
The delayed autumn freeze-up is a manifestation of the release of increased amounts of heat stored in the upper layers of the ocean, largely as a result of the increased solar absorption made possible by the earlier breakup. In this respect, trends in breakup and freeze-up are intertwined. This linkage has been demonstrated quantitatively by Serreze et al. (2016) and Stroeve et al. (2016), who explored the use of breakup timing as a predictor of the timing of ice advance in the Chukchi Sea and the broader Arctic, respectively.
The primary objective of this study is to use the locally based metrics to construct indicators of breakup and freeze-up on Arctic and subarctic coastal environments. A secondary objective is to contribute to efforts at the national and global scale to establish key sets of indicators that support sustained assessment of climate change and inform planning and decision-making for adaptation action (AMAP, 2018; IPCC, 2022). At the global, pan-Arctic, and US national levels, indicators associated with the state of the sea ice cover so far have focused on the summer minimum and winter maximum extent and ice thickness (IPCC, 2022; AMAP, 2017; Box et al., 2019; USGCRP, 2017). As outlined by Box et al. (2019), this approach has been motivated by the objective of describing and tracking the state of key components of the global climate system. However, large-scale (pan-Arctic) measures of, e.g., sea ice extent or volume are of little value and relevance to those needing to adapt or respond to such change at the community or regional scale. Here, we examine the timing of sea ice freeze-up and breakup as key constraints for a range of human activities and ecosystem functions in Arctic settings.
The primary data source is the archive of gridded daily sea ice concentrations derived from the SMMR, SSM/I, and SSMIS sensors onboard the Nimbus-7 and various DMSP satellites dating back to November 1978. The dataset is NSIDC-0051 of the National Snow and Ice Data Center (NSIDC) and is accessible at https://nsidc.org/data/nsidc-0051 (last access: 16 October 2022). In the construction of this dataset, the NASA Team algorithm (Cavalieri et al., 1984) was used to process the microwave brightness temperatures into a consistent time series of daily sea ice concentrations. The data are on a polar stereographic grid projection with a grid cell size of 25 km × 25 km. Prior to computing the breakup and freeze-up metrics described below, the data were processed with a linear interpolation to fill in missing daily values, followed by a spatial and then temporal smoothing to filter out short (<3 d) events. Specifically, the daily sea ice concentration values were spatially smoothed using a generic boxcar filter with a square footprint of 3 × 3 grid cells. The data were then temporally smoothed three times using a Hann window.
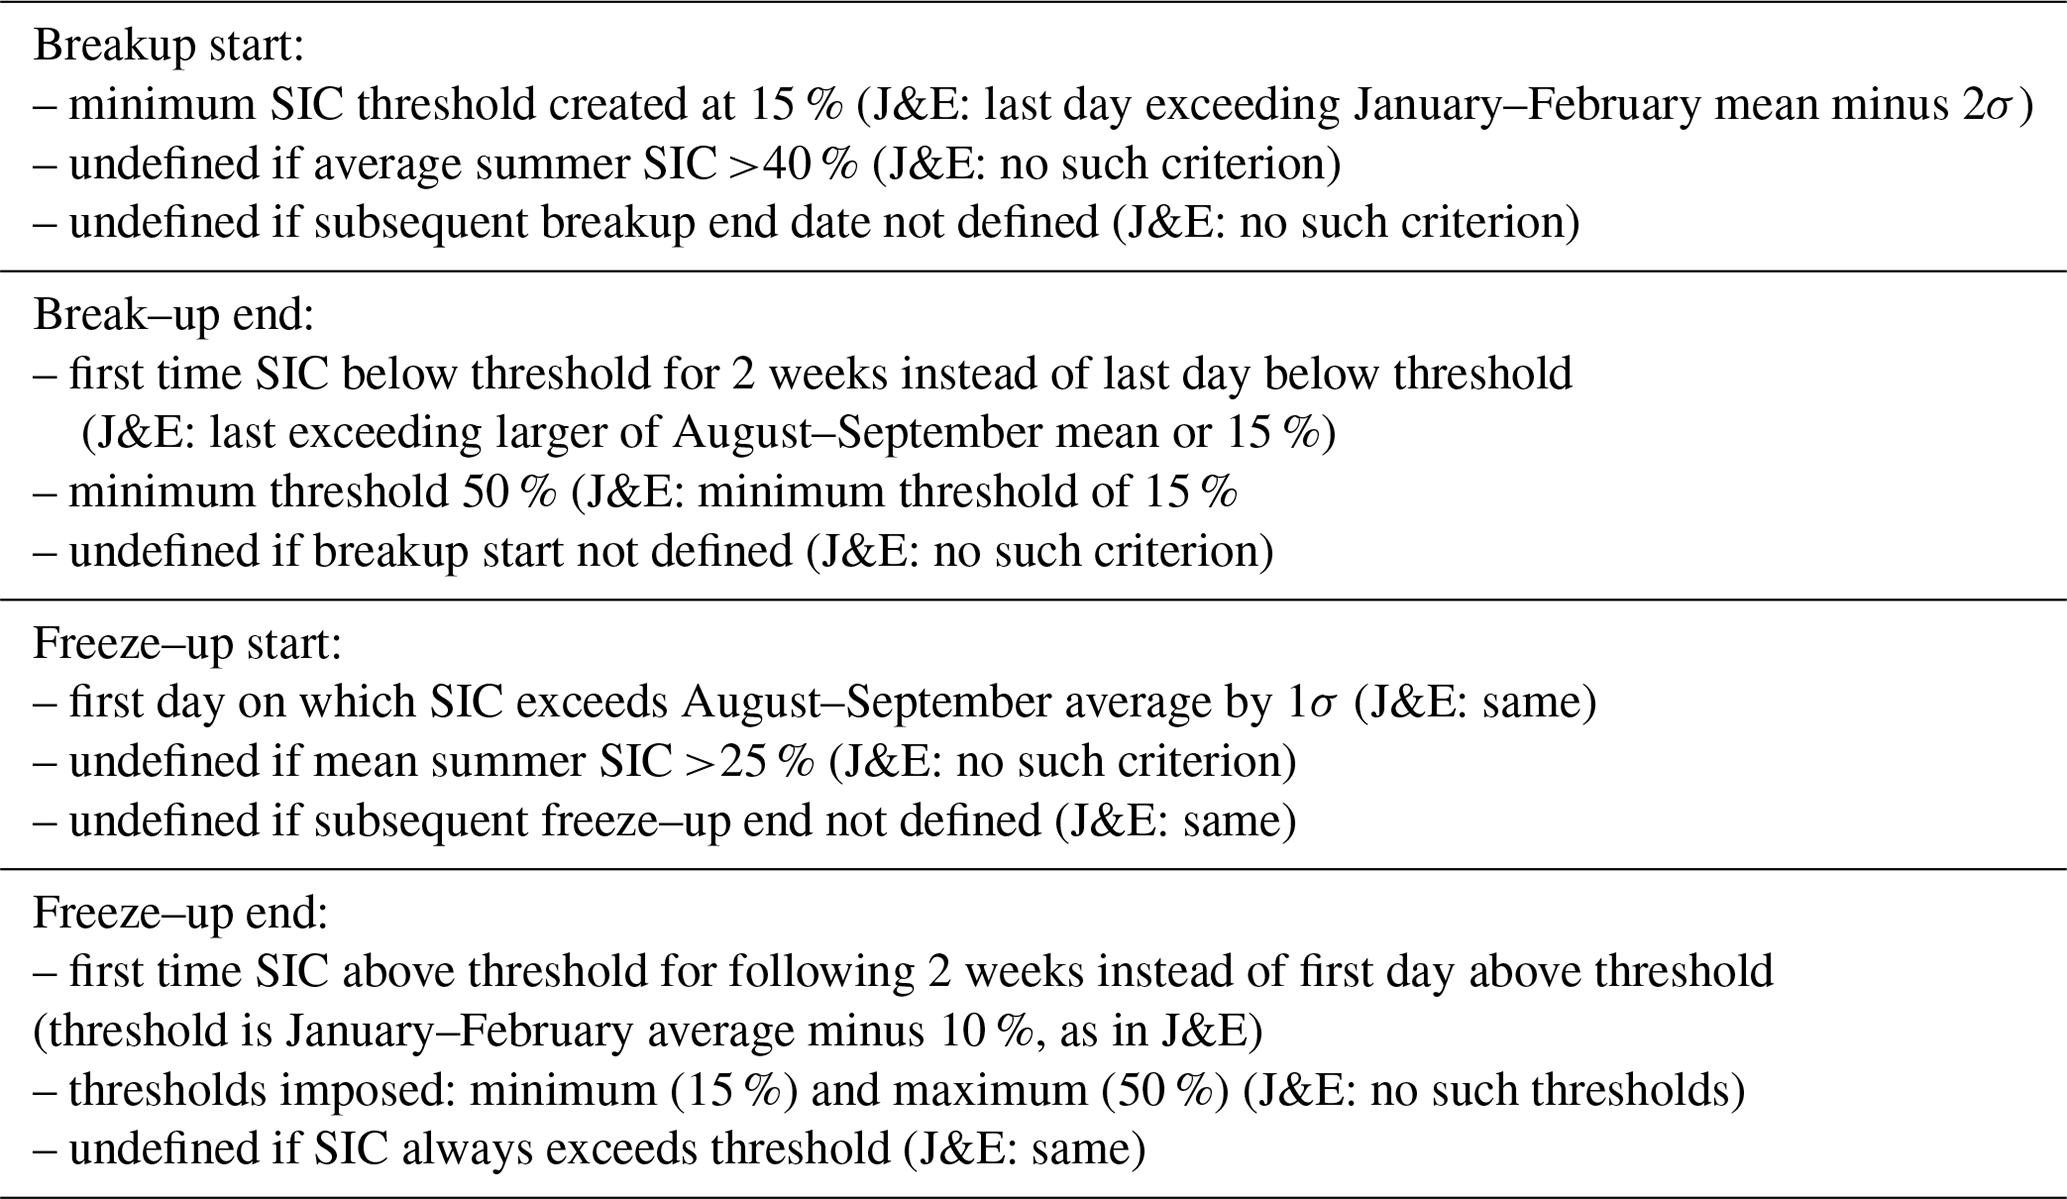
The daily sea ice concentrations are used to define the metrics of the start and end of breakup and freeze-up in each year of a 40-year period (1979–2018). The definitions build on those used by Johnson and Eicken (2016; hereafter denoted as J&E), which were informed by Indigenous experts' observations of ice use and ice hazards in coastal Alaska and relate to planning and decision-making at the community-scale (Eicken et al., 2014). Here, we expand the satellite data analysis with minor modifications of the breakup and freeze-up criteria to broaden the applicability to coastal areas. Examples include imposing maximum and minimum values for the thresholds computed from summary statistics of the daily sea ice concentration values of relevant periods. The revised definitions are presented in Table 1, and the differences relative to those of J&E are listed in Table 2.
The four indicators in this study are the dates of the start and end of breakup and freeze-up. For the purposes of this study, the breakup period may be regarded as the time between the Arctic sea ice maximum (typically in March) and the sea ice minimum (typically in September, with June representative of the period of most rapid breakup). Similarly, the freeze-up period extends from September through March, with November representative of the period of the most rapid freeze-up. The corresponding indicators used by Bliss et al. (2019) are the date of opening (defined as the last day on which the ice concentration drops below 80 % before the summer minimum), the date of retreat (defined as the last day the ice concentration drops below 15 % before the summer minimum), the date of advance (defined as the first day the ice concentration increases above 15 % following the final summer minimum), and the date of closing (defined as the first day the ice concentration increases above 80 % following the final summer minimum). For the comparisons of indicator dates presented in Sect. 3, we did not make any modifications to the Bliss et al. (2019) criteria.
While the various thresholds in Table 1 may seem somewhat arbitrary at first glance, they are based on past sensitivity tests. In particular, the 10 % threshold is based on prior work (J&E) in which sensitivities were explored. The selected thresholds were those that generally maximized the number of such years across the coastal locations and MASIE (Multisensor Analyzed Sea Ice Extent; https://nsidc.org/data/masie/explore-region, last access: 16 October 2022) regions.
Table 1Definition of the start and end of breakup and freeze-up.
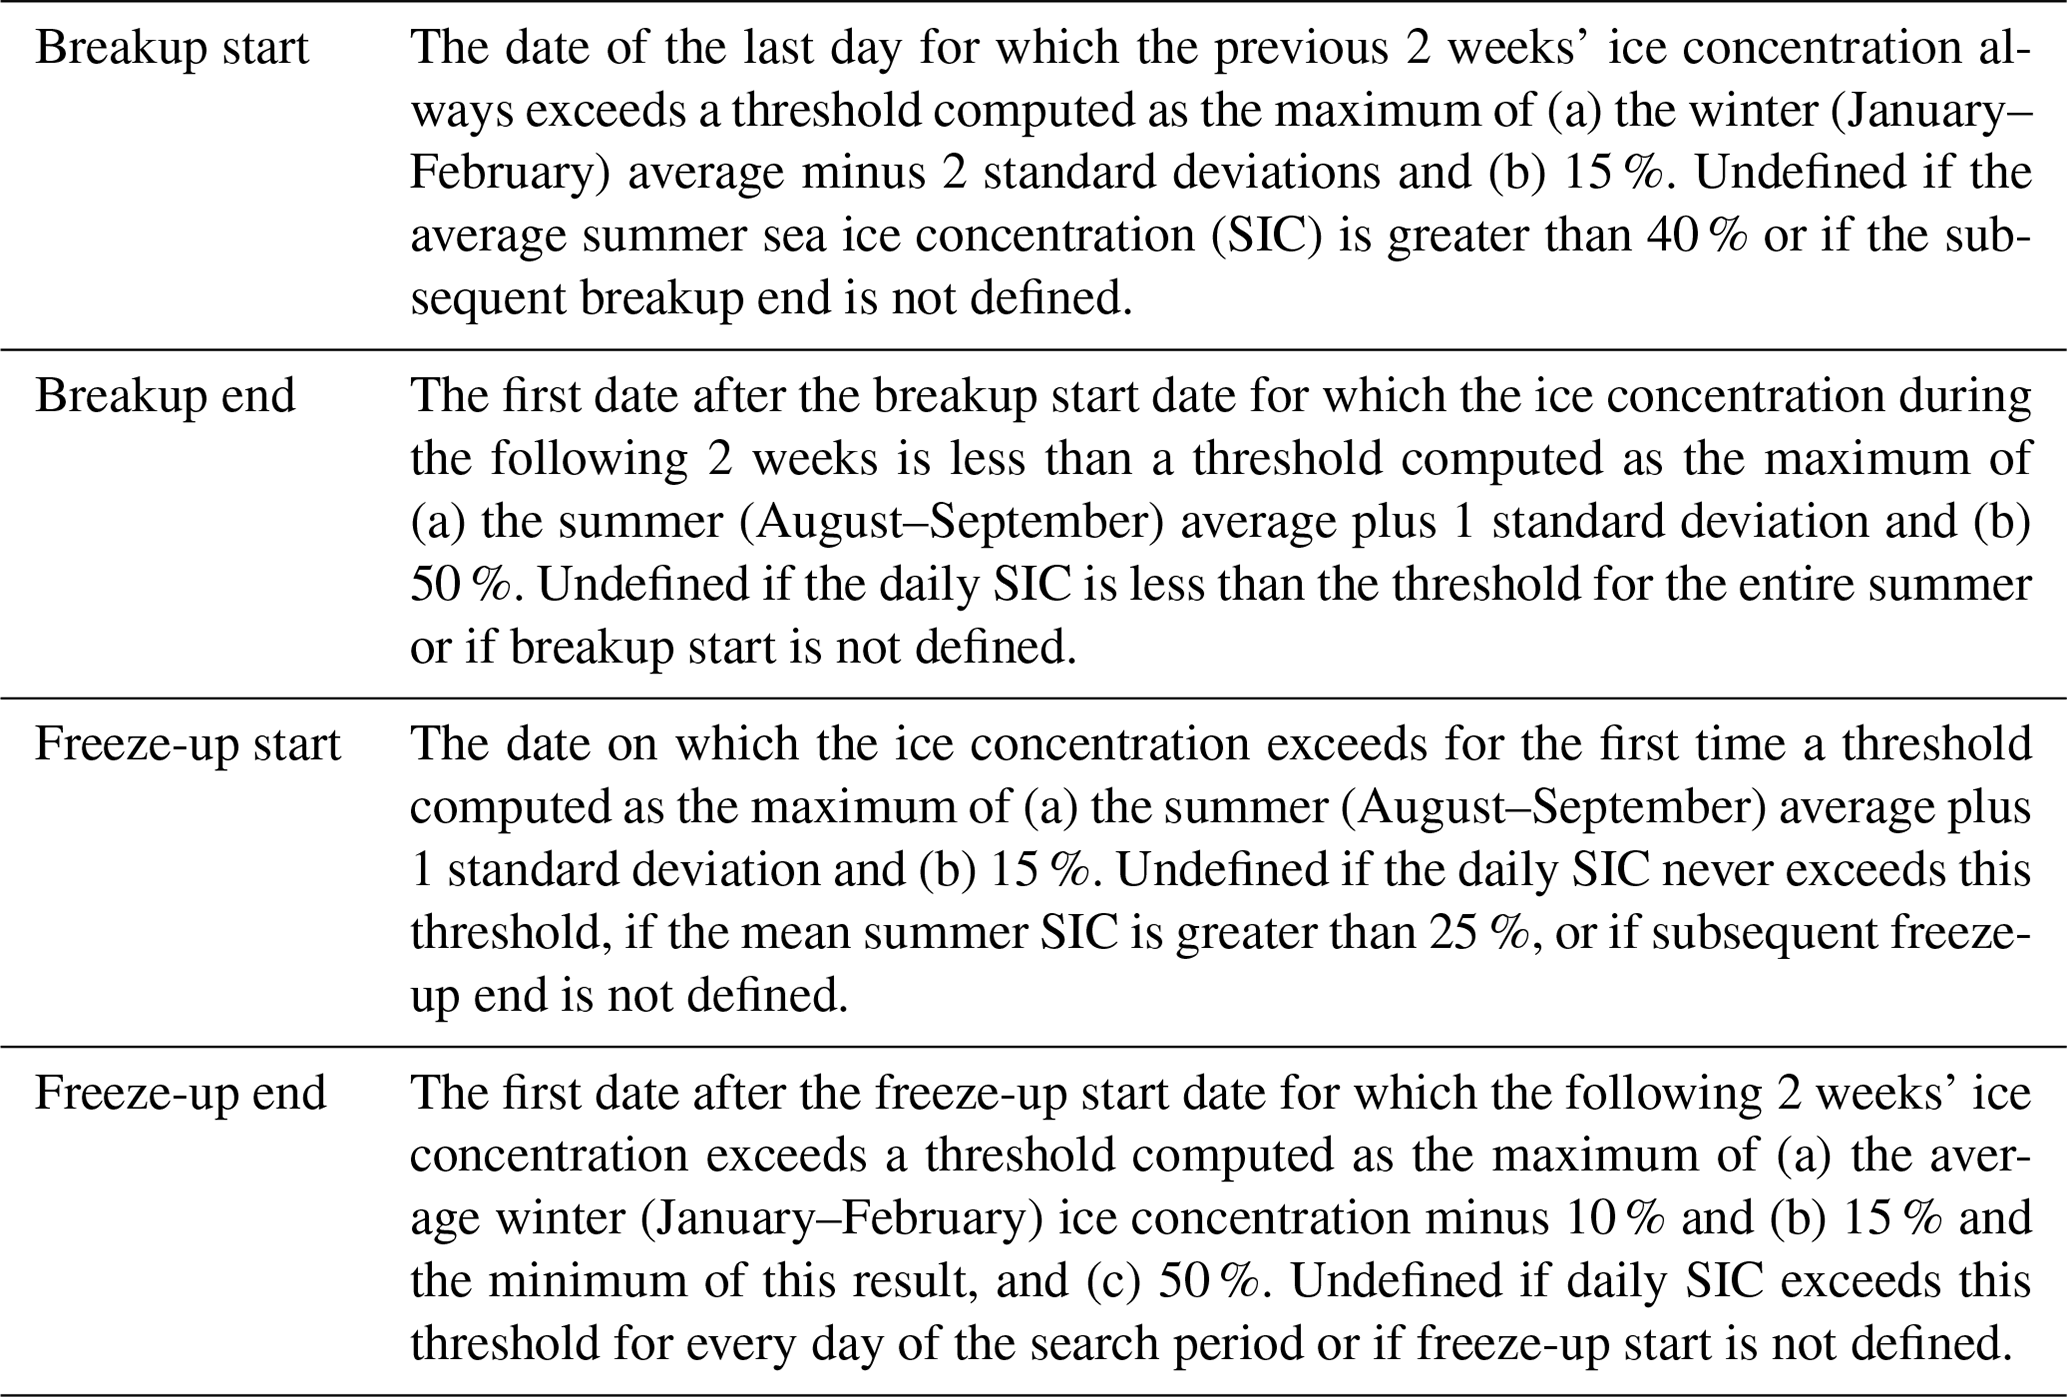
Table 2Changes in the indicator definitions relative to Johnson and Eicken (2016), denoted as “J&E”. The symbol “σ” denotes standard deviation; “SIC” denotes sea ice concentration.
Our evaluation of the coastal indicators includes comparisons of the various dates (breakup and freeze-up start and end) at nearshore locations with the corresponding metrics for broader areas of the Arctic Ocean and the subarctic seas. A set of 10 locations was selected on the basis of their geographical distribution and the relevance of local sea ice to uses by communities, industry, military, or other stakeholders. Examples of local uses include over-ice travel for access to marine mammals, offshore travel between coastal communities, access of coastal facilities by commercial vessels, and protection from coastal waves and erosion. The 10 locations are shown in Fig. 2 and listed in Table 3, together with their geographic coordinates. While there is admittedly some subjectivity in the selection of these sites, our priorities were (1) a pan-Arctic geographical distribution, thereby expanding the emphasis on North American locations in past studies (see Discussion in Sect. 4) and (2) inclusion of locations with a mix of users affected by sea ice: Indigenous communities, industry, military, and other stakeholders. For each of these locations, several passive-microwave grid cells close to (but not adjacent to) the coastline were selected for calculation of the breakup and freeze-up metrics. More specifically, the contamination of the passive-microwave-derived ice concentrations by the presence of land in a grid cell required the exclusion of grid cells containing land. Therefore, the selected grid cells satisfied the criterion that they were the cells closest to the coast but centered at least 25 km from the coast. Figure 2 shows geographical insets illustrating the proximity of the selected grid cells to the coastline.
With regard to the grid cell selection, we experimented with the grid cell selections at Sabetta and Utqiaġvik. When the grid cell locations were shifted offshore by one pixel at Sabetta, the mean breakup start and end dates changed by only −0.1 and −1.1 d, respectively; the corresponding changes in the freeze-up start and end dates were 0.2 and −0.7 d, respectively. At Utqiaġvik, the offshore shift resulted in an earlier mean breakup start by 3.3 d and a later mean breakup end by 2.9 d. The earlier breakup start is consistent with the presence of landfast ice at the coast, as discussed in Sect. 4. The changes in Utqiaġvik's freeze-up dates were small when the pixels were shifted offshore, where the start of freeze-up occurred 1.1 d later and the end of freeze-up 1.1 d earlier than closer to the coast.
Table 3Near-coastal locations selected for calculation of breakup and freeze-up metrics.
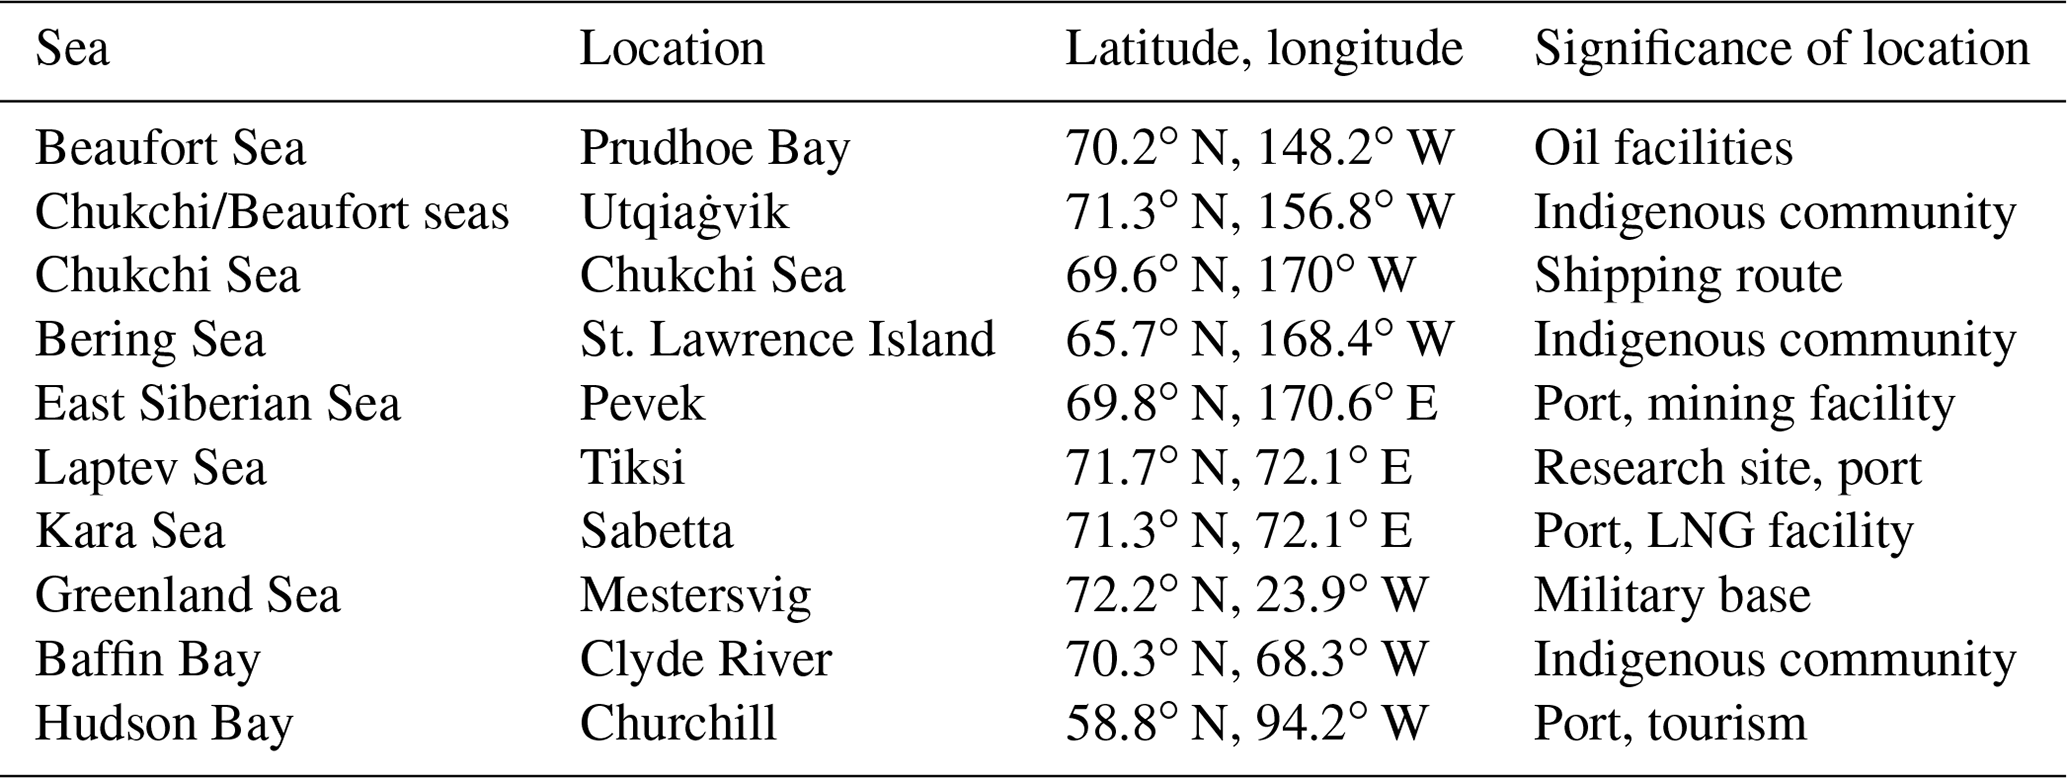
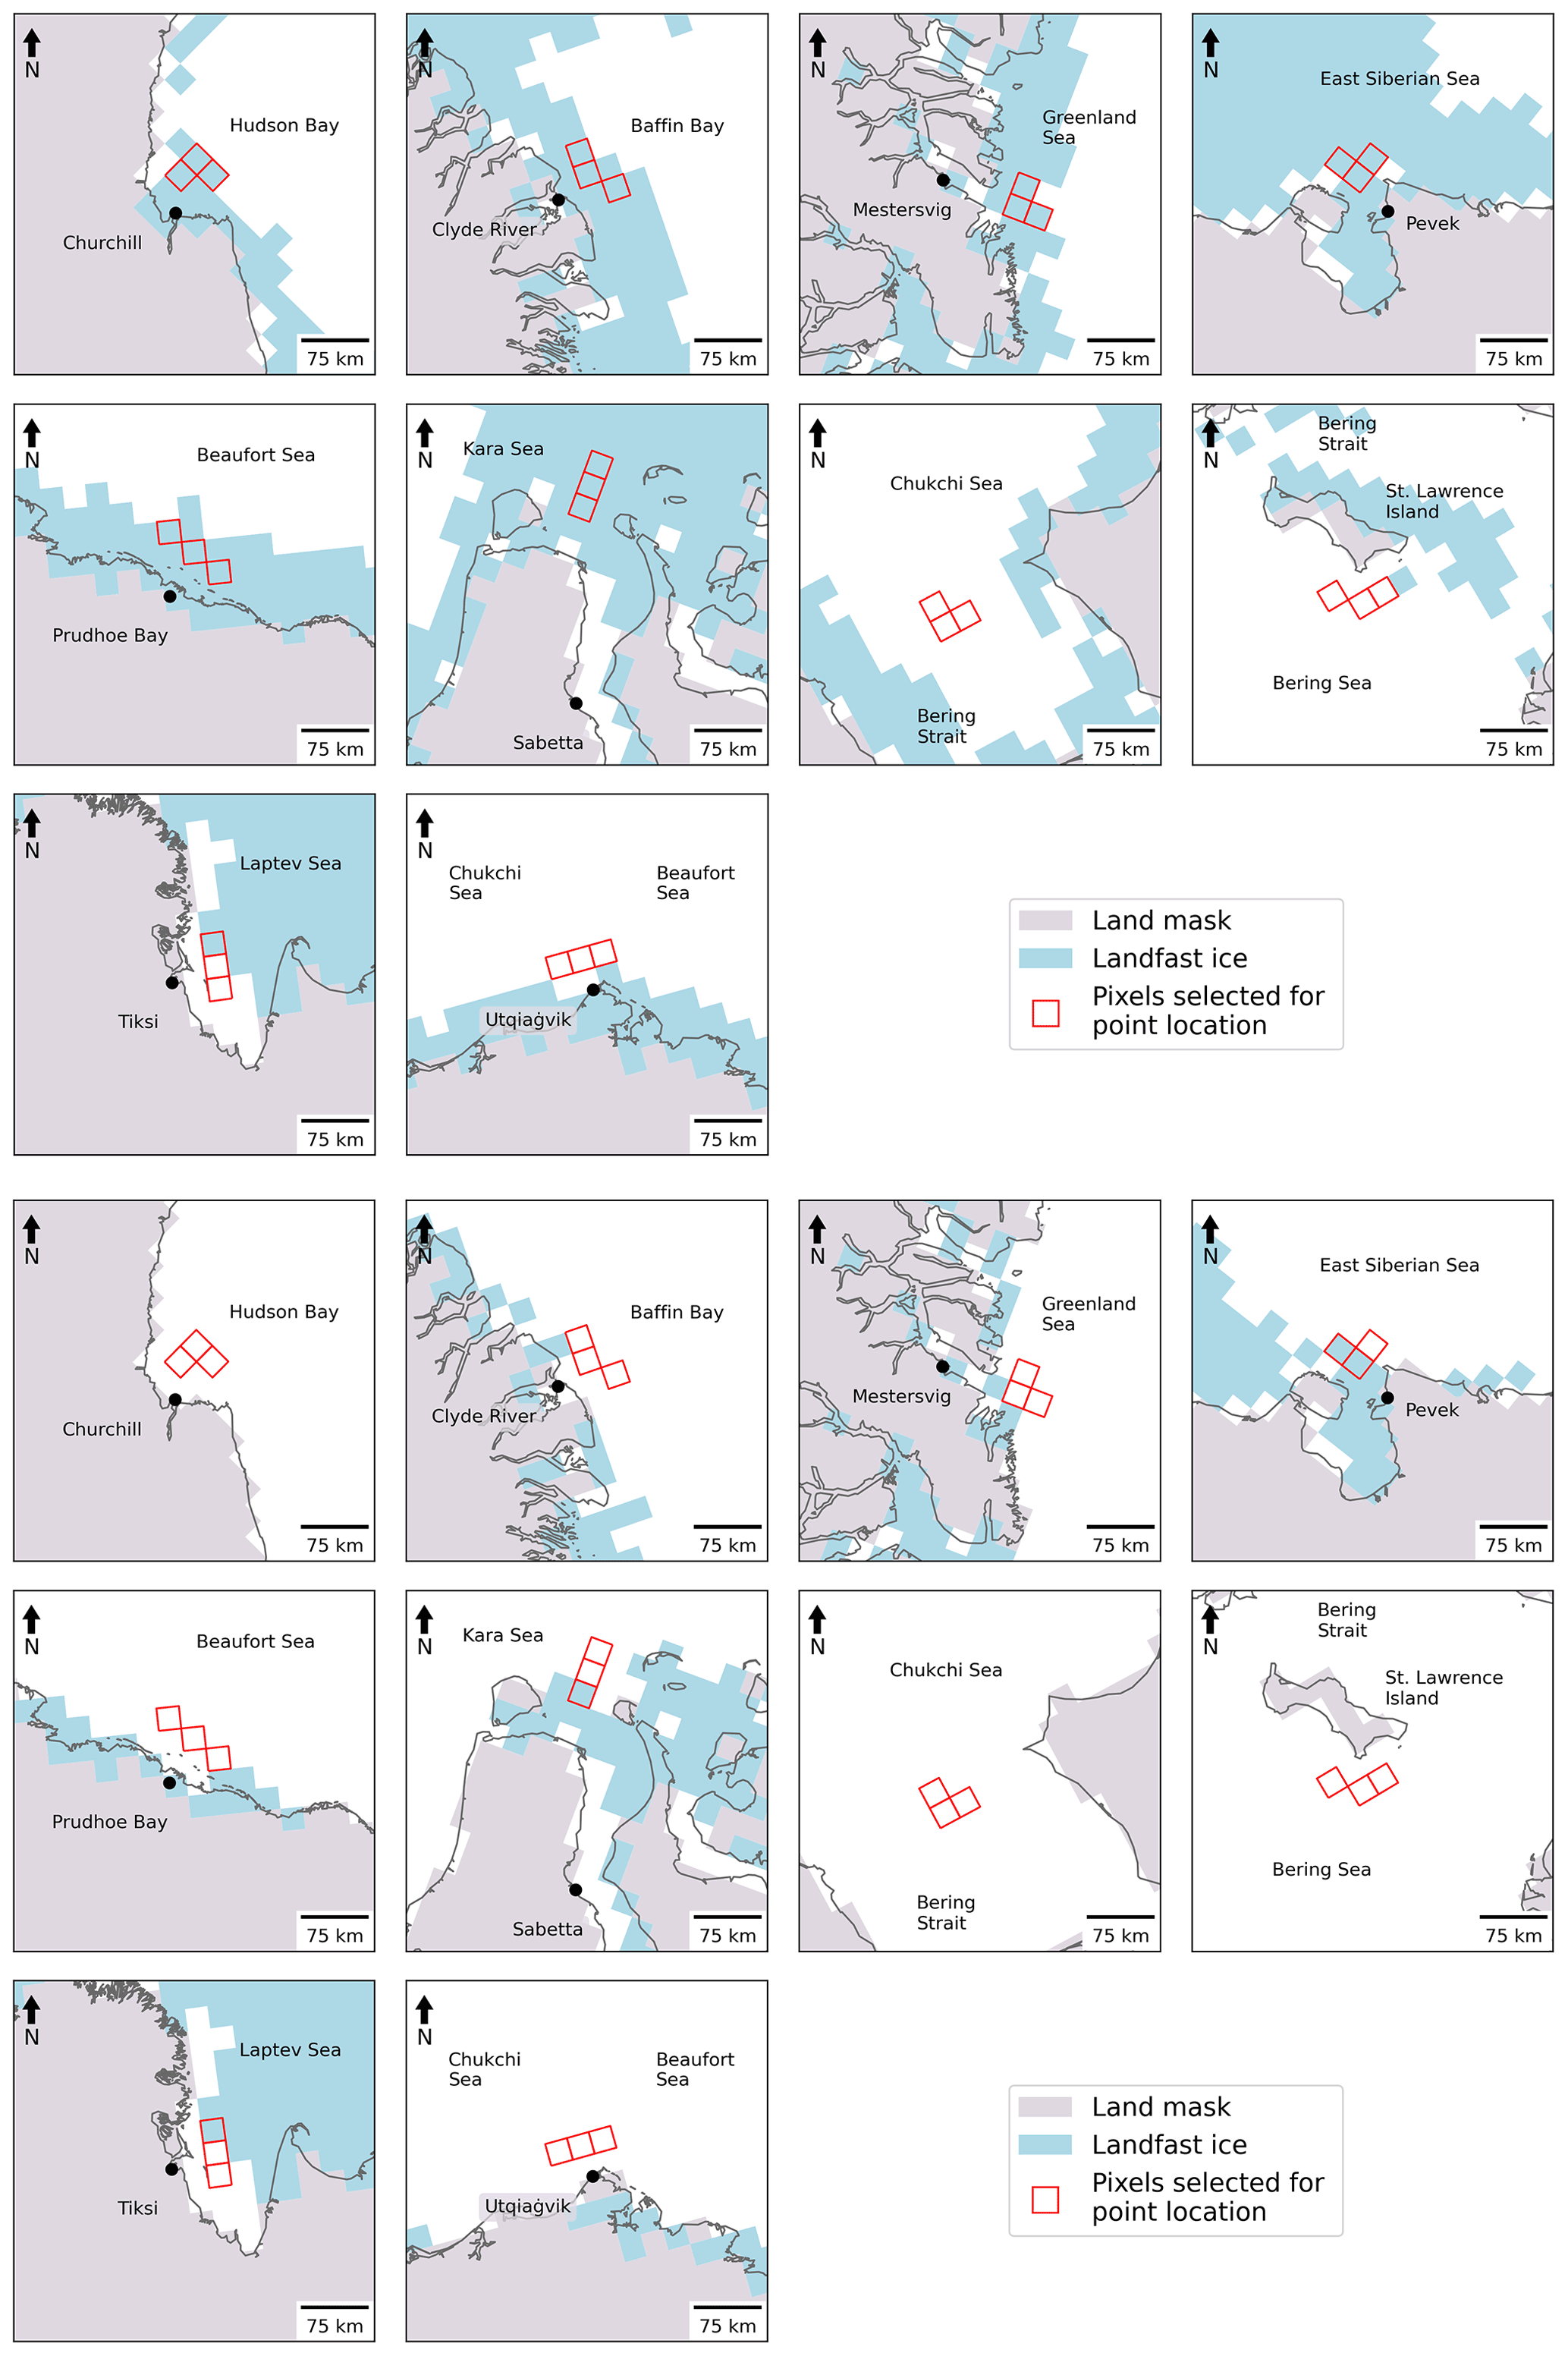
Figure 2Grid cells (red squares) for which passive-microwave-derived ice concentrations were used in computing the breakup and freeze-up metrics for the coastal locations. Black dots represent the actual locations of the coastal communities. Blue shading denotes maximum (upper panels) and median (lower panels) coverage of landfast ice in June over the 1972–2007 period based on charts of the U.S. National Ice Center – https://nsidc.org/data/G02172 (last access: 28 June 2022).
It is apparent from Fig. 2 that the innermost extent of the landfast ice does not always coincide with the coastline, which we assume here should always be the inner boundary of landfast ice. The northern Siberian coast (Sabetta and Tiksi) provides examples. In pursuing an explanation for the discrepancies, we found that the land mask in the landfast ice dataset (digitized charts of the National Ice Center) differs from the land mask of the NSIDC's passive-microwave dataset. The resulting offset does not change the area covered by sea ice in each regional plot, but it does result in the mislocation of the inner boundary of landfast ice. The discrepancy does not alter the reasoning about the geographically varying roles of landfast ice, as discussed in Sect. 4, and a more detailed analysis of the origin of these offsets in coastline depiction and landfast ice location is beyond the scope of this paper.
The grid cell selections for St. Lawrence Island and the Chukchi Sea deserve special comment. The grid cells off St. Lawrence Island were chosen to reflect timing and location of subsistence harvests by the communities of Gambell and Savoonga. Because of extensive ice coverage, including landfast ice, north and northwest of the island, both communities traditionally conduct bowhead whale harvests at hunting camps on the south side of the island once spring ice breakup is underway (Noongwook et al., 2007). These sites also reflect the seasonal migration of whales in waters south of the island with the seasonal retreat of the ice cover (Noongwook et al., 2007), modulated somewhat by the presence of a polynya south and southwest of the island (Krupnik et al., 2010; Noongwook et al., 2007). Traditional walrus harvest practices on St. Lawrence Island await the very end of the bowhead whale hunt (Kapsch et al., 2010), with timing of spring ice breakup south of the island as the driving factor. These practices motivated our selection of grid cells southeast of the island. As shown later (Sect. 4), landfast ice is confined to the northern coastal region of St. Lawrence Island – consistent with the frequent presence of the polynya south of the island. In the case of the Chukchi Sea, the grid cells are indeed farther from the coast than for the other sites; the locations were intentionally selected to be farther offshore in order to provide a non-coastal counter-example to the other sites, all of which are adjacent to a coast.
Previous studies cited earlier have evaluated breakup and freeze-up metrics for subregions of the Arctic Ocean and the surrounding seas (Markus et al., 2009; Johnson and Eicken, 2016; Bliss and Anderson, 2018; Peng et al., 2018; Bliss et al., 2019; Smith and Jahn, 2019). For comparisons with broader regions offshore of our selected sites, we utilize the MASIE regionalization. Of the MASIE regions shown in Fig. 3, we choose the following for computation of regionally averaged metrics of breakup and freeze-up: the Beaufort Sea, Chukchi Sea, East Siberian Sea, Laptev Sea, Kara Sea, Greenland Sea, Baffin Bay, Hudson Bay, and Bering Sea.
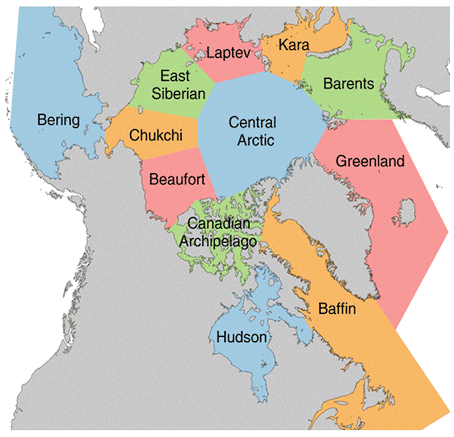
Figure 3The MASIE subregions of the Arctic. Regions utilized in this study include the Beaufort Sea, Chukchi Sea, East Siberian Sea, Laptev Sea, Kara Sea, Baffin Bay, Hudson Bay, and Bering Sea.
The following section includes time series of the local indicators and, for comparison, time series of the corresponding MASIE regional indicators. In order to address the spatial coherence of the indicators, we performed a factor analysis on the different sets (breakup and freeze-up, start and end dates). The computation of the indicators was done for the 10 local sites and for the MASIE regions in which they fall. Factor analysis is a statistical method for quantifying relationships among a set of variables. The variability in the overall dataset is depicted by a set of factors. Each factor explains a percentage of the total variance in space and time. Each variable in each factor is given a loading (or weight) based on its contribution to the variance explained by that factor. The first factor can be viewed as the linear combination of the variables that maximizes the explained variance in the overall dataset. The second and each successive factor maximize the variance unexplained by the preceding factors. Successive factors explain successively smaller fractions of the overall variance. Multiple variables can have strong loadings in the same factor, indicating they follow a similar pattern and are likely highly related. Factor analysis has a long history of applications to Arctic sea ice variability (Walsh and Johnson, 1979; Fang and Wallace, 1994; Deser et al., 2000; Fu et al., 2021). The factor analysis calculations used here were performed using the XLSAT software package run in Excel (https://www.xlstat.com/en/, last access: 8 October 2022).
With coastal ice retreat and the onset of ice advance as this study's primary foci, we first demonstrate the applicability of the indicators evaluated here. The various metrics of sea ice breakup and freeze-up in Table 1 are not defined for all locations in the Arctic. For example, locations that remain ice-covered throughout a particular year will not be assigned dates for any of the indicators in that year, and the same is true of locations at which sea ice does not form during a particular year. Figure 4 shows the number of years in the 1979–2018 study period during which the breakup and freeze-up indicators are actually defined. It is apparent that the indicators are consistently defined in the seasonal sea ice zone spanning the subarctic seas. In particular, all 10 coastal locations in Table 2 are in the yellow areas (>35 years out of 40 years defined) of Fig. 4. Of note in Fig. 4 is that the number of years with defined breakup indicators slightly exceeds (by one) the number of years with freeze-up indicators at some locations at the outer periphery of the seasonal sea ice zone. These are locations in which sea ice was present for some portion of the early years but not at the end of the study period, so in one of the years there was a breakup but no freeze-up.
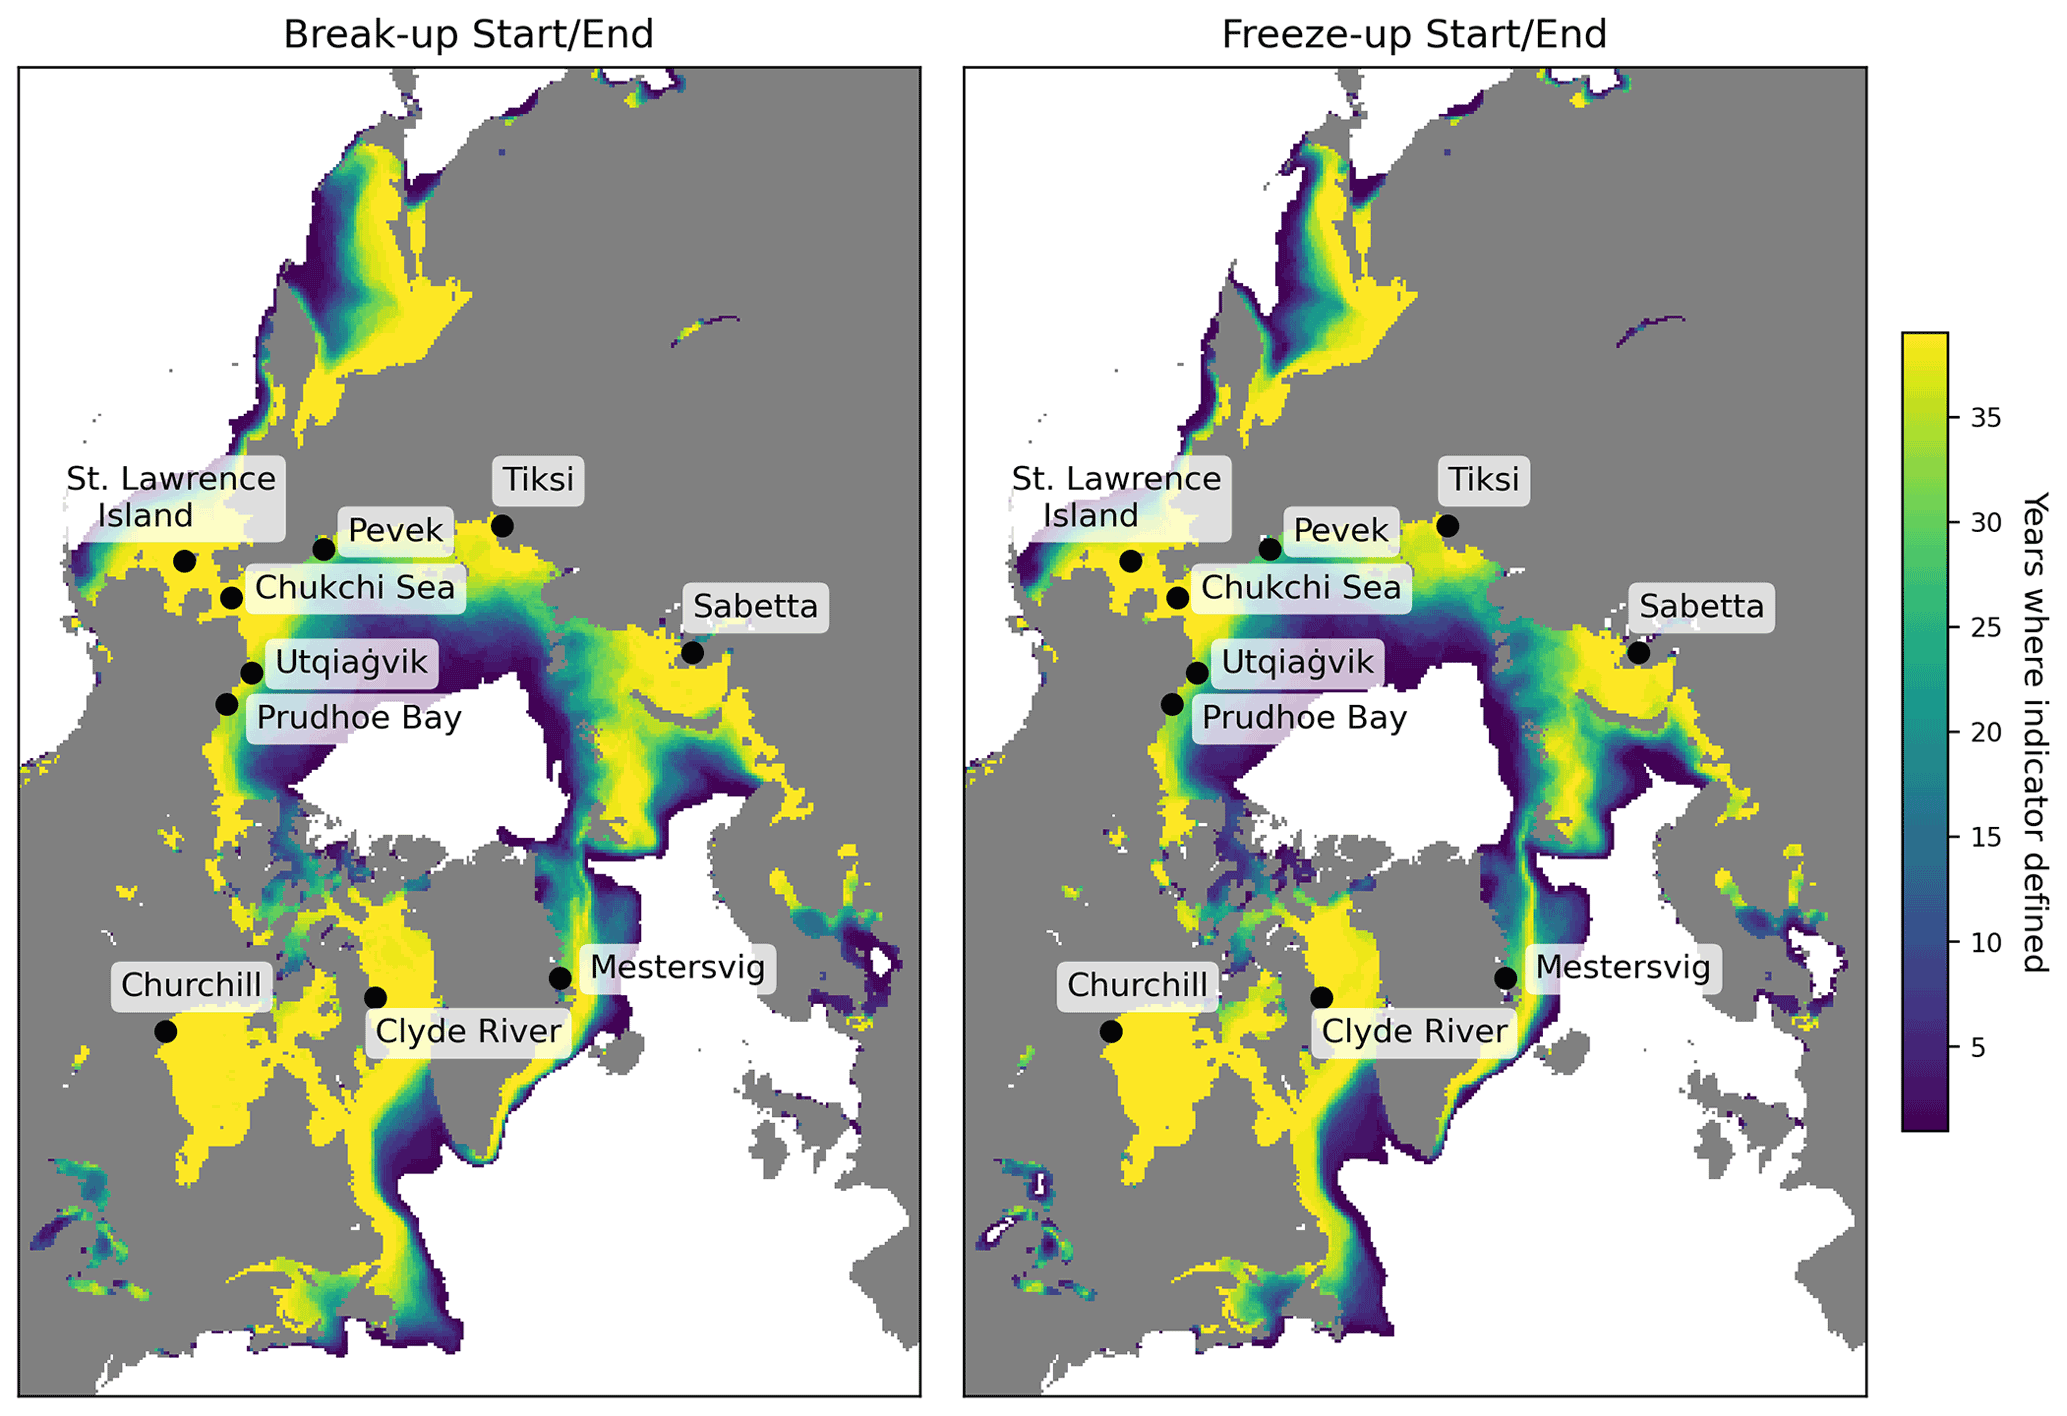
Figure 4Number of years in the 1979–2018 study period in which the breakup and freeze-up indicators were defined. Note that end dates for breakup and freeze-up exist only for years in which there are start dates for breakup and freeze-up. The start and end dates of the overall data record (1 January 1979–31 December 2018) can result in differences of 1 year in the counts when freeze-up occurs around 1 January.
A key issue to be addressed is the degree to which the indicators utilized here differ from those of previous studies. The metrics of Bliss et al. (2019) or similar variants have been used in recent publications and provide natural points of comparison. While there are various differences between our metrics and those of Bliss et al. (2019), the most consequential for the computed dates is the use of departures from winter/summer averages concentrations in our criteria vs. the Bliss et al. (2019) use of 15 % and 80 % concentrations as key thresholds. This distinction is analogous to the difference between the NASA Team algorithm's use of fixed tie points and the NASA Bootstrap algorithm's use of “dynamic” (time-/space-varying) tie points.
Figure 5 and Table S1 show that there are systematic differences between our metrics (based on the modified J&E criteria) and those of Bliss et al. (2019) when the two sets of metrics are evaluated for the MASIE regions. In particular, J&E's start and end of breakup generally occur earlier by up to several weeks than the corresponding dates of opening and retreat defined by Bliss et al. (2019) On the other hand, J&E's freeze-up dates are more closely aligned with those of Bliss et al. (2019), although J&E's end of freeze-up occurs later (by 1 to 3 weeks) than the Bliss et al. (2019) closing date in most of the MASIE regions, especially the North Atlantic and Canadian regions.
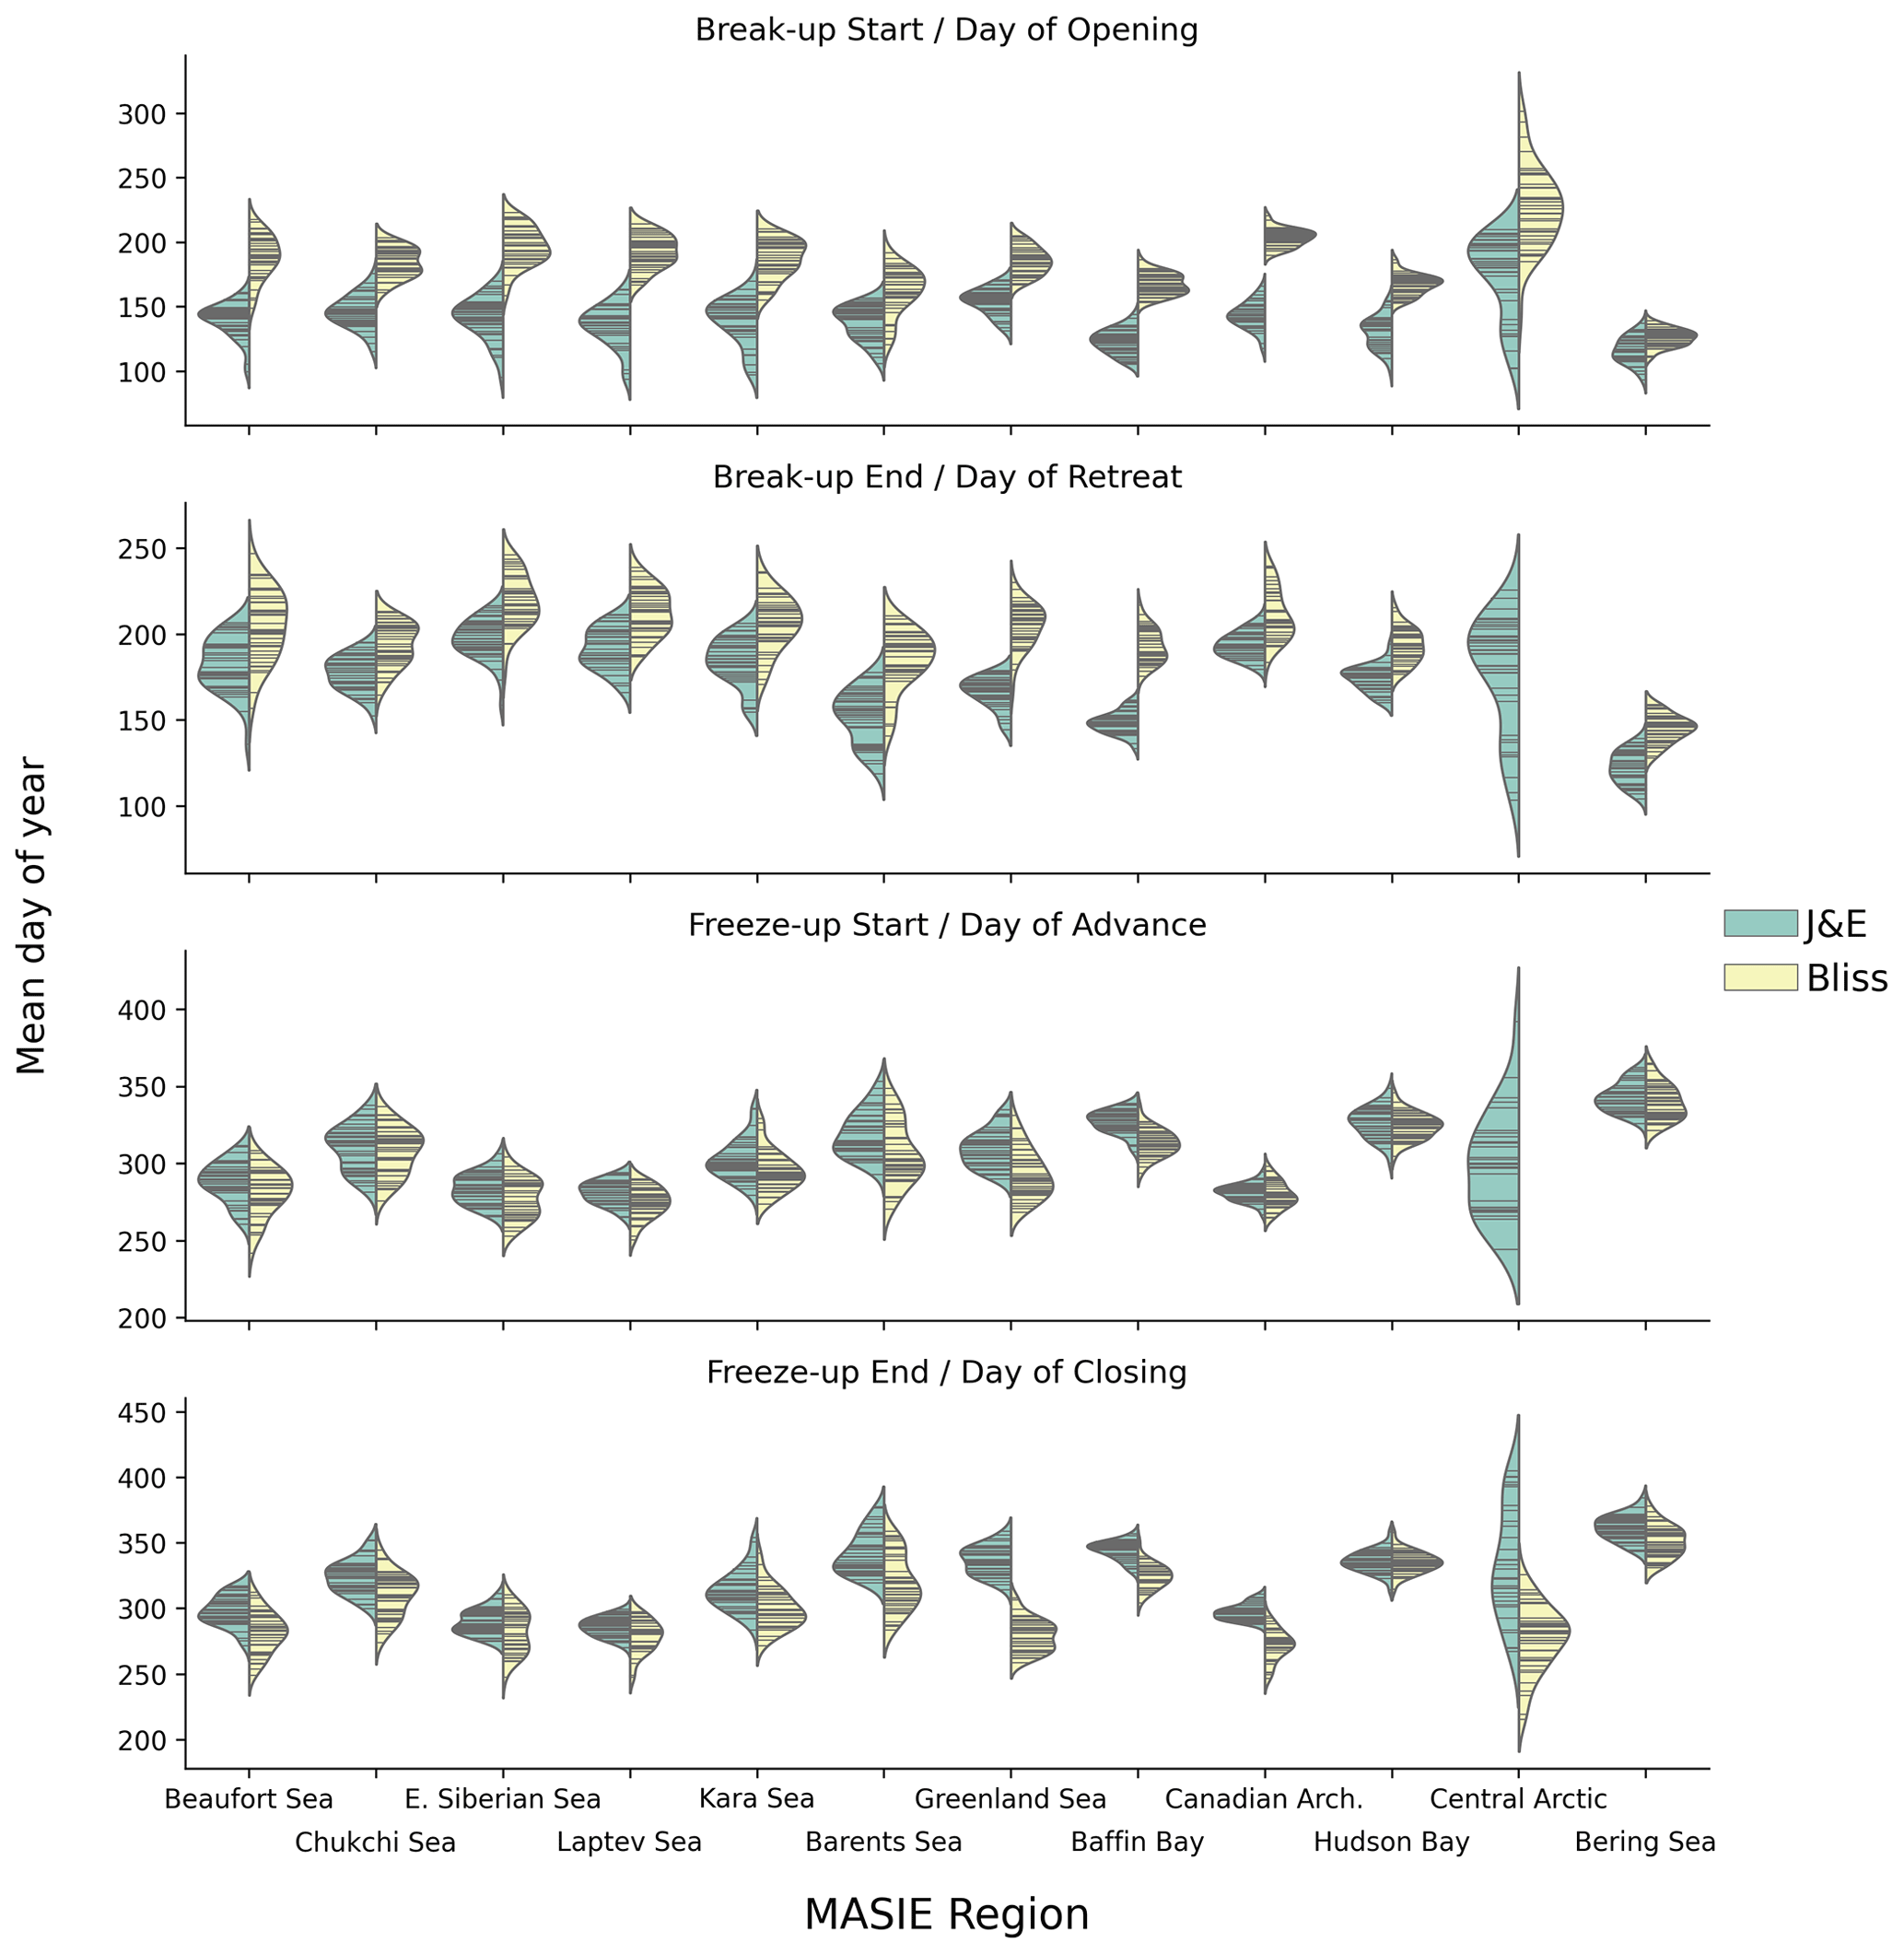
Figure 5“Violin” plots of the Julian dates of the breakup and freeze-up metrics used in this study based on Johnson and Eicken (2016) (green shading) and the corresponding dates of ice opening, retreat, advance, and closing as defined by Bliss et al. (2019) (yellow shading). A violin plot shows a distribution by widening the horizontal lines in the ranges (of day of the year, in this case) having the highest concentration of values. The thin black lines represent the observations themselves; the black strips are clusters of lines representing groups of similar values in the distribution. The violin plots provide no information about the temporal sequence of the values.
The violin plots in Fig. 5 show distributions but not the temporal variations that have been indicated by results of previous studies (Peng et al., 2018; Bliss et al., 2019). Figures 6 and 7 provide the temporal perspective on the end dates of breakup (day of retreat) and freeze-up (day of closing), respectively. In each of the MASIE regions, the J&E criterion gives an earlier breakup date. The difference is typically 2 to 3 weeks, although it exceeds 1 month in the Greenland Sea and Baffin Bay. Despite the offsets, the trends are nearly the same in nearly all the regions. Exceptions are the Canadian Archipelago, where the J&E trend is weaker than the Bliss trend, and the Bering Sea, where the trends are opposite in sign. However, the trend in the Bering region is not statistically significant at the 99 % level by either metric, in contrast to all other regions in which the trends are significant at this level (Table S2). The main conclusion from Fig. 6 is that, except for the Bering Sea, sea ice breakup is occurring earlier throughout the Arctic than several decades ago, no matter which metric is used.
In contrast to the trends towards earlier breakup, the J&E and Bliss metrics for the end of freeze-up both show significant trends towards later dates in most of the MASIE regions (Fig. 7 and Table S3). In this case, even the Bering Sea shows a trend towards later freeze-up. Again, there is an offset towards a later date with the J&E metric, although the offset has a range among the regions, from essentially zero in Hudson Bay to more than 6 weeks in the Greenland Sea. The trends, however, show less agreement in some regions than do the trends for breakup dates in Fig. 6. The J&E trends are less positive than the Bliss trends in the seas of the eastern Russian sector: the Chukchi, East Siberian, and Laptev seas. The same is true, although to a lesser degree, in the Barents Sea and the Canadian Archipelago. The main message from Fig. 7 is that the freeze-up is ending later throughout the Arctic, although the magnitude of the trend is more sensitive to the criteria used for end of freeze-up than for end of breakup.
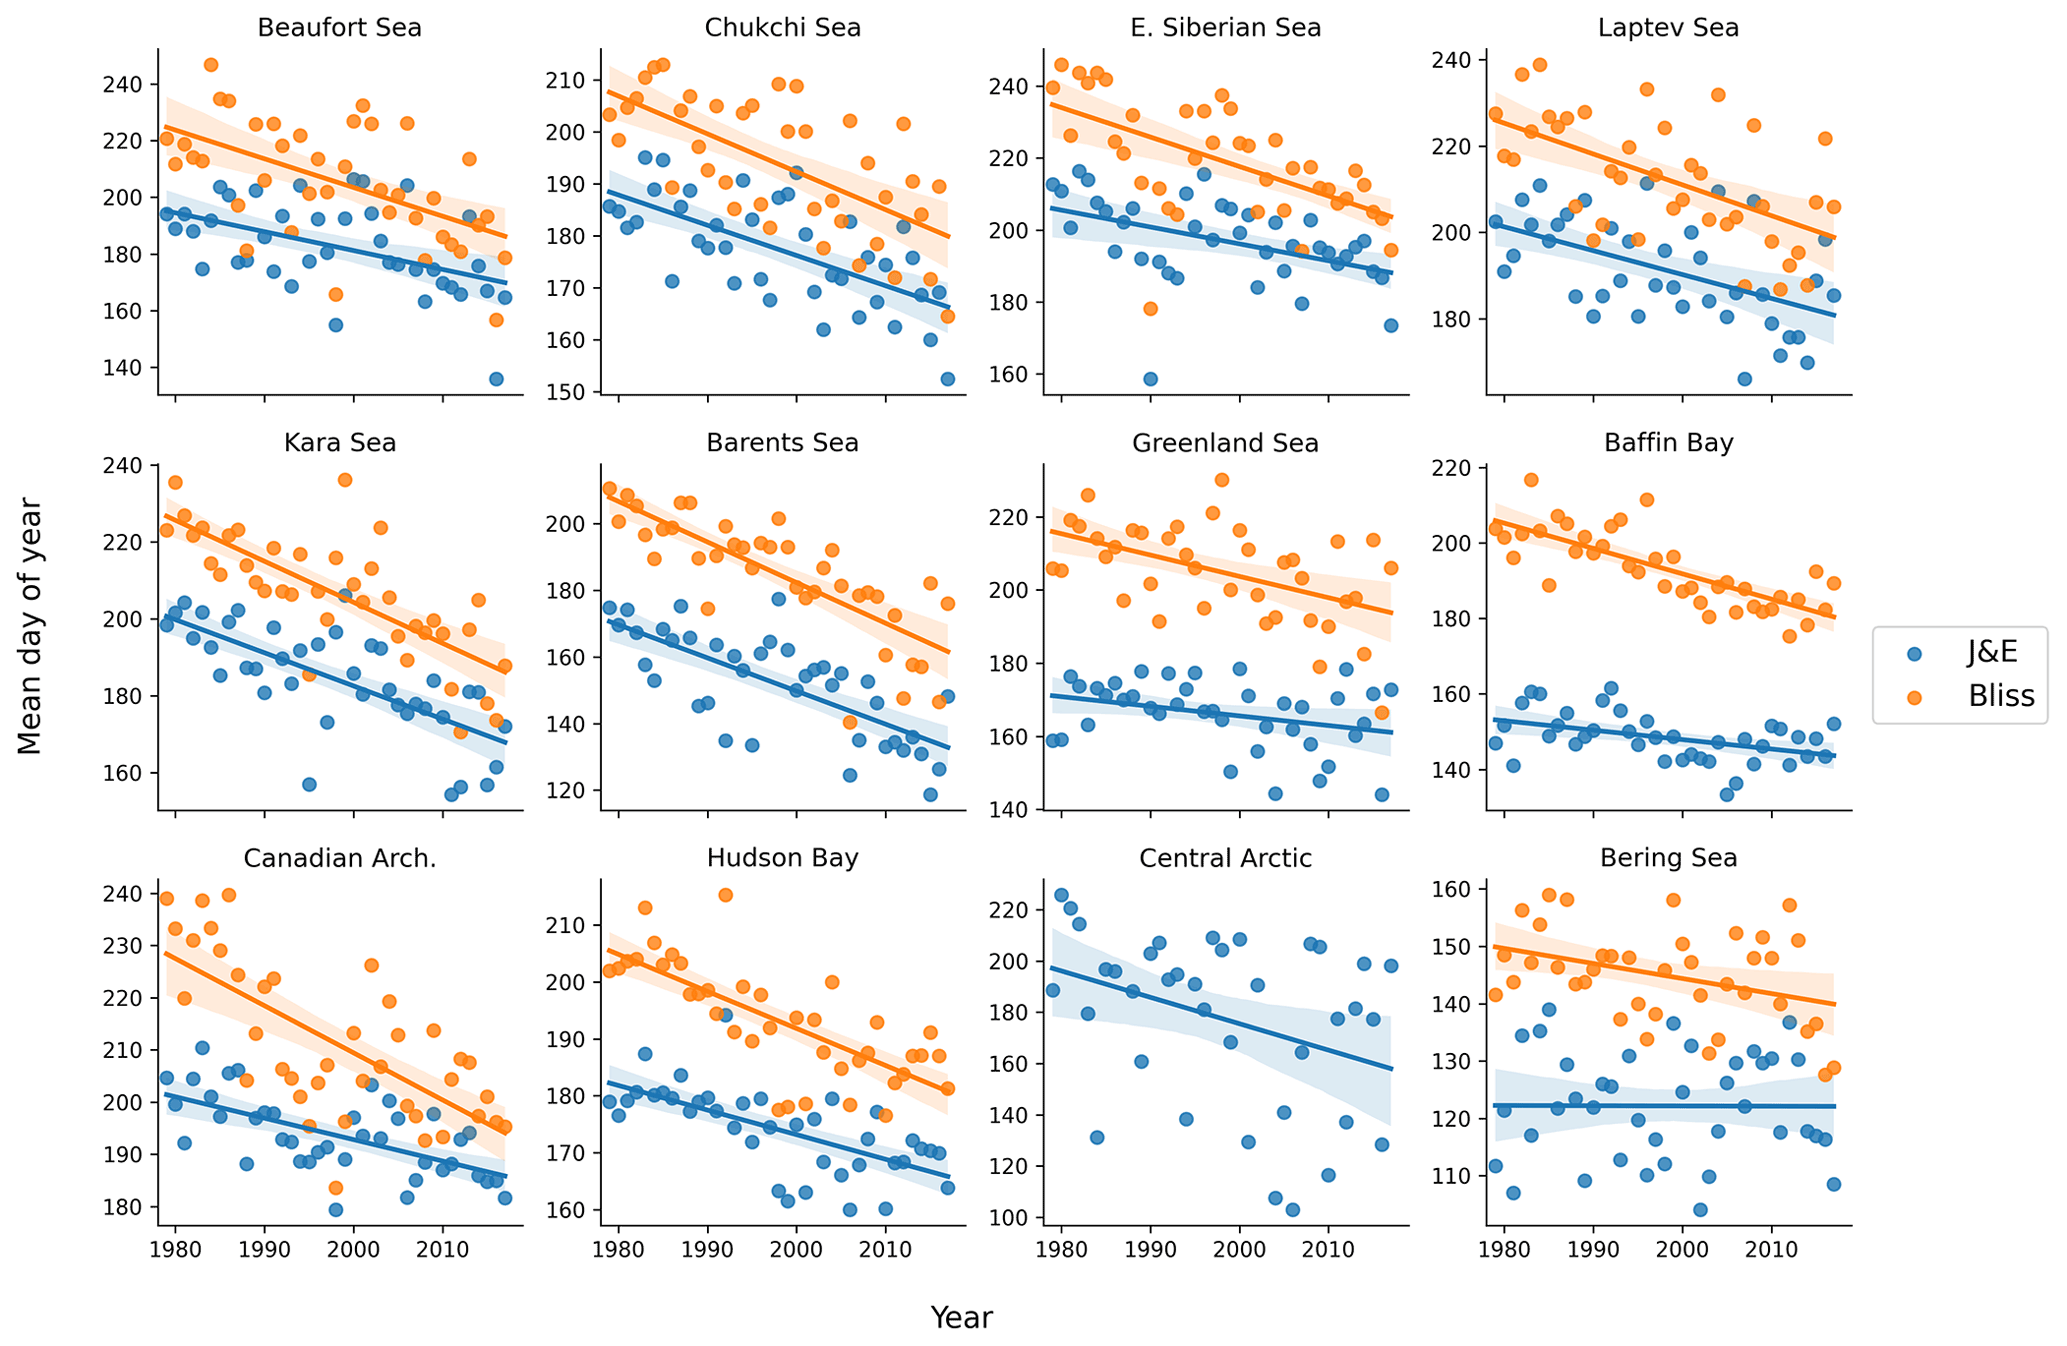
Figure 6Yearly values of J&E's breakup end date (blue symbols) and the Bliss et al. (2019) day of retreat (orange symbols) in the various MASIE regions. Corresponding trend lines are shown in each panel. (For the central Arctic region, the Bliss et al. (2019) “day of retreat” metric is not shown because it was defined for fewer than half the years.) The y-axis labels represent day of the year. Date scales on the y axis vary among panels in order to optimize the display of data points. For numerical values of slopes and significance levels, see Table S2.
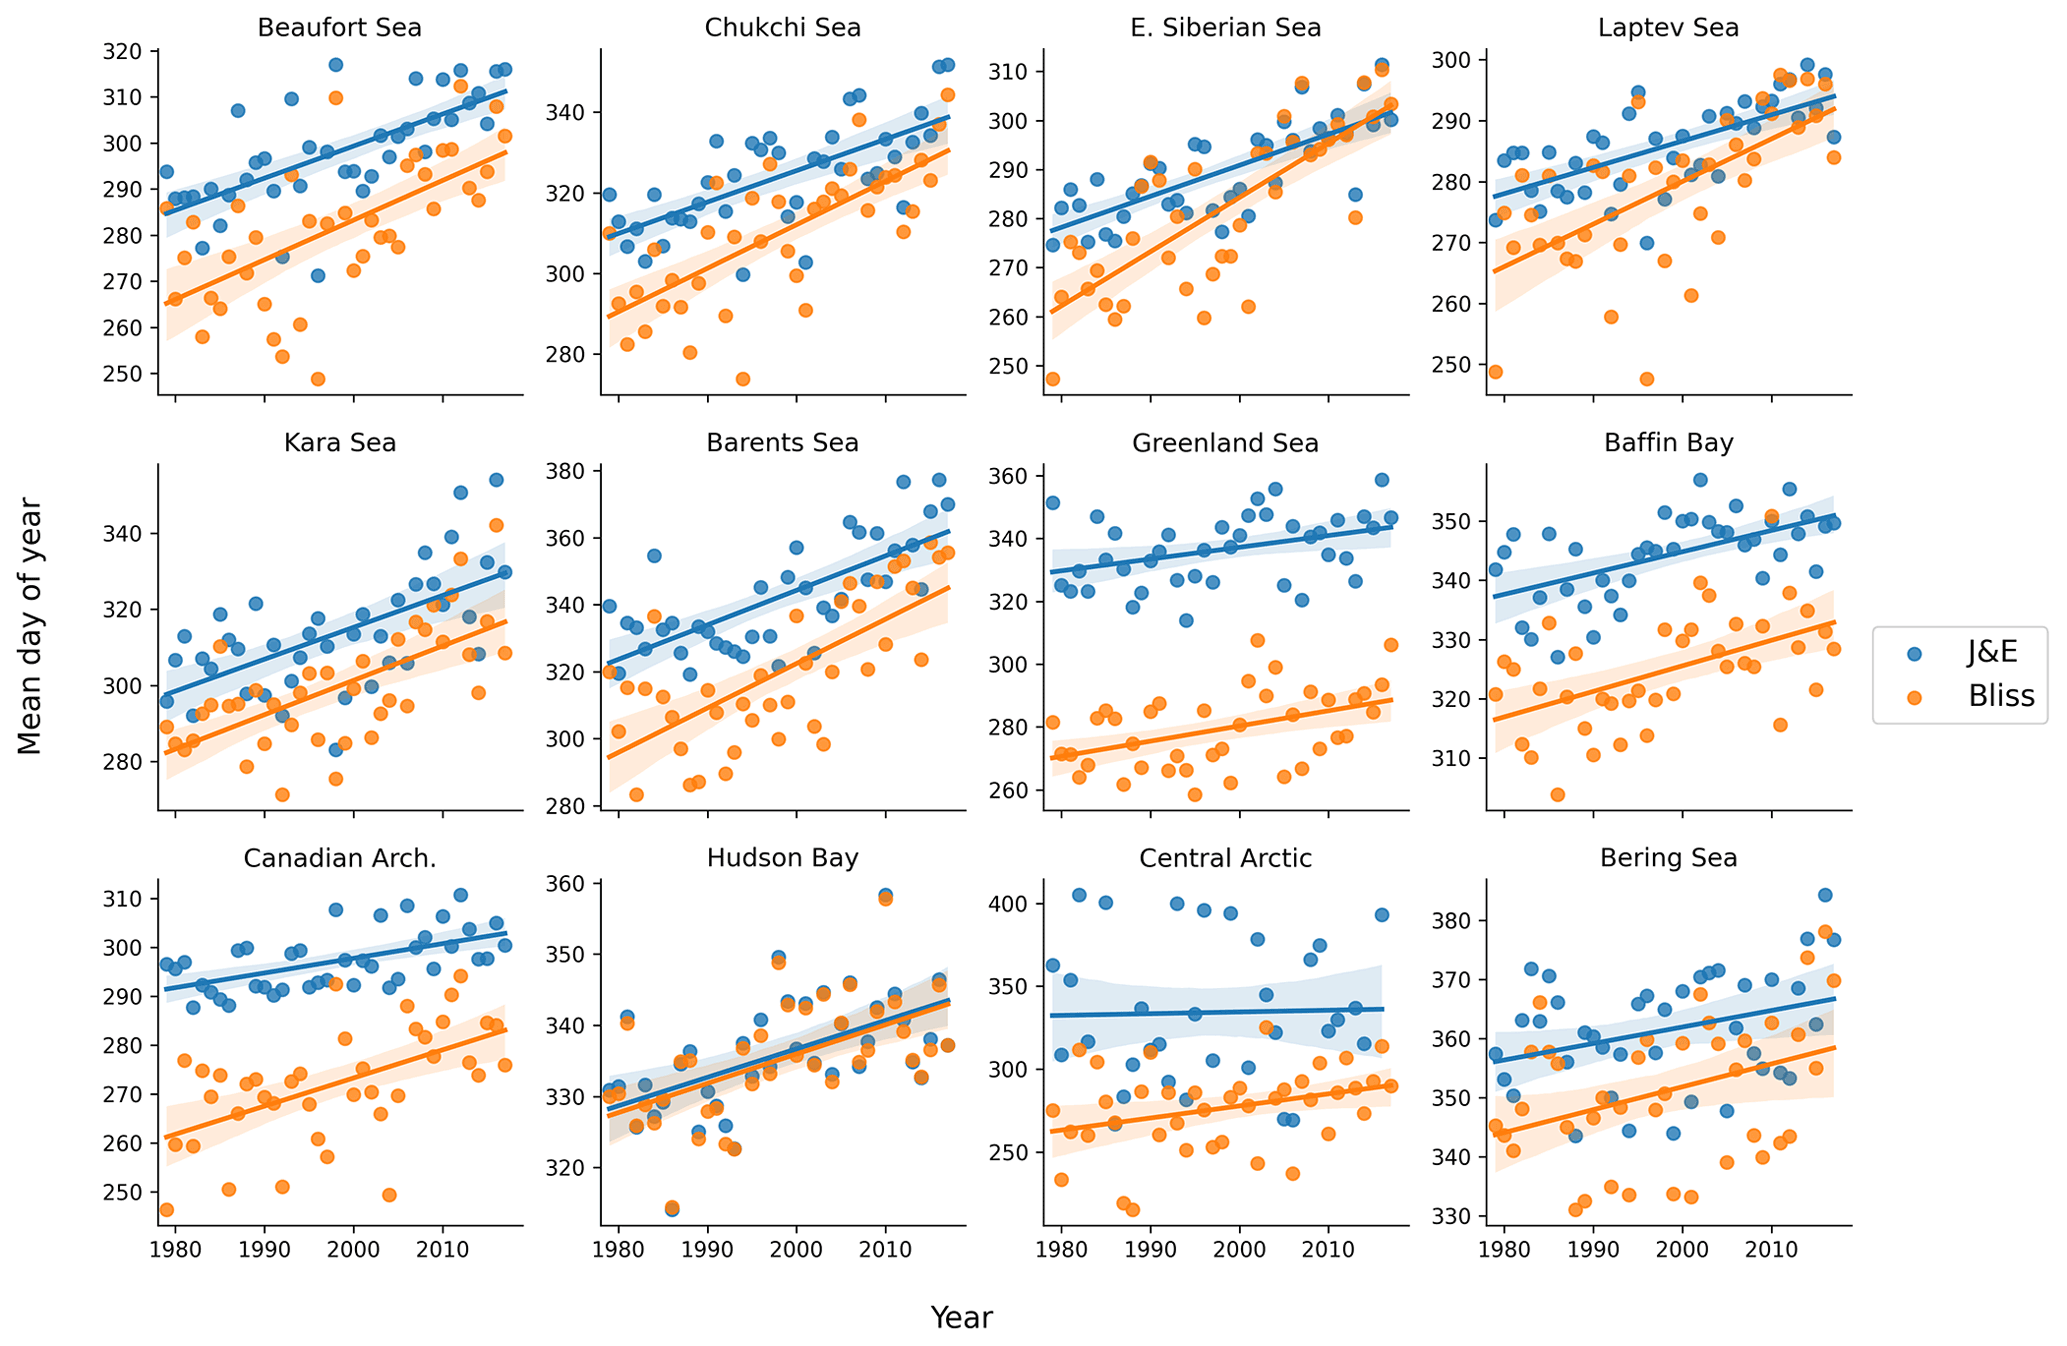
Figure 7Yearly values of J&E's freeze-up end date (blue symbols) and the Bliss et al. (2019) day of closing (orange symbols) in the various MASIE regions. Corresponding trend lines are shown in each panel. The y-axis labels represent day of the year. Date scales on the y axis vary among panels in order to optimize the display of data points. Numerical values of slopes and their significance levels are provided in Table S3.
A final comparison is presented in Fig. 8, which shows the ice season lengths computed using the two sets of metrics. The ice season length is defined as the number of days between the end of freeze-up and the start of breakup. Consistent with J&E's earlier breakup (Fig. 6) and later freeze-up (Fig. 7), the J&E metrics yield a shorter ice season than the Bliss et al. (2019) metrics. The differences in Fig. 8 exceed 1 month in most of the Arctic except for the Bering Sea, Hudson Bay and the Canadian Archipelago. However, the negative trends of ice season length are similar in magnitude according to both sets of metrics over most of the Arctic. The trend maps are not shown here because they add little to the information conveyed in Figs. 6 and 7.
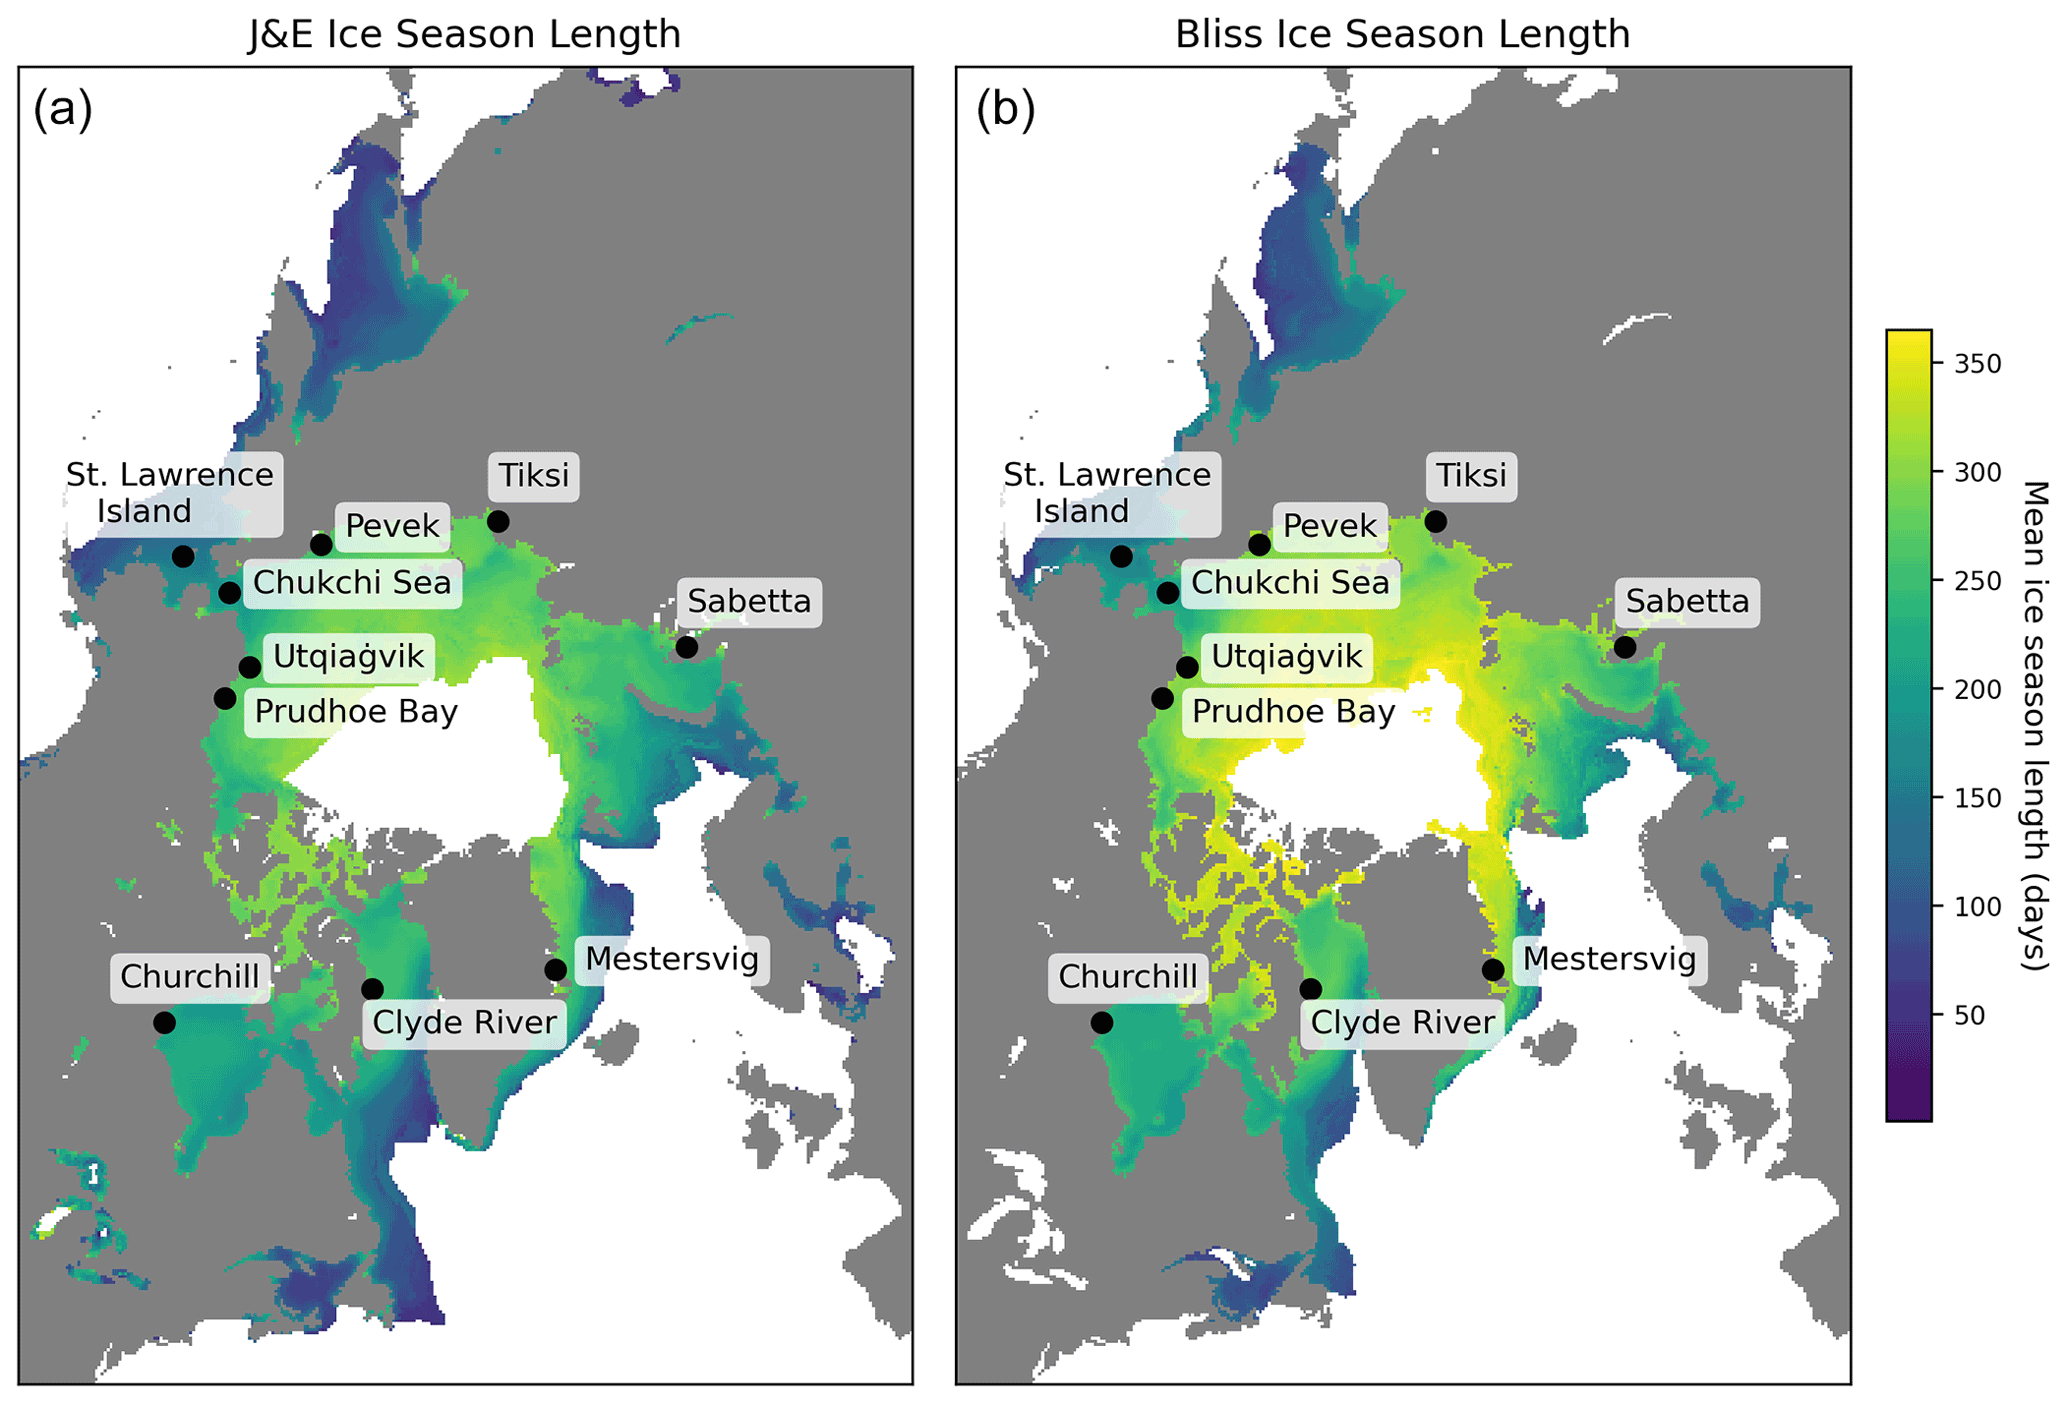
Figure 8Mean ice season length based on the J&E metrics (a) and the Bliss et al. (2019) metrics (b). Metrics of breakup and freeze-up were not defined in a sufficient number of years in the white area near the North Pole.
Given that this study targets the use of local indicators, it is important to assess the relationship between the local indicators and those for the broader MASIE regions containing the coastal locations. An important caveat in such a comparison is that our local indicators were designed for coastal users, not for broader regional application or applications in areas far from shore. This distinction introduces the possibility that the coastal indicators may be less than optimal for the larger MASIE regions. Figures 9–10 provide these comparisons for the breakup metrics defined by the modified J&E algorithms. In all cases, the yearly values (and linear trend lines) for the 10 coastal locations in Table 3 are plotted for the 1979–2018 period, together with the values for the corresponding MASIE regions.
The breakup start dates (Fig. 9) differ between the coastal locations and the broader MASIE regions in most of the 10 cases, and in some cases the trends are notably different. With regard to systematic differences, not only the magnitude but also the sign of the offsets varies among the regions. The breakup start date at the coast is later than for the MASIE regions for Prudhoe (Beaufort Sea), Utqiaġvik (Chukchi Sea), Tiksi (Laptev Sea), and both Canadian locations: Churchill (Hudson Bay) and Clyde River (Baffin Bay). These sites are all Arctic coastal locations at which varying extents of landfast ice are present. By contrast, the coastal locations have earlier breakup start dates (relative to their corresponding MASIE regions) at St. Lawrence Island, Mestersvig (Greenland Sea), and the Bering Strait (Chukchi Sea). The relation of landfast ice to the timing of breakup is discussed further in Sect. 4.
While the general trend towards earlier breakup noted above (Fig. 6) is apparent at most of the coastal locations, the magnitudes of the trends can differ between the coastal sites and the broader MASIE regions. Figure 9 shows that the trend towards an earlier start of breakup is stronger at the coastal location relative to the MASIE region at Churchill, Clyde River, Pevek, and Sabetta. Only at Tiksi is the negative trend weaker at the coastal site. In the other regions the trends are nearly identical.
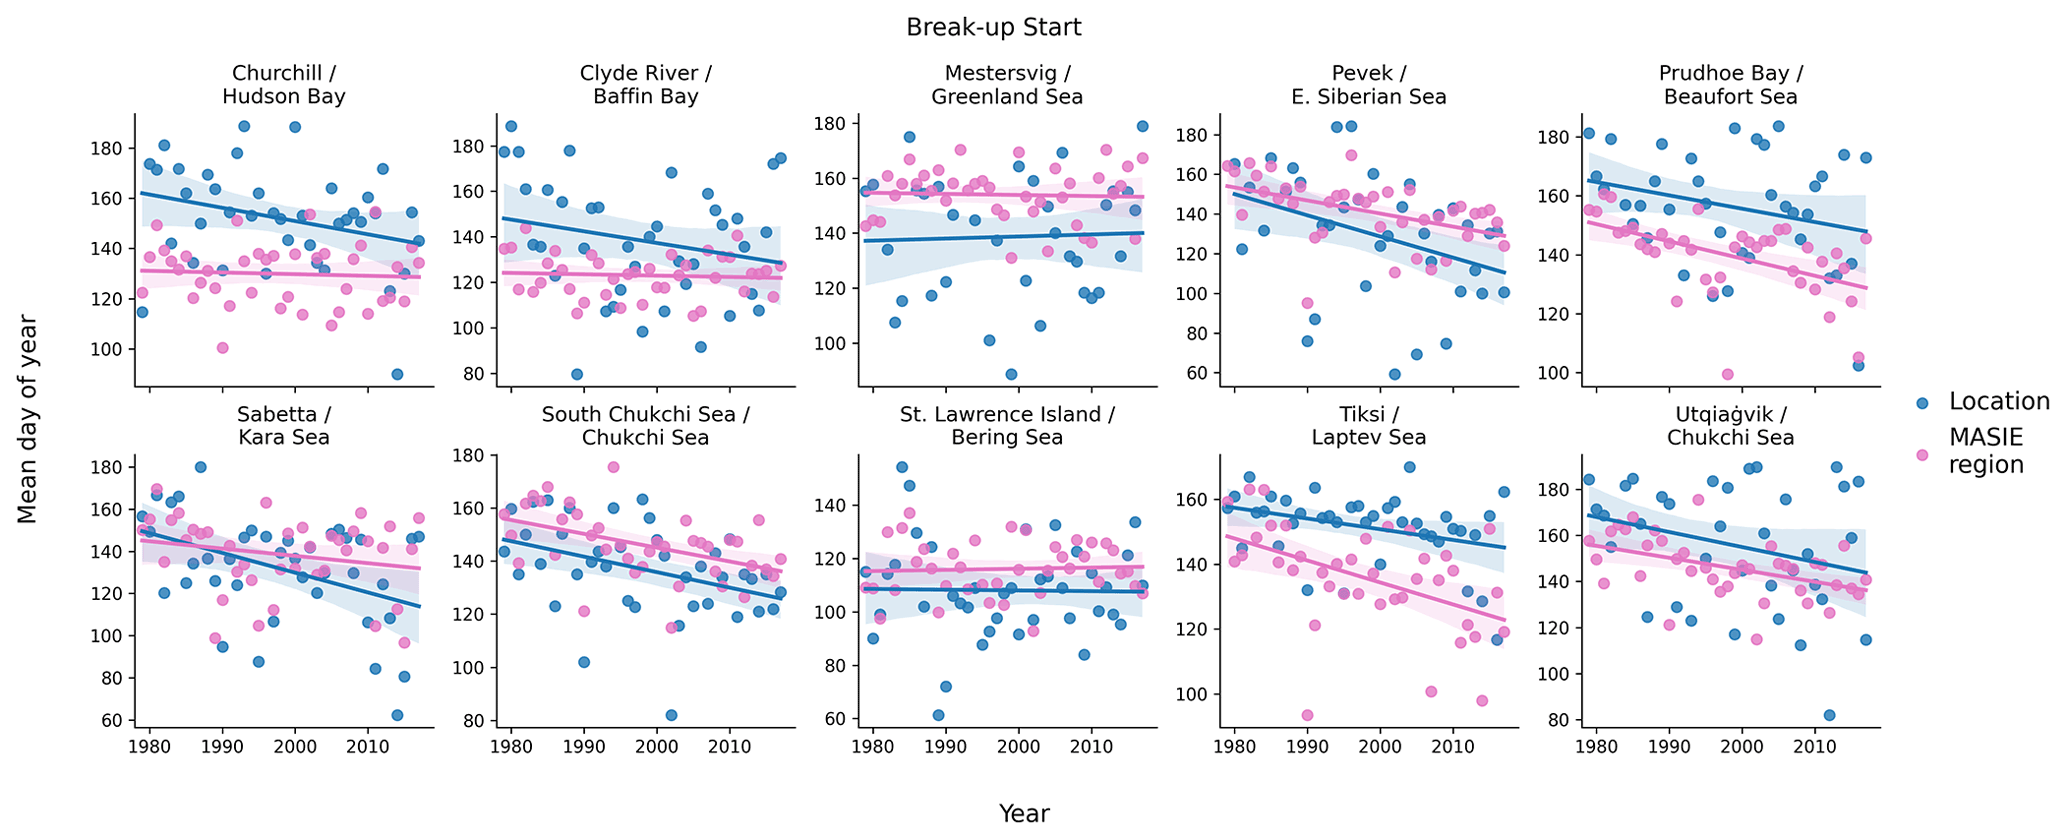
Figure 9Yearly values (1979–2018) of the breakup start dates (shown as day-of-the-year numbers) for the coastal locations (blue) and the corresponding MASIE regions (pink). Date scales on the y axis vary among panels in order to optimize the display of data points. Linear regression lines are shown with the same color coding. In each panel, the upper line of header identifies the coastal location and the lower line identifies the MASIE region. All values are based on the modified J&E algorithms. Slopes and their significance levels are listed in Tables S2 and S3.
The breakup end dates (Fig. 10) show differences similar to those in Fig. 9 in most, but not all, cases. The breakup end date occurs later at Clyde River, Prudhoe, and Utqiaġvik relative to the MASIE regions, as is the case with the results in Fig. 9. However, unlike the breakup start date, the breakup end date also occurs later at Mestersvig than for the Greenland Sea MASIE region. The opposite relationship is found in the Kara Sea/Sabetta and the Chukchi Sea (Bering Strait), where the MASIE region has the earlier breakup end date. The temporal trends in the breakup end dates are generally similar for the coastal locations and the MASIE regions, and there are no differences in sign. All coastal locations and all MASIE regions show negative trends, i.e., trends toward earlier breakup end dates in recent decades.
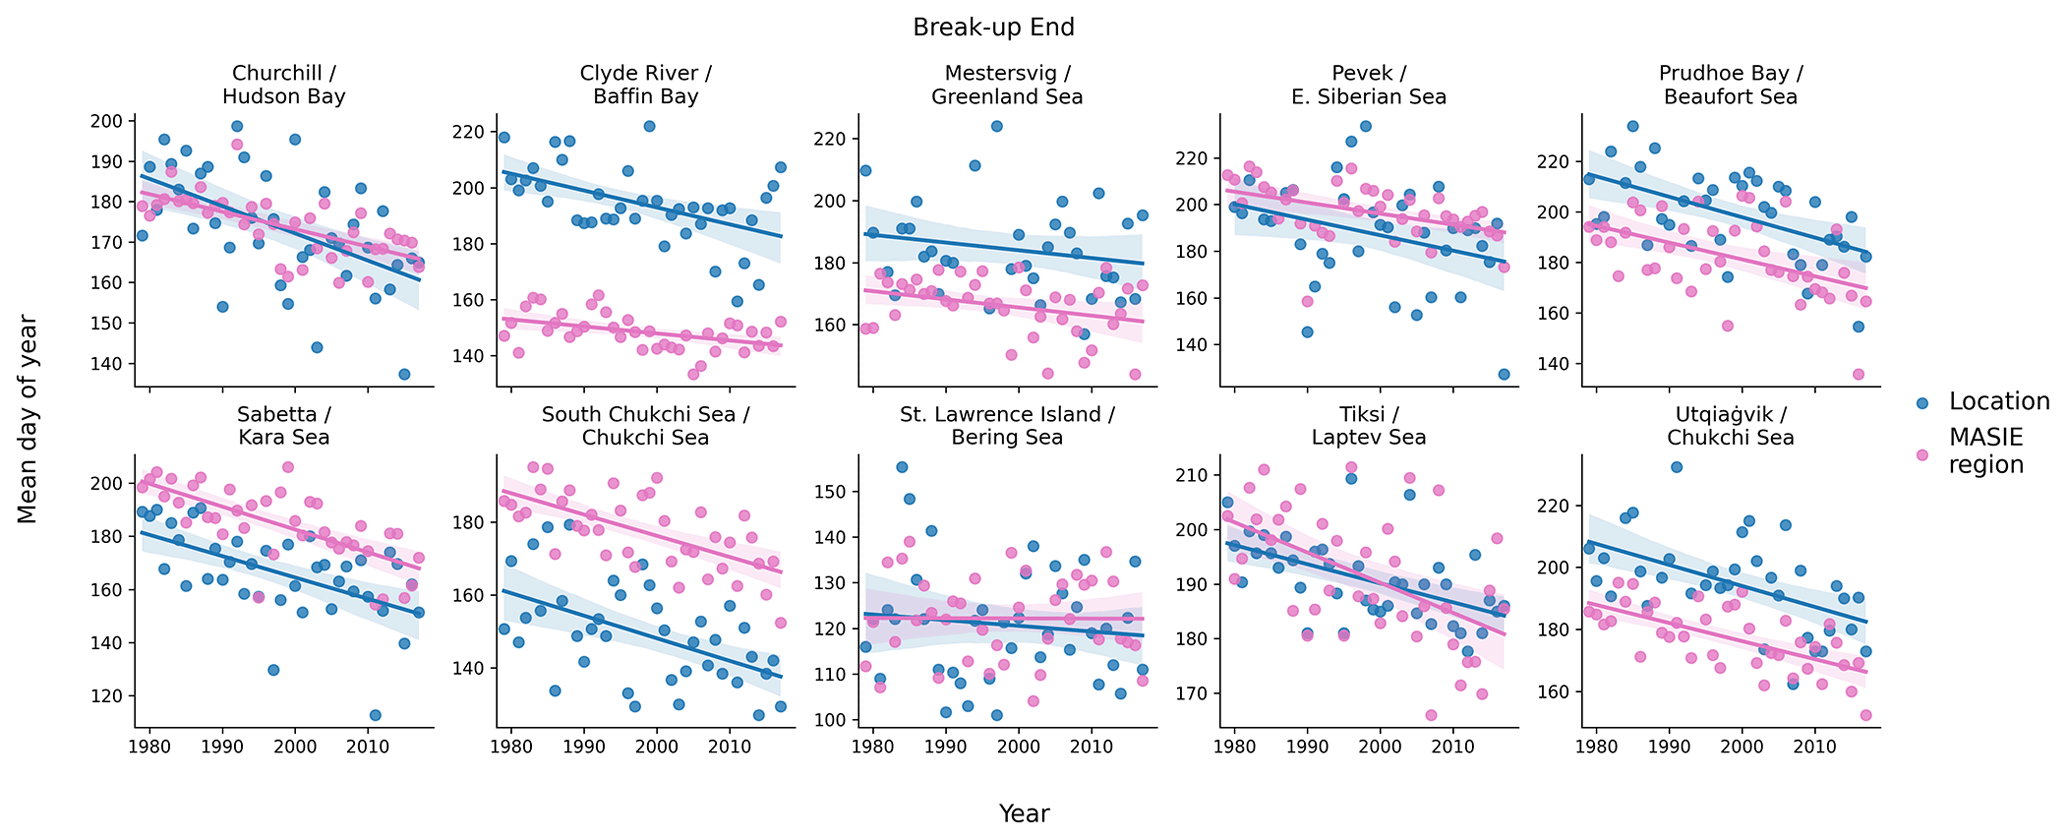
Figure 10Yearly values (1979–2018) of the breakup end dates (shown as day-of-the-year numbers) for the coastal locations (blue) and the corresponding MASIE regions (pink). Date scales on the y axis vary among panels in order to optimize the display of data points. Linear regression lines are shown with the same color coding. In each panel, the upper line of header identifies the coastal location and the lower line identifies the MASIE region. All values are based on the modified J&E algorithms. Slopes and significance levels are listed in Tables S2 and S3.
The freeze-up start dates are compared in Fig. 11. Several regions show large offsets, most notably Clyde River (Baffin Bay) and Mestersvig (Greenland Sea), where the start of freeze-up occurs earlier at the coast by several weeks. Both Baffin Bay and the Greenland Sea are large MASIE regions (Fig. 2), favoring the delay of freeze-up start over a substantial portion of the seasonal sea ice zone within the respective MASIE regions. Freeze-up start dates are also earlier than offshore at several other coastal locations: Churchill, Sabetta, and Utqiaġvik. These are regions in which it is common for ice to form along the coast in autumn, with the ice edge advancing offshore to meet the expanding main ice pack as freeze-up progresses. Figure 12 shows examples of this dual advance of the freeze-up “front” along the coasts of the East Siberian Sea in 2021 and the Beaufort Sea in 2020 and 2021. By contrast, the southern Chukchi Sea location has a later freeze-up date than the Chukchi MASIE region, largely because the southern Chukchi grid cells are located in an area of relatively warm inflowing currents from the Bering Sea and are in the southern portion of the Chukchi MASIE region. As with the breakup end dates, all coastal locations and MASIE regions show trends of the same sign. In this case, the trends are all positive, indicating a later start to freeze-up.
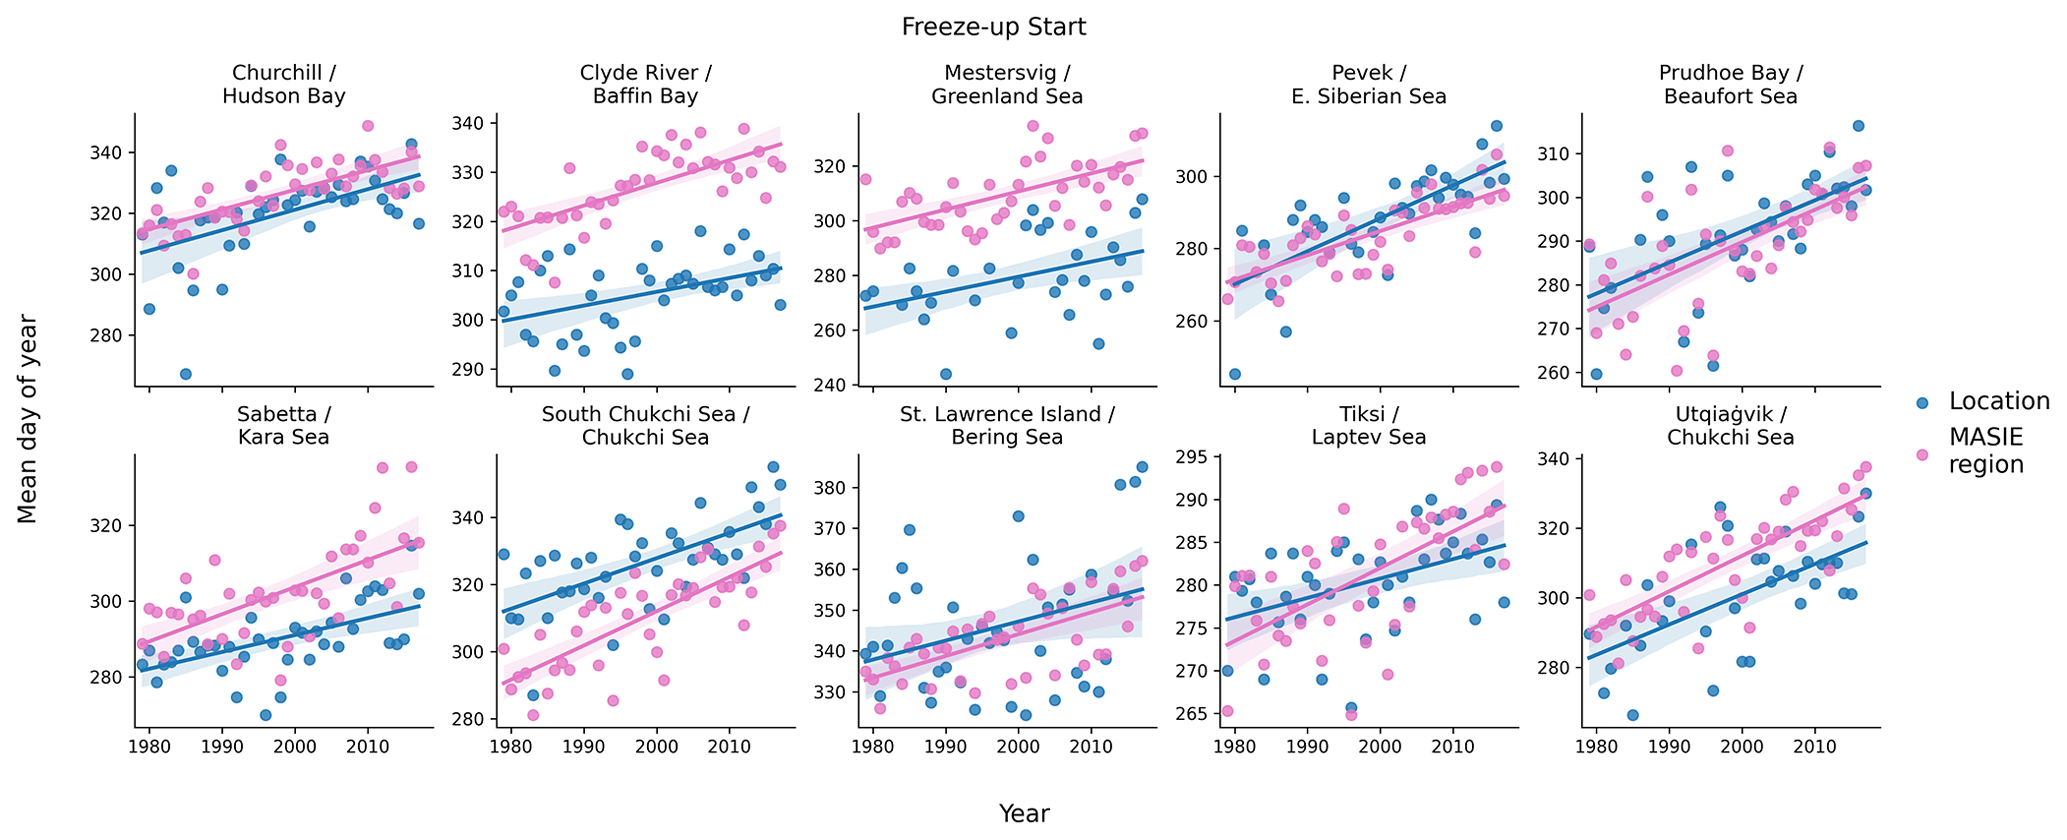
Figure 11Yearly values (1979–2018) of the freeze-up start dates (shown as day-of-the-year numbers) for the coastal locations (blue) and the corresponding MASIE regions (pink). Date scales on the y axis vary among panels in order to optimize the display of data points. Linear regression lines are shown with the same color coding. In each panel, the upper line of header identifies the coastal location and the lower line lists the MASIE region. All values are based on the modified J&E algorithms. See Tables S2 and S3 for slopes and significance levels.

Figure 12Sea ice coverage on 20 October 2021 (left panel) and 20 October 2020 (right panel). As indicated by the legends in the lower right of each panel, red denotes essentially complete ice coverage while gray areas have low concentrations. Source: NWS Alaska Region Sea Ice Desk.
Finally, Fig. 13 compares the freeze-up end dates for the 10 coastal sites and their MASIE regions. The results are quite similar to those for the freeze-up start dates in Fig. 11. Relative to the MASIE regions as a whole, freeze-up ends earlier at both Canadian sites (Churchill and Clyde River), Mestersvig, Sabetta, and Utqiaġvik. Again, the differences are especially large (more than 1 month) at Clyde River and Mestersvig, both of which are in large MASIE regions as noted above. The southern Chukchi Sea and, to a lesser extent in recent decades, Pevek (East Siberian Sea) show later freeze-ups near the coast than for the MASIE region. Once again, all trends are positive, pointing to a later end to freeze-up at coastal as well as offshore regions throughout the Arctic. The changes in the freeze-up dates over the 40-year period are especially large, exceeding 1 month, at Pevek (East Siberian Sea) and Prudhoe (Beaufort Sea). The changes are close to 1 month at Utqiaġvik (Chukchi Sea) and the Southern Chukchi Sea.

Figure 13Yearly values (1979–2018) of the freeze-up dates (shown as day-of-the-year numbers) for the coastal locations (blue) and the corresponding MASIE regions (pink). Date scales on the y axis vary among panels in order to optimize the display of data points. Linear regression lines are shown with the same color coding. In each panel, the upper line of header identifies the coastal location and the lower line identifies the MASIE region. All values are based on the modified J&E algorithms. Slopes and their significance levels are listed in Tables S2 and S3.
In order to synthesize the information provided by the local indicators, we applied a factor analysis to each of the four local indicators described in Sect. 2. For the local indicators, each input matrix was 10 (locations) × 40 (years). For comparison, we also applied the factor analysis to the corresponding regional sea ice areas from the MASIE database (National Snow and Ice Data Center dataset G02135_v3.0-4). Because the Chukchi Sea is the MASIE region for two of the local indicators (Chukchi Sea and Utqiaġvik), the data matrix for the MASIE regional factor analysis contained 9 (regions) × 40 (years) entries. We performed the MASIE factors separately for the middle months of the breakup and freeze-up seasons (June and November, respectively).
In all cases, the first factor contains loadings of the same sign for all locations/regions and is essentially a depiction of the temporal trends, which account for substantial percentages of the variance. The second factor consists of loadings of both signs, corresponding to positive departures from the mean at some locations and negative departures at others. Figure 14 illustrates this behavior for (a) the breakup start dates and (b) the freeze-up end dates. While every one of the 10 locations has a positive loading in Factor 1, the mixed signs of the Factor 2 loadings point to a regional clustering of the dates. For example, Fig. 14a shows that the northern coastal sites in the Pacific hemisphere from 90∘ E eastward to 90∘ W (Prudhoe Bay, Utqiaġvik, Tiksi, Pevek) have a component of breakup start date variability that is out of phase with the locations in the western Atlantic/eastern Canada sector from 90∘ W eastward to 90∘ E (Mestersvig, Churchill, Clyde River).
The interpretation of Factor 1 as a trend mode is supported by Fig. 15, which shows the time series of the scores of Factor 1 for (a) the breakup start date and (b) freeze-up end dates. The trends towards an earlier start of breakup and a later end of freeze-up are clearly evident. Figure 15 also illustrates the tendency for occasional “outlier” years to be followed by a recovery in the following year. These plots and those for the other local indicators show that these extreme excursions and recoveries are superimposed on the strong underlying trends, resulting in new extremes when the sign of an extreme year is the same as the sign of the underlying trend.
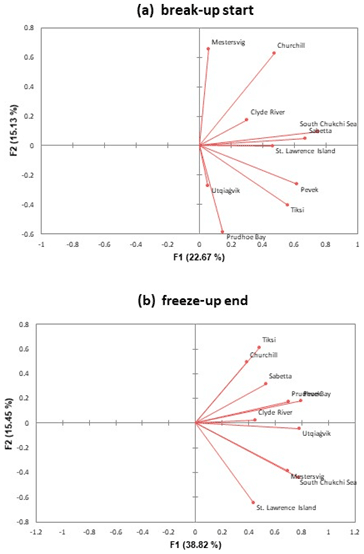
Figure 14Loadings for Factor 1 (x axis) and Factor 2 (y axis) for (a) the start of breakup and (b) the end of freeze-up at the 10 local coastal sites. Labels on vectors denote locations.
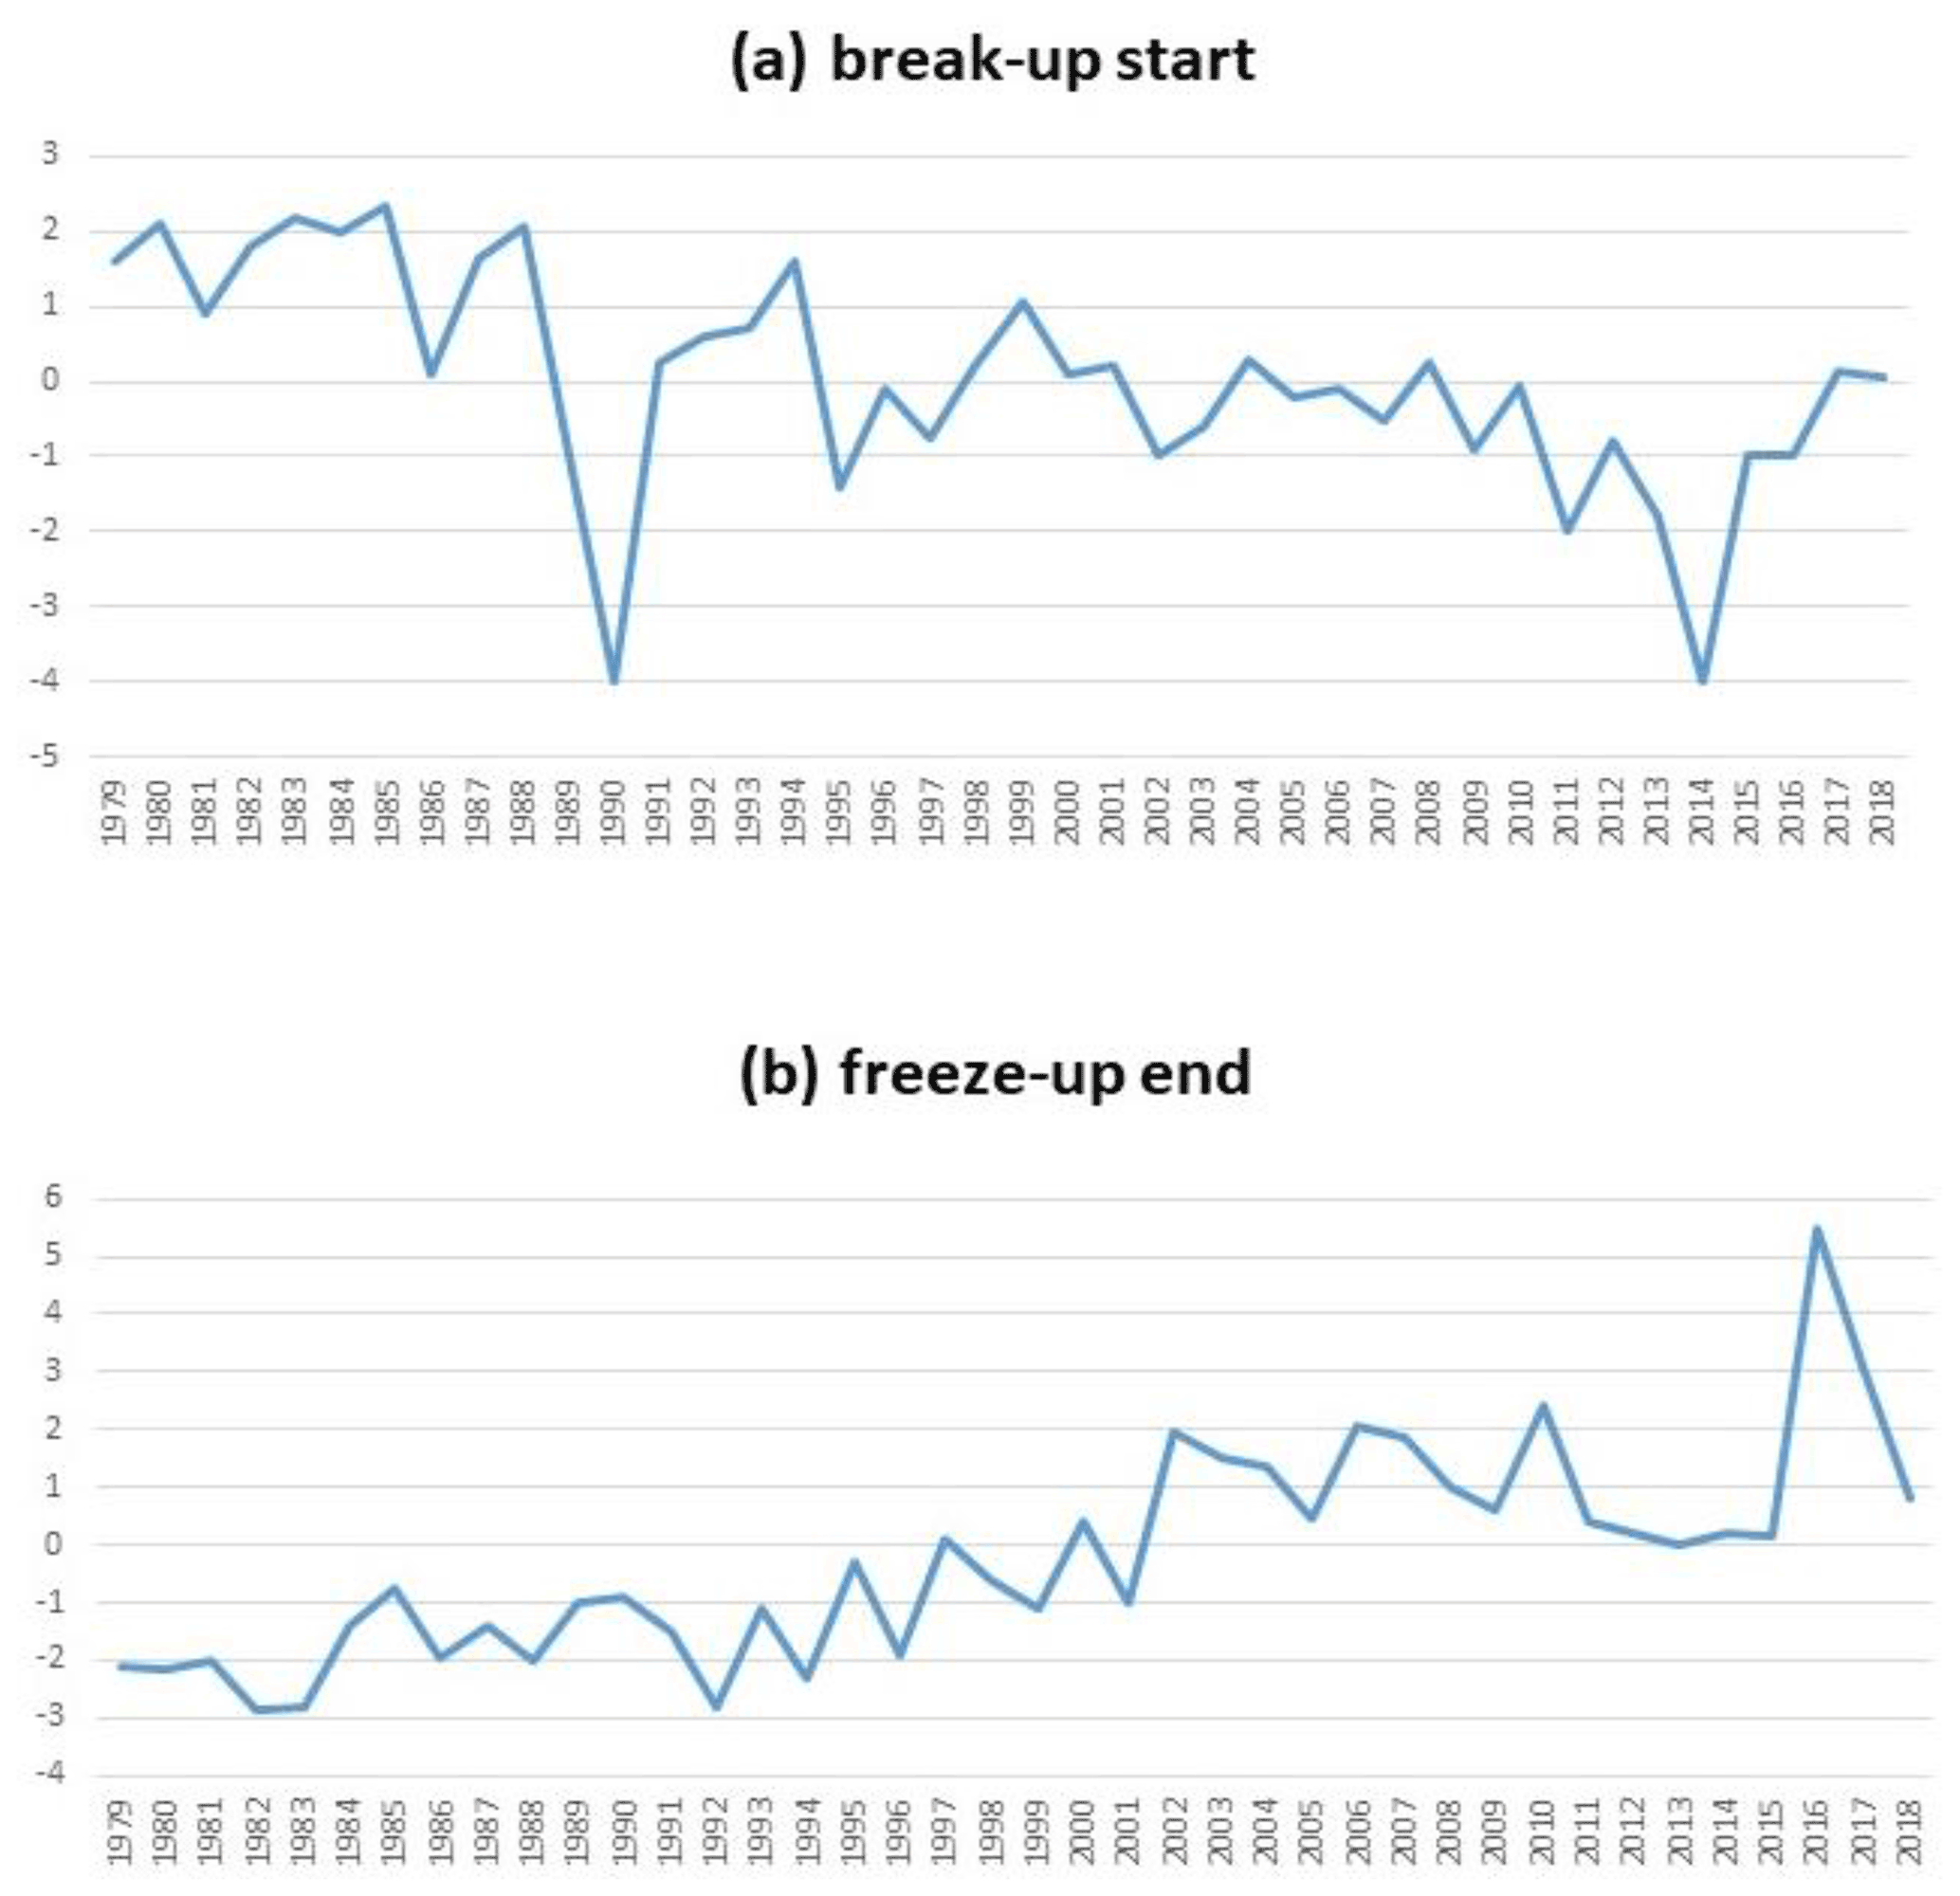
Figure 15Scores (time series) for Factor 1 of (a) the start of breakup and (b) the end of freeze-up at the 10 local coastal sites.
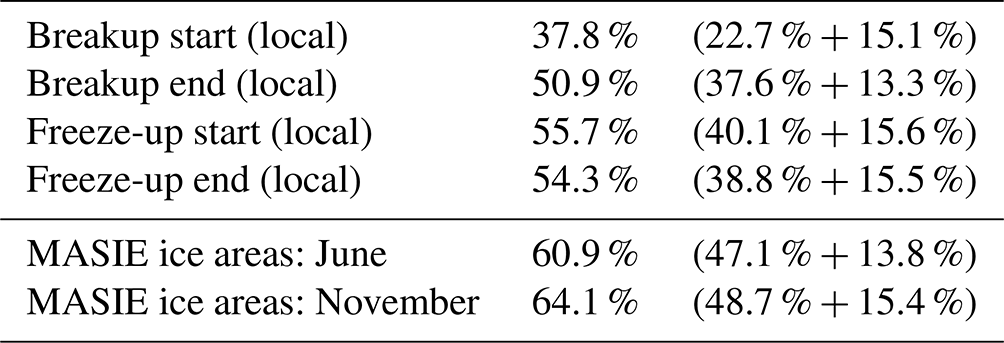
Table 4 shows that the first two factors explained more than half the variance for all local and MASIE indicators except the local breakup start date. The breakup start date is notable for the small percentages of variance explained by the first two factors. The implication is that local conditions play a relatively greater role in the timing of the start of breakup. These local factors can include landfast ice, inflow of water and heat from the adjacent land areas (including rivers), and possibly other effects related to local ocean currents or local weather conditions. The freeze-up start date has the most spatial coherence in the trend mode (55.7 % of the explained variance). However, as shown by the last two lines of Table 4, the MASIE regional ice areas have even greater percentages of variance explained by the first two factors. In both the breakup and freeze-up seasons (June and November), the first two factors explain more than 60 % of the variance (vs. 37.8 %–55.7 % for the local indicators). Because the variance of the ice concentrations in the MASIE regions is generally greater in the southern compared to the northern portion of the region, factors for individual MASIE regions have greater loadings in the south. However, this does not provide an obvious explanation for why the percentage of variance explained by the first factor is greater for the MASIE indicators than for the local indicators. These differences again point to the importance of local conditions relative to the broader underlying trend in ice coverage, as Factor 1 (the trend) accounts for most of the differences between the local and regional results in Table 4.
Table 4Percentages of variance explained by Factors 1 and 2. Numbers in parentheses are the contributions of the individual factors (Factor 1 + Factor 2).
Finally, Fig. 16 illustrates the tendency for tighter clustering in the regional indicators. For both the June and November results, the clustering in Fig. 16 is clearly more distinct than in Fig. 14, which is the corresponding figure for the local indicators. The clustering in Fig. 16 is geographically coherent; e.g., the Pacific sector sites (Bering, Chukchi, East Siberian) are in a distinct cluster for the June (breakup), while subclusters for November include the Hudson and Baffin regions, the Kara and Laptev regions, and the Bering and Chukchi regions. The results imply that underlying trends and spatially coherent patterns of forcing will be more useful in explaining – and ultimately predicting – variations in regional sea ice cover. However, diagnosis and prediction of local indicators will require a greater reliance on additional information such as local geography and local knowledge, including information from residents and other stakeholders who have had experience with breakup and freeze-up of sea ice in the immediate area.

Figure 16Loadings for Factor 1 (x axis) and Factor 2 (y axis) for the MASIE regional ice areas of (a) June and (b) November. Labels on vectors denote MASIE regions.
The results presented in Sect. 3 point to a lengthening of the open-water season as a result of both an earlier breakup and a later freeze-up. The timing of breakup and freeze-up differs between the coastal sites and the broader MASIE regions that are centered farther from shore than the coastal grid cells. These differences can be related to the presence of landfast ice, which characterizes the nearshore coastal waters to varying degrees at most of our coastal sites (Fig. 1).
Landfast ice generally persists longer than pack ice in the adjacent offshore area in spring. This contrast can be explained largely in terms of the stationary nature of the landfast ice cover, with grounded pressure ridges and confinement by coastal barrier islands (e.g., in the Beaufort and Kara seas) locking the ice cover in place. Differences in ice thickness, with offshore sea ice younger and hence thinner in areas of coastal polynyas with winter new-ice formation (e.g., in the Chukchi, Beaufort, and Laptev seas), may also contribute to longer persistence of landfast ice. Finally, with thermal decay of sea ice as a key breakup mode, the absorption of solar shortwave energy in leads and openings in the offshore ice pack promotes thinning and decay of the offshore ice relative to that of the landfast ice. The latter is mostly lacking such areas of open water, rendering lateral melt and ocean-to-ice heat transfer from subsurface ocean heat storage less effective (see also Petrich et al., 2012).
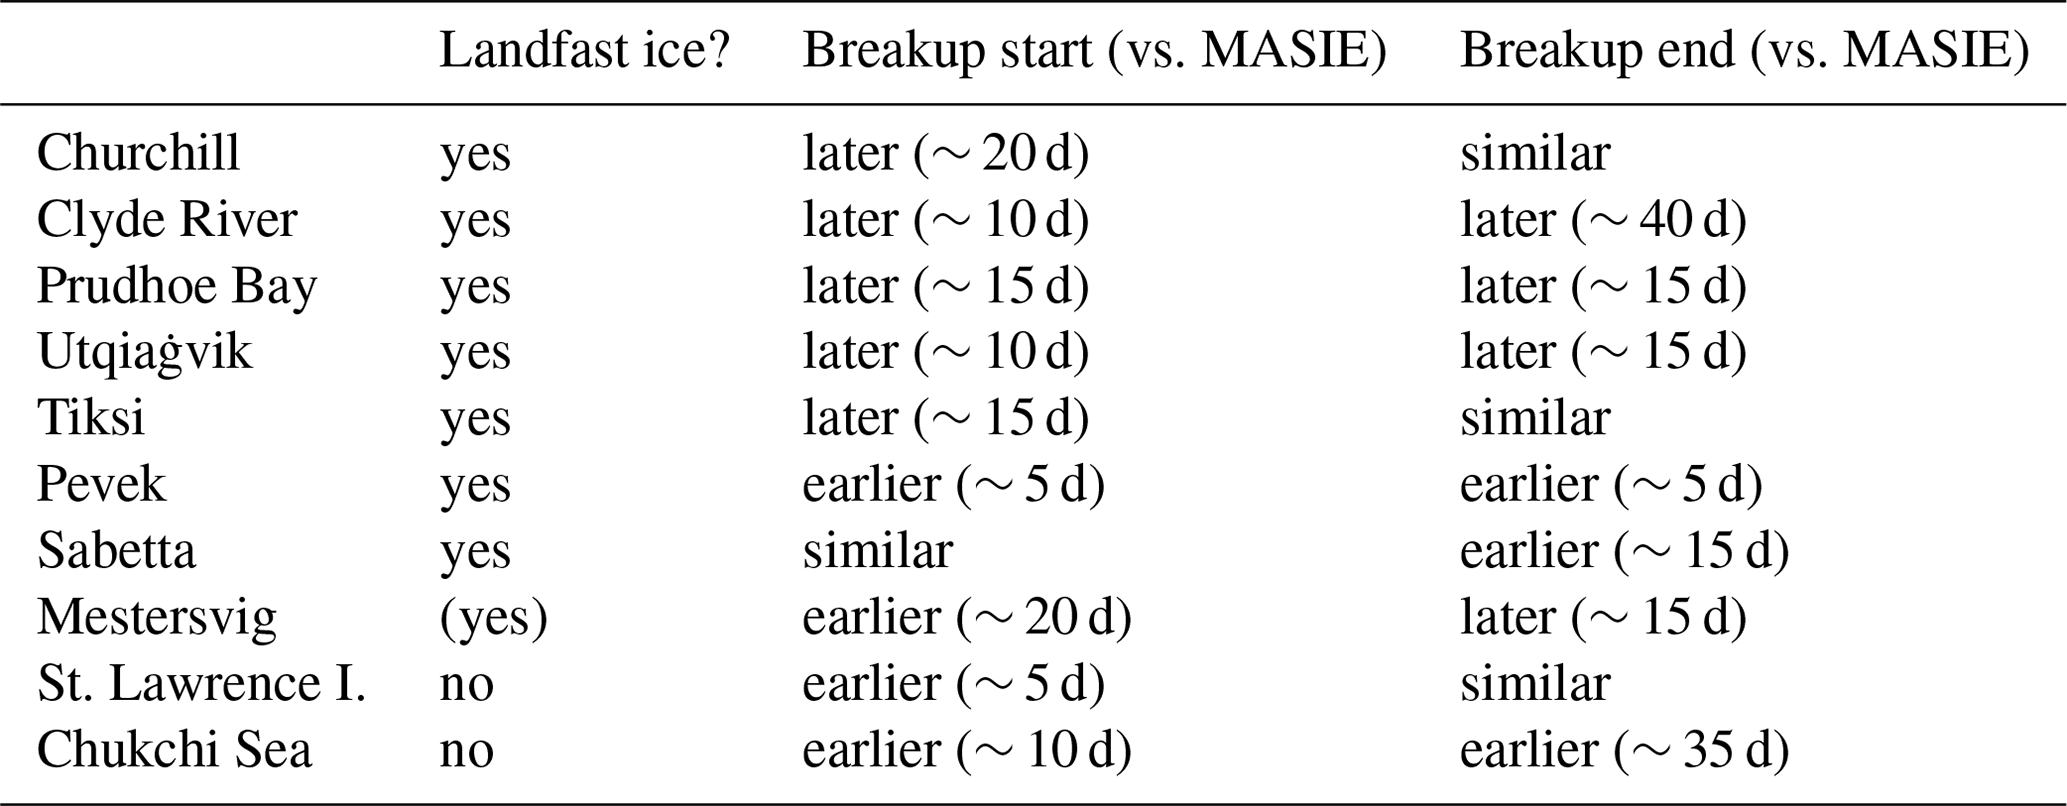
Table 5 summarizes the coastal–MASIE differences in breakup dates by grouping the sites according to the role played by landfast ice. For several sites, the categorization of the landfast ice requires clarification. The Chukchi Sea location is a non-coastal site and therefore clearly beyond the extent of landfast ice (Fig. 1). The St. Lawrence Island grid cells used here are considered to be unaffected by landfast ice because of their location southeast of the island, as described in Sect. 2. The grid cells representing the Mestersvig region are located in the coastal Greenland Sea, just outside of King Oscar Fjord. This region experiences dynamic ice conditions with a comparatively short landfast ice season and a narrower landfast ice belt, with ocean swell and ice pack interaction constraining extent and duration of the landfast ice cover (Wadhams, 1981). For this reason, Mestersvig is listed below the other sites affected by landfast ice in Table 5. With these caveats, it apparent from Table 5 that there is a general tendency for later breakup (both the start and end dates) at locations affected by landfast ice. The delay of the breakup ranges from about 5 to 40 d. Exceptions are Pevek and Sabetta, where local freshwater inflows from streams and snowmelt may contribute to earlier breakups relative to the broader MASIE regions – a hypothesis that should be tested in future research. There is no clear signal of earlier or later coastal breakup at Mestersvig and St. Lawrence Island, where landfast ice is not a major contributor to the timing of breakup. The earlier local breakup at the Chukchi site is primarily a function of its location in the southern portion of the Chukchi MASIE region.
Table 5Summary of landfast ice presence at each coastal site and timing of breakup at the site relative to breakup in corresponding MASIE region (Figs. 10 and 11).
In the autumn, water in the shallow coastal areas cools more rapidly to the freezing point because there is less stored heat below the surface. Coastal waters can also be fresher than offshore waters because of terrestrial runoff that freshens the nearshore areas during the warm season. Under such conditions both a higher freezing point and reduction in convective overturning promote earlier freeze-up. As a result, the autumn freeze-up often proceeds outward from the coast as well as shoreward from the main pack ice (Fig. 12). However, onset of freeze-up – and depending on the geographic setting and offshore ocean and atmosphere conditions potentially also end of freeze-up – does not correspond with onset of landfast ice formation. In the Chukchi and Beaufort seas, the first appearance of landfast ice may lag behind freeze onset by a couple of weeks to 3 months (Mahoney et al., 2014). In more sheltered and less dynamic environments such as the Laptev Sea, inshore landfast ice typically does not form for another couple of weeks after onset of freeze-up and generally takes more than 1 month to extend further offshore (Selyuzhenok et al., 2015). Hence, freeze-up variability and trends reported in this study are seen as largely independent of landfast ice processes.
Conversely, the timing of freeze-up does impact the seasonal evolution of landfast ice. Mahoney et al. (2007) discuss the mean climatology of annual landfast ice from 1996–2004, including analyses of the maximum, minimum, and mean extents. Notable for the results presented in the present study is the Mahoney et al. (2007) finding of a reduced presence of landfast ice in the Beaufort–Chukchi region, due to later formation and earlier breakup. In a follow-up study, Mahoney et al. (2014) addressed the geographical variability of breakup and freeze-up, especially as it relates to landfast ice. Their results show that landfast ice in the central and western Beaufort Sea forms earlier, breaks up later, occupies deeper water, and extends further from shore than that in the Chukchi Sea. These differences are partially due to the orientation of the coastline relative to the prevailing easterly winds, which can more readily advect ice away from the southwest–northeast-oriented coastline of the Chukchi Sea. Hosekova et al. (2021) examined landfast ice along the northern Alaska coast in the context of the buffering of the coastline from wave activity. They found that the wave attenuation by landfast ice was weaker in autumn than in spring because of the lower ice thickness in autumn compared to spring. However, the importance of waves for breakup is somewhat limited because large waves typically requires large fetch, which does not develop until later in the summer and fall, well past the end of breakup season.
Yu et al. (2014) showed that landfast ice has large interannual variations, which imply large variations in breakup and freeze-up. Superimposed on these variations were notable trends in landfast ice during the Yu et al. (2014) study period (1976–2007). More specifically, the duration of landfast ice was found to have shortened in the Chukchi, East Siberian, and Laptev seas, primarily as a result of a slower offshore expansion of landfast ice during the autumn and early winter since 1990. Our coastal sites in these sectors (Utqiaġvik, Pevek, and Tiksi) show notable trends toward earlier breakup and later freeze-up, consistent with the Yu et al. (2014) trends in landfast ice.
Cooley et al. (2020) examined the sensitivity of landfast ice breakup at the community level in the Canadian Arctic and western Greenland to temperature variations and trends based on analysis of visible satellite imagery. Our analysis provides a longer reference period (40 years vs. 19 years) and a broader geographical context for the work by Cooley and collaborators. Cooley et al. (2020) also used the relationships between air temperature and landfast ice breakup date, together with projected changes in air temperature from a set of eight CMIP5 global climate models, to project future changes in the breakup dates. Specifically, we note that the trends projected for the remainder of the century in Cooley et al. (2020) are in many instances less pronounced (in days per decadeshift in breakup) than those identified here. For example, for Clyde River, Cooley et al. (2020) project a shift in breakup to an earlier date by 23 d by the year 2099 as compared to changes of a similar magnitude but over a much shorter time period examined here (Figs. 9 and 10). For Clyde River, the comparison between trends in the local breakup timing compared to that for the broader region (Baffin Bay) also reveals that the regional trends are much less pronounced than those at the local scale (Figs. 9 and 10). Furthermore, the two westernmost communities examined by Cooley et al. (2020), Tuktoyaktuk and Paulatuk (eastern Beaufort Sea), were projected to see earlier landfast ice breakup onset by 5 and 11 d, respectively, by 2099. The data compiled here for Prudhoe Bay and the Beaufort Sea indicate a substantially larger shift towards earlier dates by more than 5 d per decade (Figs. 9 and 10).
One other study that addressed future changes in sea ice duration in the Pacific sector of the Arctic consists of evaluation mid-21st-century projections by Wang et al. (2018) based on sea ice concentrations simulated by seven CMIP5 global climate models. However, the Wang et al. (2018) evaluations were for the broader offshore areas of the East Siberian, Chukchi, and Beaufort seas rather than for immediate coastal areas, as global climate models generally do not include landfast ice. Pan-Arctic models that simulated landfast ice parameterized thermodynamically without addressing its mobility had significant problems in forecasting coastal ice thickness, especially during freeze-up in September and October (Johnson et al., 2012). The projected increases in ice-free season length over the 2015–2044 period were found to vary from about 20 d in the Bering Strait region to up to 60 d in the offshore areas of the East Siberian, Chukchi, and Beaufort seas. While these changes are for offshore areas, they are larger than those projected for coastal areas by the late century in the study of Cooley et al. (2020).
The primary objective of this study was to use the locally based metrics to construct indicators of breakup and freeze-up at near-coastal locations in which sea ice has high stakeholder relevance. A set of 10 coastal locations distributed around the Arctic were selected for this purpose. The sea ice indicators used here are based on local ice climatologies informed by community ice use (Johnson and Eicken, 2016; Eicken et al., 2014) rather than prescribed “universal” thresholds of ice concentration (e.g., 15 %, 80 %) used in other recent studies of sea ice breakup and freeze-up.
The trends and interannual variations in the local indicators of breakup and freeze-up at the 10 nearshore sites are similar to the trends and variations in corresponding indicators for broader offshore regions, but the site-specific indicators often differ from the regional indicators by several days to several weeks. Relative to indicators for broader adjacent seas, the coastal indicators show later breakup at sites known to have extensive landfast ice, whose breakup typically lags behind retreat of the adjacent, thinner drifting ice. The coastal indicators also show an earlier freeze-up at some sites in comparison with freeze-up for broader offshore regions, likely tied to earlier freezing of shallow-water regions and areas affected by freshwater input from nearby streams and rivers. However, the trends towards earlier breakup and later freeze-up are unmistakable over the post-1979 period at nearly all the coastal sites and their corresponding regional seas.
The coastal indicators of the seasonal ice cycle for this study are based on Alaskan ice users. However, ice uses and ice hazards in this region, as reflected in the definition of key seasonal indicators, align with those of other coastal regions in the Arctic. Specifically, the commonalities between coastal populations using the sea ice cover (both drifting and landfast) as a platform for a range of activities and to whom sea ice poses a hazard for boating and marine vessel traffic justify the approach taken in this study to extrapolate from the Alaskan Arctic (with a range of ice conditions representative of the broader Arctic) to the pan-Arctic scale.
The differences between the coastal and offshore regional indicators matter greatly to local users whose harvesting of coastal resources and whose Indigenous culture are closely tied to the timing of key events in the seasonal ice cycle (Huntington et al., 2021; Eicken et al., 2014). These differences also matter from the perspective of maritime activities, where access to coastal locations for destinational traffic is a key factor (Brigham, 2017). These offsets vary considerably by region. In light of these findings, we view locally as well as regionally defined measures of sea ice breakup and freeze-up as a key set of indicators linking pan-Arctic or global indicators such as sea ice extent or volume to local and regional uses of sea ice, with the potential to inform community-scale adaptation and response.
The daily grids of passive-microwave-derived sea ice concentrations are available from the National Snow and Ice Data Center as dataset NSIDC-0051, available at https://nsidc.org/data/nsidc-0051 (last access: 21 October 2022) (DOI: https://doi.org/10.5067/MPYG15WAA4WX, DiGirolamo et al., 2022). Lists of the indicator dates for the coastal sites and the MASIE regions are available from the authors on request.
The supplement related to this article is available online at: https://doi.org/10.5194/tc-16-4617-2022-supplement.
JEW served as the principal investigator for the study, led the drafting of the paper, and performed the factor analysis described in Sect. 3. HE supervised the implementation of the revised indicators for the coastal sites and the MASIE regions and drafted parts of the text. KR performed the indicator calculations, produced Figs. 1–11, and assisted in the preparation of the paper. MJ designed the original indicators, participated in the modification of the indicators, and contributed to the revision of the paper.
The contact author has declared that none of the authors has any competing interests.
Publisher's note: Copernicus Publications remains neutral with regard to jurisdictional claims in published maps and institutional affiliations.
This work was supported by the Climate Program Office of the National Oceanic and Atmospheric Administration through grant NA17OAR431060. Additional funding was provided by the Interdisciplinary Research for Arctic Coastal Environments (InteRFACE) project through the U.S. Department of Energy, Office of Science, Biological and Environmental Research RGMA program. We thank the two reviewers for their constructive comments and careful reading of the paper.
This research has been supported by the National Oceanic and Atmospheric Administration (grant no. NA17OAR431060) and the Department of Energy (grant no. 89233218CNA000001).
This paper was edited by Stephen Howell and reviewed by two anonymous referees.
AMAP: Snow, water, ice and permafrost in the Arctic (SWIPA) 2017, Arctic Monitoring and Assessment Programme (AMAP), Oslo, Norway, xiv + 269 pp., https://www.amap.no/documents/download/2987/inline (last access: 21 October 2022), 2017.
AMAP: Adaptation Actions for a Changing Arctic: Perspectives from the Baffin Bay/Davis Strait Region, Arctic Monitoring and Assessment Programme (AMAP), Oslo, Norway. xvi + 354 pp., https://oaarchive.arctic-council.org/handle/11374/2166, (last access: 18 October 2022), 2018.
Bliss, A. C. and Anderson, M. R.: Arctic sea ice melt onset and timing from passive microwave- and surface air temperature-based methods, J. Geophys. Res., 123, 9063–9080, https://doi.org/10.1029/2018JD028676, 2018.
Bliss, A. C., Steele, M., Peng, G., Meier, W. M., and Dickinson, S.: Regional variability of Arctic sea ice seasonal climate change indicators from a passive microwave climate data record, Environ. Res. Lett., 14, 045003, https://doi.org/10.1088/1748-9326/aafb84, 2019.
Box, J. E., Colgan, W. T., Christensen, T .R., Schmidt, N. M., Lund, M., Parmentier, F.-J. W., Brown, R., Bhatt, U. S., Euskirchem, E. S., Romanovsky, V. E., Walsh, J. E., Overland, J. E., Wang, M., Corell, R. W., Meier, W. N., Wouters, B., Mernild, S., Mård, J., Pawlak, J., and Olsen, M. S.: Key indicators of Arctic climate change: 1971–2017, Environ. Res. Lett., 14, 045010, https://doi.org/10.1088/1748-9326/aafc1b, 2019.
Brigham, L. W.: The changing maritime Arctic and new marine operations, in: Governance of Arctic shipping, edited by: Beckman, R. C., Henriksen, T., Dalaker Kraabel, K., Molenaar, E. J., and Roach, J. A., Brill Nijhoff, 1–23, https://brill.com/view/book/edcoll/9789004339385/B9789004339385_002.xml (last access: 21 October 2022), 2017.
Cavalieri, D. J., Gloersen, P., and Campbell, W. J.: Determination of sea ice parameters with the NIMBUS-7 SMMR, J. Geophys. Res., 89, 5355–5369, https://doi.org/10.1029/JD089iD04p05355, 1984.
Cooley, S. W., Ryan, J. C., Smith, L. C., Horvat, C., Pearson, B., Dale, B., and Lynch, A. H.: Coldest Canadian Arctic communities face greatest reductions in shorefast sea ice, Nat. Clim. Change, 10, 533–538, https://doi.org/10.1038/s41558-020-0757-5, 2020.
Dammann, D. O., Eicken, H., Mahoney, A. R., Meyer, F. J., and Betcher, S.: Assessing sea ice trafficability in a changing Arctic, Arctic, 71, 59–75, https://doi.org/10.14430/arctic4701, 2018.
Deser, C., Walsh, J. E., and Timlin, M. S.: Arctic sea ice variability in the context of recent atmospheric circulation trends, J. Climate, 13, 617–633, https://doi.org/10.1175/1520-0442(2000)013<0617:ASIVIT>2.0.CO;2, 2000.
DiGirolamo, N., Parkinson, C. L., Cavalieri, D. J., Gloersen, P., and Zwally, H. J.: Sea Ice Concentrations from Nimbus-7 SMMR and DMSP SSM/I-SSMIS Passive Microwave Data, Version 2 (NSIDC-0051), NASA National Snow and Ice Data Center Distributed Active Archive Center, Boulder, Colorado USA [data set], https://doi.org/10.5067/MPYG15WAA4WX, 2022.
Druckenmiller, M. L., Moon, T. A., Thoman, R. L., et al.: The Arctic, B. Am. Meteorol. Soc., 102, S263–S316, https://doi.org/10.1175/BAMS-D-21-0086.1, 2021.
Eicken, H., Kaufman, M., Krupnik, I., Pulsifer, P., Apangalook, L., Apangalook, P., Weyapuk Jr., W., and Leavitt, J.: A framework and database for community sea ice observations in a changing Arctic: An Alaskan prototype for multiple users, Polar Geogr., 37, 5–27, ttp://dx.doi.org/10.1080/1088937X.2013.873090, 2014.
Fang, A. and Wallace, J. M.: Arctic sea ice variability on a timescale of weeks in relation to atmospheric forcing, J. Climate, 7, 1897–1914, https://doi.org/10.1175/1520-0442(1994)007<1897:ASIVOA>2.0.CO;2, 1994.
Fu, D., Liu, B., Qi, Y., Yu, G., Huang, H., and Qu, L.: Multiscale variations in Arctic sea ice motion and links to atmospheric and oceanic conditions, The Cryosphere, 15, 3797–3811, https://doi.org/10.5194/tc-15-3797-2021, 2021.
Hosekova, L., Eidam, E., Panteleev, G., Rainville, L., Rogers, W. E., and Thomson, J.: Landfast ice and coastal wave exposure in northern Alaska, Geophys. Res. Lett., 48, e2021GL095103, https://doi.org/10.1029/2021GL095103, 2021.
Huntington, H. P., Raymond-Yakoubian, J., Noongwook, G., Naylor, N., Harris, C., Harcharek, Q., and Adams, B.: “We never get stuck”: A collaborative analysis of change and coastal community subsistence practices in the northern Bering and Chukchi Seas, Alaska, Arctic, 74, 113–126, 2021.
IPCC: Climate Change 2021: The Physical Science Basis. Contribution of Working Group I to the Sixth Assessment Report of the Intergovernmental Panel on Climate Change, edited by: Masson-Delmotte, V., Zhai, P., Pirani, A., Connors, S. L., Péan, C., Berger, S., Caud, N., Chen, Y., Goldfarb, L., Gomis, M. I., Huang, M., Leitzell, K., Lonnoy, E., Matthews, J. B. R., Maycock, T. K., Waterfield, T., Yelekçi, O., Yu, R., and Zhou, B., Intergovernmental Panel on Climate Change, Cambridge University Press. https://www.ipcc.ch/report/ar6/wg1/ (last access: 18 October 2022), 2022.
Johnson, M. and Eicken, H.: Estimating Arctic sea-ice freeze-up and break-up from the satellite record: A comparison of different approaches in the Chukchi and Beaufort Seas, Elementa: Science of the Anthropocene, 4, 000124, https://doi.org/10.12952/journal.elementa.000124, 2016.
Johnson, M., Proshutinsky, A., Askenov, Y., Nguyen, A. T., Lindsay, R., Haas, C., Zhang, J., Diansky, N., Kwok, R., Maslowski, W., Häkkinen, S., Ashik, I., and de Cuevas, B.: Evaluation of Arctic sea ice thickness simulated by Arctic Ocean Model Intercomparison Project models, J. Geophys. Res., 117, C00D13, https://doi.org/10.1029/2011JC007257, 2012.
Kapsch, M. L., Eicken, H., and Robards, M.: Sea ice distribution and ice use by indigenous walrus hunters on St. Lawrence Island, Alaska, in: SIKU: Knowing Our Ice, edited by: Krupnik, I., Aporta, C., Gearheard, S., Laidler, G. J., and Lielsen Holm, L., Springer, Dordrecht, 115–144, ISBN 978-90-481-8648-8, 2010.
Krupnik, I., Apangalook, L., and Apangalook, P: “It's cold, but not cold enough”: Observing ice and climate change in Gambell, Alaska, in IPY 2007–2008 and beyond, in: SIKU: Knowing Our Ice, edited by: Krupnik, I., Aporta, C., Gearheard, S., Laidler, G. J.,and Lielsen Holm, L., Springer, Dordrecht, 81–114, 2010.
Mahoney, A. R., Eicken H., Gaylord A. G., and Gens R.: Landfast sea ice extent in the Chukchi and Beaufort Seas: The annual cycle and decadal variability, Cold Reg. Sci. Technol., 103, 41–56, https://doi.org/10.1016/j.coldregions.2014.03.003, 2014.
Mahoney, A. R., Eicken, H., Gaylord, A. G., and Shapiro, L.: Alaska landfast sea ice: Links with bathymetry and atmospheric circulation, J. Geophys. Res., 112, C02001, https://doi.org/10.1029/2006JC003559, 2007.
Markus, T., Stroeve J. C., and Miller, J.: Recent changes in Arctic sea ice melt onset, freezeup and melt season length, J. Geophys. Res.-Oceans, 114, C12024, https://doi.org/10.1029/2009JC005436, 2009.
Noongwook, G., The Native Village of Savoonga, The Native Village of Gambell, Huntington, H. P., and George, J. C: Traditional knowledge of the bowhead whale (Balaena mysticetus) around St. Lawrence Island, Alaska, Arctic, 60, 47–54, https://journalhosting.ucalgary.ca/index.php/arctic/article/view/63326/47263 (last access: 24 October 2022), 2007.
Onarheim, I. H., Eldevik, T., Smedsrud, L. H., and Stroeve, J. C.: Seasonal and regional manifestations of Arctic sea ice loss, J. Climate, 31, 4917–4932, https://doi.org/10.1175/JCLI-D-17-0427.1, 2018.
Peng, G., Steele, M., Bliss, A. C., Meier, W. N., and Dickinson, S.: Temporal means and variability of Arctic sea ice melt and freeze season climate indicators using a satellite climate data record, Remote Sensing, 10, 1328, https://doi.org/10.3390/rs10091328, 2018.
Petrich, C., Eicken, H., Zhang, J., Krieger, J., Fukamachi, Y., and Ohshima, K. J.: Coastal landfast sea ice decay and breakup in northern Alaska: Key processes and seasonal prediction, J. Geophys. Res., 117, C02003, https://doi.org/10.1029/2011JC007339, 2012.
Selyuzhenok, V., Krumpen, T., Mahoney, A., Janout, M., and Gerdes, R.: Seasonal and interannual variability of fast ice extent in the southeastern Laptev Sea between 1999 and 2013, J. Geophys. Res.-Oceans, 120, 7791–7806, https://doi.org/10.1002/2015JC011135, 2015.
Smith, A. and Jahn, A.: Definition differences and internal variability affect the simulated Arctic sea ice melt season, The Cryosphere, 13, 1–20, https://doi.org/10.5194/tc-13-1-2019, 2019.
Serreze, M. C., Crawford, A. D., Stroeve, J. C., Barrett, A. P., and Woodgate, R. A.: Variability, trends, and predictability of seasonal sea ice retreat and advance in the Chukchi Sea, J. Geophys. Res.-Oceans, 127, 7308–7325, 2016.
Stammerjohn, S., Massom, R., Rind, D., and Martinson, D.: Regions of rapid sea ice change: An inter-hemispheric seasonal comparison, Geophys. Res. Lett., 39, L06501, https://doi.org/10.1029/2012GL050874 2012.
Stroeve, J. and Notz, D.: Changing state of Arctic sea ice across all seasons, Environ. Res. Lett., 13, 102001, https://doi.org/10.1088/1748-9326/aade56, 2018.
Stroeve, J. C., Markus, T., Boisvert, L., Miller, J., and Barrett, A.: Changes in Arctic melt season and implications for sea ice loss, Geophys. Res. Lett., 41, 1216–1225, https://doi.org/10.1002/2013GL058951, 2014.
Stroeve, J. C., Crawford, A. D., and Stammerjohn, S.: Using timing of ice retreat to predict timing of fall freeze-up in the Arctic, Geophys. Res. Lett., 43, 6332–6340, 2016.
Thomson, J., Smith, M., Drushka, K., and Lee, C.: Air-ice-ocean interactions and the delay of autumn freeze-up in the western Arctic Ocean, Oceanography, 35, 12, https://doi.org/10.5670/oceanog.2022.124, 2022.
USGCRP: Climate Science Special Report: Fourth National Climate Assessment, Volume I, edited by: Wuebbles, D. J., Fahey, D. W., Hibbard, K. A., Dokken, D. J., Stewart, B. C., and Maycock, T. K., U.S. Global Change Research Program, Washington, DC, USA, 470 pp., https://doi.org/10.7930/J0J964J6, 2017.
Wadhams, P.: The ice cover in the Greenland and Norwegian Seas, Rev. Geophys., 19, 345–93, https://doi.org/10.1029/RG019i003p00345, 1981.
Walsh, J. E. and Johnson, C. M.: Interannual atmospheric variability and associated fluctuations in Arctic sea ice extent, J. Geophys. Res., 84, 6915–6928, https://doi.org/10.1029/JC084iC11p06915, 1979.
Wang, M., Yang, Q., Overland, J. E., and Stabeno, P.: Sea-ice cover timing in the Pacific Arctic: The present and projections to mid-century by selected CMIP5 models, Deep-Sea Res. Pt. II, 152, 22–34, https://doi.org/10.1016/j.dsr2.2017.11.017, 2018.
Yu, Y., Stern, H., Fowler, C., Fetterer, F., and Maslanik. J.: Interannual variability of Arctic landfast ice between 1976 and 2007, J. Climate, 27, 227–243, https://doi.org/10.1175/JCLI-D-13-00178.1, 2014.