the Creative Commons Attribution 4.0 License.
the Creative Commons Attribution 4.0 License.
 | 19 Jul 2022
Tricentennial trends in spring ice break-ups on three rivers in northern Europe
Samuli Helama
At high latitudes, long-term changes in riverine ice break-ups are exemplary measures of climatic change and variation. This study compares cryophenological trends, patterns and changes for the rivers Aura (1749–2020), Torne (1693–2020) and Kokemäki (1793–2020); all sites are located in Finland. The Kokemäki River series is a new series from the city of Pori. The findings show statistically significant cross-correlations between the Aura and Kokemäki rivers but weaker cross-correlations with the Torne River. We attribute the latter to climatic differences caused by the higher latitude of the Torne River. Taken together, the many results of this study suggest that the spring climate in the south has changed more rapidly and become less predictable than in the north. Climatic extremes – warmer and wetter winters – in the 2000s resulted in the first recorded no-freeze events on the Aura and Kokemäki rivers. This was the culmination of a rapid increase in early ice break-up events and interannual variability over the last 30 years. The number of early events has increased in all three rivers since the early or mid-1900s, but the earliest recorded break-up day on the Torne River has changed only marginally in the last 100 years. Our dynamic temperature analysis shows that the ice break-up on the Torne River requires higher temperatures than in the south, and future changes in the timing of the break-up depend on April temperatures. In the south, on the other hand, future changes concerns the return period of no-freeze events, which depend on temperature and precipitation during winter.
- Article
(3811 KB) - Full-text XML
- BibTeX
- EndNote


High-latitude lakes and rivers constitute fundamental parts of the cryosphere. Records of freeze-up (winter) and break-up (spring) are linked to air temperature and provide valuable climate variability information on interannual to longer scales. Improved understanding of historical and current freeze-up and break-up patterns can provide insights into the spatiotemporal impact of climate warming. Some changes, such as an increase in open water winters or floods, could create considerable socio-economic impacts and they could cause alterations in aquatic ecosystems or biogeochemical processes (Prowse et al., 2011, 2006).
Most cryophenological studies employ lake-ice data because lake-ice series are plentiful and provide good spatial coverage. Their findings indicate trends towards later freeze-ups and earlier break-ups across the Northern Hemisphere (Sharma et al., 2021; Newton and Mullan, 2021; Benson et al., 2012; Korhonen, 2006; Magnuson et al., 2000). These trends vary in time and scale depending on the location, but in cold climate regions they typically follow increased changes in air temperature since the 1960s (Mikkonen et al., 2015; Weyhenmeyer et al., 2011; Bonsal and Prowse, 2003; Serreze et al., 2000).
River-ice series are scarce, but they commonly extend further back in history than lake-ice series, with several beginning in the 1700s (Magnuson et al., 2000; Rykatschew, 1887). These data series are often derived from port cities, and the observations were collected in connection with overseas trading and transport. Several river-ice series, unfortunately, have been discontinued in the 1900s, or they have not been updated, but there are also exceptions, such as the Daugava River in Latvia (Klavins et al., 2009).
In Finland, at least five river-ice series date back to the 1700s (e.g. Johansson, 1932). In the 1800s, before long-term meteorological data were readily available, such series were used to investigate climatic changes (Levänen, 1890; Eklöf, 1850; Hällström, 1842). Professor of meteorology Oscar Johansson (1932) updated some of these series to 1906, but they lost their value as climatic indicators until Juha Kajander (1995, 1993) highlighted their importance by documenting observations for the Torne River in northern Finland. In 2019, the Torne River series was complemented with the Aura River series from Turku in southwest Finland (Norrgård and Helama, 2019). The present study conducts the first comparison between these series. In addition, the current study presents a new tricentennial ice break-up series for the Kokemäki River (in Swedish Kumo älv) based on observations from the city of Pori (Björneborg) in southwest Finland. The series spans from 1793 to 2020 and is compared to the Torne River (1693–2020) and Aura River series (1749–2020). This study pursues four main objectives: (i) to examine whether the power plant closest to Pori has changed the timing of ice break-ups; (ii) to analyse the long-term trends and correlations between the rivers Aura, Kokemäki and Torne; (iii) to analyse how the series correlate with temperature, precipitation and, in the case of the Torne, ice thickness; and (iv) to examine long-term variability and changes in the frequency of extreme events.
2.1 Tornio and Torne River
The Torne River is one of the largest unregulated rivers in northern Europe. It flows southward from Lake Torne in the Arctic and drains into the Bothnian Bay, the northernmost sub-basin of the Baltic Sea (Fig. 1). The river, which has a watershed area of 40 157 km2 and is 522 km long, marks the border between Finland and Sweden for the last 180 km of its length. The ice break-up observation site is situated in the Finnish city of Tornio (65∘84′ N, 24∘15′ E) about 3.5 km from the mouth of the river. In 2019, Tornio had a population of 22 000 inhabitants. At the observation site, the river is approximately 260 m wide. The break-up date refers to the day when the ice begins to break up or move, and it is monitored by the Finnish Environment Institute (SYKE), which also measures ice thickness, discharge rates and snow cover thickness.
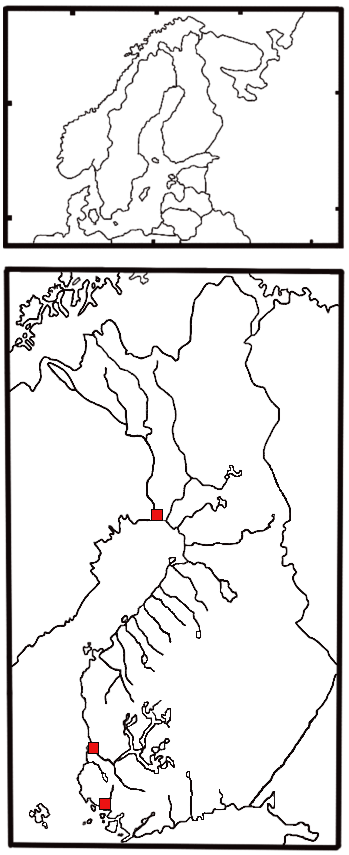
Figure 1Northern Europe and Finland with the Finnish rivers marked out. The squares from north to south are Tornio (Torne River), Pori (Kokemäki River) and Turku (Aura River). The map also shows the lakes connected to the Kokemäki River watershed area.
The average discharge at the observation site in Karunki (23 km upstream from the break-up site) during the period 1911–2020 was 388.75 m3 s−1. The maximum discharge on 11 June 1968 was 3667 m3 s−1. The Torne River is unregulated, but the Tengeliönjoki River, one of the Torne's tributaries, hosts three hydroelectric power plants. The power plant closest to the town of Tornio is 80 km upstream, and it should have no significant influence on the break-up process (Sharma et al., 2016). The strongest anthropogenic impact on the break-up process was likely to have been caused by log-driving dams built in the 1900s (Kajander, 1993). However, these dams were demolished after the log-floating era ended in 1971 (Zachrisson, 1988).
2.2 Turku and Aura River
The Aura River, which is 70 km long and drains into the Archipelago Sea, a sub-basin of the Baltic Sea, has a watershed area of 885 km2 and an average discharge at the Halinen dike (1938–2020) of 6.86 m3 s−1. The maximum discharge, recorded on 2 May 1966, was 286 m3 s−1. The data series originate from the city of Turku (60∘45′ N, 22∘27′ E), which is located at the mouth of the river. Turku, which straddles the Aura River, had a population of 191 000 inhabitants in 2019. Inside the city limits, the width of the Aura River varies between 35 and 100 m, with its depth varying between 1 and 4 m. The Aura River series depicts the ice-off date, which is when the river is ice-free between the mouth of the river and the Halinen dike (Norrgård and Helama, 2019). The dike, which is situated 6 km from the mouth of the river, was first mentioned in historical records in the 14th century. The dike separates the lower reaches from the upper reaches, creating two independent break-up processes (Norrgård and Helama, 2019). Except for the dike, the Aura River is unregulated.
2.3 Pori and Kokemäki River
The Kokemäki River, which is 121 km long and drains into the Bothnian Sea, the largest sub-basin of the Baltic Sea, features the largest river delta in the Nordic countries. The river has a catchment area of 27 046 km2 and at the Harjavalta hydroelectric power plant an average discharge of 218.62 m3 s−1 (1931–2020). The maximum discharge occurred on 5 May 1966 and was 918 m3 s−1.
The ice break-up observation site is situated in the city of Pori (61∘48′ N, 21∘79′ E) and lies about 11 km from the river delta. Pori had a population of 83 000 inhabitants in 2019. The ice break-up observations for the river, which has an estimated width of between 160 and 240 m and a depth of between 2 and 4 m, have been obtained from the city centre. For most of the period covered by the data series, the ice break-up date refers to the day when the ice between Porinsilta Bridge (built in 1926) and Kirjurinluoto Island begin to break-up or move. In Pori, daily discharge averages vary because of the Harjavalta plant and three other hydroelectric plants upstream. Harjavalta, the largest plant on the river, is also the closest of the four plants to Pori (31 km) and has been in operation since 1939. The next plant was built in 1940, and it is located in the city of Kokemäki (46 km from Pori). This is followed by the oldest plant of the four, built in Äetsä in 1919 (87 km from Pori), and the newest, built in Tyrvää in 1950 (121 km from Pori).
Ice jam floods have always been a nuisance in Pori. Consequently, during the 1900s and 2000s, to mitigate the effects of ice jam floods, the riverbanks have been reinforced while the river has been dredged on several occasions. Flood response constructions were built near the observation site in the 1970s and 1980s (Verta and Triipponen, 2011; Louekari, 2010; Huokuna, 2007; Koskinen 2006).
2.4 General reflections on ice conditions
Low winter temperatures predetermine that the Torne River always freezes. There are no midwinter break-ups, and the mean ice cover period is 5 to 6 months (Kajander, 1993). Ice thickness has been measured at the observation site since 1964, most frequently on 30 March, with the mean thickness during the period 1964–2019 being 76.5 cm (n=54).
Systematic records on freeze-up dates or ice thickness are unavailable for the Aura River. However, some freeze-up dates were recorded and collected by Leche (1763), Moberg (1893, 1892, 1891, 1890, 1857), and Levänen (1890), and adding five additional observations for 1861–1865 from a local newspaper gives a mean of 144.3 ice cover days (n=37; median 146). These observations were made before the 1900s, with 23 from the 1700s. The sporadic occurrence of midwinter break-ups means that the length of the ice cover period is only indicative of actual ice conditions. For example, in 1771, the freeze-up occurred on 20 November, and the ice had reached a thickness of 20 cm before heavy rains caused a midwinter break-up on 13 December. Midwinter break-ups of various intensities have occurred between December and February throughout the 1749–2020 period. The last recorded midwinter break-up involving ice at least 20 cm thick occurred in January 1999. During cold winters, the ice can reach a thickness of 70 cm or more, as newspaper reports from April 1837 and March 2003 testify. Records on ice conditions are sporadic, but the examples provided above offer some perspective on the conditions leading up to the first no-freeze event in 2008 (Norrgård and Helama, 2019).
Thermal break-ups appear in the Aura River. A thermal break-up, as opposed to a dynamic break-up, is characterized by the thinning and weakening of the ice by thermal inputs. In this process, there is little to no breakage of the ice, which melts in situ unless the flow increases (Beltaos and Prowse, 2009). Such break-ups also appear on the Kokemäki River, affecting the validity of some break-up observations. For example, in March 1992, a local newspaper reported that the ice had melted in situ for the fourth year in a row. The city employee conducting the observations claimed that an official break-up date would not be recorded, as the exact date could not be determined. Similar break-ups also occurred in the 1920s, but they have been, in general, rarer than on the Aura River.
Dates on freeze-up, ice thickness or ice cover have not been systematically collected in Pori. However, a break-up series published in 1843 (see below) containing 11 years of freeze-up dates between 1810 and 1844 gives a mean of 157.8 ice cover days (n=11; median 160). As in Turku, midwinter break-ups may affect the actual number of ice cover days. For example, in 1841, the freeze-up occurred on 15 November, but a midwinter break-up on 7 January 1842 took place before the actual break-up on 16 April.
The dates in the Aura River series denote the ice-off event, or the day when the river was ice-free, whereas the dates in the Torne and Kokemäki River series describe the ice break-up, or the initial movement of the ice. In this paper, we hereafter use “break-ups” to refer to either ice break-ups or ice-offs, but we will distinguish between the two when necessary.
3.1 Kokemäki River
3.1.1 Material
The Kokemäki River ice break-up series is mostly based on descriptions obtained from the local Swedish newspaper Björneborgs Tidning (1860–1965) and the Finnish newspaper Satakunnan Kansa (hereafter SK) (1873–present). Newspapers editions prior to 1950 were obtained from the National Library of Finland's digital database, while more recent newspaper articles were accessed via the University of Turku's newspaper affiliate in Raisio and the SK's internal database at the editorial office in Pori. All articles were transcribed and the metadata stored locally.
Newspapers are exemplary sources because they provide daily and sometimes sub-daily descriptions of the break-up process (Norrgård and Helama, 2019; Kajander, 1993). Newspapers also often contain break-up series submitted by readers. The first break-up series for the Kokemäki River was published under a pseudonym in Åbo Tidningar in July 1843 and covered the period 1801–1843. An extended version (1801–1849) of the initial series was parallel published in Åbo Tidningar and Suometar on 11 May 1849. We found at least four other series published in the 19th century, but the series that extended the series to 1794, thereby radically changing its length, was published in SK in 1877.
Johansson (1932) extended the series to 1793 and 1906, and an extended version of this series was published in SK in 1984, but the most recently updated series, actually a chart spanning the period 1794–1998, was found in the city archives. Its origin is unknown; however, two initials in the lower right-hand corner match the names in an article published in SK in 1996. This suggests that the series had been maintained by city employees since the 1950s. We found no break-up dates for the 4 years between 1999 and 2002. The dates between 2003 and 2020 originate from a break-up guessing competition arranged by the local Lions Club.
3.1.2 Creating the series
The aim was to create an ice break-up series with homogenized break-up dates with regard to site and event. Dates obtained from previously published series were used for reference when scrutinizing the newspapers for observations. The majority of newspaper articles described the break-up near the location of the Pontoon Bridge, which was replaced by Porinsilta Bridge in 1926. The aim was therefore to obtain observations that referred to this part of the river and described the same stage of the break-up process. Consequently, the newly compiled series describe the initial day of break-up or the day when the ice started moving between Porinsilta Bridge and Kirjurinluoto Island.
The break-up dates prior to 1863 could not be validated. However, the series published in Åbo Tidningar in July 1843 stated that it depicts the ice break-up in the city of Pori. As maps from the 1800s show that the city was small and concentrated, the observations thus most likely refer to the area where the Porinsilta Bridge was later built.
The break-up in 1852 was the only time when the dates in the previously published series diverged considerably. The break-up was noted to have begun in either early April or early May. The reason for this discrepancy might be the devastating city fire in 1852. Nonetheless, the break-up in May was preferred because it was consistent with the event on the Aura River.
Some dates in the latter half of the 1900s are likely to be based on observations near the Linnansilta Bridge (built 1974), approximately 160 m north of Porinsilta Bridge. This should have no significant impact on the analysis. However, the dates obtained from the guessing competition may affect the validity of the observations. This is because the break-up dates are based on the movement of a closely monitored marker standing on the ice instead of the break-up date on the Kokemäki River in general.
3.2 The vernal equinox
All dates in the break-up series follow the Gregorian calendar, but they were adjusted according to the vernal equinox (VE) for the purpose of the analyses. The break-up was counted as the number of days before or after the equinox. This approach was preferred over the year-to-date approach (e.g. Sharma et al., 2016) due to the length of the series. Calendar dates can result in overestimated trends when break-up series span several centuries (Sagarin, 2001, 2009). In practice, the vernal equinox has varied between 19 and 21 March. The vernal equinox dates for each series were obtained from NASA's dataset home page and adjusted to the Finnish time zone (GMT+2).
3.3 Extreme events and variability
We performed a twofold analysis of extreme events and variability. First, the 30 latest/earliest events were ranked according to their calendric dates, and the timing of the break-ups was compared over the period common to the three series (1793–2020). The timing of the events was also compared according to the length of the Aura River (1749–2020) and Torne River series (1693–2020).
Second, break-up patterns, extreme events and variability were also analysed according to the vernal equinox using 30-year non-overlapping windows in the interquartile range (IQR). The IQR is the difference between the third (75 %) and first (25 %) quartile. Thus, the IQR provides the middle range in which the middle half of the break-ups occur. The second quartile (Q2) is the median value.
No-freeze years were quantified as an ice break-up that occurred on 1 January (VE-79). No-freeze events are challenging when quantifying dates because the rate of change is easily underestimated. For example, Benson et al. (2012) chose the earliest break-up date, while Sharma et al. (2016) treated them as censored values. However, these studies used series that included no-freeze events before or in the 1900s. In our data, no-freeze events occurred for the first time in the 21st century, which is why a more distinct approach was preferred.
The Aura River series was used to estimate the break-up dates for the Kokemäki River during the periods 1781–1792 and 1999–2002. The break-up dates for the Kokemäki River were extracted by adding three (3) days, the average difference between the sites, to the recorded ice-off date on the Aura River. This approach enabled us to include the break-ups between 1793 and 1810, which otherwise would have been excluded from the long-term analysis. None of the extracted values was either extremely late or early.
Extreme events in each 30-year period were analysed according to (i) the average of the three earliest/latest break-ups and (ii) the frequency of extreme events. An extremely late event was defined as the latest break-up in the period 1991–2020. All break-ups that in previous periods occurred on the same day or later were counted. Conversely, the earliest break-up was defined as the earliest break-up in the first period of each series. For example, the earliest break-up in the Torne River was obtained from the period 1721–1750, in the Aura River from the period 1751–1780, and in the Kokemäki River from the period 1781–1810.
3.4 The impact of the hydroelectric power plant
The construction of the hydroelectric power plant in Harjavalta began in 1937, and it was operational at the end of 1939. Aerial pictures from the construction site suggest that 1938 was the last year when the break-up was unaffected by the dam. The break-up in 1939 was therefore set as the first event that could have been influenced by the power plant. Several methods were employed to establish whether the power plant changed the timing of the break-up in Pori. First, impact was assessed by analysing changes in Spearman's correlation coefficient before and after 1939. Second, the break-up date in the Kokemäki River was subtracted from the ice-off dates for the Aura River to reveal changes in the internal relationship between the rivers. It was assumed that a significant shift of any kind should be noticeable when comparing the break-up dates. Third, annual discharge rates were compared, as the break-up process is often induced by increased discharge rates caused by snowmelt (Beltaos and Prowse, 2009). In this case, discharge rates have been measured at the site since 1931, and these measurements were used to assess whether the power plant had influenced overall discharge. Discharge rates for each day leading up to the break-up date were averaged over the unregulated 1931–1938 period and the regulated 1939–1998 period to create a dynamic model depicting discharge rates 60 d before the break-up and 10 d after. The break-up dates obtained from the guessing competition were excluded because they did not depict the actual break-up date.
3.5 Cross-correlations, meteorological variables and trends
Spearman's correlation coefficient was used to analyse cross-correlations between the break-up series and correlations between the break-up series and monthly mean temperature and precipitation sums over the 1960–2020 period. The temperature and precipitation data derive from a spatial model constructed by the Finnish Meteorological Institute (FMI) (Aalto et al., 2016, 2013). The model is based on data from Finland supplemented with data from neighbouring countries (Estonia, Norway, Russia, and Sweden). It uses kriging interpolation to account for the influence of topography and nearby water bodies.
Another model created by the FMI (Venäläinen et al., 2005) was used to analyse daily temperature development leading up to the break-up. This model also employs kriging interpolation. For this analysis, the values of daily mean, maximum and minimum temperatures were calculated for Tornio (Torne River), Pori (Kokemäki River) and Turku (Aura River) over the period 1961–2020. The temperatures for three variables (mean, maximum and minimum) were aligned according to the break-up date and calculated over an interval of 180 d before and 30 d after the break-up. The analysis thereby shows the change in daily mean, maximum and minimum temperatures 180 d before and 30 d after the break-up date between 1961 and 2020.
The Mann–Kendall (MK) test (Kendall, 1970; Mann, 1945) was used to determine the statistical significance of long-term trends. The rate of change (slope) was estimated using Sen's (1968) slope. These methods are commonly used to analyse temporal trends in phenological series (e.g. Menzel, 2000; Gagnon and Gough, 2005, 2006; Terhivuo et al., 2009; Benson et al., 2012; Šmejkalová et al., 2016; Helama et al., 2020).
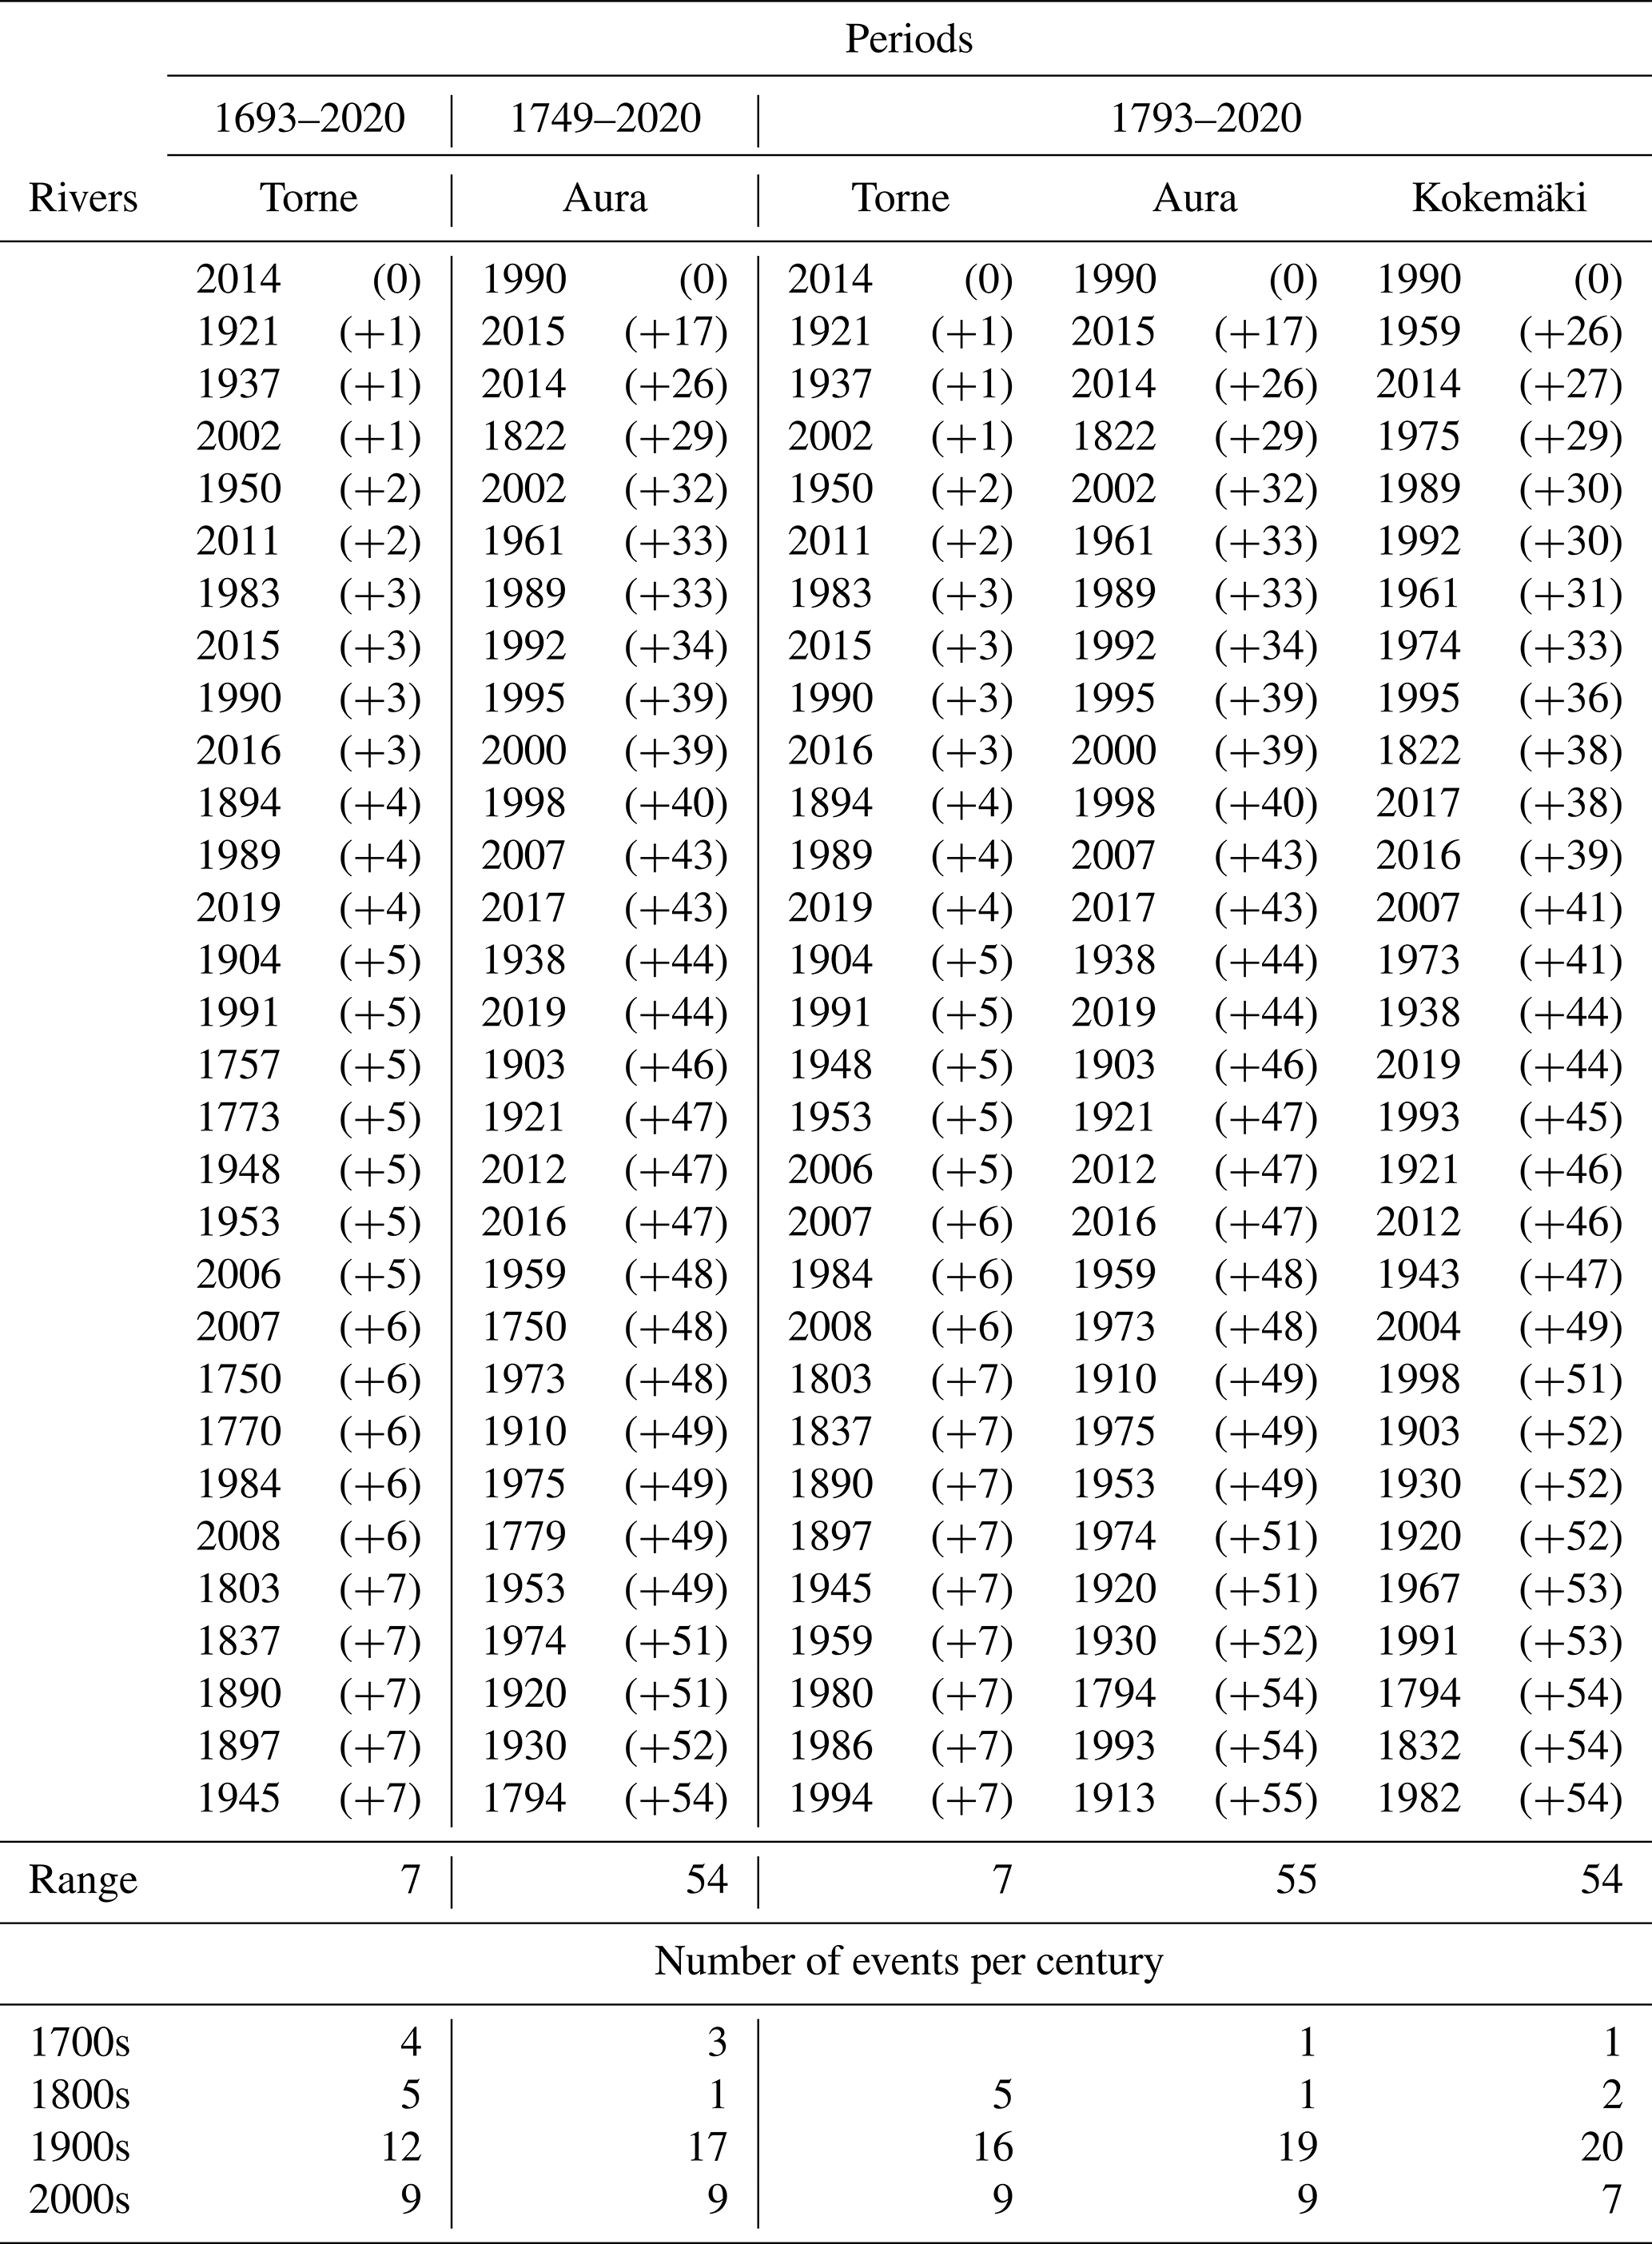
Table 1The 30 earliest ice break-up events in the Torne and Kokemäki rivers, and the 30 earliest ice-off events in the Aura River. The Torne and Aura are fitted to correspond to the length of the shorter series. The number in parentheses shows the number of days relative to the earliest event (0). In the Kokemäki River, for example, (+54) indicates that the ice break-up occurred 54 d after the earliest (0) event. The no-freeze events are not included.
4.1 Extreme break-up events
4.1.1 Early break-up events
Table 1 shows that all three series are dominated by early break-ups in the 1900s and 2000s. If the missing data (1999–2002) for the Kokemäki River are estimated from the Aura River data, then all the 30 earliest break-ups, except for the event in 1822, are from the period 1900–2000. The event in 1822 was unique on the Aura and Kokemäki rivers but not on the Torne. Three break-up series from nearby rivers in Finland and Russia show that 1822 was early in the Porvoo River (1771–1906) (Johansson, 1932) in Porvoo (60∘23′ N, 25∘39′ E), southern Finland, and in the Neva River (1706–1882) in St. Petersburg (59∘56′ N, 30∘18′ E), Russia (Rykatschew, 1887). However, it was not early in the Northern Dvina (1734–1879) in Archangel (64∘32′ N, 40∘32′ E), Russia, (Rykatschew, 1887). This suggests a climatic discrepancy between the north and south in 1822.
The first no-freeze events on the Aura and Kokemäki rivers occurred in 2008. The Aura River had its second no-freeze event in 2020, whereas the Kokemäki River had the second event in 2015 and third in 2020. The no-freeze events in 2008 and 2020 occurred during the two warmest winters on record, with the latter being slightly warmer than the former (Lehtonen, 2021; Irannezhad et al., 2014; Ilkka et al., 2012). The no-freeze event on the Kokemäki River in 2015 also occurred during one of the warmest years on record (FMI, 2016). In this context, it is worth noting that the Torne River had one of the latest late break-ups in 60 years in 2020.
On the Torne, the earliest break-up occurred in 2014, 1 d earlier than the previous record in 1921. Hence, the earliest break-up date had remained unchanged for nearly 100 years. Additionally, the event in 2014 occurred only 5 d earlier than the earliest break-up in the 1700s (1757). By contrast, there is a 48 d difference between the all-time earliest ice-off event on the Aura River and the earliest ice-off event in the 1700s (1750).
Table 2The 30 latest ice break-up events in the Torne and Kokemäki rivers and the 30 latest ice-off events in the Aura River. Torne and Aura are fitted to correspond to the length of the shorter series. The number in parentheses shows the number of days relative to the latest event (0). In the Torne River, for example, (−14) means that the ice break-up occurred 14 d before the latest (0) event.

4.1.2 Late break-up events
Table 2 shows a lack of uniformity regarding late break-up events. This discrepancy is caused by differences in series length and climatic conditions between the north and the south. For example, on the Torne River (1693–2020), 18 of the 30 latest events occurred before the start of the Aura River series in 1749. The coldest springs therefore clearly occurred during the first half of the 1700s. However, the break-up during the cold European winter in 1708/1709 (Luterbacher et al., 2004) was not among the 100 latest break-ups. On the Aura River (1749–2020), eight of the latest events occurred in the 1700s. It is worth noting that the four latest events in all three series, except for the event in 1695 on the Torne River, are from the 1800s.
Over the period common to the three series (1793–2020), each river had late break-ups in 1807, 1810, 1812, 1845, 1847, 1867 and 1881. In general, the number of events during the first two decades of the 1800s is considerable. More than one-third of the latest events on the Torne and Kokemäki rivers occurred between 1800 and 1824. Nevertheless, the break-ups were late on all three rivers only in 1807, 1810 and 1812. The concentration of late events in the early 1800s could be attributed to the climatic effects of the Dalton Minimum (1800–1824), which mainly affected the spring climate (Xoplaki et al., 2005). Smaller clusters of late events also occur, for example, in the 1840s, but they are less prominent than the events of the early 1800s. Lake-ice research has highlighted the late break-up in 1867 (Korhonen, 2005, 2006). The event in 1867 is one of the latest event on the Aura, Torne and Kokemäki rivers; however, these series also reveal the exceptionally late break-ups in 1807 and 1810.
Table 3Part (a) of the table shows the average (Avg) and median (MD) break-up date, according to the vernal equinox, for the Torne (TR) and Kokemäki (KR) rivers and the average ice-off date for the Aura River (AR). The table also shows the cross-correlations (rho) between the three series. Part (b) shows the correlations and subtracted differences between the AR and KR before and after the power plant period. The negative value indicates that the ice-off event in the AR occurred before the break-up event in the KR. The 2003–2020 period shows the difference for the guessing competition break-up dates.
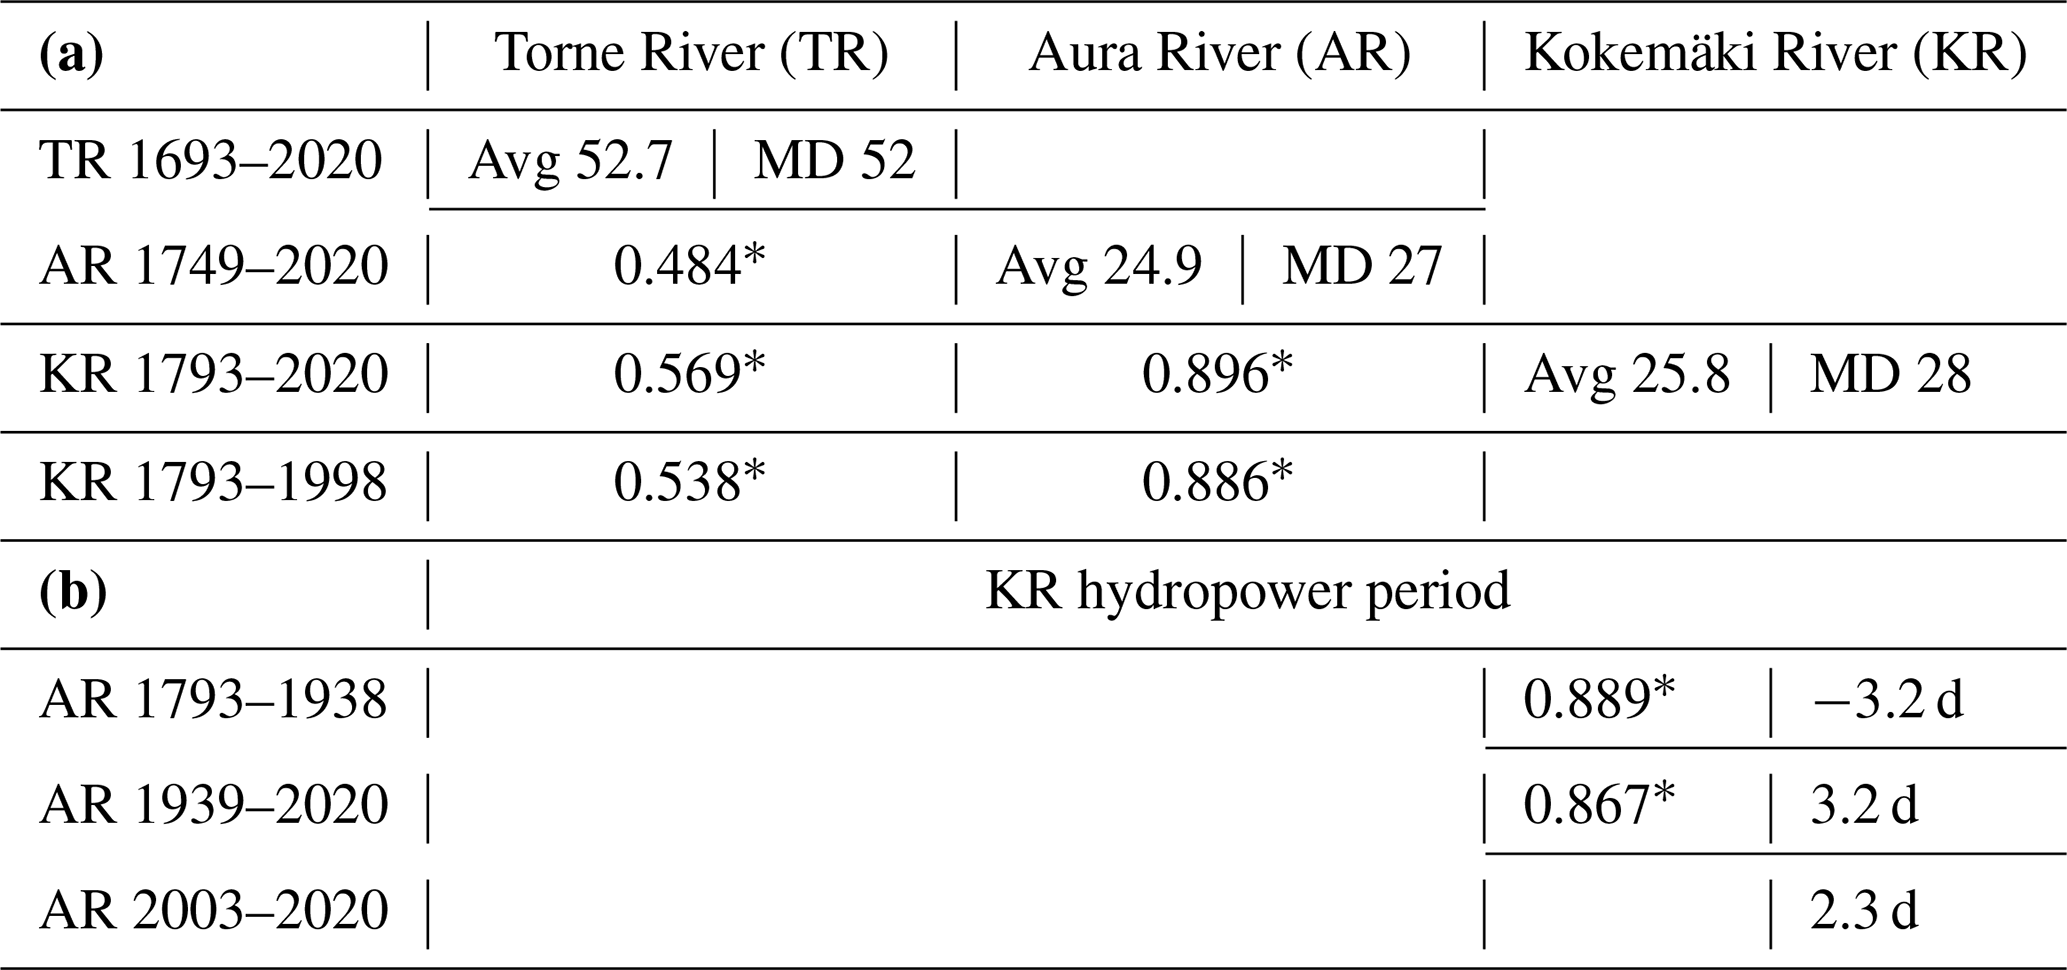
∗ p < 0.001
4.2 Cross-correlations and discharge rates
4.2.1 Cross-correlations and changes caused by the power plant
Table 3a shows the average and median break-up dates and cross-correlations between the three series across their respective lengths. The weakest correlation was between the Aura and Torne rivers. This was most likely due to different climatic conditions, as the distance between the rivers (approximately 600 km) is considerable. In turn, the strongest correlations were found between the Aura and Kokemäki rivers, which could be expected considering the relatively short distance between them (approximately 120 km). These correlations remained high for both the pre-power plant (1793–1938) and power plant period (1939–2020) (Table 3b).
For the period 1793–1938, the results show that the break-up on the Kokemäki River started on average 3.2 d after the ice-off on the Aura River (Table 3b). Thereafter, in the period 1939–2020, the break-up on the Kokemäki River started 3.2 d before the ice-off on the Aura River. Thus, it would seem as if the Harjavalta power plant caused a 6.4 d change in the timing of the break-ups. Some interannual differences were considerably larger than 6.4 d (Fig. 2), but the overall difference was too small to affect the Spearman's coefficient.
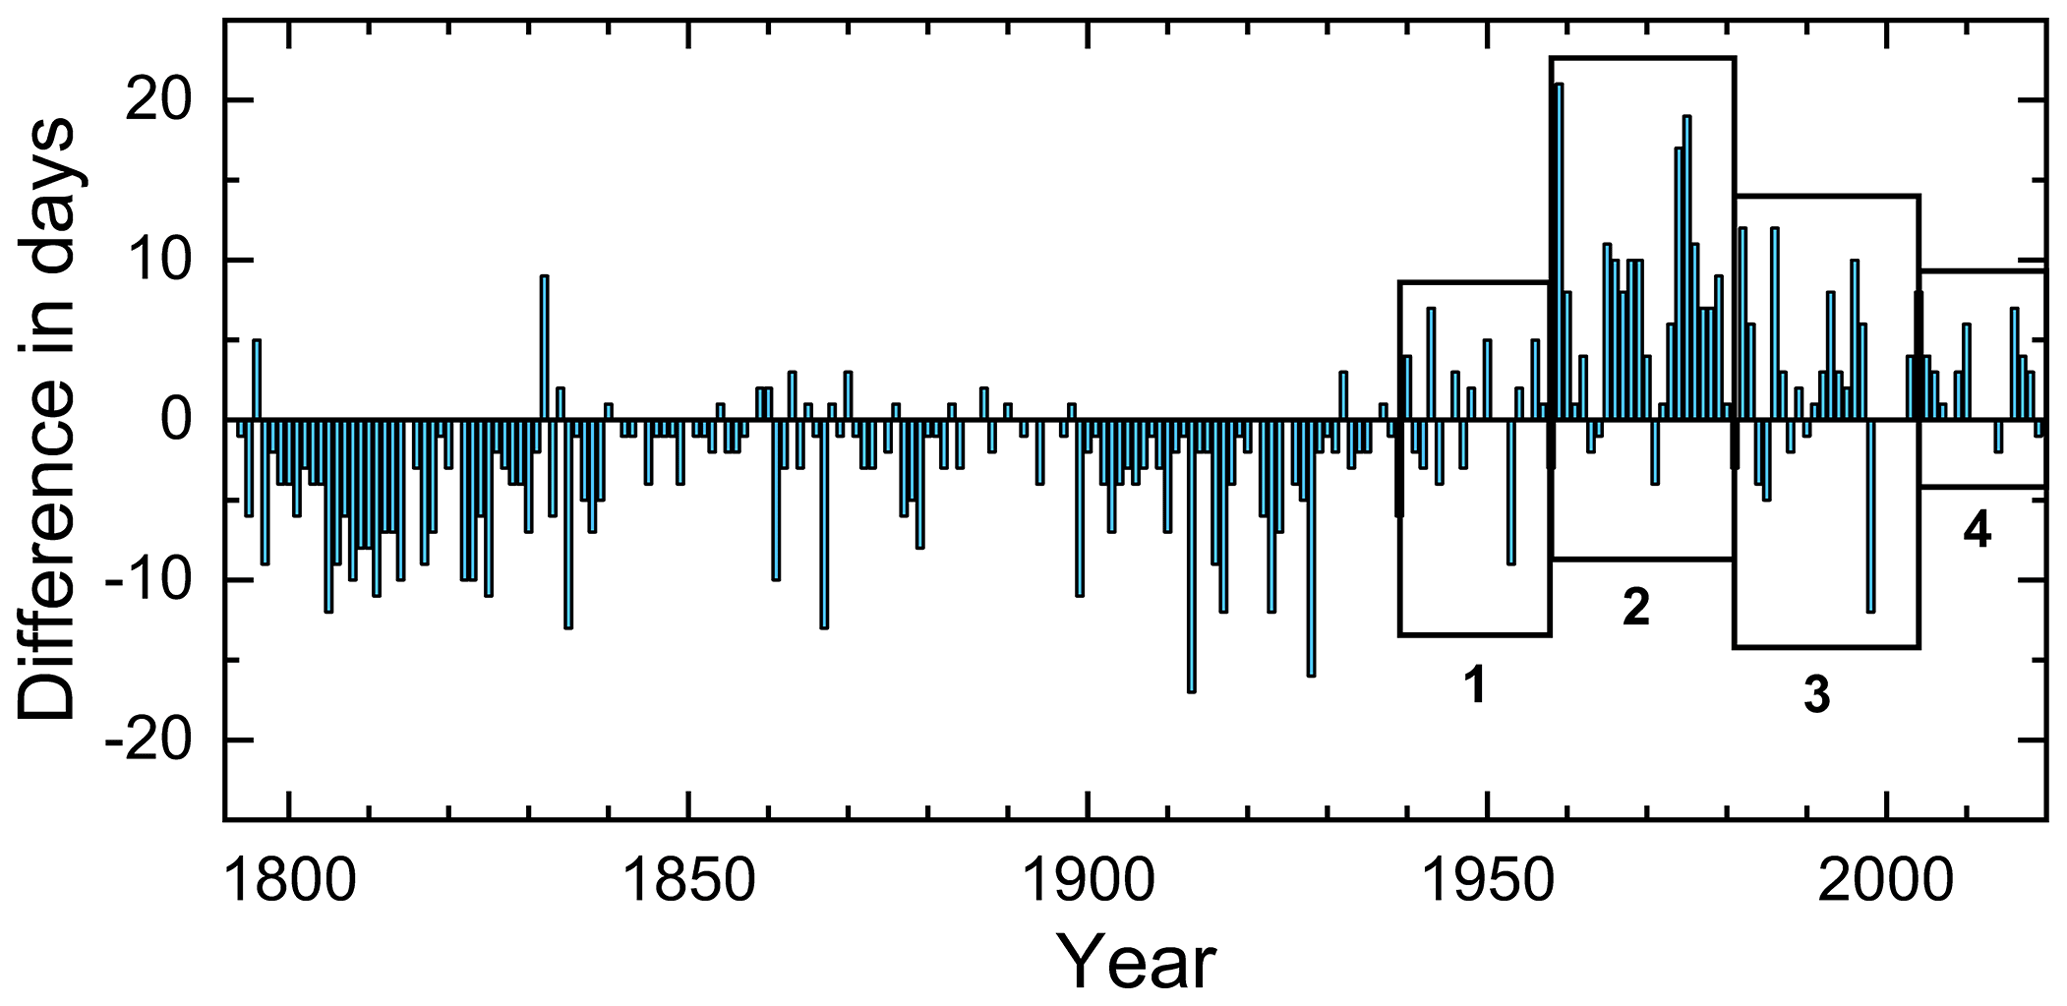
Figure 2The difference in days between the break-up date in the Kokemäki River and the ice-off event in the Aura River. A negative value indicates the number of days the ice-off event in the Aura River preceded the break-up date in the Kokemäki River. Vice versa, a positive value shows how many days the break-up in the Kokemäki River occurred before the ice-off date in the Aura River. See Sect. 4.1 for more information on the boxes.
The dates from the break-up competition in the Kokemäki River (2003–2020) were an average of 2.3 d earlier than the Aura River's ice-off event. However, the actual difference was most likely greater than this. For example, in 2019, the break-up on the Kokemäki River appears to have begun approximately 6 d before the guessing competition marker moved. This was the only year for which we found a break-up observation that could be compared to the date from the guessing competition. This 6 d difference cannot be used to estimate the break-up dates for the period 2003–2020, because of the great variance in the interannual differences between 1939 and 1998.
4.2.2 Discharge patterns, changes and impacts
Korhonen and Kuusisto (2010) demonstrated that a significant increase in winter (DJF) discharge rates had occurred at the Harjavalta power plant over the period 1931–2004. This study did not separate the pre-power plant and power plant periods, but the power plant has clearly changed discharge patterns prior to ice break-up. This is shown in Fig. 3, which compares the unregulated discharge rates in 1934 with the weekly pulses generated by the power plant in 1976. Figure 3 also shows that a flow peak used to appear 1 week after the break-up during the period 1931–1938, but this peak became less apparent after the power plant was completed in 1939. Furthermore, the average discharge rate before the break-up has increased since 1939. During 1931–1938, the median discharge rate before the break-up was 181.19 m3 s−1, but this changed to 206.78 m3 s−1 in 1939–2020. Increased discharge rates are one of the driving forces during break-ups. Thus, increased discharge rates 60 d prior to the break-up date may be a contributing factor to earlier break-ups when compared to the Aura River (Fig. 2). Finally, on the recorded break-up day, the average discharge rate decreased from 382.13 m3 s−1 in 1931–1938 to 322.88 m3 s−1 in 1939–1998 (Fig. 3).
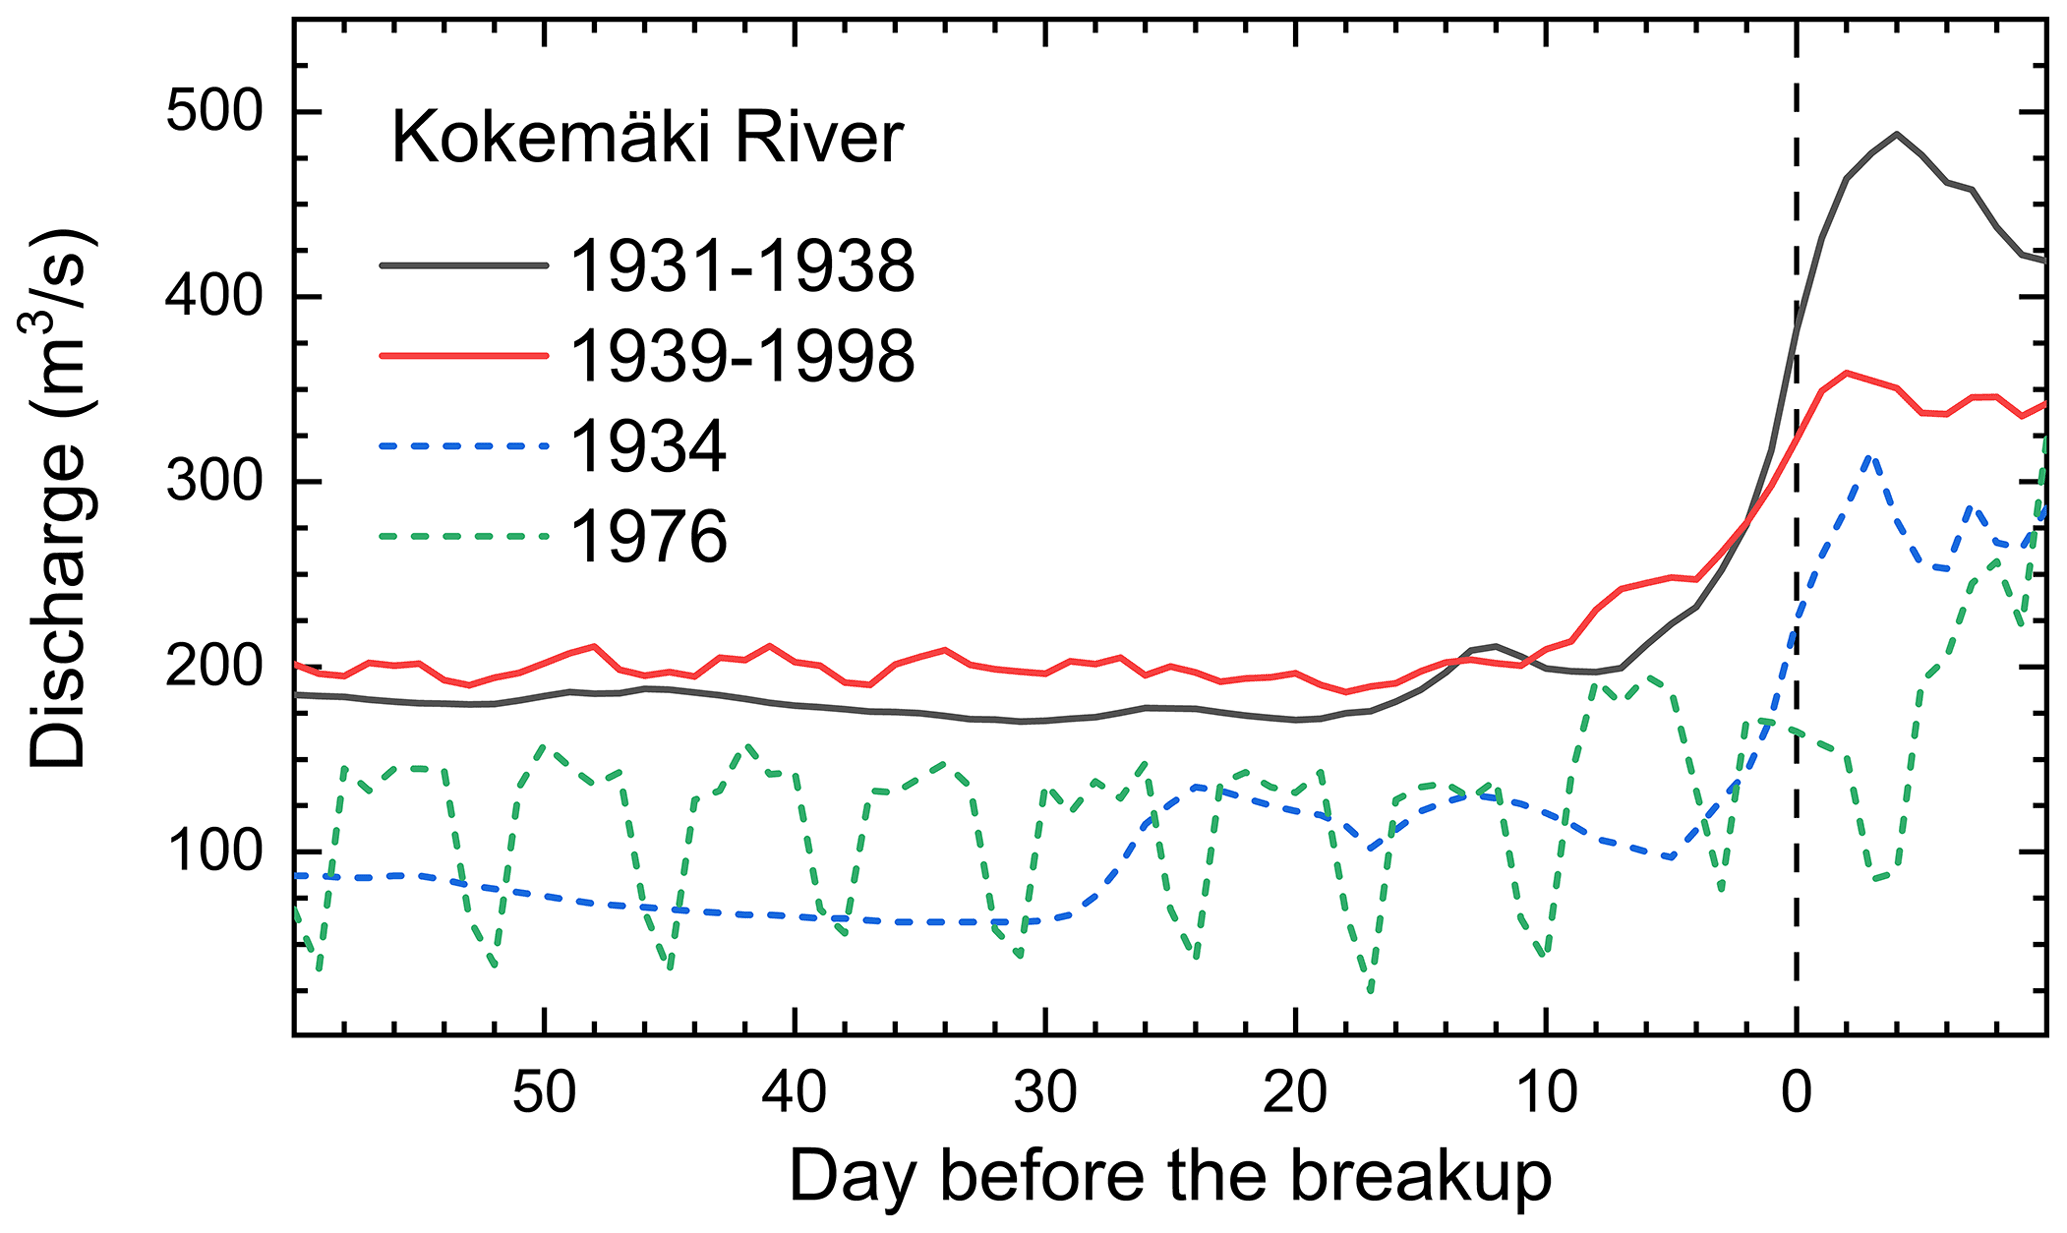
Figure 3The discharge 60 d before and 10 d after the break-up (0) in the Kokemäki River. The black line shows the average discharge rate during the 1931–1938 period and the red line the average during the 1939–1998 period. The blue line depicts the discharge before the break-up in 1934 and the green line depicts the weekly discharge cycle before the break-up in 1976.
It seems likely that the above-mentioned changes combined to advance break-ups on the Kokemäki River. On an interannual level, and when compared to the Aura River, the shift in break-up dates remained almost indistinguishable until 1958 (Fig. 2, box 1). Thereafter, in the period 1959–1979 (box 2 in Fig. 2), the break-up on the Kokemäki River began an average of 7.3 d (range 1–21 d) before the ice-off on the Aura River. However, increased discharge rates do not explain the interannual differences in this period. For example, in 1959, the break-up on the Kokemäki River occurred 21 d before the ice-off event on the Aura River, but the discharge rates were almost half below the average. Figure 2 presents the differences in the periods 1939–1968, 1959–1979, and 1980–2004. Over these periods, 60 d before the break-up, the average discharge increased from 177.73 to 205.09 m3 s−1 and finally to 239.24 m3 s−1, respectively. However, the difference between the Aura and Kokemäki rivers does not increase commensurately. It is unclear why this is so. The discharge rates at the Halinen dike increased from 7.04 to 7.31 to 7.79 m3 s−1 during the same periods, which does not explain the discrepancy between the rivers either. Hence, the interannual differences between the rivers were caused by other factors than simply increased discharge rates.
As mentioned earlier, the Aura River had its first no-freeze event in 2008 and its second event in 2020. The average discharge rates for December, January and February in 2007/2008 and 2019/2020 were higher than in any other winter months in the period 1938–2020. None of these months contained the absolute highest recorded discharges, but these were the only years when the discharge rate was at least twice the long-term average in each month. This provides a plausible explanation for the no-freeze events on the Aura River. A similar pattern could not be observed for the Kokemäki River.
4.3 Climatic correlations
4.3.1 Break-ups according to monthly mean temperatures 1961–2020
The series exhibited strong and statistically significant negative correlations with winter and spring temperatures (Fig. 4). This indicates that increased spring temperatures have caused earlier break-ups (Fig. 5). The Aura River ice-offs exhibited particularly high correlations with February (−0.77) and March (−0.74) temperatures. The Kokemäki River break-ups also showed high correlations with these months, but the correlations were higher with March (−0.84) than February (−0.71). For the February–March period, the correlation was slightly higher for the Kokemäki River (−0.89) than for the Aura River (−0.86).
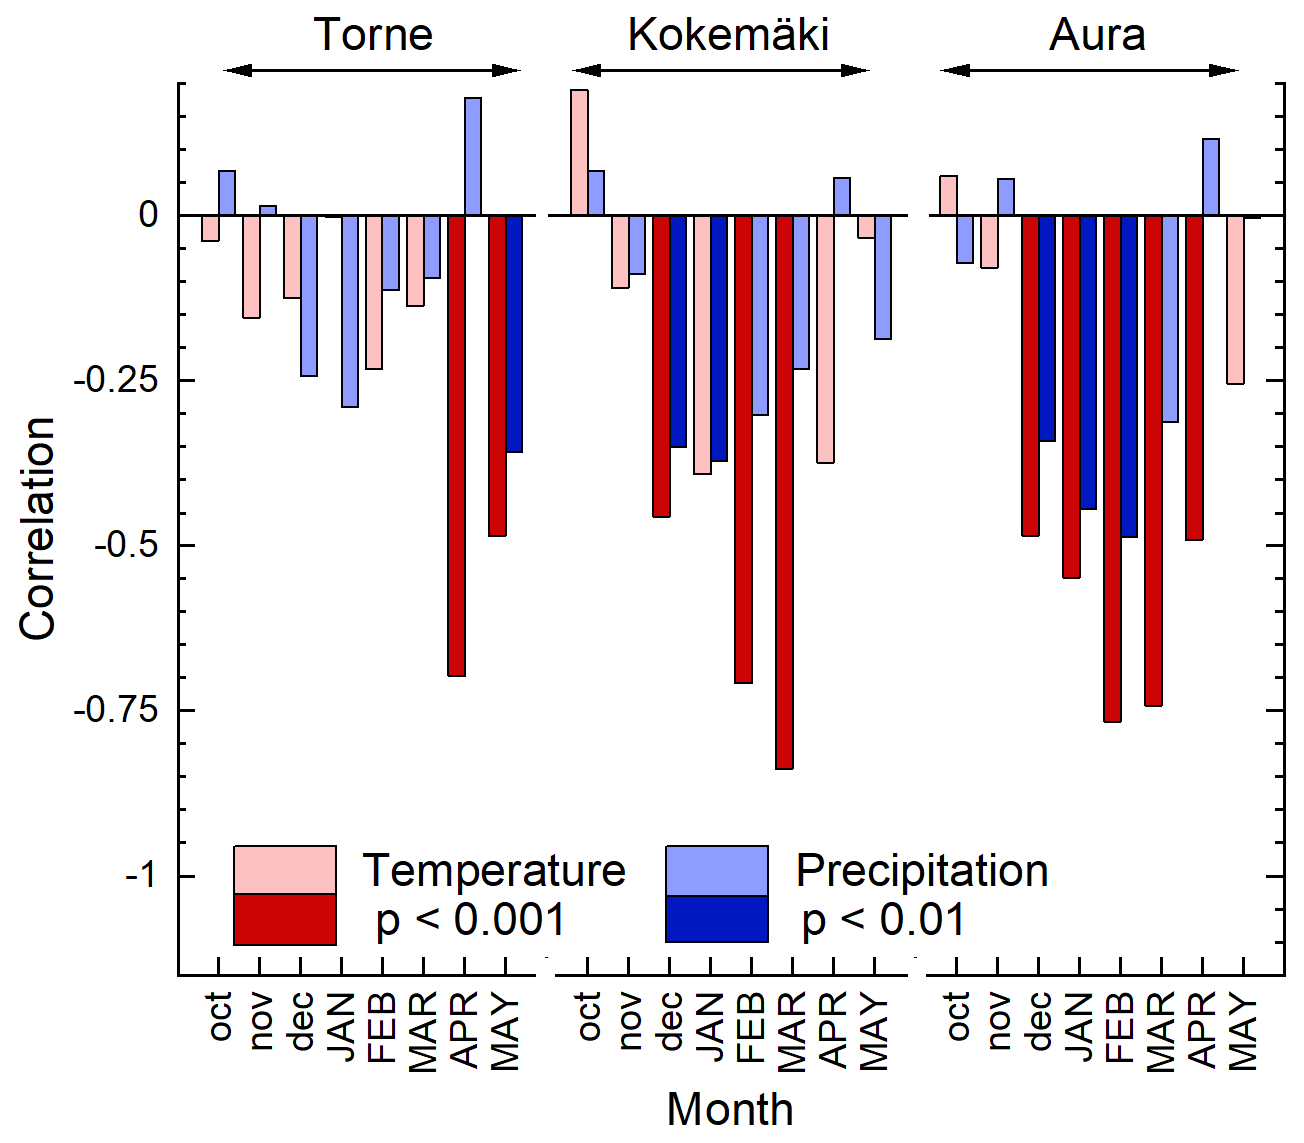
Figure 4The figure shows Spearman's correlation between temperature (red and pink), precipitation (dark and light blue) and ice break-up dates in the Torne and Kokemäki rivers and, respectively, the correlations between temperature (red and pink), precipitation (dark and light blue) and ice-off events in the Aura River, over the 1961–2020 period. The darker shaded red and blue colours indicate that the correlation is statistically significant. The capitalized letters indicate the change of year.
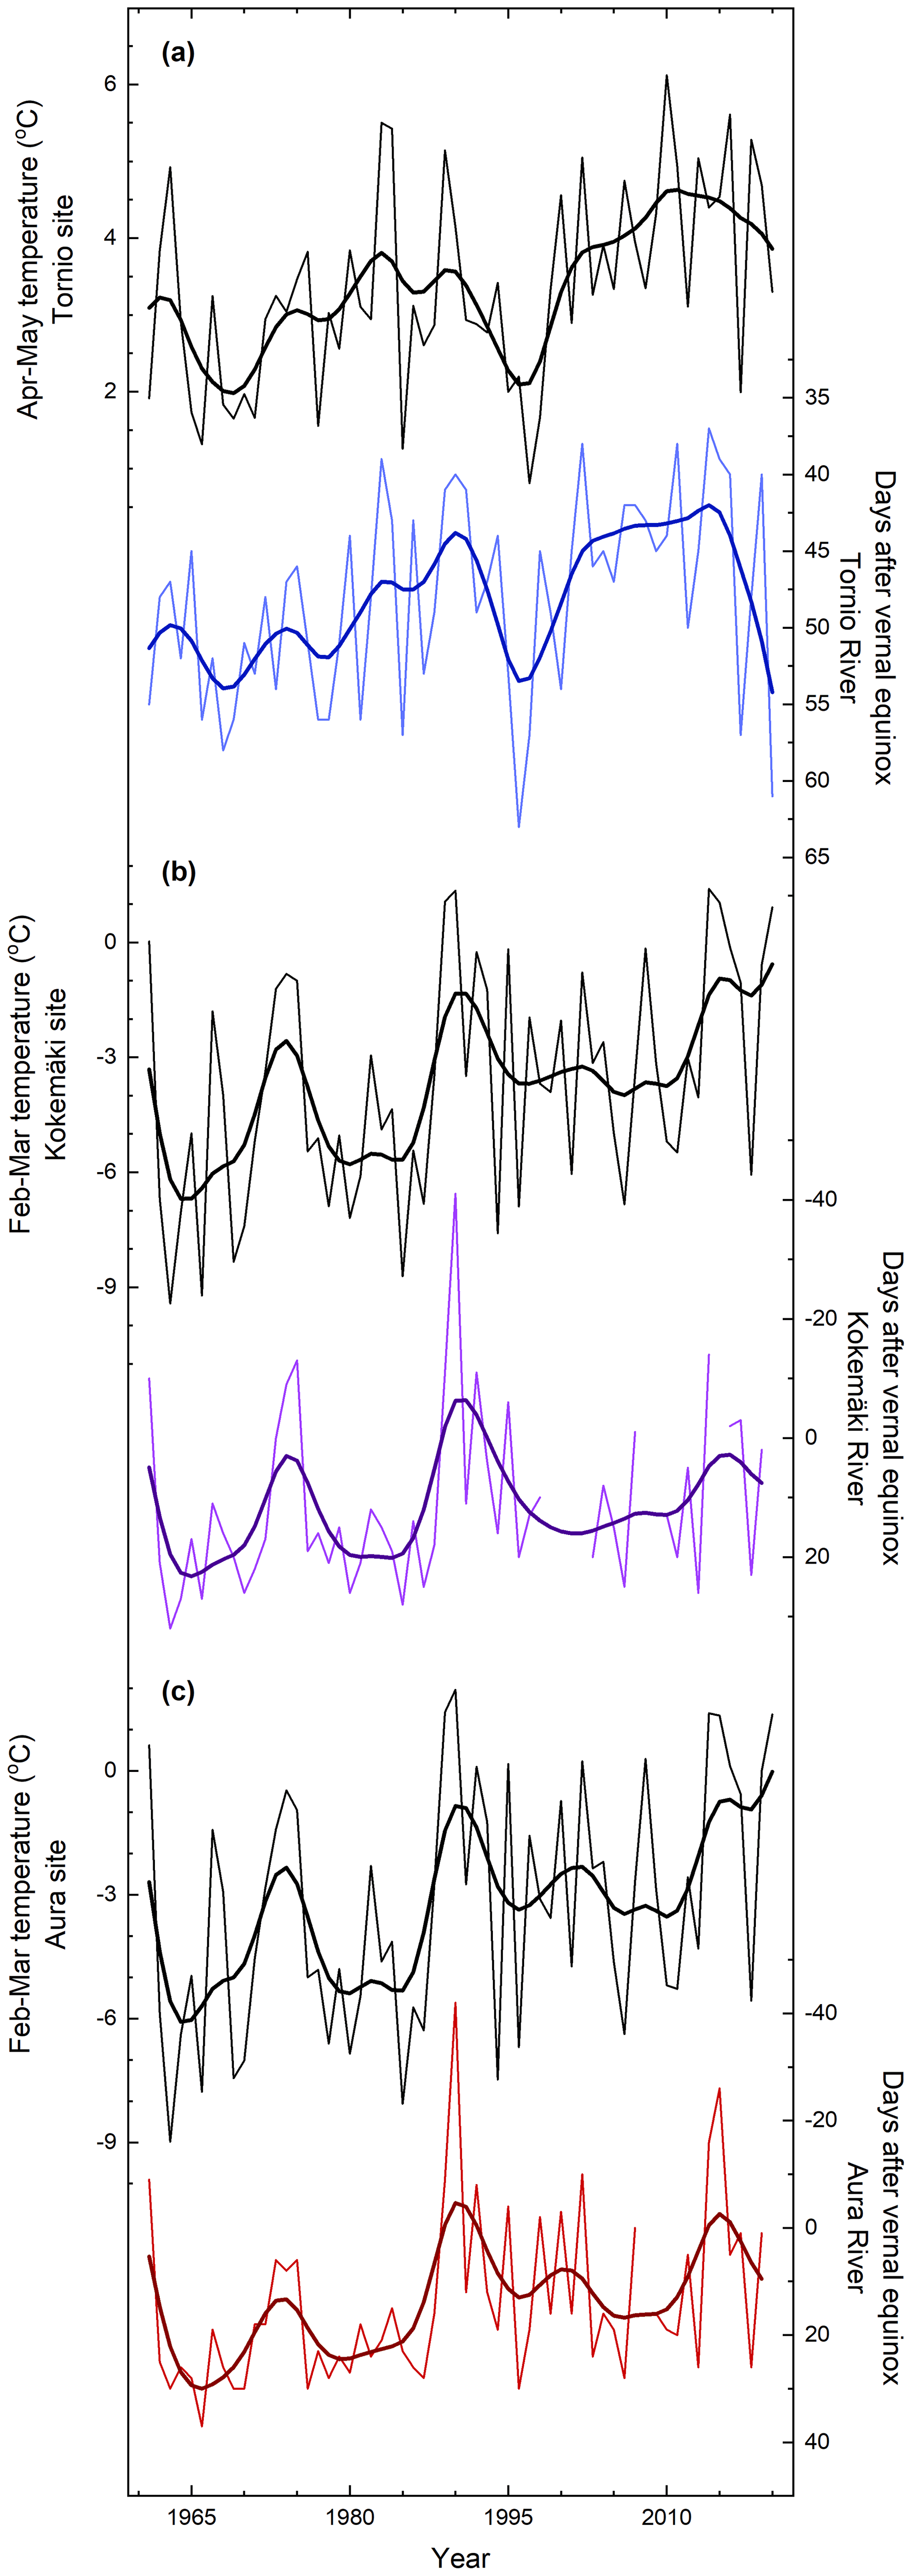
Figure 5Variations in mean spring temperature and ice break-ups. A comparison between the interpolated mean temperatures to the observation sites for the (a) Torne, (b) Kokemäki and (c) Aura rivers over 1960–2020 period. The observed break-up dates (thin line) were smoothed using a 10-year spline function (thick line) to illustrate decadal and longer variations. The axis that shows the break-up dates is inverted.
The Torne River break-ups occur later in spring than on the Aura and Kokemäki rivers. Most break-ups have occurred in late April or May, and since the 1960s they have occurred in late April or early May. The mean temperature correlations for the Torne River were therefore strongest with April (−0.70) and May (−0.49). The correlations were similar for the period April–May (−0.70).
4.3.2 Break-ups according to monthly mean precipitation 1961–2020
Correlations with winter and spring precipitation were mainly negative and considerably weaker than the correlations for temperature (Fig. 4). Nevertheless, the precipitation correlations for December and January were statistically significant for the Kokemäki and Aura rivers. On the Torne River the correlations were relatively strong, though non-significant. January showed the strongest correlations with the Kokemäki River break-up dates, February with the Aura River ice-off events and May with the Torne River ice break-ups. The Aura River ice-offs were thus the only events with the highest correlations for both temperature and precipitation in the same month.

Figure 6The lines show the temperature development 180 d before and 30 d after the break-up date in Tornio (Torne River) and Pori (Kokemäki River) and the ice-off event in Turku (Aura River). Zero (0) denotes the break-up and ice-off day in the respective rivers.
4.3.3 Break-ups according to daily mean temperatures 1961–2020
The break-up on the Torne River commonly begins approximately 3 months after the coldest winter days and when the daily mean temperature has reached approximately 4.6 ∘C (Fig. 6). This occurred, according to the data, when the daily maximum was close to 10 ∘C and the minimum above freezing point. In general, these conditions occurred approximately 20 d after the daily mean temperature had risen above freezing point.
By contrast, Kokemäki break-ups have typically begun at lower temperatures than break-ups on the Torne. In Pori, the break-ups usually begun 10 d after daily mean temperatures rose above freezing point. On the day of the break-up, the daily mean was generally around 2 ∘C and the maximum at 5 ∘C. The most noteworthy difference between Tornio and Pori was that the minimum temperature in Pori commonly oscillated above and below the freezing point even 3 weeks after the break-up. A similar pattern was visible in Turku, although temperatures did not fall below freezing point as consistently or as much as in Pori. The Turku ice-off event has regularly occurred 10 d after the daily mean has risen above freezing point, but at slightly higher temperatures than in Pori (mean 2.5 and maximum 7 ∘C). The post-event difference between the Aura and Kokemäki rivers may be an effect of the Harjavalta power plant. First, increased discharge rates cause an earlier break-up, after which, second, the discharge rates hinder the river from re-freezing.
4.3.4 Break-ups, ice thickness and snow cover in the Torne River
The negative trend (p < 0.05) and slope (−0.267) indicate that the ice on the Torne has become 14.5 cm thinner between 1966 and 2019. Over the same period, mean ice thickness was 77 cm and the break-up date 6 May (VE47, if the vernal equinox was on 20 March). The only significant correlation (p < 0.05) between break-up dates and mean ice-thickness was for April (rho 0.355, p < 0.012, 1966–2019, n = 49). The relationship between ice thickness and break-up dates is interesting. For example, the ice was 75 cm thick in 2014, the earliest break-up on record (VE37), but the ice was thinner and the break-up later on 22 occasions. One of these events occurred in 2020 (VE61), when the ice was too thin to be measured. However, measurements by another institution than SYKE reported that the ice was 55 cm thick in 2020 (this is discussed more in Sect. 5.1), which reveals the discrepancy between 2014 and 2020. Thicker snow cover could have maintained a higher surface albedo, thereby delaying the melting of the underlying ice and thus delaying the break-up (e.g. Prowse and Beltaos, 2002; Bieniek et al., 2011). However, SYKE has measured snow depth on the ice since 1978, and all correlations with the break-up date proved non-significant for the period 1978–2019.
Table 4Long-term change in the Torne (TR), Kokemäki (KR) and Aura (AR) river series. The table shows the Mann–Kendall statistic (MK), the associated statistical significance (p), the Sen slope (Sen's) and the number of years (n) over which the statistics were calculated. The periods are (a) the hydroelectric power plant period in the Kokemäki River (1939–2020), (b) the period common to all three series (1793–2020), (c) the period common to the Torne and Aura series (1749–2020), (d) the entire length of the Torne River series (1693–2020), and (e) the period for which all rivers have recorded observations (1793–1998).
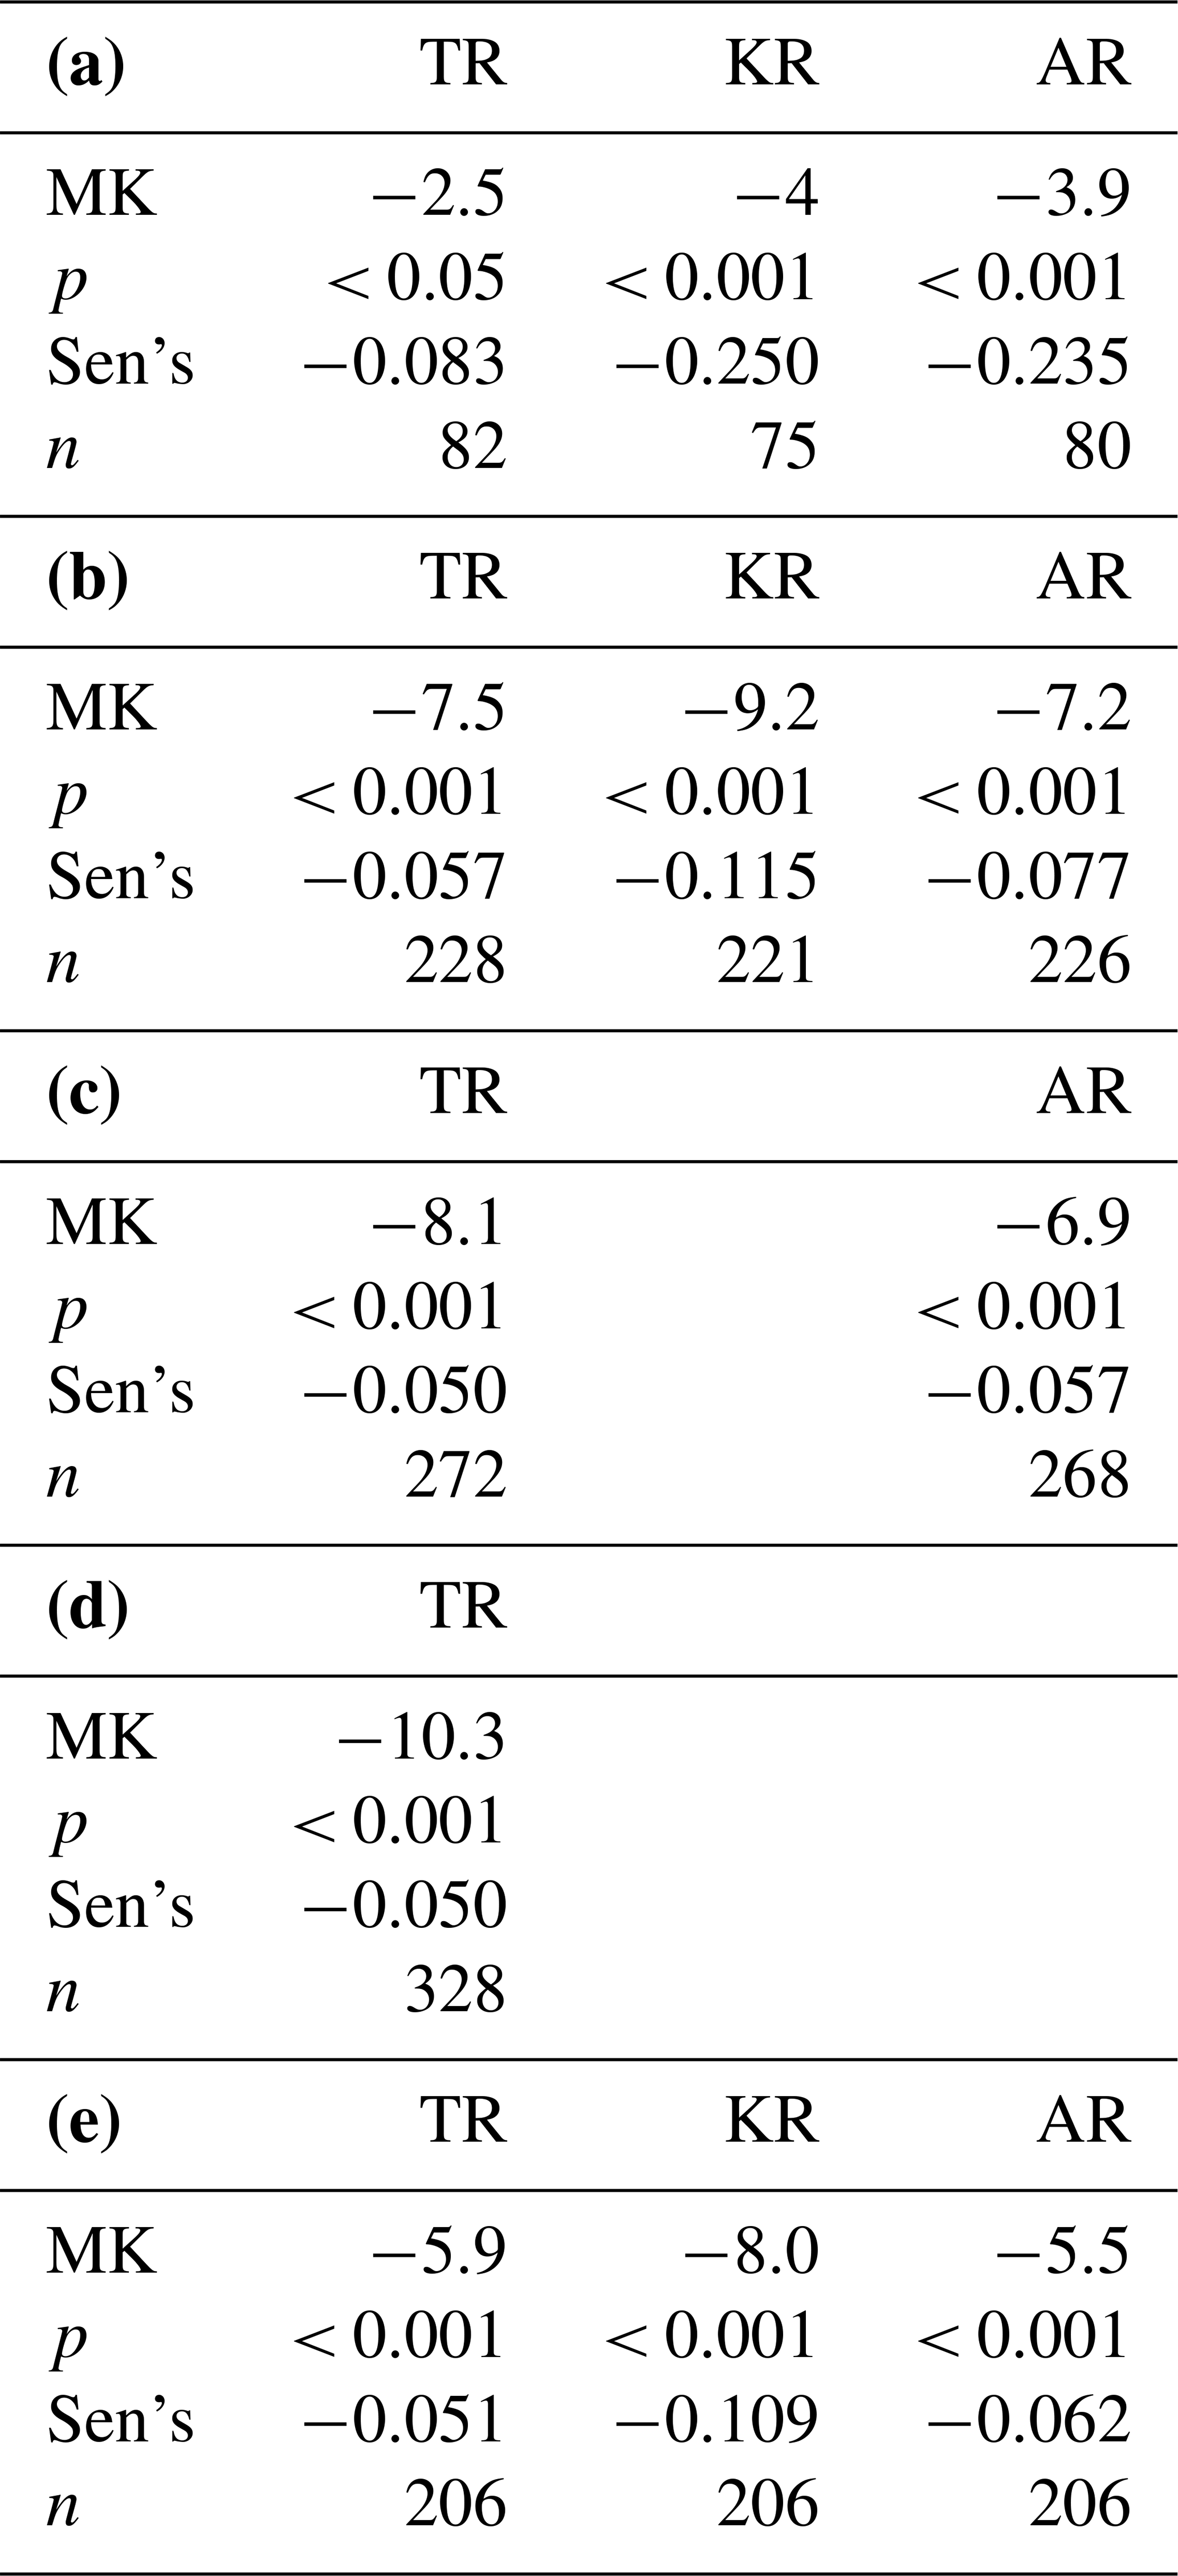

Figure 7Ice break-up dates relative to the vernal equinox on (a) the Torne and (b) Kokemäki rivers, and the ice-off dates in (c) the Aura River. The obtained dates (thin line) were smoothed to illustrate decadal and longer variations using a 10-year sling function (thick line).
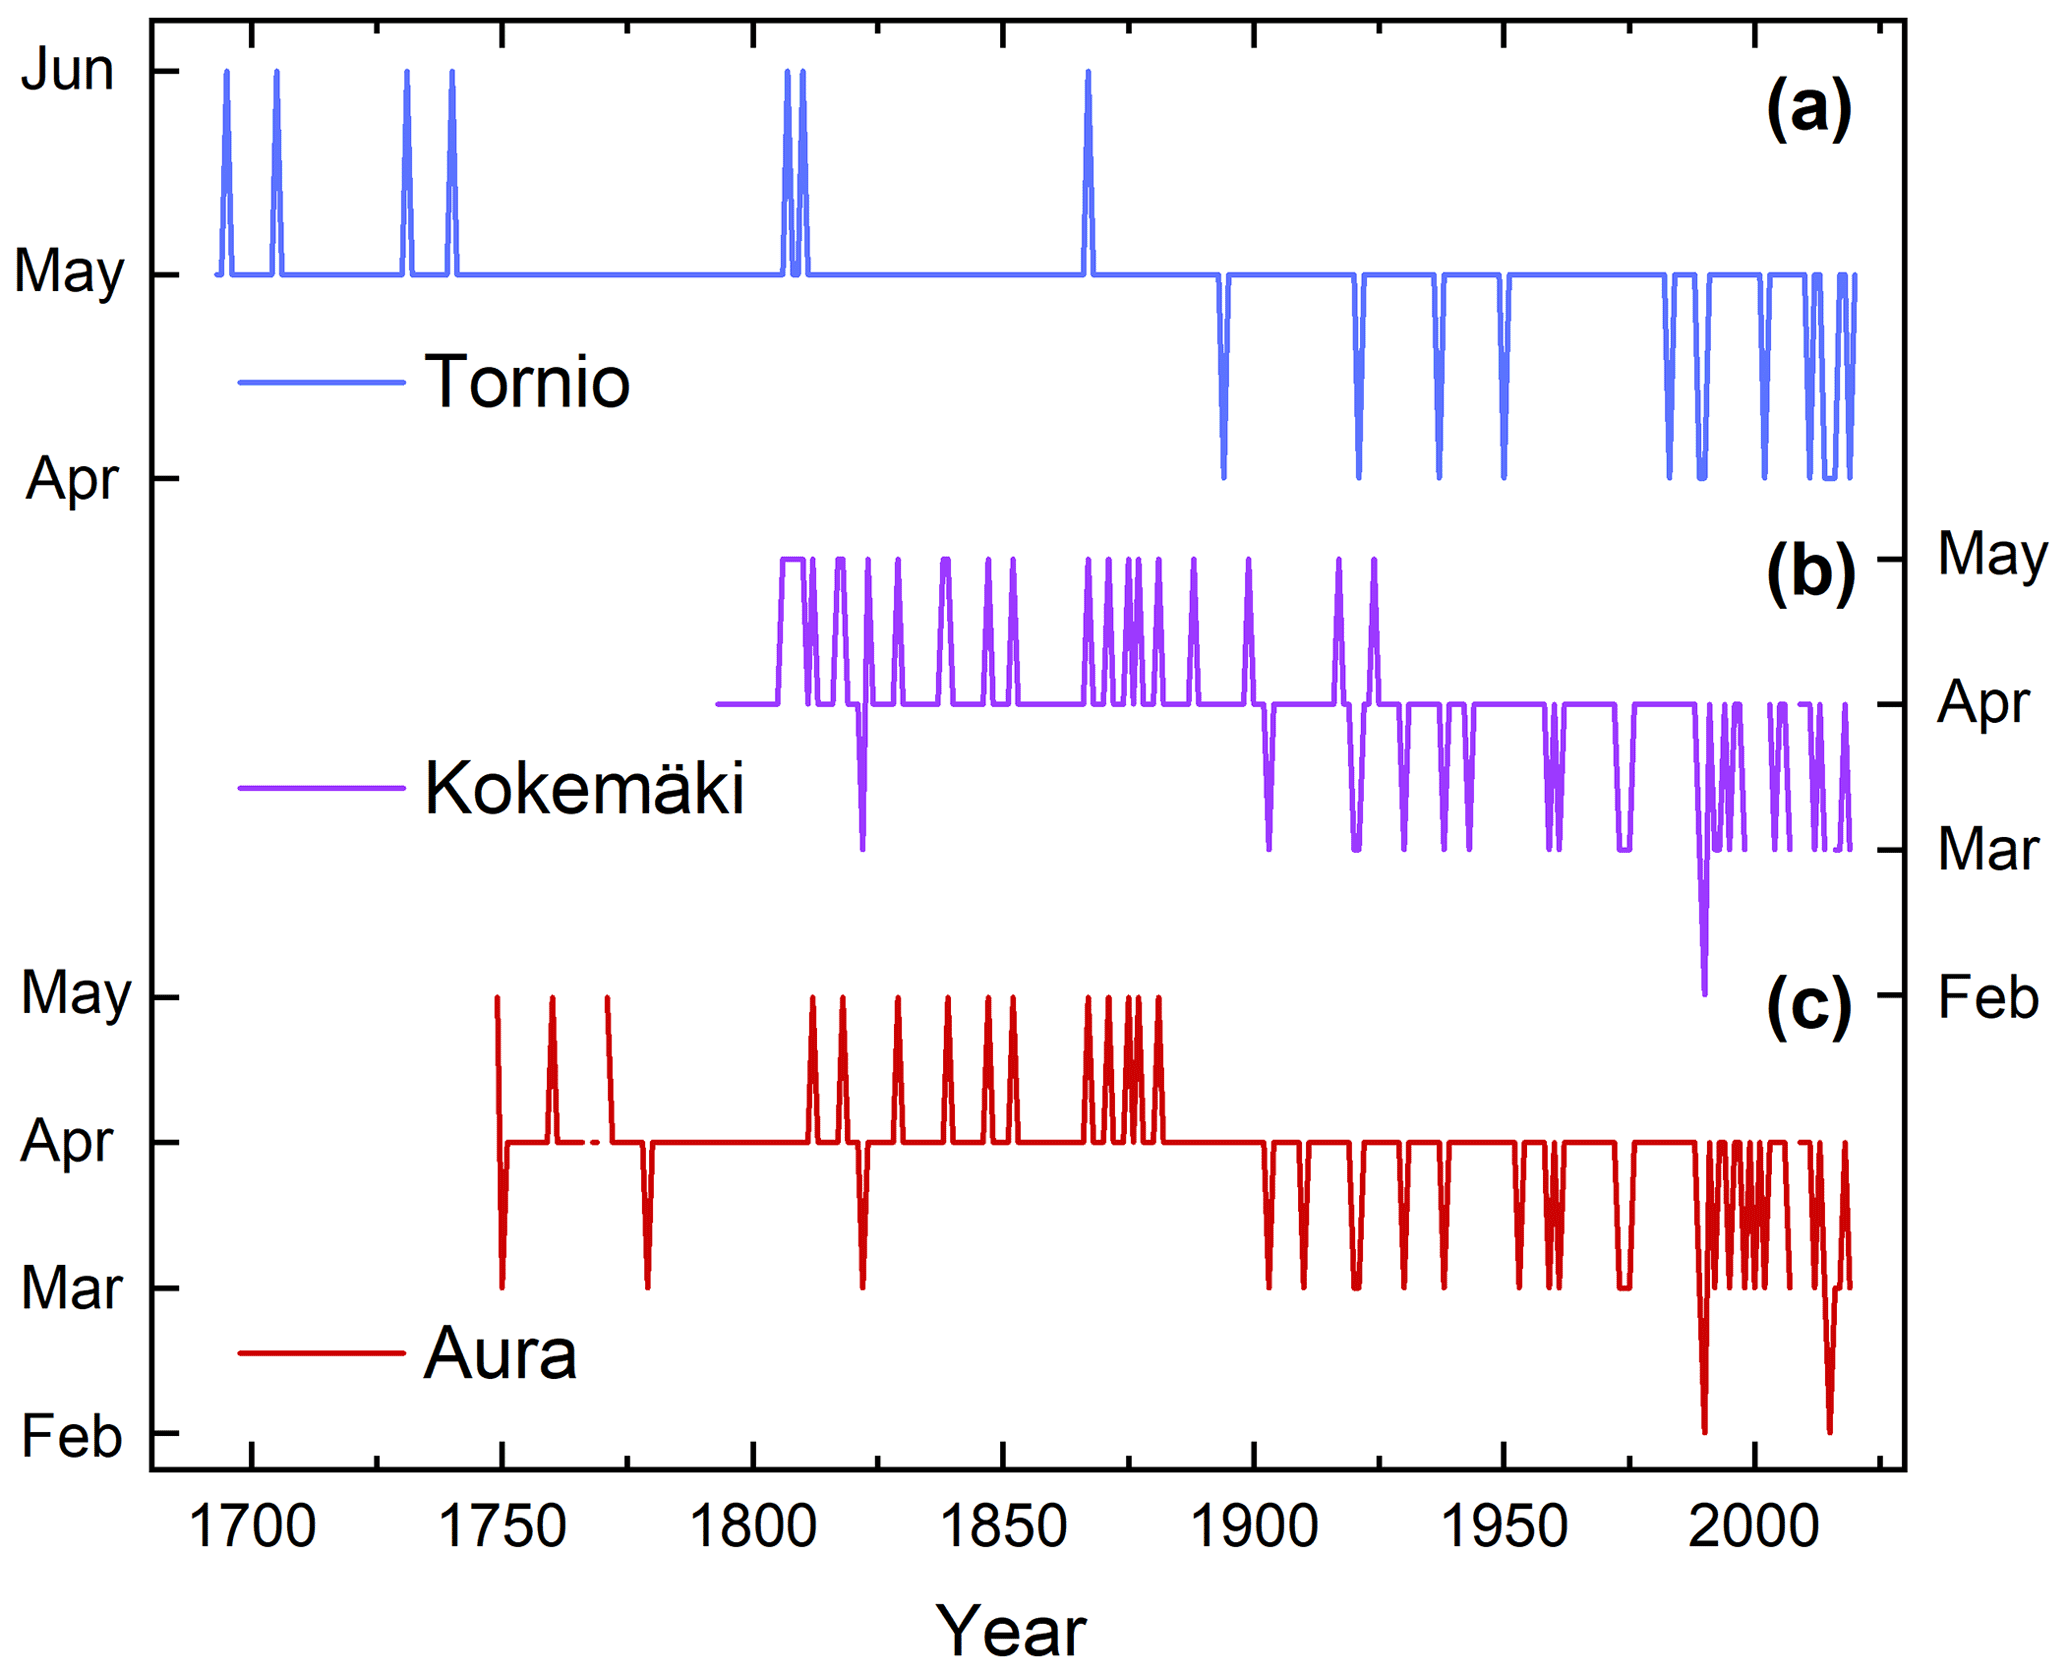
Figure 8Occurrence of ice break-up events in February, March, April, May, and June on (a) the Torne River and (b) the Kokemäki River, and the corresponding ice-off events for (c) the Aura River.
4.4 Temporal trends
The data series for all three rivers show negative break-up trends (Table 4, Fig. 7). Break-ups are withdrawing towards the beginning of the year, and it is now over 140 years since the last May event on the Aura River and almost 100 years since last May event on the Kokemäki River (Fig. 8).
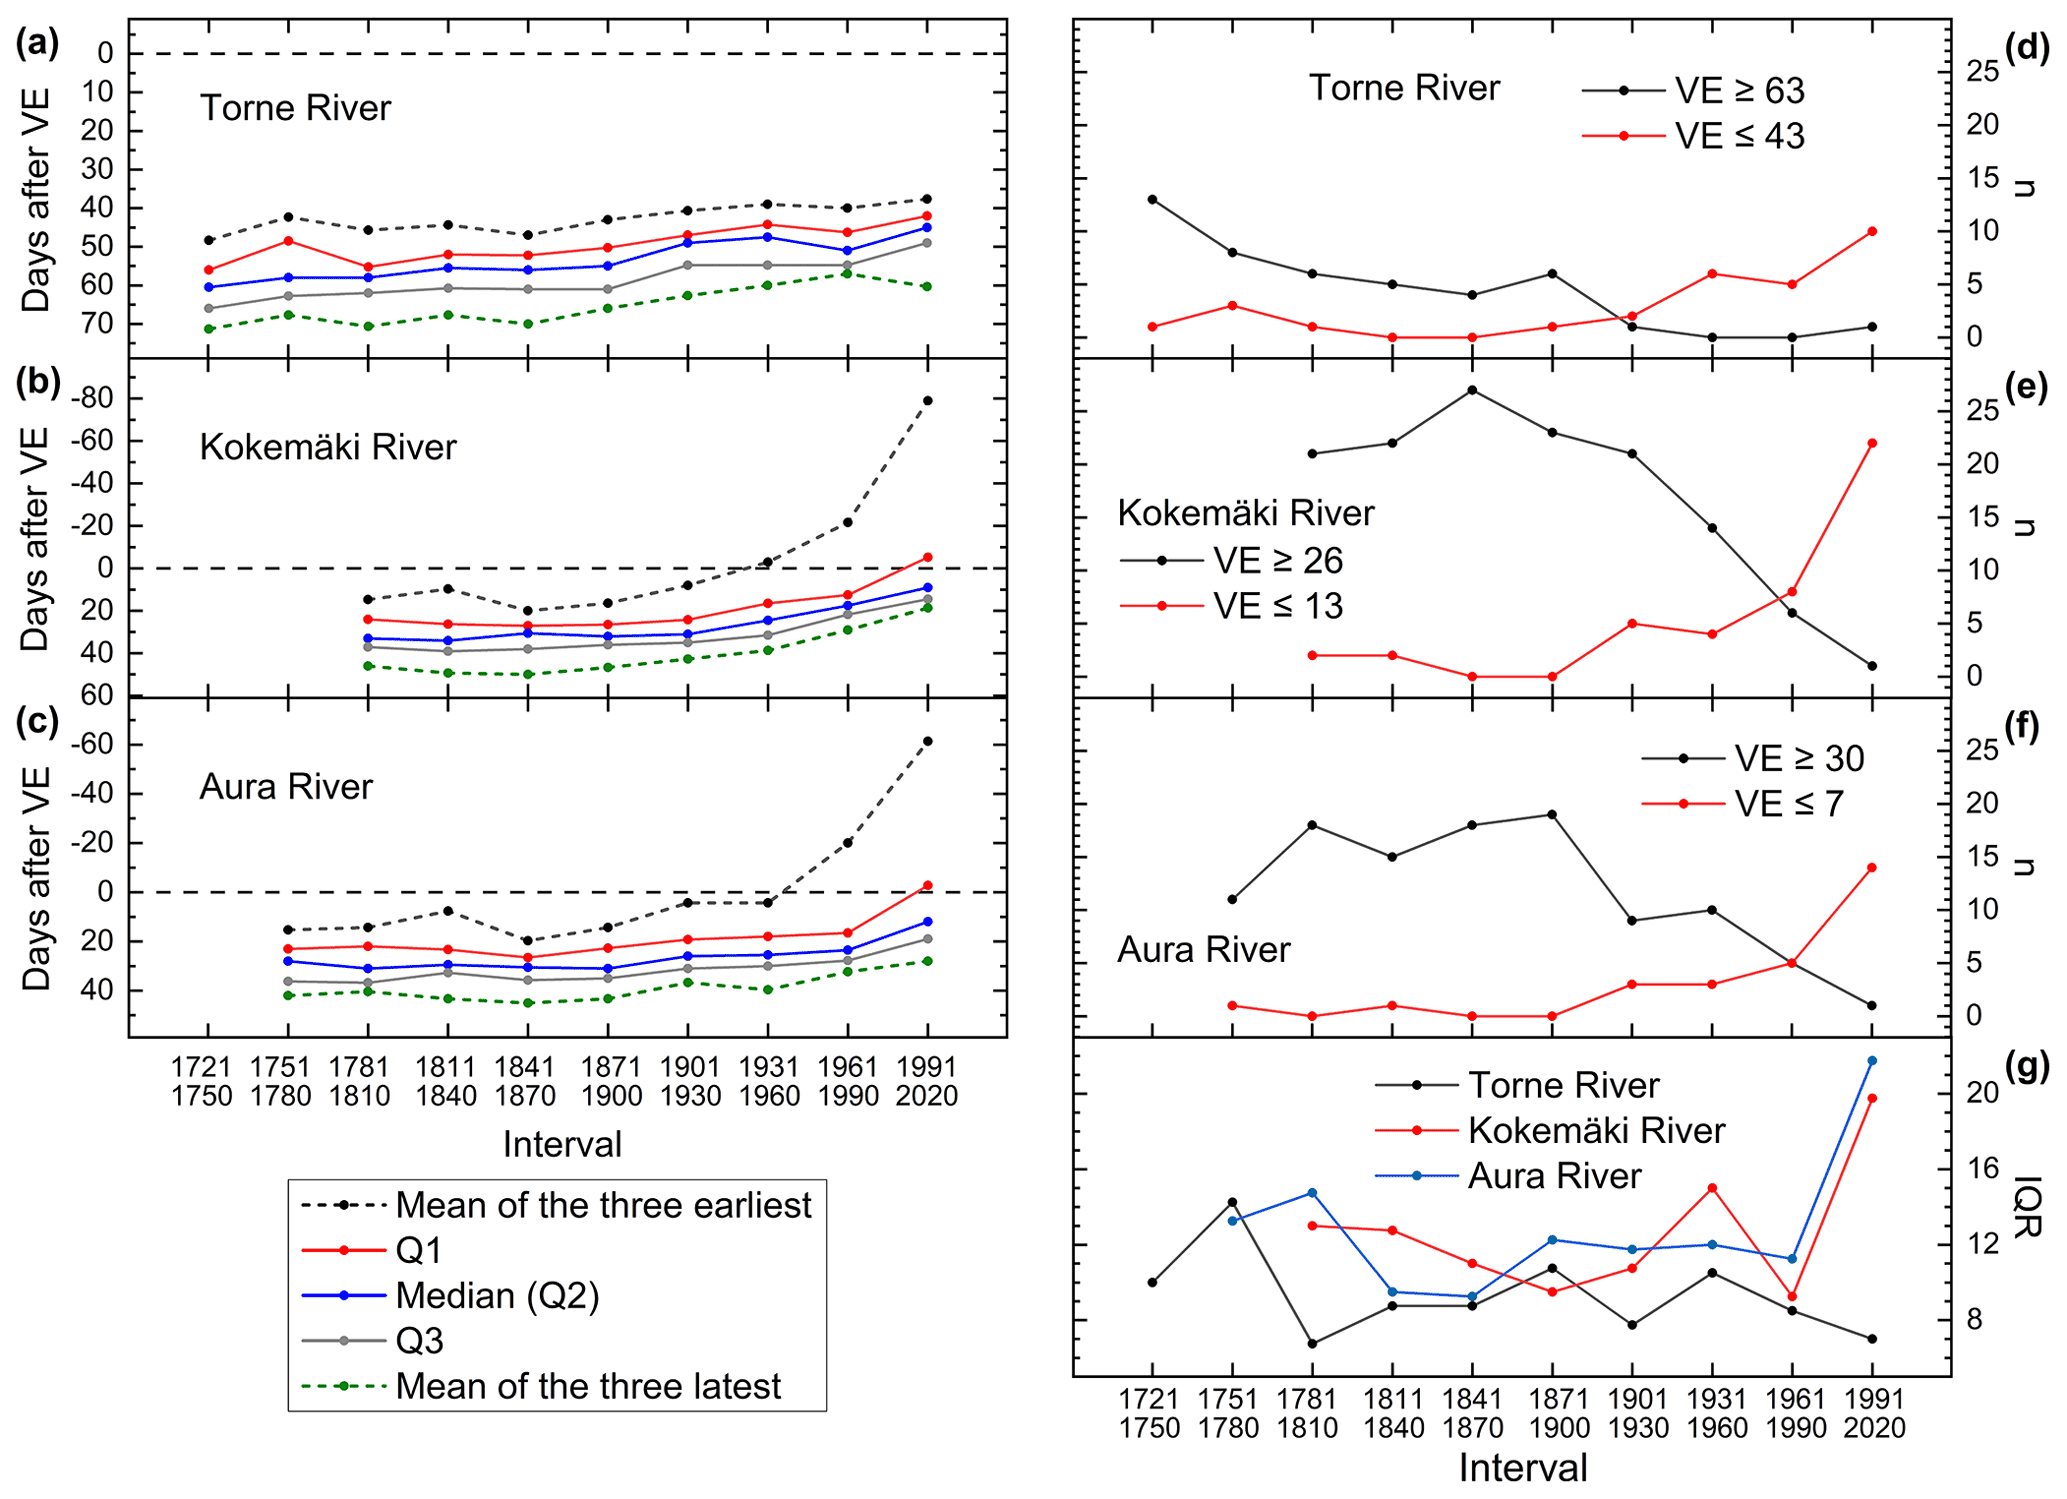
Figure 9Ice break-ups on the Torne and Kokemäki rivers and ice-offs on the Aura River according to the vernal equinox (VE) in 30-year non-overlapping periods. The dotted line (0) in panels (a)–(c) marks the vernal equinox. The values are obtained from analysing the quartiles of each series in each period. Panels (d)–(f) show the frequency of early and late events in each river. For more details on how these were chosen, see methods. Panel (g) shows the interquartile range in each period.
Over the period 1793–2020, the slopes for the Kokemäki River (26.2 d) and the Aura River (17.4 d) diverged. By contrast, the development on the Aura River was similar to that on the Torne (13.0 d). The rate of change remained similar on the Aura (15.3 d) and Torne (13.6) rivers between 1749 and 2020. Taken together, the similarities in change between the Aura and Torne imply that the change in the Kokemäki River may be skewed. Nonetheless, the Kokemäki River experienced more late events than the Aura and Torne in the 1800s and early 1900s (Fig. 9). Hence, the diverging trends for the Kokemäki River may be attributed to a greater change in late rather than early events.
Over the period 1939–2020, break-up trends were pronounced for both the Kokemäki and Aura, with a change of almost 3 weeks for both rivers. The Torne River's slope, on the other hand, indicated a change of less than 1 week, which underscores the difference between the south and north.
4.5 Variability and extremes in 30-year non-overlapping periods
4.5.1 Frequency of early and late events
The long-term frequency of extremely early events has increased while late events have decreased on all three rivers (Fig. 9d–f). The first increase in early events occurred between 1901 and 1930, but the most rapid increase took place between 1991 and 2020. For all three rivers, the extremely early break-ups that occurred once in the first period constitute at least one-third of all events in the period 1991–2020.
The decrease in late events during the period 1901–1930 is pivotal for the Aura and Torne rivers. In Turku, the press reacted to the earliness of the break-up events (Norrgård, 2020), and four distinct, but quite mild, midwinter break-ups in November and December were reported between 1903 and 1906. Moreover, Benson et al. (2012) noted that there were lakes that had their first no-freeze events in the early 1900s. These events are likely to have been caused by the period sometimes referred to as the early twentieth century warming, which is estimated to have occurred between the 1890s and 1940s (e.g. Hegerl et al., 2018). On the Kokemäki River, however, a decrease in late events did not occur until after 1931 (Fig. 9e).
The average of the three earliest events on the Kokemäki and Aura rivers changed considerably after 1991 (Fig. 9a–c). This development was driven by the no-freeze events and several events in early March and February (Fig. 8). By contrast, for the Torne River (Fig. 9a), the change in early extremes was negligible. This explains why there is a 12 d range within the 75 percentiles for the Torne River while that range is over 90 d for the Aura and Kokemäki rivers. It should be noted that while the average of the late extremes have increased in the Torne River series, the mean is primarily affected by two of the latest break-ups in almost 100 years, which occurred in 1996 and 2020.
4.5.2 Variability within the quartiles
For the Torne River, the quartiles show that an increase in early events can increase and decrease variance in the interquartile range (IQR). The IQR showed greatest variability in the period 1751–1780, and this was caused by an increase in early events within the 25 percentiles (Fig. 9g). Variability remained stable after 1840, but a slight decrease in variability, caused by a rapid increase in early break-ups, occurred after 1960. The increase in earlier break-ups has thereafter been rapid. All break-ups within the 75 percentiles between 1991 and 2020 occurred before the median break-up date in the previous period (Fig. 9a).
For the Aura River, the magnitude of change is unprecedented: 28 of 30 ice-off events between 1991 and 2020 occurred before the median ice-off date in the period 1961–1990. Moreover, the latest ice-off event in the period 1991–2020 occurred 7 d earlier than in the previous period. The IQR for the Aura and Kokemäki rivers also increased considerably after 1991. For the Aura River, the IQR doubled from 11 d in the period 1961–1990 to 22 d in the period 1991–2020. On the Kokemäki River, the change was from 9.25 to 18.5 d. The increase in variance, for both rivers, was caused by a rapid rise in the number of early events. All events within the 25 percentiles occurred before the vernal equinox (Fig. 9b–e).
5.1 Changes since 1900
The key feature describing the break-up patterns on the Aura and Kokemäki rivers the last 30 years was the increase in interannual variability. The time span between the freeze-up and break-ups has progressively shortened, and, exacerbated by a general warming trend, the first no-freeze events occurred on the Aura (2008 and 2020) and the Kokemäki (2008, 2015, 2020) rivers. The no-freeze events took place during the warmest and wettest winters on record (Lehtonen, 2021; Irannezhad et al., 2014; FMI, 2016; Ilkka et al., 2012). The 2008 no-freeze event on the Aura River can most likely be ascribed to increased winter discharge caused by higher temperatures and precipitation. In February 2020, there were some days when the river was close to getting a complete ice cover (author's observations), but the window of opportunity was short, and small sections of the river never froze completely. The contrast to Pori is noteworthy because the Kokemäki River flooded, with the discharge peaking at 656.59 m3 s−1 on 24 February.
The losses of river ice are historically unique events in Finland. Socioeconomically and culturally, the impact is meager. Citizens and businesses, in for example Turku, stopped being dependent and exploiting the ice in the 1900s. Nowadays, the ice is often considered too weak to walk on, and many have progressively alienated themselves from the river ice. Where once people relied on the ice to get across the river, it is now almost considered an exotic event if the ice is strong enough to walk on. Whether the Aura and Kokemäki rivers are partially frozen or completely ice-free in the future will depend on the return period of climatic extremes (Fischer et al., 2021). However, the occurrence of these events follows the development in certain lakes where ice-free years already are becoming more frequent (Sharma et al., 2021; Filazzola et al., 2020). Overall, the changes in the Aura and Kokemäki rivers suggest that the warmer climate that is dominating in the south has changed more rapidly and in greater magnitude than the colder climate dominating in the north. A similar latitudinal shift has been noticed in Swedish lakes (Hallerbäck et al., 2021; Weyhenmeyer et al., 2005).
There are uncertainties related to the reliability of the Kokemäki River series. First, the dates from the break-up guessing competition on the Kokemäki River are not fully comparable to the break-up dates before 1998. Observations of the actual break-up would improve the series. Second, we could not establish with certainty to what extent the Harjavalta power plant changed the timing of the break-up in Pori, even though it is evident that increased discharge rates have affected the ice regime. Finally, the largest shift in the timing of the break-ups occurred post 1959, two decades after the power plant was constructed. The change in the break-up process, however, was tangible, as evidenced by a 1972 interview in Satakunnan Kansa, where a 70-year-old man who had lived his entire life by the river remarked that a distinct change in the break-up process occurred about a decade earlier. As noted by SK, the ice started melting in the middle of the river, regardless of winter severity.
On the Torne River, the shift towards earlier break-ups has progressed in two stages. The first stage began during the period 1901–1931, while the second stage started in the 1990s. Unlike on the Aura and Kokemäki rivers, extremely early break-ups on the Torne have not progressively approached the freeze-up date. The earliest recorded break-up event occurred in the 2000s, and it was only 1 week earlier than the earliest in the 1700s. Instead, the timing of break-ups has changed such that 25 of the last 30 events occurred within the same 12 d period between 1991 and 2020. This indicates that April temperatures predetermine the break-up date. Future changes in variability and extremes therefore depend on whether warming is greater in the winter or spring (see Ruosteenoja et al., 2020; Mikkonen et al., 2015).
The event in 2020 was the second latest break-up in 100 years on the Torne River. This was surprising, considering that the 2019/2020 winter was one of the warmest on record. While temperatures were closer to normal in Lapland and came with an excess of snow, the mean temperature was 2–5 ∘C above the long-term mean (Lehtonen, 2021). Only the mean temperature for April (0.1 ∘C) was lower than the long-term mean (0.4 ∘C). This could have been decisive for the break-up, as our dynamic analysis highlighted the importance of thermal input before the break-up. At least, it should be recognized that ice thickness did not cause the late break-up. In March 2020, the national broadcasting company (YLE) reported that the Centre for Economic Development, Transport and the Environment (ELY) had measured the ice at 55 cm about 3 km downstream from the break-up site. This was almost 20 cm thinner than the long-term mean at the break-up site (1966–2019, n = 54, 73 cm). Moreover, it was 20 cm thinner than during the early break-up of 2014 (75 cm) and 45 cm thinner than the record late break-up in 1996 (90 cm). As our analysis demonstrated, ice thickness in March was non-significant for the break-up date, but it should be noted that, in Lapland, warmer winters do not necessarily correlate with early break-ups.
5.2 Changes before 1900
The first half of the 1700s was the coldest period on the Torne River, and this is only matched by the lateness of events in all three rivers around the 1810s. Figure 7 indicates that this represents one of the coldest periods at all sites. Previous research has identified this as one of the coldest periods in Haparanda (Klingbjer and Moberg, 2003) and Stockholm (Leijonhufvud et al., 2010) but also in other parts of Europe. Our series therefore mirror the colder periods at other sites. Some have argued that an unidentified volcanic eruption in 1809 (Toohey and Sigl, 2017) and the Tambora eruption in 1815 caused a colder decade between 1810 and 1819 (Cole-Dai et al., 2009). A detailed assessment of the forcing factors behind this colder decade remains beyond the scope of this article. However, our data indicated that 1807 produced a late break-up at all sites, and, furthermore, Table 2 shows that there were several late events during the first decade of the 1800s. These could be independent events or imply the presence of other forcing factors, such as the Dalton Minimum (1800–1824).
The data for the Aura, Kokemäki and Torne rivers diverged with regard to the lateness of the break-up event in 1852. The Aura River experienced one of the latest ice-off events, while the Torne River's break-up was not even amongst the 100 latest. There are several observations to confirm the validity of the Aura River event, which is why we choose to cross-check the event in 1852 with the previously mentioned the Porvoo, Neva and Dvina rivers (Johansson, 1932; Rykatschew, 1887). The three latest events on the Neva River series occurred in 1810, 1852 and 1807, whereas the latest events on the Porvoo River occurred in 1852, 1867 and 1810. In turn, the three latest break-ups on the Northern Dvina were in 1867, 1845 and 1855. Thus, the event in 1852 was late in all rivers except the Torne and Dvina. Moreover, the event in 1822 was exceptionally early on all rivers except the Torne and Dvina. There is therefore a distinct difference between the rivers in the north and the south when it comes to 1822 and 1852. These discrepancies could be explained by, for instance, atmospheric blocking events. Nonetheless, the break-up events of 1867 and 1810 were among the top 10 latest for five of the six rivers (Dvina, Kokemäki, Neva, Porvoo and Torne).
We presented a new ice break-up series for the Kokemäki River in Pori (1793–2020) and compared it to the existing series for the Aura River (1749–2020), in southwest Finland, and the Torne River (1693–2020), in Lapland. Our analyses showed a trend towards earlier break-ups in all three series. However, that change was manifested differently on the Torne River compared to the Aura and Kokemäki rivers. On the Torne River, the earliest recorded break-up has changed only slightly over the last 100 years. The Aura and Kokemäki rivers, on the other hand, recorded their first no-freeze events in the 2000s. These events express the most radical form of change for rivers that, from a historical perspective, used to freeze up every winter. On the Aura River, it appears that no-freeze events occur due to higher winter temperatures and increased winter discharge. However, this speculative suggestion requires further research. Finally, the overall trend in the timing of ice break-ups correlates with the warming trend confirmed by instrumental observations, with the events in 2008 and 2020 occurring during the two warmest winters ever recorded in the history of meteorological observations in Finland.
The Torne River series, the discharge data and ice thickness data are managed by the Finnish Environment Institute (SYKE) and are available from their Hertta database. Temperature data are managed by the Finnish Meteorological Institute. The data for the Aura and Kokemäki rivers can be accessed through the following link: https://doi.org/10.5281/zenodo.6670163 (Norrgård, 2022).
SN co-designed this research, wrote and edited the manuscript, and collected and obtained as well as coded and transcribed the metadata (the ice break-up observations) for the Kokemäki River. SN also collected the data and observations for the Aura River and obtained the Torne River series from the Finnish Environment Institute. SN did the qualitative analysis and tables and performed the power plant analysis, the discharge analysis and the correlation analysis. SH contributed to the writing and editing of the manuscript and all analyses. SH performed the trend and climate analysis and made the figures and adjoining tables.
The contact author has declared that neither of the authors has any competing interests.
Publisher's note: Copernicus Publications remains neutral with regard to jurisdictional claims in published maps and institutional affiliations.
The authors would like to thank the Finnish Environment Institute and Satakunnan Kansa for their cooperation. The authors would also like to thank the personnel at the city archives in Pori and the library staff at the University of Turku newspaper affiliate in Raisio for their assistance. Stefan Norrgård was supported by the Swedish Literary Foundation and Fonden till Hedvigs Minne at Åbo Akademi University. Samuli Helama was supported by the Academy of Finland (grant no. 339788).
This research has been supported by the Svenska Litteratursällskapet i Finland (grant no. 3610), the Stiftelsen för Åbo Akademi (grant no. 19/2021) and the Academy of Finland (grant no. 339788).
This paper was edited by Chris Derksen and reviewed by three anonymous referees.
Aalto, J., Pirinen, P., Heikkinen, J., and Venäläinen, A.: Spatial interpolation of monthly climate data for Finland: comparing the performance of kriging and generalized additive models, Theor. Appl. Climatol., 112, 99–111, https://doi.org/10.1007/s00704-012-0716-9, 2013.
Aalto, J., Pirinen, P., and Jylhä, K.: New gridded daily climatology of Finland: Permutation-based uncertainty estimates and temporal trends in climate, J. Geophys. Res.-Atmos., 121, 3807–3823, https://doi.org/10.1002/2015jd024651, 2016.
Beltaos, S. and Prowse, T.: River-ice hydrology in a shrinking cryosphere, Hydrol. Process, 23, 122–144, https://doi.org/10.1002/hyp.7165, 2009.
Benson, B. J., Magnuson, J. J., Jensen, O. P., Card, V. M., Hodgkins, G., Korhonen, J., Livingstone, D. M., Stewart, K. M., Weyhenmeyer, G. A., and Granin, N. G.: Extreme events, trends, and variability in Northern Hemisphere lake-ice phenology (1855–2005), Climatic Change, 112, 299–323, https://doi.org/10.1007/s10584-011-0212-8, 2012.
Bieniek, P. A., Bhatt, U. S., Rundquist, L. A., Lindsey, S. D., and Zhang, X. D.: Large-Scale Climate Controls of Interior Alaska River Ice Breakup, J. Climate, 24, 286–297, https://doi.org/10.1175/2010jcli3809.1, 2011.
Bonsal, B. R. and Prowse, T. D.: Trends and variability in spring and autumn 0 ∘C-isotherm dates over Canada, Climatic Change, 57, 341–358, https://doi.org/10.1023/a:1022810531237, 2003.
Cole-Dai, J., Ferris, D., Lanciki, A., Savarino, J., Baroni, M., and Thiemens, M.: Cold decade (AD 1810–1819) caused by Tambora (1815) and another (1809) stratospheric volcanic eruption, Geophys. Res. Lett., 36, L22703, https://doi.org/10.1029/2009GL040882, 2009.
Eklöf, J. H.: Jäänlähtö-ajaat Kokemäen virassa vuosina 1801–1849, todenvaihe-laskulla. Suomi. Tidskrift i Fosterländska ämnen. 1849, 9, 189–196, Finska Litteratur-Sällskapets Förlag, Helsingfors, 1850.
Filazzola, A., Blagrave, K., Imrit, M. A., and Sharma, S.: Climate Change Drives Increases in Extreme Events for Lake Ice in the Northern Hemisphere, Geophys. Res. Lett., 47, e2020GL089608, https://doi.org/10.1029/2020gl089608, 2020.
Finnish Meteorological Institute (FMI): Year 2015 was the warmest in records, https://en.ilmatieteenlaitos.fi/press-release/132036967 (last access: 7 October 2021), 2016.
Fischer, E. M., Sippel, S., and Knutti, R.: Increasing probability of record-shattering climate extremes, Nat. Clim. Change, 11, 689–695, https://doi.org/10.1038/s41558-021-01092-9, 2021.
Gagnon, A. S. and Gough, W. A.: Trends in the dates of ice freeze-up and breakup over Hudson Bay, Canada, Arctic, 58, 370–382, https://doi.org/10.14430/arctic451, 2005.
Gagnon, A. S. and Gough, W. A.: East-west asymmetry in long-term trends of landfast ice thickness in the Hudson Bay region, Canada, Clim. Res., 32, 177–186, https://doi.org/10.3354/cr032177, 2006.
Hallerbäck, S., Huning, L. S., Love, C., Persson, M., Stensen, K., Gustafsson, D., and AghaKouchak, A.: Climate warming shortens ice durations and alters freeze and break-up patterns in Swedish water bodies, The Cryosphere, 16, 2493–2503, https://doi.org/10.5194/tc-16-2493-2022, 2022.
Hällström, G. G.: Mutati Currente Saeculo Temporis, quo glacies fluminum Annuae Dissolutae sunt, Acta Soc. Scient. Fenn., 129–150, 1842.
Hegerl, G. C., Bronnimann, S., Schurer, A., and Cowan, T.: The early 20th century warming: Anomalies, causes, and consequences, WIREs Clim. Change, 9, e522, https://doi.org/10.1002/wcc.522, 2018.
Helama, S., Tolvanen, A., Karhu, J., Poikolainen, J., and Kubin, E.: Finnish National Phenological Network 1997-2017: from observations to trend detection, Int. J. Biometeorol., 64, 1783–1793, https://doi.org/10.1007/s00484-020-01961-6, 2020.
Huokuna, M.: Ice Jams in Pori, CGU HS Committee on River Ice processes and the Environment, in: 14th Workshop on the Hydraulics of ice Covered Rivers, Quebec City, Canada, 19–22 June 2007, http://www.cripe.ca/docs/proceedings/14/Huokuna-2007.pdf (last access: 13 July 2022), 2007.
Ilkka, J., Heikki, T., and Väinö, N.: The variability of winter temperature, its impacts on society, and the potential use of seasonal forecasts in Finland, Weather, 67, 328–332, https://doi.org/10.1002/wea.1971, 2012.
Irannezhad, M., Marttila, H., and Klove, B.: Long-term variations and trends in precipitation in Finland, Int. J. Climatol., 34, 3139–3153, https://doi.org/10.1002/joc.3902, 2014.
Johansson, O. V.: Isförhållanden vid Uleåborg och i Torne älv, Fennia, 64, 1–44, 1932.
Kajander, J.: Methodological Aspects on River Cryophenology Exemplified by a Tricentennial Break-up Series from Tornio, Geophysica 29, 73–95, 1993.
Kajander, J.: Cryophenological Records From Tornio, Mimeograph Series of the National Board of Waters and the Environment, Helsinki, 1995.
Kendall, M. G.: Rank Correlation Methods, 4th edition, Griffin, London, 1970.
Klavins, M., Briede, A., and Rodinov, V.: Long term changes in ice and discharge regime of rivers in the Baltic region in relation to climatic variability, Climatic Change, 95, 485–498, https://doi.org/10.1007/s10584-009-9567-5, 2009.
Klingbjer, P. and Moberg, A.: A composite monthly temperature record from Tornedalen in northern Sweden, 1802–2002, 1465–1494, Int. J. Climatol., 23, 1465–1494, https://doi.org/10.1002/joc.946, 2003.
Korhonen, J.: Suomen Vesistöjen Jääolot, Suomen Ympäristökeskus, Helsinki, 2005.
Korhonen, J.: Long-term changes in lake ice cover in Finland, Nord. Hydrol., 37, 347–363, https://doi.org/10.2166/nh.2006.019, 2006.
Korhonen, J. and Kuusisto, E.: Long-term changes in the discharge regime in Finland, Hydrol. Res., 41, 253–268, https://doi.org/10.2166/nh.2010.112, 2010.
Koskinen, M. (Ed.): Porin tulvat hallittuja riskejä?, Lounais-Suomen Ympäristökeskus, Turku, ISBN 952-11-2287-0, 2006.
Leche, J.: Utdrag af 12 års meteorologiska observationer, gjorda i Åbo: Sjette och sista stycket, Kongl. Vetensk. Acad. Handl., Stockholm, 257–268, 1763.
Lehtonen, I.: Record mild winter of 2019/2020 in most of Finland, FMI's Climate Bulleting: Research Letters, 1, 4–7, https://doi.org/10.35614/ISSN-2341-6408-IK-2021-02-RL, 2021.
Leijonhufvud, L., Wilson, R., Moberg, A., Söderberg, J., Retsö, D., and Söderlind, U.: Five centuries of Stockholm winter/spring temperatures reconstructed from documentary evidence and instrumental observations, Climatic Change, 101, 109–141, https://doi.org/10.1007/s10584-009-9650-y, 2010.
Levänen, S.: Bearbetning af tiderna för islossningar i Aura å, Fennia, 3, 1–8, 1890.
Louekari, S.: Pori, vesi ja maisema, in: Näkymätönt Porrii. Porin Veden historia, edited by: Juuti, P. S., Katko, T. S., Louekari, S. M., and Rajala, R. P., Porin Vesi, Saarijärvi, Finland, 68–97, 2010.
Luterbacher, J., Dietrich, D., Xoplaki, E., Grosjean, M., and Wanner, H.: European seasonal and annual temperature variability, trends, and extremes since 1500, Science, 303, 1499–1503, https://doi.org/10.1126/science.1093877, 2004.
Magnuson, J. J., Robertson, D. M., Benson, B. J., Wynne, R. H., Livingstone, D. M., Arai, T., Assel, R. A., Barry, R. G., Card, V., Kuusisto, E., Granin, N. G., Prowse, T. D., Stewart, K. M., and Vuglinski, V. S.: Historical trends in lake and river ice cover in the Northern Hemisphere, Science, 289, 1743–1746, https://doi.org/10.1126/science.289.5485.1743, 2000.
Mann, H. B.: Nonparametric tests against trend, Econometrica, 13, 245–259, https://doi.org/10.2307/1907187, 1945.
Menzel, A.: Trends in phenological phases in Europe between 1951 and 1996, Int. J. Biometeorol., 44, 76–81, https://doi.org/10.1007/s004840000054, 2000.
Mikkonen, S., Laine, M., Mäkelä, H. M., Gregow, H., Tuomenvirta, H., Lahtinen, M., and Laaksonen, A.: Trends in average temperature in Finland, 1847–2013, Stoch. Env. Res. Risk A., 29, 1521–1529, https://doi.org/10.1007/s00477-014-0992-2, 2015.
Moberg, A.: Naturalhistoriska Daganteckningar gjorda i Finland Åren 1750–1845, Notiser ur Sällskapets Pro Fauna & Flora Fennica Förhandlingar (Tredje Häftet), 95–250, 1857.
Moberg, A.: Sammandra af de klimatologiska anteckningarne i Finland år 1889, in: Öfversigt af Finska Vetenskaps-societetens förhandlingar XXXV 1889–1890, J Simeli Arfvingars Boktryckeri-Aktiebolag, Helsingfors, 155–176, 1890.
Moberg, A.: Sammandra af de klimatologiska anteckningarne i Finland år 1890, in: Öfversigt af Finska Vetenskaps-societetens förhandlingar XXXV 1890–1891, J Simeli Arfvingars Boktryckeri-Aktiebolag, Helsingfors, 235–259, 1891.
Moberg, A.: Sammandra af de klimatologiska anteckningarne i Finland år 1891, in: Öfversigt af Finska Vetenskaps-societetens förhandlingar XXXV 1891–1892, J Simeli Arfvingars Boktryckeri-Aktiebolag, Helsingfors, 309–333, 1892.
Moberg, A.: Sammandra af de klimatologiska anteckningarne i Finland år 1892, in: Öfversigt af Finska Vetenskaps-societetens förhandlingar XXXV 1892–1893, J Simeli Arfvingars Boktryckeri-Aktiebolag, Helsingfors, 155–181, 1893.
Newton, A. M. W. and Mullan, D. J.: Climate change and Northern Hemisphere lake and river ice phenology from 1931–2005, The Cryosphere, 15, 2211–2234, https://doi.org/10.5194/tc-15-2211-2021, 2021.
Norrgård, S.: The Aura River Ice Jam in Turku, March 1903, Environment & Society Portal, Arcadia, 10, https://doi.org/10.5282/rcc/8982, 2020.
Norrgård, S.: R-IBU: A basic ice breakup data set for the Aura and Kokemäki rivers, Version 1, Zenodo [data set], https://doi.org/10.5281/zenodo.6670163, 2022.
Norrgård, S. and Helama, S.: Historical trends in spring ice breakup for the Aura River in Southwest Finland, AD 1749-2018, Holocene, 29, 953–963, https://doi.org/10.1177/0959683619831429, 2019.
Prowse, T. D. and Beltaos, S.: Climatic control of river-ice hydrology: a review, Hydrol. Process., 16, 805–822, https://doi.org/10.1002/hyp.369, 2002.
Prowse, T. D., Wrona, F. J., Reist, J. D., Gibson, J. J., Hobbie, J. E., Levesque, L. M. J., and Vincent, W. F.: Climate change effects on hydroecology of Arctic freshwater ecosystems, Ambio, 35, 347–358, https://doi.org/10.1579/0044-7447(2006)35[347:cceoho]2.0.co;2, 2006.
Prowse, T., Alfredsen, K., Beltaos, S., Bonsal, B., Duguay, C., Korhola, A., McNamara, J., Pienitz, R., Vincent, W. F., Vuglinsky, V., and Weyhenmeyer, G. A.: Past and Future Changes in Arctic Lake and River Ice, Ambio, 40, 53–62, https://doi.org/10.1007/s13280-011-0216-7, 2011.
Ruosteenoja, K., Markkanen, T., and Räisänen, J.: Thermal seasons in northern Europe in projected future climate, Int. J. Climatol., 40, 4444–4462, https://doi.org/10.1002/joc.6466, 2020.
Rykatschew, M.: Über den Auf- und Zugang der Gewässer des Russischen Reiches, St. Petersburg, Kaiserliche Akademie der Wissenschaften, 1887.
Sagarin, R.: Phenology – False estimates of the advance of spring, Nature, 414, 600–600, https://doi.org/10.1038/414600a, 2001.
Sagarin, R.: Using nature's clock to measure phenology, Front. Ecol. Environ., 7, 296–296, https://doi.org/10.1890/09.wb.020, 2009.
Sen, P. K.: Estimates of the regression coefficient based on Kendall's tau, J. Am. Stat. Assoc., 63, 1379–1389, 1968.
Serreze, M. C., Walsh, J. E., Chapin, F. S., Osterkamp, T., Dyurgerov, M., Romanovsky, V., Oechel, W. C., Morison, J., Zhang, T., and Barry, R. G.: Observational evidence of recent change in the northern high-latitude environment, Climatic Change, 46, 159–207, https://doi.org/10.1023/a:1005504031923, 2000.
Sharma, S., Magnuson, J. J., Batt, R. D., Winslow, L. A., Korhonen, J., and Aono, Y.: Direct observations of ice seasonality reveal changes in climate over the past 320–570 years, Sci. Rep., 6, 25061, https://doi.org/10.1038/srep25061, 2016.
Sharma, S., Richardson, D. C., Woolway, R. I., Imrit, M. A., Bouffard, D., Blagrave, K., Daly, J., Filazzola, A., Granin, N., Korhonen, J., Magnuson, J., Marszelewski, W., Matsuzaki, S. I. S., Perry, W., Robertson, D. M., Rudstam, L. G., Weyhenmeyer, G. A., and Yao, H. X.: Loss of Ice Cover, Shifting Phenology, and More Extreme Events in Northern Hemisphere Lakes, J. Geophys. Res.-Biogeo., 126, e2021JG006348, https://doi.org/10.1029/2021jg006348, 2021.
Šmejkalová, T., Edwards, M. E., and Dash, J.: Arctic lakes show strong decadal trend in earlier spring ice-out, Sci. Rep., 6, 38449, https://doi.org/10.1038/srep38449, 2016.
Terhivuo, J., Kubin, E., and Karhu, J.: Phenological observations since the days of Linné in Finland, Ital. J. Agrometeorol., 14, 45–49, 2009.
Toohey, M. and Sigl, M.: Volcanic stratospheric sulfur injections and aerosol optical depth from 500 BCE to 1900 CE, Earth Syst. Sci. Data, 9, 809–831, https://doi.org/10.5194/essd-9-809-2017, 2017.
Venäläinen A., Tuomenvirta, H., Pirinen, P., and Drebs, A.: A Basic Finnish Climate Data Set 1961–2000. Descriptions and Illustrations, Finnish Meteorological Institute Reports No. 2005, 5, Finnish Meteorological Institute, https://doi.org/10.13140/RG.2.2.24473.62567, 2005.
Verta, O. M. and Triipponen, J. P.: The Kokemäki River Basin Flood Risk Management plan – A national Pilot from Finland in Accordance with the EU Floods Directive, Irrig. Drain., 60, 84–90, https://doi.org/10.1002/ird.668, 2011.
Weyhenmeyer, G. A., Meili, M., and Livingstone, D. M.: Systematic differences in the trend towards earlier ice-out on Swedish lakes along a latitudinal temperature gradient, 29th Congress of the International Association of Theoretical and Applied Limnology, Lahti, Finland, 8–14 August, WOS:000230666900039, 257–260, 2005.
Weyhenmeyer, G. A., Livingstone, D. M., Meilis, M., Jensen, O., Benson, B., and Magnuson, J. J.; Large geographical differences in the sensitivity of ice-covered lakes and rivers in the Northern Hemisphere to temperature changes, GCB Bioenergy, 17, 268–275, https://doi.org/10.1111/j.1365-2486.2010.02249.x, 2011.
Xoplaki, E., Luterbacher, J., Paeth, H., Dietrich, D., Steiner, N., Grosjean, M., and Wanner, H.: European spring and autumn temperature variability and change of extremes over the last half millennium, Geophys. Res. Lett., 32, L15713, https://doi.org/10.1029/2005gl023424, 2005.
Zachrisson, G.: Svåra islossningar i Torneälven i relation till klimat- och miljöförändringar, in: Nordisk Hydrologisk Konferens 1988, Nordisk NHP-rapport nr. 22 Del 1, Rovaniemi, Finland, 1–3 August 1988, 33–42, 1988.